water and carbon cycles - cambridge university...
TRANSCRIPT

Cambridge University Press978-1-316-60632-2 — A/AS Level Geography for AQA Student BookAnn Bowen , Andy Day , Victoria Ellis , Paul Hunt , Rebecca Kitchen , Claire Kyndt , Garrett Nagle , Alan Parkinson , Nicola Walshe , Helen Young ,
Edited by Alan Parkinson ExcerptMore Information
www.cambridge.org© in this web service Cambridge University Press
Water and carbon cycles
1
By the end of this chapter you should know:
• what a natural system is and how to describe the water and carbon cycles
as natural systems
• the global distribution of major stores of water
• the main factors driving changes in the magnitude of these water stores
• how drainage basins and other geographical features function as natural
systems
• the global distribution of major stores of carbon
• the main factors driving changes in the magnitude of these carbon stores
• the carbon budget and the impact of the carbon cycle on the atmosphere,
ocean and land.
Before you start…You should know:
• water is continuously being recycled between the land, atmosphere, rivers,
lakes, oceans and living things in a process called the water cycle
• carbon is linked to fossil fuels – these are non-renewable energy resources
• the amount of carbon dioxide in the atmosphere is increasing, and this is
leading to global warming.
Figure 1.1 The ocean is the most obvious store of water on the planet, but did you know that it is also the second largest store of carbon? Carbon is stored as dissolved carbon dioxide in organisms such as coral and in seafl oor sediments.
11

Cambridge University Press978-1-316-60632-2 — A/AS Level Geography for AQA Student BookAnn Bowen , Andy Day , Victoria Ellis , Paul Hunt , Rebecca Kitchen , Claire Kyndt , Garrett Nagle , Alan Parkinson , Nicola Walshe , Helen Young ,
Edited by Alan Parkinson ExcerptMore Information
www.cambridge.org© in this web service Cambridge University Press
1.1 Water and carbon cycles as natural systemsSystems in physical geography
Rain falling, wind moving the branches of a deciduous tree, meltwater dripping from the front of a glacier or sand cascading down the front of a sand dune – they all involve energy, physical geography and a change in the environment. They are natural processes, and are all also part of a larger natural system. The systems explored in this chapter are bounded.
The systems approach is a way of exploring physical processes, by focusing on one aspect within the larger environment, sometimes simplifying it so that its operation can be understood. The simplest explorations of systems view them as a ‘black box’; little is known of their workings, but the inputs and outputs can be compared. The water balance of a drainage basin would be an example of this, as it could be calculated without really understanding what was going on. To understand the system, we have to open the box, and explore the internal workings. This chapter will do that for two large scale cycles.
A natural system is therefore a portion of the larger environment chosen for analysis. There are two types, and both have a number of components.
Some systems are open, and have inputs and outputs as well as stores and fl ows through the system (transfers or fl ux, also called throughputs). Closed systems tend to be cycles, with some outputs becoming inputs, and others with no inputs or outputs. In physical geography, we are particularly concerned with natural systems and the physical processes, powered by the Sun, which lead to their continued functioning without human interference.
The cycling of both water and carbon are essential to all life, and also provide us with the basis for much of the environmental change that is explored in other chapters of this book. Systems theory is useful in helping us to make sense of processes that may be global in scale, but also operate within our local area. Water could be explored at the scale of a local drainage basin, for example, but also circulates around the global hydrological cycle. Similarly, the life and death of a tree in a garden, or the management of an allotment garden involve some of the same processes as the changing use of thousands of acres of tropical rainforest.
Throughputs within the larger system may be called sub-systems. The example of the water cycle would provide us with the drainage basin sub-system. The cycling element requires there to be stores, which will change in their volume over time, fl uxes, which will operate at different rates and processes which help drive the fl uxes.
The water and carbon cycles are both closed systems on a global scale. On a smaller scale, however, they include open sub-systems, such as drainage basins or the workings of a tropical rainforest. The interactions between different locations on Earth, sometimes as remote tele-connections, are sometimes hard to visualise. The interactions between the water and carbon cycles are often invisible in the same way.
1.2 The water cycleWe can think of a drainage basin as a complex system, which is the result of the hydrological cycle operating within a geographical area of the Earth. Hydrology refers to the study of water on the surface of the Earth, although water is also capable of entering the surface layer of the Earth and moving
open system: a system that
has both inputs and outputs of
energy or other material, and
which involves a fl ow or exchange
of material
closed system: a system that has
no inputs or outputs, but which
cycles energy or resources around
a closed loop
drainage basin (catchment area):
the area of land that provides
water to a river system
hydrology: the study of water on
the surface of the Earth
Key terms
Can you fi nd a chapter in
this book where there is no
connection with the natural
cycling of either water or carbon
to some extent?
Making connections
2
A/AS Level Geography for AQA
Cambridge University Press978-1-316-60632-2 — A/AS Level Geography for AQA Student BookAnn Bowen , Andy Day , Victoria Ellis , Paul Hunt , Rebecca Kitchen , Claire Kyndt , Garrett Nagle , Alan Parkinson , Nicola Walshe , Helen Young ,
Edited by Alan Parkinson ExcerptMore Information
www.cambridge.org© in this web service Cambridge University Press
between the surface and the troposphere (the lowest layer of the atmosphere). The systems approach means that we focus on the way that water enters and leaves the drainage basin, as well as the places it may be stored, and how it moves between those stores at different rates, and over different time scales. The combination of these provides the complexity, and also means that different rivers respond differently to similar precipitation events.
Global distribution and size of major stores of water
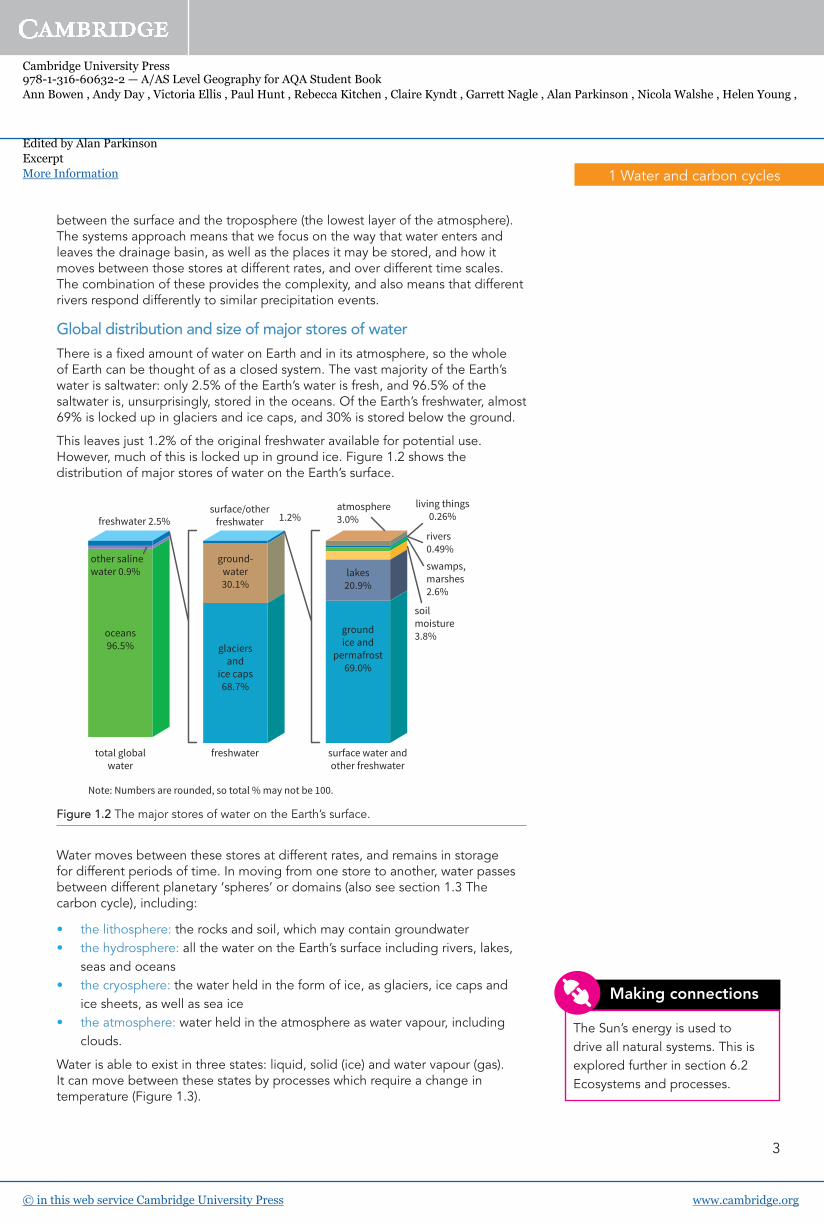
There is a fi xed amount of water on Earth and in its atmosphere, so the whole of Earth can be thought of as a closed system. The vast majority of the Earth’s water is saltwater: only 2.5% of the Earth’s water is fresh, and 96.5% of the saltwater is, unsurprisingly, stored in the oceans. Of the Earth’s freshwater, almost 69% is locked up in glaciers and ice caps, and 30% is stored below the ground.
This leaves just 1.2% of the original freshwater available for potential use. However, much of this is locked up in ground ice. Figure 1.2 shows the distribution of major stores of water on the Earth’s surface.
freshwater 2.5%
other saline
water 0.9%
ground-
water
30.1%lakes
20.9%
ground
ice and
permafrost
69.0%
soil
moisture
3.8%
swamps,
marshes
2.6%
rivers
0.49%
atmosphere
3.0%
glaciers
and
ice caps
68.7%
oceans
96.5%
total global
water
freshwater surface water and
other freshwater
surface/other
freshwater
living things
0.26%1.2%
Note: Numbers are rounded, so total % may not be 100.
Figure 1.2 The major stores of water on the Earth’s surface.
Water moves between these stores at different rates, and remains in storage for different periods of time. In moving from one store to another, water passes between different planetary ‘spheres’ or domains (also see section 1.3 The carbon cycle), including:
• the lithosphere: the rocks and soil, which may contain groundwater
• the hydrosphere: all the water on the Earth’s surface including rivers, lakes,
seas and oceans
• the cryosphere: the water held in the form of ice, as glaciers, ice caps and
ice sheets, as well as sea ice
• the atmosphere: water held in the atmosphere as water vapour, including
clouds.
Water is able to exist in three states: liquid, solid (ice) and water vapour (gas). It can move between these states by processes which require a change in temperature (Figure 1.3).
The Sun’s energy is used to
drive all natural systems. This is
explored further in section 6.2
Ecosystems and processes.
Making connections
3
1 Water and carbon cycles

Cambridge University Press978-1-316-60632-2 — A/AS Level Geography for AQA Student BookAnn Bowen , Andy Day , Victoria Ellis , Paul Hunt , Rebecca Kitchen , Claire Kyndt , Garrett Nagle , Alan Parkinson , Nicola Walshe , Helen Young ,
Edited by Alan Parkinson ExcerptMore Information
www.cambridge.org© in this web service Cambridge University Press
Factors driving change in the magnitude of major stores of water
The stores shown in Figure 1.2 vary temporally and spatially in the amount of water that they hold. Over time, the amount of water held in ice caps has fl uctuated as global temperatures have changed. During the Ice Ages, the amount increased dramatically; at present, the Arctic sea ice is at a historical minimum. There have also been signifi cant losses from the world’s Polar ice sheets – Greenland and Antarctica. As the ice sheets decline, water is released into the oceans.
Similarly, changes in weather patterns cause the relative position of atmospheric moisture to change. Increasingly large areas of Earth are becoming affected by desertifi cation (see Chapter 2 Hot desert systems and landscapes), with reduced soil moisture, and in some parts of the world rivers are drying up. This does not change the overall amount of water on Earth, which remains unchanged, but controls the way that is distributed globally. This may cause shortages more locally.
Rising warm air holds water vapour. As the water vapour rises, such as over relief barriers, it cools and condenses into clouds. These form on the windward side of a relief barrier or at the summit. Latent heat, which is used in evaporation, may be released at this point, slowing down the rate of cooling.
Cryospheric processes act when the temperature gets close to freezing point, or below. When water freezes, it is no longer part of the diurnal circulation. During the Ice Ages, global sea level dropped as water was ‘locked away’ as ice on the land. Today, some communities rely on glaciers for their water supply, but these are rapidly melting. For example, the rate of melting of Andean glaciers is threatening many cities in Peru.
A startling image created by the USGS (Figure 1.4) shows how fragile our water supply is. The blue sphere represents the amount of water relative to the size of the Earth, and of course the freshwater is a tiny fraction of that.
Figure 1.3 The movement of water between different physical states.
For a copy of Figure 1.3, download Worksheet 1.1 from Cambridge Elevate.
condensation: a change in state
from water vapour to liquid as a
result of cooling
evaporation: a change in state
from liquid water to water vapour,
as a result of heating
Key terms
solid liquid
gas
freezing
melting (ablation)
sublim
ation
depositio
ncondensation
evaporation
ACTIVITY 1.1
1 On a copy of Figure 1.3, add
labels in the correct place to
show the different movements
of water between the states,
and whether they require
an increase or decrease in
temperature to occur.
2 Explain the processes of
evaporation and condensation,
and how important they are
within the hydrological cycle.
4
A/AS Level Geography for AQA

Cambridge University Press978-1-316-60632-2 — A/AS Level Geography for AQA Student BookAnn Bowen , Andy Day , Victoria Ellis , Paul Hunt , Rebecca Kitchen , Claire Kyndt , Garrett Nagle , Alan Parkinson , Nicola Walshe , Helen Young ,
Edited by Alan Parkinson ExcerptMore Information
www.cambridge.org© in this web service Cambridge University Press
watershed: the edge of a
drainage basin
water budget: the overall
balance of inputs and outputs in a
drainage basin over time
saturated: all the available
spaces between the soil particles
are fi lled with water
water table: the level of the top
of the saturated soil beneath the
ground
Key terms
Drainage basins as open systems
A drainage basin or catchment area is the area of land drained by a particular river and its tributaries. Drainage basins can vary in size from a few square kilometres to millions of square kilometres, such as the area drained by the River Nile in north-east Africa. The physical boundary of a drainage basin is called a watershed. The watershed is marked by higher land than the surrounding area, sometimes by high mountains; from here, water is directed downslope towards the nearest river channel. Water is drained into rivers via their tributaries.
Figure 1.5 shows the different components of the drainage basin system: the inputs, outputs, stores and fl ows through the system. The stores are different sizes and store water for different lengths of time.
The overall balance of inputs and outputs is shown in the water budget or water balance equation:
precipitation = evaporation + transpiration + river fl ow ± storage
The UK’s water balance has a seasonal pattern in which groundwater is fi lled up during winter and drawn on during the warm summer months, when plants also use more water. At the end of a long dry period, there may be a water defi cit. If there are several dry years in a row, river levels might be affected and crop yields could decline. Soil moisture is important in infl uencing other fl ows within the cycle. The top of the saturated soil is marked by the water table. If this is at the surface there will be higher surface runoff.
Figure 1.4 All Earth’s water is contained in the blue spheres.
5
1 Water and carbon cycles

Cambridge University Press978-1-316-60632-2 — A/AS Level Geography for AQA Student BookAnn Bowen , Andy Day , Victoria Ellis , Paul Hunt , Rebecca Kitchen , Claire Kyndt , Garrett Nagle , Alan Parkinson , Nicola Walshe , Helen Young ,
Edited by Alan Parkinson ExcerptMore Information
www.cambridge.org© in this web service Cambridge University Press
Inputs
The only input for the drainage basin is precipitation, which is water moving from the atmosphere to the ground. Its quantity, distribution, duration and intensity will affect the pattern of fl ow of the river. The route that a rainfall event takes as it moves across the basin will also infl uence the response of the catchment. A storm spending a lot of time over the catchment will result in higher inputs than one that just clips the edge of it. The fl owing water results in a movement of sediment.
Stores
Stores are those parts of the system where water is held in some state for a period of time. They include:
• Interception storage: water held on vegetation for a short period of time
after precipitation has fallen. The amount of water held in interception
storage will vary according to the time of year and the type of ground cover.
A typical tree will catch water on its leaf surfaces: broadleaved trees will
catch more than coniferous trees. This may then evaporate from these open
surfaces without ever reaching the ground (hence the term ‘interception’).
Water will also fall off leaves as throughfall (stand under trees after rain has
been falling and you will experience this) or stemfl ow (where water fl ows
along branches and down tree trunks).
• Vegetation storage: water taken up by vegetation and absorbed into it. This
will remain in the vegetation for a variable period of time, before being lost
by transpiration.
• Soil moisture storage and soil water: water will soak into most soils at a
rate that depends on the nature and structure of the soil (the infi ltration
capacity). Previous precipitation may fi ll up some of this storage and
be held as soil water. Water held in the soil may evaporate if it is close
precipitation: the movement of
water from the atmosphere to the
ground surface. It can take several
forms, including rain, snow, sleet,
hail and fog
response: the way that a river
responds following the input of
precipitation: some rivers rise
quickly and are said to be ‘fl ashy’;
others rise and fall more slowly
transpiration: the process by
which plants lose water through
stomata (pores) in their leaves
into the atmosphere
infi ltration capacity: the rate
at which water is able to pass
through a soil (measured in mm/
hr) – this will be high for a sandy
soil; lower for a clay soil
Key terms
Figure 1.5 Drainage basin hydrological cycle.
channel storage
output
overland flow
flow or transfer
precipitation
inputevapotranspiration
drainage basin output
throughflow
groundwater flow
interception by vegetation
store
key:
surface storage
soil infiltration
soil moisture storage
deep percolation
groundwater
6
A/AS Level Geography for AQA
Cambridge University Press978-1-316-60632-2 — A/AS Level Geography for AQA Student BookAnn Bowen , Andy Day , Victoria Ellis , Paul Hunt , Rebecca Kitchen , Claire Kyndt , Garrett Nagle , Alan Parkinson , Nicola Walshe , Helen Young ,
Edited by Alan Parkinson ExcerptMore Information
www.cambridge.org© in this web service Cambridge University Press
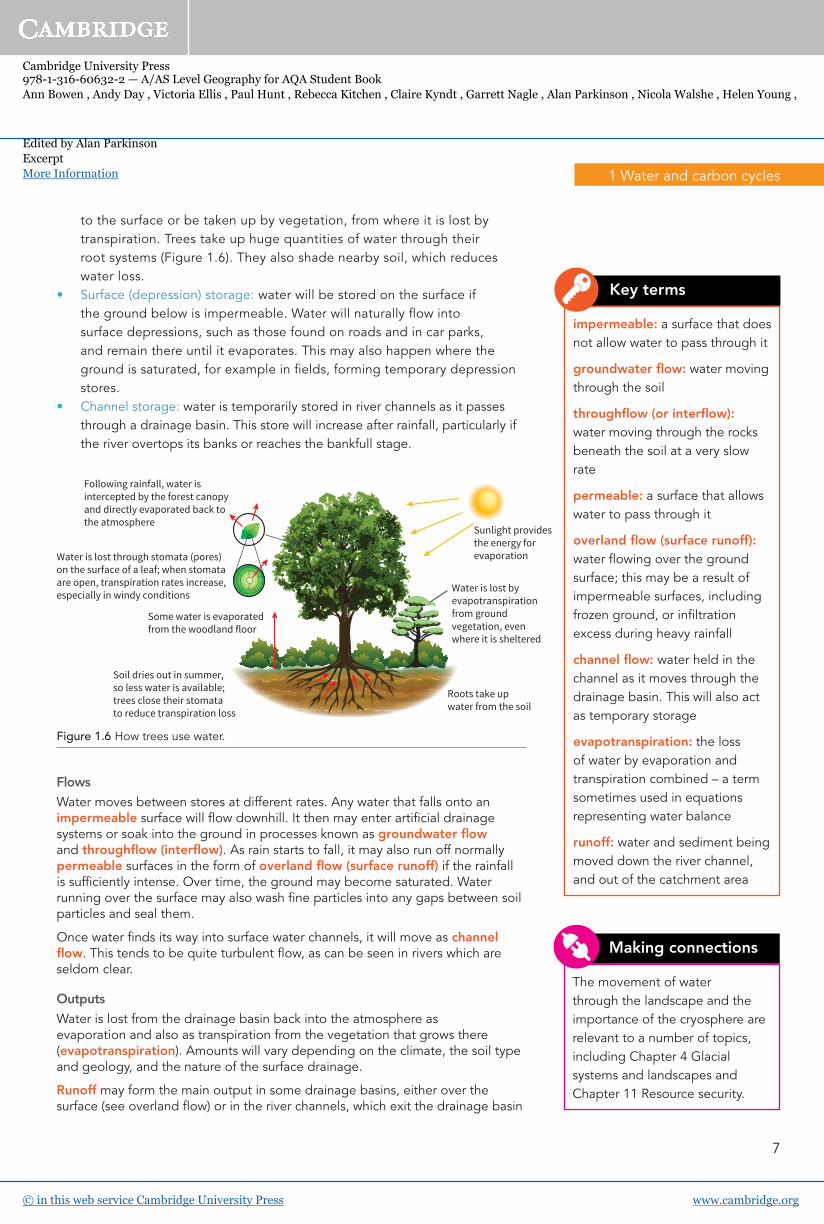
to the surface or be taken up by vegetation, from where it is lost by
transpiration. Trees take up huge quantities of water through their
root systems (Figure 1.6). They also shade nearby soil, which reduces
water loss.
• Surface (depression) storage: water will be stored on the surface if
the ground below is impermeable. Water will naturally fl ow into
surface depressions, such as those found on roads and in car parks,
and remain there until it evaporates. This may also happen where the
ground is saturated, for example in fi elds, forming temporary depression
stores.
• Channel storage: water is temporarily stored in river channels as it passes
through a drainage basin. This store will increase after rainfall, particularly if
the river overtops its banks or reaches the bankfull stage.
Sunlight provides
the energy for
evaporation
Water is lost by
evapotranspiration
from ground
vegetation, even
where it is sheltered
Roots take up
water from the soil
Soil dries out in summer,
so less water is available;
trees close their stomata
to reduce transpiration loss
Some water is evaporated
from the woodland floor
Water is lost through stomata (pores)
on the surface of a leaf; when stomata
are open, transpiration rates increase,
especially in windy conditions
Following rainfall, water is
intercepted by the forest canopy
and directly evaporated back to
the atmosphere
Figure 1.6 How trees use water.
Flows
Water moves between stores at different rates. Any water that falls onto an impermeable surface will fl ow downhill. It then may enter artifi cial drainage systems or soak into the ground in processes known as groundwater fl ow and throughfl ow (interfl ow). As rain starts to fall, it may also run off normally permeable surfaces in the form of overland fl ow (surface runoff) if the rainfall is suffi ciently intense. Over time, the ground may become saturated. Water running over the surface may also wash fi ne particles into any gaps between soil particles and seal them.
Once water fi nds its way into surface water channels, it will move as channel fl ow. This tends to be quite turbulent fl ow, as can be seen in rivers which are seldom clear.
Outputs
Water is lost from the drainage basin back into the atmosphere as evaporation and also as transpiration from the vegetation that grows there (evapotranspiration). Amounts will vary depending on the climate, the soil type and geology, and the nature of the surface drainage.
Runoff may form the main output in some drainage basins, either over the surface (see overland fl ow) or in the river channels, which exit the drainage basin
impermeable: a surface that does
not allow water to pass through it
groundwater fl ow: water moving
through the soil
throughfl ow (or interfl ow):
water moving through the rocks
beneath the soil at a very slow
rate
permeable: a surface that allows
water to pass through it
overland fl ow (surface runoff):
water fl owing over the ground
surface; this may be a result of
impermeable surfaces, including
frozen ground, or infi ltration
excess during heavy rainfall
channel fl ow: water held in the
channel as it moves through the
drainage basin. This will also act
as temporary storage
evapotranspiration: the loss
of water by evaporation and
transpiration combined – a term
sometimes used in equations
representing water balance
runoff: water and sediment being
moved down the river channel,
and out of the catchment area
Key terms
The movement of water
through the landscape and the
importance of the cryosphere are
relevant to a number of topics,
including Chapter 4 Glacial
systems and landscapes and
Chapter 11 Resource security.
Making connections
7
1 Water and carbon cycles
Cambridge University Press978-1-316-60632-2 — A/AS Level Geography for AQA Student BookAnn Bowen , Andy Day , Victoria Ellis , Paul Hunt , Rebecca Kitchen , Claire Kyndt , Garrett Nagle , Alan Parkinson , Nicola Walshe , Helen Young ,
Edited by Alan Parkinson ExcerptMore Information
www.cambridge.org© in this web service Cambridge University Press
as a result of infi ltration excess. The area from which runoff occurs will increase during a precipitation event, as more of the drainage basin reaches saturation point. This increases the area of land that may contribute water to the channel as surface runoff. Management of drainage basins sometimes involves controlling the speed of runoff.
hydrograph: a graph of the water
level or base fl ow in a river over
a period of time, such as a year,
and the response of the river to a
precipitation event
base fl ow: the normal day-to-day
fl ow of a river
discharge: water fl owing through
a river channel at any given point
and is measured in cubic metres
per second (cumecs)
Key terms
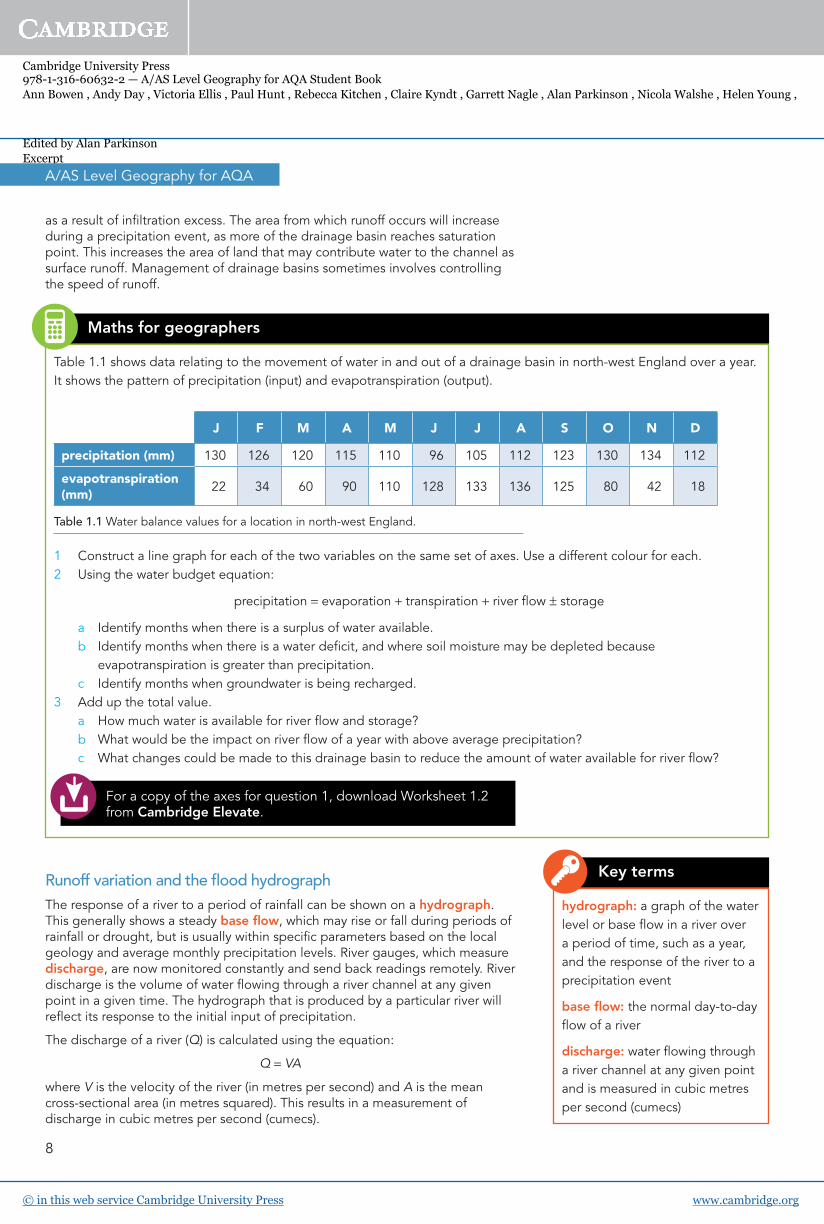
Table 1.1 shows data relating to the movement of water in and out of a drainage basin in north-west England over a year.
It shows the pattern of precipitation (input) and evapotranspiration (output).
J F M A M J J A S O N D
precipitation (mm) 130 126 120 115 110 96 105 112 123 130 134 112
evapotranspiration (mm)
22 34 60 90 110 128 133 136 125 80 42 18
Table 1.1 Water balance values for a location in north-west England.
1 Construct a line graph for each of the two variables on the same set of axes. Use a different colour for each.
2 Using the water budget equation:
precipitation = evaporation + transpiration + river fl ow ± storage
a Identify months when there is a surplus of water available.
b Identify months when there is a water defi cit, and where soil moisture may be depleted because
evapotranspiration is greater than precipitation.
c Identify months when groundwater is being recharged.
3 Add up the total value.
a How much water is available for river fl ow and storage?
b What would be the impact on river fl ow of a year with above average precipitation?
c What changes could be made to this drainage basin to reduce the amount of water available for river fl ow?
For a copy of the axes for question 1, download Worksheet 1.2 from Cambridge Elevate.
Maths for geographers
Runoff variation and the fl ood hydrograph
The response of a river to a period of rainfall can be shown on a hydrograph. This generally shows a steady base fl ow, which may rise or fall during periods of rainfall or drought, but is usually within specifi c parameters based on the local geology and average monthly precipitation levels. River gauges, which measure discharge, are now monitored constantly and send back readings remotely. River discharge is the volume of water fl owing through a river channel at any given point in a given time. The hydrograph that is produced by a particular river will refl ect its response to the initial input of precipitation.
The discharge of a river (Q) is calculated using the equation:
Q = VA
where V is the velocity of the river (in metres per second) and A is the mean cross-sectional area (in metres squared). This results in a measurement of discharge in cubic metres per second (cumecs).
8
A/AS Level Geography for AQA

Cambridge University Press978-1-316-60632-2 — A/AS Level Geography for AQA Student BookAnn Bowen , Andy Day , Victoria Ellis , Paul Hunt , Rebecca Kitchen , Claire Kyndt , Garrett Nagle , Alan Parkinson , Nicola Walshe , Helen Young ,
Edited by Alan Parkinson ExcerptMore Information
www.cambridge.org© in this web service Cambridge University Press
A typical value for a small mountain stream would be less than 1 cumec, whereas the River Thames through London after rainfall has a fl ow of hundreds of cumecs.
Figure 1.7 is a fl ood hydrograph for a typical river and shows the response of the river to a precipitation event. Flood hydrographs are drawn over a short time period of hours or days.
50 peak discharge
rising limb
falling limb
normal (base) flow
rainfall
peak
lag time
noon
Day 1
approach
segment
Precipitation
in mm
Time (hours)
midnight noon
Day 2
midnight
40
30
20
10
50
40
30
20
10
0
Runof discharge
(cumecs)
Figure 1.7 A typical fl ood hydrograph.
The peak rainfall time is marked on the hydrograph. You can see how the river rises a few hours after the rainfall event (rising limb). However, there is a time delay (the lag time) between peak rainfall and peak discharge as water needs to make its way to the river channel by various means. The delayed arrival from some types of fl ow might extend the peak of the graph (peak discharge) and therefore the lag time. The graph shows a falling limb, where the river is gradually returning to its normal, or base, fl ow. The total area under the hydrograph can be used to calculate how much water a rainfall event has contributed to the river.
The shape of the hydrograph for each river will vary depending on the nature of the rainfall that caused the discharge to increase. Intense rainfall will cause a more rapid increase than less intense rainfall.
Prolonged rainfall may take time to register, but the period of high fl ow might be extended. Water takes time to enter the river by different routes, and the falling limb will have a different gradient depending on the nature of these fl ows.
The route taken by any precipitation event may infl uence how river gauges respond. They are located at a few places down the course, and will not respond to rainfall that falls lower down the channel.
Factors affecting river discharge
Both physical and human factors can cause a river’s discharge to vary over time (Tables 1.2 and 1.3 respectively). Although these are often local changes, some of the controlling factors may change as a result of processes of change on a
rising limb: the part of a
hydrograph that records the
increase in a river’s fl ow
lag time: the time difference
between the peak rainfall and the
peak discharge that occurs as a
result
falling limb: the part of a
hydrograph that records the
decrease in a river’s fl ow
Key terms
Look on Cambridge Elevate to access the GaugeMap (www.cambridge.org/ links/gase6001).
ACTIVITY 1.2
The rivers in England are
monitored by the Environment
Agency. All river gauges now have
a weblink so that the recent fl ow is
monitored and displayed live, with
Twitter updates for each one.
Find your nearest river gauge and
monitor it for the time that you are
learning this topic.
1 What changes do you notice?
2 How does the river respond to
any rainfall events during this
time?
3 How does it compare to other
gauge locations which may be
further up or down the river
channel? Can any aspects of
the drainage basin be deduced
from changes in the fl ow at
particular gauges?
Look on Cambridge Elevate for rivers in Wales. Go to Natural Resources Wales (www.cambrige.org/links/gase6002).
9
1 Water and carbon cycles
Cambridge University Press978-1-316-60632-2 — A/AS Level Geography for AQA Student BookAnn Bowen , Andy Day , Victoria Ellis , Paul Hunt , Rebecca Kitchen , Claire Kyndt , Garrett Nagle , Alan Parkinson , Nicola Walshe , Helen Young ,
Edited by Alan Parkinson ExcerptMore Information
www.cambridge.org© in this web service Cambridge University Press
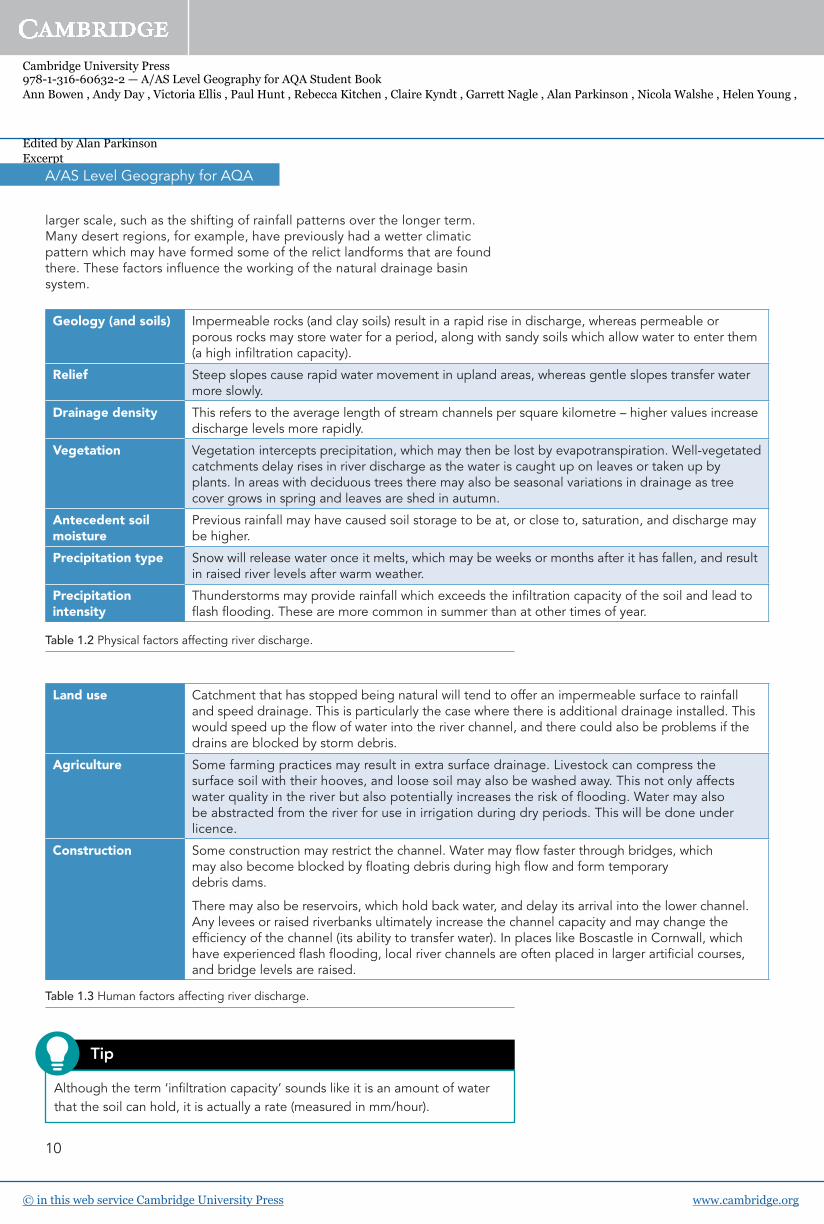
larger scale, such as the shifting of rainfall patterns over the longer term. Many desert regions, for example, have previously had a wetter climatic pattern which may have formed some of the relict landforms that are found there. These factors infl uence the working of the natural drainage basin system.
Geology (and soils) Impermeable rocks (and clay soils) result in a rapid rise in discharge, whereas permeable or porous rocks may store water for a period, along with sandy soils which allow water to enter them (a high infi ltration capacity).
Relief Steep slopes cause rapid water movement in upland areas, whereas gentle slopes transfer water more slowly.
Drainage density This refers to the average length of stream channels per square kilometre – higher values increase discharge levels more rapidly.
Vegetation Vegetation intercepts precipitation, which may then be lost by evapotranspiration. Well-vegetated catchments delay rises in river discharge as the water is caught up on leaves or taken up by plants. In areas with deciduous trees there may also be seasonal variations in drainage as tree cover grows in spring and leaves are shed in autumn.
Antecedent soil moisture
Previous rainfall may have caused soil storage to be at, or close to, saturation, and discharge may be higher.
Precipitation type Snow will release water once it melts, which may be weeks or months after it has fallen, and result in raised river levels after warm weather.
Precipitation intensity
Thunderstorms may provide rainfall which exceeds the infi ltration capacity of the soil and lead to fl ash fl ooding. These are more common in summer than at other times of year.
Table 1.2 Physical factors affecting river discharge.
Land use Catchment that has stopped being natural will tend to offer an impermeable surface to rainfall and speed drainage. This is particularly the case where there is additional drainage installed. This would speed up the fl ow of water into the river channel, and there could also be problems if the drains are blocked by storm debris.
Agriculture Some farming practices may result in extra surface drainage. Livestock can compress the surface soil with their hooves, and loose soil may also be washed away. This not only affects water quality in the river but also potentially increases the risk of fl ooding. Water may also be abstracted from the river for use in irrigation during dry periods. This will be done under licence.
Construction Some construction may restrict the channel. Water may fl ow faster through bridges, which may also become blocked by fl oating debris during high fl ow and form temporary debris dams.
There may also be reservoirs, which hold back water, and delay its arrival into the lower channel. Any levees or raised riverbanks ultimately increase the channel capacity and may change the effi ciency of the channel (its ability to transfer water). In places like Boscastle in Cornwall, which have experienced fl ash fl ooding, local river channels are often placed in larger artifi cial courses, and bridge levels are raised.
Table 1.3 Human factors affecting river discharge.
Although the term ‘infi ltration capacity’ sounds like it is an amount of water
that the soil can hold, it is actually a rate (measured in mm/hour).
Tip
10
A/AS Level Geography for AQA
Cambridge University Press978-1-316-60632-2 — A/AS Level Geography for AQA Student BookAnn Bowen , Andy Day , Victoria Ellis , Paul Hunt , Rebecca Kitchen , Claire Kyndt , Garrett Nagle , Alan Parkinson , Nicola Walshe , Helen Young ,
Edited by Alan Parkinson ExcerptMore Information
www.cambridge.org© in this web service Cambridge University Press
Changes in the water cycle over time
All drainage basins will undergo natural variations over time, which will infl uence the water cycle. These vary in scale and also through the year. There will be seasonal changes.
Storm events will occur during the year. Some individual storms may be signifi cant enough to result in major changes, such as the record rainfall that fell in parts of Cumbria in December 2015. Water may also be abstracted at certain times of year for irrigation, which may result in a lowering of the water levels. If oxygen levels in the river drop as a result, fi sh are threatened. For this reason, abstraction of water on a large scale requires a license.
Catchments are also subject to change as a result of human activities which infl uence the way they are managed and used. Management of the river for water supply, construction along its course and the seasonal changes in weather and vegetation cover will also infl uence the way that water moves through the drainage basin.
Typical changes
Typical changes which might be observed include:
• the removal of vegetation, such as deforestation (removal of trees) for
construction
• impermeable surfaces such as concrete and tarmac replacing permeable
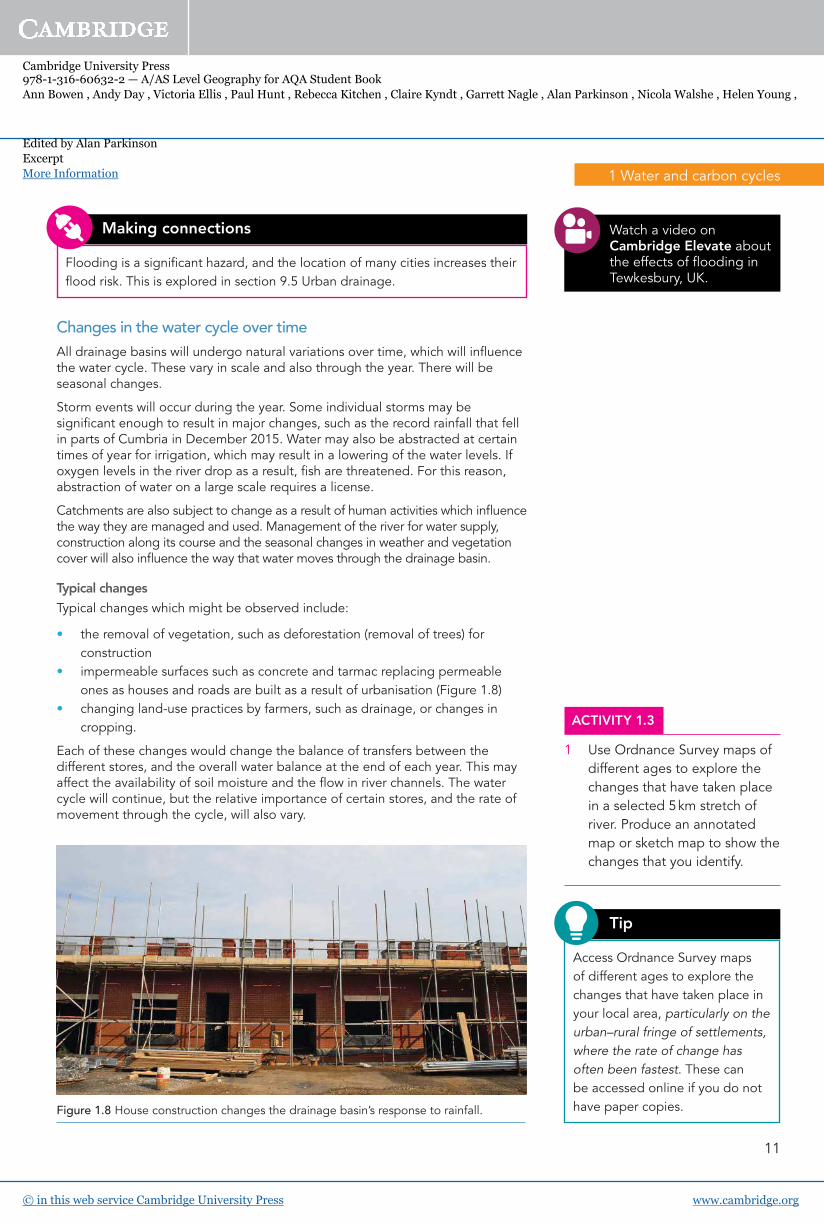
ones as houses and roads are built as a result of urbanisation (Figure 1.8)
• changing land-use practices by farmers, such as drainage, or changes in
cropping.
Each of these changes would change the balance of transfers between the different stores, and the overall water balance at the end of each year. This may affect the availability of soil moisture and the fl ow in river channels. The water cycle will continue, but the relative importance of certain stores, and the rate of movement through the cycle, will also vary.
Figure 1.8 House construction changes the drainage basin’s response to rainfall.
Flooding is a signifi cant hazard, and the location of many cities increases their
fl ood risk. This is explored in section 9.5 Urban drainage.
Making connections Watch a video on Cambridge Elevate about the effects of fl ooding in Tewkesbury, UK.
Access Ordnance Survey maps
of different ages to explore the
changes that have taken place in
your local area, particularly on the
urban–rural fringe of settlements,
where the rate of change has
often been fastest. These can
be accessed online if you do not
have paper copies.
Tip
ACTIVITY 1.3
1 Use Ordnance Survey maps of
different ages to explore the
changes that have taken place
in a selected 5 km stretch of
river. Produce an annotated
map or sketch map to show the
changes that you identify.
11
1 Water and carbon cycles