water and sewerage companies' performance - gov.uk · pdf lit 10664 page 1 water and...
TRANSCRIPT

www.gov.uk/environment-agency LIT 10664 Page 1
Water and sewerage companies' performance
2016 summary July 2017
A summary of the environmental performance of the 9 water and sewerage companies operating wholly or mainly in England.
Chair's foreword Water is a precious resource - essential to everyone and everything. Our goal is a water environment that is cleaner, healthier and managed in a way that is more resilient to flood and drought. Water and sewerage companies play a key role. The Environment Agency is committed to working in partnership with the water industry, and regulating in a fair and transparent way.
This report assesses their performance in terms of pollution incidents, compliance with permits and managing sewage. For the first time, we have also included information about prosecutions.
We are pleased to report that the overall performance of water and sewerage companies continues to improve. All 9 companies have shown 100% delivery of their environmental improvement schemes.
We have also seen widespread improvement to asset management, enabling quicker action to reduce pollution, and companies have invested in improving flood risk management. This shows a commitment to public wellbeing, resilience of the service to customers and protecting the wider environment.
Two companies, United Utilities and Wessex Water, have achieved 4 star leading company status. We celebrate their achievement, while recognising that all of the companies have made efforts to improve performance.
There is, however, still much more to do. While there was a slight reduction in the number of serious pollution incidents, we are disappointed in the increase in the most serious, category 1, incidents.
We are always ready to work hard with water companies to help them improve their systems, but we will not shy away from tough action against non-compliance when necessary - however uncomfortable that may be. In 2016, we saw the highest level of fines following prosecution, at just over £6.5 million, and we also saw a rise in the number of prosecutions.
We are serious about enforcing basic standards, but the purpose of this report is not to celebrate fines. Rather, we want to support businesses to thrive, by encouraging sustainable investment that improves water management in England. We can do this by fostering strong, trusting relationships with the water companies.
This work will create a better place for people and wildlife for generations to come.
Emma Howard Boyd, Environment Agency Chair

www.gov.uk/environment-agency LIT 10664 Page 2
Our regulation of water companies The Environment Agency is the environmental regulator for the water industry in England. We regulate and work in partnership with water and sewerage companies (called water companies in this report) to:
• challenge companies to minimise the environmental impact of their assets and activities
• achieve a better environment
• promote good performance and share good practice
We work with other regulators of the water industry in an integrated way to achieve beneficial results.
Performance messages for 2016 Overall in 2016, the water companies have improved performance on 2015. This is a trend of gradual continuous improvement since the Environmental Performance Assessment (EPA) was first used in 2011.
The sector has some way to go to meet the performance expectations for 2015 to 2020 which the Environment Agency set out in 2013 (these are shown on page 4).
For 2016, the main performance messages for the sector are: • a slight reduction in the number of serious pollution incidents to 57 compared to 59 in 2015, 61 in
2014 and 88 in 2013
• a rise in the most serious (category 1) pollution incidents to 9, all associated with sewerage, after 2 record low years when there were only 4 per year
• an increase in the total number of pollution incidents (category 1 to 3) at 1902 compared to 1742 in 2015, a disappointing first rise in incidents since 2012
• the highest ever level of self-reporting of pollution incidents at 72% (69% in 2015) showing better asset management and enabling quicker action to reduce pollution
• compliance with environmental permits at sewage treatment and water treatment works remains very good at 98.6% compared to 98.7% in 2015
• sludge use and disposal in 2016 was good overall, one company reported 99.97%, all other companies reported 100%
• all 9 companies reported good performance, with 100% delivery of planned environmental improvement schemes for the financial year to March 2017
• for 2016 to 2017, 8 of the 9 companies reported a score of 100 for the Security of Supply Index for water availability and green status in the EPA, with one company reporting red status
We are taking action with the companies, challenging them to address areas where they are failing or not meeting our performance expectations. We describe the actions we take in each section below.
This report is about the 9 water and sewerage companies in England that provide clean (drinking) water and waste water (sewerage) services. Throughout this report we use the term ‘water companies’ to describe them. There are also 10 water only companies providing only drinking water, and a number of small 'inset' companies providing drinking and sewerage services on a localised basis.
Water companies provide an essential public service that underpins the social and economic health of the nation. They work hard to minimise the impact of taking clean water from the environment and returning

www.gov.uk/environment-agency LIT 10664 Page 3
used water after treatment. Individually and collectively, however, these activities can and do affect the ecological health of rivers and their catchments. They also affect how water can be used downstream by others, particularly where mistakes have occurred. It is the role of the Environment Agency to police their work.
By far the greatest potential environmental impact from the water companies’ activities is on the water and land environment. To regulate this impact, water companies have:
• abstraction licences which allow them to take water from the environment
• discharge permits which allow them to put treated waste water back into the environment
• permits or other regulatory controls which allow them to dispose of or use sludge or other waste
• duties to manage their impact on flood and coastal risk and the environment
The licences and permits we issue control the level of impact water companies are allowed to have on the environment. It is vital that they meet the conditions we set in their licences and permits and deliver their legal obligations.
We inspect water companies’ sites, check sample data and respond to pollution incidents from their assets. We also work with the companies throughout the year to help them improve their performance. For example, auditing their monitoring data and working collaboratively with them on catchment management. Our role is both to regulate water companies, which we seek to do firmly and fairly, and to work in partnership with them on areas of mutual interest. Where appropriate we carry out enforcement activities. For 2016, these are summarised in the Enforcement and sanctions section.
Environmental Performance Assessment In 2011 we introduced the Environmental Performance Assessment (EPA) as a tool for comparing performance between water companies and across years.
The EPA indicators now measure performance associated with:
• reducing pollution incidents and increasing company reporting of incidents
• complying with discharge permits for sewage treatment and water treatment plants
• managing the use and disposal of sewage sludge
• delivering environmental improvement schemes
• delivering secure supplies of water ('security of supply')
The EPA is set for the duration of the current asset management plan (AMP) period which runs from April 2015 to March 2020. The indicators are absolute rather than relative. All companies should therefore be able to achieve good performance against these by 2020 or before.
The EPA forms part of a wider assessment of performance, including current year-to-date data, that we consider during annual performance meetings with the companies. This report summarises our findings for 2016, references the previous 5 years for the EPA (see Annex 1) and looks at longer term trends.

www.gov.uk/environment-agency LIT 10664 Page 4
Performance expectations 2015 to 2020 In 2013, we set out to the water companies our expectations in a number of areas, including their operational performance. We give the full list of expectations in Annex 2. Our expectations of companies that are directly relevant to the EPA are:
• a plan in place to achieve 100% compliance for all licences and permits
• reducing category 1 and 2 pollution incidents, trending towards zero by 2020
• trend to minimise all pollution incidents (category 1 to 3) by 2020 with at least a third reduction compared to 2012
• high levels of self-reporting of pollution incidents with at least 75% of incidents self-reported by 2020
• management of sewage sludge treatment and re-use should not cause pollution and must follow the Sludge (Use in Agriculture) Regulations and the Code of Practice for Managing Sewage Sludge, Slurry and Silage or Environmental Permitting Regulations (EPR)
• environmental improvement schemes (for example Asset Management Plans, Water Resource Management Plans) are planned well and delivered as agreed
The majority of water companies have translated our expectations into company performance commitments (PCs) and associated outcome delivery incentives (ODIs) for their 2015 to 2020 business plans. In 2017 we set out our performance expectations for 2020 to 2025 in the Water industry strategic environmental requirements (WISER). These will aid company business planning for the next AMP by providing a steer on the environment, resilience and flood risk.
Changes to the Environmental Performance Assessment for 2016 to 2020 We have changed how we report performance in the EPA for the 5 year period from 2016 by:
• changing the definitions and thresholds for existing key performance indicators (KPIs)
• adding a new KPI
The 5 year period aligns with the investment cycle for water companies to make improvements. These investments, combined with operational good practice, can improve performance. The companies acknowledge the aims inherent in the EPA. They are reflected in the companies’ own performance commitments to Ofwat (the economic regulator of the water companies) and some have set tighter standards.
We made the changes to further encourage the companies to meet their legal obligations and our expectations for 2015 to 2020 to protect the environment. We are encouraging continuous improvement by setting more stringent thresholds in the EPA. We consulted on making the changes to the EPA before we made them.
The new KPI is the Security of Supply Index (SoSI), measuring the availability of water for public supply.
The EPA changes are reported here for the first time for 2016 data and will apply to reporting up to and including 2020 data. Because of the changes, the EPA for 2016 does not directly compare to the EPA for previous years. We comment in this report on the real changes in performance of the sector, as well as the 2016 EPA results.
www.gov.uk/environment-agency LIT 10664 Page 5
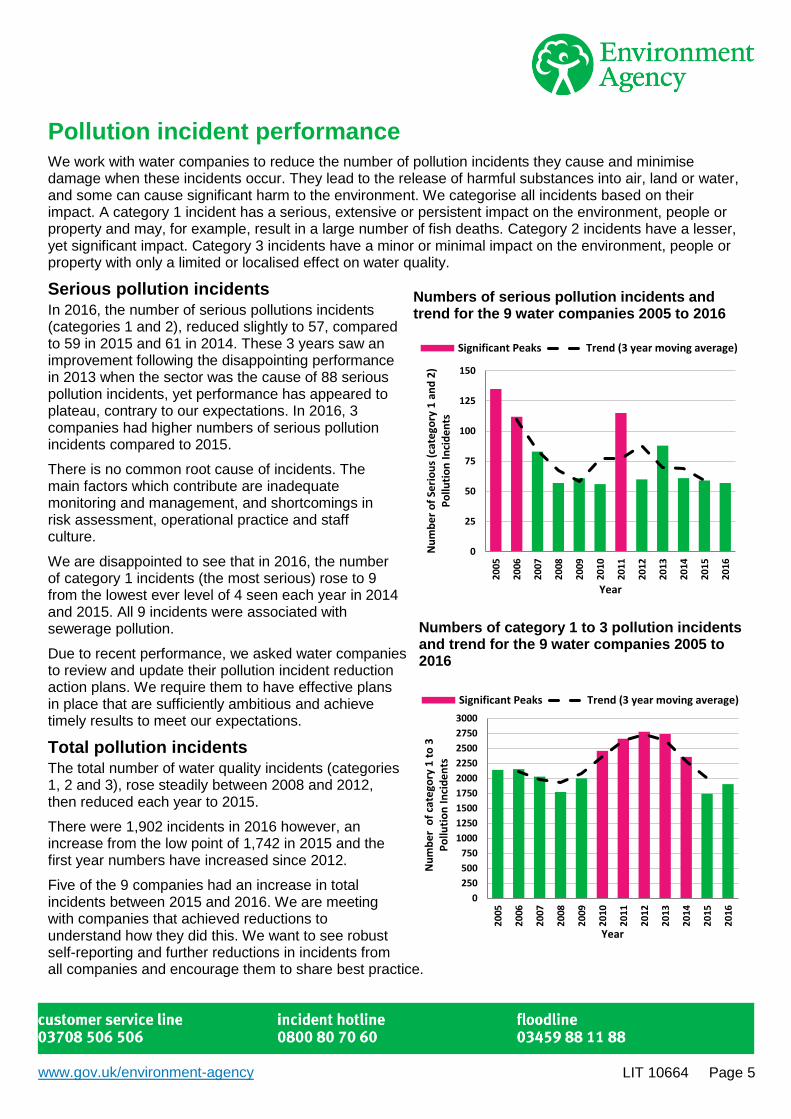
Pollution incident performance We work with water companies to reduce the number of pollution incidents they cause and minimise damage when these incidents occur. They lead to the release of harmful substances into air, land or water, and some can cause significant harm to the environment. We categorise all incidents based on their impact. A category 1 incident has a serious, extensive or persistent impact on the environment, people or property and may, for example, result in a large number of fish deaths. Category 2 incidents have a lesser, yet significant impact. Category 3 incidents have a minor or minimal impact on the environment, people or property with only a limited or localised effect on water quality.
Serious pollution incidents In 2016, the number of serious pollutions incidents (categories 1 and 2), reduced slightly to 57, compared to 59 in 2015 and 61 in 2014. These 3 years saw an improvement following the disappointing performance in 2013 when the sector was the cause of 88 serious pollution incidents, yet performance has appeared to plateau, contrary to our expectations. In 2016, 3 companies had higher numbers of serious pollution incidents compared to 2015.
There is no common root cause of incidents. The main factors which contribute are inadequate monitoring and management, and shortcomings in risk assessment, operational practice and staff culture.
We are disappointed to see that in 2016, the number of category 1 incidents (the most serious) rose to 9 from the lowest ever level of 4 seen each year in 2014 and 2015. All 9 incidents were associated with sewerage pollution.
Due to recent performance, we asked water companies to review and update their pollution incident reduction action plans. We require them to have effective plans in place that are sufficiently ambitious and achieve timely results to meet our expectations.
Total pollution incidents The total number of water quality incidents (categories 1, 2 and 3), rose steadily between 2008 and 2012, then reduced each year to 2015.
There were 1,902 incidents in 2016 however, an increase from the low point of 1,742 in 2015 and the first year numbers have increased since 2012.
Five of the 9 companies had an increase in total incidents between 2015 and 2016. We are meeting with companies that achieved reductions to understand how they did this. We want to see robust self-reporting and further reductions in incidents from all companies and encourage them to share best practice.
Numbers of serious pollution incidents and trend for the 9 water companies 2005 to 2016
0
25
50
75
100
125
150
20
05
20
06
20
07
20
08
20
09
20
10
20
11
20
12
20
13
20
14
20
15
20
16
Nu
mb
er
of
Seri
ou
s (c
ate
gory
1 a
nd
2)
Po
lluti
on
In
cid
en
ts
Year
Significant Peaks Trend (3 year moving average)
Numbers of category 1 to 3 pollution incidents and trend for the 9 water companies 2005 to 2016
0
250
500
750
1000
1250
1500
1750
2000
2250
2500
2750
3000
20
05
20
06
20
07
20
08
20
09
20
10
20
11
20
12
20
13
20
14
20
15
20
16
Nu
mb
er
of
cate
gory
1 t
o 3
Po
lluti
on
In
cid
en
ts
Year
Significant Peaks Trend (3 year moving average)

www.gov.uk/environment-agency LIT 10664 Page 6
Self-reporting of incidents Without a rapid and effective response, relatively minor events can escalate and the opportunity for mitigation measures is often lost. This is why we seek high levels of self-reporting of incidents, where water companies tell us about their incidents before a member of the public or third party does. Requiring and reviewing self-reporting is one part of the wide range of activities we do while regulating the companies. Pleasingly, in 2016, we saw the highest ever level of self-reporting of pollution incidents by the sector at 72%, up from 69% in 2015. The variation across companies in this measure has also decreased markedly in 2016 with poorer performers catching up. For 2016, the range was from 79% to 64%. The range in 2015 was from 82% to 48%. We expect company self-reporting to reach at least 75% by 2020.
Compliance with licences and permits All water companies have licences and permits to control the level of impact they are allowed to have on the environment. These vary in complexity depending on the activities concerned and the nature and sensitivity of the local environment. We set these conditions carefully and so expect companies to be 100% compliant with them.
For the first time, in the revised EPA, we have included discharge compliance at Water Treatment Works (WTWs) in 2016, as well as at Sewage Treatment Works (STW). Overall compliance was 98.6% (54 works out of a total of 3,762 failed to comply with numeric permit conditions). Compliance with numeric discharge permits for STWs only, was 99.0% in 2016, a slight improvement compared to 98.7% in 2015. This is because only 34 STWs failed, compared to 46 in 2015 and 40 in 2014. Six companies achieved the same or better compliance with numeric discharge permits at STWs in 2016 compared with 2015.
Compliance at WTWs needs to continue to improve, as 20 sites out of 271 failed in 2016 (92.6% compliance). As with waste water from STWs, treatment of dirty water from WTWs before discharge to the environment is essential to make sure that the receiving environment is not polluted. Only one company had 100% compliance with the numeric discharge conditions for WTW permits.
The water companies achieved 98.9% compliance with water abstraction and impoundment licences. There were 14 reported non-compliances against abstraction and impoundment licences during 2016. None of these caused environmental impacts. In response we issued written warnings to licence holders in 5 cases and advice and guidance letters in the other 9.
Water companies are also operators of waste activities and have 203 environmental permits for waste operations. The waste treatment processes are varied and include conditioning, composting and anaerobic digestion. We assess compliance and use the Operational Risk Appraisal (OPRA) to classify good or poor performance. We consider operators in compliance bands D, E and F as poor performers. During 2016, one permitted operation was assessed as poor and in compliance band D. We have taken action to alter the permit and work with the operator to improve performance. There was one serious incident (category 2) reported with reference to loss of control and containment of bio gas from a facility that uses anaerobic digestion to treat sludge and waste. In this instance the fault was rectified and no further problems have occurred. We have conducted a number of water treatment audits where anaerobic digestion is taking place and we are planning to continue this audit work in 2017 to 2018.
Number of Sewage Treatment Works (and for 2016 including Water Treatment Works) failing numeric limits and trend for the 9 water companies 2005 to 2016
0
25
50
75
100
125
150
20
05
20
06
20
07
20
08
20
09
20
10
20
11
20
12
20
13
20
14
20
15
20
16
Nu
mb
er
of
STW
s (a
nd
WTW
s fo
r 2
01
6)
Faili
ng
Nu
me
ric
Lim
its
Year
Significant Peaks Trend (3 year moving average)

www.gov.uk/environment-agency LIT 10664 Page 7
Sludge disposal and use All water companies produce sludge as part of their sewage treatment processes. This sludge needs to be disposed of and can often be put to good use, for example as a fertiliser on agricultural land. Its storage and spreading, however, requires careful control as misuse can result in environmental damage. We work with water companies to make sure they and their contractors understand the rules and regulations around sludge.
A revised definition of the metric for Satisfactory Sludge Disposal and Use has been agreed for use in the EPA for reporting 2018 data to 2020 inclusive. We are working with the sector to set out the compliance assessment methodology. For 2016 and 2017, we are using the existing definition.
In 2016, one company reported 99.97% compliance, all other companies reported 100%. A similar situation occurred in 2015, where the same one company reported 99.98% and all others reported 100%. In 2014 all companies reported 100%.
Progress with environmental improvement schemes In 2014, Ofwat set the prices that water companies could charge their customers between 2015 and 2020. As part of that price review we developed the National Environment Programme (NEP).
The NEP sets out the environmental improvements the water companies need to make over that period, to make sure they meet European and national environmental standards related to water. The NEP, within each company's AMP, includes schemes, investigations and monitoring to improve and protect the environment.
Bathing water quality, has generally improved significantly over the past 2 decades as a direct result of investment by water companies and work by other stakeholders. The majority of our bathing waters are very high quality and further investment is planned. Similarly, investment by water companies has resulted in thousands of kilometres of river water quality being improved benefiting people, economic growth and wildlife.
In previous reports, the EPA only included environmental improvement schemes for water quality. From 2016 (reporting on progress between April 2016 and March 2017), it also includes schemes associated with water resources, fisheries, biodiversity and geomorphology.
This EPA reports on the cumulative 2 year progress companies have made against their plans up to the end of March 2017. For the year April 2016 to March 2017, all 9 companies reported 100% delivery of planned schemes. All companies reported 100% delivery in 2015 for water quality schemes.
Security of water supply We have changed the EPA to now include the Security of Supply Index (SoSI) as a KPI. SoSI compares forecast water available for supply with actual customer demand. Expected performance is for companies to have a balance or a small surplus of water available when compared with demand (scoring a SoSI of 100).
For 2016 to 2017, 8 of the 9 companies reported a score of 100 and green status in the EPA. One company reported 99 and red status due to leakage levels significantly failing its leakage target. We see control and reduction of leakage as a fundamental component of Water Resources Management Planning.

www.gov.uk/environment-agency LIT 10664 Page 8
Flood and coastal risk management Between April 2016 and March 2017, water companies invested:
• £127 million to reduce the risk of sewer flooding to properties
• £55 million to maintain the public sewer system to prevent blockages and flooding
• £5 million in property-level protection and mitigation measures to reduce the likelihood of customers' homes experiencing sewer flooding
Under the Flood and Water Management Act 2010, water and sewerage companies are risk management authorities (RMAs). This means they have to act in a manner consistent with the National Flood and Coastal Erosion Risk Management (FCERM) Strategy for England and have a duty to cooperate with other RMAs. In 2016 to 2017 water companies have worked with others to:
• support recovery from flood incidents and repair to assets following the winter 2015 to 2016 flooding
• support lead local flood authorities on their local strategies, asset registers and flood investigations
• share data with RMAs to support flood risk assessments and produce integrated drainage models to better understand the risk of flooding
• identify and deliver sustainable and innovative solutions to reduce flood risk and enhance the environment
• develop their own drainage strategies and start to engage with partners on their Price Review 2019 plans and future investment needs
In September 2016, the government published the National Flood Resilience Review (NFRR). The review tested the understanding of fluvial and coastal flood risk in England and assessed the resilience of key local infrastructure. Water companies responded well to the review by assessing the risk of flooding to assets serving more than 25,000 people and took measures to make sure that these assets had appropriate temporary defences in place for the winter.
Relationships with RMAs and Regional Flood and Coastal Committees (RFCCs) have strengthened this year, with some companies co-funding staff as a shared resource with the RFCCs. This is enabling more partnership opportunities and contributions to strengthen the FCERM Investment Programme, benefiting communities and the environment.
Enforcement and sanctions We seek to be a firm and fair regulator. Where an offence has been committed, such as a pollution incident or breach of permit, we may consider taking enforcement action or imposing a sanction. We can seek to prosecute when there is significant environmental risk or harm, but may also choose other options where the incident has occurred as a result of a genuine accident or a company has done all it can to minimise the impact of the incident and prevent reoccurrence. We make decisions in the public interest based on our enforcement and sanctions guidance.
The formal options we have include a written warning, enforcement notices, issuing a formal caution, prosecution, or considering a civil sanction. A formal caution is the written acceptance by an offender that they have committed an offence, which as a recorded criminal sanction, will be produced in court if there are further offences.
Our flexible approach to sanctions enables us to choose options that can achieve environmental outcomes. We can accept or reject an enforcement undertaking (EU), a civil sanction, which is a voluntary agreement offered by those who may have committed an offence that becomes legally binding once accepted. The EU offer has to contain measures to restore any harm done, as well as steps to make sure of future

www.gov.uk/environment-agency LIT 10664 Page 9
compliance, such as long-term investment in environmental management systems. EUs should encourage legitimate business operators to make amends, come into compliance and prevent recurrence.
Gathering data and investigating events takes time, and so enforcement activity can conclude some months or years after the original offence occurred. As a result, enforcement activity in any one calendar year is not necessarily directly related to offences in that year. The numbers of prosecutions varies per year due to many factors. Variations in the size of fines occur due to a number of factors that are not within our control. The Sentencing Council guideline for environmental offences was published for use by the courts from 1 July 2014 and has resulted in significantly higher fines for the water companies.
We prosecuted water companies 10 times in 2016, and 9 times in 2015. The prosecutions in 2016 mostly related to sewage treatment works, but also included offences relating to sewerage assets, such as rising mains (pumped sewage pipes), a pumping station and a combined sewer overflow (where rain water and sewage are released to the environment). The total amount of water company fines was just over £6.5 million in 2016. This is the highest ever amount of fines in a year. It includes, a then record, £2 million fine for Southern Water following pollution of beaches in 2012 and 2014 at Margate in Kent.
Eleven formal cautions were accepted by 5 companies in 2016. This is lower than in previous years. We accepted 4 EUs totalling £610,000 for offences by 2 companies (Anglian Water and Northumbrian Water) in 2016. This raised the total number since they were introduced in 2014 to 6.
The largest EU from Northumbrian Water was to fund £375,000 of Rivers Trust restoration and site improvement work, following pollution from a pumping station in 2015 and 2016.
Enforcement and sanctions should help deter future offences. As a modern regulator, we also use 'earned recognition' to encourage and recognise better performance. This involves approaches that promote innovation, and lighter touch regulation for those companies who consistently perform well.
Partnerships and innovation Where companies comply with regulation and demonstrate good performance we seek to work with them to promote partnerships and innovation. We use influence, advice and other complementary approaches wherever possible to achieve more environmental outcomes but which can reduce the regulatory burden on water companies.
We are working with Wessex Water, one of the industry's leading companies, on an innovative regulatory approach for the Bristol Avon catchment.
Number of
Prosecutions Amount of
Prosecution Fines Number of
Charges receiving Formal Caution
Number of Enforcement Undertakings
Value of Enforcement Undertakings
2015 9 £2,494,500 25 0 £0
2016 10 £6,560,000 11 4 £610,000
Enforcement and sanctions for the 9 water companies 2015 to 2016

www.gov.uk/environment-agency LIT 10664 Page 10
Wessex Water case study, Bristol Avon catchment permitting The Bristol Avon river catchment has a number of rivers whose ecology is in a poor state due to phosphorus pollution. The phosphorus is mainly discharged from the large number of Wessex Water STWs in the catchment along with other sources such as farming.
Costs and benefits of conventional solutions to reduce phosphorus levels were looked at, such as treating the sewage with iron or aluminium compounds. This showed that such methods would not be appropriate, except at the very bottom of the catchment where there would be the least environmental improvement.
Improvements are usually planned on a catchment basis. The results of this planning, however, are traditionally applied as waste water specific discharge limits in the environmental permit for each STW. In this trial, we are looking at an innovative permitting solution to achieve the best overall environmental solution at least cost.
We have worked with Wessex Water to develop a catchment-wide permitting approach involving 66 STWs with improvements at 24 of them. The approach is based on optimising the additional capacity that water companies built into their STW design. Phosphorus load reduction targets have been set for the performance of these works. These will benefit the environment without increasing the cost or regulatory risk for Wessex Water.
Wessex Water will make a saving of about £20 million using this approach. They plan to remove about an additional 47 tonnes of phosphorus per year. This will result in widespread ecological improvements in the catchment.
Conclusions and forward look This year, with the revised EPA in place, we are encouraged by the performance of several companies. They have met the challenge of the tightened thresholds and revised KPI definitions and continue to deliver 'leading' or ‘good’ performance. Water companies have made welcome improvements over time. Thankfully, the industry no longer has the level of adverse impact on the environment that it had in the past. It recognises there is further work to do to meet the requirements of legislation and public expectation. We will work with and regulate the companies to help achieve a better environment, especially those 3 companies that are rated as 'requires improvement'. We will continue to encourage continuous improvement across the sector. In particular we wish to see a reduction in the most serious pollution incidents.

www.gov.uk/environment-agency LIT 10664 Page 11
Table 1: Water and sewerage companies – Environmental Performance Assessment (EPA) 2016

www.gov.uk/environment-agency LIT 10664 Page 12
Annex 1: History of EPA results Water and sewerage companies – Environmental Performance Assessment (EPA) 2015
Pollution
incidents
(sewerage)
Serious pollution
incidents
(sewerage)
Discharge
permit
compliance
Satisfactory
sludge
disposal
Self-reporting
of pollution
incidents
AMP National
Environment
Programme delivery
Overall
performance rating
Anglian Water
*** Northumbrian Water
*** Severn Trent Water
**** Southern Water *** South West Water
* Thames Water
*** United Utilities
**** Wessex Water
**** Yorkshire Water
*** Water and sewerage companies – Environmental Performance Assessment (EPA) 2014
Anglian Water
*** Northumbrian Water
*** Severn Trent Water
*** Southern Water
** South West Water
** Thames Water
*** United Utilities
*** Wessex Water
*** Yorkshire Water
**** Water and sewerage companies – Environmental Performance Assessment (EPA) 2013
Anglian Water
*** Northumbrian Water
*** Severn Trent Water
**** Southern Water
* South West Water
* Thames Water
** United Utilities
*** Wessex Water
*** Yorkshire Water
*** Water and sewerage companies – Environmental Performance Assessment (EPA) 2012
Anglian Water
*** Northumbrian Water
*** Severn Trent Water
*** Southern Water
** South West Water
** Thames Water
*** United Utilities
*** Wessex Water
**** Yorkshire Water
** Water and sewerage companies – Environmental Performance Assessment (EPA) 2011
Anglian Water
*** Northumbrian Water
** Severn Trent Water
*** Southern Water
** South West Water
* Thames Water
*** United Utilities
*** Wessex Water
**** Yorkshire Water
**

www.gov.uk/environment-agency LIT 10664 Page 13
Annex 2: Expectations for operational performance In 2013, following Ofwat’s publication of its final methodology for developing business plans, we wrote to all water companies setting out our expectations on a range of areas. This annex repeats the expectations around operational performance.
Protecting the environment
1. A plan in place to achieve 100% compliance for all licences and permits.
2. Look up table permits for water quality discharges should be 100% compliant.
3. Compliance with flow requirements, including MCERTS certification, at Waste Water Treatment Works. 4. Reducing serious (category 1 and 2) pollution incidents, trending towards zero by 2020. There should be at least a 50% reduction compared to numbers of serious incidents recorded in 2012.
5. Trend to minimise all pollution incidents (category 1 to 3) by 2020. There should be at least a third reduction compared to numbers of incidents recorded in 2012.
6. Restored sustainable abstractions outcomes are achieved.
7. Management of sewage sludge treatment and re-use should not cause pollution and must follow the Sludge (Use in Agriculture) Regulations and the Code of Practice for Managing Sewage Sludge, Slurry and Silage or Environmental Permitting Regulations (EPR).
8. High levels of self-reporting of pollution incidents. At least 75% of incidents self-reported by 2020.
9. Environmental improvement schemes (eg Asset Management Plan, Water Resource Management Plans) are planned well and delivered as planned.
10. Effective management of transferred private sewers and pumping stations with low levels of pollution incidents.
11. No D, E, or F rated sites under OPRA for waste related sewerage service Environmental Permitting Regulations permits.
12. Sample and provide data in relation to self monitoring under Operator Self Monitoring (OSM) and Urban Waste Water Treatment Directive (UWWTD).
13. Act in a manner consistent with the National Flood and Coastal Erosion Risk (FCERM) Strategy for England, when carrying out FCERM functions.
14. By 2020, the vast majority of storm discharges should have event duration monitoring. The discharges that require monitoring will be determined by a risk based methodology that is currently being developed. The required monitoring will be proportionate depending on the sensitivity of the receiving water and frequency of operation.
Sustainable management of drainage and surface water
15. Mapping of assets and application of the Drainage Strategy Framework (priority catchments by 2020) combined with comprehensive, monitoring, and management of key assets by 2020.
16. A comprehensive maintenance programme for networks and sewage treatment works.
17. A targeted programme of capital maintenance.
18. Reduced sewer flooding of properties, trending to zero.
19. Work in partnership with lead local flood authorities to deliver value for money sustainable solutions that reduce flood risk.
Security of supply
20. Delivery of Water Resources Management plans (WRMPs).
21. Achieve security of supply outcomes as defined in WRMPs.

www.gov.uk/environment-agency LIT 10664 Page 14
22. Achieve at least the sustainable economic level of leakage.
23. Universal metering in water stressed areas where your WRMP appraisal supports that.
24. All outstanding actions on drought plans are resolved and completed.