water arabia 2015 - · pdf file1,220,000 m3/day installed capacity 630,000 m3/day ro capacity...
TRANSCRIPT

Water Arabia 2015
Improvements to Brackish Water RO plants
Peter SzappanosVeolia Arabia - Operations
WaterWater

Contents
2
Context
Challenges and improvements
Conclusions and lessons learnt
Way forward

Client: National Water Company – Riyadh City Business Unit (RCBU)Management contract from 2008 to 2014Client’s expectations:
Align RCBU with NWC strategy
Improve services
Prepare company for future privatization
Enable transition from public to private
Introduce performance based culture and best practices
Fixed fee + incentives based on CAPEX and OPEX savings (HR excluded)4 KPIs, 33 performance indicators (26 with O&M), 37 deliverablesVeolia managers in key positions with Saudi counterparts
The contract
3

Demand5.5 million inhabitants
4-5% growth per year2.1 million m3/day suppliedContinuity of supply: 70%Winter / summer peak factor 1.2
Riyadh water supply
4
Assets40 treatment plants (37 with RO)1,220,000 m3/day installed capacity630,000 m3/day RO capacity280 deep wells (500 - 2000m depth)60,000 assets First plant in early 1960s, RO introduced in late 1980s early 1990sOPEX 576mSAR/yr (470mSAR RO) Water sources
50% deep wells50% desalinated water from SWCCRaw water quality (TDS 1300-2000, Iron 0.2-2, Silica 15-50, Total Hardness 700-1300, Total Alkalinity 120-210 mg/L)
Employees4,200 employees in total (water plants O&M 1,200)Direct employees: 98% Saudi nationalsOutsourced RO capacity: 22%

Main challenges
5
Produce more waterMinimize water quality failuresImprove equipment availabilityOptimize OPEXImprove operators skills

Improvements from 2008 to 2014
6
2008 2014 Change
ALL PLANTS
Installed (MLD) 1004 1220 +21%
Actual (MLD) 710 1110 +56%
Utilization 71% 91%
PLANTS WITH RO
Installed (MLD) 594 790 +33%
Actual (MLD) 382 642 +68%
Utilization 64% 80%
Installed (MLD)w/o new RO
594 594
Actual (MLD)w/o new RO
382 465 +22 %
Utilization 64% 78%
WATER QUALITY COMPLIANCE
Compliance <90% 99.75% Chemical / 99.99% Microbiology

Approach
7
RO plants / Water
Treatment
People /skills
Supply chain
Maintenance
Safety
Asset Management
Efficiency
Quality Management
Management / reporting

Achievements
Asset condition survey and registerCriticality surveySummer Action PlanInvestment PlanningFocus on reliability, availability and criticality, serviceability when selecting equipment for replacementImproved cooperation between Asset Services and Operations (early buy-in)Standard specificationsClear handing over procedures
Asset Management
8
Challenges
No asset registerCondition of assets unknownAssets operated well beyond their expected design lifeUnclear selection criteria for asset replacementPoor delivery of new assets (deadlines, quality, handing over) Silo mentality between Ops and ASO&M needs not taken on board

Asset Renewals (examples)
9
Full RO replacement – 1 siteStage conversions – 3 sites
Backwash system upgrade 2 sitesChemical dosing 4 sites
Cooling tower replacements 5 sites

Achievements
8% reduction achievedEnergy efficiency audit in 2009More efficient motors in wells (10 mSAR/yr saving) min 20 units per year replacedReplaced pumps in 4 boosters Accelerated RO stage conversion program (one plant left) Pressure management in the network (modulated PRVs)VSDs is standard for new boostersSet up internal energy efficiency unit
Energy Optimization
10
Challenges
20% reduction expected by 2014 against a 2.33 kWh/m3 baselineProduction uses 80% of RCBU’s consumptionOversized pumps in boostersLow efficiency wellpump motors3-stage ROsFixed speed pumps

Achievements
Asset survey and registerCriticality surveyEquipment availability 95.5% in 2014Number of planned WOs up by 110% Completed WOs up to 96% Rolled out CMMSIntroduced predictive maintenance (vibration, thermal, oil analysis)Winter Shutdown Maintenance Framework contractsStandard specificationsRoot cause analysisCloser to Planned-Proactive state
Maintenance Optimization
11
Challenges
60,000 assets across water plants>95% availability expectation for critical equipmentReactive state maintenanceMaintenance often driven by spares availabilityLegacy equipment issues
Thermoteknix VisIR 7:03:25 PM 2/8/2013 e : 1.00 Bg : 25.0°C
-10.00
85.00
21.88
52.16
Celsius
25.00
30.00
35.00
40.00
45.00
50.00
Area 1Max. Avg. Min.51.63 36.30 24.63
Achievements
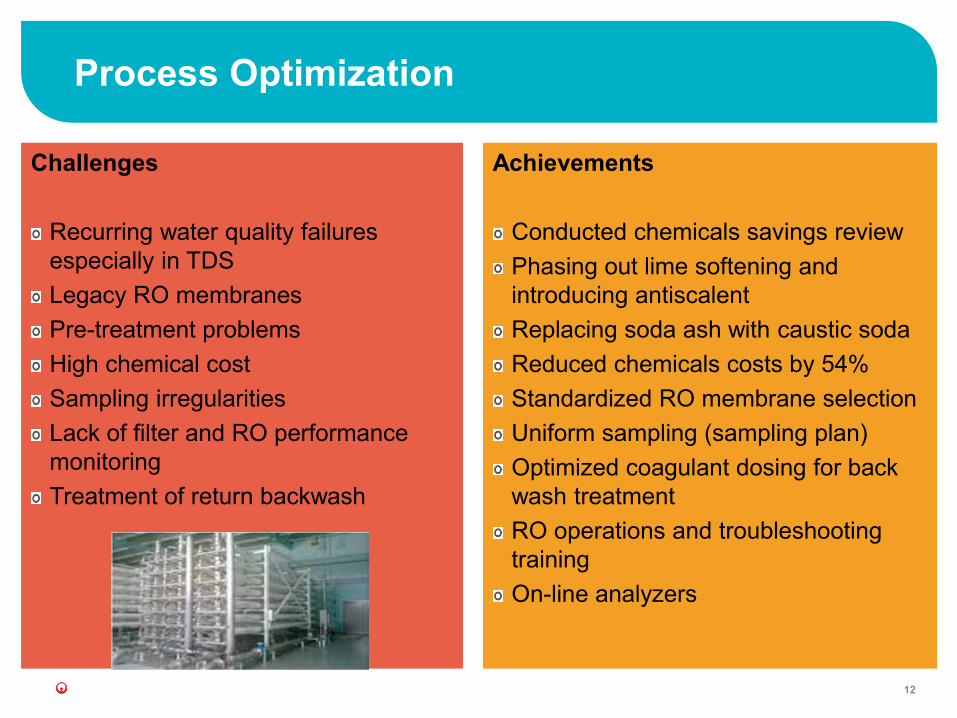
Conducted chemicals savings reviewPhasing out lime softening and introducing antiscalentReplacing soda ash with caustic sodaReduced chemicals costs by 54%Standardized RO membrane selectionUniform sampling (sampling plan)Optimized coagulant dosing for back wash treatmentRO operations and troubleshooting training On-line analyzers
Process Optimization
12
Challenges
Recurring water quality failures especially in TDSLegacy RO membranesPre-treatment problemsHigh chemical costSampling irregularitiesLack of filter and RO performance monitoringTreatment of return backwash

Carried out Skills Assessment (by Veolia Foederis system) Training Needs AnalysisTraining (safety, technical, soft skills and management skills, international training, Veolia Knowledge Transfer training) Up to 25,000 training days/yearTechnical training: RO operation, troubleshooting, Chemical preparation and dosing, Process optimization, Sampling, etcNew job descriptionsAnnual appraisal and bonus systemManagement by objectives Overtime optimization
People
13

Change in safety culture – it is an integral part of operations and critical for business continuityRCBU targets based on severity and frequencyNew safety organizationSafety procedures: full revision and update Training on all proceduresNew safety equipment Comprehensive safety survey and action plan Accident reporting
Specific areas:Acid dosingPressure vesselsChlorine dosing
Safety
14

Set up a Performance TeamFormal certification (ISO 14001, OHSAS 18001, ISO 9001) for 2 sitesStandard Operating Procedures: 30 per plant for Operation and 100 for maintenanceDocument Management systemStandard specifications Internal audits
Quality Management
15

Significant gains were made (volumes supplied, water quality, equipment availability, OPEX savings)
Some targets were missed mainly due to budget limitations
Change the mindset in many key areasPlanning and budgeting
Performance management / Accountability
Operation and Maintenance
Active support from Client (National Water Company) and RCBU employees
Veolia’s expertise and experience was key in meeting the contract challenges
Conclusions
16

Performance base line must be clear to avoid disputes over incentives
Cost of change and impact of targets must be well understood (especially in terms of asset renewals) in advance
For lasting impact knowledge transfer is key (sufficient training budget is paramount!)
Support services (Finance, HR, Procurement) must also be up to speed otherwise targets cannot be reached
Duplicated management structure can be at times slow down decision-making
Lessons learnt
17

Challenges / changes
Supply will outstrip demand (due to increased supply from SWCC)Strategic project will affect the way plants work Existing deep wells: reduction in dynamic water levels and gradually deteriorating water qualityMore pressure to improve quality and efficiencyFrom demand to efficiency driven environment
Way forward for RCBU Water Plants
18
Possible answers
Process optimization (low pressure membranes, fine tuning of pre-treatment, etc)Continue with energy and chemicals optimizationImprove automation levelsHeadcount optimization (find additional tasks, in-source activities, re-train) Closure/mothballing of least efficient plants?Maintenance: reach Proactive – Right First time stageObtain ISO certification for all plants

Water Arabia 2015
Thank you
Peter SzappanosVeolia Arabia - Operations
WaterWater