water column monitoring 2003 - summary report · ketil hylland, niva client(s): norsk hydro...
TRANSCRIPT

© This document may only be reproduced with the permission of RF or the client. RF - Rogaland Research has a certified Quality System in compliance with the standard NS - EN ISO 9001
RF-Akvamiljø
Børseth, Jan Fredrik1 and Tollefsen, Knut-Erik2 1) RF-Akvamiljø, 2) NIVA
Water Column Monitoring 2003 - Summary Report
Report RF – 2004/039
Project number: 715 1686
Project Quality Assurance: Odd-Ketil Andersen, RF-Akvamiljø Ketil Hylland, NIVA
Client(s): Norsk Hydro Produksjon AS on behalf of OLF WCM coordination group
Distribution restriction: Confidential
RF – Rogaland Research. http://www.rf.no
Preface This is the summary report of the Water Column Monitoring 2003 project. The project has been a collaboration project between RF-Akvamiljø and Norwegian Institute for Water Research (NIVA) with several sub-contractors. The sub-contractors have been The Centre for Environment, Fisheries & Aquaculture Science (CEFAS), University of the Basque Country (UPV/EHU), University of Stockholm. Other contributors to the project, but coordinated directly from Norsk Hydro and OLF have been Ocean Climate a/s and the Norwegian Institute of Marine Research, represented by the crew onboard R/V Sarsen. In addition to the expertise given by Bjørn Serigstad, Ocean Climate a/s with regard to the technical part of the fish and mussel caging, he contributed with valuable comments to the cruise report.
This has been the first regular water column monitoring survey in the North Sea and it was based on guidelines given from the BECPELAG Workshop in 2001. We would like to thank a number of people at the different companies and institutes that have contributed to make this a valuable project.
Pre-exposure sampling: Sigurd Øxnevad (NIVA), Rolf Sundt (RF-Akvamiljø), Veslemøy Eriksen (RF-Akvamiljø) and Anne Helene Tandberg (RF-Akvamiljø).
Survey I: Espen E. Hoell (Norsk Hydro) for technical advice and highly appreciated help under all surveys. Bjørn Serigstad (Ocean Climate a/s), Vidar Saue (Ocean Climate a/s), Dag Altin (Biotrix da.), Rolf Sundt (RF-Akvamiljø)
Survey II: Espen E. Hoell (Norsk Hydro), Rolf Sundt (RF), Sigurd Øxnevad (NIVA), Tom Christian Mortensen (NIVA), Hans-Petter Mannvik (Akvaplan-NIVA), Alexandra Abrahamson (Fiskerihøgskolen i Tromsø/ University of Uppsala), Anne O. Steen (NTNU).
Analytical work: NIVA: Merete Grung, Alfhild Kringstad, Anders Ruus, Harry Efraimsen, Aase Kristine Rogne. RF-Akvamiljø: Lars Petter Myhre, Anne Bjørnstad, Harald Berland, Grete Jonsson, Anne Helene Tandberg, Sigfryd Torgrimsen and Kjell Birger Øysæd. CEFAS: Steve Feist, Grant Stentiford and John Bignell. University of the Basque Country (UPV/EHU): Ionan Marigomez, Beñat. Zaldibar, Eider Bilbao, Amaia Orbea, Manu Soto, Ibon Cancio, Miren P. Cajaraville. University of Stockholm: Lennart Balk and Halldora Skarphedinsdottir
Stavanger / Oslo, 29. April 2005
Jan Fredrik Børseth, coordinator & project leader RF-Akvamiljø
Knut-Erik Tollefsen, project leader NIVA
RF – Rogaland Research. http://www.rf.no
Contents
1 INTRODUCTION................................................................................................................ 4
2 OBJECTIVES AND RATIONALE FOR THE WORK ...................................................... 5
3 EXPERIMENTAL DESIGN................................................................................................ 5
4 RESULTS............................................................................................................................. 7
4.1 Fish .............................................................................................................................. 8 4.1.1 Vitellogenin (vtg) ........................................................................................... 8 4.1.2 PAH metabolites ............................................................................................ 9 4.1.3 EROD activity .............................................................................................. 10 4.1.4 GST activity ................................................................................................. 11 4.1.5 DNA adducts ................................................................................................ 12 4.1.6 Histochemistry ............................................................................................. 13 4.1.7 Histopathology ............................................................................................. 14
4.2 Mussels...................................................................................................................... 16 4.2.1 Body burden of NPD, 16 EPA PAHs and decalins...................................... 16 4.2.2 BaPH activity ............................................................................................... 18 4.2.3 Lysosomal response ..................................................................................... 19 4.2.4 Histochemistry ............................................................................................. 20 4.2.5 Histopathology ............................................................................................. 22
5 DISCUSSION..................................................................................................................... 23
6 CONCLUSION .................................................................................................................. 25
7 REFERENCES ................................................................................................................... 26
RF – Rogaland Research. http://www.rf.no
- 4 -
1 Introduction
Organisms living in the water column around offshore oil and gas production facilities are predominantly exposed to chemicals through discharge of production water (OLF 2000). The amount and composition of produced water (PW) varies from field to field, but is generally a mixture of: a) formation water contained naturally in the reservoir, b) injected water used for secondary oil recovery and c) treatment chemicals added during production (Røe 1998). Typically, produced water contains dissolved inorganic salts, minerals and heavy metals together with dissolved and dispersed oil components and other organic compounds. The specific chemical composition varies between reservoirs and within a reservoir as production proceeds. A target chemical characterisation of four offshore oil production platforms in the North Sea showed that the major organic components were BTEX (benzene, toluene, ethylbenzene and xylene), NPD (naphtalenes, phenanthrenes and dibenzothiophenes), PAHs (polyaromatic hydro-carbons), organic acids, alkylphenols (APs) and phenols (Røe and Johnsen 1996; Utvik 1999). As a natural consequence of well exploitation, oil content in the reservoirs will decrease and the need to inject water will increase, thus eventually leading to increase in the discharges of PW. A recent report estimate that the total discharges of PW in the Norwegian sector of the North Sea will increase from approximately 130 million m3/year in 2002 to 180 million m3/year in 2011 followed by stabilisation and decrease in discharges (SFT 2004).
Some of the organic chemicals found in PW are relatively resistant to biodegradation, have a bioaccumulation potential and may be toxic to organisms in receiving waters (Brendehaug et al. 1992; Tollefsen et al. 1998; Taban and Børseth 2000; Aas et al. 2000). This applies in particular to groups of chemicals such as alkylphenols (APs) and polycyclic aromatic hydrocarbons (PAHs) that are known to produce various toxic effects including reproductive disturbances, mutagenicity and carcinogenicity (Landahl et al. 1990; Bechmann 1999; Lye 2000; Meier et al. 2002). Recent studies from the ICES workshop “Biological effects of contaminants in the pelagic ecosystem (BECPELAG)” indicate that toxic compounds are detectable several kilometres away from a North Sea oil production platform using in vitro bioassays (Thomas et al. In press; Tollefsen et al. In press) and biomarkers (Balk et al. In press; Regoli et al. In press; Aas et al. In press). Although there is reason to assume that many of the chemicals that are present in PW effluents may produce biological responses, the ability to assess the potential for adverse effects are limited by the lack of sufficient in situ monitoring data using biological effects methods with endpoints reflecting long term (ecological) effects.
Biological indicators or markers (biomarkers) have been developed to measure the biological response related to an exposure to, or the toxic effect of, an environmental chemical (Peakall 1992). Some biomarkers are specific in terms of their ability to detect and assess the potential for effects through a specific toxic mechanism, whereas others give information about larger groups of chemicals with more diverse mechanisms of action. Common for all of the methods is the capability of performing time-integrating
RF – Rogaland Research. http://www.rf.no
- 5 -
response assessment to complex mixtures over extended periods of time, which is often required in environmental monitoring. Since most of these methods are highly sensitive and responses occur at lower concentrations and/or prior in time to more adverse effects at a higher organisation level, the methods have become convenient early-warning tools for assessing the potential for long term (ecological) effects. The use of biomarkers in sentinel species or specific caging systems with keystone species has consequently facilitated the implementation of such methods in various environmental monitoring programs in freshwater, marine and estuarine areas. A combination of laboratory and field validation of the different biomarker and effects-based methods has greatly improved the knowledge of the potential and limitations of these methods and made it possible to link responses of biomarker signals to the potential for more adverse effects at the ecological level (Collier et al. 1992; Elliot et al. 2003; Bechmann et al. in prep).
2 Objectives and rationale for the work
The objective of the 2003 Water Column Survey (WCS2003) was to assess whether chemicals discharged from the Troll B production platform affect organisms in the water column and estimate the area of influence. The assessment was to be based on a combination of biomarker and chemical analyses. A suite of biomarker and effect-based methods were chosen on basis of the reported chemical profile for the Troll B discharge and recommendations from the ICES workshop “Biological Effects of contaminants in the Pelagic ecosystem, BECPELAG” (SFT 2003) .
3 Experimental design
This study was designed to monitor bioaccumulation and biomarker responses in organisms held in cages in the vicinity of the Troll B platform (Table 1). All cages were deployed for 6 weeks except for FB1 that was lost and replaced after 2 weeks (see details in Survey report). Four of the mussel rigs were placed in an expected plume, two cages in the expected area of influence and two cages outside the expected area of influence. One of the mussel rigs in the purported plume (2000m-D) was lost during sampling. Atlantic cod were caged at the reference locations and at two of the locations in the plume. Zero-time samples were taken of both blue mussels and Atlantic cod for determination of pre-exposure levels of contaminants and biomarker responses.
RF – Rogaland Research. http://www.rf.no
- 6 -
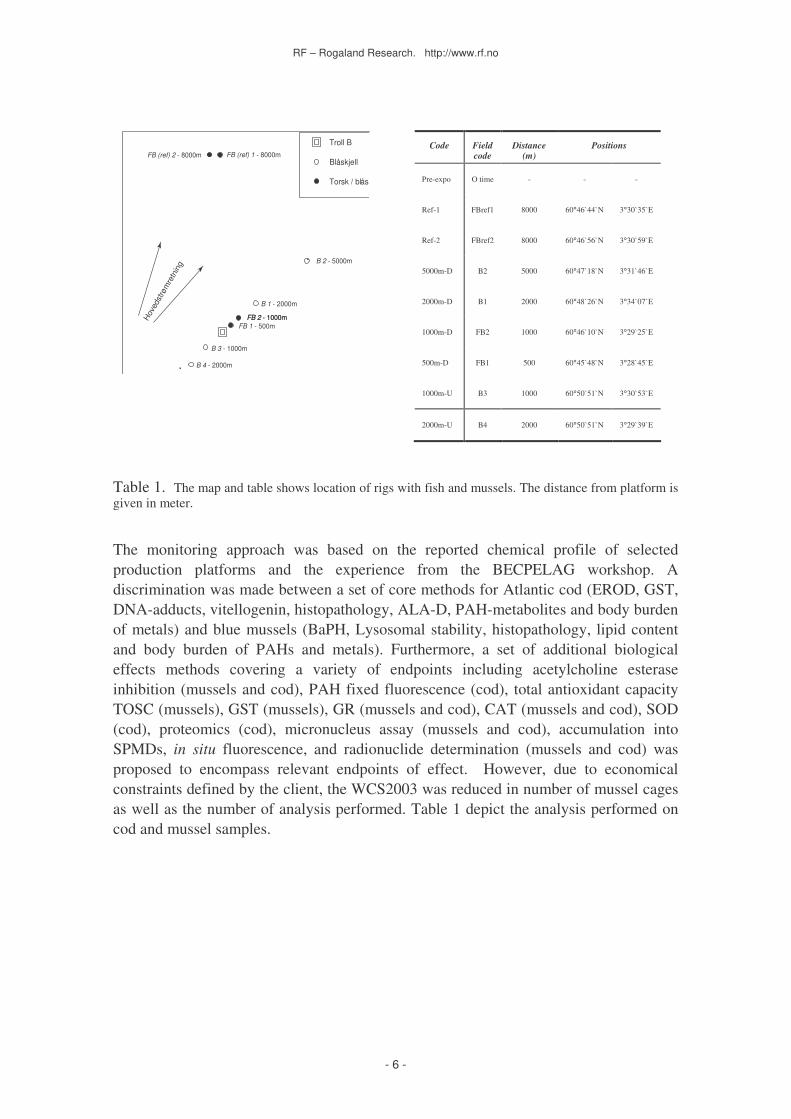
Table 1. The map and table shows location of rigs with fish and mussels. The distance from platform is given in meter.
The monitoring approach was based on the reported chemical profile of selected production platforms and the experience from the BECPELAG workshop. A discrimination was made between a set of core methods for Atlantic cod (EROD, GST, DNA-adducts, vitellogenin, histopathology, ALA-D, PAH-metabolites and body burden of metals) and blue mussels (BaPH, Lysosomal stability, histopathology, lipid content and body burden of PAHs and metals). Furthermore, a set of additional biological effects methods covering a variety of endpoints including acetylcholine esterase inhibition (mussels and cod), PAH fixed fluorescence (cod), total antioxidant capacity TOSC (mussels), GST (mussels), GR (mussels and cod), CAT (mussels and cod), SOD (cod), proteomics (cod), micronucleus assay (mussels and cod), accumulation into SPMDs, in situ fluorescence, and radionuclide determination (mussels and cod) was proposed to encompass relevant endpoints of effect. However, due to economical constraints defined by the client, the WCS2003 was reduced in number of mussel cages as well as the number of analysis performed. Table 1 depict the analysis performed on cod and mussel samples.
Code Field code
Distance (m)
Positions
Pre-expo O time - - -
Ref-1 FBref1 8000 60°46`44`N 3°30`35`E
Ref-2 FBref2 8000 60°46`56`N 3°30`59`E
5000m-D B2 5000 60°47`18`N 3°31`46`E
2000m-D B1 2000 60°48`26`N 3°34`07`E
1000m-D FB2 1000 60°46`10`N 3°29`25`E
500m-D FB1 500 60°45`48`N 3°28`45`E
1000m-U B3 1000 60°50`51`N 3°30`53`E
2000m-U B4 2000 60°50`51`N 3°29`39`E
FB 2 - 1000mFB 2 - 1000m
B 2 - 5000m
Troll B
Blåskjell
Torsk / blåskjell
Hov
edst
røm
retn
ing
FB 1 - 500m
FB (ref) 1 - 8000mFB (ref) 2 - 8000m
B 1 - 2000m
B 3 - 1000m
B 4 - 2000m
RF – Rogaland Research. http://www.rf.no
- 7 -
Table 2. Overview of biomarker and analyses performed during WCS2003.
Method Matrix No. samples EROD Cod liver 125 GST Cod liver 125 DNA-adducts Cod liver 125 Vitellogenin Blood plasma 125 Histopathology/-chemistry Cod liver, gonad & kidney
Mussel digestive gland a.o. 20-80
PAH-metabolites Cod bile 125 BaPH activity Mussel hepatopancreas 100 Lysosomal stability Mussel hematocytes 45 Lipid content Mussel whole tissue 21 (pool of mussels) Body burden (NPD, PAHs & decalins)
Mussel whole tissue 21 (pool of mussels)
4 Results
The suite of methods used reflect biomarkers of exposure (body burden of metals and organic chemicals, benzo[a]pyrene hydroxylase, neutral lipid retention, peroxisomal Acyl-CoA oxidase activity, PAH metabolites, EROD and GST activity) and effects (vitellogenin, DNA-adducts, lysosomal membrane stability, structural integrity of lysosoms and digestive tubules, gonad index, histopathology including extent of programmed cell death i.e. apoptosis).
The following text presents the most significant findings in this study and with references to more detailed descriptions that can be found in the different analyses reports.
RF – Rogaland Research. http://www.rf.no
- 8 -
4.1 Fish
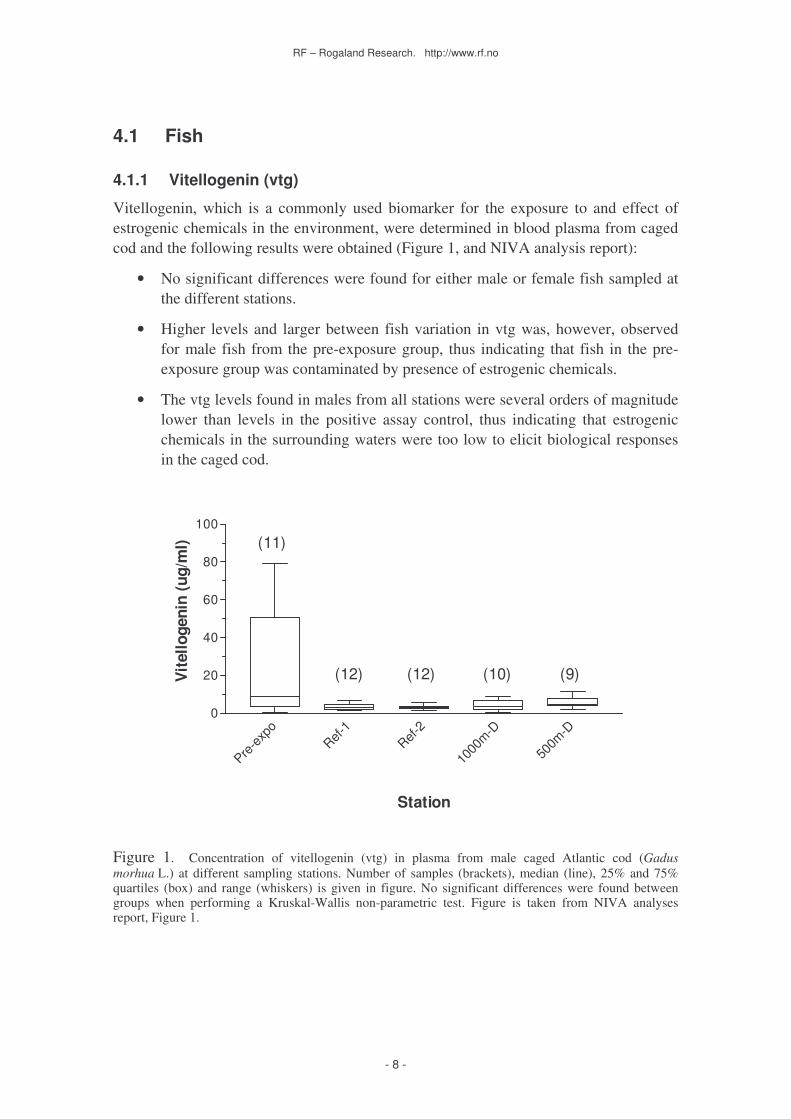
4.1.1 Vitellogenin (vtg)
Vitellogenin, which is a commonly used biomarker for the exposure to and effect of estrogenic chemicals in the environment, were determined in blood plasma from caged cod and the following results were obtained (Figure 1, and NIVA analysis report):
• No significant differences were found for either male or female fish sampled at the different stations.
• Higher levels and larger between fish variation in vtg was, however, observed for male fish from the pre-exposure group, thus indicating that fish in the pre-exposure group was contaminated by presence of estrogenic chemicals.
• The vtg levels found in males from all stations were several orders of magnitude lower than levels in the positive assay control, thus indicating that estrogenic chemicals in the surrounding waters were too low to elicit biological responses in the caged cod.
Pre-e
xpo
Ref-1
Ref-2
1000
m-D
500m
-D0
20
40
60
80
100(11)
(12) (12) (9)(10)
Station
Vit
ello
geni
n (u
g/m
l)
Figure 1. Concentration of vitellogenin (vtg) in plasma from male caged Atlantic cod (Gadus morhua L.) at different sampling stations. Number of samples (brackets), median (line), 25% and 75% quartiles (box) and range (whiskers) is given in figure. No significant differences were found between groups when performing a Kruskal-Wallis non-parametric test. Figure is taken from NIVA analyses report, Figure 1.
RF – Rogaland Research. http://www.rf.no
- 9 -
4.1.2 PAH metabolites
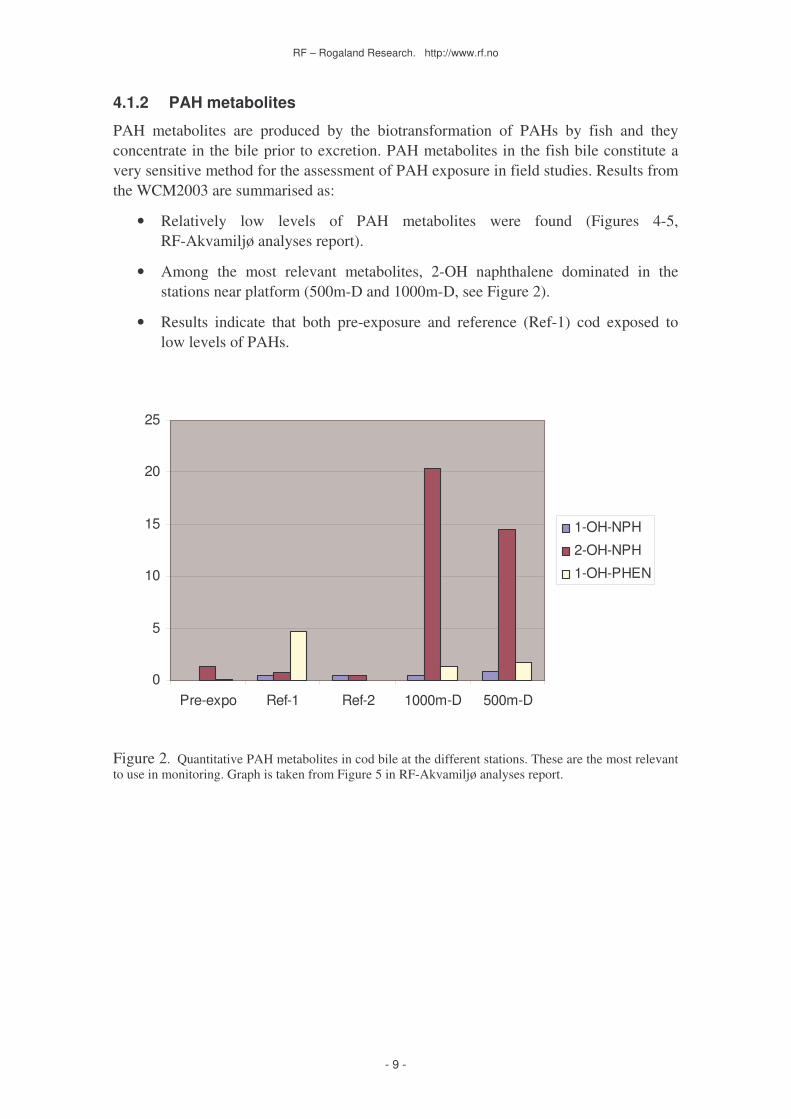
PAH metabolites are produced by the biotransformation of PAHs by fish and they concentrate in the bile prior to excretion. PAH metabolites in the fish bile constitute a very sensitive method for the assessment of PAH exposure in field studies. Results from the WCM2003 are summarised as:
• Relatively low levels of PAH metabolites were found (Figures 4-5, RF-Akvamiljø analyses report).
• Among the most relevant metabolites, 2-OH naphthalene dominated in the stations near platform (500m-D and 1000m-D, see Figure 2).
• Results indicate that both pre-exposure and reference (Ref-1) cod exposed to low levels of PAHs.
0
5
10
15
20
25
Pre-expo Ref-1 Ref-2 1000m-D 500m-D
1-OH-NPH
2-OH-NPH
1-OH-PHEN
Figure 2. Quantitative PAH metabolites in cod bile at the different stations. These are the most relevant to use in monitoring. Graph is taken from Figure 5 in RF-Akvamiljø analyses report.
RF – Rogaland Research. http://www.rf.no
- 10 -
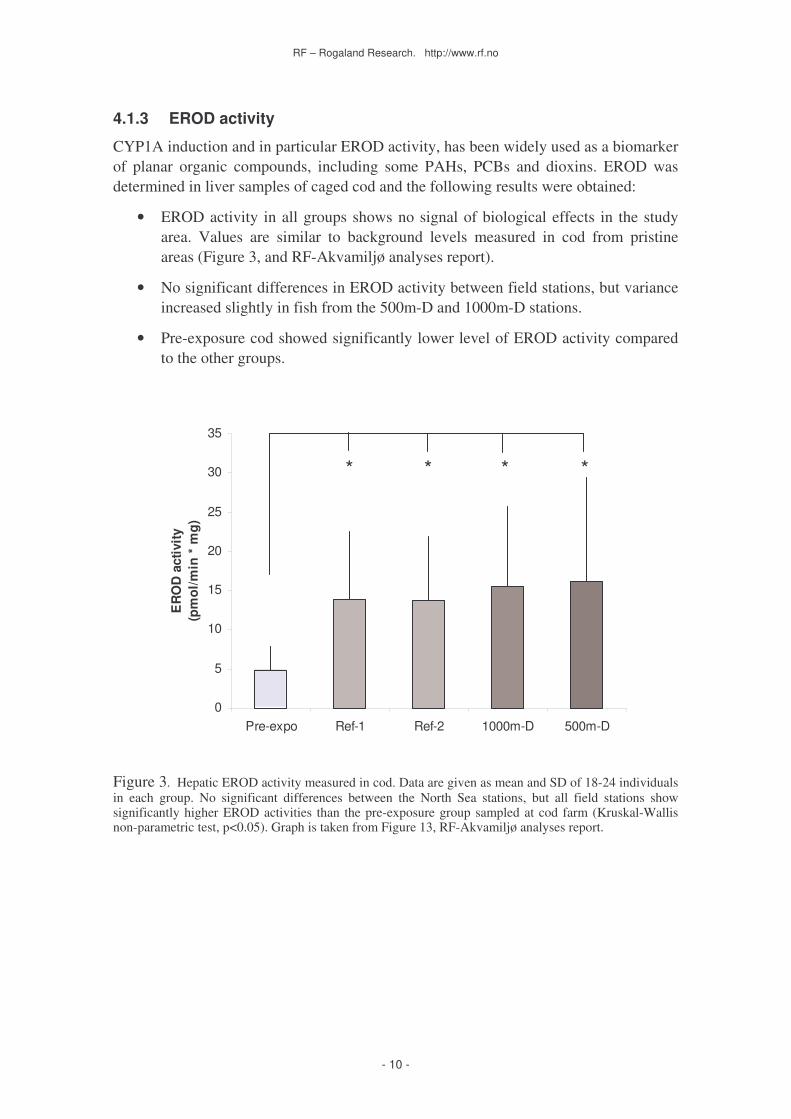
4.1.3 EROD activity
CYP1A induction and in particular EROD activity, has been widely used as a biomarker of planar organic compounds, including some PAHs, PCBs and dioxins. EROD was determined in liver samples of caged cod and the following results were obtained:
• EROD activity in all groups shows no signal of biological effects in the study area. Values are similar to background levels measured in cod from pristine areas (Figure 3, and RF-Akvamiljø analyses report).
• No significant differences in EROD activity between field stations, but variance increased slightly in fish from the 500m-D and 1000m-D stations.
• Pre-exposure cod showed significantly lower level of EROD activity compared to the other groups.
0
5
10
15
20
25
30
35
Pre-expo Ref-1 Ref-2 1000m-D 500m-D
ER
OD
act
ivity
(pm
ol/m
in *
mg)
* * * *
Figure 3. Hepatic EROD activity measured in cod. Data are given as mean and SD of 18-24 individuals in each group. No significant differences between the North Sea stations, but all field stations show significantly higher EROD activities than the pre-exposure group sampled at cod farm (Kruskal-Wallis non-parametric test, p<0.05). Graph is taken from Figure 13, RF-Akvamiljø analyses report.

RF – Rogaland Research. http://www.rf.no
- 11 -
4.1.4 GST activity
Glutathione S-transferase belongs to the phase II part of the detoxification system of the fish and is able to convert lipophilic compounds into more hydrophilic and thereby more excretable metabolites. Intermediate metabolites might otherwise react with macromolecules controlling cell growth, such as DNA, RNA and proteins. GST was determined in liver samples of caged cod and the following results were obtained:
• The GST activity significantly increased at the 1000m-D and Ref-1 stations (Figure 4, and RF-Akvamiljø analyses report).
• GST activity at the two reference stations Ref-1 and Ref-2 were significantly different.
0
200
400
600
800
1000
1200
1400
Pre-expo Ref-1 Ref-2 1000m-D 500m-D
GS
T a
ctiv
ity
(nm
ol/m
in *
mg
pro
t)
* *
* *
Figure 4. Hepatic GST activity measured in cod. Data is given as mean and SD of 18-24 individuals in each group. Significant differences are indicated with asterisk (Kruskal-Wallis non-parametric test, p<0.05). Graph is taken from Figure 14, RF-Akvamiljø analyses report.

RF – Rogaland Research. http://www.rf.no
- 12 -
4.1.5 DNA adducts
The detoxification of genotoxicants by the inducible cytochrome P450 mixed function oxygenase systems often results in the production of reactive chemical intermediates that are highly electrophilic and can covalently bind to the bases of DNA forming adducts. Thus, the presence of DNA adducts has been taken as evidence of exposure to specific genotoxicants. DNA adducts were determined in liver samples of caged cod and the following results were obtained:
• Pre-exposure cod seem to be weakly exposed to genotoxicants either through water or diet (Figure 5, and University of Stockholm analysis report).
• Overall, low DNA adduct values were found (close to natural baseline values for cod in the North Atlantic).
• Cod from the reference station Ref-1 show the highest mean value. This is a similar tendency, although much less pronounced, as experienced in the BECPELAG workshop, that platform close stations were low in DNA adduct levels.
1,641,341,13
1,54 1,79
0
1
2
3
4
5
6
7
8
9
10
11
12
Pre-expoRef-1
Ref-2
1000m-D500m-D
DN
A a
ddu
cts
(nm
ol/m
ol n
orm
al n
ucle
otid
es)
Figure 5. DNA adducts in liver of cod. Individual data are represented in each group. Average value is shown after each site.
RF – Rogaland Research. http://www.rf.no
- 13 -
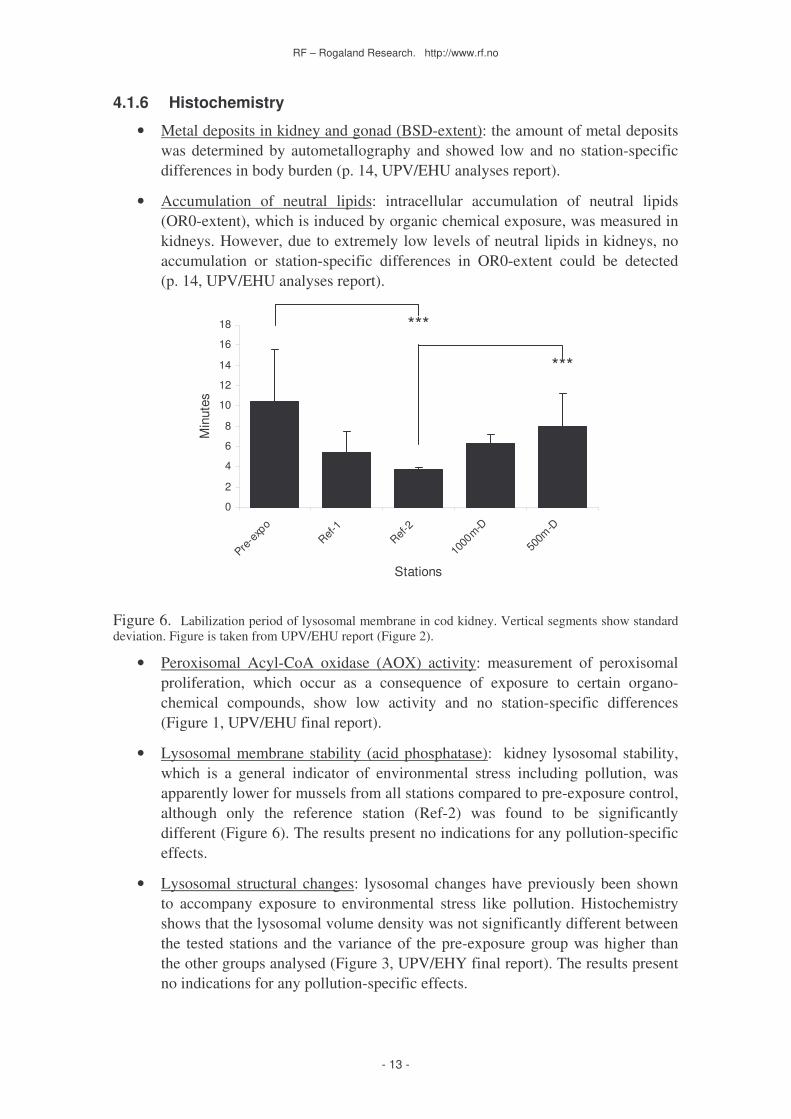
4.1.6 Histochemistry
• Metal deposits in kidney and gonad (BSD-extent): the amount of metal deposits was determined by autometallography and showed low and no station-specific differences in body burden (p. 14, UPV/EHU analyses report).
• Accumulation of neutral lipids: intracellular accumulation of neutral lipids (OR0-extent), which is induced by organic chemical exposure, was measured in kidneys. However, due to extremely low levels of neutral lipids in kidneys, no accumulation or station-specific differences in OR0-extent could be detected (p. 14, UPV/EHU analyses report).
Figure 6. Labilization period of lysosomal membrane in cod kidney. Vertical segments show standard deviation. Figure is taken from UPV/EHU report (Figure 2).
• Peroxisomal Acyl-CoA oxidase (AOX) activity: measurement of peroxisomal proliferation, which occur as a consequence of exposure to certain organo-chemical compounds, show low activity and no station-specific differences (Figure 1, UPV/EHU final report).
• Lysosomal membrane stability (acid phosphatase): kidney lysosomal stability, which is a general indicator of environmental stress including pollution, was apparently lower for mussels from all stations compared to pre-exposure control, although only the reference station (Ref-2) was found to be significantly different (Figure 6). The results present no indications for any pollution-specific effects.
• Lysosomal structural changes: lysosomal changes have previously been shown to accompany exposure to environmental stress like pollution. Histochemistry shows that the lysosomal volume density was not significantly different between the tested stations and the variance of the pre-exposure group was higher than the other groups analysed (Figure 3, UPV/EHY final report). The results present no indications for any pollution-specific effects.
0
2
4
6
8
10
12
14
16
18
Pre-e
xpo
Ref-1
Ref-2
1000
m-D
500m
-D
Stations
Min
utes
***
***
RF – Rogaland Research. http://www.rf.no
- 14 -
4.1.7 Histopathology
• All cod were in early maturation. Ovaries were pre-vitellogenic containing perinuclear and cortical alveoli stages. Testes consisted mostly of spermatogonia and spermatocytes, with a few also displaying the presence of spermatids.
• Thirty-six to 48 % of cod from all sites displayed inflammatory lesions typical of visceral granulomatosis (Figure 19, CEFAS analyses report).
• Although these inflammatory lesions were observed, no pathogens were identified. One should mention that the temperature at the fish farm was generally high during July and August (prior to cage study) and vibriosis was detected and treated with oxolin acid on the fish group > 2 kg. For the small fish that was used in caging experiments, no vibriosis was detected by the veterinary.
• Intersex was observed in one fish. Here, the organ appeared as an ovary with regions of testicular material.
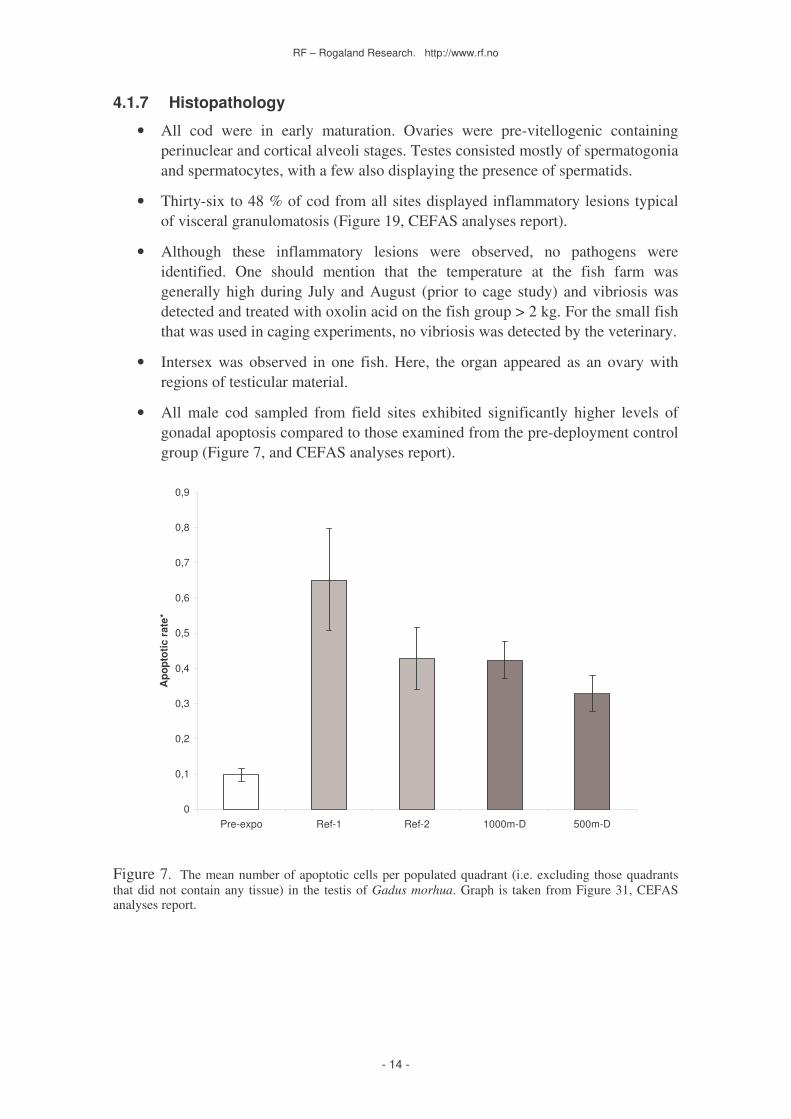
• All male cod sampled from field sites exhibited significantly higher levels of gonadal apoptosis compared to those examined from the pre-deployment control group (Figure 7, and CEFAS analyses report).
0
0,1
0,2
0,3
0,4
0,5
0,6
0,7
0,8
0,9
Pre-expo Ref-1 Ref-2 1000m-D 500m-D
Apo
ptot
ic r
ate*
Figure 7. The mean number of apoptotic cells per populated quadrant (i.e. excluding those quadrants that did not contain any tissue) in the testis of Gadus morhua. Graph is taken from Figure 31, CEFAS analyses report.
RF – Rogaland Research. http://www.rf.no
- 15 -
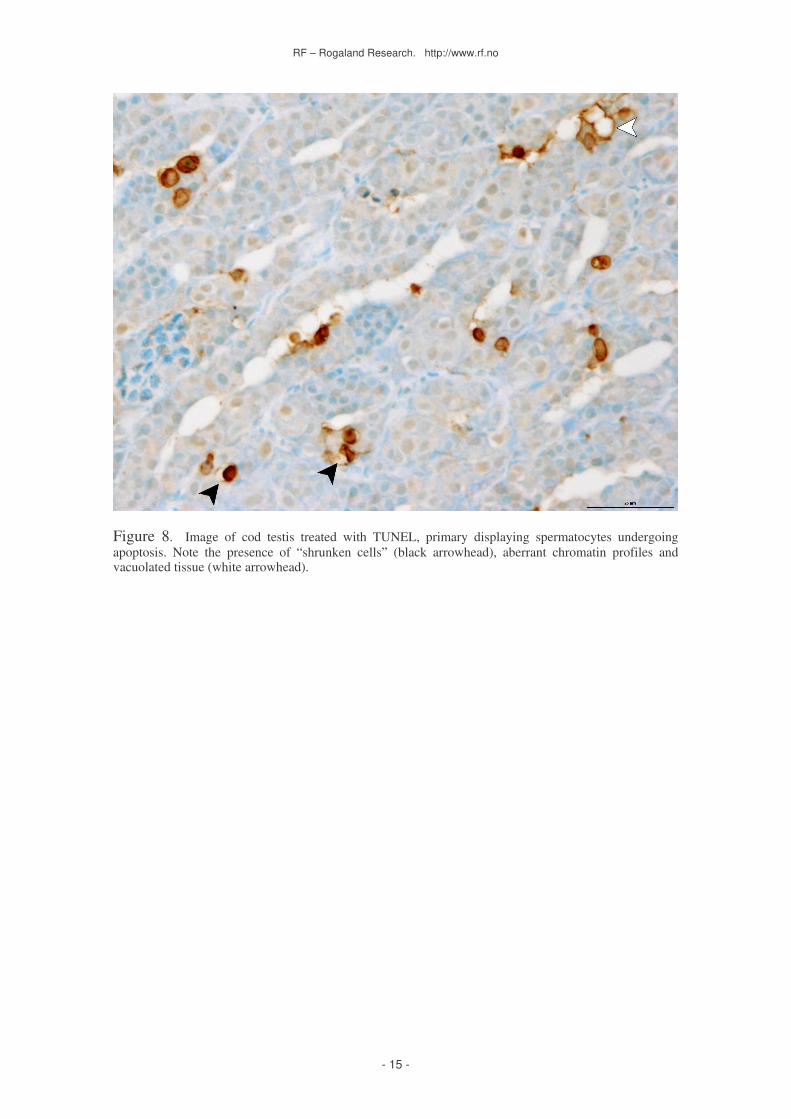
Figure 8. Image of cod testis treated with TUNEL, primary displaying spermatocytes undergoing apoptosis. Note the presence of “shrunken cells” (black arrowhead), aberrant chromatin profiles and vacuolated tissue (white arrowhead).
RF – Rogaland Research. http://www.rf.no
- 16 -
4.2 Mussels
4.2.1 Body burden of NPD, 16 EPA PAHs and decalins
Napththalenes, phenanthrenes, dibenzothiophenes, decalins, their alkylated homologues and 16 EPA PAHs were determined in blue mussel whole tissue (Table 1, and NIVA analyses report). The blue mussels at reference station Ref-2 were unfortunately not sampled due to the time constraints during the field cruise. The results from the analyses show that most of the chemicals were detected in one or more of the groups. Only a few of the chemicals tested were found over the detection limit at all stations. Some general findings may however, be outlined:
• The body burden of most chemicals detected in mussels correlated well to the distance from the assumed discharge point, with the highest levels found closest to the production platform and the lowest concentrations found farthest away.
• Increased body burdens were found both downstream (station 500m-D and 1000m-D) and upstream (station 1000m-U and 2000m-U) compared to the reference station, but only one chemical (C1-dibenzothiophen) were found to be higher at the 5000m-D than the reference station.
• The body burden of many chemicals was significantly higher at the reference station (Ref-1) than in the pre-exposure group and the 5000m-D station, thus indicating an accumulation of organic chemicals in mussels caged at the reference station during deployment.
• The body burden of the organic chemicals seems to be dominated by the alkylated homologues of naphthalene, phenanthrene, dibenzothiophene and decalin.
• Fat content in the mussels were found to range between 1.7 and 2.1% and no significant differences between sampling groups were found (Table 3, NIVA analyses report).
RF – Rogaland Research. http://www.rf.no
- 17 -
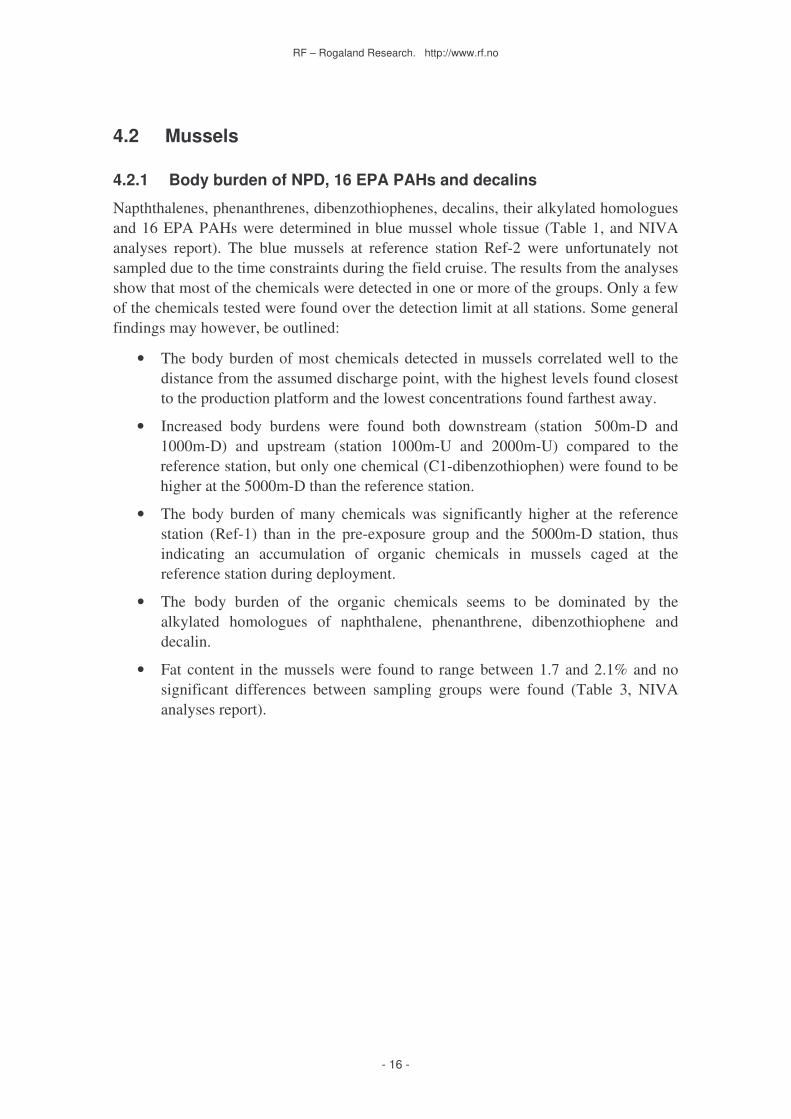
Table 3. Body burden (ng/g wet weight) of decalins, naphthalene, phenanthrene, dibenzothiophene, their alkylated homologues and 16 EPA PAHs in blue mussels sampled during WCS2003 . Results are depicted as median, minimum and maximum value. Table is taken from NIVA analyses report, Table 2.
Pre-expo Ref-1 5000m-D 1000m-D 500m-D 1000m-U 2000m-U Compound Median Min Max Median Min Max Median Min Max Median Min Max Median Min Max Median Min Max Median Min Max
Trans-decalin <10 <10 <10 <10 <10 <10 <10 <10 <10 <10 <10 <10 <10 <10 <10 <10 <10 <10 <10 <10 <10 Cis-decalin <50 <50 <50 <160 <120 <180 <20 <15 <80 <30 <25 <50 <60 <50 <150 <50 <30 <95 <40 <10 <70 C1-decalines 15 11 27 37 33 42 31 24 33 85 55 90 93 87 107 61 57 98 38 29 49 C3-decalines <10 <10 <10 28 25 31 35 31 38 174 129 174 166 153 198 96 89 138 54 54 63 C5-decalines <10 <10 <10 <20 <20 <20 <10 <10 <10 <40 <30 <40 <60 <60 <100 <30 <25 <40 <20 <15 <30 Naphthalene <1,0 <1,0 3,6 <1,0 <1,0 <1,0 <1,0 <1,0 <1,0 <1,0 <1,0 <1,0 1,4 <1,0 1,4 <1,0 <1,0 1,2 1,1 <1,0 1,5 C1-Naphthalenes <1,0 <0,5 <1,0 2,3 2,2 2,6 1,0 0,8 1,1 2,4 2,3 2,4 5,2 4,9 5,6 3,1 2,7 3,4 2,8 2,4 3,5 C2-Naphthalenes 1,4 1,3 1,8 6,3 5,9 6,5 3,8 3,4 4,1 9,7 9,6 9,9 18 17 19 13 12 13 9,6 9,1 11 C3-Naphthalenes 4,6 3,7 5,7 22 22 30 19 17 19 69 60 87 118 112 122 73 72 79 46 42 50 Acenaphthylene <0,5 <0,5 0,5 <0,5 <0,5 0,6 <0,5 <0,5 <0,5 1,4 1,3 1,4 1,8 1,5 1,9 1,0 0,7 1,0 0,7 0,5 0,7 Acenaphthen <0,5 <0,5 <0,5 <0,5 <0,5 0,5 <0,5 <0,5 <0,5 <0,5 <0,5 <0,5 <0,5 <0,5 <0,5 <0,5 <0,5 <0,5 <0,5 <0,5 <0,5 Fluorene <0,5 <0,5 0,6 0,8 <0,5 3,2 2,0 1,3 2,3 0,8 0,8 1,0 1,7 1,6 2,1 2,0 1,0 2,1 0,7 0,7 0,8 Anthracene <0,5 <0,5 <0,5 <0,5 <0,5 <0,5 <0,5 <0,5 <0,5 <0,5 <0,5 <0,5 <0,5 <0,5 <0,5 <0,5 <0,5 <0,5 <0,5 <0,5 <0,5 Phenanthrene <0,5 <0,5 <0,5 1,2 1,1 1,2 1,0 0,9 1,1 1,6 1,6 1,7 2,6 2,5 2,6 2,0 1,8 2,0 1,5 1,5 1,6 C2-Phenanthrenes 2,2 2,4 2,7 19 18 21 19 16 20 65 61 69 82 81 84 58 54 63 37 35 40 C3-Phenanthrenes 2,0 1,8 2,0 16 16 21 18 14 18 64 58 65 80 80 80 50 49 57 32 31 37 Dibenzothiophene <0,5 <0,5 <0,5 <0,5 <0,5 <0,5 <0,5 <0,5 <0,5 <0,5 <0,5 <0,5 0,6 0,5 0,6 <0,5 <0,5 <0,5 0,5 0,5 0,5 C1-Dibenzothiophenes <1,0 <1,0 <1,0 1,6 1,6 1,8 2,5 2,1 2,8 11 10 11 10 8,1 12 7,9 6,2 8,5 5,9 5,0 6,1 C2-Dibenzothiophenes <1,0 <1,0 1,0 6,0 5,9 7,1 7,2 5,7 7,2 23 22 24 26 26 27 21 17 25 12 12 13 C3-Dibenzothiophenes 5,9 1,0 14 14 8,8 14 11 8,5 11 37 33 38 51 44 52 27 26 29 18 18 21 Fluoranthene 0,9 0,7 0,9 1,3 1,0 1,3 1,2 1,1 1,3 1,6 1,6 1,7 2,1 1,9 2,1 1,4 1,4 1,6 1,2 1,0 1,2 Pyrene <0,5 <0,5 <0,5 <0,5 <0,5 <0,5 0,6 0,6 0,6 1,4 1,3 1,4 1,6 1,6 1,7 1,1 1,0 1,2 0,7 0,6 0,6 Benzo(a)anthracene <0,5 <0,5 <0,5 <0,5 <0,5 <0,5 <0,5 <0,5 <0,5 <0,5 <0,5 <0,5 0,6 <0,5 <0,5 <0,5 <0,5 <0,5 <0,5 <0,6 <0,5 Chrysene <0,5 <0,5 <0,5 <0,5 <0,5 0,6 <0,5 <0,5 <0,5 0,8 0,7 1,0 1,4 1,2 1,4 0,8 0,5 1,1 0,6 0,6 0,7 Benzo(b)fluoranthene <0,5 <0,5 <0,5 <0,5 <0,5 0,6 <0,5 <0,5 <0,5 0,7 0,5 0,7 0,9 0,8 0,9 0,6 0,6 0,6 0,5 <0,5 0,6 Benzo(j,k)fluoranthene <0,5 <0,5 <0,5 <0,5 <0,5 <0,5 <0,5 <0,5 <0,5 <0,5 <0,5 <0,5 <0,5 <0,5 <0,5 <0,5 <0,5 <0,5 <0,5 <0,5 <0,5 Benzo(a)pyrene <0,5 <0,5 <0,5 <0,5 <0,5 <0,5 <0,5 <0,5 <0,5 <0,5 <0,5 <0,5 <0,5 <0,5 <0,5 <0,5 <0,5 <0,5 <0,5 <0,5 <0,5 Indeno(1,2,3-cd)pyrene <0,5 <0,5 <0,5 <0,5 <0,5 <0,5 <0,5 <0,5 <0,5 <0,5 <0,5 <0,5 <0,5 <0,5 <0,5 <0,5 <0,5 <0,5 <0,5 <0,5 <0,5 Dibenz(a,h)anthracene <0,5 <0,5 <0,5 <0,5 <0,5 <0,5 <0,5 <0,5 <0,5 <0,5 <0,5 <0,5 <0,5 <0,5 <0,5 <0,5 <0,5 <0,5 <0,5 <0,5 <0,5 Benzo(g,h,i)perylene <0,5 <0,5 <0,5 <0,5 <0,5 <0,5 <0,5 <0,5 <0,5 <0,5 <0,5 <0,5 <0,5 <0,5 <0,5 <0,5 <0,5 <0,5 <0,5 <0,5 <0,5
RF – Rogaland Research. http://www.rf.no
- 18 -
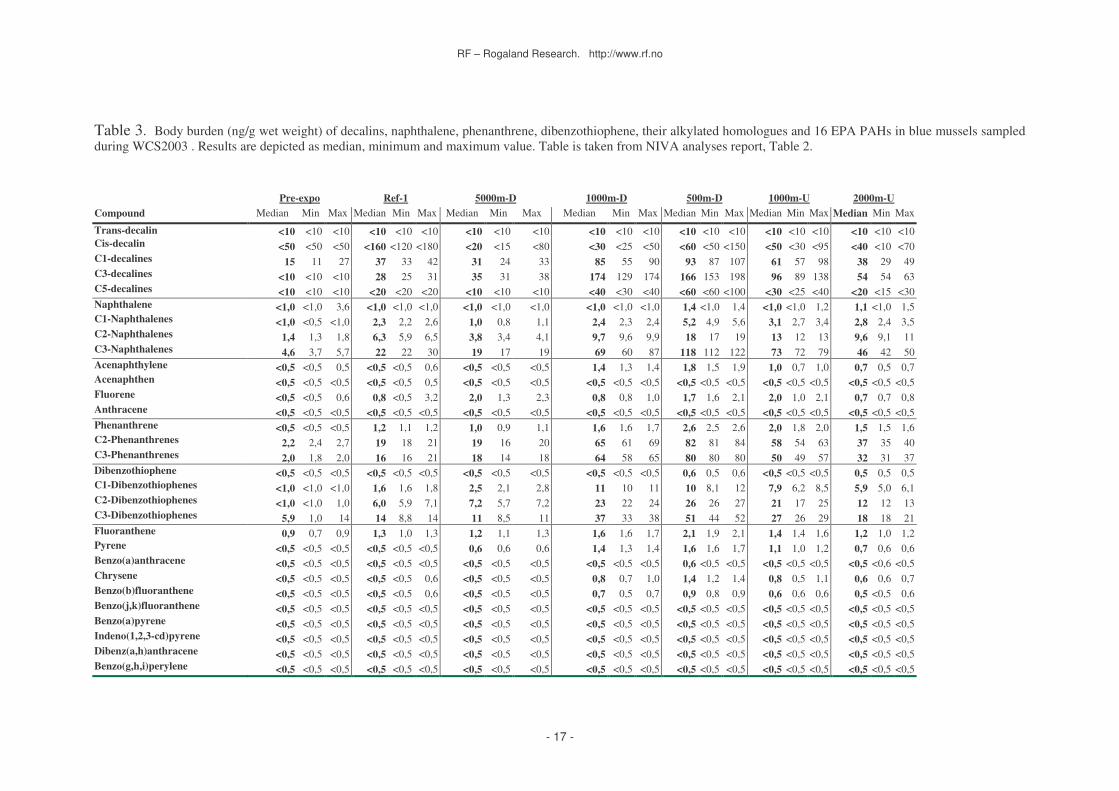
4.2.2 BaPH activity
Benzo(a)pyrene hydroxylase (BaPH) activity, which is commonly used biomarker for the exposure to and the potential for adverse biological effects of certain types of PAHs, was measured in hepatopancreas of blue mussels from the pre-exposure group and four field stations (Figure 1). Results can be summarised as follows:
• No increase in BaPH activity was observed for the two purported exposed groups (500m-D and 1000m-D) contra either the pre-exposure group or the two reference stations.
• The 1000m-D stations were found to exhibit significantly lower BaPH activity than the reference station Ref-1, and the variance in BaPH was considerable higher in the 500m-D station compared to the other stations.
Figure 9. Benzo[a]pyrene hydroxylase (BaPH) activity in hepatopancreas of caged blue mussles (Mytilis edulis) at different sampling stations. Number of samples (brackets), median (line), 25% and 75% quartiles (box) and range (whiskers) is given in figure. Asterisk ** (p<0.001) depict level of significance compared to the control group (Ref-1) when analysed by a Kruskal-Wallis non-parametric test followed by a Dunn’s pairwise post-hoc test. Figure is taken from NIVA analyses report, Figure 2.
Pre-e
xpo
Ref-1
Ref-2
500m
-D
1000
m-D0
20
40
60
80
100
***(25)(25) (25)
(25)
(24)
Station
BaP
H a
ctiv
ity
(pm
ol/m
in/m
g pr
otei
n)
RF – Rogaland Research. http://www.rf.no
- 19 -
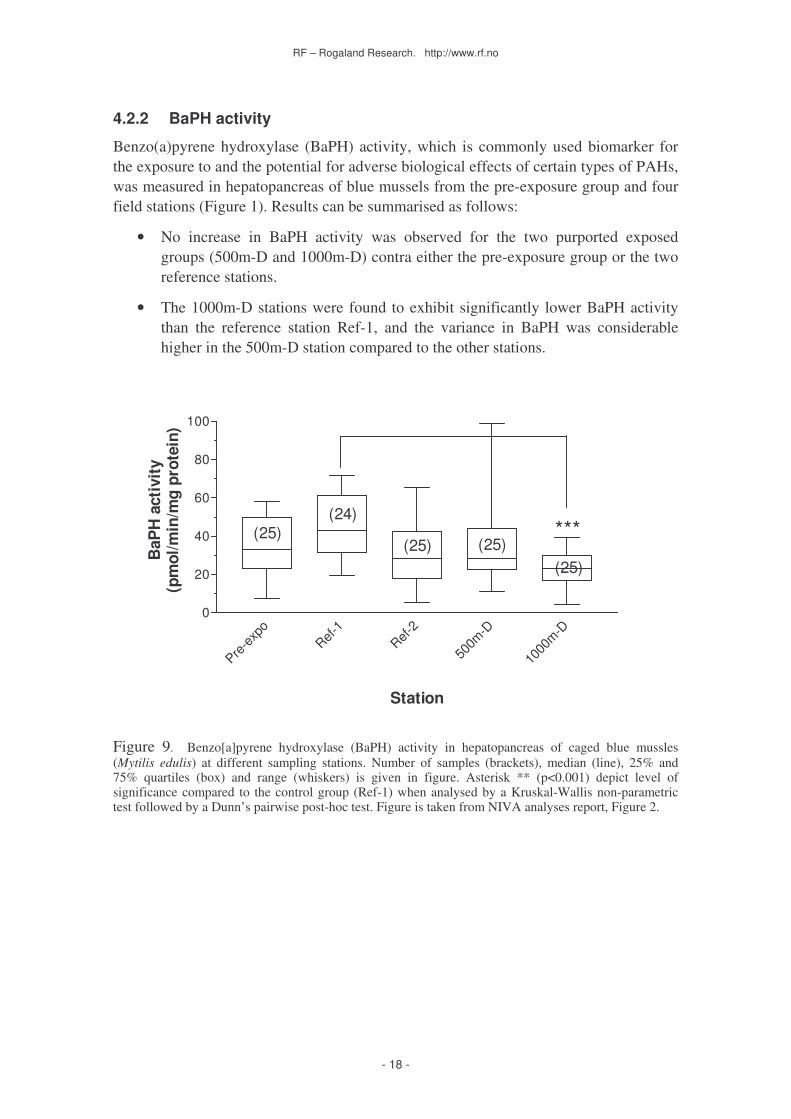
4.2.3 Lysosomal response
Lysosomal response, measured as the retention of the neutral red probe, was measured in haemocytes of the mussels. This biomarker method is characterised as a general health parameter an is earlier shown to respond to PAH and crude oil exposed mussels. The results from this study are summarised as:
• Lysosomal membrane stability was significantly lower at the reference station Ref-1 compared to the pre-exposure group (Figure 1, RF-Akvamiljø analyses report).
• The other groups, pre-exposure and B4 (2000m upstream) showed slightly decreased membrane stability compared to values found at typically uncontaminated sites.
• Few stations were covered because cruise time was much reduced due to weather conditions.
0
50
100
150
200
250
Pre-expo Ref-1 2000m-U
NR
RT
(min
) *
Figure 10. Lysosomal response levels in blue mussels prior to field experiment (pre-exposure) and at two different stations in the vicinity of the Troll B platform; a reference station (Ref-1) 8000m north of the platform and a station 2000m upstream of the produced water discharge. Data are given as mean and SD of 15 individuals in each group. The retention time is significantly lower at the reference station compared to the two other groups (Tukey Kramer, p<0.05).
RF – Rogaland Research. http://www.rf.no
- 20 -
4.2.4 Histochemistry
• Metal deposits in kidney and gonad (BSD-extent): the amount of metal deposits was determined by autometallography, and was low and no station-specific differences in body burden were found (p. 19, UPV/EHU final report).
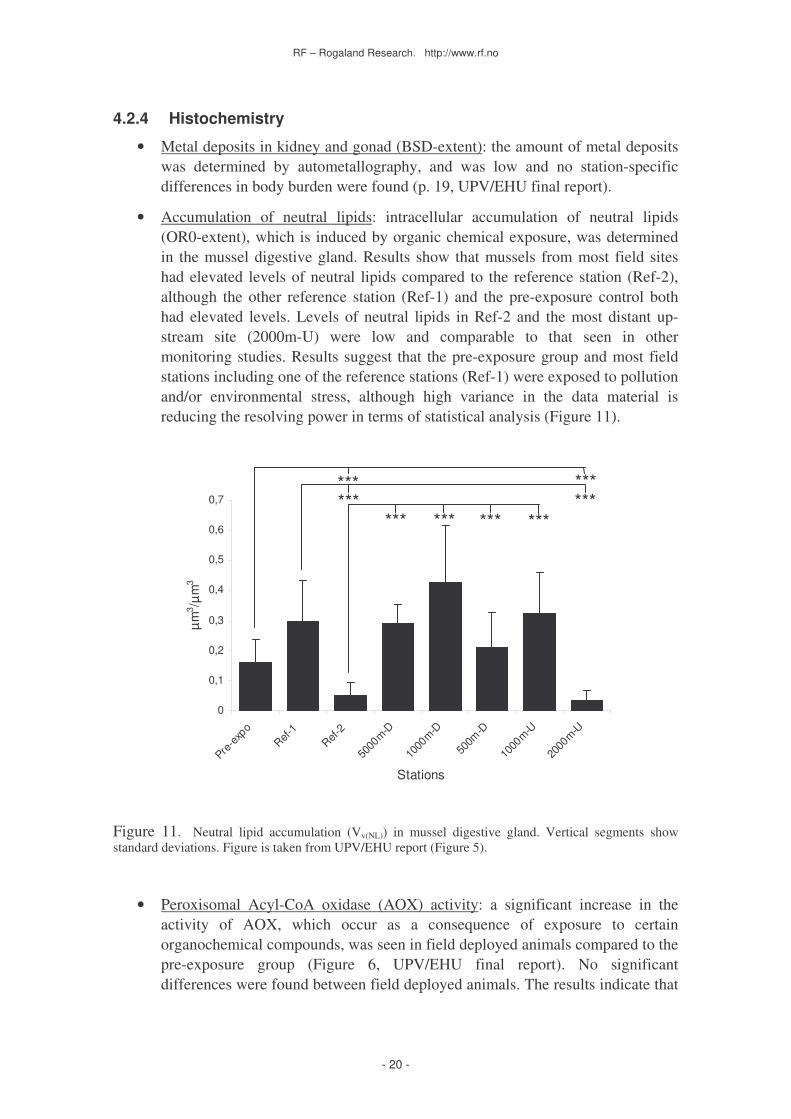
• Accumulation of neutral lipids: intracellular accumulation of neutral lipids (OR0-extent), which is induced by organic chemical exposure, was determined in the mussel digestive gland. Results show that mussels from most field sites had elevated levels of neutral lipids compared to the reference station (Ref-2), although the other reference station (Ref-1) and the pre-exposure control both had elevated levels. Levels of neutral lipids in Ref-2 and the most distant up-stream site (2000m-U) were low and comparable to that seen in other monitoring studies. Results suggest that the pre-exposure group and most field stations including one of the reference stations (Ref-1) were exposed to pollution and/or environmental stress, although high variance in the data material is reducing the resolving power in terms of statistical analysis (Figure 11).
Figure 11. Neutral lipid accumulation (Vv(NL)) in mussel digestive gland. Vertical segments show standard deviations. Figure is taken from UPV/EHU report (Figure 5).
• Peroxisomal Acyl-CoA oxidase (AOX) activity: a significant increase in the activity of AOX, which occur as a consequence of exposure to certain organochemical compounds, was seen in field deployed animals compared to the pre-exposure group (Figure 6, UPV/EHU final report). No significant differences were found between field deployed animals. The results indicate that
0
0,1
0,2
0,3
0,4
0,5
0,6
0,7
Pre-e
xpo
Ref-1
Ref-2
5000
m-D
1000
m-D
500m
-D
1000
m-U
2000
m-U
Stations
µm3 /µ
m3
*** *** *** ***
*** *** *** ***
RF – Rogaland Research. http://www.rf.no
- 21 -
peroxisomal proliferation is induced during the deployment period, but responses do not seem to follow an assumed pollution exposure.
• Lysosomal membrane stability (N-acetyl hexosaminidase): lysosomal stability, which is a general indicator of environmental stress including pollution, was found to be low and high degree of variation was detected at most stations. Lysosomes from the up-stream stations (1000m-U and 2000m-U) and the 1000m-D station showed significantly lower stability, suggesting that the condition of the mussels is affected by some type of stress during the deployment period (Figure 6, UPV/EHU analyses report).
• Lysosomal structural changes: lysosomal changes have previously been shown to accompany exposure to environmental stress such as pollution. Histochemistry shows that the lysosomal volume density was not significantly different between stations (Figure 8, UPV/EHU analyses report). Some of the stations (Ref-2, 2000m-U and 1000m-D) had an apparent decrease in lysosomal volume that are similar to effects seen following exposure to organic chemicals or environmental stress, although this effect was not reflected in the surface to volume ratio. The results suggest that some type of stress is affecting the mussels, but responses do not seem to follow an assumed pollution exposure.
• Cell-type replacement: the volume (and relative proportion) of basophilic cells was not found to differ significantly between the different groups, although significantly higher levels in the pre-exposure group indicate a responses to stress prior to deployment (Figure 9, UPV/EHU analyses report).
• Quantitative structure of digestive tubules: no significant differences were seen in the epithelial characteristics of the digestive tubules, thus indicating that the mussels were in good conditions (Figure 10, UPV/EHU analyses report).
RF – Rogaland Research. http://www.rf.no
- 22 -
4.2.5 Histopathology
• Gonad index, sex ratios and presence of reserve tissue: determination of high gonad index, normal gonadal development and presence of well developed reserve tissue in mussels indicate that the mussels were in good conditions (Figure 4 and Table 1, UPV/EHU analyses report).
• The mean adipogranular cell rate (ADG) was generally high (mean 3.25) also indicating that all mussels were generally in good condition (Figure 4, CEFAS analyses report).
• The prevalence of melanised lysosomes within the tubules of the digestive gland was significantly higher in mussels from the exposed sites (100% prevalence) compared to those from the control (Figure 6, CEFAS analyses report).
• Relatively higher levels of degeneration and inflammation were observed in mussels from the exposed sites. Those sites closest to the Troll B platform appeared to exhibit the highest levels of this pathology.
• Although pathogens were observed in low levels, it is not thought that these were associated with any of the pathologies observed during this study.
RF – Rogaland Research. http://www.rf.no
- 23 -
5 Discussion
The present experimental design was chosen to combine a spatial distribution along a gradient with that of a pre-exposure control. Although this design seemed appropriate at the time, the present data suggest that temporal difference in sampling times between the pre-exposure group and the field trial gave rise to artefacts in several of the analysis performed. This applies in particular to the observation that pre-exposure levels of plasma vitellogenin, cod lysosomal stability and structure, mussel cell type replacement, and EROD activity showed signs of either being pre-exposed or subjected to environmental stress. Although the pre-exposure groups were probably affected by pre-exposure to undefined stressors, low body burden of organic chemicals (Table 3) suggest that these stressors are due to differences in environmental condition rather than chemical contamination in the mussels.
As expected, total body burden of organic chemicals in mussels were found to correspond well to the distance to the discharge source. Increased levels compared to reference stations and the pre-exposure group was found both up stream and down stream for the alkylated NPDs and decalins, although non-alkylated PAHs and decalins did not show a clear gradient. In fact, total body burden of the non-alkylated NPDs were considerable lower than what has been found in similar monitoring studies in the Statfjord area during the BECPELAG workshop (Ruus et al. In press), thus suggesting that the general exposure levels were lower at the Troll field compared to other production fields like Statfjord. Low exposure to high molecular PAHs which normally contribute to the toxic effects of oil related compounds, may explain why typical biomarkers like EROD and DNA-adducts did not show a clear pattern of effect. This seems also to be the case for BaPH activity in blue mussels which were not induced at any field site compared to either the two reference sites or the pre-exposure control. Interestingly, BaPH activity was significantly reduced at the 1000m-D site compared to Ref-1, an effect proposed elsewhere to be caused by selective enzyme inhibition by low molecular PAHs like fluoranthene (Willett et al. 2001).
Although the suite of biomarker endpoints was carefully chosen to target key analytes such as toxic PAHs and alkylphenols, the level of exposure was low and probably not sufficient to elicit many biological responses due to low level of exposure. Knowing that the chemical composition in produced water and consequently the type of exposure is highly variable between different production fields (Røe 1998), suggests including a set of core methods that encompass the most probable effects, but also necessitating inclusion of accessory endpoints of effects which may be more field-specific or be more sensitive than the present selection. Since the current knowledge about effects of oil related discharges to the water column is rather limited, water column surveys using a similar caging approach need to be carried out on a regular basis and at different production fields in order to encompass field to field variation and allow for historic monitoring comparisons. Also, a science-driven adjustment and trial of accessory endpoints need to be adopted in the water column surveys in order to improve the experimental design and choice of most appropriate endpoints. This can be facilitated
RF – Rogaland Research. http://www.rf.no
- 24 -
through inclusion of promising effect methods and updated knowledge about the toxicology of produced water generated from several ongoing projects in the NFR-Proof research programme.
There are several indications (see mussel BaPH, cod and mussel histopathology) that organisms at the reference station (Ref-1) have experienced some degree of exposure to contaminants, although they are only located approximately 900m West of Ref-2. One can only speculate what could be the reason for this difference. The cod might have experienced different exposure regimes due to local phenomenon with regard to sea currents. This could cause peak exposure of produced water discharge in only one of two relative closely located stations. The difference could also be explained by discharges from other platforms in the area North-West of Troll B and that only reach the closest station due to different current systems in the reference area. A trial was made to run DREAM simulations on spreading of PW into the reference area and this confirms that there might be entry of discharges from several platforms into the area.
There are two important aspects of the present water column monitoring based biomarker methods. One aspect is to gain experience and learn, and the other is to obtain information about the degree of exposure and effects of produced water discharges in the specific field. Available information about the size of discharge at Troll field (Emissions and Discharges form the Norwegian Petroleum Industry 2003, reports from the operators, figure 12 & 13) show that Troll B and C discharge less than i.e. the Statfjord and Gullfaks field.
2003 Discharges from selected fields in the North Sea
0
50
100
150
200
250
300
350
STAFJORD
GULLFAKS
TROLL B og
C
SNORRE A A
ND B
OSEBERG
EKOFISK
ÅSGARD FELT
ET
VALHALL
ELDFIS
K
SLEIP
NER ØST
Ton
n/ye
ar
BTEXPAHFenol
Figure 12. Discharge of BTEX, PAH and Fenol in PW from selected fields in the North Sea, reports
from the operators.
The discharges of BTEX and PAH from Troll B and C was small compared with Statfjord and Gullfaks but comparable to Snorre and Oseberg.
RF – Rogaland Research. http://www.rf.no
- 25 -
2003 Discharges from selected fields in the North Sea
0
20
40
60
80
100
120
STAFJORD
GULLFAKS
TROLL B og
C
SNORRE A A
ND B
OSEBERG
EKOFISK
ÅSGARD FELT
ET
VALHALL
ELDFIS
K
SLEIP
NER ØST
Tonn
/yea
r
AP C1-C3AP C4-C5AP C6 +
Figure 12. Discharge of alkylphenols in PW from selected fields in the North Sea, reports from the
operators.
If we look at the discharges of alkylphenols Troll B and C were less than several of the other fields that we have compared with.
The Troll fields is not the largest contributer of PW in the North Sea, but nevertheless, the results from the core biomarkers in this study demonstrate that biomarkers are operative for monitoring an exposure situation with limited discharges and low potential for toxic effects.
6 Conclusion
The results of this campaign show that exposure to contaminants in produced water was probably low (assessed through accumulation of non-alkylated PAHs in blue mussels), as compared to observations from the BECPELAG workshop. This was even the case at sites closest to the platform and downstream. Exposure within the purported plume affected tissue integrity in caged blue mussels, but did not cause obvious changes in contaminant-related biomarkers measured in mussels from the same cages. Cod caged in the plume was clearly exposed to naphthalenes, seen from the concentration of naphthalene metabolites in bile. There was also evidence that fish held at one of the reference locations were exposed to PAHs.
Increased activity of cytochrome P4501A and increased counts of apoptotic cells in gonads were observed in cod caged at all sites compared to pre-exposure control, but there were no obvious differences between sites in the expected plume and reference sites. If anything, there was more apoptosis in cod held at the reference sites. However, too few rigs were deployed to establish the area influenced by the Troll B effluent, which was evident by the differences in biomarker responses seen between the two reference sites.

RF – Rogaland Research. http://www.rf.no
- 26 -
Furthermore, the use of pre-exposure controls sampled directly after close confinement in rearing facilities seems to be inappropriate, since many of the biomarkers indicate high degree of variation in signal at different environmental conditions. A better solution may be to deploy another reference in a more pristine area, possibly in combination with deploying the two field reference cages on each side of the transect to reduce the chance for picking a influenced reference station. The variability of currents and the diffuse exposure pattern seen in the upstream and downstream stations, suggest that a clear gradient in exposure may not have been the case during the experiment and warrant improved exposure assessment in future monitoring survey.
Based on the experiences from the WCS2003, the following proposals are to be evaluated for this year survey:
• The exposure period should be scheduled at least one month earlier and of a duration of 4-6 weeks.
• Extra care must be taken to find non-contaminated fish and mussels for use in the cage experiment.
• There should be a reference station both South and North of the area of interest.
• A larger number of rigs should be deployed to enable an assessment of the area of influence.
• Careful consideration of PW composition and environmental modelling (i.e. DREAM modelling) are required to include appropriate endpoints; data must be made available well prior to tender (or as part of tender).
• PAH metabolites should primarily be analysed by fixed fluorescence and then verified by GC/MS analysis for selected samples.
• Some of the histology parameters should be complemented with other molecular, biochemical and cellular biomarkers that were not included this year.
• Include assessment of DNA and lipid membrane damage to complement DNA-adduct determination and assessment of cell injury (i.e. apoptosis).
• Promote testing and use of new promising biomarker and effect methods through facilitating field trial participation by personnel from ongoing NFR-proof programme projects (assuming that cost will not increase much due to increased participation on surveys).
7 References
Balk, L., B. K. Liewenborga, et al. (In press). "Large hydrophobic adducts and strand breaks analyzed in hepatic DNA from Atlantic cod (Gadus morhua) caged at the Statfjord oil field." Environ. Toxicol. Chem.

RF – Rogaland Research. http://www.rf.no
- 27 -
Bechmann, R. K. (1999). "Effect of the endocrine disrupter nonylphenol on the marine copepod Tisbe battagliai." The Science of the Total Environment.
Bechmann, R. K., I. C. Taban, et al. (in prep). "Effects of PAH componds on the reproduction of Cyprinodon variegatus (sheepshead minnow)."
Brendehaug, J., S. Johnsen, et al. (1992). Toxicity testing and chemical characterization of produced water - A preliminary study. Produced Water. Technological/Environmental Issues and Solutions. F. R. Engelhart. New York, NY, Plenum Press: 245-260.
Collier, T. K., S. V. Singh, et al. (1992). "Hepatic xenobiotic metabolizing enzymes in two species of benthic fish showing different prevalences of contaminant-associated liver neoplasms." Toxicology and Applied Pharmacology 113(2): 319-324.
Elliot, M., K. L. Hemmingway, et al., Eds. (2003). From the individual to the population and community responses to pollution. Effects of pollution on fish. Molecular effects and population responses, Blackwell Publishing.
Landahl, J. T., B. B. McCain, et al. (1990). Consistent associations between hepatic lesions in English sole (Parophrys vetulus) and polycyclic aromatic hydrocarbons in bottom sediment. Environ Health Perspect. 89: 195-203.
Lye, C. M. (2000). Impact of estrogenic substances from oil production at sea. Toxicology Letters. 112: 265-272.
Meier, S., T. E. Andersen, et al. (2002). Hormonal effects of C4-C7 alkylated phenols in cod. Bergen, Norway, Institute for Marine Sciences (IMS): 70.
OLF (2000). Emissions and discharges from the Norwegian Petroleums industry 2000. Stavanger, Norway, The Norwegian Oil Industry Association (OLF).
Peakall, D. (1992). Animal biomarkers as pollution indicators. London, Chapman and Hall: 291.
Regoli, F., S. Frulla, et al. (In press). "Antioxidant parameters and total oxyradical scavenging capacity in mussels from German Bight and Statfjord oil field." Environ. Toxicol. Chem.
Ruus, A., K.-E. Tollefsen, et al. (In press). Accumulation of contaminants in pelagic organisms, caged blue mussels, caged cod and semi-permeable membrane devices (SPMDs). ICES workshop on biological effects of contaminants in the pelagic ecosystem (ICES). SETAC special publications.
Røe, T. I. (1998). Produced water discharges to the North Sea: a study of bioavailable organic produced water compounds to marine organisms. Faculty for Chemistry and Biology. Trondheim, Norwegian University of Science and Technology.
Røe, T. I. and S. Johnsen (1996). Discharges of produced water to the North Sea; Effects in the water column. Produced water 2. Environmental Issues and Mitigation Technologies. S. Johnsen. New York, Plenum Press: 13-25.
SFT (2003). Guidelines water column monitoirng. Oslo, Norway, Norwegian Pollution Control Authority (SFT): 23.
SFT (2004). Nullutslippsrapporten (National report on Zero effect emissions from the Norwegian offshore oil production industry). Oslo, SFT.
Taban, I. C. and J. F. Børseth (2000). Biomarker responses in transplanted mussels (Mytilus edulis L.) in the Ekofisk region. Stavanger, RF-Akvamiljø: p. 34.
Thomas, K., M. R. Hurst, et al. (In press). In vitro bioassay testing of produced and surface water extracts. ICES workshop on biological effects of contaminants in the pelagic ecosystem (ICES). SETAC special publications.
Tollefsen, K.-E., A. Goksøyr, et al. (In press). The use of a fish in vitro bioassay for monitoring of pollutants in the North Sea. ICES workshop on biological effects of contaminants in the pelagic ecosystem (ICES). SETAC special publications.
RF – Rogaland Research. http://www.rf.no
- 28 -
Tollefsen, K.-E., K. Ingebrigtsen, et al. (1998). Acute toxicity and toxicokinetics of 4-heptylphenol in juvenile Atlantic cod (Gadus morhua L.). Environmental Toxicology and Chemistry. 17: 740-746.
Utvik, T. I. R. (1999). Chemical charaterisation of produced water from four offshore oil production platforms in the North Sea. Chemosphere. 39: 2593-2606.
Willett, K. L., L. A. Lienesch, et al. (2001). No detectable DNA excision repair in UV-exposed hepatocytes from two catfish species. Comp Biochem Physiol C Toxicol Pharmacol. 128: 349-58.
Aas, E., T. Baussant, et al. (2000). "PAH metabolites in bile, cytochrome P4501A and DNA adducts as environmental risk parameters for chronic oil exposure: a laboratory experiment with Atlantic cod." Aquatic Toxicology 51(2): 241-258.
Aas, E., G. Jonsson, et al. (In press). "PAH metabolites and metals in bile from caged Atlantic cod (Gadus morhua) and feral fish in the North Sea used in environmental monitoring." Environmental Toxicology & Chemistry.
Appendix
Analyses report RF-Akvamiljø
Analyses report NIVA
Analyses report CEFAS
Analyses report University of the Basque Country
Analyses report University of Stockholm
Cruise report RF-Akvamiljø/ NIVA