water cooling towers - iso-iran.ir 4485 part 2-1988.pdf · bs 4485 : part 2 1988 foreword this part...
TRANSCRIPT

SITIRBDRADNATS H
SCI
���������������� ������������������������������� �������������
BS 4485: Part 2: 1988 UDC 66.045.5.001 .4
© British Standards Institution. No part of this publication may be photocopied or otherwise reproduced without the prior permission in writing of BSI
8 ritish Standard
Water cooling towers
Part 2. Methods for performance testing
Tours de refroidissement par l'eau Partie 2. Methodes d'essai de fonctionnement
Wasserkuh lturme Tei l 2. Funktionsprufung
British Standards

BS 4485 : Part 2 1988
Foreword
This Part of BS 4485, which has been prepared under the direction of the Civil Engineering and Building Structures Standards Committee, deals with the performance testing of industrial mechanical draught and natural draught water cooling towers. This Part of BS 4485 is a revision of BS 4485 : Part 2 : 1969 which is withdrawn.
The principal difference between this Part of BS 4485 and the 1969 edition is the introduction of the option of using a computer to do the calculation of thermal performance capability rather than carrying it out manually.
The performance of a cooling tower is dependent upon a number of factors, such as conditions of the atmosphere, conditions of the cooling water flow, conditions of equipment and conditions of the site, and the object of this Part of BS 4485 is to describe methods for the accurate determination of thermal performance. In addition, methods are described for the functional testing of equipment necessary for the satisfactory operation of a cooling tower.
This Part of BS 4485 also includes a description for the performance test procedure, the computation and evaluation of results, and the appendices provide worked examples for establishing the L/G ratio for natural draught cooling towers, and also the cooling tower characteristic KaV/L.
The other Parts of BS 4485 are as follows.
Part 1 Glossary of terms Part 3 Code of practice for thermal and functional design Part 4 Code of practice for the structural design of
cooling towers
Where necessary, definitions have been included in the revisions of BS 4485 : Parts 2, 3 and 4 so that when they have all been published BS 4485 : Part 1 can be withdrawn.
Compliance with a British Standard does not of itself confer immunity from legal obligations.

BS 4485 : Part 2 : 1988
Contents
Page Page
Foreword Inside front cover 8.5 Computation of tower pumping head 9 Committees responsible Back cover 8.6 Computation of thermal lag 9
8.7 Computation of fan power 9 Methods 9 Evaluation of thermal performance 9 1 Scope 2
2 Definitions 2 Appendices
3 Symbols and units 2 A Matters to be agreed between purchaser and
4 Conditions of validity of tests 2 supplier 10
4.1 General 2 8 Guidance on precipitation rates and
4.2 Conditions of site 2 determination of droplet size for the evaluation
4.3 Conditions of equipment 2 of drift nuisance 11
4.4 Conditions of atmosphere 4 c Methods for evaluating test results 13
4.5 Conditions of inlet water 4 D Computer program for calculating performance
4.6 Variation from design conditions 4 capability 17
-- E Determination of test value of L/G for natural 5 Instruments and methods of measurement 4 draught towers 27 5.1 Measurement of wind velocity 4 F Example of determination of cooling tower 5.2 Measurement of air temperature 4 capability from calculation of KaV/L value 32 5.3 Measurement of water temperature 5 5.4 Measurement of water flow 5 5.5 Water analysis 6 Tables 5.6 Measurement of tower pumping head 6 1 Symbols and units 3 5.7 Measurement of power input to the fan driver 6 2 Frequency of readings 8 5.8 Measurement of drift loss 6 3 Precipitation rates for droplet diameters 100 1-1m 5.9 Measurement of tower noise 6 to 2000 1-1m 12 6 Test checks and readings 6 4 Guide to nuisance effects for precipitation rates 6.1 Functional test 6 of 0.05 mm/h to 0.0005 mm/h 13 6.2 Performance test 7 5 Enthalpy of saturated air 15
7 Performance test procedure 7 7.1 Preparation for test 7 Figures
7.2 Preliminary tests 7 1 Determination of droplet diameter 12
7.3 Test procedure 8 2 Graph for determination of density difference at
8 Computation of results 8 design conditions 29
8.1 Reduction of test readings 8 3 Determination of relation between Gd and
8.2 Computation of inlet water temperature 8 Gt for natural draught cooling towers 31
8.3 Computation of recooled water temperature 4 Determination of cooling tower capability 33
with make-up and purge flows shut off 8 8.4 Computation of recooled water temperature
with make-up and purge flows operating 9

BS 4485 : Part 2 1988
Methods
1 Scope
This Part of BS 4485 describes methods for the determination of the performance of industrial mechanical draught and natural draught water cooling towers.
This Part of BS 4485 can also be applied to other forms of cooling towers. NOTE 1. The matters to be agreed between purchaser and supplier are listed in appendix A.
NOTE 2. The titles of the publications referred to in this standard are listed on page 33.
2 Definitions
For the purposes of this Part of BS 4485 the following definitions apply.
2.1 air flow. Total quantity of air, including associated water vapour flowing through the tower.
2.2 ambient wet (dry) bulb temperature. Wet (dry) bulb temperature of air measured windward of the tower and free from the influence of the tower.
2.3 approach. Difference between recooled water temperature and nominal inlet air wet bulb temperature.
2.4 inlet water flow. Quantity of hot water flowing into the tower.
2.5 cold water basin. Device underlying the tower to receive the cold water from the tower and direct its flow to the suction line or sump.
2.6 cooling range. Difference between the hot water temperature and the recooled water temperature. NOTE. The term 'range' is also applied to this definition, but is regarded as a non-preferred term.
2. 7 drift loss. Water lost from the tower as liquid droplets entrained in the outlet air.
2.8 heat load. Rate of heat removal from the water within the tower.
2.9 hot w~ter temperature. Temperature of inlet water.
2.10 inlet air wet (dry) bulb temperatures. Average wet (dry) bulb temperatures of the inlet air; including any recirculation effect. NOTE. This is an essential concept for purposes of design, but is difficult to measure.
2.11 make up. Water added to the circulating water system to replacP water loss from the system by evaporation, drift, purge ar,j leakage.
2.12 nomind! inlet air wet (dry) bulb temperatures. Arithmetical a·, -,·age of the measurements taken within 1.5 m of the air inlets and between 1.5 m and 2.0 m above the basin kerb elevation on both sides of the cooling tower. NOTE. See 5.2.2.
2
2.13 purge. Water discharged from the system to control concentration of salts or other impurities in the circulating water.
2.14 recooled water temperature. Average temperature of the water at the cold water basin discharge excluding the effect of any make-up entering the basin.
2.15 recirculation. Portion of the outlet air that re-enters the tower.
2.16 fan drive assembly. Components for driving the fan, normally comprising driver, drive shaft and transmission unit, and primary supporting members.
2.17 fan power. Power input to the fan drive assembly, excluding power losses in the driver.
2.18 tower pumping head. Total head of water required at the inlet to the tower, measured above the basin kerb, to deliver the inlet water through the distribution system.
2.19 water loading. Inlet water flow expressed in quantity per unit of plan packing area of the tower.
2.20 wet (dry) bulb temperature. The temperature indicated by an adequately ventilated and wetted (non-wetted) thermometer in the shade and (where applicable) protected from strong ground radiation.
3 Symbols and units
For the purposes of this Part of BS 4485, the symbols and units given in table 1 apply.
4 Conditions of validity of tests
4.1 General
In determining the performance and thermal efficiency of mechanical and natural draught cooling towers, the conditions of validity specified in 4.2 to 4.5 shall be fulfilled. NOTE. These conditions may also form the basis for contractual agreement between the purchaser and the supplier.
4.2 Conditions of site
Any variations in the conditions of the site from those of the design shall be recorded.
4.3 Conditions of equipment
At the time of test all equipment and systems shall be in proper operating condition, and the following checks shall be made.
(a) The water distribution system shall be clear and free from foreign materials which may clog or impede the normal water flow.
(b) Mechanical equipment shall be in good working order and set for the design duty (see 6.1).

(c) Drift eliminators shall be clear and free from algae and other deposits which may impede normal air flow.
(d) Packing shall be free from foreign material, such as oil, tar, scale or algae, and shall have been in use for such a period (as recommended by the supplier) to ensure adequate wetting.
(e) The water level in the cold water basin shall be at normal operating elevation immediately prior to the test.
Table 1. Symbols and units
Symbol Quantity
BS 4485 : Part 2 1988
NOTE. Wherever possible the make-up and purge should be shut off during the test in the interest of simplicity and accuracy.
In the event of the equipment not being in a satisfactory operating condition, such adjustment or changes as may be required to place it in proper operating condition shall be made. However, no adjustments shall be made which are not practical in continuous commercial operation, other than the initial setting.
Units
a Area of effective transfer surface per unit of tower packed volume mz /m3
c Specific heat capacity of water kJ/(kg·K)
G Mass flow of dry air per unit plan area of packing* kg/(m 2 ·s)
h Enthalpyt of air-water vapour mixture kJ/kg
hG Enthalpyt of air-water vapour mixture passing through the packing kJ/kg
hL Enthalpyt of saturated air film in contact with and at the temperature of the water passing through the packing kJ/kg
K Coefficient of mass transfer defined in terms of difference in absolute humidity kg/[m2 ·s·(kg/kg)]
L Mass water flow per unit plan area of packing kg/(m 2 ·s)
n (Constant) -
a, Inlet water flow m 3 /s
OM Make-up water flow m 3 /s
Op Purge water flow m3 /s
tos Dry bulb temperature oc tE Temperature of mixture of recooled water and make-up leaving cold water basin oc tM Make-up water temperature oc tp Purge water temperature oc tws Wet bulb temperature oc tl Hot water temperature oc tz Recooled water temperature oc v Effective packed volume per unit area of packing m3/mz
VB Average water volume in cold water basin during the test m3
wh Fan horsepower w A. (Constant) -
p Density of air kg/m 3
!:!h Change in air enthalpy kJ/kg
M Cooling range K
!:!p Change in air density kg/m 3
KaV/L Tower characteristic -
L/G Water/air ratio -
Subscripts
d design -
t test -
*The quantity defined for G applies to counterflow; for crossflow see appendix C.
tAll enthalpies relate to 1 kg of dry air.
3

BS 4485 : Part 2 1988
4.4 Conditions of atmosphere
The tests shall be carried out during stable weather conditions and within the following limitations.
(a) Wind velocity readings averaged over the test period shall not exceed 5.0 m/s, with readings averaged over 1 min not exceeding 7.0 m/s, when measured at a height of 1.5 m to 2.0 m above local ground level.
(b) The inlet wet bulb temperature shall be within ± 5 K of the design wet bulb temperature, but shall not fall below 3 °C.
Readings may fluctuate but the rate of change in average wet bulb temperature shall not exceed 1 K/h.
(c) In the case of natural draught towers, the relative humidity shall not fall below 40 %.
(d) Natural draught towers shall not be tested under conditions of atmospheric inversion. Where doubt exists as to the presence of a normal 'lapse rate', additional readings of air temperature shall be taken at a height of 8 m to 10 m to confirm a positive lapse (see 5.2).
The tests shall be carried out during daylight hours for reasons of safety and accuracy of measurements except that under certain circumstances it may be necessary to carry out noise tests at night.
4.5 Conditions of inlet water
The total dissolved solids in the inlet water shall be within 500 mg/L of the design value and oil, tar or other fatty substances shall not exceed 10 mg/L.
4.6 Variation from design conditions
The following variations of average test readings from design conditions are permissible.
(a) Inlet water flow not more than 10 % below or 10 % above the design value.
(b) Cooling range not more than 20% below or 20% above the design value.
(c) Heat load not more than 20% below or 20% above the design value.
During the hour selected in accordance with 7.3.1 as being representative of the test conditions, the difference between maximum and minimum readings of the inlet water flow, cooling range and heat load, shall not exceed 5%.
5 Instruments and methods of measurement
5.1 Measurement of wind velocity
Instruments shall be calibrated before use. Measurement shall be made in an open and unobstructed location to the windward of the equipment at a horizontal distance sufficient to eliminate the influence of the upstream effects of the equipment, and, where possible, a vertical distance of 1.5 m to 2.0 m above local ground level.
4
NOTE 1. The instrument recommended for the measurement of wind velocity is either the rotating cup or rotating vane anemometer.
NOTE 2. If such a location is inaccessible, a suitable location for wind measurement should be agreed between the test personnel (see appendix A).
NOTE 3. The frequency of readings taken should increase with wind speed and gust effect, in order to arrive at a representative average result.
5.2 Measurement of air temperature
5.2.1 General. The number of stations at which measurements are to be taken depends upon the size of the cooling tower and the existence of neighbouring influences. In the case of multi-cell mechanical draught and natural draught cooling towers, a minimum of three stations shall be used, whereas one station may suffice for a single-cell cooling tower.
5.2.2 Measurement of nominal inlet air temperatures. The nominal inlet wet bulb and dry bulb temperature shall be determined as the arithmetical average of the measurements taken within 1.5 m of the air inlets and between 1.5 m and 2.0 m above the basin kerb elevation on both sides of the cooling tower so as to bracket substantially the air flow to the tower.
In the case of natural draught towers, it is likely that the ambient and nominal inlet air temperatures will be identical, in which case the tests can be carried out using the ambient temperature measurements only in accordance with 5.2.3.
5.2.3 Measurement of ambient temperatures. The ambient wet bulb and dry bulb temperatures shall be determined as the arithmetic average of measurements taken, where possible, approximately 1.5 m to 2 m above ground level, and not less than 15m or more than 100m to windward of the equipment, and equally spread along a line substantially bracketing the flow of air to the equipment. NOTE. If such a location is inaccessible, or the area surrounding the equipment contains elements which can affect the ambient wet bulb and dry bulb temperatures, a suitable location for these measurements should be mutually agreed (see appendix A).
5.2.4 Measurement of wet bulb and dry bulb temperatures. The instrument for the measurement of the wet bulb and dry bulb temperature shall be a mechanically aspirated psychrometer complying with the following.
(a) The temperature-sensitive element shall be in accordance with 5.3.1.
(b) Temperature-sensitive elements shall be shielded from the direct rays of the sun or from any other sources of radiant heat. Shielding devices shall be substantially at the dry bulb temperature.
(c) The wick covering the bulb of the wet bulb thermometer shall be kept clean at all times and maintained in a saturated condition. It shall be a snug fit over the bulb and at least 25 mm in length.
(d) The temperature of the distilled water used to wet the wick shall be at approximately the wet bulb temperature to be measured.
NOTE 1. This can be obtained in practice by allowing adequate ventilated wick between the water supply and the temperaturesensitive element.
(e) The air velocity over the temperature-sensitive elements shall be between 3.0 m/s and 6.0 m/s.
At least three successive readings, separated by 10 s, shall be taken at any given location and averaged after the psychrometer has reached equilibrium. NOTE 2. The instrument will usually reach equilibrium in 2 min.
5.3 Measurement of water temperature
5.3.1 General. The method used to measure water temperature shall be accurate to± 0.05 °C. NOTE. The instrument preferred for water temperature measurement is the mercury in glass thermometer with divisions etched on the glass at intervals not greater than 0.1 °C. Other officially calibrated instruments may be used by mutual agreement (see appendix A).
The instrument used for the test shall have been checked against a reference thermometer calibrated by an approved calibrating authority prior to the test, but not more than 6 months before the test in the case of a first calibration of the same instrument. Certificates of examination shall be made available for inspection.
The locations of the temperature measuring instruments shall be such that the av-eraiie Temperature of the hot and the recooled water flows are determined. Where various streams of different temperatures combine, the point of measurement shall be located to ensure complete mixing without stratification.
If stratification is evident, the weighted average water temperature shall be determined by a survey of a selected section using simultaneous temperature and water flow measurements at each point.
5.3.2 Hot water temperature. A suitable location for the measuring instrument for hot water temperature is the common supply conduit to the tower.
5.3.3 Recooled water temperature. The recooled water temperature can be measured directly at the point where the water is discharged from the basin, the average cold water temperature being determined by simultaneous test readings, where possible, across the selected section.
Where stratification is evident, a suitable point of measurement is at the outlet of the circulating water pump. Allowance shall also be made for the rise in temperature due to energy losses in the pump (see 8.4).
When the temperature of the circulating water in the basin is the mixed temperature of both circulating water and make-up water, the recooled water temperature shall be determined indirectly by heat balance calculation taking into account the temperature and quantity of make-up and purge and other heat added or removed between the tower and the point of measurement (see 8.4).
5.3.4 Make-up water and purge temperatures. Temperature readings shall be taken at the spill over weir or in the piping immediately adjacent to the cooling tower.
5
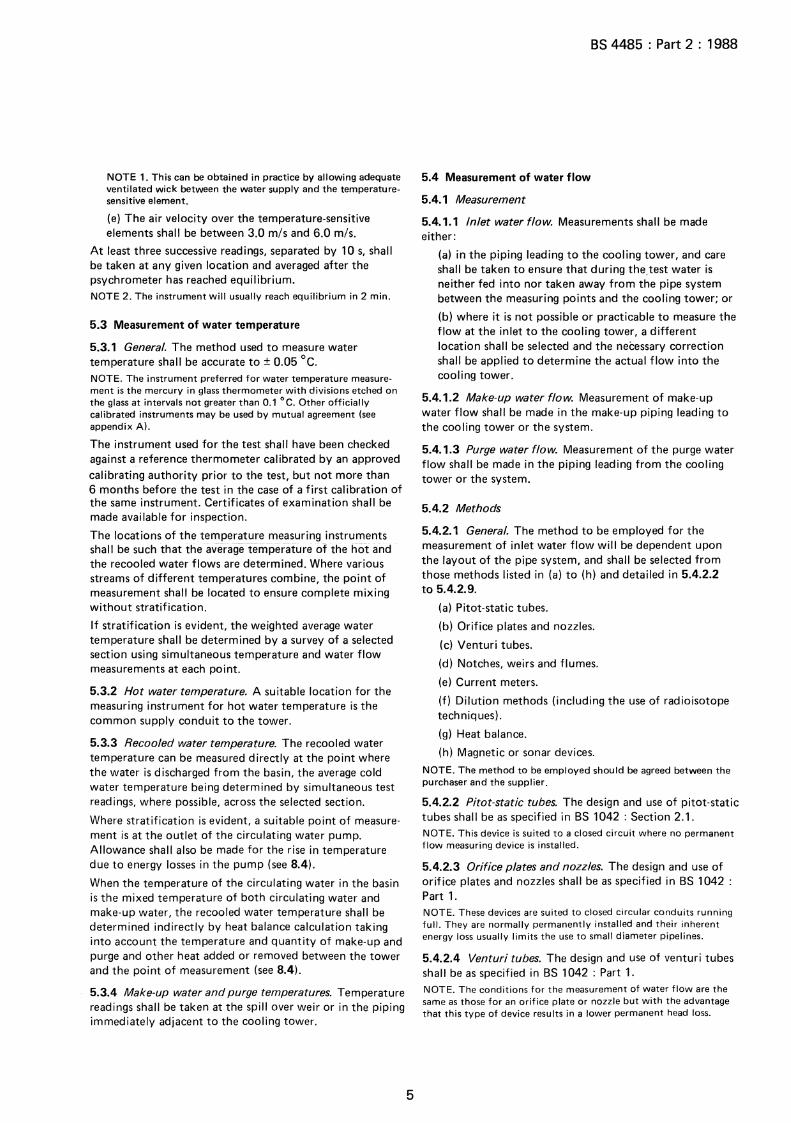
5.4 Measurement of water flow
5.4.1 Measurement
BS 4485 : Part 2 1988
5.4.1.1 Inlet water flow. Measurements shall be made either:
(a) in the piping leading to the cooling tower, and care shall be taken to ensure that during the. test water is neither fed into nor taken away from the pipe system between the measuring points and the cooling tower; or
(b) where it is not possible or practicable to measure the flow at the inlet to the cooling tower, a different location shall be selected and the necessary correction shall be applied to determine the actual flow into the cooling tower.
5.4.1.2 Make-up water flow. Measurement of make-up water flow shall be made in the make-up piping leading to the cooling tower or the system.
5.4.1.3 Purge water flow. Measurement of the purge water flow shall be made in the piping leading from the cooling tower or the system.
5.4.2 Methods
5.4.2.1 General. The method to be employed for the measurement of inlet water flow will be dependent upon the layout of the pipe system, and shall be selected from those methods listed in (a) to (h) and detailed in 5.4.2.2 to 5.4.2.9.
(a) Pitot-static tubes.
(b) Orifice plates and nozzles.
(c) Venturi tubes.
(d) Notches, weirs and flumes.
(e) Current meters.
(f) Dilution methods (including the use of radioisotope techniques).
(g) Heat balance.
(h) Magnetic or sonar devices.
NOTE. The method to be employed should be agreed between the purchaser and the supplier.
5.4.2.2 Pitot-static tubes. The design and use of pitot-static tubes shall be as specified in BS 1042 : Section 2.1. NOTE. This device is suited to a closed circuit where no permanent flow measuring device is installed.
5.4.2.3 Orifice plates and nozzles. The design and use of orifice plates and nozzles shall be as specified in BS 1042 : Part 1. NOTE. These devices are suited to closed circular conduits running full. They are normally permanently installed and their inherent energy loss usually limits the use to small diameter pipelines.
5.4.2.4 Venturi tubes. The design and use of venturi tubes shall be as specified in BS 1042 : Part 1. NOTE. The conditions for the measurement of water flow are the same as those for an orifice plate or nozzle but with the advantage that this type of device results in a lower permanent head loss.

BS 4485 Part 2 1988
5.4.2.5 Notches, weirs and flumes. The construction and installation of notches, weirs and flumes shall be as specified in BS 3680 : Part 4A. NOTE. This method is suitable only when a system is designed to accommodate a notch, weir or flume as a permanent structure.
5.4.2.6 Current meters. Current meters shall be as specified in BS 3680 : Part 8A and their use shall be as specified in BS 3680 : Part 3A. NOTE. This method is suitable for flow in channels having a free water surface.
5.4.2.7 Dilution methods. Flow measurement by chemical dilution shall be as specified in BS 3680 : Part 2A and by radioactive tracer dilution as specified in BS 3680 : Part 2C. NOTE 1. This method is equally applicable to flow in open channels with free water surface and to conduits running full.
NOTE 2. It is important that the appropriate water authority and river authority are consulted.
NOTE 3. The requirements specified in 7.3.2 do not apply with the use of this method.
5.4.2.8 Heat balance. Application of this method shall be as specified in BS 752.
NOTE. This method can be employed in the case of power station cooling towers.
5.4.2.9 Magnetic or sonar devices. Several proprietary devices are available and have the potential for high accuracy.
5.5 Water analysis
When it is required to determine the concentration of dissolved solids, oil, tar and other fatty substances (see 4.5) samples of water shall be taken at the cooling tower inlet, and tests carried out in accordance with BS 2690 : Part 9 or Part 11, as appropriate.
5.6 Measurement of tower pumping head
The following measurements shall be taken in order that the pumping head may be evaluated.
(a) Static pressure above atmosphere measured at the centre I ine oft he water inlet to the tower and immediately adjacent to the termination of supply. NOTE 1. This may be a connecting flange or another termination of supply agreed between the purchaser and supplier.
(b) The height above basin kerb level of the point at which the above static pressure is measured.
(c) The cross section of the inlet conduit at which the above static pressure is measured. NOTE 2. This may be most conveniently taken from the design drawings and an observation taken to confirm that the size and shape of the inlet corresponds to the design.
5.7 Measurement of power input to the fan driver
The electrical power input of three-phase a.c. electric motors shall be determined from measurements of voltage and current in each phase in conjunction with the power factor quoted by the motor manufacturer.
6
When voltage measurements cannot be made at the motor terminals, due allowance shall be made for voltage drop in the cable between the points of measurement and the motor terminals.
5.8 Measurement of drift loss
The assessment of the nuisance created by drift loss from a cooling tower shall be obtained by the method described in aprendix B. NOTE. The amount of drift loss can be estimated by taking the difference between the quantity of make-up water flow and the sum of the purge flow and evaporation loss. The accuracy of the measurement of the various quantities concerned should be taken into account. This measurement should preferably be carried out under conditions of no-heat-load.
5.9 Measurement of tower noise
When it is necessary to measure the free-field sound level of a cooling tower, the instrument used shall be an industrial grade sound level meter, complying with BS 5969, fitted with an' A' weighting network and capable of measurements at least over the range 30 dBA to 90 dBA.
The instrument shall have its acoustic calibration checked immediately before and after the test.
The microphone of the sound level meter shall be located out of doors, at least 1.5 m above local ground level. NOTE 1. The microphone positions should be agreed between the purchaser and the supplier.
The values recorded shall correspond to the free-field noise of the cooling tower (water and fans) and exclude noise due to wind, electrical interference and other sources of noise.
The total noise inclusive of the tower under full water and fan load shall be measured and also the background noise measured immediately before the test and exclusive of fan and water noise.
Measurements shall be made under conditions representative of the guaranteed conditions. NOTE 2. Evaluation of the results obtained is covered by appendix B of BS 4485 : Part 3 : 1988.
6 Test checks and readings
6.1 Functional test
6.1.1 General. In order to establish that the cooling tower is fully operational and that the mechanical equipment is functioning in accordance with the design requirements, check the equipment in accordance with 6.1.2 to 6.1.4.
6.1.2 Fans. Check the following:
(a) that the fan blades are set to the correct pitch for design duty;
(b) that the fan is centralized in the fan casing to ensure uniform tip clearance within the specified tolerances;
(c) that the fan rotates in the correct plane;
(d) that the direction of rotation of the fan is correct at all speeds.
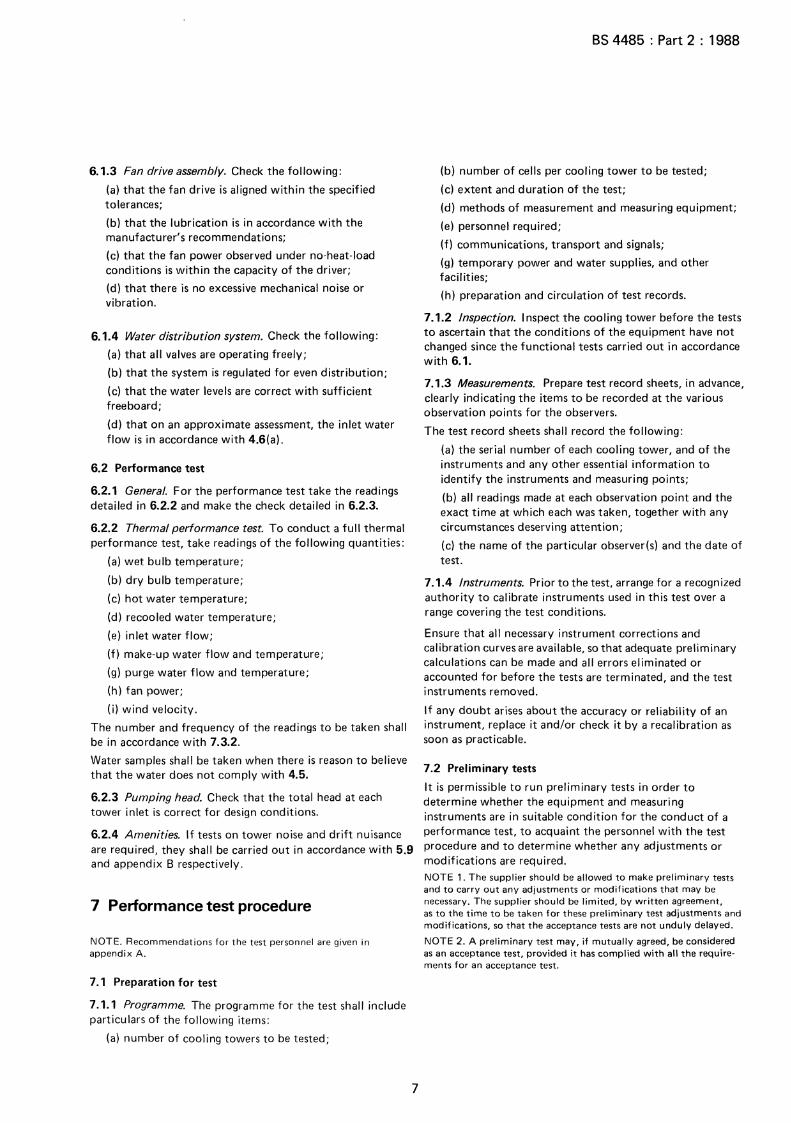
6.1.3 Fan drive assembly. Check the following:
(a) that the fan drive is aligned within the specified tolerances;
(b) that the lubrication is in accordance with the manufacturer's recommendations;
(c) that the fan power observed under no-heat-load conditions is within the capacity of the driver;
(d) that there is no excessive mechanical noise or vibration.
6.1.4 Water distribution system. Check the following:
(a) that all valves are operating freely;
(b) that the system is regulated for even distribution;
(c) that the water levels are correct with sufficient freeboard;
(d) that on an approximate assessment, the inlet water flow is in accordance with 4.6(a).
6.2 Performance test
6.2.1 General. For the performance test take the readings detailed in 6.2.2 and make the check detailed in 6.2.3.
6.2.2 Thermal performance test. To conduct a full thermal performance test, take readings of the following quantities:
(a) wet bulb temperature;
(b) dry bulb temperature;
(c) hot water temperature;
(d) recooled water temperature;
(e) inlet water flow;
(f) make-up water flow and temperature;
(g) purge water flow and temperature;
(h) fan power;
(i) wind velocity.
The number and frequency of the readings to be taken shall be in accordance with 7.3.2.
Water samples shall be taken when there is reason to believe that the water does not comply with 4.5.
6.2.3 Pumping head. Check that the total head at each tower inlet is correct for design conditions.
6.2.4 Amenities. If tests on tower noise and drift nuisance are required, they shall be carried out in accordance with 5.9 and appendix B respectively.
7 Performance test procedure
NOTE. Recommendations for the test personnel are given in appendix A.
7.1 Preparation for test
7.1.1 Programme. The programme for the test shall include particulars of the following items:
(a) number of cooling towers to be tested;
7
BS 4485 : Part 2 1988
(b) number of cells per cooling tower to be tested;
(c) extent and duration of the test;
(d) methods of measurement and measuring equipment;
(e) personnel required;
(f) communications, transport and signals;
(g) temporary power and water supplies, and other facilities;
(h) preparation and circulation of test records.
7.1.2 Inspection. Inspect the cooling tower before the tests to ascertain that the conditions of the equipment have not changed since the functional tests carried out in accordance with 6.1.
7.1.3 Measurements. Prepare test record sheets, in advance, clearly indicating the items to be recorded at the various observation points for the observers.
The test record sheets shall record the following:
(a) the serial number of each cooling tower, and of the instruments and any other essential information to identify the instruments and measuring points;
(b) all readings made at each observation point and the exact time at which each was taken, together with any circumstances deserving attention;
(c) the name of the particular observer(s) and the date of test.
7.1.4 Instruments. Prior to the test, arrange for a recognized authority to calibrate instruments used in this test over a range covering the test conditions.
Ensure that all necessary instrument corrections and calibration curves are available, so that adequate preliminary calculations can be made and all errors eliminated or accounted for before the tests are terminated, and the test instruments removed.
If any doubt arises about the accuracy or reliability of an instrument, replace it and/or check it by a recalibration as soon as practicable.
7.2 Preliminary tests
It is permissible to run preliminary tests in order to determine whether the equipment and measuring instruments are in suitable condition for the conduct of a performance test, to acquaint the personnel with the test procedure and to determine whether any adjustments or modifications are required. NOTE 1. The supplier should be allowed to make preliminary tests and to carry out any adjustments or modifications that may be necessary. The supplier should be limited, by written agreement, as to the time to be taken for these preliminary test adjustments and modifications, so that the acceptance tests are not unduly delayed.
NOTE 2. A preliminary test may, if mutually agreed, be considered as an acceptance test, provided it has complied with all the requirements for an acceptance test.

BS 4485 : Part 2 1988
7.3 Test procedure
7.3.1 Duration of test. Ensure that the duration of the test is such as to enable steady state conditions to be achieved within the limits specified in 4.6. Take the readings (at the intervals specified in 7.3.2) during the hour in which conditions are steadiest, as the test readings.
Increase the period of 1 h by a period equivalent to the thermal lag of the system, as specified in 8.6, provided this exceeds 15 min.
If the test run is undertaken with the make-up water and purge shut off, the water level in the basin will drop and the concentration of dissolved solids in the circulating water will increase. Therefore, limit the duration of the test run so that the corresponding rise in pumping head will not decrease the inlet water flow by more than 5 %and the increase in the concentration of dissolved solids does not exceed the concentration specified.
7.3.2 Frequency of readings (see note 3 to 5.4.2.7). Take readings:
(a) at regular intervals over the same period of time, at each measuring point;
(b) accurately, even for preliminary tests, so as to be repeatable and to serve as a reliable basis for calculating the test results;
(c) at the frequencies given in table 2.
7.3.3 Test records. Prepare complete test record sheets in accordance with 7.1.3. NOTE. The test records should be signed by the Chief of Test (see appendix A) and by representatives of both the purchaser and the supplier.
Table 2. Frequency of readings
7.3.4 Preliminary results. Work out a preliminary assessment of results during the test in order to investigate irregularities, to eliminate detectable faults and errors, and to ensure that the test points are suitable in number and position for determining the final results.
8 Computation of results
8.1 Reduction of test readings
In general, use the arithmetic mean of the quantities during the test period to derive the average values necessary for the final evaluation of the results. However, when conditions of stratification are known to exist compute the mean values of water temperatures in accordance with 8.2 to 8.7.
8.2 Computation of inlet water temperature
Derive.'the mean value of the inlet water temperature from the arithmetic mean of the individual readings at each measuring point weighted by the corresponding water velocities at these points to give average hot water temperatures.
8.3 Computation of recooled water temperature with make-up and purge flows shut off
8.3.1 Derive the mean value of the recooled water temperature from the arithmetic mean of the individual readings at each measuring point weighted by the corresponding water velocities at these points to give the average recooled water temperature.
Quantity Unit Recommended number of readings each hour
Wind velocity m/s 3to 12 (see5.1) Wet bulb temperature oc 12 Dry bulb temperature (for natural
draught cooling tower) oc 12 Hot water temperature oc 12 Recooled water temperature oc 12 Make-up water temperature oc 2 Purge water temperature oc 2 Inlet water flow m3 /s 12 (see 5.4.2) Make-up water flow m3 Is 2 Purge water flow m3 /s 2 Tower pumping head m 2 Fan power w 1
8

8.3.2 When the point of measurement for the recooled water temperature is taken at the discharge of the circulating water pump, determine the true recooled water temperature by subtracting the temperature rise of the water across the pump from the measured value.
8.4 Computation of recooled water temperature with make-up and purge flows operating
Where make-up and purge flows exist up-stream of the point of temperature measurement, this point being taken before the circulating water pump, determine the true recooled water temperature readings by heat balance calculation as follows:
a, tE + Op tp- aM tM t 2 = --'-='---'---__: __ :.:.:__;c_:.
a,+ Op- aM NOTE. This equation is based on the assumption that during the test there is no leakage and the make-up water only replaces the evaporation and purge loss (drift losses being neglected).
When the point of measurement for recooled water temperature is taken at the discharge of the circulating water pump, the value of tE in the equation shall be reduced by the calculated temperature rise across the pump.
8.5 Computation of tower pumping head
Compute the pumping head, which represents the total energy at the cooling tower inlet related to basin kerb level, as the sum of the measurements taken in accordance with 5.6(a) and (b) and add to this the velocity head, calculated on the basis of the measured water flow and the conduit cross section measured in accordance with 5.6(c).
9
BS 4485 : Part 2 1988
8.6 Computation of thermal lag
Calculate the thermal lag of the cooling tower as:
Vs
a,+ Op
Where the thermal lag exceeds 15 min assume that the period of the recooled water temperature readings lags an equivalent time behind the period of the other readings.
8. 7 Computation of fan power
Compute the fan power from measurements of electrical power input to the motor, together with the efficiency quoted by the motor manufacturer.
9 Evaluation of thermal performance
The measure of the thermal performance of a cooling tower is its ability to fulfil guaranteed conditions in terms of fan power, water flow, range, approach and inlet air conditions.
This can be achieved by a direct comparison between the test results and the manufacturer's performance curves, or by reference of the test results to design conditions as described in appendix C.
The effect of measurement errors shall be taken into account when interpreting the results. NOTE. The reproducibility of this evaluation is± 5 %. Therefore, the tower should be deemed acceptable if the evaluated result from the test equals or exceeds 95% of the design capability.

BS 4485 : Part 2 1988
Appendices
Appendix A. Matters to be agreed between purchaser and supplier
A.1 General
The object of the test procedure is to determine the overall operating characteristics of mechanical draught and natural draught cooling towers, and to verify the technical guarantees. To this end the matters listed in A.2 to A.6 should be agreed between the purchaser and supplier.
A.2 Technical guarantees
The functional and thermal performance guarantees within the validity specified in clause 4 should be agreed.
The guaranteed thermal performance of the cooling tower should be related to the nominal inlet air conditions at a specified reference position, given in 5.2.2, which is intended to provide a compromise between measurement of ambient and inlet air conditions. NOTE. This measurement may detect gross recirculation and in arriving at a specified nominal condition, due allowance should have been made by the purchaser in consultation with the supplier.
A.3 Performance curves
Manufacturer's performance curves should be obtained to show the recooled water temperature at conditions other than the design operating conditions. Charts should be provided to include the variations in nominal inlet wet bulb temperature, inlet water flow and range, specified in 4.4(b) and 4.6(a) and (b). In the case of natural draught towers, these curves should also include variations in relative humidity, within the limits specified in 4.4(c).
The guarantee zone should be clearly marked on all curves. NOTE. Recirculation effects may be calculated in accordance with BS 4485 : Part 3.
A.4 Date of test
Tests should be carried out within a period of 1 year following the completion of the cooling tower installation, unless otherwise agreed between the purchaser and the supplier.
A.5 Test personnel
A.5. 1 Responsibility for tests
Unless otherwise provided in the contract, the purchaser and the supplier should have equal rights in settling all details of test methods, instruments, procedure and in the selection of test personnel. Subject to their agreement, the responsibility for carrying out tests may be assigned to either the purchaser or the supplier, or to an independent authority acceptable to both. All necessary information concerning guarantees and conditions of operation which are required for the acceptance tests should be made available to all parties.
A.5.2 Chief of Test
The test should be controlled and coordinated by one person acceptable to all parties, designated 'Chief of Test'. He should exercise authority over all observers, and be responsible for all measurements. He should conduct and supervise that test, at the conclusion of which he should submit a report to all parties on the operating conditions of the test, and any factors which in his opinion have a bearing on the accuracy of the results.
A.5.3 Competence of personnel
Personnel should include engineers experienced in the measurement of the quantities concerned as detailed in 6.2.
10

A.6 Test conditions
The following matters related to the test should be agreed between the purchaser and supplier:
(a) the conditions of validity (see 4.1 );
(b) the location of measurements (see clause 5);
(c) the instrument used for the measurement of water temperature (see 5.3.1);
(d) the method of measurement of inlet water flow (see 5.4.2.1);
(e) the use of preliminary tests (see 7.2);
(f) the signing of test reports (see 7.3.3).
BS 4485 : Part 2 1988
Appendix B. Guidance on precipitation rates and determination of droplet size for the evaluation of drift nuisance
8.1 Evaluation of precipitation rate
To ascertain the rate of precipitation from the cooling tower, place a treated cotton cellulose medium fast general purpose filter paper* on the ground in the area subjected to drift nuisance.
Then accurately measure the diameter of the blots registered on the paper and make a detailed count of the numbers of blots according to diameter.
Determine the droplet diameter (in micrometres) for each blot diameter from the curve given in figure 1.
Table 3Jists for each droplet size, within the range 100 !Jm to 2000 j.lm, the number of droplets for an exposure time of 1 min which will result in 0.01 mm precipitation per hour over an area 100 mm X 100 mm.
Using table 3, determine in each droplet size bracket the percentage count in relation to the figures in table 3 (correcting for time and area). Then determine the approximate total precipitation by addition of the individual percentages.
8.2 Precipitation rates
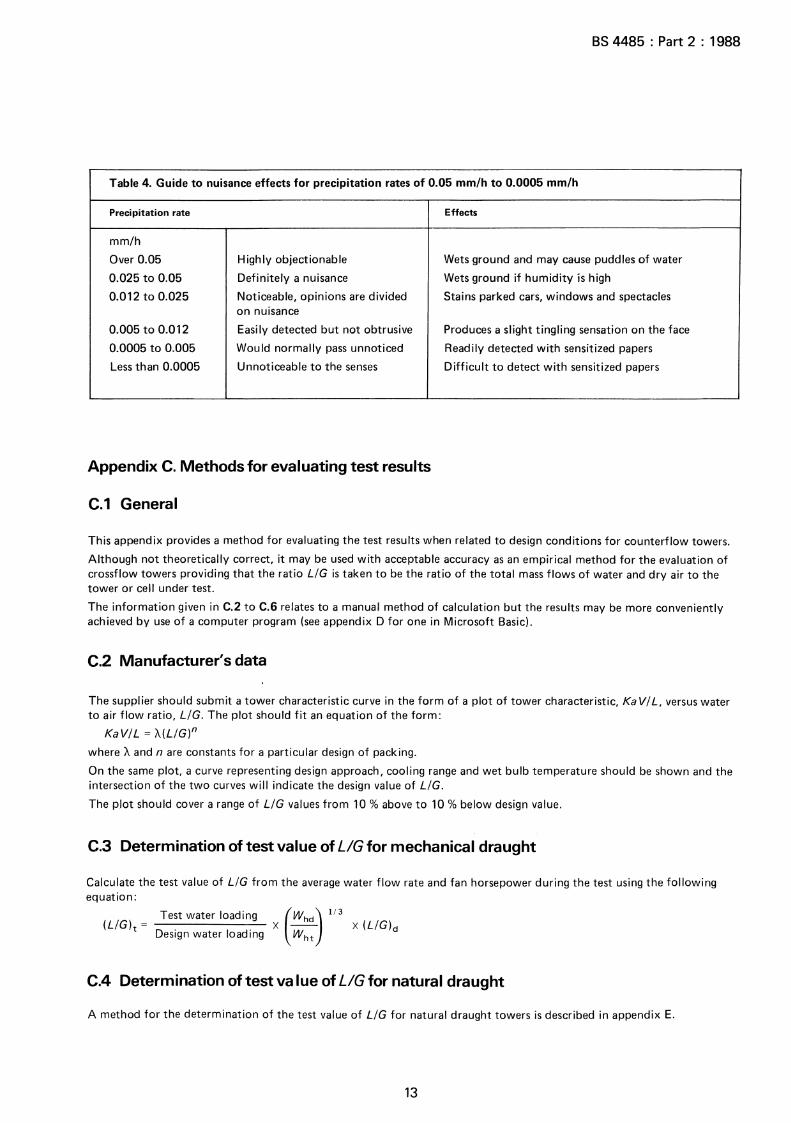
Table 4 provides guidance on the effect of drift nuisance in terms of the rate of precipitation measured in millimetres per hour.
The chief source of inaccuracy arises from the problem of exact measurement of the blot diameter, further errors may arise in original positioning of the test papers and moisture falling from trees.
*A Whatman No.1 filter paper has been found suitable. The Whatman filter paper may be prepared by dusting with powdered potassium permanganate Lisamine Green or Erio Green or be dipped in a 10 g/L solution of potassium ferricyanide. After drying the dipped paper and immediately prior to use, dust liberally with powdered ferrous ammonium sulphate.
11

BS 4485 : Part 2 : 1988
E ::l...
'-w +w E c:l ·u
+w n.. 0 '--
0
2000
1000
500
100
/ v
/ v / I
/ i
I 1
! I
I t ,
/ !
'------l--L-J.__l.-'---'--L.-. _ ___.l__--'--..J_j_ I I ; : OJ 0 5 10 5
Blot diameter (mm)
Figure 1. Determination of droplet diameter
Table 3. Precipitation rates for droplet diameters 100 IJm to 2000 IJm
Droplet Number of droplets/min Droplet Number of droplets/min diameter per 100 mm X 160 mm diameter per 100 mm X 100 mm
per 0.01 mm per 0.01 mm precipitation precipitation
IJffi IJffi
100 3183.0 900 4.4 150 943.0 1000 3.18 200 398.0 1100 2.39
250 204.0 1200 1.84 300 118.0 1300 1.45 350 74.0 1400 1.16
400 50.0 1500 0.94 450 35.0 1600 0.78 500 25.5 1700 0.65
600 14.7 1800 0.54 700 9.3 1900 0.46 800 6.2 2000 0.40
12
10
BS 4485 : Part 2 : 1988
Table 4. Guide to nuisance effects for precipitation rates of 0.05 mm/h to 0.0005 mm/h
Precipitation rate Effects
mm/h
Over 0.05 Highly objectionable Wets ground and may cause puddles of water
0.025 to 0.05 Definitely a nuisance Wets ground if humidity is high
0.012 to 0.025 Noticeable, opinions are divided Stains parked cars, windows and spectacles on nuisance
0.005 to 0.012 Easily detected but not obtrusive Produces a slight tingling sensation on the face
0.0005 to 0.005 Would normally pass unnoticed Readily detected with sensitized papers
Less than 0.0005 Unnoticeable to the senses Difficult to detect with sensitized papers
Appendix C. Methods for evaluating test results
C.1 General
This appendix provides a method for evaluating the test results when related to design conditions for counterflow towers.
Although not theoretically correct, it may be used with acceptable accuracy as an empirical method for the evaluation of crossflow towers providing that the ratio L/G is taken to be the ratio of the total mass flows of water and dry air to the tower or cell under test.
The information given in C.2 to C.6 relates to a manual method of calculation but the results may be more conveniently achieved by use of a computer program (see appendix D for one in Microsoft Basic).
C.2 Manufacturer's data
The supplier should submit a tower characteristic curve in the form of a plot of tower characteristic, KaV/L, versus water to air flow ratio, L/G. The plot should fit an equation of the form:
Ka VI L = 'A(L/G)n
where A and n are constants for a particular design of packing.
On the same plot, a curve representing design approach, cooling range and wet bulb temperature should be shown and the intersection of the two curves will indicate the design value of L/G.
The plot should cover a range of L/G values from 10% above to 10% below design value.
C.3 Determination of test value of L/G for mechanical draught
Calculate the test value of L/G from the average water flow rate and fan horsepower during the test using the following equation:
(L/G) 1 = X -- X (L/G)d Test water loading (Whdj 113
Design water loading Wht
C.4 Determination of test value of L/G for natural draught
A method for the determination of the test value of L/G for natural draught towers is described in appendix E.
13

BS 4485 : Part 2 1988
C.5 Determination of test value of KaVIL
Calculate the test value of Ka VI L from average test values of hot water, recooled water and wet bulb temperatures and the test value of L!G using the following equation:
edt
An example of a numerical method for determining this integral (the Tchebycheff method) is described in appendix F.
NOTE. The Tchebycheff method for numerically evaluating the integral! by dx uses values of y at predetermined values,of x within the a
interval a to b, so selected that the sum of these values of v multiplied by a constant times the interval (b- a) gives the desired values of the integral. In its four point form the approximate formula becomes:
f b (b- a) V dx = --- (yl + V2 + V3 + V4)
a 4
where
Vi are values of y atx =a+ 0.1 (b -a);
vz are values of vat x =a+ 0.4 (b- a);
V3 are values of y at x = b- 0.4 (b- a);
y 4 are values of y at x = b - 0.1 (b -a).
Hence for the evaluation of KaV!L,
KaV = jtt edt
L t2 (hL-hG)
t 1 - t1 { 1 1 1 1 } =---X + + + Xc
4 (hL-hGJt (hL-hG)2 (hL-hGlJ (hL-hG)4
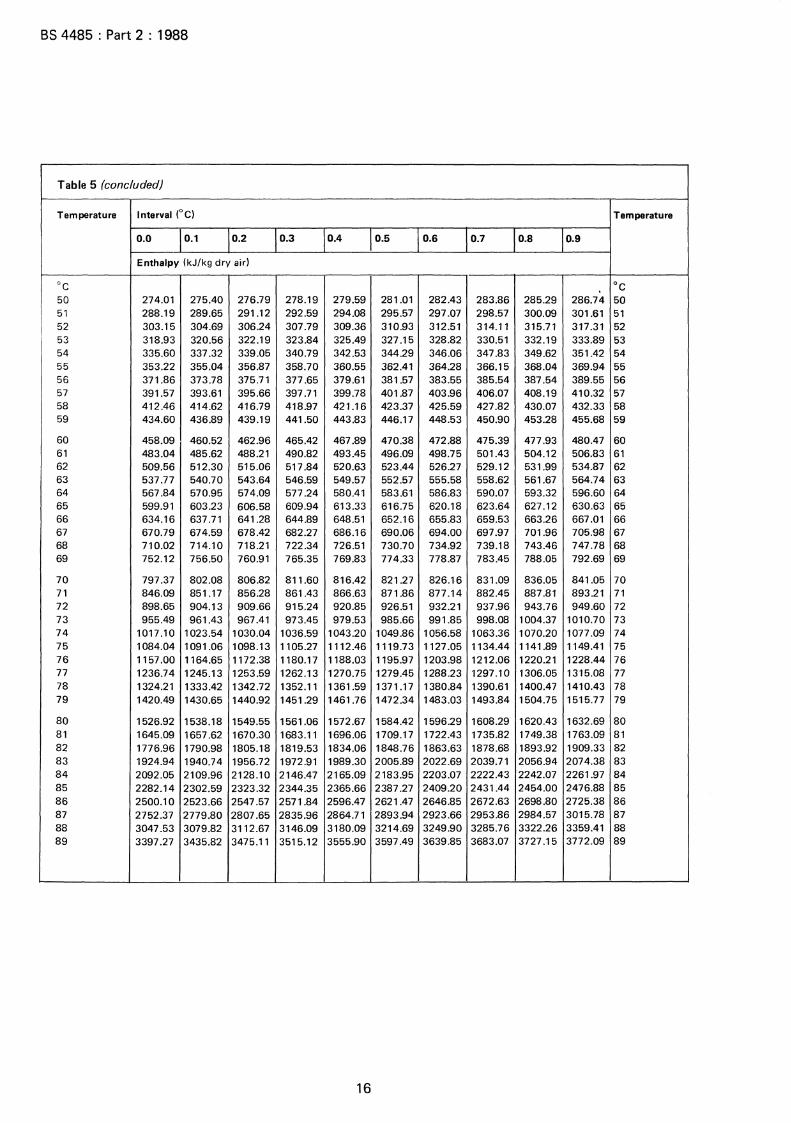
Enthalpy values to be used in this calculation are tabulated in table 5 for an atmospheric pressure of 101.325 kPa. This data may be used for locations up to 300 m above sea level without correction for altitude.
C.6 Determination of tower performance
Locate the point representing values calculated in C.3 or C.4 and in C.5 on the manufacturer's plot described in C.2. Through this point draw a curve parallel to the tower characteristic curve. The intersection of the line so drawn with the design approach curve determines the value of L!G at which the tower will produce a design approach at design range and wet bulb temperature.
The ratio of this value of L!G to the design value of L/G multiplied by 100 represents the percentage of the design circulating flow which can be cooled at design range, approach and inlet air conditions.
An example of an evaluation for a natural draught tower calculated by this method is given in appendices E and F. The evaluation for a mechanical draught tower involves the calculations illustrated in appendix F following correction of L!G in accordance with C.3.
14

BS 4485 : Part 2 1988
Table 5. Enthalpy of saturated air
Temperature Interval (° C) Temperature
0.0 0.1 0.2 0.3 0.4 0.5 0.6 0.7 0.8 0.9
Enthalpy (kJ/kg dry air)
oc oc 0 9.44 9.61 9.78 9.95 10.12 10.30 10.47 10.64 10.82 10.99 0 1 11.16 11.34 11.52 11.69 11.87 12.05 12.22 12.40 12.58 12.76 1 2 12.94 13.12 13.30 13.48 13.66 13.85 14.03 14.21 14.40 14.58 2 3 14.77 14.95 15.14 15.32 15.51 15.70 15.89 16.08 16.27 16.46 3 4 16.65 16.84 17.03 17.22 17.42 17.61 17.80 18.00 18.19 18.39 4 5 18.59 18.78 18.98 19.18 19.38 19.58 19.78 19.98 20.18 20.38 5 6 20.59 20.79 21.00 21.20 21.41 21.61 21.82 22.03 22.23 22.44 6 7 22.65 22.86 23.07 23.29 23.50 23.71 23.92 24.14 24.35 24.57 7 8 24.79 25.00 25.22 25.44 25.66 25.88 26.10 26.32 26.55 26.77 8 9 26.99 27.22 27.44 27.67 27.90 28.13 28.35 28.58 28.81 29.05 9
10 29.28 29.51 29.74 29.98 30.21 30.45 30.69 30.92 31.16 31.40 10 11 31.64 31.88 32.13 32.37 32.61 32.86 33.10 33.35 33.59 33.84 11 12 34.09 34.34 34.59 34.84 35.10 35.35 35.61 35.86 36.12 36.37 12 13 36.63 36.89 37.15 37.41 37.67 37.94 38.20 38.47 38.73 39.00 13 14 39.27 39.54 39.81 40.08 40.35 40.62 40.90 41.17 41.45 41.73 14 15 42.00 42.28 42.56 42.85 43.13 43.41 43.70 43.98 44.27 44.56 15 16 44.85 45.14 45.43 45.72 46.02 46.31 46.61 46.90 47.20 47.50 16 17 47.80 48.10 48.41 48.71 49.02 49.32 49.63 49.94 50.25 50.56 17 18 50.87 51.19 51.50 51.82 52.14 52.46 52.78 53.10 53.42 53.75 18 19 54.07 54.40 54.73 55.06 55.39 55.72 56.05 56.39 56.72 57.06 19
20 57.40 57.74 58.08 58.43 58.77 59.12 59.46 59.81 60.16 60.51 20 21 60.87 61.22 61.58 61.94 62.29 62.66 63.02 63.38 63.75 64.11 21 22 64.48 64.85 65.22 65.59 65.97 66.34 66.72 67.10 67.48 67.86 22 23 68.25 68.63 69.02 69.41 69.80 70.19 70.59 70.98 71.38 71.78 23 24 72.18 72.58 72.98 73.39 73.80 74.21 74.62 75.03 75.44 75.86 24 25 76.28 76.70 77.12 77.54 77.97 78.39 78.82 79.25 79.69 80.12 25 26 80.56 81.00 81.44 81.88 82.32 82.77 83.22 83.67 84.12 84.57 26 27 85.03 85.49 85.95 86.41 86.87 87.34 87.81 88.28 88.75 89.22 27 28 89.70 90.18 90.66 91.14 91.63 92.11 92.60 93.09 93.59 94.08 28 29 94.58 95.08 95.58 96.09 96.60 97.11 97.62 98.13 98.65 99.17 29
30 99.69 100.21 100.74 101.26 101.79 102.33 102.86 103.40 103.94 104.48 30 31 105.03 105.57 106.12 106.68 107.23 107.79 108.35 108.91 109.48 110.04 31 32 110.61 111.19 111.76 112.34 112.92 113.50 114.09 114.68 115.27 115.86 32 33 116.46 117.06 117.66 118.27 118.88 119.49 120.10 120.72 121.34 121.96 33 34 122.59 123.21 123.84 124.48 125.11 125.75 126.40 127.04 127.69 128.34 34 35 129.00 129.66 130.32 130.98 131 .65 132.32 132.99 133.67 134.35 135.03 35 36 135.72 136.41 137.10 137.80 138.50 139.20 139.91 140.62 141.33 142.05 36 37 142.77 143.49 144.21 144.94 145.68 146.41 147.16 147.90 148.65 149.40 37 38 150.15 150.91 151.67 152.44 153.21 153.98 154.76 155.54 156.32 157.11 38 39 157.90 158.70 159.50 160.30 161.11 161.92 162.73 163.55 164.37 165.20 39
40 166.03 166.87 167.71 168.55 169.40 170.25 171.10 171.96 172.83 173.69 40 41 174.57 175.44 176.32 177.21 178.10 178.99 179.89 180.79 181.70 182.61 41 42 183.53 184.45 185.37 186.30 187.24 188.18 189.12 190.07 191.02 191.98 42 43 192.94 193.91 194.88 195.86 196.84 197.83 198.82 199.82 200.82 201.82 43 44 202.84 203.85 204.87 205.90 206.93 207.97 209.01 210.06 211.11 212.17 44 45 213.24 214.31 215.38 216.46 217.55 218.64 219.73 220.84 221.94 223.06 45 46 224.18 225.30 226.43 227.57 228.71 229.86 231.01 232.17 233.34 234.51 46 47 235.69 236.87 238.06 239.26 240.46 241.67 242.88 244.10 245.33 246.56 47 48 247.80 249.05 250.30 251.56 252.83 254.10 255.38 256.67 257.96 259.26 48 49 260.57 261.88 263.20 264.53 265.86 267.20 268.55 269.90 271.27 272.64 49
15
BS 4485 : Part 2 1988
Table 5 (concluded)
Temperature Interval (°C) Temperature
0.0 0.1 0.2 0.3 0.4 0.5 0.6 0.7 0.8 0.9
Enthalpy (kJ/kg dry air)
oc oc 50 274.01 275.40 276.79 278.19 279.59 281.01 282.43 283.86 285.29 286.74 50 51 288.19 289.65 291.12 292.59 294.08 295.57 297.07 298.57 300.09 301.61 51 52 303.15 304.69 306.24 307.79 309.36 310.93 312.51 314.11 315.71 317.31 52 53 318.93 320.56 322.19 323.84 325.49 327.15 328.82 330.51 332.19 333.89 53 54 335.60 337.32 339.05 340.79 342.53 344.29 346.06 347.83 349.62 351.42 54 55 353.22 355.04 356.87 358.70 360.55 362.41 364.28 366.15 368.04 369.94 55 56 371.86 373.78 375.71 377.65 379.61 381.57 383.55 385.54 387.54 389.55 56 57 391.57 393.61 395.66 397.71 399.78 401.87 403.96 406.07 408.19 410.32 57 58 412.46 414.62 416.79 418.97 421.16 423.37 425.59 427.82 430.07 432.33 58 59 434.60 436.89 439.19 441.50 443.83 446.17 448.53 450.90 453.28 455.68 59
60 458.09 460.52 462.96 465.42 467.89 470.38 472.88 475.39 477.93 480.47 60 61 483.04 485.62 488.21 490.82 493.45 496.09 498.75 501.43 504.12 506.83 61 62 509.56 512.30 515.06 517.84 520.63 523.44 526.27 529.12 531.99 534.87 62 63 537.77 540.70 543.64 546.59 549.57 552.57 555.58 558.62 561.67 564.74 63 64 567.84 570.95 574.09 577.24 580.41 583.61 586.83 590.07 593.32 596.60 64 65 599.91 603.23 606.58 609.94 613.33 616.75 620.18 623.64 627.12 630.63 65 66 634.16 637.71 641.28 644.89 648.51 652.16 655.83 659.53 663.26 667.01 66 67 670.79 674.59 678.42 682.27 686.16 690.06 694.00 697.97 701.96 705.98 67 68 710.02 714.10 718.21 722.34 726.51 730.70 734.92 739.18 743.46 747.78 68 69 752.12 756.50 760.91 765.35 769.83 774.33 778.87 783.45 788.05 792.69 69
70 797.37 802.08 806.82 811.60 816.42 821.27 826.16 831.09 836.05 841.05 70 71 846.09 851.17 856.28 861.43 866.63 871.86 877.14 882.45 887.81 893.21 71 72 898.65 904.13 909.66 915.24 920.85 926.51 932.21 937.96 943.76 949.60 72 73 955.49 961.43 967.41 973.45 979.53 985.66 991.85 998.08 1004.37 1010.70 73 74 1017.10 1023.54 1030.04 1036.59 1043.20 1049.86 1056.58 1063.36 1070.20 1077.09 74 75 1084.04 1091.06 1098.13 1105.27 1112.46 1119.73 1127.05 1134.44 1141.89 1149.41 75 76 1157.00 1164.65 1172.38 1180.17 1188.03 1195.97 1203.98 1212.06 1220.21 1228.44 76 77 1236.74 1245.13 1253.59 1262.13 1270.75 1279.45 1288.23 1297.10 1306.05 1315.08 77 78 1324.21 1333.42 1342.72 1352.11 1361.59 1371.17 1380.84 1390.61 1400.47 1410.43 78 79 1420.49 1430.65 1440.92 1451.29 1461.76 1472.34 1483.03 1493.84 1504.75 1515.77 79
80 1526.92 1538.18 1549.55 1561.06 1572.67 1584.42 1596.29 1608.29 1620.43 1632.69 80 81 1645.09 1657.62 1670.30 1683.11 1696.06 1709.17 1722.43 1735.82 1749.38 1763.09 81 82 1776.96 1790.98 1805.18 1819.53 1834.06 1848.76 1863.63 1878.68 1893.92 1909.33 82 83 1924.94 1940.74 1956.72 1972.91 1989.30 2005.89 2022.69 2039.71 2056.94 2074.38 83 84 2092.05 2109.96 2128.10 2146.47 2165.09 2183.95 2203.07 2222.43 2242.07 2261.97 84 85 2282.14 2302.59 2323.32 2344.35 2365.66 2387.27 2409.20 2431.44 2454.00 2476.88 85 86 2500.10 2523.66 2547.57 2571.84 2596.47 2621.47 2646.85 2672.63 2698.80 2725.38 86 87 2752.37 2779.80 2807.65 2835.96 2864.71 2893.94 2923.66 2953.86 2984.57 3015.78 87 88 3047.53 3079.82 3112.67 3146.09 3180.09 3214.69 3249.90 3285.76 3322.26 3359.41 88 89 3397.27 3435.82 3475.11 3515.12 3555.90 3597.49 3639.85 3683.07 3727.15 3772.09 89
16

BS 4485 : Part 2 1988
Appendix D. Computer program for calculating performance capability
A program in Microsoft Basic for calculating performance capability is as follows.
NOTE. In this appendix the references to BS 4485: Part 2: 1987 should be read as 'BS 4485: Part 2: 1988'.
10 REM ******** Program P4485 Rev. 6 Date: 30 January 1987 ******** 12 tH'-'' EVALUATION OF THERi·lAL PERFORMANCE: WATER COOLING TOWER' 14 L$=' *****************************************************************' 16 N$''' TEST METHOD TO BS 4485: PART 2: 1987' 18 Gii"' INPUT FROM VDU. OUTPUT TO VDU' 20 PRINT L$ 22 Pf-<JNT M$ 24 PRINT N$ 26 PfUNT G$ 28 PHINT L$ 30 PRINT 32 PRINT ' ********************** INPUT DESIGN DATA *********************' 34 PfHNT 36 PRINT ' IS IT A MECHANICAL OR A NATURAL DRAUGHT TOWER ? (Input M or N)' 38 INPUT LINE I$ 40 IF SUB( I$, 1>='M' THEN 46 42 IF SUB(!$, 1l='N' T.EN 46 44 G(JTO 36 46 D$,,SUH< J$, 1 > 48 PRINT ' DESIGN INLET WATER FLOt-1 (m3/s) ?' 50 INPUT G1 52 PRINT ' DESIGN HOT ~lATER TEMPERATURE <C> ?' 54 INPUT T1 56 PRINT ' DESIGN RECOOLED ~lATER TEMPERATURE (C) ?' 58 •INPUT T2 60 IF D$='M' THEN 62 PRINT ' DESIGN 64 INPUT D1 66 PRINT ' DESIGN 68 INPUT t.-11 70 IF D$='N' THEN 72 PRINT ' DESIGN 74 INPUT P3
66 DRY
L--IET
76 FAN
BULB
BULB
PQI.-IER
TEI'lPERATURE OF INLET AIR
TEI'lPERATURE OF INLET AIR
<HI) ?I
(Cl ?I
(C) ?I
76 PRINT ' IS THE DESIGN BASED ON ATI"'IOS. PRESSURE, OR ALTITUDE? (Input P or A)' 78 INPUT LINE P$ 80 IF P$~'P' THEN 86 82 IF P$='A' THEN 92 84 GOTO 76 86 PRINT ' DESIGN ATI'lOSPHERIC PRESSURE <kPa> ?' 88 INPUT P1 90 GClTO 96 92 PRINT ' DESIGN ALTITUDE (m above sea level) ?' 94 INPUT A1 96 PRINT ' DESIGN AIR/WATER RATIO L/G ?' 98 INPUT J1
100 PRINT ' "n" VALUE FOR TOL-lER CHARACTERISTIC CURVE KaV/L=C•<LIG>·~n ?' 102 INPUT N1 104 N1~c-·ABS(N1 I 106 Pf<JNT 108 PRINT ' ********************** INPUT TEST DATA ***********************' 110 PRINT 112 PRlNT 'TEST INLET ~lATER FLOW (m3/s) ?' 114 INPUT G2 116 PRINT ' TEST HOT WATER TEMPERATURE (C) ?' 118 INPUT TS 120 PRINT ' TEST RECOOLED WATER TENPERATURE (C) ?' 122 INPUT T6 124 IF D$='M' THEN 130 126 PRINT ' TEST DRY BULB THIPERATURE OF INLET AIR !Cl ?' 128 INPUT D2 130 PRINT ' TEST WET BULB TEMPERATURE OF INLET AIR (C) ?' 132 INPUT W2 134 IF D$='N' THEN 140 136 PRINT ' TEST FAN POWER <kWI ?'
17

BS 4485 : Part 2 1988
138 140 142 144 146 148 150 152 154 156 158 160 162 164 166 168 170 172 174 176 178
1000 1002 1004 1006 1008 1010 1012 1014 1016 1018 1020 1022 1024 1026 1028 1030 1032 1034 1036 1038 1040 1042 1044 1046 1048 1050 1052 1054 1056 1058 1060 1062 1064 1066 1068 1070 1072 1074 1076 1078 1080 1082 1084 1086 1088 1090 1092 1094 1096 1098 1100
INPUT P4 PRINT ' Calculating REM SET LOOP TOLERANCES FOR KaV/L, L/G <TEST), ENTHALPY BALANCE REM AND EXPECTED WATER TEMPERATURE ( Ref. Line 7016 - 7018 l Yl=l. E-05 Y2=2. E-·05 Y3"'.0015 Y4"'.0001 REM **************** READ DATA, DEFINE FUNCTIONS *****~*********** READ A,B,C,D,E,F,G,TO,T9,M1,M2,C1,C2,C3,LO,RO,P9,B1,B2 DIM NC4J,WC41,A(4),D(4),T(6),E(2) READ NC1),NC2J,N(3),NC4),C0 GOSUB 3020 REM ************************ CALCULATIONS ************************ IF D$='M' THEN GOSUB 1010 IF D$='N' THEN GOSUB 2010 IF FO+F1+F2+F3+F6+F7+F8=0 THEN GOSUB 2852 REM *********PRINT OUTPUT lAND WARNINGS - IF APPLICABLE> ******** GOSUB 4006 GOSUB 4306 END REI'l REI'l REM REI'l REN F7=c0
•••••••••••••••••••••••••••••••••••••••••••••••••••••••••••••• SUBROUTINE: CALCULATION OF TOWER CAPABILITY - MECH. DRAUGHT
•••••••••••••••••••••••••••••••••••••••••••••••••••••••••••••• ********************** CHECK DATA INPUT ********************** *** SET ERROR FLAG F7 <INPUT DATA ERROR>
REM *** SET ERROR FLAG F3 CNO CONVERGENCE> F3=0 IF W1<:3 THEN F7=1 IF W2<3 THEN F7=1 IF T2<=W1 THEN F7'-"1 IF T 6(=\tJ2 THEN F7= 1 IF T 1 <:=T2 THEN F7"' 1 IF T5(=T6 THEN F7~1
IF T1>90 THEN F7=1 IF T5>90 THEN F7=1 IF P$='A' THEN Pl=FNPCA1) REM * TEST ATI'IOSPHEHIC PRESSURE IS ASSUMED EGUAL TO THE DESIGN VALUE * REN SEA LEVEL PRESSURE IS USED FOR ALTITUDES UP TO 300 m CBS4485: Pt 31 IF P1>=FNPI3001 THEN IF P1<FNPIOI THEN Pl~FNPIOJ
IF P1<70 THEN F7=1 Rl==T1-T2 IF F7==1 THEN 1198 REM ******************* CALCULATE DESIGN KaV/L ******************* PO,~P1
DO=W1 lrJO=IrJl VO=FNVCWO> E I 1 J ==FNE <DO J REM *** SET ERROR FLAG F8 <NEGATIVE ENTHALPY DRIVING FORCE> FB=cO FOR 1=1,4 T=T2+NCIJ•R1 DO=T J..IO=T VO=,FNV CWO> WCIJ=FNECDOl ACI>=EC1l+NIIJ•Rl*Jl•CO IF WCI><AIIJ THEN F8=1 DllJ=1/IWIIl-AIIJJ NEXT I IF F8=1 THEN 1198 Kl=R114•1DI1J+DI2J+DI3J+DI411*CO REM ************** CALCULATE TEST L/G AND TEST KaV/L ************* J2=J1•G2/Gl•CP3/P4)-11/3) R2ocT5-T6 P2ocp 1 PO=,P2 oo~'W2
J..IO=W2 VO:.cFNVCWO>
18

1102 1104 1106 1108 1110 1112 1114 1116 1118 1120 1122 1124 1126 1128 1130 1132 1134 1136 1138 1140 1142 1144 1146 1148 1150 1152 1154 1156 1158 1160 1162 1164 1166 1168 1170 1172 1174 1176 1178 1180 1182 1184 1186 1188 1190 1192 1194 1196 1198 2000 2002 2004 2006 2008 2010 2012 2014 2016 2018 2020 2022 2024 2026 2028 2030 2032 2034 2036 2038 2040
E ( 2 >=FNE <DO> REM *** SET ERROR FLAG F8 <NEGATIVE EN"fHALPY DRIVING FORCE> FB=O FOR I=1,4 T=T6+N<I>•R2 DO=T HO=~T
VO=FNV<WO> H < J > =FNE <DO> A<J>=E<2>+N<I>•R2•J2•CO IF W<I><A<I> THEN FB=l D<I>=1/<W<I>-A<I>> NEXT I IF F8=1 THEN 1198 K2=R2/4*(D(1)+D(2)+D(3)+D<4>>*CO
BS 4485 : Part 2 1988
REM * SOLVE FOR L/G: TEST TOWER CHARACTERISTICS & DESIGN DEMAND CURVE REI'l *** SET ERROR FLAG F8 (NEGATIVE ENTH1iLPY DRIVING FORCE> F8=0 I3=1 I8=~1
J3=J2 D8=SGN<K3-K4> K3=K2* < J3/ J2 > ·''N 1 FOH I=L 4 T=T2+N<I>•R1 DO=T ~IO==T
VO=FNV<WO> W ( I > =FNE <DO> A<I>=E<l>+N<I>•R1•J3•CO IF W<I><A<I> THEN F8=1 0(1>=1/(W<I>-A<I>> NEXT I IF F8=0 THEN 1176 FB:=O ~t3=J3-. 1 GOTO 1144 K4=R114•<D<1>+D(2)+D(3)+D<4>>•CO IF ABS<K3-K4><Y1 THEN 1196 IF 13=50 THEN F3=1 IF 13=50 THEN 1198 IF D8C·O THEN IF D8C·SGN<K3-K4> THEN I8=. 5*I8 J3=J3+SGN<K3-K4>•IU IF J3<0 THEN J3=. OJ I3:=I3+1 GOTO 1144 REI'l *********** CALCULATE PERCENTAGE TOWER CAPABILITY ************ E5:o100•·J3/·J1 RETURN REI'l ************************************************************** REM SUBROUTINE: CALCULATION OF TOWER CAPABILITY - NATURAL DRAUGHT REM RH1 REI'! F7"0 REM FO=O F1=0
************************************************************** ********************** CHECK DATA INPUT ********************** ***SET ERROR FLAG F7 <INPUT DATA ERROR>
*** SET ERROR FLAGS FO, F1, F2, F3 <NO CONVERGENCE>
F;!=·O F3=0 IF W1,:3 THEN F7=1 IF W2,:3 THEN F7=1 IF T2<:=W1 THEN F7=1 IF T6<=W2 THEN F7=1 IF T1<=T2 THEN F7=l IF T5<=T6 THEN F7==1 IF TD90 THEN F7=1 IF T5>90 THEN F7=1 IF D 1 ,:~11 THEN F7=1 IF D2<:W2 THEN F7=1
19

BS 4485 : Part 2 : 1988
IF P$='A' THEN P1~FNP<A1> 2042 2044 2046 2048 2050
REM * TEST ATI'10SPHERIC PRESSURE IS ASSUMED EQUAL TO THE DESIGN VALUE * REI'l SEA LEVEL PRESSURE IS USED FOR ALTITUDES UP TO 300 m <BS4485: Pt 3) IF P 1:>:=FNP ( 300) THEN IF P 1<FNP (0) THEN P 1 ='FNP ( 0 > IF P1<70 THEN F7mJ
2052 RJmT1-T2 2054 REI'l ******** PROPERTIES OF INLET AIR AT DESIGN CONDITIONS ******** 2056 PO==P1 2058 DO'-"D1 2o6o ltlo~-'w 1 2062 VO~FNV<WO>
2064 U1==FNR<WO> 2066 IF U1<40 THEN F7mJ 2068 IF F7m1 THEN 2346 2070 E l ==FNE <DO)
E6"-'E1+R1*J1•CO 2072 2074 2076 2078 2080 2082 2084 2086 2088 2090 2092 2094 2096 2098 2100 2102 2104 2106 2108 2110 2112 2114 2116 2118 2120 2122 2124 2126
REM PROPERTIES OF EXIT AIR AT DESIGN CONDITIONS <ASSUME SATURATION> IO:o1 I7=10 T7=40 E7=E6 D7=SGN<E6-E7l DO=T7 WO=T7 VO==FNV<WO> E7=FNE<DOl IF ABS<E6-E7l•~Y3 THEN 2110 IF I0=50 THEN FO=l IF I0=50 THEN 2346 IF D7<>0 THEN IF D7<>SGN<E6-E7l THEN I7=. 5*I7 T7=T7+SGN<E6-E7>•I7 IO=I0+1 GOTO 2086 X2=-,FND < VO) REM ******************* CALCULATE DESIGN KaV/L ******************* REI'l *** SET ERROR FLAG F8 <NEGATIVE EN"fiiALPY DRIVING FORCE) Fs,~o
DO=W1 WO==W1 VO=FNV<WOl E( 1 )mFNE<DOl FOR I=1, 4
2128 T~T2+N<I>•R1
2130 DO=T 2132 WO==T 2134 VO=FNV<WOl 2136 W(Il=FNE<DO> 2138 A<Il=E<1l+N<I>•R1•J1•CO 2140 IF W<Il<A<I> THEN F8=1 2142 D<I>=1/<W<I>-A<I>> 2144 NEXT I 2146 IF F8=1 THEN 2346 2148 K1=R1/4*<D<1l+D(2l+D(3l+D(4))*CO 2150 REI'l ********* PROPERTIES OF INLET AIR AT TEST CONDITIONS ********* 2152 R2==T5-T6 2154 P2=P1 2156 PO=P2 2158 DO=D2 2160 ~IO=W2
2162 VO=FNV<ItiOl 2164 U2=FNR<WOl 2166 IF U2<40 THEN F7=J 2168 IF F7=1 THEN 2346 217 0 E2==FNE <DO) 2172 X3=FND<VO> 2174 REI'l ********************* CALCULATE TEST L/G ********************* 2176 2178 2180 2182 2184 2186
12=1 E8=E2+R2•J4•CO REM PROPERTIES OF EXIT AIR AT TEST CONDITIONS <ASSUME SATURATION> Il'-'1 IB"-'10
20

BS 4485 Part 2 1988
2332 2334 2336 2338 2340 2342 2344 2346 2800 2802 2804 2806 2808 2810 2812 2814 2816 2818 2820 2822 2824 2826 2828 2830 2832 2834 2836 2838 2840 2842 2844 2846 2848 2850 2852 2854 2856 2858 2860 2862 2864 2866 2868 2870 2872 2874 2876 2878 2880 2882 2884 2886 2888 2890 2892 2894 2896 2898 2900 2902 2904 2906 2908 2910 2912 2914 2916 3000 3002
IF D8C·O THEN IF D8C·SGN<K3-K4> THEN ~3=~3+SGN<K3-K4>•I8 IF ~3<0 THEN ~3=.01
I3"'I3+1 GOTO 2292
I8=. ::l*I8
REM *********** CALCULATE PERCENTAGE TOWER CAPABILITY ************ E5=100•~3/~1
RETURN REM ************************************************************** REM REM REM REM REM REM REM REM REM REI'l REM REM REM REM REM REM REM REM REM REM REI'l REM REM REI'l REI'l F4=0 REI'l FH=O I4=1 19=1
SUBROUTINE: ALTERNATIVE PRESENTATION OF CAPABILITY OF WATER COOLING TmJER IN TERMS OF TEMPERATURE
************************************************************** It may be desirable to express the capability of a water cooling tower as the difference in recooled water temperature between that obtained on the actual cooling tower under test and that expected from the de~igned cooling tower when operating at test conditions of water flow rate, cooling range. fan power. wet and d1··y bulb temperatuT·es.
METHOD OF SOLUTION: An inherent feature of this method of evaluation is that the water/air ratio remains constant and equal to the test value of L/G. The first step is to calculate the theoretical value of KaV/L for a 100 Y. efficient tower from the de~ign tower characteristics at test value of L/G. Then. the corresponding value of theoretical recooled water temperature is obtained by iteration to match the above theoretical KaV/L. This calculation uses test conditions of water flow. cooling range, fan power. wet ~< dry bulb air temperatures. Finally. the theoretical and test values of recooled water temperature are compared in order to assess the capability of the cooling tower under test in terms of temperature.
*** SET ERROR FLAG F4 <NO CONVERGENCE>
*** SET ERfWR FLAG F8 <NEGATIVE ENTHALPY DRIVING FORCE>
IF T6-W2<3 THEN I9=.2 IF ABS(E5-100><20 THEN I9=. 2 R2"~T5-T6
T<6>=T6+. 05•<E5-100) IF T(6J<W2+3•I9 THEN TI6J=W2+3*I9 D9""SGNIK5-K7> K5=K1*1~2/~1 J·"N1 FOR I=1,4 T=T(6J+NII>•R2 DO'"T WOc"T VO==FNV<WO> ~~ ( I ) =FNE (DO) AII>=EI2J+N(Il*R2*J2*CO IF W<I><A<I> THEN FB~1
D<I>=1/IWII>-A<I>> NEXT I IF F8=1 THEN 2916 K7=R214•<D<1J+D(2)+D(3J+D<4>>•CO IF ABS<K5-K7><Y4 TIEN 2914 IF I4=50 THEN F4=1 IF I4=50 THEN 2916 IF D90·0 THEN IF D90·SGN < K 5-K 7 > THEN T<6J=TI6J-SGN(K5-K7l*I9 I4.,I4+1 GOTO 2872 D5=TI6>-T6
I9=. 51i-I9
RETURN REM RHl
************************************************************** SUBROUTINE: PSYCHROMETRY IS. I. Units>
22

3004 3006 3008 3010 3012 3014 3016 3018 3020 3022 3024 3026 3028 3030 3032 3034 3036 3038 3040 3042 3044 3046 3048 3050 3052 4000 4002 4004 4006 4008 4010 4012 4014 4016 4018 4020 4022 4024 4026 4028 4030 4032 4034 4036 4038 4040 4042 4044 4046 4048 4050 4052 4054 4056 4058 4060 4062 4064 4066 4068 4070 4072 4074 4076 4078 4080 4082 4084 4086
BS 4485 Part 2 1988
REM Reference ( 1): BS 2520: 1983, BaromE"ter conventions and tables REM Reference (21: C.E.R. L. Repo1·t RD/L/M 198, ~une 1968 REM Psychrometric data for moist air (in S. I. units> REI'l Source for Ref. (21: 1963, Proceedings, InteT·national Symposium REM on Humidity and Moisture (various authors> REM *************************************************~************ REN REM ********** SATURATION VAPOUR PRESSURE OF WATER <Pal ********** DEF FNVCWOI"'10-~·(A/(WO+TOI+B*LOG<WO+TOI+C•10·'•(D*<WO-. 01 I l+E•10''(F*< 1-T9/(WO+TOI I I+GI REM ******SPECIFIC HUMIDITY Ckg water vapour I kg dry airl ****** DEF FNW< VO I"'M1 /M2*< V0-1000•PO•C1 •<DO-t.-10 I I I C 1 OOO•PO-V0+1000•PO•C 1 *( DO-WOI I REM **SPECIFIC ENTHALPY (k~/kg dry air+associated water vapour** DEF FNECDOI"'C2*DO+FNWCVOI•<LO+C3*DOI REM *SPECIFIC VOLUME OF MOIST AIR (m3 air+water vapour/kg dry air> DEF FNS< WO I"'RO* <DO+ TO I I <1'12* ( 1000•PO-IJ0+1000*PO*C 1•<00-WOI I I *1000 REM ****************DENSITY OF MOIST AIR Ckg/m31 **************** DEF FNDCVOI"'C1+FNWCVOII/FNSCWOI REI'l **************** PERCENTAGE RELATIVE HUNIDITY **************** DEF FNR<WOI"'100•<FNVCWOI-1000•PO*C1•CDO-WOII/FNVCDOI REM **STANDARD ATMOSPHERIC PRESSURE CkPal vs. ALTITUDE C m asll * DEF FNPCXI"'P9+B1•X+B2•X•X REI'l ************************ OUTPUT FORMAT *********************** DEF FNACXI=INTC100•X+. 51/100 DEF FNBCXI=INTC1000•X+. 51/1000 RETURN REI'l REM
*************************~·········~··········~··············· SUBROUTINE: OUTPUT TO VDU DESIGN DATA & TEST RESULTS
REM PRINT L$
***********~**************************************************
PRINT M$ T$"''MECHANICAL' IF D$='N' THEN T$"''NATURAL' PRINT ' PRINT N$ PRINT L$ PRINT
TYPE: ': T<~: 'DRAUGHT I
PRINT ' PRINT ' PRINT
' 'DESIGN'' 'TEST I: ' LII'1ITS OF VALIDITY' OF TEST' ' 'DATA', 'DATA': I
PRINT ' Water flow <m3/s)',GLG2,FNA<.9•Gll: '-':FNAC1.1*G11 PRINT ' Hot water temp. PRINT ' Recooled water temp. PRINT ' Cooling range H1=INTC1000*Gl*R11 H2"'INTC1000•G2•R21
CCJ',TLT5 CCJ',T2,T6 C K I ', FNA ( R 1 I, FNA ( R2 I, FNA (. 8*R 1 I : '-': FNA C 1. 2*R 1 I
PRINT' Heat load Ckcal/s)',HLH2,INTC.8•H1+.51: '-':INTC1.2*H1+.51 IF D$"''N' THEN PRINT ' Inlet dry bulb temp. CCI ',D1,D2 Ll=W1-5 IF L1<3 THEN L1=3 PRINT ' Inlet wet bulb temp. CCI', WL ~12, L1: '-': L1+10 IF D$='N' THEN PRINT' Inlet rel. humidity Ci.)',FNACU1l,FNACU21, '40- 100' IF D$"''M' THEN PRINT ' Fan power CkWI ',P3,P4 R$"',, IF A1>0 THEN IF PlcFNPCOI THEN R$='See NOTE C11' PRINT' Atmos. pressure CkPa)',FNB<P11, 'Design value',R$ IF P$='A' THEN PRINT 'Altitude Cm asll ',AL '-~ PRINT 1 L/G water/air ratio 1 ~J1,FNBCJ2)
PRINT ' "n" for KaV/L=C•CL/G)·"n ', Nl, 'Design value' PRINT ' Tower KaV/L ',FNBCK1l,FNBCK21 PRINT PRINT ' TOWER CAPABILITY Ct.. I', 1 100 1 , FNi\CE51 IF FO+F 1 +F2+F3+F4+F6+F7+F8)·0 THEN 4082 PRINT 'EXPECTED RECOOLED WATER TEMPERATURE CCJ',FNACT6+D51 IF FNACD5l<O THEN PRINT 1 t.-IORSE THAN DESIGN BY 1 :FNA<ABSCD511: 'CKI' IF FNACD51>0 THEN PRINT' BETTER THAN DESIGN BY':FNACD51: 1 (1-<.)'
IF FNACD51=0 THEN PRINT ' EGUAL TO DESIGN' PRINT IF R$= 1 ' THEN 4092 PRINT I NOTE C 1 I: For altitudes 0-300 m above sea leveL the test data 1
4088 PRINT ' is evaluated at mean sea level pressure CBS 4485: Pt 31 1
4090 PRINT 4092 RETURN
23

BS 4485 Part 2 1988
4300 4302 4304 4306 4308 4310 4312 4314 4316 4318 4320 4322 5000 5002 5004 5006 5008 5010 5012 5014 5016 5018 5020 5022 5024 5026 5028 7000 7002 7004 7006 7008 7010 7012 7014 7016 7018 7020 7022 7024 7026 7028 7030 7032 7034 7036 7038 7040 7042 7044
REM REI'l REM IF F0=1 IF F1=1 IF F2=1 IF F3=1 IF F4=1 IF F6=1 IF F7=1 IF F8=1 RETURN
************************************************************** SUBROUTINE: PRINT WARNINGS IF APPLICABLE
************************************************************** THEN PRINT '***WARNING: NO CONVERGENCE <DESIGN EXIT AIR TEMP. l' THEN PRINT '***WARNING: NO CONVERGENCE CTEST EXIT AIR TEMP. l' THEN PRINT ' *** WARNING: NO CONVEHGENCE <TEST L/Gl' THEN PRINT ' ·H* WARNING: NO CONVERGENCE CL/G FOR TQl.oJER CAPABILITY>' THEN PRINT '***WARNING: NO CONVERGENCE <EXPECTED COLD WATER TEMP.)' THEN PRINT ' *** WARNING: NEGATIVE DRAUGHT' THEN PRINT ' ·H* WARNING: INPUT DATA ERROR' THEN PRINT ' ***WARNING: NEGATIVE ENTHALPY DRIVING FORCE'
REM ********·••• DATA FOR FNVCX>: A,B,C,O,E,F,G,TO,T9 ************* DATA -2948.997118,-2.1836674,-.000150474,-.0303738468,.00042873 DATA 4. 76955,25.83220018,273.15,273.16 REM ******************DATA FOR FNWCWOl: M1,M2,C1 **************** DATA 18.01534,28. 9645,. 000666 REM *****************DATA FOR FNECDO>: C2,C3,LO ***************** DATA 1. 00568,1.84598,2500.84 REM ********************DATA FOR FNSCWO>: RO ******************** Dt\TA 8. 31432 REM ******************DATA FOR FNPCX>: P9,B1,B2 ***************** DATA 101. 325,-.0118917,4.94444E-07 REI'l ••·••* DATA FOR NC4l: INTERVALS FOR NtiMERICAL INTEGRATION ***** DATA . 1.. 4, . 6,. 9 REM ********** SPECIFIC HEAT OF WATER <Reference 2l: CO ********** DATA 4. 18684 REM *********** Program P4485: Rev. 6: GENERAL NOTES ************* REI'l REM REM REM REM REM REI'l REI'! REM REM REM REI'1 REM REM REM
CAl The program uses constants of up to 10 digits for pressure correlation vs. temperature. This version of is also suitable for single precision BASIC with data limited to six digits, but such limitation may affect slightly to an extent which is normally negligible.
water vapour the program storage the results
CBl The tolerances for iteration loops were tested and are set wide to ensure convergence when using six-digit data storage.
CCJ The input data contains usual information for the design conditions and the averaged test results, as listed in lines 36-138. The 'n' value for the fill characteristics also needs to be input: K~V/L=C•CL/GJAn.
REM (D) For altitudes from 0 to 300 m above sea level the program REM evaluates results at ambient pressure equal to that at sea level, REM in accordance with BS 4485: Part 3. For altitudes over 300 m REM above sea level the calculations are made at reduced ambient REM air pressure corresponding to the design altitude. REN HEN
<Reference: BS 2520, Barometer conventions and tables).
7046 REM CE> Four examples of output are appended for information. 7048 RHl 7050 7052 7054 7056 7058 7060 7062 7064 7066 7068 7070 7072 7074 7076 7078 7080
REI'l REN REI'l REM REM REM REN REI'! REI'! REN REI'l REM REM REM RH1 REM
<F> An error condition occurs if the limits of this BS Test Code are exceeded, or if there is no convergence after 50 iterations. In such cases the flow of calculations stops and partial output is printed, which contains input data and results calculated prior to the occurence of this error. Noughts are displayed for the remaining data. This may help to trace the problem. Several diagnostic messages may appear in the output to warn the user of possible input data errors, or some unspecified abnormality which prevents the completion of calculations.
(G) The program may need adjustments to suit user's operating system, or the type of BASIC in use. An output file may be written by simple modification of the subroutine 4000.
****** End of program P4485 Rev. 6 Date: 30 January 1987 ******
24
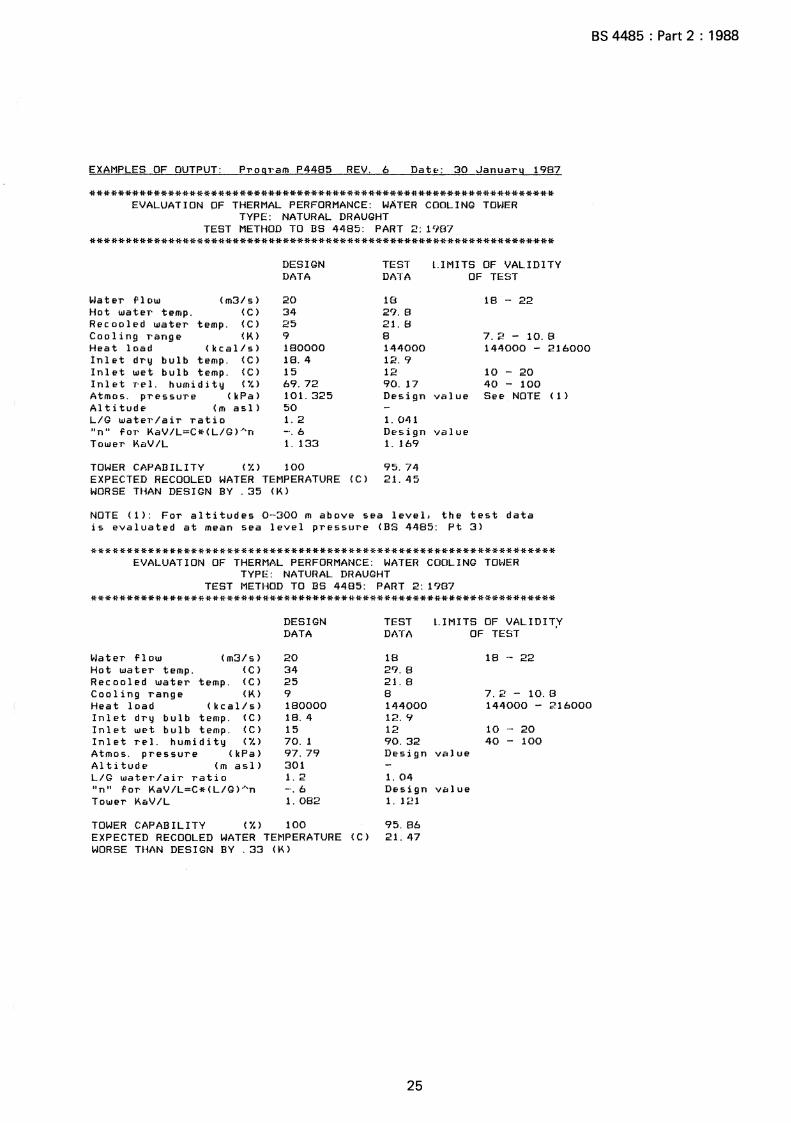
EXAMPLES OF OUTPUT: Program P4485 REV. 6 Dat~: 30 January 1987
***************************************************************** EVALUATION OF THERMAL PERFORMANCE: WATER COOLING TOitiER
TYPE: NATURAL DRAUGHT TEST METHOD TO BS 4485: PART 2: 1987
*****************************************************************
DESIGN TEST l.Ii'IITS OF VALIDITY DATA DATA OF TEST
~later !'low <m3/s) 20 18 18 - 22 Hot water temp. (c) 34 29. 8 Recooled water temp. <C> 25 21. 8 Cooling range no 9 8 7 ~. . "" - 10.8 Heat load <kcal/s) 180000 144000 144000 - 216000 Inlet dry bulb temp. (c) 18. 4 12. 9 Inlet wet bulb temp. (c) 15 12 10 - 20 Inlet r·e 1. humidity ( 'Y.) 69. 72 90. 17 40 - 100 Atmos. pressure <kPa) 101. 325 Design value See NOTE ( 1 ) Altitude (m asl) 50 LIG water/air ratio 1.2 1. 041 unu !'or KaV/L=C•(L/G)·'•n -·. 6 Design value Tower KaV/L 1. 133 1. 169
TOWER CAPABILITY ( /.) 100 95. 74 EXPECTED RECOOLED WATER TEI'IPERATURE (C) 21. 45 WORSE THAN DESIGN BY . 35 <K>
NOTE (1): For altitudes 0-300 m above sea level. the test data is evaluated at mean sea level pressure <BS 4485: Pt 3>
***************************************************************** EVALUATION OF THERMAL PERFORMANCE: WATER COOLING TOitiER
TYPE: NATURAL DRAUGHT TEST METHOD TO BS 4485: PART 2: 1~/87
*****************************************************************
DESIGN TEST LII'liTS OF VALIDIT,Y DATA DATA OF TEST
lflater !'low (m3/s) 20 18 18 - 22 Hot water temp. <C> 34 29. 8 Recooled water temp. <C> 25 21. 8 Cooling range <K> 9 8 7.2- 10.8 Heat load (kcal/s) 180000 144000 144000 - 216000 Inlet dry bulb temp. <C> 18. 4 12. 9 Inlet wet bulb temp. <C> 15 12 10 - 20 Inlet rel. humidity ( /.) 70. 1 90. 32 40 - 100 Atmos. pressure (kPa) 97. 79 Design value Altitude (m asl) 301 LIG wateT'/air ratio 1. 2 1. 04 unu for KaV /L=C• < L/G > ·''n -·. 6 Design value Tower KaV/L 1. 082 1. 121
TOWER CAPABILITY ( /.) 100 95. 86 EXPECTED RECOOLED WATER THlPERATURE <C> 21. 47 WORSE THAN DESIGN BY . 33 <K)
25
BS 4485 : Part 2 1988

BS 4485 Part 2 1988
EXAMPLES OF OUTPUT: Program P4485 REV. 6 Dat~: 30 January 1987
***************************************************************** EVALUATION OF THERMAL PERFORMANCE: WA'rER COOLING TQI.-IER
TYPE: MECHANICAL DRAUGHT TEST METHOD TO BS 4485: PART 2: 1987
*****************************************************************
DESIGN DATA
TEST DATA
L.I M ITS OF VALl D lTV OF TEST
Water flow <m3/s) Hot water temp. <C> Recooled water temp. (C) Cooling range 00 Heat load (kcal/s) Inlet wet bulb temp. (C) Fan power (kW) Atmos. pressure <kPa> Altitude <m asl) L/G water/air ratio "n" for KaV/L=C*(L/G)An Tower KaV/L
10 46 23 23 230000 18.3 240 101. 325 50 . 75 -. 6 2.89
9. ~!3 44. 2 22. 5 21. 7 200290 17. 7 20(-i Design value
. 726 Design value 2. 837
TOWER CAPABILITY (%) 100 97.04 EXPECTED RECOOLED WATER TEMPERATURE <Cl 22. 3 t-JORSE THAN DESIGN BY . 2 <K>
9 - 11
18.4- 27.6 184000 - 276000 13. 3 - 23. 3
See NOTE (1)
NOTE (1): For altitudes 0-300 m above sea leveL the test data is evaluated at mean sea level pressure <BS 4485: Pt 3)
***************************************************************** EVALUATION OF THERMAL PERFORMANCE: WATER COOLING TmJER
TYPE: MECHANICAL DRAUGHT TEST METHOD TO BS 4485: PART 2: 1987
*****************************************************************
DESIGN DATA
TEST DATA
LIMITS OF VALIDITY OF TEST
Water flow <m3/s) Hot water temp. (C) Recooled water temp. (C) Cooling range <K> Heat load <kcal/s) Inlet wet bulb temp. (C) Fan power <kW> Atmos. pressure <kPa) Altitude (m asl) L/G water/air ratio "n" for KaV/L=C*(L/G)An Tower KaV/L
10 46 23 23 230000 18. 3 240 97. 79 301 . 75 -. 6 2. 753
9.23 44. 2 22. 5 21. 7 200290 17.7 208 Design value
. 7';.!6 Design v;;,lue 2. 706
TOWER CAPABILITY (%) 100 97.04 EXPECTED RECOOLED WATER TEi1PERATURE ( C > 22. 31 WORSE THAN DESIGN BY . 19 <K>
26
9- 11
18. 4 - 27. 6 184000 - 276000 13. 3 - 23. 3

BS 4485 : Part 2 : 1988
Appendix E. Determination of test value of L/ G for natural draught towers
E.1 General
Whereas it can be assumed that for a mechanical draught tower the air flow produced by the fan(s) remains constant within the limitations detailed in 4.4 and 4.6, such is not the case with a natural draught tower.
The natural draught induced by the shell is proportional to the differences in density between the ambient air and the airwater vapour mixture leaving the packing. The operating air flow can only be determined by equating the tower draught to the tower resistance at any one set of conditions.
E.2 Determination of density difference of design conditions
Calculate the increase in total heat of air from inlet to exit of packing from the following equation.
!1h = (L/G)d X (M)d X c
In figure 2, locate point (1 d) representing inlet air wet bulb temperature and relative humidity. The intersection (2 d) of a vertical line through this point with the total heat curve gives the enthalpy value of the air inlet conditions.
Find the point (3d) on the total heat curve representing an increase in total heat equal to the calculated value of !1h. The intersection (4 d) of a vertical line through (3d) with the saturated air line gives the point representing the exit air conditions. Subtraction of the densities at (1 d) and (4 d) gives the required density difference (!1p)d.
E.3 Determination of test value of G
To a convenient scale commence a plot of l::!.p versus G/Gd taking unity at the design value of G. Locate design (l::!.p)d (point (1) on figure 3) and through this point draw a section of the square law curve: l::!.p = (l::!.p)d x (G/Gd) 2 . This represents the variation with G of the overall tower resistance.
Obtain values for draught curve using figure 2, test conditions and trial values of G. The intersection of draught and resistance curves gives the test value of G and hence the test value of L/G.
Example
Parameter Design Test conditions conditions
Wet bulb temperature 15 °C 12 °C Dry bulb temperature 18.4 °C 12.9°C Relative humidity 70% 90% Cooling range 9K 8K Approach 10 K 9.8 K Design L/G 1.2 -Water loading - 90%
(a) Determine density difference at design conditions. I ncr ease in air enthalpy:
!1h = L/G x M X c = 1.2 X 9 X 4. 1868 kJ/kg = 45.217 kJ/kg
From figure 2.
Inlet air density (point 1d) = 1.2040 kg/m 3
Exit air density (point 4d) = 1.1580 kg/m 3
Thus (!1p)d = 0.0460 kg/m3
(figure 3 point (1))
27

BS 4485 : Part 2 : 1988
(b) Determine test value of G
Lt = 0.9 x Ld Cooling range = 8 K Say G; i x Gd:
0.9 Then test (L/G)t = - 1- X (L/G)d
= 0.9 X 1.2 = 1.08
Increase in air enthalpy:
b.h = (L/G)t X b. t X c = 1.08 X 8 X 4.1868 kJ/kg = 36.174 kJ/kg
From figure 2.
Inlet air density (point 1t) = 1.2275 kg/m3
Exit air density (point 4t) = 1.1772 kg/m3
Thus (b.p)t = 0.0503 kg/m 3
(figure 3 point (2))
Now say G = 1.1 X Gd:
0.9 Then (L/G)t =- X (L/G)d
1.1
0.9 =-X 1.2 =0.98
1.1
Increase in air enthalpy:
b.h = (L/G)t X b.t X c
= 0.98 X 8 X 4.1868 kJ/kg
= 32.824 kJ/kg
From figure 2 Exit p = 1.1813 kg/m3
(b.p)t = 0.0462 kg/m3 (figure 3 point (3))
Draw draught line through points (2) and (3)
Draught and resistance curves intersect at
1.0305 X Gd (figure 3 point (4))
0.9 (L/G)t =--X 1.2 = 1.048
1.0305
28

1.28 Enthalpy (kJ/kg) !
r-.... 60
" r-.... r-.... i'oo.. Design inlet air density {1dJ
I' r-... ~ r-.... ""
Design exit air density (4dl v ["'. r-.... ~"""--
Test inlet air density (1d) v ~ ~ t-o..... Test exit air density (4d) 1'. ['.. r-.... 1"""-o r-...... v
'r--.._ r-.... ........ ........ r-.... 3t(G I Gd=1.0 y 70
I I
1.27
1.26
1.24
1.23
.......... 'r-..., r-.... ..... ....... r..... 1:4. ~ 3t(G/Gd=1.1} r-... t--.... ['.. 'r-.._ r-.... I'. ~ I~
~
r-.... ........ r--... ..... r-...~ :cz: r-.... ~/ .....
1.22
....... ....... ......... ... :..r ............ /v .......... .......... 60 II II I' ['-.. ' ......... ......... r-.... /v ~ I--.. i'oo.. ' r-....
1.21
r-.... ' " ' 10~ ["'. ........ / r-... ......... i'oo.. ~10 r-.... ['-..
t-o..... l/
1.20
rn 1 19 E ...... en ~ 1.18 >-_._ Vl c 1.17 C1J
0
-- ....... ........ ' r-.... ~.
......... I'-.. v
~ '~ ......... < ........
~ ........ 50
(~plt (Aplt ........ .... ........ ......... De ....... ~0~ (G /Gd = 1.0 l (G /Gd = 1.1 l ' ......... / ......... I 0 R/f
>.... 8oo
'r---.. / ....... i'. ~R/f ......., ~
2d ~ " .............. 6oo I !'-... r......... 4t(G /lid:1.1)
/' .......... ~R/f ......... ~t(G /Gd=1.0'
~p)d "' ["'. .......
' .......... ......... 40
./ .... ~0~ ...... " v I" OR/f ......... .........
.......... r-.... ........ "-1 16 2t ./ v 1'. ........
r--..... .......... r-.... ' -../ ....... ......... ........ I"'..
1.15 v c .......... r--... 1"""-o r-.... 0 30 l/17' c -z: ~"'--t.... ["'. 0 "l:l
1.14 v _._ c ['.. / 0
"l:l u
1.13
1.12
v c 'I'. / 0 c w
.S!' ~ v .... Vl
........ ~'.... Vl C1J v c:u 0 v ..; I-
~ !.--"' 2v
./ v v 1 11 ~ v
Barometric pressure 101.325 kPa
1.10 10 5 10 12 15 20 25
\.let bulb temperature {° Cl
Figure 2. Graph for determination of density difference at design conditions
/ I
7
/ 7
I II'
t--.... / I'.. ........,4d v
~ r-...... I .........
t-o..... .......
~ 3d r-..... 1/ ......
~ ~ v
.:30
BS 4485 : Part 2 : 1988
Enthalpy
J I
J I
I J
,~/ :<?; <$ )
v
r-.... !"--
r-....
35
( kJ/ kg)
140
130
120
110
100
9D
80
70
29

30 blank

BS 4485 : Part 2 : 1988
0.052
/ 0.050
0.048
0.0503 (6p)t(2) / .......
['-.... ~) r-...... 1/ r"['....
~~f / "" 0.046 E ...... Ol
0.0460 v 0.0462 -......... r---... (6p)
v(6p)d(1) .:.:.
Cl.. 0.044 <]
/ /
0.042 <-e. / v
-~/ ~,~
;/ / v v
0.9 0.95 1.03 1.05 1.1
Figure 3. Determination of relation between Gd and Gt for natural draught cooling towers
31

BS 4485 : Part 2 : 1988
Appendix F. Example of determination of cooling tower capability from calculation of KaV/Lvalue
Using the L/G value obtained in the example given in appendix E, the value of Ka VI L is determined as follows:
given ti = 29.8 °C
t 2 =21.8°C
tw 8 =12°C
L/G = 1.048
From enthalpy table at tws 12 °C:
hi = 34.1 kJikg (inlet air hi)
h 2 =hi + L/G (ti - t 2 ) c
= 34.1 + 1.048 (29.8- 21.8) X 4.1868 kJikg
= 69.2 kJikg
Using the method given in C.5 and the data listed in table 5 the following is obtained:
tz = 21.8 hi = 34.1
tz + 0.1 (ti - t 2 ) = 22.6 66.7 hi + 0.1c L/G (t 1 - t2 ) = 37.6 29.1 0.0344
t 2 + 0.4 (tJ- t 2 ) = 25.0 76.3 h 1 + 0.4c L/G (t 1 - t 2 ) = 48.1 28.2 0.0355
t 1 - 0.4 (t 1 - t 2 ) = 26.6 83.2 h 2 - 0.4c L/G (ti - t 2 ) = 55.2 28.0 0.0357
ti - 0.1 (t 1 - t 2 ) = 29.0 94.6 h 2 - 0.1c LIG (t 1 tz) = 65.7 28.9 0.0346
t! = 29.8 hz = 69.2
Thus KaVIL is obtained by substituting these values in the formula:
KaVIL = ---X + + + { t 1 - t 2 ( 1 1 1 1 ) } 4 (hL- hG)i (hL hG)2 (hL- hG)3 (hL- hG)4
(29.8- 21.8) KaVIL = X (0.0344 + 0.0355 + 0.0357 + 0.0346) X 4.1868
4
= 1.17
X c
From figure 4: a curve drawn through the point Ka VI L = 1.17 at L/G = 1.048 parallel to manufacturer's characteristic curve intersects the 10 K approach curve at an L/G of 1.155.
The tower capability is therefore:
1.155 -- X 100 = 96.25%
1.2
i.e. the tower is capable of cooling 96.25% of the design inlet flow at design approach, range and inlet air conditions. The accuracy of the various test observations should be taken into account in the interpretation of this value.
32
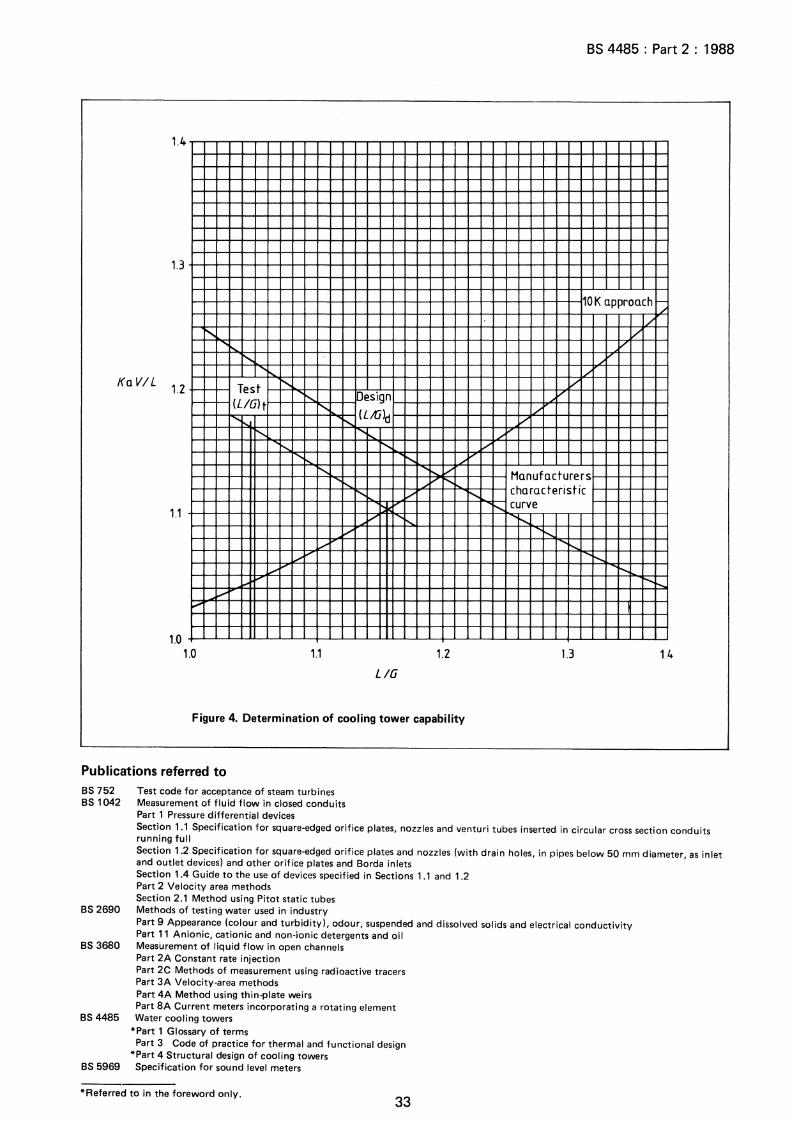
BS 4485 : Part 2 1988
13
10 K approach C lL
' ,(_ 1-'
~ /
KaVIL 1.2 Test ~ v
1-
1.1
~
1.0 1.0
1-I- !Uult
' I'
v
~ f'
~ I'
I"-
,. £::~
!.--'
1.1
Design
,...... (LAild
' I'
1"'-~
"' I' ....... /
v ~ v
1.2
L/G
Figure 4. Determination of cooling tower capability
l/ v
L
~ ,....
Manufacturers
['-. characteristic
........ curve
........ !:'-,
"' r--.. t:::::
I' t:::,
1.3
Publications referred to BS 752 BS 1042
BS 2690
BS 3680
BS 4485
BS 5969
Test code for acceptance of steam turbines Measurement of fluid flow in closed conduits Part 1 Pressure differential devices Section 1.1 Specification for square-edged orifice plates, nozzles and venturi tubes inserted in circular cross section conduits running full Section 1.2 Specification for square-edged orifice plates and nozzles (with drain holes, in pipes below 50 mm diameter, as inlet and outlet devices) and other orifice plates and Borda inlets Section 1.4 Guide to the use of devices specified in Sections 1.1 and 1.2 Part 2 Velocity area methods Section 2.1 Method using Pitot static tubes Methods of testing water used in industry Part 9 Appearance (colour and turbidity), odour, suspended and dissolved solids and electrical conductivity Part 11 Anionic, cationic and non-ionic detergents and oil Measurement of liquid flow in open channels Part 2A Constant rate injection Part 2C Methods of measurement using radioactive tracers Part 3A Velocity-area methods Part 4A Method using thin-plate weirs Part 8A Current meters incorporating a rotating element Water cooling towers
*Part 1 Glossary of terms Part 3 Code of practice for thermal and functional design
*Part 4 Structural design of cooling towers Specification for sound level meters
*Referred to in the foreword only. 33

This British Standard, having been prepared under the direction of the Civil Engineering and Building Structures Standards Committee, was published under the authority of the Board of BSI and comes in to effect on 30 September 1988.
© British Standards Institution, 1988
First published August 1969 First revis,on September 1988
ISBN 0 580 16168 4
The following BSI references relate to the work on this standard: Committee reference CSB/23 Draft for comment 85/15355 DC
British Standards Institution. Incorporated by Royal Charter, BSI is the independent national body for the preparation of British Standards. It is the UK member of the International Organization for Standardization and UK sponsor of the British National Committee of the International Electrotechnical Commission.
In addition to the preparation and promulgation of standards, BSI offers specialist services including the provision of information through the BSI Library and Standardline Database; Technical Help to Exporters; and other services. Advice can be obtained from the Enquiry Section, BSI, Milton Keynes MK14 6LE, telephone 0908 221166, telex 825777.
Copyright. Users of British Standards are reminded that copyright subsists in all BSI publications. No part of this publication may be reproduced in any form without the prior permission in writing of
Committees responsible for this British Standard
The preparation of this British Standard was entrusted by the Civil Engineering and Building Structures Standards Committee (CSB/·) to Technical Committee CSB/23, upon which the following bodies were represented:
Association of Consulting Engineers British Effluent and Water Association British Gear Association Chartered Institution of Building Services Engineers Concrete Society
Amendments issued since publication
Amd. No. Date of issue Text affected
8809 -8-1.8k-B JWD
BS 4485 ·Part 2 · 1988
BSI. This does not preclude the free use, in the course of implementing the standard, of necessary details such as symbols and size, type or grade designations. Enquiries should be addressed to the Publications Manager, BSI, Linford Wood, Milton Keynes MK14 6LE. The number for telephone enquiries is 0908 220022 and for telex 825777.
Contract requirements. A British Standard does not purport to include all the necessary provisions of a contract. Users of British Standards are responsible for their correct application.
Revision of British Standards. British Standards are revised, when necessary, by the issue either of amendments or of revised editions. It is important that users of British Standards should ascertain that they are in possession of the latest amendments or editions.
Automatic updating service. BSI provides an economic, individual and automatic standards updating service called PLUS. Details are available from BSI Enquiry Section at Milton Keynes, telephone 0908 221166, telex 825777.
Information on all BSI publications is in the BSI Catalogue, supplemented each month by BSI News which is available to subscribing members of BSI and gives details of new publications, revisions, amendments and withdrawn standards. Any person who, when making use of a British Standard, encounters an inaccuracy or ambiguity, is requested to notify BSI without delay in order that the matter may be investigated and appropriate action taken.
Electricity Supply Industry in England and Wales Engineering Employer's Federation Engineering Equipment and Materials Users' Association Health and Safety Executive Hevac Association Industrial Water Society Institution of Chemical Engineers Institution of Structural Engineers Process Plant Association
CSB/23
c.o (X) (X)