water demand assessment for the juba and shabelle … 22 water demand assess… · i. project...
TRANSCRIPT

i
Project Report No W-22 February 2013
Water Demand Assessment for the Juba and Shabelle Rivers
Somalia Water and Land Information Management Ngecha Road, Lake View. P.O Box 30470-00100, Nairobi, Kenya.
Tel +254 020 4000300 - Fax +254 020 4000333, Email: [email protected] Website: http//www.faoswalim.org
Funded by the European Union and implemented by the Food and Agriculture Organization of the United Nations

ii
Disclaimer
The designations employed and the presentation of material in this information product do not imply the expression of any opinion whatsoever on the part of the Food and Agriculture Organization of the United Nations and the SWALIM Project concerning the legal status of any country, territory, city or area of its authorities, or concerning the delimitation of its frontiers or boundaries. This document is prepared by SWALIM consultant with contributions from the SWALIM team below: Flavian Muthusi, Hydrologist Peris Muchiri, Hydrometeorologist
The document should be cited as follows: Petersen, G., and Gadain, H.M., (2012) Water Demand Assessment for the Juba and Shabelle Rivers. Technical Report No W-22, FAO-SWALIM (GCP/SOM/049/EC) Project, Nairobi, Kenya

Executive Summary
iii
Executive Summary The Somalia Water and Land Information Management (SWALIM) aims to generate up-to-date information on aspects of water and land resources management and development in the country. This report aims to provide a comprehensive overview on water demands in the Juba and Shabelle River basins. The assessment is based on precedent publications, field consultations with key informants as well as recent data not covered by any of the previous reports. This report aims to assist decision makers, donors and investors committed to a sustainable and holistic development in the basin. The specific objectives of this report are:
• To estimate past, present and future water demands for the Juba and the Shabelle River basins
• To set the demands into relation with the available supplies, considering the impact of climate change and upstream development in Ethiopia
• To reveal data gaps or mismatches and provide recommendations for further research
The results of this study feed into the FAO AQUASTAT data for Somalia. Introduction The Juba and Shabelle rivers are the only perennial streams in Somalia. They originate in Ethiopia, where over 90 percent of the stream flow is generated. The two river basins cover an area 174,600 km2 within Somalia. Basic monitoring of the two rivers and their basins has been ongoing in the previous SWALIM projects, laying a good foundation for more developed, continuous river monitoring and data processing (automatic weather stations, continuous discharge measurements, sediment and water quality monitoring together with pilot land degradation monitoring systems). The Juba and Shabelle basins are also called the ‘breadbasket’ of Somalia: It is the centre of agricultural and livestock production and home to the majority of the Somali population. Surface Water (River Flow) The Juba and Shabelle rivers have an average annual stream flow of 5.9 BCM and 2.4 BCM respectively, as measured by gauging stations at Luuq and Beled Weyne, both located near the Somali-Ethiopian border. Historic records reveal high intra- and inter-annual variations in river flows. These are projected to increase as a consequence of climate change, altering the rainfall patterns in the Ethiopian highlands. Upstream developments in Ethiopia are projected to decrease and heavily regulate the river flows: Major dam and irrigation projects are envisioned by the Ethiopian Ministry of Water

Executive Summary
iv
Resources, reducing the stream flows by 20 – 100 %. There is a data mismatch between Ethiopian and Somali reports concerning the available stream flows. This mismatch is responsible for different perceptions and growth scenarios on both sides and will be an obstacle for cooperative efforts. The following table summarizes the planned upstream developments for the two river basins respectively, indicating the remaining river flow at the different stages of development. The amounts refer to the stream flows at the Somali-Ethiopian Border according to the Ethiopian Ministry of Water Resources. Stage of Development Juba River QRemaining Shabelle River QRemaining Baseline (2005) 6.75 BCM 3.9 BCM 2010 NA 2.6 BCM 2022 5.99 BCM NA 2035 NA 0.75 BCM 2037 5.57 BCM NA Groundwater There is no comprehensive data available on groundwater occurrence, groundwater abstractions or respective safe yields in the Juba and Shabelle basins. Also the mechanisms of groundwater recharge are not known, but infiltrations associated to the river flows are considered the main component of inflows. There are rough maps estimating zones of high groundwater potential. Together with local population densities these provide an indication for quantity and quality of groundwater resources. To obtain more information regarding the local groundwater resources seems to be a priority action for the near future considering the projected reduction in surface water availability. Rainwater Harvesting Harvesting rainwater for domestic or livestock use is partially used as an alternative water source to groundwater or river water. No data is available on the current extent of use nor its potential. Access to Water Besides the available quantities and qualities, the technical and communal access are important aspects regulating how and to what extent the different water demands are satisfied: In agriculture, recession cultivation and field irrigation though canals are the central techniques. Only the latter is an active diversion of river water and hence the water demands of irrigated agriculture refer exclusively to this irrigation method. Groundwater is accessed via boreholes, shallow wells, springs and infiltration galleries. Water supply in the cities is happening partly via piped supply, water tankers and public standpoints but also donkey carts are a common means of delivery. While in the cities,

Executive Summary
v
access to water is dominated by market mechanisms, communal arrangements are responsible for water distribution in the rural context, with village elders ruling and settling conflicts. The water distribution for irrigation is also done communally, whether by elders or by so called water user associations. Agricultural Water Demands Agriculture in the two basins is estimated to currently abstract 715 MCM of river water. Despite the lower flow volume of the Shabelle River, greater amounts are abstracted from it (550 MCM). This is due to the existent extent of infrastructure as well as favourable soil properties that facilitate agricultural utilization. Under a medium growth scenario, agricultural demands are projected to increase to 1155 MCM in the two basins: 275 MCM along the Juba River and 880 MCM along the Shabelle River. Under a high growth scenario, the basin-wide agricultural demands have been estimated as 2,915 MCM. The greatest development is projected to take place in the Shabelle basin. Domestic Water Demands The current population in the basin is estimated as 4.848 million, 62 % rural and 38 % urban. If a water consumption of 20 litre/ day for the rural and 50 litre / day for the urban population is assumed, the total current water demands amount to about 52.2 MCM annually. Interestingly, already in current conditions the urban population consumes 60 % of the domestic water use while the rural population is associated to 40 % of it. With a population growth of 2.7 %, the population would increase to 10 million by 2035. Considering the trend of urbanization, the total domestic water consumption in the year 2035 would amount to about 130 MCM. Livestock Water Demands Based on pre-war figures by the Ministry of Agriculture (1988) the annual livestock consumption in the basin was 41.6 MCM. No data could be obtained on current livestock numbers in the basin. Nationwide, the number of grazing animals reduced from 42 million in 1988 to currently about 38 million. The drop may be associated to local resource conflicts, trade restrictions and socio-economic trends such as urbanization. It must be investigated if the decline also took place in the Juba and Shabelle basins. Environmental Water Demands In order to maintain the ecological services as well as the natural channel habitat associated to the historic flow regimes of the Juba and Shabelle Rivers, a certain reserve flow has to be maintained. Information did not suffice to conduct an Environmental Flow Analysis with the purpose of determining the exact environmental water needs. For

Executive Summary
vi
the sake of not neglecting this stake, an arbitrary reserve flow of 10 % was chosen, corresponding to annual environmental demands of 0.315 – 1.07 BCM for the Juba and of 0.128-0.473 BCM for the Shabelle River. Analysis of Findings and Conclusions Considering the projected increase in water consumption in both Ethiopia and Somalia for the Juba and Shabelle River basins, significant impacts of these developments have to be expected. Impacts on river flows are different for the Juba and the Shabelle basins due to different projected upstream developments, but will, in combination with population growth and potentially climate change, lead to a significant reduction in water resource availability. Agriculture is the greatest anthropogenic water use in the Juba and Shabelle basins. Despite its smaller flow volumes, the Shabelle River, in comparison to the Juba River, experiences greater water demands within Somalia and also a greater upstream development. Currently, about 35 % of its annual river flow is abstracted, while there is a water deficit during dry seasons. A medium (year 2035) and a high (year 2055) growth scenario for the Juba and Shabelle basin explore the impact of potential future upstream developments and growing water demands within the country. While the demands in the Juba basin make up about 20 % of annual river flows, demands in the Shabelle basin surpass available supplies under the medium and high growth assumptions. The results are summarized in the table below. The high deficits in the Shabelle basin are partly attributable to a data mismatch on stream flows between Ethiopia and Somalia. The mismatch has to be resolved, laying common ground for an integrated planning procedure in the river basin.
Scenario Juba Basin Shabelle Basin Demands1 Remaining
Flow Demands Remaining
Flow Current 801 MCM 5099 MCM 836 MCM 1564 MCM Dry Season 266 MCM 422 MCM 246 MCM -12 MCM Medium Growth 972 MCM 4168 MCM 1227 MCM -127 MCM Dry Season 319 MCM 751 MCM 340 MCM -50 MCM High Growth 1025 MCM 3695 MCM 2765 MCM -3515 MCM Dry Season 337 MCM 900 MCM 737 MCM -934 MCM
1 Demands within Somalia: Agriculture, Domestic, Livestock and Environmental

Abbreviations
vii
Abbreviations AQUASTAT FAO Information System on Water and Agriculture EC European Commission EFA Environmental Flow Analysis EU European Union FAO (UN) Food and Agriculture Organization FEWS Famine Early Warning System FSNAU Food Security and Nutrition Analysis Unit (Somalia) HLC High Level Conference HPP Hydroelectric Power Plant IPCC Intergovernmental Panel on Climate Change IUCN International Union for the Conservation of Nature l/c/d Litre Per Capita per Day LVBC Lake Victoria Basin Commission MoA Ministry of Agriculture MoNP Ministry of National Planning MoWR Ministry of Water Resources PPP Public Private Partnership RWH Rain Water Harvesting SWALIM Somalia Water and Land Information Management SWIMS Somali Water Sources Information Management System UCSB University of California Santa Barbara UNDP United Nations Development Programme UNEP United Nations Environmental Programme UNICEF United Nations Children’s Fund WB World Bank WUA Water User Association

Table of Contents
viii
Table of Contents Executive Summary ......................................................................................................... iii Abbreviations .................................................................................................................. vii Table of Contents ........................................................................................................... viii List of Figures ................................................................................................................... ix List of Tables...................................................................................................................... x Chapter 1. Introduction ...................................................................................................... 1 Chapter 2. Literature Review ............................................................................................. 3 Chapter 3. Data Description and Methodology.................................................................. 6 Chapter 4. Available Water Resources and Water Supply ................................................ 9
4.1. Surface Water (River Flow) .................................................................................... 9 4.2. Groundwater .......................................................................................................... 11 4.3. Access to Water..................................................................................................... 13 4.4. Rainwater Harvesting: An Alternative Supply ..................................................... 18 4.5. The Impact of Climate Change ............................................................................. 19 4.6. The Impact of Upstream Developments ............................................................... 24
Chapter 5. Water Demand Analysis ................................................................................. 30 5.1. Sectoral Water Demands ....................................................................................... 30
5.1.1. Agricultural Demand ...................................................................................... 31 5.1.2. Domestic Demand .......................................................................................... 43 5.1.3. Livestock Demand ......................................................................................... 50 5.1.4. Environmental Demand ................................................................................. 55
Chapter 6. Analysis of Findings ....................................................................................... 57 Chapter 7. Conclusions and Recommendations for Future Work.................................... 75 References ........................................................................................................................ 78

List of Figures
ix
List of Figures Figure 1: Map of the Juba and Shabelle River basins ......................................................... 1 Figure 2: Mean annual river flows of Juba (at Luuq) and Shabelle (at Beled Weyne) ..... 10 Figure 3: Long-term monthly flows in m³/s for different stations at the Juba and Shabelle River .................................................................................................................................. 11 Figure 4: Map of potential groundwater zones in Southern Central Somalia ................... 12 Figure 5: Number of water source types for different user groups ................................... 16 Figure 6: Runoff in the Juba and Shabelle basin............................................................... 20 Figure 7: Temperature trends between 1960 and 2009 ..................................................... 21 Figure 8: Annual maximum discharge (m³/s) between 1951 and 1990 ............................ 22 Figure 9: Spatial patterns of projected change in monthly precipitation for 10-year periods in the future under the SRES A2 scenario. ........................................................... 24 Figure 10: Map of existing irrigation schemes in the Ethiopian river basins ................... 25 Figure 11: Monthly river flows (m³/s) into Somalia if development plans were implemented ...................................................................................................................... 26 Figure 12: Development of water demands in the Ethiopian Juba basin .......................... 28 Figure 13: Shares of agricultural production types (% of hectares) in Southern Somalia 32 Figure 14: Boundaries of GIS map on land use ................................................................ 33 Figure 15: Map of cultivable areas in Southern Central Somalia ..................................... 34 Figure 16: Monthly crop water demands at Jilib and Jowhar (m³/ha) .............................. 36 Figure 17: Food security situation in 2011 ....................................................................... 38 Figure 18: Middle Shabelle – cereal production in million tons (MT) ............................. 39 Figure 19: Monthly Juba River flows vs. agricultural water demands (MCM) ................ 39 Figure 20: Monthly Shabelle River flows vs. agricultural water demands (MCM) ......... 40 Figure 21: Percentage (agricultural demand / river flow) ................................................. 40 Figure 22: Map on soil suitability for growing maize ...................................................... 42 Figure 23: Urbanization trend in Southern Central Somalia ............................................. 45 Figure 24: Settlements in the southern central river basin ................................................ 47 Figure 25: Population density in the Juba and Shabelle basin .......................................... 48 Figure 26: Projected population growth and domestic water demand .............................. 49 Figure 27: Land use in the Juba and Shabelle riverine areas ............................................ 52 Figure 28: Livestock movements across the region .......................................................... 53 Figure 29: Suitability of lands for extensive grazing ........................................................ 54

List of Tables
x
List of Tables Table 1: List of key literature according to the year of publication .................................... 3 Table 2: Types of access to groundwater .......................................................................... 14 Table 3: Types of commercial domestic water delivery ................................................... 16 Table 4: Annual Shabelle flow into Somalia if development plans were implemented ... 26 Table 5: Development of sectoral water demands in the Ethiopian Shabelle basin ......... 27 Table 6: Annual Juba River flow at border if development plans were implemented ...... 28 Table 7: Areas under irrigation (ha) .................................................................................. 35 Table 8: Annual agricultural water demands along the Juba and Shabelle River ............. 36 Table 9: Future development scenarios for the water demand ......................................... 41 Table 10: Population numbers in the basin and associated water demands ...................... 45 Table 11: Projections of population growth and domestic water demands ...................... 48 Table 12: Livestock water demand in Southern Central Somalia in 1988 ........................ 51

Introduction
1
Chapter 1. Introduction Somalia is located at the Horn of Africa, covering an area of 637,600 km². It is bordered by Ethiopia to the West, Djibouti to the northwest, the Gulf of Aden to the north, the Indian Ocean to the east and Kenya to the southwest. The Juba and Shabelle River basins are located in Southern Somalia (Figure 1). It is also called the ‘breadbasket’ of the country (Basnyat, 2007) as it is the centre of agricultural and livestock production and home to a majority of the Somali population (EC, 2004).
Figure 1: Map of the Juba and Shabelle River basins
Due to highly irregular rainfalls, infrastructural breakdowns and the collapse of the national administration as a consequence of civil war, Somalia has been struck by
Introduction
2
droughts and famines during the last decades. Political institutions are still weak and the rehabilitation of infrastructure particularly in the agricultural sector has just begun. Water availability to people, livestock and for agricultural use constitutes the basis of people’s livelihoods and is a prime constraint for regional development (Gadain and Mugo, 2009). Although the basin evinces the greatest freshwater resources in Somalia, it is hydrologically water deficient and there are seasonal gaps with low river flows (IUCN, 2006; Muthusi, Mahamoud, Abdalle and Gadain 2007; Basnyat 2007). Moreover, the local accessibility to water is restricted mainly due to political instability, deteriorated or lacking infrastructure as well as lacking means to deal with flood variability (IUCN, 2006; Muthusi, Mahamoud, Abdalle and Gadain 2007; Basnyat 2007). Also the water quality is often problematic (Basnyat, 2007). As far as possible, water users have adapted their demands, but the current resource management seems highly fragmented and inefficient (Basnyat, 2007). Demographic and economic trends as well as climate change and upstream developments are likely to further strain the current system of demand and supply. The Juba and Shabelle Rivers feed associated groundwater aquifers (Basnyat, 2007) and hence most of south-central Somalia is directly or indirectly dependent on this source of water. Information on the water demand development constitutes the basis for future policy recommendations, to responsibly and strategically draw scenarios for an optimal water use and to detect respective conflict potentials. The study at hand provides an overview on regional water demands in the context of the local water availability. It provides an analysis of the current situation as well as future supply and demand scenarios based on different assumptions regarding population growth, climate change and upstream developments.

Literature Review
3
Chapter 2. Literature Review A variety of relevant publications has been used for this study: The report series by FAO SWALIM constituted the main body of information, providing data on river flows (Basnyat, 2007; Basnyat and Gadain 2009), groundwater availability (Muthusi, Mahamud, Abdalle and Gadain, 2007), rainwater harvesting (Odour and Gadain, 2007) and a basic overview of water demands within the Somali river basin (Basnyat, 2007). Information in groundwater use was importantly complemented by a publication of Faillace and Faillace (1987) which still provides the most extensive account of potential groundwater occurrences. The UNDP (2008) was the main provider of information on climate change. However, Arnell (1999) and Funk, Michaelsen and Marshall (2010) provided partially even more accurate details on climate trends in the basin. Concerning upstream developments, information is mainly based on governmental reports from the Ethiopian Ministry of Water Resources. The following table lists the central references for this assessment according to their year of publication. It provides the year of publishing, relevant thematic information as well as the author. It demonstrates that substantial efforts are done in terms of publications, but data is still fragmentary and information available is partially outdated. More details on the data availability and reliability are provided in Section 3. Table 1: List of key literature according to the year of publication
Year Topic Author 2012 Improved Drinking Water Sources WHO UNICEF 2012 Cultivable Area Somalia Oduori, Oroda, Gadain and
Rembold 2011 Mapping recent decadal climate
variations Funk, Michaelsen and Marshall (UCSB)
2011 Hydrometric Network Analysis to Assess Juba and Shabelle River Flows
Houghton-Carr, Print, Fry, Gadain and Muchiri, 2011
2010 Atlas of the Juba and Shabelle Rivers in Somalia
FAO – SWALIM
2010 African Water Atlas UNEP 2009 Land degradation FAO – SWALIM 2009 Atlas of Somali Water and Land
Resources FAO – SWALIM
2009 River Flows, Flood Hydrology, Irrigation Water Availability and Cropping Cycles
Basnyat and Gadain
2009 Climate: Rainfall, Temperature ... Mutua and Zoltan

Literature Review
4
2009 Water Sources and Access Points Muthusi, Mugo and Gadain 2009 Water Sources and Supply; Quality;
Rural/Urban; Drought; Improvements 2005-2009
Gadain and Mugo
2008 Trends and spatial distribution of annual and seasonal rainfall in Ethiopia.
Cheung, Senay and Singh
2008 National Investment Brief High-Level Conference on: Water for Agriculture and Energy in Africa: the Challenges of Climate Change Sirte, Libya
2008 Land Rights UN-HABITAT 2008 Ethiopia: Climate Change Country
Profile UNDP
2007 Water Resources of Somalia: Supply and Demand in Southern Central Somalia
Basnyat
2007a Climate Muchiri 2007b Hydrometereological Data Muchiri 2007 Medium and Large Irrigation Schemes Mbara, Gadain and Muthusi
2007 Rural Water Supply, Access and
Management Muthusi, Mahmoud, Abdalle and Gadain
2007 Rain Water Harvesting (RWH) Odour and Gadain 2007 Land cover and use Monaci, Downie and
Oduori 2007b Land use in the Juba and Shabelle Basin Oduori, Vargas and Alim 2007 Soil Types and Suitability in the Juba
and Shabelle Basin Vargas, Omuto and Alim
2007 Land suitability in the Juba and Shabelle Basin
Venema and Vargas
2007 Land Resources of Somalia Venema
2007 Ethiopia: Genale-Dawa River Basin Development Master Plan: GIS and Databases
Ministry of Water Resources Ethiopia
2006 Pastoral Resource Management in Kenya, Somalia and Ethiopia
FAO
2006 Environmental Profile Somalia IUCN 2006 Ethiopia: Genale-Dawa River Basin
Development Master Plan: Final Report. Part 1
Ministry of Water Resources Ethiopia

Literature Review
5
2005 State of the Environment UNEP 2005 Ethiopia: Wabi Shabelle Development
Plan. Phase 3. Master Plan. Main Report
Ministry of Water Resources Ethiopia
2005b Ethiopia: Wabi Shabelle Development Plan. Phase 3. Volume 3. Water Allocation and Utilization
Ministry of Water Resources Ethiopia
2004 Rural Water and Sanitation Interventions
EC
2004 Livestock Sector Strategy FAO, WB, EU 2004 Large Scale Irrigation in Juba and
Shabelle (Banana Sector Study) FAO / EC
2004 Ethiopia: Wabi Shabelle Development Plan. Phase 2. Survey & Analysis. Development Strategy and Scenarios.
Ministry of Water Resources Ethiopia
2004b Ethiopia: Wabi Shabelle Development Plan. Phase 2. Section 2. Part 4. Irrigation and Drainage
Ministry of Water Resources Ethiopia
2004c Ethiopia: Wabi Shabelle Development Plan. Phase 2. Volume 5. Water Supply & Sanitation
Ministry of Water Resources Ethiopia
2002 Socio Economic Survey 2002 UNDP, WB 1999 Climate Change and Global Water
Resources Arnell
1986 Agricultural and Water Surveys FAO

Data Description and Methodology
6
Chapter 3. Data Description and Methodology For this study, data has been taken partly from the literature, briefly presented in Section 2, and partly from data bases, mainly the ones of FAO SWALIM and the UNDP Climate Change Country Profile datasets. Relevant data was selected based on its reliability, its robustness and its immediacy. In Somalia, due to decades of conflicts and the lack of governmental control, statistics tend to be fragmentary, unreliable or non-existent (UNEP, 2005). Despite greatest efforts to collect and verify data by triangulation, any statistics and conclusion derived from these must be treated with caution. Concerning the different topics, the data situation looks as follows: River Flows: Basnyat and Gadain (2009) referred to average flow values derived from measurements by governmental gauging stations along the Juba and Shabelle. FAO SWALIM (2012) compiled and published recent time series of measured river flows and hence this data was used to portray inter-annual variations. Basnyat and Gadain (2009) also presented a chart illustrating monthly river flows based on gauged values, although such data was not available for all years and months. If data on the monthly level was incomplete it was excluded from the data set and hence their data only covers pre-war statistics. Groundwater: Faillace and Faillace (1987) determined potential groundwater zones in South Central Somalia based on measurements of borehole depths, but there is no robust data available on the nature, thickness, safe yield or extension of the associated aquifers. Muthusi et al. (2007) and Basnyat (2007) provided further information on groundwater occurrence, depths and their water quality in particular locations of the basin, providing an impression of current groundwater availability. Rainwater Harvesting: Odour and Gadain (2007) provided data on regional rainfall and on various types of rainwater harvesting (RWH). Rainwater is an alternative water supply and may substitute some of the water demands from the rivers. However, there is no information available to locate and estimate the current use of RWH techniques or the potential of these in the basin. The calculation of RWH potential requires knowledge on rainfalls (which is available), information about the rooftop surface of the sedentary parts of the population (estimates could be made), on geological circumstances for reservoirs or ponds (maps are available) and on the socio-economic costs generally associated to the establishment of simple harvesting systems (no information available). The implementation of such an analysis is beyond the scope of this study, but the level of existing and required information seems encouraging. Climate Change: The central data on climate change was taken from the UNDP Climate Change Country Profile (2008) for Ethiopia, which also covers large parts of

Data Description and Methodology
7
Somalia. The data is not catchment-specific, but available in raster units of 1.5x1.5°. The data was used by choosing the most suitable (central) unit and assuming some validity of it for the entire basin. Cheung, Senay and Singh (2008) reported rainfall trends for the Ethiopian parts of the Juba and Shabelle catchment. Their analysis however, revealed a low correlation coefficient, suggesting that their level of aggregation was probably too rigid to capture the prevailing dynamics of local rainfall patterns. The significance of their findings also depends on the representativeness of the gauging stations chosen for the catchment. Funk, Michaeles and Marshall (2011) provided valuable input concerning past rainfall trends in the region. They used an interpolation approach combining long-term satellite observations with station data (by the Ethiopian National Meteorological Agency, CRA, the GHCN archive and FAOCLIM data) and topographic field grids, merging a moving window regression with geostatistical interpolation. Overall, they used records of 1,339 rainfall stations and 178 temperature stations, illustrating trends for rainfalls between 1960 and 2009. Upstream Developments: The information on upstream developments in Ethiopia were almost exclusively taken from governmental reports, specifically from the Ministry of Water Resources in Ethiopia (2004, 2004b, 2005, 2005b, 2006, 2007). These reports set time horizons that envisioned the completion of first infrastructural projects by 2010. Online research could not confirm the implementation according to governmental planning and in fact, a 2010 publication by the IMWI reports on respective constraints. The projections are hence based on speculations grounded in the actual governmental planning. Agricultural Demands: The most important data input for estimates concerning agricultural demands is based on Basnyat (2007), who combined pre-war data on irrigation by the Ministry of Agriculture (MoA) with current information on land use, land suitability (SWALIM SOMALES data) and crop water demands. He used the FAO CROPWAT software to determine the latter for two key locations along the Juba and the Shabelle River. His publication also allowed to compare water availability with water demands in order to determine shortages. Estimates of future demands have also been based on Basnyat’s elaborations, but have been complemented by publications of the EC (2004; on rehabilitation plans of large irrigation schemes, feasibility study), the UNDP (2011; on food shortages and the need to increase agricultural production) as well as Venema and Vargas (2007; revealing the limits of production). Domestic Demands: Present domestic water demands are based on 2005 UNDP population estimates and per capita water requirements as used by Basnyat (2007), whose assumptions are in line with other international publications (e.g. WHO, 2010; Gleick, 1996). Historic records of the Ministry of National Planning (1988) were referred to by Basnyat (2007), but in his publication only the shares of the urban and rural population were provided, no total population numbers per region, causing a data gap concerning historic water demands in the basin. The projections of future domestic demands are based on population growth estimates by UN Data (2012). Furthermore,

Data Description and Methodology
8
information of the EC (2004) report was used to elaborate on the local water availability. For the EC report, field work as well as local stakeholder workshops were conducted. The publication by Muthusi, Mahamud, Abdalle and Gadain (2007) also contributed valuable information on domestic water use and groundwater quality. Their data is also based on field visits, key informant interviews, the SWIMS national database as well as UNICEF/WHO (1999) surveys on water quality at strategic access points. The SWIMS stores and manages data about water sources in Somalia, e.g. on boreholes, shallow wells, springs, dams etc. as well as the interventions associated to these. The study by Gadain and Mugo (2009) on the status of UNICEF water interventions was important too, contributing further details on water availability, quality and use. They used the UNICEF and SWALIM database as well as field surveys and the SWIMS software. Livestock Demands: Only data by the MoA from the pre-war period (1988) was available, cited by Basnyat (2007). The same ‘per head water consumption’ was referred to by the EC (2004) as well as by Basnyat (2007). Together these numbers formed the basis of calculation. The FAO (FAO/WB/EU, 2004) provided recent estimates on livestock numbers. Environmental Demands: Insufficient information was available to make sound estimates on the environmental water demands in the basin. However, for the sake of not neglecting this stake, a case study from Kenya/Tanzania (LVBC, 2010) was consulted to provide an input for a conservative estimate. Required information concerns the aquatic and riparian ecology, water quality, hydraulics, hydrology and geomorphology. An expert workshop should be conducted and software such as the SPATSIM used, in order to generate better estimates. Required inputs and resulting benefits seem encouraging.
Available Water Resources and Water Supply
9
Chapter 4. Available Water Resources and Water Supply The Juba and Shabelle Rivers are the greatest and the only perennial streams within Somalia (IUCN, 2006). The catchment areas cover 220,872 km² and 296,972 km² respectively (Mutua and Zoltan, 2009), most of these (>60%) are located upstream in Ethiopia (Basnyat and Gadain, 2009), where also most of the river flow is generated (Mutua and Zoltan, 2009). The rivers feed associated groundwater aquifers in the region and together these water sources sustain the extended agricultural as well as pastoralist activities, livestock, ecosystems and local settlements (Basnyat, 2007). According to Muthusi et al. (2007) the Juba and Shabelle Rivers, if well-utilized, can provide most, if not all, water requirements in the basin. Due to the limited access and inefficient use, water availability is often far beyond its potential and especially the pastoralist population prioritizes water quantity over quality (Basnyat, 2007; EC, 2004). The following subsections elaborate on the water availability in the basin, in terms of quantity, quality as well as social and technical access to surface and groundwater.
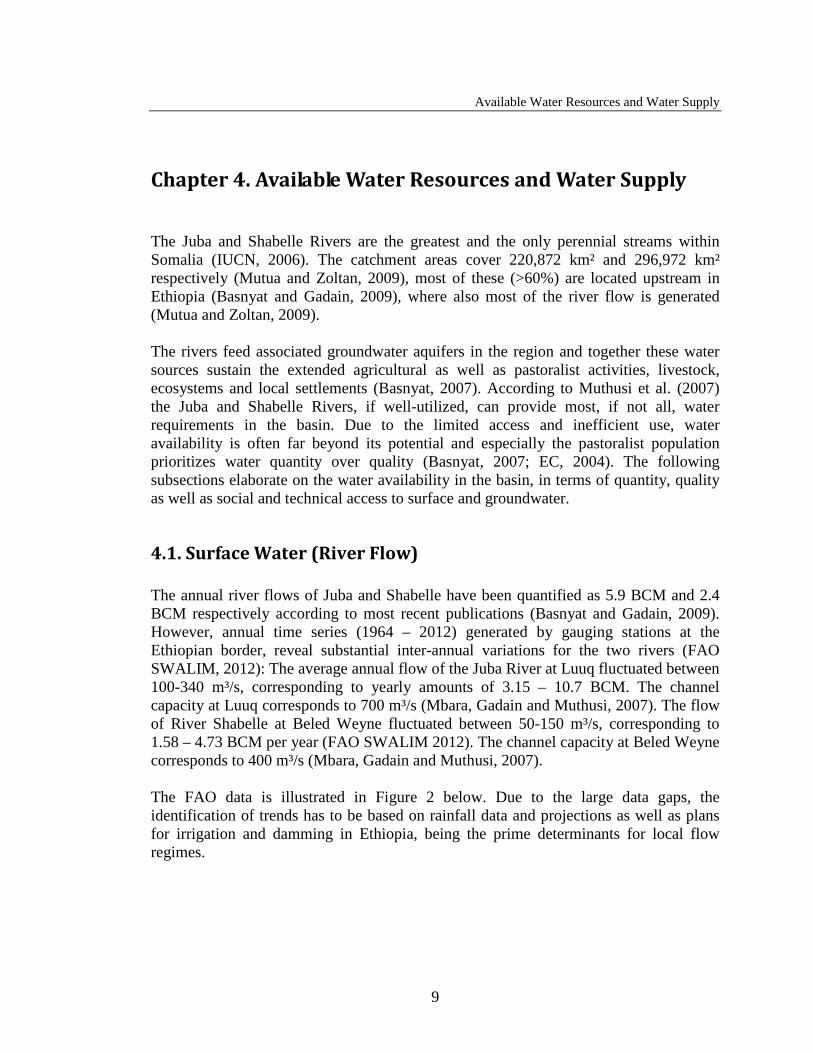
4.1. Surface Water (River Flow) The annual river flows of Juba and Shabelle have been quantified as 5.9 BCM and 2.4 BCM respectively according to most recent publications (Basnyat and Gadain, 2009). However, annual time series (1964 – 2012) generated by gauging stations at the Ethiopian border, reveal substantial inter-annual variations for the two rivers (FAO SWALIM, 2012): The average annual flow of the Juba River at Luuq fluctuated between 100-340 m³/s, corresponding to yearly amounts of 3.15 – 10.7 BCM. The channel capacity at Luuq corresponds to 700 m³/s (Mbara, Gadain and Muthusi, 2007). The flow of River Shabelle at Beled Weyne fluctuated between 50-150 m³/s, corresponding to 1.58 – 4.73 BCM per year (FAO SWALIM 2012). The channel capacity at Beled Weyne corresponds to 400 m³/s (Mbara, Gadain and Muthusi, 2007). The FAO data is illustrated in Figure 2 below. Due to the large data gaps, the identification of trends has to be based on rainfall data and projections as well as plans for irrigation and damming in Ethiopia, being the prime determinants for local flow regimes.

Available Water Resources and Water Supply
10
Figure 2: Mean annual river flows of Juba (at Luuq) and Shabelle (at Beled Weyne) Source: Own illustration based on FAO SWALIM, 2012
Also intra-annual fluctuations are quite high: During the wet seasons floods are a frequent problem, while during the dry season the flow may be reduced to almost zero (Basnyat, 2007). The two charts below in Figure 3 depict the monthly fluctuation measured at different gauging stations along the two rivers (Basnyat and Gadain, 2009). The Juba River experiences floods of greater magnitude than the Shabelle River, due to higher rainfall intensities and a denser drainage network in its upper catchment (Basnyat, 2007). Although the flood volume compared to the catchment area is not very large, damage frequently occurs due to local agriculture and residents who cut river banks for irrigation during the dry season (Basnyat, 2007). Due to extensive irrigation, infiltration and evaporation the river flow decreases as it runs downstream.
Long-term Flows (1963-1989)
050
100150200250300350400450
Jan Feb Mar Apr May Jun Jul Aug Sep Oct Nov Dec
Disc
harg
e (m
3 /s)
Luuq Bardheere Marere Kaitoi Jamama

Available Water Resources and Water Supply
11
Long-term Flows (1963-1989)
0
50
100
150
200
Jan Feb Mar Apr May Jun Jul Aug Sep Oct Nov Dec
Dis
char
ge (m
3 /s)
Belet Weyne Bulo Burti M. Weyne Afgoi Awdhegle
Figure 3: Long-term monthly flows in m³/s for different stations at the Juba and Shabelle River
Source: Basnyat and Gadain, 2009 The water quality of the two rivers is not well documented, but as human and livestock use it for direct consumption as well as basic hygiene it deteriorates in quality along its course (Basnyat, 2007). Measurements of electrical conductivity (1977 – 1990) revealed that salinity rises during the dry seasons and the first subsequent rain events, specifically during the Jilaal season (December -March), peaking in the Gu season (April – June) (Basnyat, 2007; Muthusi, Mahamud, Abdalle and Gadain, 2007). The river water may be appropriate for direct use in agriculture, while livestock and humans rather resort to nearby wells and springs as a source of drinking water (Basnyat, 2007).
4.2. Groundwater Information on groundwater resources is based on knowledge about geological formations, depth and water quality of existing wells and the local settlement density (Basnyat, 2007). Precise data on the nature, the thickness and the extension of these aquifers are missing (Basnyat, 2007). The map in Figure 4 illustrates potential groundwater zones based on a study by Faillace and Faillace (1987).

Available Water Resources and Water Supply
12
Figure 4: Map of potential groundwater zones in Southern Central Somalia Source: Faillace and Faillace, 1987
The groundwater aquifers are mainly fed by infiltrating river water (Basnyat, 2007). In the central rangelands groundwater recharge is very slow, depending on direct rainfall, whose infiltration is estimated to be at maximum 5 % (Faillace and Faillace, 1987). Groundwater amounts and qualities of different sources are quite different, depending on the hydrogeological circumstances (Basnyat, 2007): In the Bakool region, located between the Juba and Shabelle and bordering with Ethiopia (see also Figure 1), borehole depths vary between 90-220m. In the Bay region, geographically south of the Bakool area, groundwater can be found in 60-70m depth. The Bakool and Bay region belong to the so called Basement Complex, where groundwater bodies are rather fragmented and

Available Water Resources and Water Supply
13
discontinuous (Muthusi, Mahamud, Abdalle and Gadain, 2007). The population density in the basement complex area is as high as along the riverbanks, which can be considered as a testimony to good groundwater quality and availability (Basnyat, 2007). In the Hiraan region, located at the upper Shabelle, the groundwater depth is 60 – 125m, while in the Gedo region, located at the upper Juba River, the depths are about 50-100m. The Gedo region belongs to the Xuddur-Bardheere basin and water quality is described as good with medium levels of salinity (Muthusi, Mahamud, Abdalle and Gadain, 2007). In the coastal area there are shallow freshwater lenses with depths ranging from 2-10m (Basnyat, 2007). Furthermore there are many natural springs along the two rivers and the swamps in the southern part of the Shabelle River sustain the freshwater aquifers that meet the water needs of the coastal towns and settlements (Muthusi, Mahamud, Abdalle and Gadain, 2007; Basnyat and Gadain, 2009). The water of the coastal aquifers is of fairly good quality, but the layer of freshwater is overlaying a stratum of salty water, requiring extra care in extraction (Muthusi, Mahamud, Abdalle and Gadain, 2007). Besides the geohydrological circumstances, the use of these resources has an impact on the water quality, too: Where the demand for livestock consumption is high and a direct access to water is given, the sanitary condition is poor and the water turns unsafe for human consumption (Muthusi, Mahamud, Abdalle and Gadain, 2007). Contamination may occur during handling, delivery and storage (Gadain and Mugo, 2009). Most sources in the region are described as non-potable (Gadain and Mugo, 2009) and UNICEF (2011) reports recurrent outbreaks of cholera and diarrhoea in the lower Shabelle and Bay region, associated to the direct consumption of contaminated water from the river and shallow wells. Point of use treatment by chlorination, filtration or boiling are measures the population has to adopt in order to achieve drinking water standards (Muthusi, Mahamud, Abdalle and Gadain, 2007; Gadain and Mugo 2009). The following subsection elaborates on the access to water, linking the local water availability to the local water demands.
4.3. Access to Water The occurrence of water is the precondition, but infrastructure and management practices are necessary to provide ground or surface water to the specific places and needs. Irrigation There are different forms of diversion and use of river water for irrigation:
• Recession cultivation: Some farmers would cultivate inundated areas, so called desheks (natural depressions at the riverbanks), once the water recedes (Odouri,

Available Water Resources and Water Supply
14
Vargas and Alim, 2007b; Monaci, Downie and Odouri, 2007). Along the Juba River about 24,200 ha were used by this form of irrigation, compared to 21,600 ha along the Shabelle River (Basnyat, 2007, referring to the Somalia Agricultural Sector Survey 1988).
• Irrigation via Canals: To irrigate adjacent fields, the water is diverted to these via canals, whether by pumps or by gravity flow (Basnyat, 2007). Along the Juba River about 22,600 ha were used by this form of irrigation, compared to 40,150 ha along the Shabelle River (Basnyat, 2007, referring to the Somalia Agricultural Sector Survey 1988). In the Bay region, located in the southern part between the Juba and Shabelle, about 800 ha were supplied by these forms of controlled irrigation (Basnyat, 2007).
Groundwater Abstraction and Water Distribution Concerning the access to groundwater, the different types of access, their implications and frequencies are listed in Table 2 below. There is no information though on how much water is abstracted via the different sources, not even for single abstraction points (Basnyat, 2007). Table 2: Types of access to groundwater
Type Suitability Frequency Shallow Wells Very appropriate in areas
with shallow groundwater (0-20m); permanent; upgrade by pumps; Water could achieve health standards for human consumption; often high organic contamination; may run dry in periods of drought
24 in the Juba basin, 97 in the Shabelle basin; mostly rural 2009 update for Juba: >221 = more than 62% of the strategic water points in the region 2007 update (Muthusi et al.) for upper Shabelle: In the Hiraan region there are more than 200 shallow wells
Boreholes Access to deeper wells (40-400m), higher cost in implementation and maintenance, often the only option in dry season for pastorals or larger villages; Concentration of herds and population may strain the
31 in the Juba basin, 4 in the Shabelle basin; mostly urban; 2009 update for Juba: >74 = about 19% of the strategic water points in the region
Available Water Resources and Water Supply
15
local environment; yield: 5-10 m³/hour
Examples for yields: Bay region: 12m³/hour Hiraan region: 10m³/hour
Springs perennial or seasonal; mostly in mountainous regions; usually apt for livestock and human consumption
16 in the Juba basin, 3 in the Shabelle basin; mostly pastoral use; 2009 update for Juba: >415 = about 3% of the strategic water points in the region
Subsurface Dams Intercept and store underflow in permeable togga beds. Toggas are small, mostly ephemeral streams
22 in the Juba basin = about 16% of the strategic water points in the region
Infiltration Galleries Permeable collectors for interflow/sub-surface flow. Laid horizontally across the river bed, conveyed to a central collector or well.
No information available
Berkads Storage pit, lined or un-lined, excavated to store surface runoff
Only affordable technology for livestock and human consumption for rainwater collection where shallow groundwater is not available. Water could achieve health standards for human consumption; main source for pastoralists
No information available
Sources of Information: EC, 2004; Basnyat, 2007; Muthusi, Mugo and Gadain, 2009; Gadain and Mugo, 2009; Muthusi, Mahamud, Abdalle and Gadain, 2007
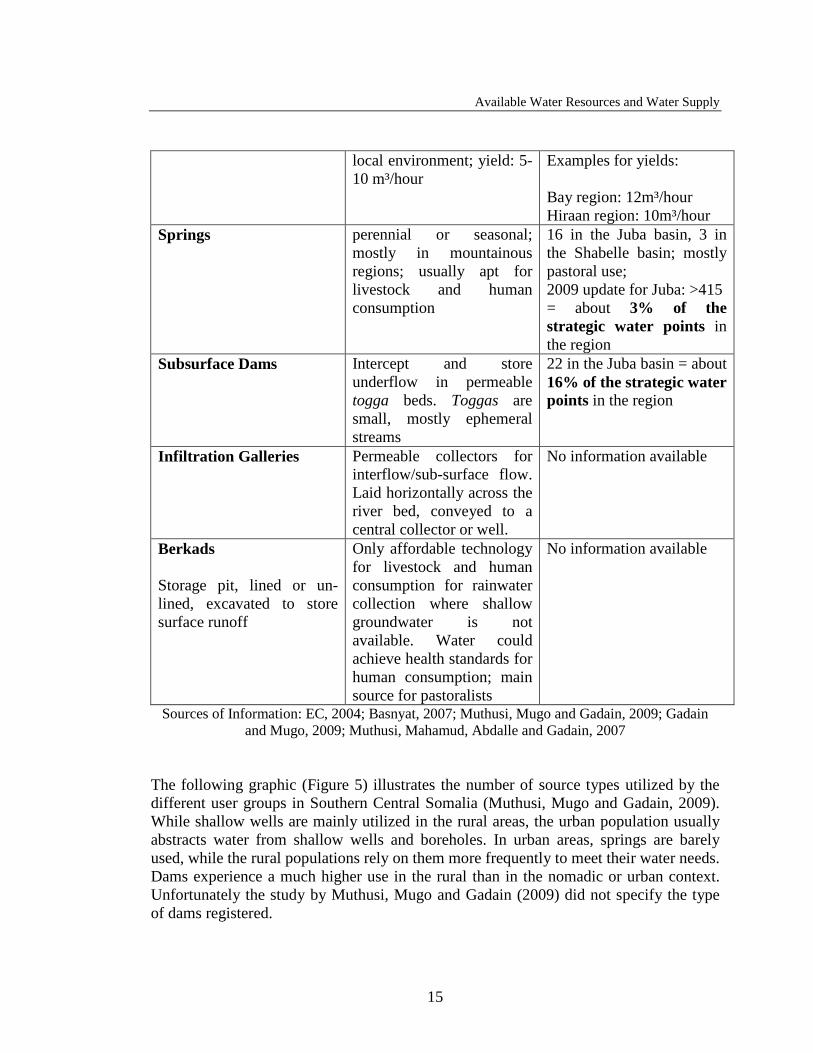
The following graphic (Figure 5) illustrates the number of source types utilized by the different user groups in Southern Central Somalia (Muthusi, Mugo and Gadain, 2009). While shallow wells are mainly utilized in the rural areas, the urban population usually abstracts water from shallow wells and boreholes. In urban areas, springs are barely used, while the rural populations rely on them more frequently to meet their water needs. Dams experience a much higher use in the rural than in the nomadic or urban context. Unfortunately the study by Muthusi, Mugo and Gadain (2009) did not specify the type of dams registered.

Available Water Resources and Water Supply
16
Figure 5: Number of water source types for different user groups
Source: Muthusi, Mugo and Gadain, 2009 Domestic and commercial water needs are usually met by tapping groundwater resources via wells, boreholes and springs (Muthusi, Mugo and Gadain 2009). Commercial supply options are listed in Table 3 below.
Table 3: Types of commercial domestic water delivery
Type Suitability Piped Water Supply Urban Context, Mostly Private Operation Public Standpoints/Wells Urban Context, Commonly governmental Operation Donkey Cart Delivery Urban Poor and Rural Context; Low cost water provision;
small amounts; requires quality upgrade at delivery; large numbers of service providers reduce the dependence on one source
Water Tankers Refill water storage of households that are not connected to the piped system
Sources of Information: EC, 2004; Basnyat, 2007; EU 2002 Communal Access Apart from the physical access, the administrative access also plays a role in water distribution and use:
• Access to irrigation water is regulated by local customs, holding that the right to use water for irrigation only depends on access to land along the river (Mbara, Gadain and Muthusi, 2007). Pumps are regarded as legitimate ways to increase the amounts abstracted, hence the use is limited merely by technical restrictions. No official approval or registration (licensing) and respective extraction control

Available Water Resources and Water Supply
17
is currently required, having lead to water misuse and wastage (Mbara, Gadain and Muthusi, 2007). Partly, local management committees have been established in order to regulate the use among the farmers, especially during times of a low river flow (Mbara, Gadain and Muthusi, 2007). Farmers sharing irrigation canals are often organized in so called maddas, which are customary water user associations (WUAs) (FAO, 2006). There are seasonal schedules for water allocations, gatekeepers, technicians controlling the discharge and assigning maintenance and repair duties among the members (Mbara, Gadain and Muthusi, 2007). Twice per year farmers usually have to desilt a section of the main canal as well as their distributaries, non-compliance being fined. Fights over water are usually settled by elders (Mbara, Gadain and Muthusi, 2007).
• Rural water sources like wells and boreholes are typically administered by community management committees, led by elders or the village chiefs (Basnyat, 2007). Traditional norms and male authorities hence decide on the validity of the water demands within their community. They determine the water distribution as well as the procedures of operation and maintenance (Basnyat, 2007). The decisions of the committee are made on behalf of the community, usually without their consultation. For the community the water is typically free of charge. Revenues are collected from external herders by an operator. Generally, there are no records on the amounts of water distributed nor on the revenues collected. The revenues are usually envisaged to cover operational costs and infrastructure-reinvestments (Basnyat, 2007), but the effectiveness and efficiency of operation and maintenance strongly depend on the particular well operator. While men are usually in charge of commercial wells, women frequently administer wells serving domestic purposes. Commercial wells are usually in a better state, since water sales are dependent on outsiders, buying water to satisfy livestock demands. Although trained women were found to perform better in management and maintenance of community water sources than men, they conventionally do not participate in decision making regarding the management of water sources. For outsiders or for users of private wells, water prices may limit the access and regulate the demand: Where salinity and bitterness of water are high, fresh-tasting water is sold at high prices. This was for instance the case in the Burhakaba and Dinsor district (Bay region) where 200 litres were sold for 1 -2.5 USD in 2007, which was five to fifteen times higher than average water prices (Basnyat, 2007).
• Urban private wells show better maintenance than communal wells and water distribution is determined by the local supply and demand situation, often run by Public Private Partnerships (PPPs) and regulated via market mechanisms (Basnyat, 2007). The coverage of piped water supply in urban areas is rather low (EC, 2002; Basnyat, 2007), so donkey carts and trucks are common means of supply. Due to losses in the network and illegal connections, the unaccounted for

Available Water Resources and Water Supply
18
water (UFW) is estimated at an average of about 50 %, indicating that half of the piped water is ‘lost and remains unbilled’ for the service provider (EC, 2002). Furthermore, the billing efficiency of many suppliers is low and due to customs and traditional hierarchies, many larger consumers e.g. the public administration but also mighty private customers, are supplied with water free of charge (EC, 2002). Hence also in the urban context, traditional norms and power positions determine how far and at what cost water demands are being met. The price per cubic meter for piped water in 2002 was about 0.61 US$ compared to 0.78 US$ for water sold at kiosk standpoints and an average of 2.1 US$ per cubic meter supplied by water trucks (EC, 2002).
4.4. Rainwater Harvesting: An Alternative Supply
The demand for river water also depends on the availability of alternative water supplies such as rainwater. There is no data available on amounts of rainwater substituting river water, nor any maps illustrating and locating the current use of rainwater harvesting (RWH) techniques or the potential for these in the different parts of Somalia (Odour and Gadain, 2007). But rainfall values are known and there seems considerable potential to expand rainwater use, substituting at least parts of the demand for water from the river, from wells and boreholes. Rainfall is relatively high (700-800 mm/year) in the middle and lower Juba area and along the coastal region around the Shabelle River. The area between the Juba and Shabelle Rivers receives slightly lower amounts (500-700mm/year) and in the upper Shabelle valley (Hiraan region and surroundings) regional rainfall is lowest, with about 400 mm/year (Odour and Gadain, 2007).
There are several traditional RWH techniques applied in the Juba and Shabelle basin, namely:
• Rooftop RWH: Households may use the surface of their roofs to collect rainwater, diverting it into cisterns or storage tanks. This technique is also called berkad guri (Odour and Gadain, 2007). The water derived from it mainly serves as drinking water and may substitute water needs from wells and boreholes. The water quality depends on the cleanliness of the roof surface as well as hygienic handling of water from the storage facility. Rainwater should hence be filtered and disinfected before consumption (Odour and Gadain, 2007). If done so, it commonly reaches greater quality than river or groundwater, which often evinces a high salinity (IWA, 2012). If awareness was raised about the health benefits of rainwater use, domestic demands for river or groundwater could be lower.

Available Water Resources and Water Supply
19
• RW Ponds and Reservoirs: Where soil properties, geological formations and rainfall amounts allow for it, rainwater is concentrated in depressions or man-made ponds (Basnyat, 2007). The local types are also called Wars. This water is mainly used as drinking water for humans and livestock (Odour and Gadain, 2007). There are more water points of this type than of groundwater sources in the Juba and Shabelle River basin (Basnyat, 2007). However, even in lined ponds and reservoirs water only lasts up to 6 months. They are falling dry during periods of low or no rainfall (Muthusi, Mahamud, Abdalle, Gadain, 2007). Furthermore, the water quality quickly turns critical if the access is uncontrolled.
• Rainfed Agriculture: The establishment of terraces in areas with higher rainfalls and sloped terrain are a classical example for RWH without intermediate storage (Odour and Gadain, 2007). This harvesting technique reduces the surface runoff, increases the infiltration and hence the moisture content in the soil. Directly along the rivers though, rainwater just serves as a complementary source of irrigation and cannot compete with river water as the main source of supply.
4.5. The Impact of Climate Change Climate change models project that especially the pastoral areas of Ethiopia and Somalia will become drier due to lower rainfalls (IUCN, 2006; EC, 2004). At the same time, drought and flood events are predicted to become more extreme and more frequent along the Juba and Shabelle Rivers (EC, 2004; HLC, 2008). Due to the absence of effective policy making institutions, Somalia currently does not possess any agenda for climate change adaptation (HLC, 2008; UNDP, 2012). Hence the effects of climate change will not be buffered in a coordinated manner and affected parties are challenged to self-organize or to individually cope with the consequences. The flow of the Juba and Shabelle River in Somalia mainly depends on rainfall and runoff in Ethiopia (Basnyat and Gadain, 2009). This is illustrated in Figure 6 below.

Available Water Resources and Water Supply
20
Figure 6: Runoff in the Juba and Shabelle basin
Source: UNEP, 2012 Changes of climatic (and other) conditions occurring in Ethiopia would therefore have a significant impact on water availability in the Somali part of the Juba and Shabelle basin. Alterations in temperature and precipitation in Somalia would also modify the regional agricultural water use in terms of irrigation requirements and crop water demands. Lower rainfalls imply a greater reliance on river or groundwater and hence the climate change impacts on river flows are of central importance to the analysis of local water availability. The UNDP has generated climate change projections for Somalia, but the raster units, for which local changes are indicated, are very coarse (1.5 x 1.5°) and do neither match the catchment boundaries nor the specific geomorphological runoff characteristics of the basin. This study hence refers to the most suitable raster unit and its changes. Arnell (1999) generated more precise predictions using HadCM Simulations with spatial resolutions of 0.5 x 0.5°. He determined changes in precipitation of -5% to +15% until 2050 in the Shabelle basin, associated to a change in run-off ranging between -10% and +45 % in the same time period. His calculation exemplifies the relation of runoff and river flows. Generally it holds that the greater the rainfall and the rainfall intensity, the higher the percentage of precipitation that will run off. The lower the rainfall and the rainfall intensity, the lower the amounts of run-off (FAO, 1991). In other words, trends in rainfalls are magnified in the occurrence of runoff and hence in river flows, with dry years leading easily to droughts and wet years to floods. Arnell (1999) has not referred to changes in the Juba basin and hence the recent UNDP (2008) data on rainfalls shall be used for projections on both river flows. Unfortunately, no monthly rainfall data for the

Available Water Resources and Water Supply
21
Ethiopian basin was available that could have been correlated with river flows, producing a precise relationship between rainfalls and runoffs. Past Funk, Michaelsen and Marshall (2011) have mapped recent decadal climate variations in precipitation and temperature across Eastern Africa and the Sahel. Figure 7 below illustrates rainfall trends observed between 1960 and 2009, for the time period ‘March, April, May, June’ (MAMJ) and for the period ‘June, July, August, September’ (JJAS). The rough catchment area has been delineated by a red circle. It is visible that rainfall decreased by 10-20 mm per decade.
Figure 7: Temperature trends between 1960 and 2009
Source: Funk, Michaelsen and Marshall (2011)
For the Ethiopian Shabelle catchment, a decline in rainfall was found to be statistically significant at the 0.1 level (Cheung, Senay and Singh, 2008). In the Ethiopian Juba Watershed, changes observed were not significant, but the catchment has been particularly affected by the heavy drought period between 1978-1986 (Cheung, Senay and Singh, 2008). The drought had an impact on the river flows in Somalia, as visible in Figure 2 (Section 4.1) as well as Figure 8 below.

Available Water Resources and Water Supply
22
Figure 8: Annual maximum discharge (m³/s) between 1951 and 1990 Source: Own illustration based on Basnyat and Gadain, 2009
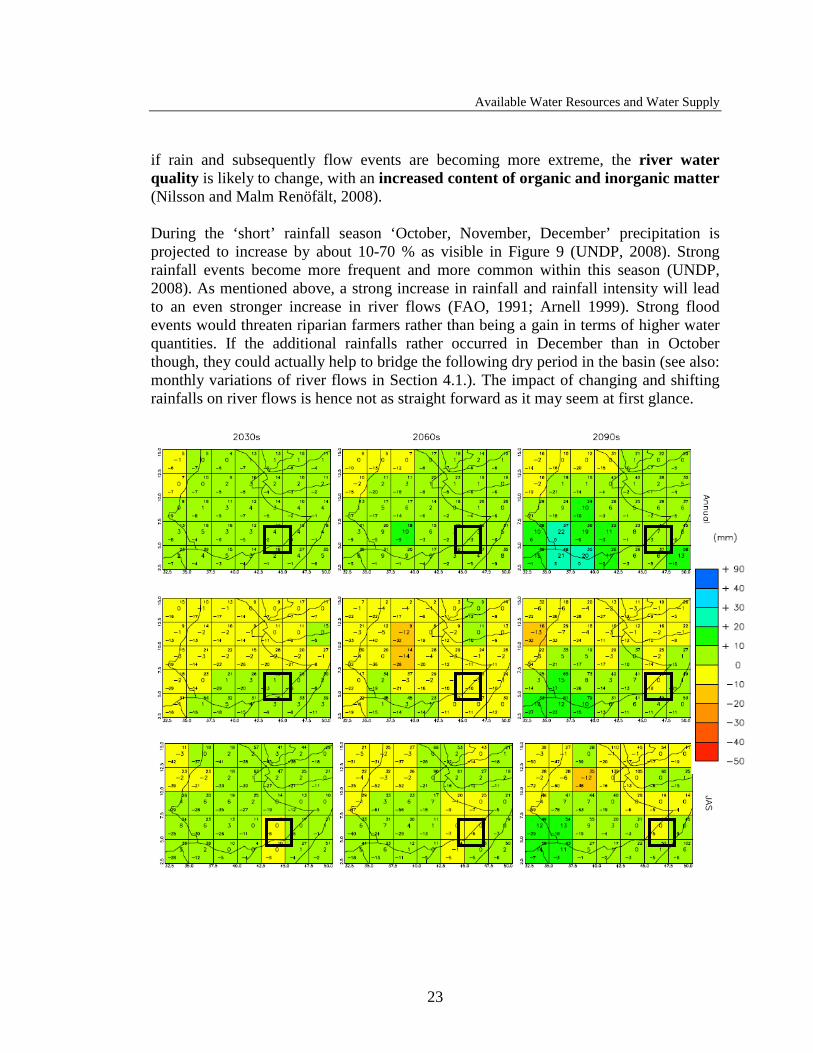
The measured rainfall values in the Juba and Shabelle Watersheds evince a high inter-annual and seasonal variability (Cheung, Senay and Singh, 2008). The variability of yearly values is illustrated in Figure 2 and Figure 8. The mean annual temperature in Ethiopia has increased by 1.3°C between 1960 and 2006, corresponding to 0.28°C per decade (UNDP, 2008). Future According to the UNDP climate change country profile for Ethiopia2 (2008), based on the A2 climate scenario of the IPCC, during the ‘long’ rainy season ‘April, May, June’ and ‘July, August, September’ the variance of minimum and maximum rainfall values are projected to increase significantly over the decades: There are much drier and much wetter months than in the past, but on average precipitation during this season is projected to stay the same or to slightly decrease, as visible in Figure 9 below. So the rain is coming down in heavier events and hence floods are likely to become more frequent in the Juba and Shabelle basin. This would have a negative impact on farming along the river banks and flood protection in Somalia. Already today, it is a challenge for farmers in the basin to capture and use flood water (Venema and Vargas, 2007; Basnyat and Gadain, 2009). The high amounts and spillovers hitherto are rather a threat than an additional water resource (Venema and Vargas, 2007). Recession farming, more than ever, would only be feasible if crops were highly flood and drought resistant and if farmers themselves could cope with the irregularity of the recurring floods. Furthermore,
22 The Ethiopian country profile is also covering large parts of Somalia, but for this study the rainfall and runoff characteristics in the Ethiopian part of the catchment play the most important role.
Available Water Resources and Water Supply
23
if rain and subsequently flow events are becoming more extreme, the river water quality is likely to change, with an increased content of organic and inorganic matter (Nilsson and Malm Renöfält, 2008). During the ‘short’ rainfall season ‘October, November, December’ precipitation is projected to increase by about 10-70 % as visible in Figure 9 (UNDP, 2008). Strong rainfall events become more frequent and more common within this season (UNDP, 2008). As mentioned above, a strong increase in rainfall and rainfall intensity will lead to an even stronger increase in river flows (FAO, 1991; Arnell 1999). Strong flood events would threaten riparian farmers rather than being a gain in terms of higher water quantities. If the additional rainfalls rather occurred in December than in October though, they could actually help to bridge the following dry period in the basin (see also: monthly variations of river flows in Section 4.1.). The impact of changing and shifting rainfalls on river flows is hence not as straight forward as it may seem at first glance.

Available Water Resources and Water Supply
24
Figure 9: Spatial patterns of projected change in monthly precipitation for 10-year periods in the future under the SRES A2 scenario.
All values are anomalies relative to the mean climate of 1970-1999. Black boxes indicate the main runoff generating areas for the Juba and Shabelle basin
Source: UNDP, 2008 Furthermore, the mean annual temperature in the selected grid unit is projected to increase by 1.9- 2.9°C until 2060 and by 2.8-4.8°C until 2090 (see Figure 9). Higher temperatures will increase the evaporation and reduce the runoff in the Ethiopian catchment (Arnell, 1999), which in turn would reduce the river flow as well as the soil moisture content and hence the plant growth. It is unclear though, how strong the impact would be, since the amounts of rain and the strength of a rain event are decisive factors as well. Against the background of increasing irregularity in river flows due to climate change, upstream developments in terms of dams may positively contribute to water accessibility and use in the Juba and Shabelle basin by regulating the water flow. The subsequent section elaborates on prospective changes.
4.6. The Impact of Upstream Developments Currently very few and rather small irrigation projects have been implemented in the Ethiopian Juba and Shabelle catchments, illustrated in the map (Figure 10) below.

Available Water Resources and Water Supply
25
Figure 10: Map of existing irrigation schemes in the Ethiopian river basins
Source: IWMI, 2010 The Ethiopian Ministry of Water Resources (MoWR) developed master plans for extending water allocation and utilization in the basin (MoWR 2004, 2004b, 2005, 2005b, 2006, 2007). Several dams for hydropower generation in Ethiopia are planned, that would cause a delay in river flows and alter prevailing stream flow patterns. Besides these non-consumptive uses the stepwise implementation of projects entails a massive expansion of irrigated agriculture in the area. Shabelle River The master plan divides the river basin into 8 development zones, 4 in Oromya, 4 in the Somali Region. The area proposed for irrigation covers about 190,000 ha. In Oromya, the greatest number of small- and medium scale projects are envisioned, while in the Somali Region, particularly in zone 6 (Gode, Korahe), the greatest area with large-scale irrigation schemes is planned (MoWR, 2005). Under the full development scenario, by 2035 more than 80% of the water resources of the Ethiopian Shabelle basin would be utilized to upscale and supply the Ethiopian agriculture, livestock as well as domestic water needs (MoWR, 2005b). During wet years, further seasonal irrigation is envisioned. Hydropower projects such as the Melka

Available Water Resources and Water Supply
26
Wakena dam3, the WS18 dam and flood control in the lower Ethiopian valley shall reduce flood damages by regulating the river flow (MoWR, 2005b). Table 4 demonstrates the changes in river flows if development plans were implemented according to the master plan by the MoWR. Figure 11 illustrates the monthly flow regimes after project implementation in the different phases. It is clearly visible that variability of flows is reduced, especially from 2010 to 2035, once the multipurpose dam project WS18 is implemented. Table 4: Annual Shabelle flow into Somalia if development plans were implemented
Mean flow leaving model area Year Base (2005) 2010 2020 2035 Flows in m³/s 123.33 83.15 80.90 23.84 Flows in BCM 3.9 2,6 2,5 0,75 Change to Base -32.6 % -34.4 % -80.7 %
Source: Numbers based on MoWR, 2005b
Figure 11: Monthly river flows (m³/s) into Somalia if development plans were implemented
Source: Numbers based on MoWR, 2005b
3 This dam is already existent and associated to irrigation plans for the Gode region; the irrigation schemes are still under construction, but first parts were inaugurated in 2003 (Awulachew, Yilma, Loulseged, Loiskandl, Ayana and Alamirew, 2007; Erta 2011)

Available Water Resources and Water Supply
27
A flow reduction of 80 %, as suggested above, will drastically lower the water availability in the Somali part of the Shabelle basin, both the river water flow as well as potentially groundwater recharge. The projects have not been implemented as planned, mainly due to financial, technical and institutional constraints (IMWI, 2010). But according to estimations by the MoWR (2004) the sectoral water demands in the Ethiopian Shabelle basin are rapidly increasing between 2005 and 2055 (Details: Table 5). Table 5: Development of sectoral water demands in the Ethiopian Shabelle basin
in million cubic meters (MCM)/year Sector Irrigation Livestock Domestic Total4 2005 96 73 83 0.253
BCM 2055 2.228 775 173 3.18 BCM Percentage Change
+ 2320 % + 1006% + 208% + 1257 %
Source: Numbers based on MoWR, 2004 These increases in demands will have to be met mainly by an increase in supply. The master plan, as presented above, suggests a concrete scenario to do so. There may be shifts in implementation and in single projects, but Somalia can expect significantly greater amounts of river water to be abstracted by their upstream neighbour. This will increase the competition for remaining water among Somali farmers and pastoralists. The regulation will also diminish the potential for recession farming and the sediment loads. However, the regulation of the river flow will decrease the risk of flooding in Somalia and help to maintain a certain base flow even in dry seasons. Juba River For the Ethiopian Juba catchment the Ministry of Water Resources (2007) also issued a master plan revealing the gradual implementation of irrigation and dam projects to increase the water supply for the local population. The year 2005 has been chosen as the reference (base case). The ‘low scenario’ (2007-2012) assumes the implementation of medium-scale irrigation projects while the ‘medium scenario’ (2012-2022) comprises a major hydroelectric power plant (HPP GD3) as well as medium-to-large-scale irrigation schemes. The ‘high scenario’ (2022-2037) assumes almost full irrigation development and the so called Genale HPP cascade. Finally, there is a ‘full development scenario’ (2037+), assuming full irrigation, water supply and hydropower development in the
4 The current reference river flow entering Somalia is 3.9 BCM (MoWR, 2005b). Future flow availability will strongly depend on abstraction developments in Ethiopia
Available Water Resources and Water Supply
28
region. The river flows at border associated with the different scenarios are provided in Table 6 below. Table 6: Annual Juba River flow at border if development plans were implemented
1973-2002 2005 2007–2012 2012-2022 2022-2037 2037 Mean Base Case Low
Scenario Medium Scenario
High Scenario
Full Development
Flow in m³/s
207,47 206,8 186,27 184,1 179,48 171,23
Flow in BCM
6.75 6.73 6.06 5.99 5.84 5.57
Change to Base Case
-9.9% -12.2% -14.8% -19.8%
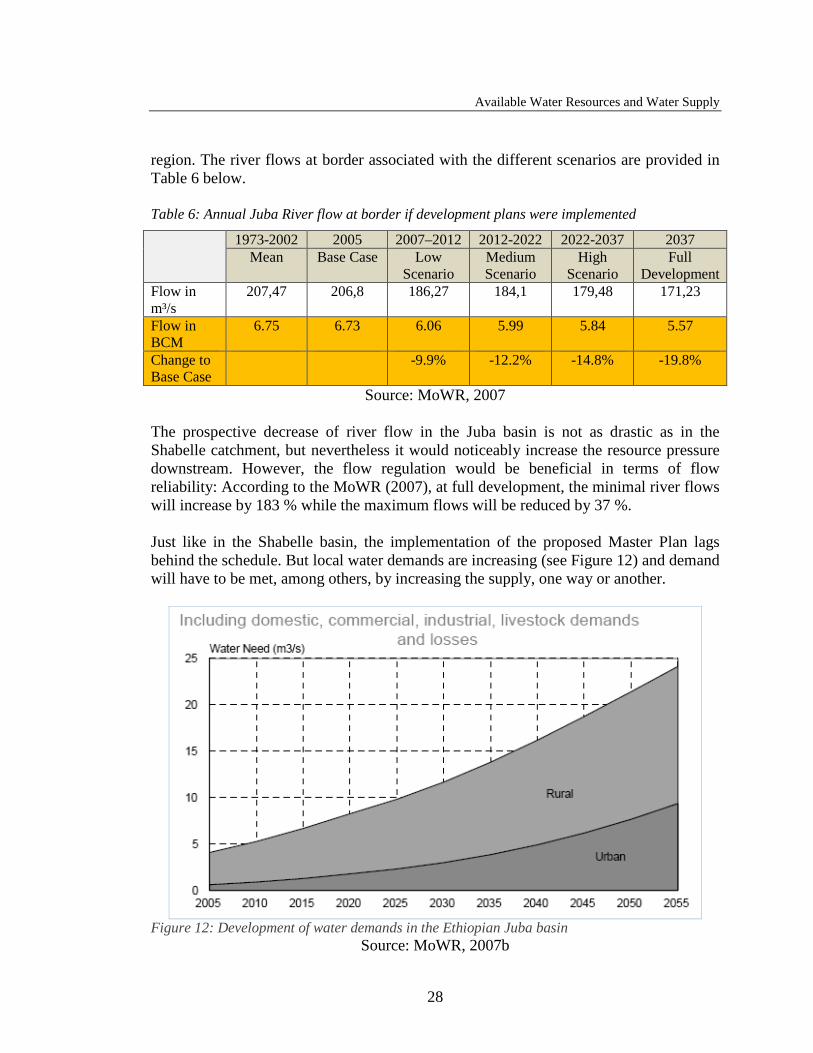
Source: MoWR, 2007 The prospective decrease of river flow in the Juba basin is not as drastic as in the Shabelle catchment, but nevertheless it would noticeably increase the resource pressure downstream. However, the flow regulation would be beneficial in terms of flow reliability: According to the MoWR (2007), at full development, the minimal river flows will increase by 183 % while the maximum flows will be reduced by 37 %. Just like in the Shabelle basin, the implementation of the proposed Master Plan lags behind the schedule. But local water demands are increasing (see Figure 12) and demand will have to be met, among others, by increasing the supply, one way or another.
Figure 12: Development of water demands in the Ethiopian Juba basin
Source: MoWR, 2007b

Available Water Resources and Water Supply
29
The regional and national water needs in Ethiopia call for concrete extensions of the current water use. The Somali part of the catchment would be severely affected and a mutual consultation as well as a coordinated planning would increase the development potential of the whole region while avoiding international conflicts (MoWR, 2006). Ethiopia refers to Somalia’s unstable political situation and to the lack of information about Somalia’s water demands, making negotiations impossible from their point of view (MoWR, 2006). Ethiopia also refers to its right to an equitable water use according to international norms, particularly the recommendations by the Convention on the Non-Navigational Use of International Watercourses (MoWR, 2006). Furthermore, international donors financing the implantation of the master plan demand basic agreements between upstream and downstream parties: The World Bank for instance expects commitment to their operational policy on international waterways, encouraging cooperation, goodwill, efficient use and protection (MoWR, 2006). In this light, the report at hand with its detailed investigation of water use and demands in the Somali part of the basin, would allow a downstream impact assessment and may contribute to a more holistic planning procedure on the Ethiopian side. In fact, there is an obvious general discrepancy in information concerning the river flows leaving Ethiopia versus entering Somalia: While the Ethiopian master plans (MoWR, 2005b and 2007) refer to average river flows of 6.75 BCM for the Juba and 3.9 BCM for the Shabelle River at the border to Somalia, measurements on the Somali side indicate lower annual averages: 5.9 BCM for the Juba River and 2.4 BCM for the Shabelle River as historic-until-present averages recorded by the gauging stations at Luuq and Belet Weyene (Basnyat and Gadain, 2009). If the Ethiopian plans for total abstractions would hold true and the Somali information on river flows, too, the annual abstractions of 3.15 BCM on the Ethiopian part of the Shabelle River by 2035 would surpass the average current Shabelle River flow by 750 MCM. The mismatch of data between the two countries must be investigated in order to provide common ground for a sustainable resource use on both sides of the border. The Intergovernmental Authority for Development is a regional body that could play an important role in respective cooperative efforts (IUCN, 2006).

Water Demand Analysis
30
Chapter 5. Water Demand Analysis Water demands in the basin can be categorized according to the
• purpose of use: sectoral water demands (agriculture, livestock, domestic...) What is water needed for? How much water is needed per sector (past, present, future)?
• place of use (close to the river vs. reliant on groundwater, rural vs. urban) Where is water needed? How much water is needed at the different locations? What are the implications for water distribution?
• time of use (mainly cropping seasons and cycles) When water is needed, e.g. irrigation requirements depending on rainfall and evapotranspiration? and
• user groups (e.g. pastoralists vs. sedentary farmers) Who needs/demands for water, based on different lifestyles, social hierarchies and traditional forms of management? How much water is needed per user group?
Since water availability in terms of quantity might not be enough to satisfy all water demands, the analysis also has to be concerned with the
• water quality required for the different uses/sectors. All of these categories and aspects are important conceptual view points to explore the character, the dimension and the location of water demands in the river basins. This section will hence attempt to respond to all of the questions above, analyzing sectoral requirements, differentiating geographic and temporal demands as well as (socio-political) features of user groups, responsible for specific claims on water resources. The question of water quality is common to all of the prior categories and will be dealt with for each perspective, as far as information is available. General information on short and long-term water availability, abstraction and provision was dealt with in Section 4.
5.1. Sectoral Water Demands Although the major irrigation schemes collapsed during the civil war and the El Nino Flood 1997/1998 (Houghton-Carr, Print, Fry, Gadain and Muchiri, 2011), agriculture still is the main water consumer according to Basnyat (2007) and in accordance with the study at hand. Agricultural development, population growth and urbanization are

Water Demand Analysis
31
important socio-economic trends in the region (Basnyat, 2007). Future projections about the local economy and demography are vital for the water demand assessment and will be explored in terms of development scenarios. It is also important to consider that certain reserve flows are required to sustain environmental functions and environmental services associated to the rivers (LVBC, 2010). There is no data nor are any estimates available on environmental water demands in the Juba and Shabelle basin, but a ‘zero-demand-assumption’ would distort the picture. This report therefore attempts to provide first cautious estimates of reserve flow requirements in the basin, referring to case studies in the region and their respective research findings. There is also no data available on industrial water use or demands in the basin. The respective needs are probably relatively small though, since the agro-pastoral sector is the dominant occupation (UNDP, 2008) and none of the available field reports assigned any importance to it. But even if industry does not abstract major water quantities, discharges of pollutants could have severe impacts on the water quality, polluting large quantities of water and making them unsuitable for any other use. Data is needed in order to assess industrial demands as well as pollutant discharges with resulting impacts on the local water resources. As long as no data is available, no meaningful statements can be given though on this topic.
5.1.1. Agricultural Demand Despite the infrastructural collapse in irrigated agriculture, 70 % of the national cereal production still takes place in the Juba and Shabelle basin (Basnyat, 2007). Furthermore, about 60 % of the national maize production is situated in the Lower Shebelle Region, mainly sustained by small-scale farmers, satisfying water-related food demands beyond the catchment boundaries (FSNAU, 2012). Maize and sorghum are the two most common crops, cultivated in rain-fed as well as in irrigated conditions (Basnyat, 2007). Other crops grown are rice, cereals, bananas, vegetables and fruit trees (Basnyat and Gadain, 2009). Only the irrigated parts and their water requirements are of interest for this study, tapping the surface and groundwater resources of the basin. In Southern Somalia the most widespread agricultural practice is rainfed cultivation (84%), followed by irrigated agriculture (6%) and recession farming (5%), as illustrated in Figure 13 below (Monaci, Downie and Oduori, 2007).

Water Demand Analysis
32
Figure 13: Shares of agricultural production types (% of hectares) in Southern Somalia
Source: Monaci, Downie and Oduori, 2007 Extent and Location of Irrigated Areas 90 % of the regional crop production is undertaken in the alluvial plains of the Juba and Shabelle basin as well as in the inter-riverine area of the Bay region (Basnyat, 2007). Concerning the extent and the location of agricultural demands, information from several sources had to be combined in order to draw a differentiated picture, providing robust estimates. Based on an extensive GIS analysis, the area of irrigated agriculture was determined to be 129,774 ha, with the greatest share located in the southern part of the basin (Basnyat, 2007). However, the analysis does not reveal whether the identified irrigation schemes are or ever were under simultaneous operation. Moreover, Figure 14 below demonstrates that data was not available for the central plateau, e.g. the Bay region. The only available data for the Bay region on irrigated areas dates from the pre-war period (FEWS, 1988), estimated as low as 800 ha. As elaborated in Section 4, the riparian zone mainly uses river water as a source for irrigation while the central plateau meets its water demands mainly by groundwater abstraction (Basnyat, 2007), being much more cost intensive and a severe limiting factor. Since no data is available on the exact groundwater availability, nor on recharge rates, demands or abstractions in the plateau region, the analysis of water requirements for agriculture in the basin has to focus on abstractions along and from the river.

Water Demand Analysis
33
Figure 14: Boundaries of GIS map on land use
Source: Monaci, Downie and Oduori, 2007 Besides the GIS analysis, there exist other calculations and estimates for the area under irrigation: Mbara, Gadain and Muthusi (2007) refer to 161,583 ha of irrigated land along the river, not based on a GIS analysis but on information from inception reports about local irrigation schemes. Their actual operation or operational status was not considered though and hence this figure is likely too high. A recent study by Oduori, Oroda, Gadain and Rembold (2012) determined those areas in the catchment that have been cultivated at least once during the last 4 years. They used remote sensing Landsat, DMC and ASTER images and revealed an area of 591,325 ha, most of it located along the Shabelle River (see Figure 15). Their result is a multiple of prior estimates and would hence make a significant difference in this analysis. Their assessment also seems the most robust and up to date, but it does not reveal the actual use and the seasonality of irrigated agriculture.

Water Demand Analysis
34
Figure 15: Map of cultivable areas in Southern Central Somalia
Source: Oduori, Oroda, Gadain and Rembold, 2012 Basnyat (2007) provides estimates that are more suitable to the conceptual focus of this study, but his estimates are also much lower than the ones presented above: He refers to 50,000 ha in the Shabelle basin and a current maximum capacity of 25,000 ha along the Juba River given existent irrigation schemes. Basnyat also compared the crop water

Water Demand Analysis
35
demands to monthly river flows and determined irrigation potentials based on low and high flows (see Table 7). Basnyat’s estimates are compatible with the calculations of Mbara, Gadain and Muthusi, as well as with the GIS results of Monaci, Downie and Oduori (2007). The study of Oduori, Oroda, Gadain and Rembold (2012) confirms that the cultivated area along the Shabelle is currently much greater than the one along the Juba River. Given Basnyat’s consideration of seasonal flows, crop water requirements and the status of irrigation schemes, his analysis seems to be the most suitable among the available studies and therefore has been selected. Table 7: Areas under irrigation (ha)
Location Current (average)
Potential of Existent Schemes
Area that could be irrigated based on minimal river flow (Dry Season)
.. based on maximum river flow (Wet Season)
Historic – Pre War (1987/88) Controlled Irrigation MoA data
Juba River 15,0005 25,000 50,000 170,000 112,950 Shabelle River
50,0006 135,0007 17,000 80,000
Source: Basnyat, 2007 Based on river flows the irrigation potential along the Juba River is much greater than along the Shabelle River. However, based on given infrastructure the irrigated area is actually larger along the Shabelle (77%) than along the Juba River (23%) (Basnyat, 2007). With information on the irrigated area and the crop water demand per hectare, quite precise statements can be given on respective water demands along the two rivers.
5 According to Mbara, Gadain and Muthusi (2007) less than half of the pre-war medium to large irrigation schemes are currently operational. Monaci, Downie and Oduori have determined the shares of large, medium and small scale schemes (5%, 40%, 55%). Assuming that of large schemes only 30 % are still operational, of medium schemes 50 % and of small schemes 70 %, 60 % of the total pre-war set up would still be in operation. 60 % of 25,000 ha (Juba River) = 15,000 ha. 6 Estimate by Basnyat (2007) corresponding to 37 % of the original infrastructure (which has probably never been simultaneously in operation, since river flows would not have been sufficient for that) 7 If all the pre-war irrigation infrastructure was rehabilitated to full simultaneous operation, based on available river flows not all this area could be irrigated. The restricting factor would hence not be the space, nor the irrigation infrastructure, but the available water quantities. However, if river regulation was possible, the water availability could be increased. Also a change in cropping patterns could lead to a utilization of greater areas.

Water Demand Analysis
36
Extent and Location of Agricultural Water Demands The FAO CROPWAT software has been used (Basnyat, 2007) to determine crop water requirements at two stations in the basin, namely at Jilib (Lower Juba Basin) and at Jowhar (Middle Shabelle Basin). The calculated annual irrigation demands are 11,428m³/ha and 11,830m³/ha respectively. The associated monthly values and variations are illustrated in Figure 16 below. As visible, the water demands per hectare as well as the monthly variations are almost congruent at the two locations.
Figure 16: Monthly crop water demands at Jilib and Jowhar (m³/ha)
Source: Basnyat, 2007 Since most of the agricultural production is taking place in the lower Juba and middle Shabelle basin, under similar climatic conditions and with similar cropping patterns, the values for Jilib and Jowhar (~11,000 m³/ha) are considered a good estimate of crop water demands in the region. Combining the information on irrigated areas and crop water demands, the following annual agricultural water demands (current, potential and past) can be derived: Table 8: Annual agricultural water demands along the Juba and Shabelle River
Location (River)
Current (average)
Potential of existent schemes
Demands for the area that could be irrigated based on minimal river flow (dry Season)
.. based on maximum river flow (wet Season)
Historic – pre war
Juba 0.165 BCM 0.275 BCM 0.55 BCM 1.87 BCM NA Shabelle 0.55 BCM 1.485 BCM 0.187 BCM 0.88 BCM NA Total 0.715 BCM 1.76 BCM 0.737 BCM 2.75 BCM 1.24 BCM
Source: Basnyat, 2007

Water Demand Analysis
37
For irrigated agriculture along the Juba River, the infrastructure seems to be the limiting factor, while along the Shabelle, the river flow even during high flow periods is the prime restricting resource. The maximum area that could currently be irrigated hence amounts to about 105,000 ha, with crop water requirements of about 1.16 BCM. The current average agricultural water demand is determined as 0.715 BCM. 0.715 BCM correspond to 5 - 16 % of the total river flows8. To consider the rivers separately, from the Juba River 1.6 - 5.5 % are abstracted for agriculture, while from the Shabelle River on average 12 – 40 % are used. It is revealed that a much higher share of river water is abstracted in the Shabelle basin. The amounts of average abstractions are quite alarming against the background of projected upstream developments (Section 4.5.). The analysis of demand and developments in the basins will however only be meaningful if livestock, population and the environment are considered as well. Section 6 summarizes and combines the single findings, providing integrated conclusions. Inter- and Intra-Annual Variability of Demands At this point, it is also important to consider that there are great inter- and intra-annual fluctuations in river flows as well as in crop water requirements: As illustrated in Section 4.1, river flows are highly variable and in drought periods close to zero (FSNAU, 2011). During low flow periods, the total abstractions (in MCM) will be lower than the average, but the share of abstractions from total river flows (in %) will be higher, the water demand being greater than the water availability. Inversely, during wet years, total abstractions will increase as far as the infrastructure allows it, while the ratio of abstractions to river flow will probably be smaller. During extreme flood events, existing irrigation schemes as well as harvests close to the river bank might even be damaged or destroyed by overspills (Basnyat, 2007). Mainly due to climate variations and civil unrest, cereal production has been fluctuating over the years, and with it, the agricultural water use. Every seven to ten years severe droughts strike the region and threaten the minimum of local water availability and food production (UNEP, 2010). The map below shows how severely the region has been affected during the drought in
8 As elaborated in Section 4, the annual Juba River flow fluctuates between 3.15-10.7 BCM at Luuq, the Shabelle River flow between 1.58 -4.73 BCM at Belet Weyne (FAO SWALIM, 2012). However, most of the agricultural production is taking place in the lower river basin, starting around Jilib and Jowhar, where the crop water demands have been determined, too. The closest upstream stations to Jilib and Jowhar are Kaitoi and Mahaday Wayne, where river flows are 4.5% and 13 % lower than at Luuq and at Belet Weyne respectively (Basnyat, 2007). This indicates that not much water has been abstracted or infiltrated until these points, but the losses shall be considered here for accuracy. Hence the available river flows at Kaitoi fluctuated between 3 -10.2 and at Mahaday Weyne between 1.37-4.12 BCM, yielding a maximal total range of 4.37 – 14.32 BCM of river water per annum in the area of agricultural production. The percentages of total flows are in respect to this rage!

Water Demand Analysis
38
2011 (UNDP, 2011b). In this year, cereal production was so low, that the population faced a severe humanitarian crisis.
Figure 17: Food security situation in 2011
Source: UNDP, 2011 Figure 18 illustrates the past fluctuations in cereal production for the Middle Shabelle area of cultivation.

Water Demand Analysis
39
Figure 18: Middle Shabelle – cereal production in million tons (MT)
Source: FSNAU, 2012 Due to the detailed and transparent elaboration on calculations in this section, new data can easily be added to account for recent changes. Concerning the intra-annual, specifically the monthly variations in river flows and crop water requirements, the Figure 19 and Figure 20 compare water demands with available supplies and infrastructural capacities.
Figure 19: Monthly Juba River flows vs. agricultural water demands (MCM)
Source: Basnyat, 2007

Water Demand Analysis
40
Figure 20: Monthly Shabelle River flows vs. agricultural water demands (MCM)
Source: Basnyat, 2007
Figure 21: Percentage (agricultural demand / river flow)
Source: Basnyat, 2007 The monthly differentiation reveals that during certain months (January, July and December) the crop water demands are greatest while the river flows are lowest.

Water Demand Analysis
41
Agricultural demands during January in the Shabelle basin even exceed the available supply. The gap may be compensated temporarily by groundwater abstractions or else demands are simply left unattained. Projections for Future Agricultural Water Demands Considering the national population growth of 2.7% (UN Data, 2012) as well as the frequent food shortages (UNDP, 2011), the demand for agricultural products will keep rising. However, if the above mentioned restrictions would hold true for the future, the area for irrigation in the Juba basin would be limited to 25,000 ha, and in the Shabelle basin to 80,000 ha. However, if infrastructural extensions were made along the Juba River, up to 170,000 ha could be irrigated during the wet season and 50,000 ha during the dry season. In the Shabelle basin, the capacity of irrigation schemes, if rehabilitated, would be 135,000 ha. With extensions, as much as 215,000 ha could be irrigated, given the regional suitability of soils (Basnyat, 2007). An operation on this level though would only be possible with flow regulations, increasing the local water availability. According to Basnyat and Gadain (2009), the maximum area that could be irrigated in the Juba and Shabelle basin is 265,000 ha. Currently, based on the so called ‘Banana Sector Study’ (EC, 2004), several donor agencies and investors are actually making efforts to restore existent irrigation facilities (Basnyat, 2007). Table 9: Future development scenarios for the water demand
Location Rehabilitation of pre-war irrigation schemes
Maximum based on current river flow
With agricultural extensions
Expert estimate of maximum potential, given extensions and river regulation
Juba River 25,000 ha 170,000 ha9 NA NA 0.275 BCM 1.87 BCM NA NA Shabelle River
135,000 ha10 80,000 ha 215,000 ha NA
1.485 BCM 0.88 BCM 2,365 BCM NA Total 160,000 ha 250,000 ha 265,000 ha 1.76 BCM 2.75 BCM 2.915 BCM
Source: Basnyat, 2007; Basnyat and Gadain, 2009
9 Only possible with infrastructural extension 10 Only possible with flow regulation, increasing the water availability

Water Demand Analysis
42
If the annual river flows were maintained, the maximum agricultural water consumption in the future (2.915 BCM) could be as high as 67 % of the total river flow. Based on the historic records of monthly flows and water demands though, the share of abstractions is likely to be significantly higher during the high temperature and low flow seasons. According to Venema and Vargas (2007) the main limitation to crop production are flooding, water scarcity, partially low soil fertility (see Figure 22 for an example of soil suitability for maize), lack of tillage capacity, market inaccessibility, deteriorated irrigation infrastructure and poor farming practices. It could be improved though, through the rehabilitation of irrigation schemes, a provision of credits, improvements in civil security, use of organic and inorganic fertilizers and careful use of pesticides, improved seed and planting material, improved markets, farmer education and a higher security in land tenure (Venema and Vargas, 2007). As elaborated in Section 4.3, local laws and regulations further determine the water abstraction and might not lead to an efficient irrigation in economic terms. Also, with the projected increase in upstream water use in Ethiopia (Section 4.5), water availability in the Somali part of the basin would decrease and the possibilities for the local agricultural production would be limited.
Figure 22: Map on soil suitability for growing maize
Source: Venema, 2007
If large scale irrigation schemes would be rehabilitated and would come back to operation, the crop water requirements would need to be revised though, since small and

Water Demand Analysis
43
medium scale farms are currently dominating, typically growing different crops than large scale farms: While on smaller farms, usually maize, sesame, fruit trees and vegetables are grown, large scale projects commonly grew sugarcane, guavas, lemons, mangos and papayas (Muthusi, Mahamud, Abdalle and Gadain, 2007; Oduouri, Vargas and Alim 2007b). User Groups Agriculture in the river basin is mainly performed by sedentary farmers (Basnyat, 2007), owning and cultivating the land. Besides the crop production they typically also practise animal husbandry. Lactating cattle, a few sheep and goats are kept near their homes, while non-lactating animals are herded further away (Basnyat, 2007). There have been large scale land acquisitions since the 1980s facilitated by the government, though, leading to conflicts between non-local investors with little farming experience and the local population (IUCN, 2006).
5.1.2. Domestic Demand About 60 % of the Somali population (7.5 million) live in the Juba and Shabelle basin (Basnyat, 2007). The basin embraces 38 districts in 9 regions in Southern Central Somalia (Basnyat, 2007). The two regions of Galgadug and Banadir are not considered part of the basin since their water supply is not based on direct abstractions from the Shabelle River, but entirely on groundwater (Basnyat, 2007). At least for the Banadir region though, groundwater availability is directly dependant on infiltrations along the Shabelle River (Faillace and Faillace, 1987). The Banadir region is the smallest among all Somali regions, but with towns like Mogadishu it has the highest population number (EC, 2004). Being located south of Jowhar, where agricultural production on the Shabelle is concentrated, its water supply in quantity and quality is heavily dependent on upstream use as well as on developments in the local agricultural sector. Hence for this assessment all southern-central regions and their districts are included in the study except for the region of Galgadug, where due to its distance from the Shabelle River it is not safe to assume groundwater recharge here still mainly depends on river flows. More data is needed in order to confirm or reject this assumption. User Groups and Available Water Qualities The user groups to be differentiated here are the urban and the rural population. They differ fundamentally in their access to water, in terms of quantities and qualities. Rural populations, especially nomadic tribes, mainly use wells, springs and boreholes, so their water abstractions are severely limited by technical means. The nomadic population uses multiple sources of different qualities in order to cope with the water scarcity along their herding routes. Since their people and livestock are usually supplied by the same sources, water quality is often quite low due to bacterial contamination (EC, 2004). The

Water Demand Analysis
44
rural population still generally prefers the use of surface water (e.g. from a pond) to the use of groundwater since it tastes fresher (Muthusi, Mahamud, Abdalle and Gadain, 2007). According to a recent UNICEF report (2012), only 9 % of the rural population has access to improved drinking water. The same share of children currently attends primary school, receiving basic education on water, sanitation and hygiene (UNICEF, 2012). For the urban population the water supply is commercialized, accessing private wells or deep boreholes (see Section 4.3 for elaboration). About 67 % have access to improved drinking water, the (primary) school attendance is at 30 % referring to nationwide figures (UNICEF, 2012). The population here therefore has a higher education on hygiene and is more likely to practise point of use treatment like chlorination or basic filtration (Basnyat, 2007). However, Gadain and Mugo (2009) report that there are large numbers of unprotected shallow wells in most towns that are used by a great share of households. Hence water use depends on the availability and affordability of different water sources as well as the acceptability towards them. The water use may be below the water demand if insufficient amounts are available, affordable or if sources are inacceptable. Especially in rural areas, the gap between demand and use may be particularly high, although water is often used even if it is not of appropriate quality for livestock (Gadain and Mugo, 2009). Extent and Location of Domestic Water Demands The last population census was conducted before the outbreak of the civil war in 1988 by the Ministry of National Planning (Basnyat, 2007). However, only data on rural/urban shares were available, not the total population numbers per region. Recent data e.g. by UNDP in 2002 and 2005 do provide numbers per region as well as the rural/urban shares, but these are estimates. It is a difficult task to determine local population numbers and their distribution due to the large refugee movements as a consequence of the civil war as well as famines but also due to traditional seasonal migration of pastoral communities. For this study the most recent estimates (UNDP, 2005) are used and combined with assumptions on water demands per person. Based on Basnyat (2007) per capita water demands of 20 litre per day (l/d) and 50 l/d for the rural and the urban population respectively are assumed. Muthusi et al. (2007) report that in rural areas and during dry seasons, water demands may be as low as 2-12 l/d, which is very close to the minimum humanitarian standard of 0.83 l/d (IUCN, 2006). Basnyat’s figures seem fair estimates for average consumptions. By these means, a total domestic water demand of 140,250 m³ per day is determined, translating into 51.2 MCM per year. Table 10 lists the regional as well as rural/urban details for this calculation.
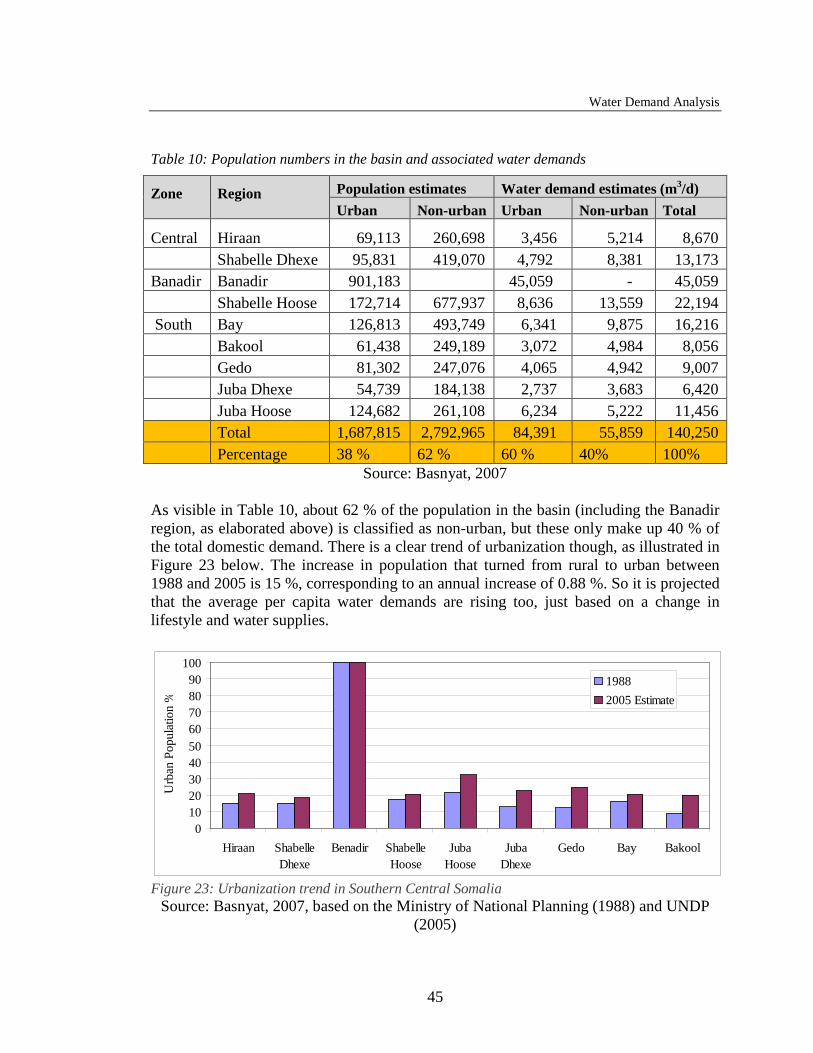
Water Demand Analysis
45
Table 10: Population numbers in the basin and associated water demands
Zone
Region
Population estimates Water demand estimates (m3/d) Urban Non-urban Urban Non-urban Total
Central Hiraan 69,113 260,698 3,456 5,214 8,670 Shabelle Dhexe 95,831 419,070 4,792 8,381 13,173 Banadir Banadir 901,183 45,059 - 45,059 Shabelle Hoose 172,714 677,937 8,636 13,559 22,194 South Bay 126,813 493,749 6,341 9,875 16,216 Bakool 61,438 249,189 3,072 4,984 8,056 Gedo 81,302 247,076 4,065 4,942 9,007 Juba Dhexe 54,739 184,138 2,737 3,683 6,420 Juba Hoose 124,682 261,108 6,234 5,222 11,456 Total 1,687,815 2,792,965 84,391 55,859 140,250 Percentage 38 % 62 % 60 % 40% 100%
Source: Basnyat, 2007 As visible in Table 10, about 62 % of the population in the basin (including the Banadir region, as elaborated above) is classified as non-urban, but these only make up 40 % of the total domestic demand. There is a clear trend of urbanization though, as illustrated in Figure 23 below. The increase in population that turned from rural to urban between 1988 and 2005 is 15 %, corresponding to an annual increase of 0.88 %. So it is projected that the average per capita water demands are rising too, just based on a change in lifestyle and water supplies.
0102030405060708090
100
Hiraan ShabelleDhexe
Benadir ShabelleHoose
JubaHoose
JubaDhexe
Gedo Bay Bakool
Urb
an P
opul
atio
n %
19882005 Estimate
Figure 23: Urbanization trend in Southern Central Somalia
Source: Basnyat, 2007, based on the Ministry of National Planning (1988) and UNDP (2005)

Water Demand Analysis
46
Concerning the exact locations of water demands, only the one of the settled population can be illustrated, as done in Figure 24 and 25 below. The map in Figure 24 confirms that settlements tend to be concentrated along the river and/or where there are good groundwater resources, as discussed in Section 4. Figure 25 demonstrates estimates of population densities in the different regions for the year 2010.

Water Demand Analysis
47
Figure 24: Settlements in the southern central river basin
Source: Basnyat, 2007

Water Demand Analysis
48
Figure 25: Population density in the Juba and Shabelle basin
Source: UNEP, 2012 - Africa Water Atlas Future Domestic Water Demands Combining the findings on urbanization with the national annual population growth trend of 2.7 % (UN Data 2012) future water demands can be projected. The years for projection have been chosen to match the upstream development scenarios in order to generate some comparability for the analysis. Table 11: Projections of population growth and domestic water demands
Year Population in the basin assuming 2.7 % growth
Share of rural:urban
Annual water demand (MCM)
Baseyear (2005) 4,480,780 62:38 51,2 2020 6,682,059 54:46 82,2 2035 9,964,762 48:52 130 2037 10,510,123 47:53 138 2055 16,977,581 40:60 235,7
Source: Own elaboration based on UN Data 2012

Water Demand Analysis
49
Figure 26: Projected population growth and domestic water demand
Source: Own elaboration based on UN Data 2012 According to the projections, if trends continue, the urban population will be greater than the rural population from 2030 on. Pressure on groundwater resources, particularly around the urban areas, is hence expected to increase (HLC, 2008). It must be kept in mind that the growth rate was not basin-specific and that due to the high instability in the region, migration and development constraints, the projected numbers are only as reliable as they can be under such circumstances. Seasonality At locations with relatively high rainfalls and with rainwater harvesting facilities (see Section 4.4) the demands for river or groundwater may fluctuate according to the season. There are no figures on amounts of rain water harvested for domestic purposes though. While rooftop rainwater harvesting in rural areas may produce high quality drinking water, storage in open ponds or reservoirs usually results in inferior quality, especially if livestock has a direct access to it. During seasons of low or no rainfall, rainwater storage facilities usually dry up and the rural just as the urban population fully relies on groundwater and river water of the Juba and Shabelle (Muthusi, Mahamud, Abdalle, Gadain, 2007). Every seven to ten years severe droughts strike the region and threaten even the minimum of local water availability (UNEP, 2010).

Water Demand Analysis
50
5.1.3. Livestock Demand Water for livestock is an essential basis for subsistence and development of the Somali population (Basnyat, 2007). Livestock is a main source of nutrition and income (IUCN, 2006) and in 1990 about 55 % of the Somali population was directly engaged in livestock production (FAO/WB/EU 2004). In the Juba and Shabelle basin grazing of goats, sheep, cattle and camels is among the dominant land use types (Oduori, Vargas and Alim, 2007b). Livestock is usually not herded immediately along the river banks, since this area is used for cultivation. So like the domestic demand, livestock demands are only partly satisfied directly from the rivers. Livestock typically accesses ponds and reservoirs, partially fed by rainwater but mostly by groundwater (see also Section 4). User Groups Transhumance pastoralism is the most common grazing system in the area, moving animals along well designed routes dependant on water and forage availability (Venema and Vargas, 2007). Pastoralism serves as a strategy to secure people’s livelihoods while maintaining the fragile arid and semi-arid regional ecosystems (IUCN, 2006). Somalia ranks third in hosting the largest number of pastoralists worldwide (FAO, 2006). Common products are milk, meat, skin and ghee, both for commercial and domestic use (Venema and Vargas, 2007). Transhumance pastoralism also is often practised along with cropping and wood collection for charcoal production (Venema and Vargas, 2007). Farmers in the basin usually keep relatively small numbers of livestock, mostly cattle and small ruminants (Oduori, Vargas and Alim, 2007b). While lactating cattle, sheep and goats are kept near their homes, on their own property, non-lactating animals are herded further away, at nomadic modalities (Oduori, Vargas and Alim, 2007b; Basnyat, 2007). Mainly natural vegetation and crop residues serve as animal feed (Oduori, Vargas and Alim, 2007b). While livestock ownership is private, grazing lands are communal property, making it difficult to regulate the access to it (Oduori, Vargas and Alim, 2007b, UN-HABITAT, 2008). During the dry season there are frequent conflicts between sedentary farmers and pastoralists, crossing private properties with their herds in order to access river water (Basnyat, 2007). Pastorals traditionally have a low position in the Somali social stratification, but in the past due to their number and strong social ties they were often quite successful to impose their interest against those of minority farming communities (FAO, 2006). Also private water developments, e.g. berkads, as well as private enclosures increase the pressure on surrounding rangelands, sometimes cutting the traditional grazing routes (IUCN, 2006). Conflicts between pastoral groups on water for livestock have been fuelled by an externally lead establishment of free-access wells, disregarding the traditional structures of access to land and water resources (UN-HABITAT, 2008). According to the FAO (2006) restricted access to water is an

Water Demand Analysis
51
effective mean to regulate the influx of animals, controlling pasture consumption. Livestock productivity was reported to decrease as a consequence of resource conflicts as well as the export ban to Saudi Arabia in 2001 (IUCN, 2006, UN-HABITAT 2008). Extent and Location The only available data on regional livestock numbers is a pre-war record from 1988, based on data by the Ministry of Agriculture (Basnyat, 2007). If water demands of 25, 1.6 and 12 litres per day are assumed per cattle, sheet/goat and camel respectively, then a total daily water livestock requirement of 114,000 m³ for the basin can be determined. This translates into a demand of 41,610,000 m³ (41.6 MCM) per year. The details of this calculation are listed in Table 12 below. Table 12: Livestock water demand in Southern Central Somalia in 1988
Region
Cattle Camel Sheep/Goats Total Demand (m3/day) Head m3/day Head m3/day Head m3/day
Shabelle Dhexe 443,420 11,086 235,140 2,822 1,348,380 2,157 16,065 Shabelle Hoose 43,940 1,099 336,070 4,033 374,210 599 5,730 Banadir 25,530 638 1,140 14 32,430 52 704 Bakool 116,080 2,902 220,230 2,643 458,750 734 6,279 Bay 296,000 7,400 415,230 4,983 321,020 514 12,896 Gedo 612,900 15,323 899,270 10,791 1,566,160 2,506 28,620 Mid Juba 424,860 10,622 252,300 3,028 968,160 1,549 15,198 Low Juba 999,450 24,986 254,640 3,056 252,450 404 28,446
Total 2,962,180 74,055 2,614,020 31,368 5,321,560 8,514 113,937 Source: Basnyat, 2007 based on the MoA, 1988
For 1988 a country wide figure of 41.7 million animals was indicated by the MoA and 44.3 million by the Ministry of Planning (MoNP, 1990 according to Elmi, 1991). Recent FAO (FAO/WB/EU, 2004) estimates assume a current nationwide number of 37.5 million grazing animals. So nationwide, a drop in livestock can be observed, partly attributable to resource conflicts, trade restrictions and eventually also trends like urbanization. Concerning the locations predominantly used for transhumance pastoralism, these are illustrated in the map (Figure 27) below.

Water Demand Analysis
52
Figure 27: Land use in the Juba and Shabelle riverine areas
Source: Oduori, Vargas and Alim, 2007b According to Venema and Vargas (2007) one of the main pastures of Somalia is located in the upper Juba area. However, generally there is a high fluctuation, due to the pastoral livestock movements across the region, as illustrated in Figure 28 below.

Water Demand Analysis
53
Figure 28: Livestock movements across the region
Source: FSNAU, 2012 Limiting factors for livestock breeding vary from place to place: While in the low alluvial plains the tse tse fly, extensive cropping activities, high soil sodicity or salinity may be reasons, the northern areas simply seem to lack rainfall and can only provide the biomass for limited seasonal grazing (Venema and Vargas, 2007). Less than 2% of the study area was classified entirely unsuitable, including the coastal plains that are devoid of vegetation. In general, also animal diseases, water shortage or a high cost of water, low market prices as well as poor management practices are constraints for development (Venema and Vargas, 2007). Performance could be improved by the provision of veterinary services, construction and/or rehabilitation of water points, improved security, improved livestock markets and extension services (Venema and Vargas, 2007).

Water Demand Analysis
54
The basic suitability of land for extensive grazing is illustrated in Figure 29. As visible, no data was available for the central plateau region.
Figure 29: Suitability of lands for extensive grazing
Source: Venema, 2007 Future Livestock Demands According to the FSNAU (2012) there is a current national trend of increasing livestock keeping (cattle, camel, sheep/goats). However, no reliable regional projections for livestock numbers and its water demands can be made, as long as there is no respective panel data available. A growing population will surely need a higher supply with livestock related products, but alternative food sources might have to be found if the local political situation as well as the market remains as unstable as in the recent past.

Water Demand Analysis
55
Water Quality and Seasonality Water quality at shallow wells, springs, berkads and rainwater reservoirs is usually poor due to the unrestricted access of livestock and humans to these water sources, using it for hygiene, sanitation as well as drinking purposes without treatment (EC, 2004). There seems to be some seasonality in available water quality: Rainwater ponds and seasonal springs are probably of good quality in the beginning of the wet season, deteriorating towards the end of it. During the dry season animals move towards the rivers in search for water (Muthusi, Mahamud, Abdalle and Gadain, 2007; Houghton-Carr, Print, Fry, Gadain and Muchiri, 2011). River water, as the only running source of water, might have the lowest bacteriological contamination, but depending on the location, agricultural or industrial inputs as well as dissolved organic and inorganic matter the quality may be quite low. Water from deep wells and boreholes seems to promise the highest safety from contamination, but it also depends on hygiene standards at the points of access. Sometimes geological conditions have led to a high salinity, beyond humanitarian standards. Water from boreholes may furthermore be too expensive for regular livestock supply. According to the Human Development Report of 2011 (UNDP, 2011), Somalia also has the highest inter-annual variability of rainfall among all African mainland states, having a pervasive influence on pastoral and agro-pastoral production systems. A strong correlation between rainfall and livestock numbers has been reported (UNDP, 2011) but respective background data has not been available for the report at hand.
5.1.4. Environmental Demand In order to maintain the ecological services as well as the natural channel habitat associated to the historic flow regimes of the Juba and Shabelle Rivers, a certain reserve flow has to be maintained and could be considered as a sectoral demand on its own (Muthusi, Mahamud, Abdalle and Gadain, 2007). An Environmental Flow Assessment (EFA) could reveal the precise water needs for sustaining specific ecosystem functions at desirable qualities (LBVC, 2010, IWR, 2010, IUCN, 2003). The so called Building Block methodology usually serves as a strategy to identify the basic elements of the flow regime responsible to maintain the key ecosystem functions (IUCN, 2003). Once these ‘building blocks’ are known, acceptable flow regimes for ecosystem maintenance can be constructed (IUCN, 2003). Required information concerns the aquatic and riparian ecology, water quality, hydraulics, hydrology and geomorphology (LBVC, 2010). Information on the Juba and Shabelle basin does not suffice in order to perform a complete EFA. An expert workshop would have to be conducted, too. However, the basic idea is to maintain a minimum flow level

Water Demand Analysis
56
during dry and wet months as well as regular flooding, which may have an important geomorphological and ecological function (LBVC, 2010). A recent EFA for the Mara River between Kenya and Tanzania yielded a minimal reserve flow of 25% and 35% at two selected locations respectively (LVBC, 2010). Assuming a comparably low reserve flow of 10% for the Juba and Shabelle River just for the sake of not neglecting this sector, an annual environmental demand of 0.315 – 1.07 BCM for the Juba and of 0.128-0.473 BCM for the Shabelle River are determined. An expert workshop is recommended in order to perform a country specific EFA with robust estimates based on the actual aquatic and riparian ecology, the water quality, hydraulics, hydrology and geomorphology in the Juba and Shabelle basin.

Analysis of Findings
57
Chapter 6. Analysis of Findings The comparison of current annual demands by the different sectors reveals the clear dominance of agricultural water use over domestic and livestock demands. With the assumption of a 10 % reserve flow11 though, the environmental demands are even slightly greater. Comparing the annual total flows with the annual total sectoral demands, the following chart can be derived:
Figure 30: Current annual sectoral water demands in the Somali Juba and Shabelle basin
Source: Own elaboration It must be kept in mind, that especially domestic and livestock demands are partly satisfied by groundwater, not directly by river water. Since groundwater availability in the region is not known and strongly depends on the stream flow (Basnyat, 2007), the river flow has been set in direct relation with the sectoral demands for the purpose of this analysis. The river flow has been taken as 8.3 BCM, according to the average gauged values measures at Luuq (Juba) and Beled Weyne (Shabelle), both located at the border to Ethiopia (Basnyat and Gadain, 2009). The ‘remaining river flows’ are the river flows after the deduction of all demands. Due to a lack of information the systemic set-up is simplified by assuming that there is a static river flow12 and the aggregated demands are subtracted from this quantity. More information is needed on the exact location and timing of the demands and this 11 Referring to the mean flow of 8.3 BCM 12 8.3 BCM annually for both rivers according to Basnyat and Gadain, 2009

Analysis of Findings
58
information, in turn, has to be combined with data on natural flow reductions along the river course due to infiltration. Such information could be used in decision support software such as WEAP, generating a greater preciseness in the analysis of river flows versus water demands. Based on the annual water balance, as illustrated in the chart above, there seems to be some room for development upstream as well as within the Somali Juba and Shabelle basin. However, it must be considered that environmental water demands could be much higher since a relatively low share has been introduced here for the sake of not fully neglecting its stake. Also, the chart above did not discriminate between the Juba and the Shabelle River respectively, since domestic and livestock demands have not been indicated separately either. However, the analysis of agricultural demands (Section 5.1.1.) and upstream developments (Section 4.5.) provided a glimpse at the disproportional use of the Shabelle River as compared to the Juba River. Since highly populated regions like Banadir are also associated to the Shabelle, it can be assumed that at least half of the domestic demand is related to the river too. Concerning the livestock demands, it is highly uncertain what proportion of which river is used for this purpose. But the livestock and the domestic sector also only have minor shares in water consumption, so it does not distort the overall analysis if equal demands for the Juba and Shabelle River are assumed. Based on these calculations and estimates, the following current annual sectoral water demands for the Juba and Shabelle River respectively are determined:
Figure 31: Current annual sectoral water demands in the Somali Juba basin
Source: Own elaboration

Analysis of Findings
59
Figure 32: Current annual sectoral water demands in the Somali Shabelle basin
Source: Own elaboration The comparison between the two rivers reveals that a higher proportion of Shabelle water (35%) is used as compared to the Juba River water (13.6%). A further interesting focus for this analysis is the comparison of dry season demands versus the seasonal river flows. During low flow periods the sectoral demands will make up a higher share of the available river flow. If the months of the dry season Jilaal (December, January, February and March) are selected, the charts for the Juba and the Shabelle basin look as follows:
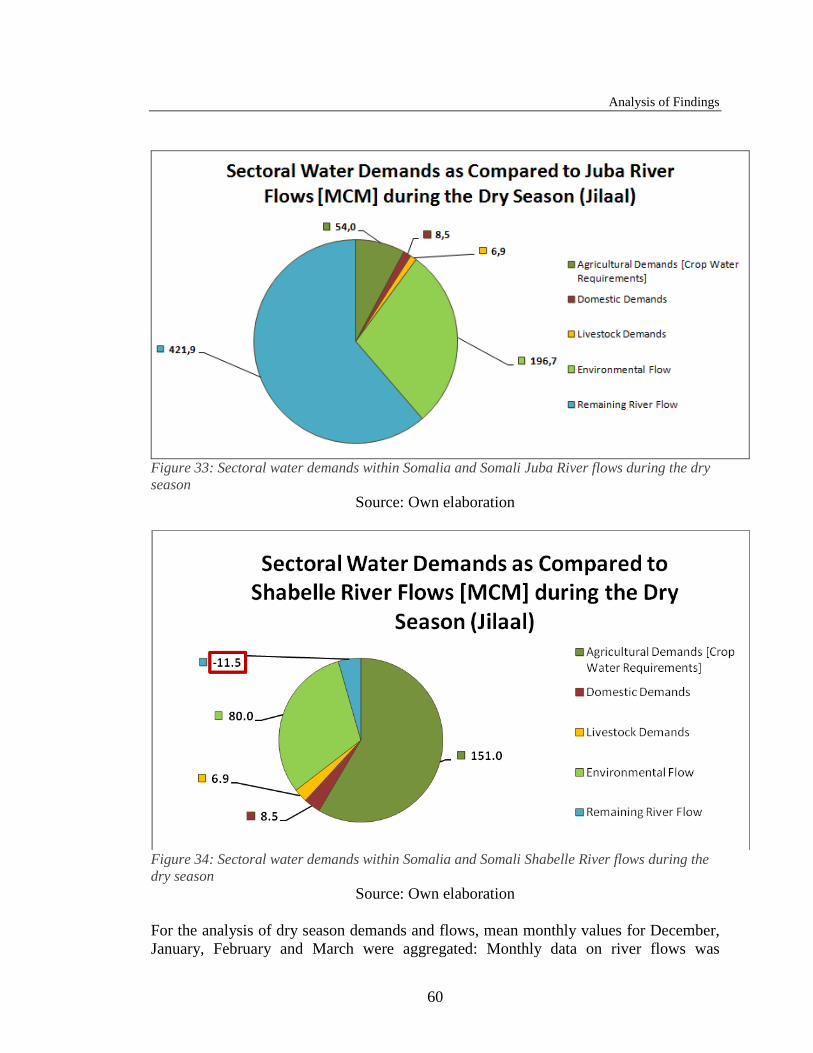
Analysis of Findings
60
Figure 33: Sectoral water demands within Somalia and Somali Juba River flows during the dry season
Source: Own elaboration
Figure 34: Sectoral water demands within Somalia and Somali Shabelle River flows during the dry season
Source: Own elaboration For the analysis of dry season demands and flows, mean monthly values for December, January, February and March were aggregated: Monthly data on river flows was
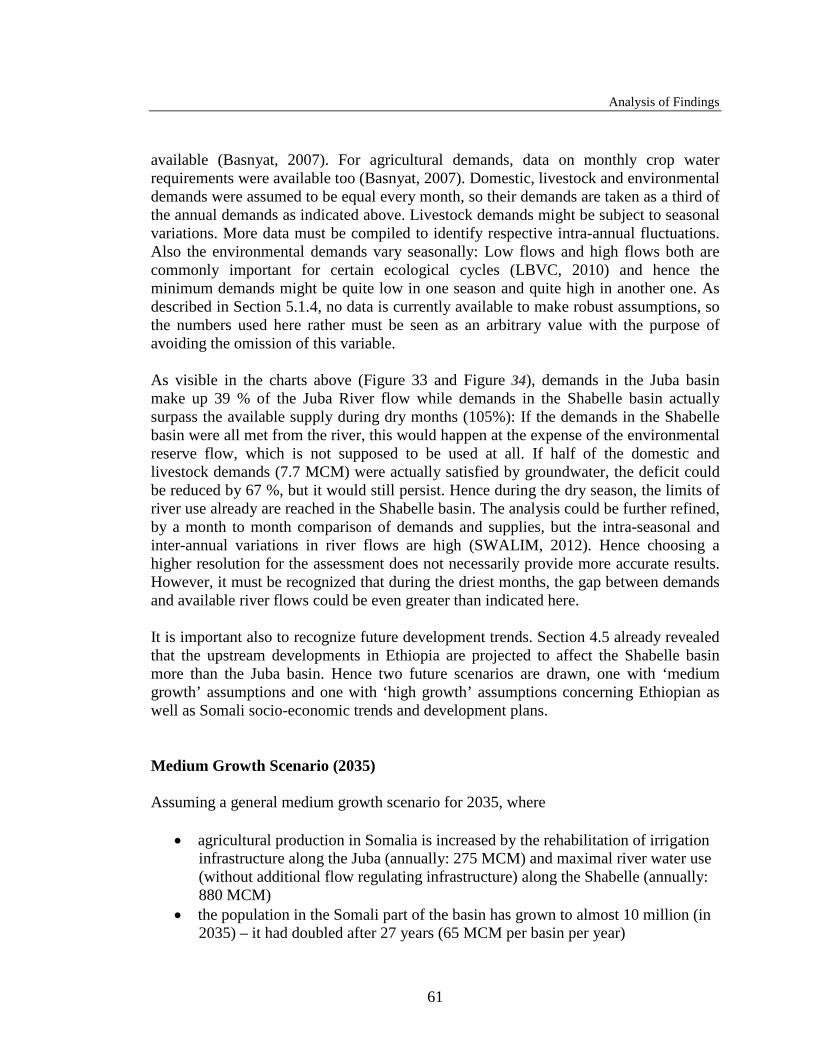
Analysis of Findings
61
available (Basnyat, 2007). For agricultural demands, data on monthly crop water requirements were available too (Basnyat, 2007). Domestic, livestock and environmental demands were assumed to be equal every month, so their demands are taken as a third of the annual demands as indicated above. Livestock demands might be subject to seasonal variations. More data must be compiled to identify respective intra-annual fluctuations. Also the environmental demands vary seasonally: Low flows and high flows both are commonly important for certain ecological cycles (LBVC, 2010) and hence the minimum demands might be quite low in one season and quite high in another one. As described in Section 5.1.4, no data is currently available to make robust assumptions, so the numbers used here rather must be seen as an arbitrary value with the purpose of avoiding the omission of this variable. As visible in the charts above (Figure 33 and Figure 34), demands in the Juba basin make up 39 % of the Juba River flow while demands in the Shabelle basin actually surpass the available supply during dry months (105%): If the demands in the Shabelle basin were all met from the river, this would happen at the expense of the environmental reserve flow, which is not supposed to be used at all. If half of the domestic and livestock demands (7.7 MCM) were actually satisfied by groundwater, the deficit could be reduced by 67 %, but it would still persist. Hence during the dry season, the limits of river use already are reached in the Shabelle basin. The analysis could be further refined, by a month to month comparison of demands and supplies, but the intra-seasonal and inter-annual variations in river flows are high (SWALIM, 2012). Hence choosing a higher resolution for the assessment does not necessarily provide more accurate results. However, it must be recognized that during the driest months, the gap between demands and available river flows could be even greater than indicated here. It is important also to recognize future development trends. Section 4.5 already revealed that the upstream developments in Ethiopia are projected to affect the Shabelle basin more than the Juba basin. Hence two future scenarios are drawn, one with ‘medium growth’ assumptions and one with ‘high growth’ assumptions concerning Ethiopian as well as Somali socio-economic trends and development plans. Medium Growth Scenario (2035) Assuming a general medium growth scenario for 2035, where
• agricultural production in Somalia is increased by the rehabilitation of irrigation infrastructure along the Juba (annually: 275 MCM) and maximal river water use (without additional flow regulating infrastructure) along the Shabelle (annually: 880 MCM)
• the population in the Somali part of the basin has grown to almost 10 million (in 2035) – it had doubled after 27 years (65 MCM per basin per year)

Analysis of Findings
62
• livestock numbers in Somalia are assumed to have doubled, too, heavily straining the environment, leading to overgrazing and erosion as well as the accelerated depletion of seasonal ponds and reservoirs with the consequence of a heavier reliance on river water (41.6 MCM per basin per year)
• environmental flow demands stay the same (annually 590 MCM for the Juba and 240 MCM for the Shabelle River), relative to the initial (!) river flow
• on the supply side a medium upstream development in Ethiopia is taking place, using the 2010 MoA assumptions for the Shabelle River (1300 MCM) and the 2022 scenario for the Juba River (760 MCM), together this results into a flow reduction by 2060 MCM13.
A ‘medium scenario‘ of annual sectoral demands in the two river basins is determined and illustrated in Figure 35.
Figure 35: Medium growth scenario for annual sectoral water demands in the Somali Juba and Shabelle basin
Source: Own elaboration The ‘remaining river flow’ is the result of the initial flow (8300 MCM) minus the Ethiopian water needs according to the MoWR (2060 MCM) minus the agricultural, 13 As described in Section 4.5, the Ethiopian master plans (MoWR, 2005b and 2007) refer to average river flows of 6.75 BCM for the Juba and 3.9 BCM for the Shabelle River, while the estimates on the Somali side indicate lower numbers: 5.9 BCM for the Juba River and 2.4 BCM for the Shabelle River (Basnyat and Gadain, 2009, based on the gauging stations at Luuq and Beled Weyne). It must be assumed here, that the total abstractions on the Ethiopian side have been correctly indicated by the MoWR and that the Somali gauging stations yield the most reliable numbers on stream flows entering the country.

Analysis of Findings
63
domestic, livestock and environmental water demands (2198 MCM) in the Somali part of the basin. The annual figure reveals that the water demands in the Somali basin, under medium growth assumptions, would make up 35 % of the Juba and Shabelle stream flows. But again, a comparison for the two rivers shall be performed in order to reveal the differences in developments and their impacts on the single basins. As above, domestic and livestock demands are equally assigned to the two rivers. Environmental demands amount to 10 % of initial flows each and the agricultural as well as upstream modalities have been set as stated above. It must be highlighted at this point again, that there is a data mismatch between the Ethiopian and Somali side: The Ethiopian master plans (MoWR, 2005b and 2007) refer to average river flows of 6.75 BCM for the Juba and 3.9 BCM for the Shabelle River, while the estimates on the Somali side indicate lower numbers: 5.9 BCM for the Juba River and 2.4 BCM for the Shabelle River (Basnyat and Gadain, 2009). Ethiopia hence assumes quite high water availability and has envisioned correspondingly high absolute abstractions from the rivers. These, at some point, might surpass the available river flows, as measured in Somalia. The different assumptions therefore are a fundamental threat to even basic cooperative efforts between the two riparian states. The current mismatch has to be dealt with, so for the analysis at hand it is assumed, that the total abstractions on the Ethiopian side have been correctly indicated by the MoWR and that the Somali gauging stations yield the most accurate numbers on stream flows entering the country. For the Shabelle River for instance, the Ethiopian water demands of 1300 MCM have been abstracted from the total annual stream flow of 2400 MCM. Of the 1100 MCM entering Somalia, the Somali water demands are abstracted (1226.6 MCM), resulting into a deficit of about 127 MCM. The Ethiopian water demands were not explicitly illustrated in the charts though in order to maintain the focus of this assessment on the water demands within the Somali part of the basin.

Analysis of Findings
64
Figure 36: Medium growth scenario for annual sectoral water demands in the Somali Juba basin
Source: Own elaboration
Figure 37: Medium growth scenario for annual sectoral water demands in the Somali Shabelle basin
Source: Own elaboration
The difference between the Juba and Shabelle River becomes highly visible in this scenario: While in the Juba basin demands make up 19 % of its river flows, demands in the Shabelle basin make up 112 % of the average total stream flow. The demands are by far beyond the supply and if agriculture, livestock and domestic demands were maintained, this would happen, again, at the cost of environmental reserve flows, which would reduce to 4.7 % instead of the 10 % of the total annual river flows envisioned by the very conservative arbitrary share set for this variable. According to these calculations, only if Ethiopia would experience a slower or reduced growth in demands, and annual projected abstractions would be lower by 12 % (=150 MCM), the Somali water balance would remain without annual deficit. This scenario hence reveals the need for negotiations and a compromise between the two riparian states in order to respect their mutual water needs to sustain the socio-economic developments in the greater region. Again, the dry season demands and supplies shall be illustrated, in order to examine the situation in times of lowest water supplies: The monthly flow and demand values for the Jilaal season have been selected (December, January, February and March) and aggregated. Monthly projections for river flows were available for the Ethiopian parts of the rivers only, but the seasonal shares could directly be transferred to the Somali river

Analysis of Findings
65
flows and hence a quite precise discrimination was achieved (MoWR, 2005b; MoWR, 2007; Basnyat, 2007; Basnyat and Gadain, 2009). The available river flows at the Somali-Ethiopian border during the Jilaal season are hence projected as 106914 MCM and 290.215 MCM for the Juba and the Shabelle River respectively. Due to the upstream developments (e.g. the HPP GD3) some flow regulation would be achieved at the Juba River in the medium growth scenario. Hence the dry season flows are relatively high as compared to current low flows in the Juba basin. No flow regulation is happening in the Shabelle basin under this scenario. Here the flow regulation will begin in a later phase, with the implementation of the multipurpose dam project WS18. As mentioned above, the Ethiopian demands are not displayed explicitly in the chart, but they are accounted for and have been abstracted from the total river flows along with the Somali water demands, yielding the respective ‘remaining river flows’. Figures of Basnyat (2007) were used to determine the seasonal shares of crop water requirements16. It was assumed that the current seasonality of agricultural demands is maintained and hence the seasonal shares of future agricultural water demands could be determined. Identical monthly shares for domestic, livestock and environmental demands were assumed. The results of these calculations are displayed in the charts below:
14 5900 MCM (annual average total river flow at Luuq) – 760 MCM (abstractions by upstream developments in Ethiopia) * 0.208064 (this is the share of the 4 months (DJFM = 465 MCM) to the total river flows (2235) in 2022 according to the MoWR, 2007. It is used here as a factor to determine future Jilaal river flows within Somalia) = 1069 MCM 15 2400 MCM (annual average total river flow at Belet Weyne) – 1300 MCM (abstractions by upstream developments in Ethiopia) * 0.2637 (this is the share of the 4 months (DJFM) to the total river flows in 2010 according to the MoWR, 2005b) = 290.2 16 The crop water requirements of December, January, February and March were aggregated (e.g. 151 MCM along the Shabelle) and divided by the total annual crop water requirements (591.45 MCM along the Shabelle), yielding a ratio (25.53 %) that was used to determine the seasonal share of projected agricultural demands (e.g. 880 MCM annually * 0.2553 = 224.668 MCM during the dry season in the Shabelle basin. In the Juba basin, the ratio is 31.5 % (54MCM/171.42 MCM), yielding 86.62 MCM for the Jilaal season (275 MCM*0.315)

Analysis of Findings
66
Figure 38: Medium growth scenario: Sectoral water demands within Somalia versus Somali Juba River flows during the dry season
Source: Own elaboration
Figure 39: Medium growth scenario: Sectoral water demands within Somalia versus Somali Shabelle River flows during the dry season
Source: Own elaboration In the Juba basin, the Somali demands make up about 30 % of the seasonal Somali river flows according to this scenario. The Somali water demands in the Shabelle basin make up 117 % of the total flows and hence the seasonal gap is only slightly more severe than the annual one. This is due to the fact that the highest crop water demands do not occur during the Jilaal season, but during June, July and August, as illustrated in Figure 20 in

Analysis of Findings
67
Section 5.1.1. Nevertheless, the gap in the water balance is alarming and demonstrates the limits of development especially in the Shabelle basin. Even if domestic and livestock demands were entirely satisfied by groundwater during this season, the deficit would not be covered. Only if Ethiopian abstractions would be reduced, agricultural demands could be maintained without threatening the environmental reserve flow. Despite the alarming results for the medium growth scenario, a high growth scenario shall still be drawn. High Growth Scenario (2055) Assuming a high growth scenario for 2055, where
• agricultural production in Somalia is increased, maintaining the irrigation infrastructure along the Juba and achieving a maximum river water use (regulated), plus extensions along the Shabelle (total: 2915 MCM according to an expert estimate)
• the population in the Somali part of the basin has grown to almost 17 million in 2055 (237.5 MCM; 118.75 per basin per year)
• livestock numbers in Somalia stayed the same since 2035 since environmental limits presumably are reached (41.6 MCM per basin per year)
• environmental flow demands stay the same (annually 590 MCM for the Juba and 240 MCM for the Shabelle River), relative to the initial (!) river flow
• on the supply side an intensive upstream development in Ethiopia is taking place (using the 2035 MoA assumptions for the Shabelle River (3150 MCM) and the 2037 scenario for the Juba River (1180 MCM), together: 4330 MCM)
the following ’high growth scenario‘ of annual sectoral water demands is determined:

Analysis of Findings
68
Figure 40: High growth scenario for annual sectoral water demands in the Somali Juba and Shabelle basin
Source: Own elaboration The ‘remaining river flow’ is the result of the initial flow (8300 MCM) minus the Ethiopian water needs according to the MoWR (4330 MCM) minus the agricultural, domestic, livestock and environmental water demands (4063.9 MCM) in the Somali part of the basin. The negative result for the remaining river flow is again not entirely correct, since, as mentioned above, not all demands are actually satisfied from the river. The domestic as well as livestock demands are partly satisfied by groundwater, eventually compensating the deficit. Nevertheless, the total river flow would be reduced to a minimum in any case. And if environmental demands were in fact higher than the assumed 10 %, the limits for development would be crossed and development would happen at the cost of environmental services, the traditional livelihood and hence the life quality of current and future generations. In the high growth scenario agriculture is using about 73 % of the river water entering Somalia. Also the domestic demands have increased in absolute and relative terms: In 2005 domestic demands were only slightly greater (1.23 times) than the livestock demands, in 2055 they are projected to be 2.83 times greater. The results surely mainly reflect the underlying assumptions and these are only of limited validity due to the lack of data and the highly unstable general situation in Somalia. However, they serve to reveal the consequences of certain development trends as well as the need for revision of respective development plans.

Analysis of Findings
69
The results are, again, quite distinct if examining the Juba and Shabelle River separately. Since the expert estimate for agricultural demands cannot be traced back and assigned separately to the two river basins, slightly different assumptions must be used here: 275 MCM for agricultural demands along the Juba River and 2365 MCM for respective demands along the Shabelle River (for details, see Section 5.1.1). Domestic and livestock demands are again assumed to be equal for the two basins and environmental demands amount to 10% of the initial average annual river flows.
Figure 41: High growth scenario for annual sectoral water demands in the Somali Juba basin
Source: Own elaboration
Figure 42: High growth scenario for annual sectoral water demands in the Somali Shabelle basin
Source: Own elaboration
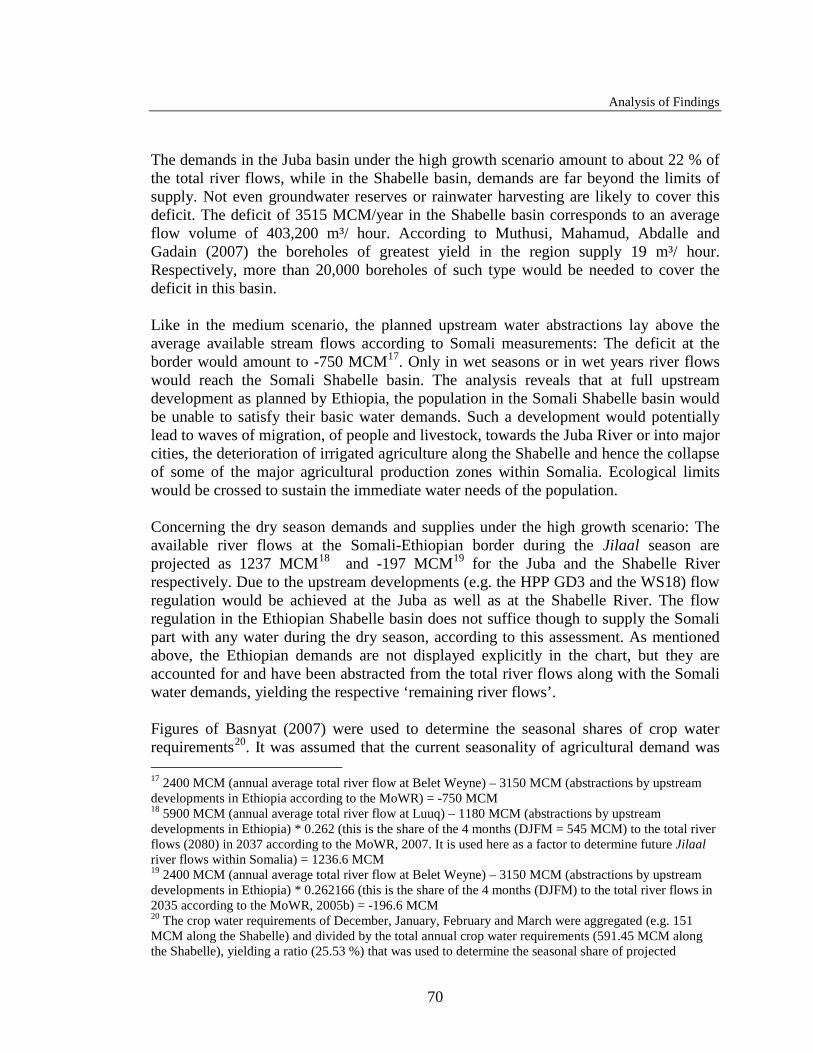
Analysis of Findings
70
The demands in the Juba basin under the high growth scenario amount to about 22 % of the total river flows, while in the Shabelle basin, demands are far beyond the limits of supply. Not even groundwater reserves or rainwater harvesting are likely to cover this deficit. The deficit of 3515 MCM/year in the Shabelle basin corresponds to an average flow volume of 403,200 m³/ hour. According to Muthusi, Mahamud, Abdalle and Gadain (2007) the boreholes of greatest yield in the region supply 19 m³/ hour. Respectively, more than 20,000 boreholes of such type would be needed to cover the deficit in this basin. Like in the medium scenario, the planned upstream water abstractions lay above the average available stream flows according to Somali measurements: The deficit at the border would amount to -750 MCM17. Only in wet seasons or in wet years river flows would reach the Somali Shabelle basin. The analysis reveals that at full upstream development as planned by Ethiopia, the population in the Somali Shabelle basin would be unable to satisfy their basic water demands. Such a development would potentially lead to waves of migration, of people and livestock, towards the Juba River or into major cities, the deterioration of irrigated agriculture along the Shabelle and hence the collapse of some of the major agricultural production zones within Somalia. Ecological limits would be crossed to sustain the immediate water needs of the population. Concerning the dry season demands and supplies under the high growth scenario: The available river flows at the Somali-Ethiopian border during the Jilaal season are projected as 1237 MCM18 and -197 MCM19 for the Juba and the Shabelle River respectively. Due to the upstream developments (e.g. the HPP GD3 and the WS18) flow regulation would be achieved at the Juba as well as at the Shabelle River. The flow regulation in the Ethiopian Shabelle basin does not suffice though to supply the Somali part with any water during the dry season, according to this assessment. As mentioned above, the Ethiopian demands are not displayed explicitly in the chart, but they are accounted for and have been abstracted from the total river flows along with the Somali water demands, yielding the respective ‘remaining river flows’. Figures of Basnyat (2007) were used to determine the seasonal shares of crop water requirements20. It was assumed that the current seasonality of agricultural demand was 17 2400 MCM (annual average total river flow at Belet Weyne) – 3150 MCM (abstractions by upstream developments in Ethiopia according to the MoWR) = -750 MCM 18 5900 MCM (annual average total river flow at Luuq) – 1180 MCM (abstractions by upstream developments in Ethiopia) * 0.262 (this is the share of the 4 months (DJFM = 545 MCM) to the total river flows (2080) in 2037 according to the MoWR, 2007. It is used here as a factor to determine future Jilaal river flows within Somalia) = 1236.6 MCM 19 2400 MCM (annual average total river flow at Belet Weyne) – 3150 MCM (abstractions by upstream developments in Ethiopia) * 0.262166 (this is the share of the 4 months (DJFM) to the total river flows in 2035 according to the MoWR, 2005b) = -196.6 MCM 20 The crop water requirements of December, January, February and March were aggregated (e.g. 151 MCM along the Shabelle) and divided by the total annual crop water requirements (591.45 MCM along the Shabelle), yielding a ratio (25.53 %) that was used to determine the seasonal share of projected
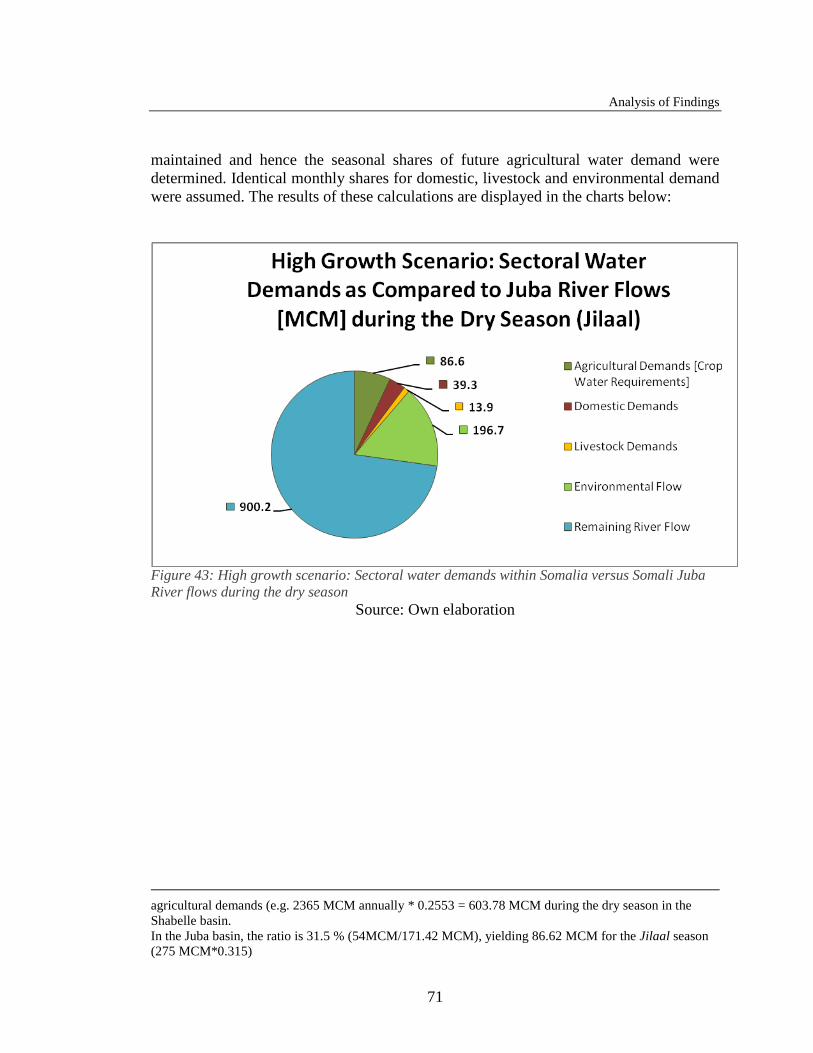
Analysis of Findings
71
maintained and hence the seasonal shares of future agricultural water demand were determined. Identical monthly shares for domestic, livestock and environmental demand were assumed. The results of these calculations are displayed in the charts below:
Figure 43: High growth scenario: Sectoral water demands within Somalia versus Somali Juba River flows during the dry season
Source: Own elaboration
agricultural demands (e.g. 2365 MCM annually * 0.2553 = 603.78 MCM during the dry season in the Shabelle basin. In the Juba basin, the ratio is 31.5 % (54MCM/171.42 MCM), yielding 86.62 MCM for the Jilaal season (275 MCM*0.315)

Analysis of Findings
72
Figure 44: High growth scenario: Sectoral water demands within Somalia versus Somali Shabelle River flows during the dry season
Source: Own elaboration The seasonal differentiation confirms the massive hydrological deficit in the Shabelle basin under high growth assumptions. Demands in the Somali Juba basin still only make up 15.7 % of the Juba River flow, even under high growth assumptions. As a last step, the different scenarios and their impacts shall be set into direct relation by column charts. At this point the analysis does not start with a basin-wide comparison, but directly proceeds with a separate consideration of the situation along the Juba and the Shabelle River respectively. As revealed above, the growth scenarios affected the two river basins quite differently: While in the Juba basin a positive water balance is maintained under all growth scenarios (see Figure 45), the Shabelle basin already shows deficits under medium growth assumptions (Figure 46). The deficit might partly be buffered by groundwater abstractions and rainwater harvesting, but at some point environmental reserve flows and the domestic water demands in the Somali Shabelle basin would be negatively affected if Ethiopian abstractions were taking place as assumed.

Analysis of Findings
73
Figure 45: Comparison of present and future water demand scenarios in the Somali Juba basin
Source: Own elaboration
Figure 46: Comparison of present and future water demand scenarios in the Somali Shabelle basin
Source: Own elaboration

Analysis of Findings
74
It can be concluded that while the socio-economic development and water use in the Shabelle basin are existentially threatened, there still seems room for development and further water use along the Juba River. More data must be generated and evaluated in order to revise, refine and update all numbers and estimates used for this study.

Conclusions and Recommendations for Future Work
75
Chapter 7. Conclusions and Recommendations for Future Work Comparing the annual sectoral anthropogenic water demands, agriculture, with 715 MCM, is currently by far the largest water consumer in the basin, followed by domestic (51.2 MCM) and livestock water demands (41.6 MCM). This report made an important conceptual contribution to the discussion of local water demands by considering basic environmental needs. With the assumption of a 10 % environmental reserve flow (830 MCM), the annual environmental demands are currently slightly greater than the agricultural water use. This ratio only holds true though for the Juba-Shabelle basin as a whole: In the Shabelle basin, already today, agricultural demands (550 MCM) are greater than the basic environmental demands (240 MCM). This report revealed how differently the Juba and the Shabelle basin are affected and will be affected by the regional interplay of upstream developments, climate change and Somali water demand expansions: Already today, agricultural, domestic, livestock and environmental water demands within Somalia make up 35 % of the Shabelle River flow, while in the Juba basin these demands only amount to 14 % of its river flows. During the dry season the shares are temporarily much higher: Demands in the Juba basin make up 39 % of available river flows, while demands in the Shabelle basin even surpass the available supplies (105%), provided the demands are mainly met from the river. At least during the dry season and in the Shabelle basin, water demands and hence developments already seem to have reached their limits. In the future, flow regulation upstream, e.g. the WS18 dam, could increase the Shabelle stream flows during the dry season, but envisioned water abstractions on the Ethiopian side are projected to leave the river with a constant low flow or no flow at all. In the future, also an increase in population, livestock and agricultural water use within Somalia are expected, leading to an increase in water demands. Under medium growth assumptions (see Section 6) the Juba basin would be left with a river flow of about 4170 MCM/year, while the Shabelle basin would experience an annual deficit of 127 MCM. Solutions for this shortage must be found, whether via negotiations with Ethiopia or via demand reductions on the Somali side. If the hydrological deficit is compensated by accessing the environmental reserve flows, key ecosystem functions as well as groundwater renewal may be threatened and by that the livelihood of people in the Shabelle basin could be jeopardized. Under high growth assumptions, the shortage in the Shabelle basin turns out to be even more severe: An annual deficit of 3515 MCM has been determined, surpassing the average annual river water availability of 2400 MCM, as indicated by Somali measurements. The large deficits calculated for the Shabelle basin derive from a data mismatch between official Ethiopian and Somali reports: According to the Ethiopian

Conclusions and Recommendations for Future Work
76
Ministry of Water Resources, the Shabelle River carries 3900 MCM, 1500 MCM more than the Somali figures show. According to the Ethiopian master plan for development (2005b), Ethiopia envisions to annually abstract 3150 MCM (=81 % of the river flow according to their calculation) from the Shabelle River. By that, their abstractions would be greater (131 %) than the river flows measured on the Somali side. The data mismatch has to be resolved in order to draw coherent scenarios for development and to constitute common ground for negotiations between the two states. For the Juba basin, the limits of growth are less obvious since river flows are generally greater (5900 MCM), agricultural abstractions on the Somali side are significantly lower and upstream developments on the Ethiopian side also take a lower fraction of the stream low (20% of the Juba River flow according to Ethiopian data). For both, the Juba and the Shabelle basin the analysis must be refined and revised based on updated, complete and coherent data. Concrete gaps in data availability and drawbacks in data quality have been revealed in this study and hence an improvement in the following aspects is recommended:
• Data on river flows has to be reviewed, due to a mismatch in statements between Ethiopia and Somalia. Common figures are a prerequisite for negotiations and holistic planning procedures in the basin.
• More information on groundwater availability in Somalia is needed: On its extent, location, recharge rates, safe yields, current amounts of abstraction, basic quality and purpose of use (sectoral shares).
• More data is needed on water demands in the basin: On its extent, the location and the temporal variability. Combining this information with data on actual river flows and groundwater availability, local demands and supplies could be compared in a more accurate and meaningful way. Software such as WEAP could then be used to generate basic models and illustrate growth potentials or water shortages.
• An expert workshop is recommended in order to perform a country specific environmental flow analysis. Robust estimates on respective water demands have to be generated based on information about the aquatic and riparian ecology, the water quality, hydraulics, hydrology and geomorphology in the Juba and Shabelle basin. The aim would be to reveal the water needs of those ecosystem function that are an important part of the livelihoods of the riparian population. Together with the domestic demands, environmental reserve flows constitute the absolute minimum requirement in terms of stream flow on the Somali side.
• The area of irrigated agriculture is a key variable in determining agricultural water needs. Hitherto, estimates by Basnyat (2007) were used since recent mapping efforts did not match the conceptual focus of this assessment (Oduori, Oroda, Gadain and Rembold, 2012). However, the data and methodology used seem promising: If data of comparable quality was available on the annual and

Conclusions and Recommendations for Future Work
77
monthly extent and location of irrigated agriculture, too, statements on agricultural water demands in the Somali part of the basin would be more precise than ever.
• Industrial demands must be investigated, particularly their impacts on the water quality.
• More data on rainwater harvesting is needed, too, in order to estimate how much of the demands could be satisfied by these means instead of groundwater or river water abstractions. Interesting are the current use and well as the potential, based on roof surfaces and geological circumstances.

References
78
References
Arnell, N.W. 1999. Climate Change and Global Water Resources Global Environmental Change 9, S31-S49/Pergammon
Awulachew, S. B.; Yilma, A. D.; Loulseged, M.; Loiskandl, W., Ayana, M.; Alamirew, T. 2007. Water Resources and Irrigation Development in Ethiopia. Colombo, Sri Lanka: International Water Management Institute. 78p. (Working Paper 123) available online at: http://www.iwmi.cgiar.org/publications/Working_Papers/working/WP123.pdf (Date of access: 29.11.2012)
Basnyat, D. B. and Gadain H. M. 2009. Hydraulic Behaviour of the Juba and Shabelle Rivers: Basic Analysis for Irrigation and Flood Management Purposes. Technical Report No W-13, FAO-SWALIM, Nairobi, Kenya.
Basnyat, D. B. 2007. Water Resources of Somalia. Technical Report No W-11, FAO-SWALIM, Nairobi, Kenya
Cheung, W.H., Senay, G.B. and Singh, A. 2008. Trends and spatial distribution of annual and seasonal rainfall in Ethiopia. INTERNATIONAL JOURNAL OF CLIMATOLOGY. (www.interscience.wiley.com) DOI: 10.1002/joc.1623. Available online at: http://earlywarning.usgs.gov/fews/pubs/JOC%201623.pdf (Date of access:28.11.2012)
EC 2004. Project Development: Rural Water and Sanitation Interventions in Northeast and Southern Somalia. Volume II Preliminary Assessment and Strategic Approaches Report. Available online at: http://agris.fao.org/agris-search/search/display.do?f=2010%2FSO%2FSO1001.xml%3BSO2005100215 (date of access: 19.11.2012)
Elmi, A.A. 2001. Livestock Production in Somalia with Special emphasis on Camels. Commission on Nomadic Peoples. Available online at: http://cnp.nonuniv.ox.ac.uk/pdf/NP_journal_back_issues/Livestock_Production_in_Somalia_with_special_emphasis_on_Camels_AA_Elmi.pdf (Date of access: 14.12.2012)
Erta 2011. Gode irrigation scheme changing livelihoods of local communities. Article available onliene at: http://www.ertagov.com/erta/erta-news-archive/38-erta-tv-hot-news-addis-ababa-ethiopia/543-gode-irrigation-scheme-changing-livelihoods-of-local-communities.html (Date of access: 29.11.2012]
EU 2002. Study on the Commercialisation of Urban Water Distribution and Collection and Disposal of Solid and Liquid Waste in Somalia Final Report. Available online at: http://www.docstoc.com/docs/2375779/Study-on-the-Commercialisation-of-Urban-Water-Distribution-and (Date of access: 21.11.2012)

References
79
Faillace, C and Faillace, E. R. 1987. Water Quality Data Book of Somalia. General Report. GTZ Project No. 80.2193.3-09.112. GTZ and Water Development Agency (WDA), Somalia
FAO 1966 Agricultural and Water Surveys for Somalia, Volume IV - Livestock and crop production. Rome, Italy. Available online at: http://agris.faoswalim.org/cgi-bin/isis3w.exe?rec_id=000047&database=agris&search_type=link&table=mona&back_path=/agris/mona&lang=eng&format_name=EFMON (Date of access 14.11.2012)
FAO 1968. Agricultural and Water Surveys. Somalia. Final Report. Volume 2. WATER RESOURCES. Rome, Italy. Available online at: http://agris.faoswalim.org/resources/Series/Agricultural_and_Water_surveys_of_Somalia/Vol_2_Water_Resources.pdf (Date of access: 14.11.2012)
FAO 1968. Agricultural and Water surveys Somalia, Volume VI - Social and economic aspects of Development. Rome, Italy. Available online at: http://agris.faoswalim.org/resources/Series/Agricultural_and_Water_surveys_of_Somalia/Vol_6_Social_and_Economic_Aspects_of_Development.pdf (Date of access:14.11.2012)
FAO 1991. Water Harvesting. Section 3: Rainfall-Runoff Analysis. FAO Corporate Document Repository. Available online at: http://www.fao.org/docrep/U3160E/u3160e05.htm (Date of access: 15.12.2012)
FAO / EC 2004. Banana Sector Study for Somalia. Agricultural Development and Diversification Strategy in Lower Shabelle. Availöable online at: http://agris.faoswalim.org/resources/Agriculture/Banana_sector_study_for_Somalia/Agricultural_Development_diversification_Strategy_Lower_Shabelle.pdf (Date of access: 20.11.2012)
FAO/WB/EU 2004. Towards a livestock Sector Strategy. Somalia. Available online at: http://siteresources.worldbank.org/SOMALIAEXTN/Resources/so_LS_final_rpt.pdf (Date of access: 14.12.2012)
FAO 2006. Access to water, pastoral resource management and pastoralists’ livelihoods. Lessons learned from water development in selected areas of Eastern Africa (Kenya, Ethiopia, Somalia). LSP Working Paper 26. Nathalie Gomes. Available online at: http://www.fao.org/es/esw/lsp/cd/img/docs/LSPWP26.pdf (Date of access: 14.12.2012)
FAO SWALIM 2009. Atlas of Somali Water and Land Resources. First edition, Nairobi, Kenya.
FAO SWALIM 2010 Atlas of the Juba and Shabelle Rivers in Somalia, http://www.faoswalim.org/subsites/River_Atlas_Files/River_Atlas_Documents/index.html
FAO SWALIM 2009. Technical Report L-14: Omuto, C.T., Vargas, R. R., Alim, M.S., Ismail, A., Osman, A., Iman. H.M. 2009. Land degradation assessment and a monitoring framework in Somalia. Nairobi, Kenya.

References
80
FAO SWALIM 2012. Juba and Shabelle River Flow Data. Time Series. Available online at: http://www.faoswalim.org/river_flow_data (Date of access: 20.11.2012)
FEWS 1988. Compendium of Agricultural Statistics, State Planning Commission
FSNAU 2009. Food Security and Nutrition Analysis Unit –Somalia. Post Gu ’ 09 Assessment Analysis FSEDC Meeting. PowerPoint presentation available online at: http://reliefweb.int/report/somalia/somalia-fsnau-presentation-post-gu-09-assessment-analysis-fsedc-meeting-21-aug-2009 (Date of access: 05.12.2012)
FSNAU 2011. Food Security & Nutrition. Quarterly Brief - Focus on Deyr Season Early Warning. Available online at: http://www.oxfamnovib.nl/Redactie/Downloads/Rapporten/FSNAU-Quarterly-Brief-October-2011.pdf (Date of access: 05.12.2012)
FSNAU 2012. Post Gu 2012 Presentation. Juba Regions. Available online at: www.fsnau.org/downloads/Juba-Regional-Presentation-Gu-2012.pdf (Date of access: 05.12.2012) FSNAU 2012b. Food Security and Nutrition Analysis. Technical Series Report No. VI 48. Available online at: www.fsnau.org/.../FSNAU-Post-Gu-2012-Technical-Report.pdf (Date of Access: 07.12.2012)
Funk, C., Michaelsen, J. and Marshall, M. 2011. Mapping recent decadal climate variations in precipitation and temperature across Eastern Africa and the Sahel. Section 14 in Remote Sensing of Drought: Innovative Monitoring Approaches. Edited by: Wardlow, B., Anderson, M., Verdin, J. Taylor and Francis. Available online at: http://earlywarning.usgs.gov/fews/pubs/mapping_decadal_variations.pdf (Date of access:29.11.2012)
Gadain, H. M. and Mugo, M. W. 2009. Report on UNICEF Water Interventions Mapping (2005-2009), Technical Report No W-19, FAO-SWALIM, Nairobi, Kenya
Gleick, P.H. 1996. Basic Water Requirements for Human Activities: Meeting Basic Needs. Water International. Volume 21. Issue 2. Available online at: http://www.pacinst.org/reports/basic_water_needs/basic_water_needs.pdf (Date of access: 17.12.2012)
HLC 2008. National Investment Brief Somalia. High Level Conference: Water for Agriculture and Energy in Africa: the challenges of climate change. Available online at: http://www.sirtewaterandenergy.org/docs/reports/Somalia-Draft2.pdf (Date of access: 28.11.2012)
Houghton-Carr, H. A., Print, C. R., Fry, M. J., Gadain, H. & Muchiri, P. 2011. An assessment of the surface water resources of the Juba-Shabelle basin in southern Somalia. Hydrol. Sci. J. 56(5), 759–774.
IUCN 2006. Country Environmental Profile for Somalia.

References
81
IWA 2012. Demographics, practices and water quality from domestic potable rainwater harvesting systems. Journal of Water Supply: Research and Technology—AQUA Vol. 61 No 5 pp 261–271
IWMI 2010. Irrigation potential in Ethiopia. Constraints and opportunities for enhancing the system. Available online at: http://ethiopianagriculture.files.wordpress.com/2010/11/ethiopia-irrigation-diagnostic-july-20101.pdf (Date of access: 29.11.2012)
IWR 2010. Hydrological Information and the Ecological Reserve. Website of the Rhodes University: http://www.ru.ac.za/static/institutes/iwr/software/reserve/reserve.php (Date of access: 14.12.2012)
IWRA 1996. Basic Water Requirements for Human Activities:
Meeting Basic Needs. Pacific Institute for Studies in Development, Environment, and Security IUCN 2003. Flow. The essentials of environmental flows. Available online at: http://moderncms.ecosystemmarketplace.com/repository/moderncms_documents/iucn_the-essentials-of-environmental-flows.pdf (Date of access:14.12.2012)
LVBC 2010. Assessing Reserve Flows for the Mara River. Lake Victoria Basin Commission, Kisumu, Kenya. Report available online at: http://wwf.panda.org/who_we_are/wwf_offices/eastern_southern_africa/publications/?193036/Assessing-Reserve-Flows-for-the-Mara-River (Date of access:06.12.2012)
Mbara C.J., Gadain H.M and Muthusi F.M. 2007. Status of Medium to Large Irrigation Schemes in Southern Somalia, Technical Report No W-05, FAO-SWALIM, Nairobi, Kenya
Ministry of National Planning, 1990. Somalia in figures (Lith. Ed). Mogadishu.
Ministry of Water resources Ethiopia 2004. WABI SHEBELE RIVER BASIN INTEGRATED DEVELOPMENT MASTER PLAN STUDY PROJECT. Final Report. Phase 2. Data Collection, Site investigation. Survey & Analysis.
Ministry of Water resources Ethiopia 2004b. WABI SHEBELE RIVER BASIN INTEGRATED DEVELOPMENT MASTER PLAN STUDY PROJECT. Final PHASE II Report. PHASE II- Data collection, site investigation, Survey & Analysis SECTION II SECTORAL STUDIES . VOLUME VIII – WATER RESOURCES Part 4 - IRRIGATION & DRAINAGE
Ministry of Water resources Ethiopia 2005. WABI SHEBELE RIVER BASIN INTEGRATED DEVELOPMENT MASTER PLAN STUDY PROJECT. Draft Final Phase 3 Report. Phase 3. Master Plan Formulation. Volume 1. Master Plan Main Report.
Ministry of Water Resources. 2005b. INTEGRATED DEVELOPMENT MASTER PLAN STUDY PROJECT. FINAL PHASE III REPORT. PHASE III – MASTER

References
82
PLAN FORMULATION.VOLUME 3. WATER ALLOCATION AND UTILIZATION REPORT
Ministry of Water Resources Ethiopia. 2006. Genale-Dawa River Basin Integrated Resources Development Master Plan Study. Final Report. Part 1. Master Plan. Vol. l.1. A Main report.
Ministry of Water Resources Ethiopia. 2007. Genale-Dawa River Basin Integrated Resources Development Master Plan Study. Final Report. Part 1. Master Plan.. Vol. l. 3. C. Master Planning Models D. GIS and Databases.
Monaci, L., Downie, M., Oduori, S. 2007. Land Cover of Selected Study Areas in Somaliland and Southern Somalia. FAO-SWALIM. Project Report No L-03. , Nairobi, Kenya.
Muchiri P.W. 2007a. Climate of Somalia. Technical Report No W-01, FAO-SWALIM, Nairobi, Kenya
Muchiri, P. W. 2007b. Inventory of Hydro-Meteorological Data of Somalia. Technical Report No W-03. FAO-SWALIM, Nairobi, Kenya. Muthusi F.M., Mahamud G., Abdalle A., Gadain H.M. 2007. Rural Water Supply Assessment, Technical Report No-08, FAO-SWALIM, Nairobi, Kenya.
Muthusi F. M., Mugo M. W., and Gadain H. M. 2009. Water Sources Inventory for Central – South Somalia. Technical Report No W-17, FAO-SWALIM (GCP/SOM/048/EC) Project, Nairobi, Kenya
Mutua, F. M. Zoltan, B. 2009. Analysis of the General Climatic Conditions to Support Drought Monitoring in Somalia. Technical Report No W-14, FAO-SWALIM Nairobi, Kenya
Nilsson, C., and Malm Renöfält, B. 2008. Linking flow regime and water quality in rivers: a challenge to adaptive catchment management. Ecology and Society 13(2): 18. [online] URL: http://www.ecologyandsociety.org/vol13/iss2/art18/
Oduor A.R. Gadain, H. M. 2007: Potential of Rainwater Harvesting in Somalia, A Planning, Design, Implementation and Monitoring Framework, Technical Report NoW-09, 2007,FAO-SWALIM, Nairobi, Kenya. SWALIM FAO
Oduori, S., Vargas, R. and Alim, M. 2007b. Land Use Characterisation of the Juba and Shabelle riverine areas in Southern Somalia. FAO-SWALIM. Project Report No. L-07. Nairobi, Kenya.
Oduori, S. M., Oroda A. S., Gadain H., and Rembold, F. 2012. Estimating Cultivable Areas in Central and Southern Somalia using Remote Sensing by FAO-SWALIM. Project Report No. RSM 02 Nairobi, Kenya.
UN Data, 2012. Somalia. United Nations Statistics Division. Available online at: http://data.un.org/CountryProfile.aspx?crName=Somalia (Date of access: 13.12.2012)

References
83
UNEP 2010. Africa Water Atlas. Available online at: http://www.unep.org/pdf/africa_water_atlas.pdf (Date of access: 13.12.2012)
UNDP/World Bank 2002. Socio Economic Survey 2002. Somalia. Report No. 1. Somalia Watching Brief 2003. Available online at: http://siteresources.worldbank.org/INTSOMALIA/Resources/swb_complete_report.pdf (Date of access: 13.12.2012)
UNDP 2008. Climate Change Country Profile Ethiopia. Available online at: http://www.geog.ox.ac.uk/research/climate/projects/undp-cp/ (Date of access 19.11.2012)
UNDP 2008b. Somalia Country Profile: Lower Shabelle. Available online at: http://www.so.undp.org/census/profiles/lower_shabelle.php (Date of access: 05.12.2012)
UNDP 2011. Human Development Report Somalia. Available online at: http://hdr.undp.org/en/reports/national/arabstates/somalia/Somalia_2001_en.pdf (Date of access: 29.11.2012]
UNDP 2011b. Crisis Brief: Horn of Africa. Crisis prevention and recovery. Available online at: http://www.undp.org/content/dam/undp/library/crisis%20prevention/UNDP%20Crisis_brief_horn_of_africa.pdf (Date of access: 13.12.2012)
UNDP 2012. Human Development Report Somalia. Available online at: http://hdr.undp.org/en/reports/national/africa/somalia/Somalia%20Report%202012.pdf (Date of access: 29.11.2012]
UNEP 2005. State of the Environment in Somalia. A Desk Study.
UNICEF 2011. Report on Cholera and Diarrhoea incidences in southern Somalia. Available online at: http://www.unicef.org/esaro/5440_Somalia_waterborne_disease_threat.html (Date of access: 20.11.2012)
UNICEF 2012. The State of the World’s Children. Children in an Urban World. Report available online at: http://www.unicef.org/sowc/files/SOWC_2012-Main_Report_EN_21Dec2011.pdf (13.12.2012)
UN-HABITAT 2008. Land, Property and Housing in Somalia. Available Online at. http://www.unhabitat.org/pmss/listItemDetails.aspx?publicationID=2601 (Date of access: 19.11.2012)
Vargas, R. R., Omuto, C., and Alim, M. S. 2007. Soil survey of the Juba and Shabelle riverine areas in Southern Somalia. FA0-SWALIM. Project Report L-08. Nairobi, Kenya.
Venema, J.H. and Vargas, R., 2007. Land suitability assessment of the Juba and Shabelle riverine areas in Southern Somalia. FAO-SWALIM. Project Report No. L-09. Nairobi, Kenya.

References
84
Venema, J.H., 2007. Land resources assessment of Somalia. Technical Project Report L-12. FAO-SWALIM, Nairobi, Kenya.
WHO 2010. The Right to Water. Factsheet Number 35. Available online at: http://www.ohchr.org/Documents/Publications/FactSheet35en.pdf (Date of access: 17.12.2012)
WHO UNICEF 2012. Estimates for the use of Improved Drinking-Water Sources Updated March 2012 Somalia. Available online at: http://www.wssinfo.org/fileadmin/user_upload/resources/FJI_wat.pdf (Date of access 14.11.2012)
WikiCommons 2012. Political map of the Juba and Shabelle Region. Available online at: wikicommons http://upload.wikimedia.org/wikipedia/commons/c/c1/Somalia_pol02.jpg
(Date of access: 15.12.2012)
World Bank 2003. Water Resources and Environment. Technical Note C2. Environmental flows: Case Studies. Available online at: http://iwlearn.net/publications/courses/environmental-flows-case-studies-david-hirji (Date of access: 14.12.2012)
World Bank 2007. Somalia - Interim Strategy Note. Washington D.C. - The World Bank. http://documents.worldbank.org/curated/en/2007/06/7861995/somalia-interim-strategy-note