water demand forecast report - arkansas water plan demand forecast report arkansas natural resources...
TRANSCRIPT

Water Demand Forecast Report
Arkansas Natural Resources Commission
Arkansas State Water Plan Update
September 2013


Table of Contents
1.0 Introduction and Overview ...................................................................................................................... 1 1.1 Sectors of Water Use..................................................................................................................................... 2 1.2 Water Use Data ............................................................................................................................................... 3 1.3 Demographic Projections ........................................................................................................................... 3
2.0 Summary ......................................................................................................................................................... 3
3.0 Demographic Projections .......................................................................................................................... 8 3.1 Population Projections ................................................................................................................................ 8 3.2 Employment Projections ......................................................................................................................... 10
3.2.1 Arkansas Department of Workforce Services Employment Projections ....... 10 3.2.2 Woods & Poole Employment Projections .................................................................... 10
4.0 Municipal (Public-Supply) ..................................................................................................................... 11 4.1 Base Period Water Use ............................................................................................................................. 11 4.2 Future Water Use ........................................................................................................................................ 12 4.3 Water Sources .............................................................................................................................................. 14 4.4 Withdrawals, Consumptive Use, and Water Balance Considerations .................................. 15
5.0 Self-Supplied Domestic ........................................................................................................................... 15
6.0 Self-Supplied Commercial ...................................................................................................................... 16 6.1 Base Period Water Use ............................................................................................................................. 16 6.2 Future Water Use ........................................................................................................................................ 16 6.3 Water Sources .............................................................................................................................................. 17 6.4 Withdrawals, Consumptive Use, and Water Balance Considerations .................................. 17
7.0 Industrial...................................................................................................................................................... 18 7.1 Base Period Water Use ............................................................................................................................. 18 7.2 Future Water Use ........................................................................................................................................ 18 7.3 Water Sources .............................................................................................................................................. 19 7.4 Withdrawals, Consumptive Use, and Water Balance Considerations .................................. 19
8.0 Mining ............................................................................................................................................................ 19 8.1 Base Period Water Use ............................................................................................................................. 19 8.2 Future Water Use ........................................................................................................................................ 19 8.3 Water Sources .............................................................................................................................................. 20 8.4 Withdrawals, Consumptive Use, and Water Balance Considerations .................................. 20
9.0 Shale Gas ....................................................................................................................................................... 20 9.1 Base Period Water Use ............................................................................................................................. 20 9.2 Future Water Use ........................................................................................................................................ 20 9.3 Water Sources .............................................................................................................................................. 22 9.4 Withdrawals, Consumptive Use, and Water Balance Considerations .................................. 22 9.5 Other Considerations to Note ................................................................................................................ 22
i

• Water Demand Forecast Report
10.0 Thermoelectric Power ............................................................................................................................ 23 10.1 Base Period Water Use .............................................................................................................................. 23 10.2 Future Water Use ........................................................................................................................................ 23 10.3 Water Sources ............................................................................................................................................... 24 10.4 Withdrawals, Consumptive Use, and Water Balance Considerations .................................. 24
11.0 Crop Irrigation ........................................................................................................................................... 24 11.1 Base Period Water Use .............................................................................................................................. 24 11.2 Future Water Use ........................................................................................................................................ 26 11.3 Water Sources ............................................................................................................................................... 28 11.4 Withdrawals, Consumptive Use, and Water Balance Considerations .................................. 28
12.0 Livestock ...................................................................................................................................................... 28 12.1 Base Period Water Use .............................................................................................................................. 29 12.2 Future Water Use ........................................................................................................................................ 30 12.3 Water Sources ............................................................................................................................................... 31 12.4 Withdrawals, Consumptive Use, and Water Balance Considerations .................................. 31 12.5 Other Considerations to Note ................................................................................................................ 31
13.0 Aquaculture ................................................................................................................................................. 32 13.1 Base Period Water Use .............................................................................................................................. 32 13.2 Future Water Use ........................................................................................................................................ 33 13.3 Water Sources ............................................................................................................................................... 33 13.4 Withdrawals, Consumptive Use, and Water Balance Considerations .................................. 33
14.0 Waterfowl Management and Duck Hunting .................................................................................... 33 14.1 Base Period Water Use .............................................................................................................................. 34 14.2 Future Water Use ........................................................................................................................................ 34 14.3 Water Sources ............................................................................................................................................... 34 14.4 Withdrawals, Consumptive Use, and Water Balance Considerations .................................. 34 14.5 Other Considerations to Note ................................................................................................................ 35
15.0 Navigation In-stream Water Demands .............................................................................................. 35 15.1 Characteristics of Arkansas Navigation Systems ........................................................................... 36 15.2 Commodity Transport ............................................................................................................................... 36 15.3 Navigation Base Period Water Demand ............................................................................................ 37
15.3.1 Flow/Stage Requirements for Navigation ................................................................... 37 15.3.1.1 Arkansas River................................................................................................ 37 15.3.1.2 Ouachita River ................................................................................................ 37 15.3.1.3 White River ...................................................................................................... 37
15.3.2 System Operations for Navigation .................................................................................. 38 15.3.2.1 Arkansas River................................................................................................ 38 15.3.2.2 Ouachita River ................................................................................................ 39 15.3.2.3 White River ...................................................................................................... 39
15.4 Future Navigation Water Needs ........................................................................................................... 39
ii

• Water Demand Forecast Report
16.0 A Note on Geographic Aggregation and Disaggregation of Demands .................................... 39
17.0 Forecasts by County ................................................................................................................................. 40
18.0 Forecasts by Region.................................................................................................................................. 44
19.0 Forecasts by Sources ................................................................................................................................ 48
20.0 Recommendations .................................................................................................................................... 49
Appendices
Appendix A Population Projections by County and Scenario Appendix B Employment Growth Rates by County Appendix C Municipal Water Demand by County and Scenario (With and Without
Conservation) Appendix D Self-supplied Domestic Water Demand by County and Scenario (With and
Without Conservation) Appendix E Self-supplied Commercial Water Demand by County and Scenario Appendix F Industrial Water Demand by County Appendix G Mining Water Demand by County Appendix H Thermoelectric Power Water Demand by Facility and Scenario (Withdrawal
and Consumptive) Appendix I Crop Irrigation Water Demand by County Appendix J Livestock Water Demand by County Appendix K Aquaculture Water Demand by County Appendix L Waterfowl Management Water Demand by County Appendix M Total Sector Water Demand by County
iii
• Water Demand Forecast Report
List of Tables
Table 2.1 Water Demand Forecast in MGD, with Thermoelectric Power Withdrawal ...................................................................................................................................... 4
Table 2.2 Water Demand Forecast in MGD, with Thermoelectric Power Consumption ................................................................................................................................... 4
Table 2.3 Statewide Water Demand by Region in MGD, with Thermoelectric Power Withdrawals ...................................................................................................................... 6
Table 2.4 Statewide Water Demand by Region in MGD, with Thermoelectric Power Withdrawals and without Crop Irrigation ........................................................... 6
Table 2.5 Water Demand Forecast by Source in MGD, with Thermoelectric Power Withdrawals ...................................................................................................................... 8
Table 3.1 Summary Characteristics of Population Projections...................................................... 9 Table 3.2 Population Scenarios for State of Arkansas in Millions ................................................ 9 Table 4.1 Municipal Statewide Demands by Scenario in MGD .................................................... 13 Table 5.1 Self-Supplied Domestic Statewide Demands by Scenario in MGD ........................ 15 Table 6.1 Self-Supplied Commercial Water Demand in MGD ...................................................... 16 Table 9.1 Shale Gas Water Demands in MGD ...................................................................................... 21 Table 10.1 Thermoelectric Power Generation Water Demands in MGD ................................... 24 Table 11.1 Base Period Irrigated Acres Statewide .............................................................................. 25 Table 11.2 Application Rates by Crop ...................................................................................................... 25 Table 11.3 Projected Irrigated Acres by Crop ....................................................................................... 26 Table 11.4 Crop Irrigation Water Demand by Crop in AFY and MGD ......................................... 27 Table 12.1 Statewide Base Period Animal Inventory ........................................................................ 29 Table 12.2 Daily Water Requirements per Animal in GPD .............................................................. 29 Table 12.3 Statewide Projected Livestock Inventory in Millions of Animals .......................... 30 Table 12.4 Statewide Estimated Livestock Water Demand in MGD ............................................ 31 Table 13.1 Aquaculture Acres by Species ............................................................................................... 32 Table 13.2 Average Application Rates ...................................................................................................... 32 Table 13.3 Statewide Aquaculture Water Demand in MGD ............................................................ 33 Table 14.1 Waterfowl Management Water Demand in MGD ......................................................... 34 Table 14.2 Statewide Total Waterfowl Management Water Demand in MGD ........................ 34 Table 15.1 Commodity Transportation Tonnages Reported for 2010 ....................................... 37 Table 15.2 Estimated Stages Required for Operation of 9-foot Draft Barges on
White River, Arkansas, in Memphis District ................................................................... 38 Table 16.1 Navigation in the Planning Regions .................................................................................... 40 Table 17.1 Total County Water Demand in MGD, with Thermoelectric Power
Withdrawals ................................................................................................................................. 41 Table 17.2 Total County Water Demand in MGD, with Thermoelectric Power
Consumption ................................................................................................................................ 43 Table 18.1 Statewide Water Demand by Region in MGD, with Thermoelectric
Power Withdrawals ................................................................................................................... 46 Table 18.2 Statewide Water Demand by Region in MGD, with Thermoelectric
Power Withdrawals and without Crop Irrigation ........................................................ 46 Table 18.3 Navigation in the Planning Regions .................................................................................... 47 Table 19.1 Water Demand Forecast in MGD, with Thermoelectric Power
Withdrawals ................................................................................................................................. 49
iv

• Water Demand Forecast Report
List of Figures
Figure 2.1 Statewide Water Demand, with Thermoelectric Power Withdrawals and Crop Irrigation ....................................................................................................................... 4
Figure 2.2 Statewide Water Demand, with Thermoelectric Power Withdrawals, without Crop Irrigation .............................................................................................................. 5
Figure 2.3 State Water Resources Planning Regions ........................................................................... 6 Figure 2.4 Statewide Water Demand by Region, including Thermoelectric Power
Withdrawals .................................................................................................................................... 7 Figure 2.5 Statewide Water Demand by Region, including Thermoelectric Power
Withdrawals, and without Crop Irrigation ......................................................................... 7 Figure 3.1 Comparison of Population Projections ................................................................................ 9 Figure 3.2 Employment WIAs throughout the State ......................................................................... 10 Figure 4.1 Arkansas Municipal Water Demand Forecast: All Population Scenarios ........... 13 Figure 4.2 Arkansas Municipal Water Deand Forcast: Passive Conservation
Impact ............................................................................................................................................. 14 Figure 6.1 Arkansas Statewide Self-Supplied Commercial Water Demand ............................ 17 Figure 9.1 Shale Gas Water Demand by County .................................................................................. 22 Figure 11.1 Total Projected Irrigated Acres by Crop ........................................................................... 27 Figure 15.1 Arkansas Commercial Navigation System ....................................................................... 35 Figure 18.1 State Water Resources Planning Regions ........................................................................ 45 Figure 18.2 Statewide Water Demand by Region, including Thermoelectric Power
Withdrawals ................................................................................................................................. 46 Figure 18.3 Statewide Water Demand by Region, including Thermoelectric Power
Withdrawals, and without Crop Irrigation ...................................................................... 47 Figure 18.4 Navigable Rivers by Water Resources Planning Region ........................................... 48
v

• Water Demand Forecast Report
Acronyms
AF acre-foot AFY acre-foot per year AIEA Arkansas Institute of Economic Advancement ANRC Arkansas Natural Resources Commission AWP Arkansas Water Plan CAPS County Agricultural Production Survey CDL Crop Data Layer CEDDS The Complete Economic and Demographic Data Source cfs cubic feet per second COA Census of Agriculture DOH Department of Health DWS Arkansas Department of Workforce Services EIA Energy Information Agency GIS geographic information system gpcd gallons per capita per day gpd gallons per day HUC Hydrologic Unit Code MG million gallons MGD million gallons per day MKARNS McClellan-Kerr Arkansas River Navigation System MPID Measurement Point Identification MWh megawatt hour NAICS North American Industrial Classification System NASS National Agricultural Statistics Service NRCS Natural Resources Conservation Service R2 R-square SIC Standard Industrial Classification USACE U.S. Army Corps of Engineers USDA U.S. Department of Agriculture USGS U.S. Geological Survey W&P Woods & Poole Economic, Inc. WIA Workforce Investment Area WUDBS Water Use Registration Data Base
vi

Water Demand Forecasts for the Arkansas Water Plan
1.0 Introduction and Overview The update to the Arkansas Water Plan (AWP) involves several major steps including the quantification of current and future water needs (also referred to as water demand) in order to provide an answer to the question – How much water do we currently use and how much will we need in the future? These estimates of future water demand are intended for statewide and regional planning purposes, and are not intended to replace local water resources planning efforts.
This report describes the methods and data used to quantify current and future water demands. The methodologies described in this document provide a means of maintaining consistency in the forecasting effort while still allowing for regional variation to be captured. This information is used to develop a complete statewide, county and regional quantification of current and future water needs by source of supply (groundwater and surface water) and by various demand sectors, as described below.
The water demand forecasts are developed to the year 2050. The water demands for all sectors, except navigation, are developed on the county level. The base period for each demand sector varies slightly due to the availability of data for each sector. Generally, the base period is representative of the period from 2008 to 2011. The primary data used to develop the county level forecasts are derived from the Water Use Registration Data Base (WUDBS) and include withdrawal point information (i.e., Measurement Point Identification (MPID) with associated latitude and longitude coordinates) and water sources (i.e., aquifer codes or surface water Hydrologic Unit Code (HUC) 8 codes). Thus, water demands of each county are quantified at the individual withdrawal point level with a specific coordinate and source. The water demands are then re-aggregated by planning region, aquifer, or surface water basin.
Sector water demand forecasts are developed at the county level for each of Arkansas' 75 counties. The county is a necessary geographic unit for forecasting demand because much of the data required to forecast future demand (e.g., demographic projections) are available at the county level.
In addition, five water resources planning regions have been identified as a framework to quantify and compare demands to available water supply. The overall purpose of the Planning Regions is to group areas of the state with shared resources and similar economic, social, and institutional characteristics in order to facilitate the water resources planning process and to devise basin- and resource-focused planning needs, goals, and management practices/solutions to address local and regional needs. The aggregation of sector water demand forecasts to Planning Regions is discussed in Section 18.
Existing and future water demands are summarized by source of supply. For each county, surface water and groundwater demands are identified by aquifer unit or surface water source for each forecast year and for each sector of use.
1

• Water Demand Forecast Report
1.1 Sectors of Water Use Demands are forecast separately for 12 sectors of water use within the state. Sector forecasts are necessary because each sector has unique factors that influence its water demand. The data, forecast methods, and summaries of estimated future water demand in the State of Arkansas through 2050 are described in detail in subsequent sections of this report for the following sectors:
Municipal – this sector includes residential, commercial, light industrial, and irrigation water demands of public water systems in the state.
Self-supplied Domestic – this sector includes the residential indoor and outdoor water uses of the state's population not served by a public water system.
Commercial – this sector includes self-supplied commercial water users in the state.
Industrial – this sector includes both self-supplied and municipally-supplied large water-using industries in the state.
Agriculture, which is subdivided into:
- Crop irrigation – this sector accounts for the crop irrigation water demands of row crop producers in the state.
- Livestock – this sector accounts for the livestock raising operation water demands of livestock producers in the state.
- Aquaculture – this sector accounts for the water demands of aquaculture producers in the state.
Thermoelectric Power – this sector accounts for the water demands of electric utility thermoelectric power generators in the state and does not quantify the water needs for hydroelectric power generation or renewable energy sources that use no water or negligible amounts of water (e.g., wind and solar).
Mining – this sector includes both self-supplied and municipally-supplied mining water users in the state.
Shale Gas (Hydraulic Fracturing of the Fayetteville Shale formation) – this sector accounts for the water demands of the natural gas drilling and fracturing operations in the Fayetteville Shale Play.
Waterfowl Management and Duck Hunting – this sector includes the water demands for self-supplied commercial duck hunting clubs as well as waterfowl management water demands for the Arkansas Game and Fish Commission throughout the state.
Navigational Considerations – minimum in-stream flows for commercial navigation in Arkansas rivers.
Water demand is typically defined as the water volume withdrawn from a source. However, for water resources planning, water demand can also be defined as the consumed volume of water since the non-consumed volume returns to a water body or aquifer. Water consumption is most often attributed to evaporation, absorption by plants, or actual consumption by people and animals.
2

• Water Demand Forecast Report
For the purposes of this report, water consumption is defined as any water withdrawal volume that is not returned to a water body or aquifer.
1.2 Water Use Data Where possible, historical water withdrawal data are used to establish base period levels of demand by water use sector for developing demand forecasts. In Arkansas, water users that withdraw 1 acre-foot (AF) or more per year of surface water, or those users with the potential to pump 50,000 gallons per day (gpd) of groundwater, are required to register their water use under the Arkansas Natural Resources Commission (ANRC) Water-Use Registration Program. Withdrawal and diversion volumes from the previous year are reported by registered users each year to the ANRC, or Conservation Districts in the case of agricultural water users in some counties. There are approximately 6,100 surface water withdrawal sites and 49,000 groundwater withdrawal sites registered in Arkansas. Reported withdrawals are stored in the WUDBS, which is managed by the U.S. Geological Survey (USGS) through a cooperative agreement with ANRC. This database contains monthly water withdrawal volumes by registered user. Key data fields include the diverter name, location of withdrawal, and industry type. Other data sources are described in subsequent sections of this report by respective water use sector.
1.3 Demographic Projections The water demand forecasts developed for the AWP are based upon current water use information and future projections of population and employment. (Note that projections for the agricultural water demand forecast are described separately, as are the shale gas and navigation water demands.) Projections of future population and employment are "drivers" of the future water demand for many of the water user sectors described in this report. The data sources for demographic projections are described in detail in Section 3.
2.0 Summary Water demands by sector and by county are presented in each of the Appendices for the individual sectors. A few of the demand sectors have multiple forecast scenarios. The water demand forecasts by sector are summarized using the following recommended planning scenarios:
Arkansas Institute of Economic Advancement (AIEA) population projection scenario for Municipal, Self-supplied Domestic, and Self-supplied Commercial sectors
With conservation effects scenario for the Municipal and Self-supplied Domestic sectors
Reference scenario for the thermoelectric power sector
Total water demand by sector (excluding navigation) is shown in Table 2.1 including the thermoelectric power withdrawal demands, and in Table 2.2 including the thermoelectric power consumption demands. There is a difference of more than 1,000 million gallons per day (MGD) between forecasts with the thermoelectric power generation withdrawal and consumption.
Water demand for crop irrigation is about 80 percent of total water demand when thermoelectric power withdrawals are considered and about 89 percent of total water demand when only thermoelectric power consumption is included in the calculation of total water demand. Figures 2.1 and 2.2 show the statewide total water demand (including thermoelectric power withdrawals) with and without crop irrigation.
3

• Water Demand Forecast Report
Table 2.1 Water Demand Forecast in MGD, with Thermoelectric Power Withdrawals
Base
Period 2015 2020 2025 2030 2035 2040 2045 2050 Crop Irrigation 8,816 9,161 9,507 9,724 9,941 9,980 10,020 10,030 10,040 Thermoelectric 1,177 1,258 1,274 1,326 1,337 1,346 1,349 1,352 1,355 Municipal 385 393 405 418 431 446 463 482 503 Industrial 291 281 273 261 249 237 224 213 202 Duck Habitat 259 259 259 259 259 259 259 259 259 Aquaculture 103 103 103 103 103 103 103 103 103 Livestock 27 27 29 29 29 29 29 29 29 Self-Supplied Domestic 13 13 13 13 13 13 13 14 14 Shale Gas 11 10 9 8 0 0 0 0 0 Mining 6 6 6 7 9 10 11 12 14 Self-Supplied Commercial 5 6 6 6 6 6 7 7 7 TOTAL 11,093 11,519 11,885 12,155 12,378 12,430 12,479 12,501 12,526
Table 2.2 Water Demand Forecast in MGD, with Thermoelectric Power Consumption
Base
Period 2015 2020 2025 2030 2035 2040 2045 2050 Crop Irrigation 8,816 9,161 9,507 9,724 9,941 9,980 10,020 10,030 10,040 Thermoelectric 81 98 99 99 99 100 100 101 101 Municipal 385 393 405 418 431 446 463 482 503 Industrial 291 281 273 261 249 237 224 213 202 Duck Habitat 259 259 259 259 259 259 259 259 259 Aquaculture 103 103 103 103 103 103 103 103 103 Livestock 27 27 29 29 29 29 29 29 29 Self-Supplied Domestic 13 13 13 13 13 13 13 14 14 Shale Gas 11 10 9 8 0 0 0 0 0 Mining 6 6 6 7 9 10 11 12 14 Self-Supplied Commercial 5 6 6 6 6 6 7 7 7 TOTAL 9,997 10,358 10,709 10,928 11,140 11,184 11,230 11,250 11,272
Figure 2.1 Statewide Water Demand, with Thermoelectric Power Withdrawals and Crop Irrigation
-
2,000
4,000
6,000
8,000
10,000
12,000
14,000
Base Period 2020 2030 2040 2050
Mill
ion
Gal
lons
per
Day
(MG
D)
Arkansas Statewide Demands Crop Irrigation
Livestock
Duck Habitat
Aquaculture
Mining
Shale Gas
Thermoelectric
Self-Supplied Commercial
Industrial
Self-Supplied Domestic
Municipal
4
• Water Demand Forecast Report
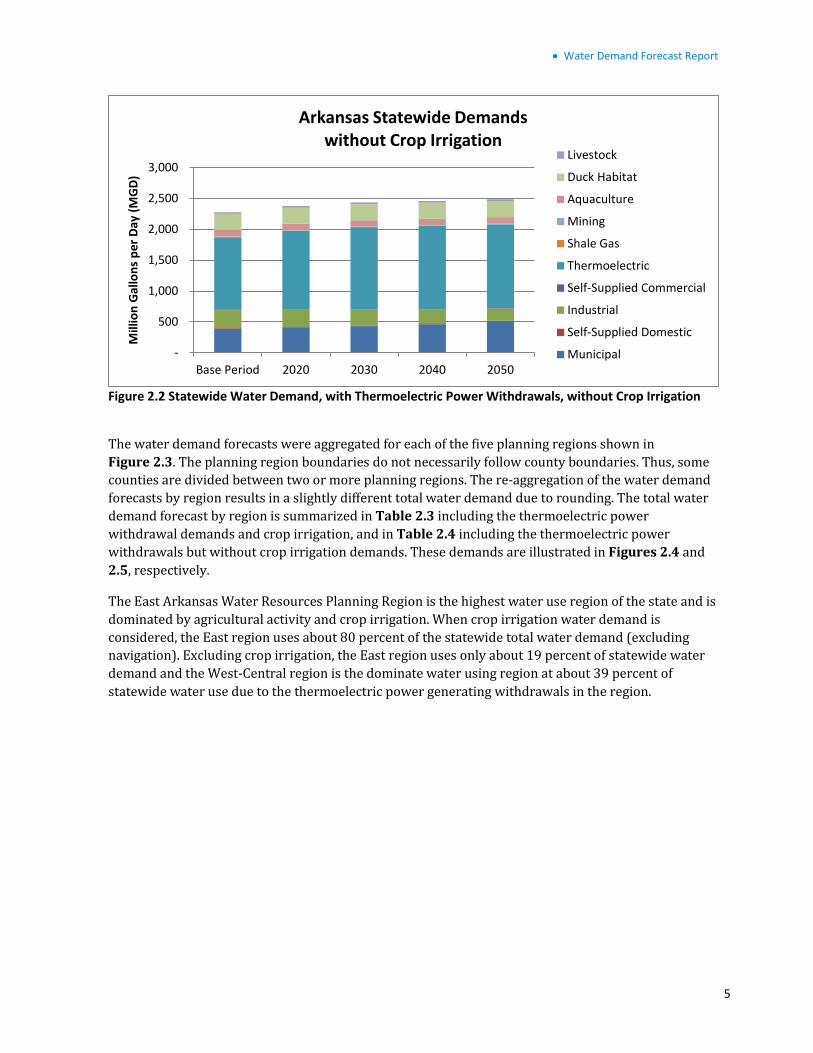
Figure 2.2 Statewide Water Demand, with Thermoelectric Power Withdrawals, without Crop Irrigation
The water demand forecasts were aggregated for each of the five planning regions shown in Figure 2.3. The planning region boundaries do not necessarily follow county boundaries. Thus, some counties are divided between two or more planning regions. The re-aggregation of the water demand forecasts by region results in a slightly different total water demand due to rounding. The total water demand forecast by region is summarized in Table 2.3 including the thermoelectric power withdrawal demands and crop irrigation, and in Table 2.4 including the thermoelectric power withdrawals but without crop irrigation demands. These demands are illustrated in Figures 2.4 and 2.5, respectively.
The East Arkansas Water Resources Planning Region is the highest water use region of the state and is dominated by agricultural activity and crop irrigation. When crop irrigation water demand is considered, the East region uses about 80 percent of the statewide total water demand (excluding navigation). Excluding crop irrigation, the East region uses only about 19 percent of statewide water demand and the West-Central region is the dominate water using region at about 39 percent of statewide water use due to the thermoelectric power generating withdrawals in the region.
-
500
1,000
1,500
2,000
2,500
3,000
Base Period 2020 2030 2040 2050
Mill
ion
Gal
lons
per
Day
(MG
D)
Arkansas Statewide Demands without Crop Irrigation
Livestock
Duck Habitat
Aquaculture
Mining
Shale Gas
Thermoelectric
Self-Supplied Commercial
Industrial
Self-Supplied Domestic
Municipal
5

• Water Demand Forecast Report
Figure 2.3 State Water Resources Planning Regions
Table 2.3 Statewide Water Demand by Region in MGD, with Thermoelectric Withdrawals Region Base Period 2020 2030 2040 2050 East Arkansas 8,864 9,524 9,936 10,007 10,020 North Arkansas 913 940 1,028 1,054 1,083 South-central Arkansas 212 237 232 233 234 Southwest Arkansas 201 199 197 195 194 West-central Arkansas 910 990 991 996 1,003 TOTAL 11,099 11,891 12,385 12,486 12,534
Table 2.4 Statewide Water Demand by Region in MGD, with Thermoelectric Withdrawals and without Crop Irrigation Region Base Period 2020 2030 2040 2050 East Arkansas 478 480 474 472 471 North Arkansas 553 539 617 643 672 South-central Arkansas 202 227 221 223 223 Southwest Arkansas 159 164 156 147 141 West-central Arkansas 892 974 975 980 987 TOTAL 2,283 2,384 2,444 2,466 2,494
6

• Water Demand Forecast Report
Figure 2.4 Statewide Water Demand by Region, including Thermoelectric Power Withdrawals
Figure 2.5 Statewide Water Demand by Region, including Thermoelectric Power Withdrawals, and without Crop Irrigation
7

• Water Demand Forecast Report
The water demand forecasts were also quantified by source of supply (i.e., groundwater aquifer or surface water basin). Table 2.5 shows the statewide annual water demand by sector, the base period percent of water by source for each sector, and the base period and 2050 MGD for each sector by source. Overall, about 71 percent of statewide water demand (including thermoelectric power withdrawals) is from groundwater sources. Because of assumptions made in the demand forecasting methodology of each sector, these percentages remain fairly constant to 2050.
Table 2.5 Water Demand Forecast by Source in MGD, with Thermoelectric Power Withdrawals
Sector Base Period Base Period MGD 2050 MGD
%GW %SW GW SW GW SW Crop Irrigation 84.2% 15.7% 7,427 1,388 8,459 1,580 Thermoelectric 0.3% 99.7% 3 1,174 3 1,351 Municipal 29.4% 70.6% 113 271 109 394 Industrial 24.6% 75.4% 72 219 52 149 Duck Habitat 36.4% 63.6% 94 165 94 165 Aquaculture 100.0% 0.0% 103 — 103 – Livestock 39.9% 60.1% 11 16 12 18 Self-Supplied Domestic 100.0% 0.0% 13 — 14 – Shale Gas 0.0% 100.0% – 11 – – Mining 15.5% 84.5% 1 5 2 12 Self-Supplied Commercial 17.5% 82.5% 1 4 1 6 TOTAL 7,838 3,254 8,849 3,675 71% 29% 71% 29%
3.0 Demographic Projections The water demand forecasts developed for the AWP Update are based upon base period water use information and future projections of population and employment. (Note that projections for the agricultural water demand forecast are described separately.) Projections of future population and employment are "drivers" of the future water demand for many of the water use sectors described in this report.
3.1 Population Projections There are three sets of population projections available for the State of Arkansas with projections of future population by county:
Woods & Poole Economic, Inc. (W&P) – projected through 2040, extended to 2050, usually the highest of the three forecasts
University of Arkansas Institute of Economic Advancement (AIEA) – projected through 2030, extended to 2050, usually the middle of the three forecasts
Arkansas Natural Resources Commission Water Resources Development Division (ANRC) – projected through 2050, usually the lowest of the three forecasts
Note that not all counties are consistently high, medium, and low for each data source so some exceptions occur to these categories of high, medium, and low on a county by county basis. All three sets of projections indicate that some counties will experience negative population growth. General characteristics of the population scenarios are shown in Table 3.1.
8

• Water Demand Forecast Report
Table 3.1 Summary Characteristics of Population Projections ANRC AIEA W&P
Overall Average Growth 2% 10% 23% Counties with Positive Growth 47 45 55 Maximum Growth Rate 83% 152% 195% Counties with Negative Growth 25 30 20 Minimum Growth Rate -45% -71% -30%
The population projections by county and scenario are provided in Appendix A of this report. Figure 3.1 and Table 3.2 show the statewide total population projection from each of the three scenarios.
Figure 3.1 Comparison of Population Projections
Table 3.2 Population Scenarios for State of Arkansas in Millions 2010 2015 2020 2025 2030 2035 2040 2045 2050 W&P 2.916 3.082 3.250 3.420 3.589 3.756 3.924 4.098 4.285 AIEA 2.916 3.018 3.139 3.260 3.381 3.509 3.649 3.801 3.966 ANRC 2.916 3.019 3.122 3.205 3.288 3.349 3.410 3.450 3.491
9
• Water Demand Forecast Report
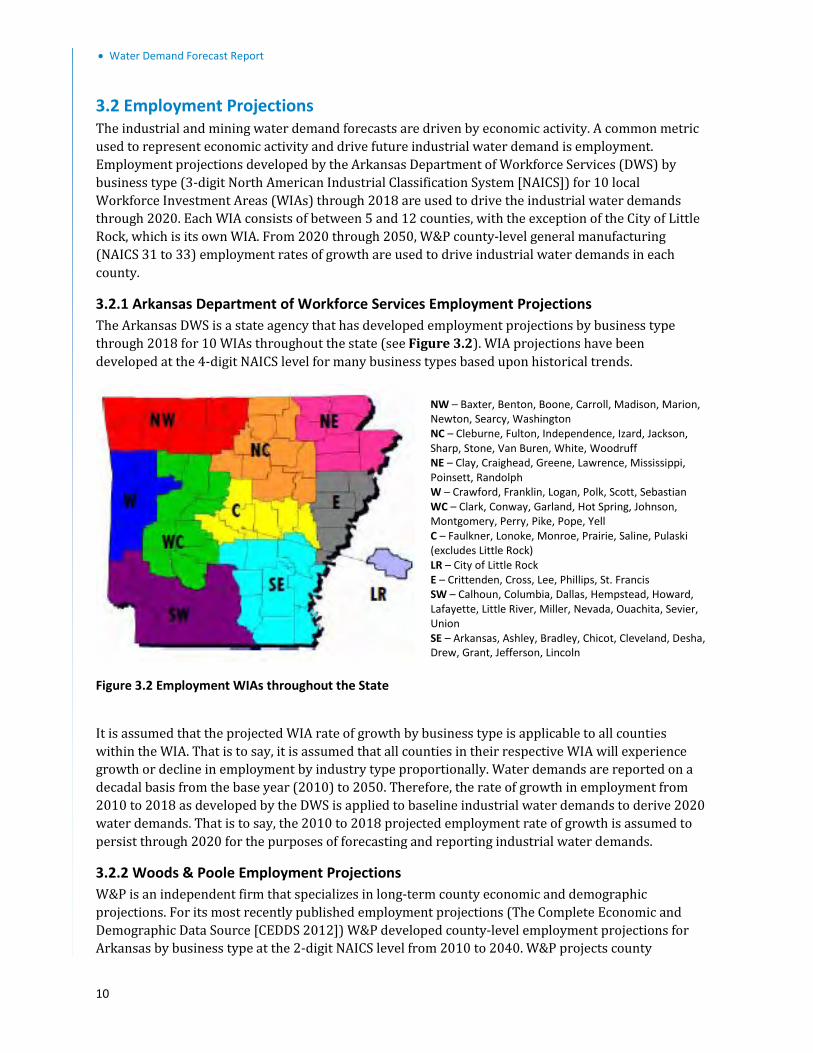
3.2 Employment Projections The industrial and mining water demand forecasts are driven by economic activity. A common metric used to represent economic activity and drive future industrial water demand is employment. Employment projections developed by the Arkansas Department of Workforce Services (DWS) by business type (3-digit North American Industrial Classification System [NAICS]) for 10 local Workforce Investment Areas (WIAs) through 2018 are used to drive the industrial water demands through 2020. Each WIA consists of between 5 and 12 counties, with the exception of the City of Little Rock, which is its own WIA. From 2020 through 2050, W&P county-level general manufacturing (NAICS 31 to 33) employment rates of growth are used to drive industrial water demands in each county.
3.2.1 Arkansas Department of Workforce Services Employment Projections The Arkansas DWS is a state agency that has developed employment projections by business type through 2018 for 10 WIAs throughout the state (see Figure 3.2). WIA projections have been developed at the 4-digit NAICS level for many business types based upon historical trends.
Figure 3.2 Employment WIAs throughout the State
It is assumed that the projected WIA rate of growth by business type is applicable to all counties within the WIA. That is to say, it is assumed that all counties in their respective WIA will experience growth or decline in employment by industry type proportionally. Water demands are reported on a decadal basis from the base year (2010) to 2050. Therefore, the rate of growth in employment from 2010 to 2018 as developed by the DWS is applied to baseline industrial water demands to derive 2020 water demands. That is to say, the 2010 to 2018 projected employment rate of growth is assumed to persist through 2020 for the purposes of forecasting and reporting industrial water demands.
3.2.2 Woods & Poole Employment Projections W&P is an independent firm that specializes in long-term county economic and demographic projections. For its most recently published employment projections (The Complete Economic and Demographic Data Source [CEDDS 2012]) W&P developed county-level employment projections for Arkansas by business type at the 2-digit NAICS level from 2010 to 2040. W&P projects county
NW – Baxter, Benton, Boone, Carroll, Madison, Marion, Newton, Searcy, Washington NC – Cleburne, Fulton, Independence, Izard, Jackson, Sharp, Stone, Van Buren, White, Woodruff NE – Clay, Craighead, Greene, Lawrence, Mississippi, Poinsett, Randolph W – Crawford, Franklin, Logan, Polk, Scott, Sebastian WC – Clark, Conway, Garland, Hot Spring, Johnson, Montgomery, Perry, Pike, Pope, Yell C – Faulkner, Lonoke, Monroe, Prairie, Saline, Pulaski (excludes Little Rock) LR – City of Little Rock E – Crittenden, Cross, Lee, Phillips, St. Francis SW – Calhoun, Columbia, Dallas, Hempstead, Howard, Lafayette, Little River, Miller, Nevada, Ouachita, Sevier, Union SE – Arkansas, Ashley, Bradley, Chicot, Cleveland, Desha, Drew, Grant, Jefferson, Lincoln
10

• Water Demand Forecast Report
employment for the following industry categories. The manufacturing (industrial) and mining employment growth rates are used in the respective water use sectors.
NAICS 21: Mining o 211 Oil and Gas Extraction o 212 Mining (except Oil and Gas) o 213 Support Activities for Mining
NAICS 31-33: Manufacturing o 311 Food Manufacturing o 312 Beverage and Tobacco Product Manufacturing o 313 Textile Mills o 314 Textile Product Mills o 315 Apparel Manufacturing o 316 Leather and Allied Product Manufacturing o 321 Wood Product Manufacturing o 322 Paper Manufacturing o 323 Printing and Related Support Activities o 324 Petroleum and Coal Products Manufacturing o 325 Chemical Manufacturing o 326 Plastics and Rubber Products Manufacturing o 327 Nonmetallic Mineral Product Manufacturing o 331 Primary Metal Manufacturing o 332 Fabricated Metal Product Manufacturing o 333 Machinery Manufacturing o 334 Computer and Electronic Product Manufacturing o 335 Electrical Equipment, Appliance, and Component Manufacturing o 336 Transportation Equipment Manufacturing o 337 Furniture and Related Product Manufacturing o 339 Miscellaneous Manufacturing
W&P presents county-level employment projections annually from 2010 through 2020, then at 5-year increments from 2020 through 2040. Thus, an extrapolation of these projections is necessary in order to forecast industrial water demands from 2040 to 2050. It is assumed that the county-level employment rate of growth from 2035 to 2040 remains constant through 2050.
Appendix B of this report lists the employment growth rates by county for the industrial NAICS and for mining.
4.0 Municipal (Public-Supply) Water use among publicly-supplied municipal (includes all publicly-supplied users except some large water-using industries) water users by county is projected into the future based upon the rate of growth of the county population.
4.1 Base Period Water Use Base period water use for each county was obtained from either the Department of Health (DOH) Sanitary Survey or WUDBS. WUDBS data are reported for water users with the capability to withdraw 50,000 gpd of groundwater or 1 acre-foot per year (AFY) of surface water. The WUDBS data for 2008
11

• Water Demand Forecast Report
to 2010 are averaged to provide an average base period water use. Where publicly-supplied municipal water withdrawals are identified for mining or industrial use, these water volumes are subtracted from the volume of municipal water use. (These volumes are accounted for in their respective sector demand estimates.) The reported municipal water volume is divided by the reported population served to derive a gallon per capita per day (gpcd) rate of use for each municipality.
The DOH data consists of community non-transient water systems data, and reports annual average water demand for the reporting year. The DOH data are updated on a 3-year rotating basis and therefore may reflect water use of any single year between 2008 and 2012. The reported municipal water volume is divided by the reported population served to derive a gpcd rate of use for each municipality.
The gpcd rates from the WUDBS and DOH data for municipalities in each county are weighted by the respective population served to derive a county average gpcd to represent the base period publicly-supplied municipal water use for each county. The weighted average per capita use for each county includes some imbedded commercial and industrial water use, as well as distribution system losses.
The county average gpcd is multiplied by the county population that is served by municipal systems to derive an estimate of the publicly-supplied municipal water demand. USGS 2010 data reports the percent of each county population that is served by municipal water systems.
4.2 Future Water Use The percent of county population that is publicly served is assumed constant into the future. That is, as the county population increases, the number of people that are served by public systems, and the number not served, increase at the same rate.
As described in Section 3, there are three sources of population projections (W&P – high; AIEA – medium; and ANRC – low). Thus, three municipal water demand forecast scenarios are developed.
Future publicly-supplied municipal water demands are calculated by multiplying the future county population of each scenario times the percent of county population served by public systems, times the adjusted gpcd rate of water use for the county. The statewide total municipal water demand as determined by these three scenarios is shown in Table 4.1 and illustrated in Figure 4.1. The demand forecasts by county are included in Appendix C of this report.
A water efficiency adjustment to the base per capita water use is made over time to account for the phasing out and replacement of older toilets (passive water conservation based on the 1992 Energy Policy Act that changed flow standards for certain plumbing fixtures). Thus, there is a "passive conservation" scenario in conjunction with each of the three population scenarios. The effect of the passive conservation from plumbing codes is about a 6 percent reduction in municipal water use by 2050. Table 4.1 also shows the conservation adjusted statewide municipal water demands, which are shown in comparison to the unadjusted forecasts in Figure 4.2.
The mid-range AIEA scenario with the passive conservation adjustment is used in developing demand projections for the AWP Update.
12

• Water Demand Forecast Report
Table 4.1 Municipal Statewide Demands by Scenario in MGD
Scenario Base Year 2015 2020 2025 2030 2035 2040 2045 2050
W&P 384.5 407.5 430.6 454.0 477.3 500.3 523.4 547.4 573.2 AIEA 384.5 399.5 416.6 433.7 450.8 468.8 488.5 510.0 533.4 ANRC 384.5 398.7 413.0 424.3 435.5 443.8 452.1 457.3 462.5
With Conservation W&P 384.5 401.0 418.4 437.0 456.0 475.4 495.3 516.4 539.4 AIEA 384.5 393.0 404.8 417.5 430.9 445.7 462.7 481.6 502.7 ANRC 384.5 392.3 401.3 408.3 416.1 421.6 427.7 431.2 435.0
Figure 4.1 Arkansas Municipal Water Demand Forecast: All Population Scenarios
200
250
300
350
400
450
500
550
600
Base Year 2015 2020 2025 2030 2035 2040 2045 2050
Mill
ion
Gal
lons
per
Day
(MG
D)
Arkansas Municipal Water Demand Forecast: All Population Scenarios
ANRC Population Scenario AIEA Population Scenario Woods & Poole Population Scenario
13

• Water Demand Forecast Report
Figure 4.2 Arkansas Municipal Water Demand Forecast: Passive Conservation Impact
4.3 Water Sources The municipal data from the WUDBS data contains either an aquifer ID for groundwater sources or HUC ID for surface water sources. The DOH data may indicate a specific aquifer or HUC, simply indicate "well," or provide the name of the spring. Water from unknown, or unidentified, groundwater sources is assigned to the "most likely" aquifer based on the predominant reported groundwater aquifer use identified in the 2011 Arkansas Ground-Water Protection and Management Report. Groundwater demands for the base period and future forecast were assigned to the known or "most likely" aquifer(s).
A ratio of groundwater to surface water is derived from the base period publicly-supplied municipal water volume by aquifer and HUC for each county. This proportion of surface to groundwater is maintained into the future for each county. Statewide the publicly-supplied municipal water demand is about 71 percent surface water in the base period increasing to about 78 percent surface water in 2050. Many of the counties with higher rates of population growth are primarily on surface water, and many counties with little or no population growth are mostly on groundwater. Thus, statewide there is a gradual shift to surface water among municipal use as population grows.
200
250
300
350
400
450
500
550
600
Base Year 2015 2020 2025 2030 2035 2040 2045 2050
Mill
ion
Gal
lons
per
Day
(MG
D)
Arkansas Municipal Water Demand Forecast: Passive Conservation Impact
ANRC Population Scenario W/ConservationANRC Population Scenario W/O ConservationAIEA Population Scenario W/ConservationAIEA Population Scenario W/O ConservationWoods & Poole Population Scenario W/ConservationWoods & Poole Population Scenario W/O Conservation
14

• Water Demand Forecast Report
4.4 Withdrawals, Consumptive Use, and Water Balance Considerations The portion of publicly-supplied municipal water use that is consumptive use (i.e., not returned to an aquifer or water body) is variable depending upon customers (i.e., domestic, commercial, industrial that are not included in the industrial forecast), seasonal variation, and percent of indoor versus outdoor water use. Source water is conveyed, treated, and distributed to customers with some losses. Some municipal water customers may be on septic systems with the outflow assumed to not reach an aquifer or water body. However, most wastewater from municipal water customers is likely to be treated at wastewater treatment facilities and discharged to a stream or water body. Water that is not returned may be associated with irrigation, cooling towers, or other evaporative losses. A detailed accounting of municipal return flows was beyond the scope of this project.
5.0 Self-Supplied Domestic The population of each county that is not supplied water from a municipal water system is assumed to be self-supplied domestic water users. USGS 2010 data reports the percent of each county population that is served, and not served, by municipal water systems. In addition, USGS data is used to determine county self-supplied gpcd. Self-supplied water use is projected into the future based upon the rate of county population growth.
The percentages of county population that are publicly-served and not served are assumed constant into the future. That is, as the county population increases, the number of people that are served by public systems, and the number not served, increase at the same rate.
There are three population projections (W&P –high; AIEA – medium; and ANRC – low) of future county population to the year 2050. Thus, there are three self-supplied domestic water demand forecast scenarios. Future self-supplied domestic water demands are calculated by multiplying the future county population of each scenario times the percent of county population not served by public systems, times the USGS gpcd rate of self-supplied domestic water use for the county. An adjustment to the base per capita water use is made over time to account for the phasing out and replacement of older toilets (passive water conservation based on the 1992 Energy Policy Act that changed flow standards for certain plumbing fixtures). The effect of the passive conservation from plumbing codes is about a 10 percent reduction in self-supplied domestic water use by 2050. These forecasts are summarized at the statewide level in Table 5.1. Details by county are provided in Appendix D.
Table 5.1 Self-Supplied Domestic Statewide Demands by Scenario in MGD Scenario Base Year 2015 2020 2025 2030 2035 2040 2045 2050 W&P 13.1 13.6 14.1 14.6 15.1 15.6 16.1 16.6 17.1 AIEA 13.1 13.4 13.6 13.9 14.1 14.4 14.7 15.0 15.3 ANRC 13.1 13.2 13.3 13.4 13.5 13.6 13.6 13.7 13.7
With Conservation W&P 13.1 13.2 13.4 13.6 13.9 14.2 14.5 14.9 15.3 AIEA 13.1 13.0 12.9 13.0 13.0 13.1 13.3 13.5 13.7 ANRC 13.1 12.9 12.7 12.6 12.5 12.4 12.3 12.3 12.3
All self-supplied domestic use is assumed to be groundwater. No return flows are anticipated from self-supplied domestic use.
The mid-range AIEA scenario with the passive conservation adjustment is used for the demand projections in the AWP Update.
15

• Water Demand Forecast Report
6.0 Self-Supplied Commercial Water use among self-supplied commercial water users (i.e., camp grounds, resorts, stores) by county is projected into the future based upon the rate of growth of the county population.
6.1 Base Period Water Use Base period water use for each county was obtained from either the WUDBS or the DOH. WUDBS data are reported for water users with the capability to withdraw 50,000 gpd of groundwater or 1 AFY of surface water, and includes monthly water use for the reporting year. The WUDBS data for 2008 to 2010 are averaged to provide an average base period water use. The DOH data include both non-community non-transient water systems and non-community transient water systems, and reports annual average water demand for the reporting year. The DOH data are updated on a 3-year rotating basis and therefore may reflect water use of any single year between 2008 and 2012. The WUDBS average and DOH available data are summed to represent the base period self-supplied commercial water use for each county.
6.2 Future Water Use Future self-supplied commercial water demands are calculated by applying the county population rate of growth to base year county commercial water demands. The three population projections (W&P –high; AIEA – medium; and ANRC – low) are used to derive three commercial water demand forecast scenarios. The statewide summary of future water demands are shown in Table 6.1 and illustrated in Figure 6.1. Details are provided in Appendix E. About 55 percent of counties have self-supplied commercial water use, and the AIEA population growth rate for many of these counties is higher than the population growth rate suggested by ANRC or W&P. Thus, the AIEA scenario generates the highest self-supplied commercial future water demand.
Table 6.1 Self-Supplied Commercial Water Demand in MGD
Base Year 2015 2020 2025 2030 2035 2040 2045 2050
AIEA 5.35 5.67 5.87 6.07 6.27 6.47 6.69 6.91 7.15 W&P 5.35 5.54 5.72 5.92 6.11 6.30 6.49 6.68 6.88 ANRC 5.35 5.48 5.61 5.70 5.79 5.84 5.89 5.91 5.93
16

• Water Demand Forecast Report
Figure 6.1 Arkansas Statewide Self-Supplied Commercial Water Demand
6.3 Water Sources The self-supplied commercial data from the WUDBS data contains either an aquifer ID for groundwater sources or point data and HUC 8 ID for surface water sources. A ratio of groundwater to surface water is derived from the base period self-supplied commercial water volume for each county. This proportion of surface to groundwater is maintained into the future. The percent of base period water use in the county by aquifer and point location/HUC 8 is derived from the base period self-supplied commercial water information.
The DOH data for groundwater withdrawals may indicate a specific aquifer or simply indicate "well." Groundwater withdrawals that have unknown, or unidentified, sources are assigned to the "most likely" aquifer of the county. The most likely aquifer is the predominant reported groundwater aquifer use identified in the 2011 Arkansas Ground-Water Protection and Management Report.
The DOH data for surface water withdrawals specifies either a HUC 8 ID or the name of the spring. If surface water location data was unknown the demands were randomly distributed within the county, within a constrained area (based on HUC 8s).
6.4 Withdrawals, Consumptive Use, and Water Balance Considerations The portion of self-supplied commercial water use that is consumptively used (i.e., not returned to an aquifer or water body) is unknown. It is assumed that these users are on septic systems and therefore no significant water returns to aquifers or streams are anticipated from the self-supplied commercial users.
4.0
4.5
5.0
5.5
6.0
6.5
7.0
7.5
Base Year 2015 2020 2025 2030 2035 2040 2045 2050Mill
ion
Gal
lons
per
Day
(MG
D)
Arkansas Statewide Self-Supplied Commercial Water Demand
ANRC Pop Scenario AIEA Pop Scenario Woods & Poole Pop Scenario
17
• Water Demand Forecast Report
7.0 Industrial Water use among industrial water users by county is projected into the future based upon the rate of growth of the county employment. Employment data were obtained from two sources as described in Section 3. Industrial water use was obtained from self-supplied users and large users from publicly-supplied industries.
7.1 Base Period Water Use Base period water use for each county was obtained from the WUDBS. The WUDBS data for 2008 to 2010 are averaged to provide an average base period water use for each county. WUDBS data are reported for water users with the capability to withdraw 50,000 gpd of groundwater or 1 AFY of surface water, and includes monthly water use for the reporting year. Entities in the WUDBS determined to be industrial water users may be classified within the WUDBS as: (a) industrial users, (b) municipally-supplied withdrawals identified for industrial use, (c) non-community systems with corporate names, or (d) commercial self-supplied withdrawals determined to be industrial users (e.g., a bottling company).
Withdrawal entities registered in WUDBS as industrial users include an identifier by Standard Industrial Classification (SIC) or NAICS code. (Note that in 1997, the Department of Commerce changed from the SIC system to the NAICS for identification of business types.) Records reporting in SIC codes are converted to NAICS codes. Where the specific industry type of an entity could not be identified, the 2-digit NAICS code (31 – manufacturing) was used.
Base period water use was identified in 61 of the 75 counties, and totaled about 291 MGD statewide.
7.2 Future Water Use Future industrial water demands are calculated by applying the county employment rate of growth (rate of growth can be positive or negative) to the base year county industrial water demand. The employment growth rates are derived from two sources. The Arkansas DWS projects employment by 3-digit NAICS from 2008 to 2018 by WIA. There are nine regional WIAs plus one WIA for the City of Little Rock, thus each county is associated with one of the WIAs. The employment growth rate by NAICS for each WIA was applied to corresponding counties within each WIA. Thus, the WIA growth rates are used to project county employment by 3-digit NAICS to 2018 (for forecasting, this rate was extended statistically to 2020 to align with the decadal forecast periods).
W&P employment projections are available for Arkansas at the county level at the 2-digit NAICS to the year 2040. From 2020 to 2040, the employment growth rate at the 2-digit NAICS level for each county is used. Thus, all manufacturing industries within a county are projected to increase or decrease at the same rate. The county 2-digit NAICS employment rate of growth (positive or negative growth) from 2035 to 2040 is used to project growth from 2040 to 2050. The employment growth rates by county are in Appendix B of this report.
Six of the nine WIAs, plus the City of Little Rock, have projected declines in manufacturing employment from 2008 to 2018 in the DWS employment projections. Some counties have projected increases in manufacturing employment in the W&P projections from 2020 to 2040. However, statewide the W&P projections show continued decline in manufacturing employment.
Base period water use is matched with employment growth rates by county and NAICS. Thus some individual county forecasts of industrial water demand show an increase over time, but the majority of
18

• Water Demand Forecast Report
counties show a decrease in industrial water demand. Appendix F has the industrial water demand forecasts by county. Statewide industrial water demand is projected to decline about 30 percent from 291 MGD in the base period to about 202 MGD in 2050.
7.3 Water Sources The industrial data from the WUDBS data contains either an aquifer ID for groundwater sources or point data surface water sources. The proportion of surface to groundwater withdrawal is maintained into the future.
Groundwater withdrawals that have unknown, or unidentified, sources are assigned to the "most likely" aquifer of the county. The most likely aquifer is the predominant reported groundwater aquifer use identified in the 2011 Arkansas Ground-Water Protection and Management Report.
Surface water withdrawals that have unknown or unidentified sources are randomly distributed within the county, within a constrained area (based on HUC 8s). About 75 percent of the industrial water demand is from surface water.
7.4 Withdrawals, Consumptive Use, and Water Balance Considerations The portion of industrial water use that is consumptive use (i.e., not returned to an aquifer or water body) may vary by type of industry and the way water is used. For statewide planning purposes, consumptive use by industry is typically not a major factor to be investigated in detail unless there are extremely large withdrawals or major transfers between sources of supply that may warrant future analysis of resource implications.
8.0 Mining Water use among self-supplied mining water users by county is projected into the future based upon the rate of growth of the county mining employment.
8.1 Base Period Water Use Base period water use for each county was obtained from the Water Use Registration Program (WUDBS). WUDBS data are reported for water users with the capability to withdraw 50,000 gpd of groundwater or 1 AFY of surface water, and includes monthly water use for the reporting year. The WUDBS data for 2008 to 2010 are averaged to provide an average base period water use for each county. Water use for mining activity is identified in 24 counties. Statewide total water use for mining in the base period is 6.1 MGD. Almost half of this water demand occurs in Izard County.
8.2 Future Water Use Future self-supplied mining water demands are calculated by applying the county mining employment (NAICS 212) rate of growth to base year county mining water demands. From 2010 to 2020 the mining employment growth rate is obtained from the WIA in which the county is located. WIA employment projections are at the 3-digit NAICS level (i.e., NAICS 212) and only run through 2018. Mining employment is projected to increase from 2010 to 2018 in only two of the nine WIAs (i.e., 19 counties). From 2020 to 2050 the mining employment growth rate is obtained from W&P employment projections by county, which is at the 2-digit NAICS level for mining (i.e., NAICS 21). The W&P projections indicate increasing mining employment in 34 counties. Employment growth rates by county are listed in Appendix B. County level estimates of future mining water demand are listed in
19
• Water Demand Forecast Report
Appendix G. The 6.1 MGD for mining water use in the base period is expected to increase to 14 MGD statewide by 2050.
8.3 Water Sources The self-supplied mining data from the WUDBS data contains either an aquifer ID for groundwater sources or HUC ID for surface water sources. Thus the county level growth in mining water use can be applied to aquifers and basins. About 85 percent of mining water is obtained from surface water sources.
8.4 Withdrawals, Consumptive Use, and Water Balance Considerations The portion of self-supplied mining water use that is consumptively used (i.e., not returned to an aquifer or water body) is assumed to be minimal.
9.0 Shale Gas Water use for self-supplied shale gas development/water use by county is projected into the future based upon an industry specific methodology and assumptions developed in coordination with the shale gas workgroup. The primary water dependent activity in shale gas development is the hydraulic fracturing process. Data from the WUDBS appears to under estimate water used for this purpose based on literature sources and experience of the shale gas production company representatives. Additional data from the shale gas companies were provided to ANRC and used to develop a value for the amount of water used (4.73 million gallons [MG] per well; with about 3.7 MG from surface water and 1.03 MG from on-site recycled water) to hydraulically fracture a well.
9.1 Base Period Water Use The historical number of wells for shale gas production in the state was obtained from the Arkansas Geologic Survey and Arkansas Oil and Gas Commission. There are currently (through 2012) about 4,598 wells active in nine counties that overlay the Fayetteville shale formation. Almost 90 percent of these wells are in the four-county area of Cleburne, Conway, Van Buren, and White Counties.
Only a few companies are registered in the WUDBS, which does not report the number of wells associated with specific MPID locations. The shale gas workgroup provided additional water use data that was combined with data regarding water use and well development data from 2009 to 2012. Thus, a 4-year average volume of water use of 4.73 MG per well was calculated and used with the 2010 number of wells to determine the base period water use. This average water use assumes that all water associated with a given well is used in the year that the well is drilled, and no re-fracturing (returning to further develop the well) occurs after the initial year of development. The nine-county total water demand in the base period is estimated to be 10.6 MGD. The forecasted water demand does not include any estimate of reuse water recovered after fracturing, or any estimates of "produced" water encountered during the well drilling/development process.
9.2 Future Water Use It was estimated (based on literature sources) that a total of approximately 14,000 wells could be developed in the Fayetteville shale formation. This is about 10,000 more wells than are currently active. Historic well development trend data (2008-2012) was used to determine the number of new wells that are expected to be drilled and fractured over the planning horizon (as noted below, full development of the Fayetteville shale play is expected to occur in the mid-2020s). Based on the trend data, the annual number of new wells is expected to decrease slightly until full development occurs; it
20

• Water Demand Forecast Report
is estimated that an average of about 500 wells could be drilled per year over the next approximately 13 years. If there is a significant increase in natural gas prices the above assumption should be revised.
The U.S. Department of Energy estimates an average well spacing of eight wells per square mile. The Arkansas Geological Survey estimates an average of six wells per square mile. For this analysis, an average of seven wells per square mile is assumed.
Geographic information system (GIS) analysis of the Fayetteville shale formation was used to determine the approximate area of potential development per county for the nine counties. A density of seven wells per square mile was used to determine a maximum potential number of wells per county. The assumed increase of 500 new wells per year is distributed proportionally among the nine counties based on 2012 existing well distribution. If the cumulative number of wells per county reaches the maximum potential number of wells for the county, then any additional new wells are distributed among the remaining counties (only Van Buren County reached maximum density, in 2024). The cumulative total of 14,000 possible shale gas wells was reached in the year 2026 with these assumptions.
The estimated number of new wells per county per year was used to estimate the annual water requirements for shale gas drilling by county. The nine-county total gradually declines to a rate of 7.8 MGD in 2026, as shown in Table 9.1 and illustrated in Figure 9.1. Note that estimates of water use for 2012 are based upon actual drilling data, which falls below the projected number of wells per year.
Table 9.1 Shale Gas Water Demands in MGD County 2010 2015 2020 2025 2026 Cleburne 2.1 1.4 1.3 1.6 1.6 Conway 2.1 2.0 1.8 2.3 2.2 Faulkner 1.1 0.8 0.7 0.9 0.8 Franklin - 0.02 0.02 0.02 0.02 Independence 0.2 0.1 0.1 0.2 0.2 Jackson 0.0 0.1 0.0 0.1 0.1 Pope 0.0 0.1 0.1 0.1 0.1 Van Buren 2.6 3.1 2.7 - - White 2.4 2.5 2.3 2.9 2.8 Total 10.6 10.1 9.1 8.0 7.8
21

• Water Demand Forecast Report
Figure 9.1 Shale Gas Water Demand by County
9.3 Water Sources The source of self-supplied shale gas water is 100 percent from surface water. GIS analysis was used to overlay the Fayetteville shale area with surface water HUC areas [MPIDs were not used because of differences in calculated water use/demand and there is not a one-to-one relationship between MPID and individual well(s)]. The area of each HUC within the shale formation area was determined by county. Then the percent of county shale formation area in each HUC was determined. The future shale gas water demand by county is distributed among HUCs within the county proportionally. That is, the percent of water demand by HUC within the county is maintained into the future.
9.4 Withdrawals, Consumptive Use, and Water Balance Considerations The portion of self-supplied shale gas water use that is consumptive use (i.e., not returned to an aquifer or water body) is assumed to be 100 percent for planning purposes. The water is assumed to remain deep within the shale formation. Some information suggests that a small to moderate percent (5 to 35 percent) of water used in the fracturing process may be recoverable, depending upon the operating procedures and site-specific conditions. The forecast also excludes any "produced" water that may have entered the well from penetrated aquifers.
9.5 Other Considerations to Note The shale gas boom in Arkansas was not anticipated during the last water plan update. In light of this unforeseen increase demand for water, the planning team reviewed literature and mineral resource data for Arkansas to identify possible unknown future emerging resource development that might significantly affect future water use. Two potential resources were identified; Lignite and the Lower Smackover Brown Dense Formation (an unconventional oil reserve). In both cases information was not identified to provide an understanding of the feasibility, rate of possible development, or rate of water use. Information on these and other possible new resources should be tracked over the coming years to determine more specific information on development potential and possible water use needs.
-
2
4
6
8
10
12
2010
2011
2012
2013
2014
2015
2016
2017
2018
2019
2020
2021
2022
2023
2024
2025
2026
MG
D Shale Gas Water Demand by County
White
Van Buren
Pope
Jackson
Independence
Franklin
Faulkner
Conway
Cleburne
22

• Water Demand Forecast Report
10.0 Thermoelectric Power Water use among self-supplied thermoelectric power (power) water users by county is estimated for each major power generating facility in the state, and projected into the future taking into consideration fuel type, prime mover, cooling method, and three scenarios of regional projections of future power generation. Generating units with once-through cooling require significantly more water than units with cooling towers, although actual consumptive use may be similar. Plant specific withdrawal and consumption factors were developed using data from the WUDBS and input from thermoelectric power producers in Arkansas.
10.1 Base Period Water Use Base period water use for each generating unit of each facility was estimated with water withdrawal and water consumption factors developed with guidance from the workgroup. Forty generating units were identified in 19 counties. Many facilities have multiple generating units at the same location. A list of the generating units and the water withdrawal and consumption factors by generating and cooling types are listed in Appendix H. The water use factors (in gallons per megawatt hour [MWh]) are multiplied by the annual power generation (in MWh) for each unit, and then converted to MGD. Thus, a withdrawal MGD and consumption MGD are estimated for each generating unit. The withdrawal and consumptive use factors in gallons per MWh for each combination of fuel type and cooling type are listed in Appendix H.
The estimates of withdrawal and consumptive use by generating unit are aggregated by fuel type, county, and source of supply. The statewide estimate of water use for thermoelectric power generation in the base period is about 1,177 MGD for withdrawals and about 81 MGD consumptive use. More than 99 percent of water used for thermoelectric power is from surface water sources.
10.2 Future Water Use Future self-supplied thermoelectric power water demands are based upon Department of Energy, Energy Information Agency (EIA) projections of power generation by regional pool and fuel type. The EIA projects future power generation for three scenarios—Reference, High, and Low. Power generating facilities in Arkansas are in one of two regional power pools. The rate of growth in power generation by fuel type by pool was assigned to the Arkansas facilities by fuel type and location in one of the two pools. EIA projections of power generation from 2010 to 2035 were extended to 2050 using the growth rate from 2034-2035 by power pool and fuel type.
Reported 2012 power generation by facility was aggregated by fuel type and power pool. The aggregate values are increased into the future based upon the fuel type and power pool, and then allocated back to individual generating facility units according to the proportion of 2010 to 2012 average power generation. Thus, power generation projected to 2050 is allocated among existing facilities. However, each facility has maximum generating capacity, which was developed with guidance from the work group. If the assigned allocated power generation in a given future year exceeds the facility maximum capacity, then no additional power generation is assigned at that facility and the "overload" is reassigned to all other facilities of the same fuel type that are not at maximum capacity. (This assignment of future generation is an iterative process, year by year to 2050.)
This allocation of future power generation among facilities is repeated for the Reference, High, and Low scenarios. Water demand estimates for withdrawal and consumption by facility for the three scenarios is included in Appendix H. The statewide total estimated future water demand for
23

• Water Demand Forecast Report
thermoelectric power generation is shown in Table 10.1 for withdrawals and consumptive use for the three scenarios. In the reference case scenario, total water withdrawals increase from 1,177 MGD to 1,355 MGD in 2050, and from 81 MGD up to 101 MGD consumptive use in 2050. The Reference Case scenario is used as the basis of the thermoelectric power water demands for the AWP Update.
Table 10.1 Thermoelectric Power Generation Water Demands in MGD
2010 2015 2020 2025 2030 2035 2040 2045 2050 Withdrawals
Reference Case 1,177 1,258 1,274 1,326 1,337 1,346 1,349 1,352 1,355 Low Growth 1,177 1,368 1,356 1,368 1,357 1,360 1,363 1,366 1,370 High Growth 1,177 1,368 1,363 1,366 1,368 1,379 1,409 1,471 1,580
Consumption Reference Case 81 98 99 99 99 100 100 101 101 Low Growth 81 99 99 100 98 99 99 100 100 High Growth 81 99 100 100 101 102 106 112 118
10.3 Water Sources The self-supplied thermoelectric power data from the WUDBS data contain either an aquifer ID for groundwater sources or point data and/or HUC ID for surface water sources. The source of supply for some facilities not in the WUDBS was identified from EIA information. Where a facility has multiple water sources, a ratio of sources was developed based upon 2010-2012 averages. The water sources, or supply ratio, of each facility are assumed to remain the same to 2050, and remain the same for each scenario. Nearly all water used for thermoelectric power generation is surface water.
10.4 Withdrawals, Consumptive Use, and Water Balance Considerations As described above, thermoelectric power water use is estimated for both withdrawals and consumption for each facility. Overall, for all fuel types and cooling methods water use is largely non-consumptive with over 99 percent of withdrawals returned to surface water. However, it should be noted that once-through cooling exerts a large impact on this statistic as facilities with this cooling method are a large component of overall water use and once-through cooling is essentially non-consumptive. Other cooling types such as those that use cooling towers have much higher consumption rates.
11.0 Crop Irrigation The largest use of water in Arkansas is for crop irrigation. Water use for crop irrigation by county is estimated based upon the number of acres irrigated by crop type and an application rate of water per acre by crop type. The base year number of irrigated acres is estimated to increase for most crops in most counties based upon historical trends (with strong statistical growth correlations based on time or price as described in more detail below) into the future up to a reasonable maximum level determined for each county [as determined by GIS analysis using U.S. Department of Agriculture (USDA), National Agricultural Statistics Service (NASS), Crop Data Layer (CDL) information regarding available tillable acreage that is not currently under irrigation].
11.1 Base Period Water Use The base period (2010) and historical (2000 to 2010) irrigated acreage and crop irrigation water application rates for each county were obtained from two sources. Irrigated acres in cotton, corn, and miscellaneous crops were obtained from the WUDBS. Irrigated acres in soybeans and rice were
24
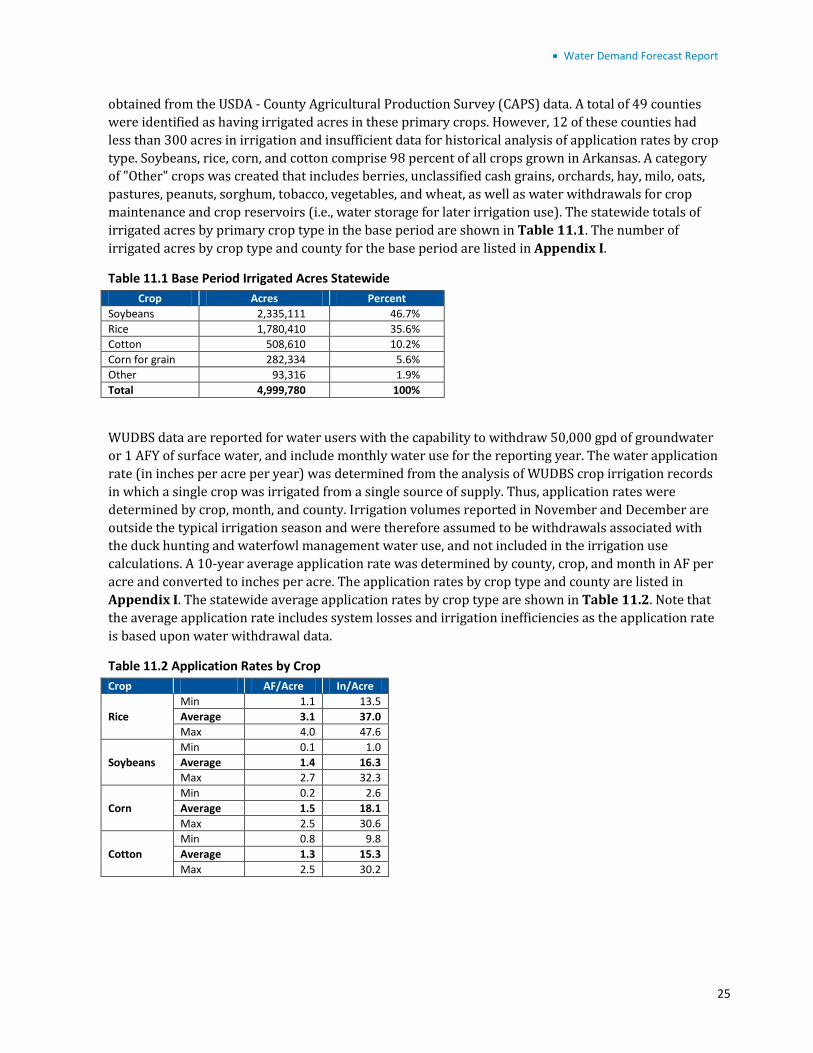
• Water Demand Forecast Report
obtained from the USDA - County Agricultural Production Survey (CAPS) data. A total of 49 counties were identified as having irrigated acres in these primary crops. However, 12 of these counties had less than 300 acres in irrigation and insufficient data for historical analysis of application rates by crop type. Soybeans, rice, corn, and cotton comprise 98 percent of all crops grown in Arkansas. A category of "Other" crops was created that includes berries, unclassified cash grains, orchards, hay, milo, oats, pastures, peanuts, sorghum, tobacco, vegetables, and wheat, as well as water withdrawals for crop maintenance and crop reservoirs (i.e., water storage for later irrigation use). The statewide totals of irrigated acres by primary crop type in the base period are shown in Table 11.1. The number of irrigated acres by crop type and county for the base period are listed in Appendix I.
Table 11.1 Base Period Irrigated Acres Statewide Crop Acres Percent
Soybeans 2,335,111 46.7% Rice 1,780,410 35.6% Cotton 508,610 10.2% Corn for grain 282,334 5.6% Other 93,316 1.9% Total 4,999,780 100%
WUDBS data are reported for water users with the capability to withdraw 50,000 gpd of groundwater or 1 AFY of surface water, and include monthly water use for the reporting year. The water application rate (in inches per acre per year) was determined from the analysis of WUDBS crop irrigation records in which a single crop was irrigated from a single source of supply. Thus, application rates were determined by crop, month, and county. Irrigation volumes reported in November and December are outside the typical irrigation season and were therefore assumed to be withdrawals associated with the duck hunting and waterfowl management water use, and not included in the irrigation use calculations. A 10-year average application rate was determined by county, crop, and month in AF per acre and converted to inches per acre. The application rates by crop type and county are listed in Appendix I. The statewide average application rates by crop type are shown in Table 11.2. Note that the average application rate includes system losses and irrigation inefficiencies as the application rate is based upon water withdrawal data.
Table 11.2 Application Rates by Crop Crop AF/Acre In/Acre
Rice Min 1.1 13.5 Average 3.1 37.0 Max 4.0 47.6
Soybeans Min 0.1 1.0 Average 1.4 16.3 Max 2.7 32.3
Corn Min 0.2 2.6 Average 1.5 18.1 Max 2.5 30.6
Cotton Min 0.8 9.8 Average 1.3 15.3 Max 2.5 30.2
25

• Water Demand Forecast Report
The application rate by county, crop, and month is multiplied by the number of acres irrigated per county by crop to estimate the irrigation water demand by county, crop, and month for the 49 counties with reported irrigation of the primary crops.
11.2 Future Water Use The trends in historical irrigated acres by crop by county were used to determine the future irrigated acreage. Irrigated acres in soybeans, rice, cotton, corn, and "other" were summed for each county and year from 2000 to 2010. An R2 (R-square) value was calculated for the historical trend line of each crop and the total irrigated acres of each county. The R2 value ranges from 0.0 to 1.0 and represents a "goodness of fit"; with zero indicating no relationship between the trend in acres and time, and a value of 1.0 indicating a perfect fit. For corn, the relationship was between the trend in irrigated acres and the price of corn. A trend line with an R2 value of 0.65 or more was deemed to have an acceptably significant growth trend.
If the R2 of an individual crop was 0.65 or more, and greater than the R2 for the total irrigated acreage trend of the county, then the individual crop trend line was used to project the growth in future irrigated acres for that crop. If the R2 for total acres was 0.65 or more, and greater than any individual crop R2 in the county, then the future irrigated acres of all crops in the county increased at the same trend using the total acres trend. If neither the total acres nor individual crop R2 indicated a good fit (i.e., was 0.65 or more) then the irrigated acres of all crops in the county remained constant at the current level. In a few instances, rice and cotton irrigated acres had significant R2 values but negative trends, which resulted in a declining projection in future irrigated acres for these crop types.
For each county, the total tillable row crop acreage was determined by GIS analysis using USDA, NASS, and CDL information regarding available tillable acreage that is not currently under irrigation. In counties with projected increases in irrigated crop acres, the sum of future irrigated acres was compared with the 2010 total tillable row crop acreage. The tillable row crop acreage was deemed as the maximum number of irrigable acres within each county that were most likely to become irrigated during the forecast period. Twenty of the 49 counties that irrigate the primary crops are projected to reach the maximum irrigable acres before 2050. Projected irrigated acres by county and crop are listed in Appendix I and summarized statewide in Table 11.3. Figure 11.1 illustrates the statewide growth in projected irrigated acres by primary crop.
Table 11.3 Projected Irrigated Acres by Crop
2010 2020 2030 2040 2050
Rice 1,780,410 1,859,031 1,916,862 1,924,633 1,926,917 Soybeans 2,335,111 2,742,262 2,986,237 3,034,605 3,042,217 Cotton 508,610 528,352 542,192 534,893 536,413 Corn 282,334 288,435 296,870 299,451 300,064 Other 93,316 95,334 96,666 96,872 96,908 Total 4,999,780 5,513,415 5,838,827 5,890,454 5,902,518
26

• Water Demand Forecast Report
Figure 11.1 Total Projected Irrigated Acres by Crop
The application rate by county, crop, and month is multiplied by the future acres irrigated by county and crop to estimate the irrigation water demand by county, crop, and month in the future years for the 49 counties irrigating the primary crops. The estimated water demand for crop irrigation by county and crop is listed in both AFY and MGD in Appendix I. Statewide total demand is shown in Table 11.4 with estimated irrigated crop water demand increasing from 8.8 billion gallons per day up to 10 billion gallons per day in 2050.
Table 11.4 Crop Irrigation Water Demand by Crop in AFY and MGD Crop 2010 2020 2030 2040 2050
AFY Rice 5,483,710 5,718,125 5,888,561 5,912,304 5,919,475 Soybeans 3,164,959 3,678,422 3,976,103 4,047,725 4,059,670 Cotton 647,302 660,702 664,449 652,777 655,296 Corn 424,580 434,441 447,014 451,515 452,749 Other 154,633 157,463 159,160 159,371 159,412 TOTAL AF 9,875,183 10,649,154 11,135,286 11,223,692 11,246,602
MGD Rice 4,896 5,105 5,257 5,278 5,285 Soybeans 2,825 3,284 3,550 3,614 3,624 Cotton 578 590 593 583 585 Corn 379 388 399 403 404 Other 138 141 142 142 142 TOTAL MGD 8,816 9,507 9,941 10,020 10,040
-
1,000,000
2,000,000
3,000,000
4,000,000
5,000,000
6,000,000
2010 2020 2030 2040 2050
Irrig
ated
Acr
es Other
Cotton
Corn for grain
Rice
Soybeans
27
• Water Demand Forecast Report
11.3 Water Sources The water sources for crop irrigation use are identified in the WUDBS by point location/HUC 8 for surface water sources and by point location and aquifer code for groundwater sources. Groundwater withdrawals that have unknown, or unidentified sources are assigned to the "most likely" aquifer of the county. The most likely aquifer is the predominant reported groundwater aquifer use identified in the 2011 Arkansas Ground-Water Protection and Management Report. Surface water withdrawals that have unknown or unidentified sources are randomly distributed within the county, within a constrained area (based on HUC 8s).
The total irrigation water volume for each county is allocated among the groundwater (aquifer codes) and surface water locations as identified in the WUDBS data. Statewide crop irrigation water is 84 percent groundwater and 16 percent surface water. The groundwater/surface water ratios of each county are listed in Appendix I. The allocation of each county total to groundwater and surface water sources is maintained proportionally into the future.
11.4 Withdrawals, Consumptive Use, and Water Balance Considerations Research and literature review was completed for Arkansas specific information to determine the proportion of water use for crop irrigation that is consumptively used (i.e., not returned to an aquifer or water body). Consumptive use values could not be identified for Arkansas. Data from western states were available, but based on differences in irrigation application methods, climate, soil, topography, and crop differences this information was not deemed to be applicable to Arkansas. Broadly speaking, based on literature review and discussions with irrigators, most farmers appear to be efficient in their water application rates; applying water when crops need it and in the amounts that they need for plant growth requirements. Data identified from across the United States suggests that crop irrigation consumptive use is high ranging from about 85 to 100 percent, with the irrigation application method (flood, sprinkler, drip irrigation, etc.) having a significant impact on these values. Ideal application rates include the plant uptake of water, evaporative loss, and perhaps some shallow percolation to the root zone. Application rates in excess of the ideal application rate can result in: (1) deeper percolation that recharges aquifers; (2) groundwater to surface water flux; and (3) direct runoff to surface water. Some farmers may have infrastructure in place to capture the surface runoff and precipitation that is used as an additional source of irrigation water (i.e., "relift"). Proper field management should prevent runoff (with soil nutrients, fertilizers, and pesticides) from entering a stream. For this round of planning it is assumed that none of the irrigation water returns to a stream or aquifer, although further research may be warranted.
12.0 Livestock Water use among agricultural livestock water users by county is projected into the future based upon the rate of growth from the USDA National Agricultural Projections through 2022. Some specific exceptions to this methodology are made by animal type based on Livestock Water Demand Work Group suggestions, and are discussed below.
Livestock water use in most locations is beneath the WUDBS reporting threshold; therefore, location specific MPID locations are not available for the majority of livestock water use. Consequently, for demand quantification and forecasting, the Livestock demand is assumed to be equally distributed across the county, and is distributed proportionally among planning regions in cases where counties cross regional planning boundaries.
28

• Water Demand Forecast Report
12.1 Base Period Water Use Base period animal counts were obtained based on the most recent animal counts available. Statewide USDA, NASS CAPS animal counts for 2012 were available for dairy cows, beef cattle, and hogs and pigs (note – CAPS is completed annually). These statewide animal counts were disaggregated to the county level using the ratio of county to state animal count taken from 2007 USDA NASS Census of Agriculture (COA) (note – COA is completed every 5 years). Base period animal counts at the county level for chickens, turkeys, sheep and goats, and horses were obtained from the 2007 COA (2012 data was sought but was not available at the time that the forecast was complete). Base period animal counts are summarized statewide in Table 12.1. Detailed animal counts by county are listed in Appendix J.
Table 12.1 Statewide Base Period Animal Inventory Livestock Type Base Period Horses1 78,968 Chickens1 215,082,244 Turkeys1 9,339,092 Hogs2 110,000 Sheep1 16,197 Goats1 50,579 Beef Cattle3 909,000 Dairy Cows3 11,000 1 Base period data from the 2007 COA 2 Base period data derived from the 2012 NASS statewide hog total with 2007 Ag Census County Data Ratios 3 Base period data derived from the 2012 NASS statewide cattle/dairy cow totals with 2007 Ag Census County Data Ratios
Daily water use requirements by animal type were estimated using data from USGS Method for estimating Water Withdrawals for Livestock in the U.S. and Arkansas Natural Resources Conservation Service (NRCS) Animal Daily Water Requirements. Daily water requirements for each livestock group include water used for drinking water, cooling, and sanitation and waste water removal requirements. The daily water requirements in gpd per animal are shown in Table 12.2. These values remain the same in all counties and in all future years.
Table 12.2 Daily Water Requirements per Animal in GPD Livestock Type GPD All Cattle minus Dairy Cows 12.0 Dairy Cows 35.0 Sheep 2.0 Hogs 4.5 Chickens 0.1 Horses 12.0 Turkeys 0.12 Goats 2.0
To determine base period water use, the base period animal count, by animal type, by county is multiplied by the daily water requirement.
29

• Water Demand Forecast Report
12.2 Future Water Use Future livestock animal counts are calculated based on USDA National Livestock Projections livestock growth projections and specific input from the Livestock Water Demand Work Group regarding historical trend data for key livestock animal types.
For dairy cows, the USDA national projections forecast a slight decline in animal counts (< 1 percent); however, the work group recommended that the growth rate for dairy cows in Arkansas be held constant because there has already been a 15-year decline in dairy cow counts and it is thought that this animal group has stabilized. Therefore, dairy cow count is held constant from the 2012 baseline year through 2050.
The USDA national projections predict a significant increase in hog production; however, based on a 15-year declining trend in hog animal counts in Arkansas, it is not likely that hog numbers will increase. But again based on work group input it is believed that the decline may have stabilized. Therefore, hog counts are also held constant from baseline counts throughout the forecast period.
USDA national projections were used to forecast future animal counts for beef cattle and chickens and turkeys through 2022. USDA growth projections were not available for the remaining animal types (horses, sheep, and goats) and since there were no major identified drivers to indicate upward or downward growth it was determined that for planning purposes these animal type counts will be held constant from the base year to 2050.
The statewide summary of projected livestock inventory is shown in Table 12.3, with detailed projections by county provided in Appendix J.
Table 12.3 Statewide Projected Livestock Inventory in Millions of Animals Livestock
Type Base
Period 2015 2020 2025 2030 2035 2040 2045 2050
Horses 0.079 0.079 0.079 0.079 0.079 0.079 0.079 0.079 0.079 Chickens 215.082 220.767 239.144 244.447 244.447 244.447 244.447 244.447 244.447 Turkeys 9.339 9.447 10.203 10.441 10.441 10.441 10.441 10.441 10.441 Hogs 0.110 0.110 0.110 0.110 0.110 0.110 0.110 0.110 0.110 Sheep 0.016 0.016 0.016 0.016 0.016 0.016 0.016 0.016 0.016 Goats 0.051 0.051 0.051 0.051 0.051 0.051 0.051 0.051 0.051 Beef Cattle 0.909 0.909 0.943 0.951 0.951 0.951 0.951 0.951 0.951 Dairy Cows 0.011 0.011 0.011 0.011 0.011 0.011 0.011 0.011 0.011
Future water use was determined by multiplying projected future animal counts by daily water requirements. Daily water requirements by animal type are summarized statewide in Table 12.4 for the forecast period. Future livestock water demands by county are shown in Appendix J. Growth in the number of livestock statewide is projected to level off by 2025; therefore, the water demands for livestock also levels off. Statewide water demand for livestock remains below 30 MGD.
30

• Water Demand Forecast Report
Table 12.4 Statewide Estimated Livestock Water Demand in MGD Livestock
Type Base
Period 2015 2020 2025 2030 2035 2040 2045 2050
Horses 0.95 0.95 0.95 0.95 0.95 0.95 0.95 0.95 0.95 Chickens 12.90 13.25 14.35 14.67 14.67 14.67 14.67 14.67 14.67 Turkeys 1.12 1.13 1.22 1.25 1.25 1.25 1.25 1.25 1.25 Hogs 0.50 0.50 0.50 0.50 0.50 0.50 0.50 0.50 0.50 Sheep 0.03 0.03 0.03 0.03 0.03 0.03 0.03 0.03 0.03 Goats 0.10 0.10 0.10 0.10 0.10 0.10 0.10 0.10 0.10 Beef Cattle 10.91 10.91 11.31 11.41 11.41 11.41 11.41 11.41 11.41 Dairy Cows 0.39 0.39 0.39 0.39 0.39 0.39 0.39 0.39 0.39 TOTAL 26.89 27.25 28.85 29.29 29.29 29.29 29.29 29.29 29.29
12.3 Water Sources Groundwater and surface water livestock withdrawal amounts by county were taken from the 2005 USGS Estimated Use of Water in the United States. These data were used to assign a percentage of livestock water demand to surface water and groundwater use for each county. Statewide, water for livestock is estimated to be about 66 percent surface water and 34 percent groundwater. The estimated percent of water by source by county is listed in Appendix J.
Since comprehensive and consistent point location data were not available for this demand sector, the groundwater demands were equally distributed within the county. Groundwater demands for the base period and future forecast were assigned to the "most likely" aquifer(s) of each county. The most likely aquifer of each county is based on the predominant groundwater aquifer use identified in the 2011 Arkansas Ground-Water Protection and Management Report.
For surface water, livestock demand is equally distributed within the county and assigned to the corresponding HUC 8s of each county.
12.4 Withdrawals, Consumptive Use, and Water Balance Considerations No applicable data were identified to determine the portion of livestock water demand that is fully consumed. However, it is unlikely that any significant component of livestock water use is returned to groundwater or surface water. Consequently, it is assumed that little to no return flows are associated with livestock water use.
12.5 Other Considerations to Note Livestock demands are a relatively small portion of overall demand in Arkansas (< 1 percent statewide). As noted above, data availability for this sector resulted in the need to develop several planning assumptions that could be further assessed with improved data collection over the next several years in preparation for the next water plan update. However, since this is a relatively small statewide demand sector, the benefits and level of effort and cost should be considered. Additionally, since livestock demands are not evenly distributed in Arkansas, if additional details regarding source of supply (surface water, groundwater, publicly-supplied, and self-supplied) are desired, it may also make sense to undertake a more targeted data collection effort in areas of higher demand and lower water availability. There are some livestock demands (above the reporting threshold) that are reported in the WUDBS and have some point location data; however, since location and information is not available for all livestock water demands, a consistent methodology was applied to allow a common approach to all livestock demands within the state.
31

• Water Demand Forecast Report
13.0 Aquaculture Water use among aquaculture water users by county is quantified by species type and number of acres used for fish cultivation, in combination with water application rates per species type. Overall, with the exception of catfish, aquaculture water demands did not show significant past trends and no major drivers for growth were identified. Consequently, for planning purposes demands are held constant for all species types over the forecast period.
13.1 Base Period Water Use Base period water use for each county was obtained from the WUDBS, in combination with USDA NASS 2012 statewide information. Between the two data sources, 25 counties were identified with aquaculture activities.
WUDBS data are reported for water users with the capability to withdraw 50,000 gpd of groundwater or 1 AFY of surface water. The WUDBS data on aquaculture users reports the number of acres by five species types, plus an aquaculture "not classified" category. Significant reporting changes in the data from 2008 to 2010 were identified; therefore, only 2011 data were used to provide an average base period water use.
The total WUDBS reported number of acres in catfish was identified by aquaculture demand subgroup members as being higher than believed, and upon additional research was found to be 2-3 times higher than the USDA NASS reported statewide data. Therefore, the USDA NASS statewide total acres in catfish aquaculture was utilized and was proportionally allocated to counties with reported WUDBS catfish aquaculture water use based upon the proportion of WUDBS acres of this species by county. The statewide number of acres in aquaculture by species type is shown in Table 13.1. The number of acres by county and species is listed in Appendix K.
The water application rate (in inches per acre per year) for each species type derived from the WUDBS data was deemed to be an over-estimation by the workgroup based upon industry experience. Therefore, a range of values was provided by the workgroup. The high end of the range (36 inches) was assumed for all species, except catfish (15 inches) and crayfish (18 inches).
For catfish ponds, literature was identified that described both "maintain full" and "6/3" (producer refills with 3 inches once pond drops 6 inches) management schemes. Additionally, workgroup members noted that catfish ponds do have to be fully drained and filled approximately every 10-15 years. Since the proportion of catfish producers utilizing the two management schemes could not be obtained from the data, the forecast assumed the "6/3" rate from Pote et al. (1988) with a 10-year drain and refill interval. A 40-inch refill is assumed and annualized, and added to the water application rate, resulting in an average annual application rate of 19 inches for catfish.
Table 13.1 Aquaculture Acres by Species Species Type Acres Not Classified 10,880 Crawfish 267 Goldfish 2,576 Hatcheries 827 Minnows 19,119 Catfish 9,700 TOTAL 43,369
Table 13.2 Average Application Rates
Species Type Annual Inches per
Acre Not Classified 36 Crawfish 18 Goldfish 36 Hatcheries 36 Minnows 36 Catfish 19
32

• Water Demand Forecast Report
The species application rate for each species is multiplied by the acres per species by county to derive the aquaculture water demand by county. The statewide water demand by species is shown in Table 13.3. The aquaculture water demand by county is listed in Appendix K.
13.2 Future Water Use Future aquaculture water demands are extremely vulnerable to regulations, international markets, and other factors, such that the future of aquaculture in Arkansas is uncertain. Future water demands for aquaculture are held constant at baseline period levels for planning purposes. Thus, the aquaculture water demand remains at about 103 MGD each year.
13.3 Water Sources All water for aquaculture purposes is obtained from groundwater to ensure conformance with regulations, and/or to control parasite/disease, as surface water has the potential to introduce contaminants into the ponds. Data from the WUDBS data contain an aquifer ID for groundwater sources, as well as the county and species. A ratio of groundwater by aquifer to county use, times the base period aquaculture water volume by species for each county, is used to determine the water volume by aquifer.
13.4 Withdrawals, Consumptive Use, and Water Balance Considerations A portion of aquaculture water use is lost to evaporation (i.e., consumptive use) or seepage; however, ponds also receive direct precipitation. Thus, climate exerts a strong influence on yearly application rates. Water is typically recycled for other on-farm purposes.
14.0 Waterfowl Management and Duck Hunting Water use for creating waterfowl hunting opportunities on agricultural fields and bottomland timber land is estimated by county based upon number of acres flooded and an application rate per acre. The base year volume of water is assumed constant into the future.
There are three "components" to this forecast based on how the data are described in the WUDBS. Data for the waterfowl management forecast include the following:
Self-supplied private duck hunting clubs
Self-supplied state-owned wildlife Management Areas (Arkansas Game and Fish reports water use for maintaining reservoir levels and providing flooded habitat)
The November and December portion of crop irrigation (see discussion in crop irrigation section)
Table 13.3 Statewide Aquaculture Water Demand in MGD Species Type MGD Not Classified 29.12 Crawfish 0.36 Goldfish 6.89 Hatcheries 2.21 Minnows 51.17 Catfish 13.70 TOTAL 103.46
33

• Water Demand Forecast Report
14.1 Base Period Water Use Water use for each county was obtained from 2000-2010 average withdrawals from the WUDBS. WUDBS data are reported for water users with the capability to withdraw 50,000 gpd of groundwater or 1 AFY of surface water, and include monthly water use for the reporting year. Total acreage for 2010 was obtained from the WUDBS.
The water application rates (in inches per acre per year) were determined from the analysis of reported crop irrigation withdrawals. Irrigation volumes reported in November and December are assumed to be for waterfowl hunting. A 10-year average application rate was determined. The application rate times the acres irrigated per county was used to estimate the water demand by county.
Statewide water use by duck clubs, state-owned water management areas, and estimated November and December crop irrigation are summarized in Table 14.1. Water use by county is listed in Appendix L.
14.2 Future Water Use Water use among private duck clubs represents about 86 percent of the demands for this sector. A review of the trend in duck club water use shows that total withdrawals have been relatively constant from 2000-2010 with no discernible changes. Consequently, it was determined that for forecasting purposes the base period volume of water is assumed to remain constant through 2050.
14.3 Water Sources The water sources for duck hunting and wildlife management are identified in the WUDBS by point of withdrawal and HUC 8 for surface water sources, and by point of withdrawal and aquifer code for groundwater sources. Statewide, about 64 percent of demand is from surface water sources, and about 36 percent is from groundwater. The estimated statewide demand by water source is shown in Table 14.2.
Table 14.2 Statewide Total Waterfowl Management Water Demand in MGD
Base Period 2015 2020 2025 2030 2035 2040 2045 2050
Groundwater 94.3 94.3 94.3 94.3 94.3 94.3 94.3 94.3 94.3 Surface Water 164.9 164.9 164.9 164.9 164.9 164.9 164.9 164.9 164.9 Total 259.2 259.2 259.2 259.2 259.2 259.2 259.2 259.2 259.2
14.4 Withdrawals, Consumptive Use, and Water Balance Considerations The portion of water use for waterfowl management that is consumptively used (i.e., not returned to an aquifer or water body) is assumed to be minimal as evaporative loss is minimal in November and December. Ponds are drained in January and February. Therefore, there is a modest volume of groundwater that is "transferred" to surface water when ponds are drained. These releases are available for other uses, and/or may contribute to recorded gage river flows.
Table 14.1 Waterfowl Managment Water Demand in MGD MGD Percent Duck Clubs 224.2 86.5% Wildlife Management Areas 7.6 2.9% Crop Irrigation 27.4 10.6% TOTAL 259.2 100%
34

• Water Demand Forecast Report
14.5 Other Considerations to Note Self-supplied private duck club water demand by county is estimated on an average annual time-step to the year 2050. However, since the demands occur in a 2-month period, the effect on water resources is "seasonal." For groundwater withdrawals, the effect is more attenuated based on the nature of the resource; however, surface water withdrawals have a more immediate effect on the resources. During the water plan update no "seasonal" concern regarding the timing and magnitude of withdrawals were noted. If concerns do arise, a more spatially-refined review of withdrawals and returns could be conducted for the next water plan update.
15.0 Navigation In-stream Water Demands Current in-stream water needs for navigation are determined for the three rivers in Arkansas where commercial shipping occurs and is federally supported: the Arkansas, White, and Ouachita Rivers, as shown in Figure 15.1. Although the Mississippi River borders Arkansas, it is not generally considered waters of the state. Therefore, the Mississippi River is not considered in navigation water supply needs for the water plan update. The feasibility of developing a federal navigation system on the Red River in Arkansas is being evaluated for the future.
Figure 15.1 Arkansas Commercial Navigation Systems
35

• Water Demand Forecast Report
15.1 Characteristics of Arkansas Navigation Systems
In Arkansas, the McClellan-Kerr Arkansas River Navigation System (MKARNS) consists of a series of 13 lock and dam structures and one dam, maintained and operated by the Little Rock District of the US Army Corps of Engineers (USACE). The system begins at the Mississippi River, at the mouth of the White River, at the Montgomery Point Lock & Dam at White River navigation mile 0.5 and continues approximately 10 miles up the White River. At that point, the approximately 10 mile long Arkansas Post Canal connects the White River to the Arkansas River. There are two locks and dams on the canal, Norrell Lock (Lock 1) and Wilbur D. Mills (Lock 2). Wilbur D. Mills (Dam 2), on the Arkansas River just downstream of the mouth of the Arkansas Post Canal maintains navigation depth on the Arkansas River upstream of Dam 2. The rest of the MKARNS in Arkansas consists of a series of 10 more locks and dams on 290 miles of the Arkansas River. The MKARNS navigation channel is maintained to 9 feet. In 2005 Congress authorized construction of a 12-foot navigation channel along the entire length of the MKARNS, but funding has been limited. Therefore, the 12-foot navigation channel will not be maintained until a complete funding package is provided by Congress. There are three public ports on the river in Arkansas, at Pine Bluff, Little Rock, and Fort Smith. Hydropower projects are located at Dam 2, and at five of the locks and dams on the MKARNS in Arkansas. Two of these are federal hydropower projects, and the other four are non-federal. In addition to the locks and dams, channel stabilization structures, and routine dredging are required to maintain the MKARNS navigation channel. Commercial navigation on the Arkansas River is generally feasible year-round.
On the White River upstream of the MKARNS, a navigation channel 125 feet wide and 8 feet deep, when the water level is at 12 feet at the Clarendon gage, is maintained by the Memphis District USACE to Augusta, approximately 190 miles. Between Augusta and Newport—approximately 57 miles—a 100-foot wide channel with minimum depth of 4.5 feet at a gage reading of 3.5 feet at Newport is maintained. There are no structures on the White River navigation project, and no public ports. The navigation channel is maintained solely through dredging and snagging. The Memphis District also maintains nine harbors along the White River. Commercial navigation on the White River is dependent on river stage, and is currently feasible to Newport during only 57 percent of the year (Arkansas Waterways Commission 2012). When the navigation channel is maintained, commercial navigation to Augusta is usually possible year round.
The Ouachita River - Black River navigation project is maintained and operated by the Vicksburg District USACE. This navigation project extends into Arkansas on the Ouachita River from the Louisiana state line to Camden (117 miles). In Arkansas, the Ouachita River - Black River navigation project consists of two locks and dams constructed on cutoff canals. A 9-foot navigation channel is maintained in the Ouachita River to Camden by dredging and snagging. There are two public ports on the Ouachita River in Arkansas, at Crossett and Camden. Commercial navigation on the Ouachita River is feasible year round in Arkansas.
The J. Bennet Johnston Waterway on the Red River extends as far as Shreveport, Louisiana. No commercial navigation channel is currently maintained in the Red River in Arkansas. Commercial navigation does not currently occur on the Red River in Arkansas.
15.2 Commodity Transport In 2010, over 12 million tons of commodities were transported on Arkansas rivers (excluding the Mississippi River). The reported amounts of commodities transported on these rivers for 2010 are
36

• Water Demand Forecast Report
summarized in Table 15.1. In 1998, it was estimated that water transportation of goods in Arkansas contributed almost $60 million to the Gross State Product (Nachtmann 2002). Over the last 4 years, shipping on the MKARNS has been fairly consistent, and represents about 90 percent of the 2010 tonnage. Shipping on the White River was relatively high from 2007 through 2009, but was low the last 2 years.
Table 15.1. Commodity Transportation Tonnages Reported for 2010 (USACE 2012). River 2010 Total tonnage 2010 Commodities
McClellan-Kerr Arkansas River Navigation System (Arkansas and White Rivers)
11,120,000 Crude petroleum, fuel oils, chemicals, rock, sand, gravel, coal, asphalt, wood chips, metal ores, metal products and scrap, clay, slag, minerals, concrete, wheat, corn, rice, sorghum, soybeans, sugar, molasses
Ouachita River+ 1,123,000 Crude petroleum, fertilizer, ammonia, distillate fuel, corn
White River 40,000 Sand and gravel Total 12,283,000 + Information shown is totals for the Ouachita & Black River Navigation Project in Arkansas and Louisiana.
15.3 Navigation Base Period Water Demand Base period in-stream water needs for navigation as determined for the three rivers in Arkansas where commercial shipping occurs and is federally supported is a function of both flow/stage requirements and operating procedures.
15.3.1 Flow/Stage Requirements for Navigation Water levels in navigable rivers must be above a minimum stage to be passable to barge traffic. In addition, there are high stage and/or flow conditions that occur that make barge traffic uneconomical, hazardous, or impossible. This information provides lower and upper bounds for navigation water needs. Information on minimum and maximum flow and/or stage requirements for navigation in the Arkansas River, Ouachita River, and White River is provided below.
15.3.1.1 Arkansas River The target minimum flow necessary for commercial navigation for the Arkansas River is 3,500 cubic feet per second (cfs) at Van Buren and 3,000 cfs at Little Rock. Barge traffic on the Arkansas River is limited when flows at Van Buren exceed 70,000 cfs.
15.3.1.2 Ouachita River Specific flow requirements for navigation have not been designated for the Ouachita River. Operation of the locks and dams on the river provides sufficient water depth in the channel for navigation purposes.
15.3.1.3 White River The Memphis District is authorized to maintain a navigation channel that is 8 feet deep when the stage at Clarendon is 12 feet. Table 15.2 lists the White River minimum stages required for the operation of barges with 9-foot draft. These stages are estimated based upon experience and known channel conditions as of spring 2013. The White River is a dynamic river and continually adjusts its path; therefore, future conditions may require different stages than those indicated.
Under flood conditions, navigability of the White River is primarily a function of flow/discharge, but very high stages impact clearance under the Highway 67 bridge crossing; common tows operating on
37

• Water Demand Forecast Report
the White River do not have adequate clearance when stages exceed 26.5 feet on the gage at Newport. High stages on the White River caused by Mississippi River backwater do not generally impede barge traffic because the backwater reduces velocities enough in the flooded sections of the White River to allow barges to travel upstream.
Table 15.2 Estimated Stages Required for Operation of 9-foot Draft Barges on White River, Arkansas, in Memphis District (2013)
Location Elevation/Stage Gage Zero Elev Discharge (cfs) RM 15 Elevation 121 NA NA Clarendon, AR gage 18 ft 139.91 21,2002 DeValls Bluff, AR gage 14 ft 152.96 26,8001 Georgetown, AR gage 11 ft 170.08 24,6001 Augusta, AR gage 23 ft 169.85 22,2001 Newport, AR gage 11 ft 194.09 22,5001 1 USGS Ratings Depot 2 USACE, Memphis Rating
15.3.2 System Operations for Navigation Existing standard operating procedures for the navigable rivers may constrain, or provide opportunities for, the ability to meet future navigation needs. Therefore, the operating procedures are described and entities responsible for operations are identified in the following sections.
15.3.2.1 Arkansas River In Oklahoma, flow in the Arkansas River is managed by the Tulsa District Army Corps of Engineers. Under normal and low-flow conditions, the Tulsa District manages flow in the Arkansas River to meet the requirements of the Arkansas River Compact. There is storage in the Tulsa District reservoir, Oologah Lake, Oklahoma, allocated for use to supplement flow in the Arkansas River to meet the compact flow requirements under drought or low-flow conditions. The decision to use this storage rests with the Drought Board that is convened in the case of a Level 2 drought declaration. To our knowledge, the storage in Oologah Lake has never been used to supplement flow in the Arkansas River.
In Arkansas, flow in the Arkansas River is managed by the Little Rock District Army Corps of Engineers, primarily to maintain navigation. Hydropower generation in this part of the MKARNS is secondary to navigation (M. Biggs, USACE Little Rock District, personal communication, 6-4-13).
When rainfall runoff fills the flood pools in the Tulsa District reservoirs, the Tulsa District manages flow in the Arkansas River for flood control purposes. The Tulsa District operates reservoirs on the Arkansas River and its tributaries to store flood waters and reduce flood peaks on the Arkansas River through controlled releases. The MKARNS water control plan requires the Tulsa District to evacuate flood storage from upstream lakes as quickly as possible without exceeding the 22-foot Van Buren, Arkansas regulating stage (135,000 cfs to 150,000 cfs). The target flows at Van Buren vary with time of year and for a given amount of system storage in use at the 11 flood control reservoirs in Tulsa District. The Van Buren target flow recedes as system storage use recedes. Target flows occur at 150,000 cfs for flood storage evacuation, and at 60,000 cfs for self-scouring of the navigation channel. Also, a 12-day tapered recession from 40,000 cfs to 20,000 cfs is implemented to provide a recovery period for navigation.
38

• Water Demand Forecast Report
15.3.2.2 Ouachita River Flow in the navigation portion of the Ouachita River is influenced to some extent by the operation of the upstream USACE reservoirs on the Ouachita River and Caddo River, and the Entergy hydropower reservoirs on the Ouachita River. The Felsenthal lock and dam is operated to maintain higher water levels in the Felsenthal National Wildlife Refuge during the fall and winter, to enhance the waterfowl habitat in the refuge (USACE Vicksburg District 2013).
15.3.2.3 White River Flow in the navigation portion of the White River is influenced to some extent by the operation of USACE reservoirs on the White River and its tributaries upstream. Releases from these reservoirs are managed for hydropower production and flood control. In addition, minimum flows have been authorized for two of the White River system reservoirs in Arkansas—Bull Shoals Lake on the White River, and Norfork Lake on the North Fork River. The minimum release from Bull Shoals dam has been set to 800 cfs, and the minimum release from Norfork dam has been set to 300 cfs. These releases are intended to sustain trout habitat in the waters downstream of these dams. Modifications to Bull Shoals systems necessary to enable the minimum release were scheduled to be completed December 2012. Modifications to Norfork dam necessary to enable the minimum release were scheduled to be completed May 2013 (USACE Little Rock District 2012).
15.4 Future Navigation Water Needs For the purpose of forecasting water needs for navigation in Arkansas, the following assumptions are made:
There will be no significant change in flow and water level needs for navigation over the forecast period to 2050
On the Arkansas River, the existing system of locks and dams will be adequate to maintain the minimum 9-foot or 12-foot depth for the navigation channel
On the Ouachita River, existing locks and dams will be adequate to maintain the existing navigation channel
Commercial navigation on the White River is supported and maintained
Adequate funding is available for snagging and dredging and structure maintenance to maintain existing navigation channels
Thus, the base period flow requirements are assumed to be maintained to 2050.
16.0 A Note on Geographic Aggregation and Disaggregation of Demands Water demands of each sector are assigned to locations for different planning purposes. The water demands for all sectors, except navigation, are developed on the county level. The source data used to develop many of the county level forecasts are derived from the WUDBS, which include withdrawal point information (i.e., MPID with associated latitude and longitude coordinates) and water sources (i.e., aquifer codes or surface water HUC 8 codes). Thus, water demands of the county could be
39

• Water Demand Forecast Report
replicated at the individual withdrawal point level with a specific coordinate and source. In instances where an MPID did not have associated coordinate information, a GIS geo-processing tool was used to place a random point with the MPID’s respective county and HUC8. Water demands could then be aggregated by planning region, aquifer, or surface water basin.
In some instances, additional identifying information is used to geographically locate and assign water demands. Water demand among thermoelectric power generating facilities is estimated by facility location, which has specific latitude and longitude coordinates that allow assignment of water demands to planning regions and basins. Water demand among self-supplied domestic users, shale gas, and livestock are estimated at the county level without the benefit of withdrawal point information. The county-level estimates of water demand in these three sectors are proportionally distributed within each county assuming even geographic distributions of demand across the county. Shale gas demand is further limited by the area of the county that overlays the Fayetteville shale formation. GIS analysis is used to distribute the county demands of these three sectors and then assign them to regions and basins. If a particular county is bisected by two (or more) regions or basins, then the sector demand is allocated proportionally among the regions or basins based upon area.
The distribution of navigation water demands among the planning regions is summarized in Table 16.1. There are currently no federal navigation projects in the North and Southwest Arkansas Water Resources Planning Regions. However, the USACE is conducting a feasibility study for extending navigation on the Red River into Arkansas (Southwest Arkansas Water Resources Planning Region).
Table 16.1 Navigation in the Planning Regions Planning Regions Rivers with Federal Navigation Projects East Arkansas White River, Arkansas River downstream of Little Rock West-central Arkansas Arkansas River from Fort Smith to Little Rock South-central Arkansas Ouachita River
17.0 Forecasts by County Water demands by sector (excluding navigation) and by county are presented in each of the appendices for the individual sectors. They are also combined and presented collectively in Appendix M by county using the following planning scenarios:
AIEA population projection scenario for Municipal, Self-supplied Domestic, and Self-supplied Commercial sectors
With conservation effects scenario for the Municipal and Self-supplied Domestic sectors
Reference scenario for the thermoelectric power sector
Total water demand by county is listed in Table 17.1 including the thermoelectric power withdrawal demands, and in Table 17.2 including the thermoelectric power consumption demands. Those counties with thermoelectric power facilities are indicated by an asterisk (*).
40

• Water Demand Forecast Report
Table 17.1 Total County Water Demand in MGD, with Thermoelectric Power Withdrawals
County Base
Period 2015 2020 2025 2030 2035 2040 2045 2050 Arkansas 927 927 927 926 926 926 926 926 926 Ashley 198 196 193 190 187 184 181 179 176 Baxter 6 7 7 7 8 8 9 9 10 Benton * 389 339 367 422 441 450 457 465 474 Boone 6 7 7 7 7 8 8 8 9 Bradley 2 2 2 2 2 1 1 1 1 Calhoun 1 1 1 1 1 1 1 1 1 Carroll 10 10 10 10 11 11 11 11 11 Chicot 284 311 339 338 338 338 338 338 338 Clark 6 6 5 5 5 5 5 5 5 Clay 548 571 594 601 608 614 619 623 627 Cleburne 6 5 5 6 4 4 4 5 5 Cleveland 1 1 1 1 1 1 1 1 1 Columbia 7 7 7 7 7 7 6 6 6 Conway 22 21 19 19 16 15 15 14 14 Craighead * 418 434 451 452 453 453 454 455 456 Crawford 14 15 16 17 17 18 19 21 22 Crittenden 328 365 401 437 473 481 490 490 490 Cross 538 538 539 539 539 538 538 538 538 Dallas 1 1 1 1 1 1 1 1 1 Desha 460 465 470 470 469 468 467 467 466 Drew 80 80 80 80 80 80 80 80 80 Faulkner 22 23 24 26 27 28 30 32 34 Franklin * 5 6 6 6 6 6 7 7 7 Fulton 2 2 2 2 2 2 2 2 2 Garland 18 19 20 20 21 21 22 23 24 Grant 3 3 3 3 3 3 3 3 3 Greene * 301 319 337 360 382 382 383 383 383 Hempstead * 8 14 14 14 14 14 14 14 14 Hot Spring * 27 53 50 51 50 53 54 55 56 Howard 4 4 4 4 4 4 4 4 4 Independence * 130 137 144 147 150 149 148 147 146 Izard 5 5 5 5 6 7 7 8 9 Jackson 443 443 442 461 480 480 480 480 480 Jefferson * 471 494 517 515 514 512 511 509 508 Johnson 5 5 5 5 5 5 6 6 6 Lafayette * 26 28 30 32 34 36 38 41 43 Lawrence 365 379 394 398 402 402 402 402 402 Lee 286 308 329 351 372 394 415 418 422 Lincoln 223 223 224 224 224 224 224 224 224 Little River 99 97 95 91 87 82 78 74 70 Logan 5 5 5 5 5 5 5 5 6 Lonoke 422 417 413 414 415 415 416 417 418 Madison 4 4 4 4 4 5 5 5 5 Marion 2 2 2 2 2 2 2 2 2 Miller 82 77 73 74 75 76 78 79 80 Mississippi * 355 408 455 502 549 549 549 548 548 Monroe 331 354 377 395 414 415 416 416 416 Montgomery 1 1 1 1 1 1 1 1 1 Nevada 1 1 1 1 1 1 1 1 1 Newton 1 1 1 1 1 1 1 1 1
41

• Water Demand Forecast Report
Table 17.1 Total County Water Demand in MGD, with Thermoelectric Power Withdrawals
County Base
Period 2015 2020 2025 2030 2035 2040 2045 2050 Ouachita * 24 30 28 29 28 29 30 30 31 Perry 1 1 1 1 1 1 1 1 1 Phillips * 269 270 269 269 269 269 269 269 269 Pike 1 1 1 1 1 1 1 1 1 Poinsett 730 755 781 781 781 781 781 781 781 Polk 3 3 3 3 4 4 4 4 4 Pope * 756 836 837 837 837 837 837 837 838 Prairie 288 296 303 303 303 303 303 303 303 Pulaski * 89 87 85 85 84 84 84 84 84 Randolph 167 176 186 186 186 186 186 186 186 St. Francis * 348 377 407 440 473 472 472 472 472 Saline 16 16 16 17 17 17 18 19 19 Scott 3 3 3 3 3 3 3 3 3 Searcy 1 1 1 1 1 1 1 1 1 Sebastian 21 21 21 21 22 22 23 23 24 Sevier 4 4 4 4 4 4 5 5 5 Sharp 2 2 2 2 2 2 2 2 2 Stone 1 1 1 1 1 1 1 1 2 Union * 19 22 21 21 20 20 20 20 20 Van Buren 5 6 6 3 3 3 3 3 3 Washington * 30 32 35 37 40 43 46 49 53 White 107 107 107 108 105 106 106 106 107 Woodruff * 308 326 339 340 342 342 343 343 343 Yell 6 6 6 5 5 5 5 5 5 Total 11,093 11,519 11,885 12,155 12,378 12,430 12,479 12,501 12,526 * indicates thermoelectric power facilities
42

• Water Demand Forecast Report
Table 17.2 Total County Water Demand in MGD, with Thermoelectric Power Consumption
County Base
Period 2015 2020 2025 2030 2035 2040 2045 2050 Arkansas 927 927 927 926 926 926 926 926 926 Ashley 198 196 193 190 187 184 181 179 176 Baxter 6 7 7 7 8 8 9 9 10 Benton * 48 53 58 65 71 78 85 93 102 Boone 6 7 7 7 7 8 8 8 9 Bradley 2 2 2 2 2 1 1 1 1 Calhoun 1 1 1 1 1 1 1 1 1 Carroll 10 10 10 10 11 11 11 11 11 Chicot 284 311 339 338 338 338 338 338 338 Clark 6 6 5 5 5 5 5 5 5 Clay 548 571 594 601 608 614 619 623 627 Cleburne 6 5 5 6 4 4 4 5 5 Cleveland 1 1 1 1 1 1 1 1 1 Columbia 7 7 7 7 7 7 6 6 6 Conway 22 21 19 19 16 15 15 14 14 Craighead * 418 434 451 452 453 453 454 455 456 Crawford 14 15 16 17 17 18 19 21 22 Crittenden 328 365 401 437 473 481 490 490 490 Cross 538 538 539 539 539 538 538 538 538 Dallas 1 1 1 1 1 1 1 1 1 Desha 460 465 470 470 469 468 467 467 466 Drew 80 80 80 80 80 80 80 80 80 Faulkner 22 23 24 26 27 28 30 32 34 Franklin * 3 3 3 3 3 3 4 4 4 Fulton 2 2 2 2 2 2 2 2 2 Garland 18 19 20 20 21 21 22 23 24 Grant 3 3 3 3 3 3 3 3 3 Greene * 301 319 337 360 382 382 383 383 383 Hempstead * 8 14 14 14 14 14 14 14 14 Hot Spring * 12 13 12 13 12 13 13 13 13 Howard 4 4 4 4 4 4 4 4 4 Independence * 130 137 144 147 150 149 148 147 146 Izard 5 5 5 5 6 7 7 8 9 Jackson 443 443 442 461 480 480 480 480 480 Jefferson * 471 494 517 515 514 512 511 509 508 Johnson 5 5 5 5 5 5 6 6 6 Lafayette * 26 28 30 32 34 36 38 41 43 Lawrence 365 379 394 398 402 402 402 402 402 Lee 286 308 329 351 372 394 415 418 422 Lincoln 223 223 224 224 224 224 224 224 224 Little River 99 97 95 91 87 82 78 74 70 Logan 5 5 5 5 5 5 5 5 6 Lonoke 422 417 413 414 415 415 416 417 418 Madison 4 4 4 4 4 5 5 5 5 Marion 2 2 2 2 2 2 2 2 2 Miller 82 77 73 74 75 76 78 79 80 Mississippi * 355 408 455 502 549 549 549 548 548 Monroe 331 354 377 395 414 415 416 416 416 Montgomery 1 1 1 1 1 1 1 1 1 Nevada 1 1 1 1 1 1 1 1 1 Newton 1 1 1 1 1 1 1 1 1 Ouachita * 4 3 3 3 3 2 2 2 2 Perry 1 1 1 1 1 1 1 1 1
43

• Water Demand Forecast Report
Table 17.2 Total County Water Demand in MGD, with Thermoelectric Power Consumption
County Base
Period 2015 2020 2025 2030 2035 2040 2045 2050 Phillips * 269 268 268 268 268 267 267 267 267 Pike 1 1 1 1 1 1 1 1 1 Poinsett 730 755 781 781 781 781 781 781 781 Polk 3 3 3 3 4 4 4 4 4 Pope * 42 42 42 43 43 43 43 43 44 Prairie 288 296 303 303 303 303 303 303 303 Pulaski * 89 87 85 85 84 84 84 84 84 Randolph 167 176 186 186 186 186 186 186 186 St. Francis * 348 377 407 440 473 472 472 472 472 Saline 16 16 16 17 17 17 18 19 19 Scott 3 3 3 3 3 3 3 3 3 Searcy 1 1 1 1 1 1 1 1 1 Sebastian 21 21 21 21 22 22 23 23 24 Sevier 4 4 4 4 4 4 5 5 5 Sharp 2 2 2 2 2 2 2 2 2 Stone 1 1 1 1 1 1 1 1 2 Union * 19 22 21 21 20 20 20 20 20 Van Buren 5 6 6 3 3 3 3 3 3 Washington * 30 32 35 37 40 43 46 49 53 White 107 107 107 108 105 106 106 106 107 Woodruff * 304 318 332 333 335 335 335 334 334 Yell 6 6 6 5 5 5 5 5 5 Total 9,997 10,359 10,710 10,929 11,140 11,184 11,230 11,250 11,272 * indicates thermoelectric power facilities
18.0 Forecasts by Region The water demands for all sectors, except navigation, are developed on the county level. As discussed in Section 16, water demands are replicated at the individual withdrawal point level and re-aggregated by planning region.
This section provides a summary of water demand forecasts for each of the five planning regions in the state. As shown in Figure 18.1, the planning region boundaries do not necessarily follow county boundaries. Thus, some counties are divided between two or more planning regions.
Demands are assigned to regions based on: (a) the corresponding county, if the entire county is within a region; (b) latitude and longitude of withdrawal points derived from the MPID location from the WUDBS; or (c) from other identifying information (e.g., location of thermoelectric power generating facility).
Water demand among self-supplied domestic users, shale gas, and livestock are estimated at the county level without the benefit of withdrawal point information. The county-level estimates of water demand in these three sectors are proportionally distributed within each county assuming even geographic distributions of demand across the county. GIS analysis is used to proportionally allocate demands of these three sectors to regions based upon area if a particular county is bisected by two (or more) regions. Shale gas demand is further limited by the area of the county that overlays the Fayetteville shale formation.
44

• Water Demand Forecast Report
Figure 18.1 State Water Resources Planning Regions
The aggregation of the water demand forecasts by region results in a slightly different total water demand due to rounding. The total water demand forecast by region is summarized in Table 18.1 including the thermoelectric power withdrawal demands and crop irrigation, and in Table 18.2 including the thermoelectric power withdrawals but without crop irrigation demands. These demands are illustrated in Figures 18.2 and 18.3, respectively.
The East Arkansas Water Resources Planning Region is dominated by agricultural activity and crop irrigation. When crop irrigation water demand is considered, the East region uses about 80 percent of the statewide total water demand (excluding navigation). Excluding crop irrigation, the East regions uses only about 19 percent of statewide water demand and the West-central region is the dominant water using region at about 39 percent of statewide water use due to the thermoelectric power generating withdrawals in the region.
45
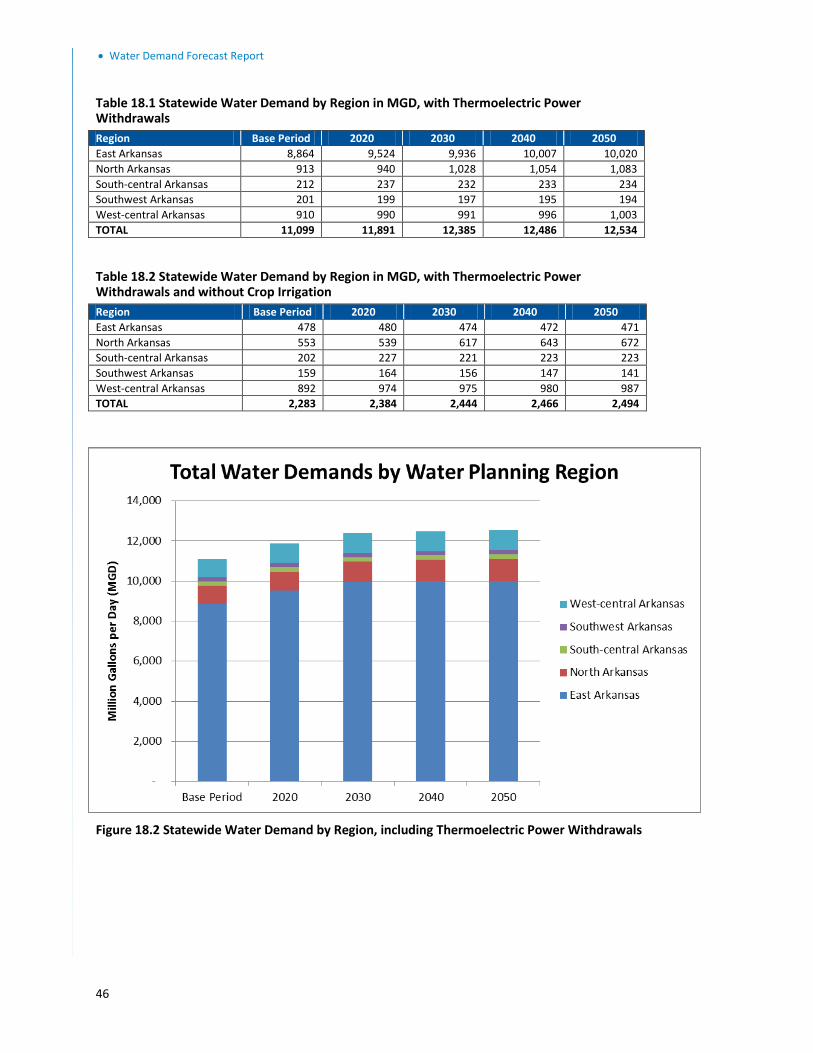
• Water Demand Forecast Report
Table 18.1 Statewide Water Demand by Region in MGD, with Thermoelectric Power Withdrawals Region Base Period 2020 2030 2040 2050 East Arkansas 8,864 9,524 9,936 10,007 10,020 North Arkansas 913 940 1,028 1,054 1,083 South-central Arkansas 212 237 232 233 234 Southwest Arkansas 201 199 197 195 194 West-central Arkansas 910 990 991 996 1,003 TOTAL 11,099 11,891 12,385 12,486 12,534
Table 18.2 Statewide Water Demand by Region in MGD, with Thermoelectric Power Withdrawals and without Crop Irrigation Region Base Period 2020 2030 2040 2050 East Arkansas 478 480 474 472 471 North Arkansas 553 539 617 643 672 South-central Arkansas 202 227 221 223 223 Southwest Arkansas 159 164 156 147 141 West-central Arkansas 892 974 975 980 987 TOTAL 2,283 2,384 2,444 2,466 2,494
Figure 18.2 Statewide Water Demand by Region, including Thermoelectric Power Withdrawals
46

• Water Demand Forecast Report
Figure 18.3 Statewide Water Demand by Region, including Thermoelectric Power Withdrawals, and without Crop Irrigation
Current in-stream water needs for navigation are determined for the three rivers in Arkansas where commercial shipping occurs and is federally supported—the Arkansas, White, and Ouachita Rivers. The Mississippi River is not considered in navigation water supply needs for the water plan update. The estimates of minimum flow requirements and maximum level constraints for navigation are described in Section 15 for each river.
The distribution of the Arkansas rivers with commercial navigation among the planning regions is summarized in Table 18.3 and illustrated in Figure 18.4. There are currently no federal navigation projects in the North and Southwest Arkansas Water Resources Planning Regions. However, the USACE is conducting a feasibility study for extending navigation on the Red River into Arkansas, which would be in the Southwest Arkansas Water Resources Planning Region.
Table 18.3 Navigation in the Planning Regions Planning Region Rivers with Federal Navigation Projects East Arkansas White River, Arkansas River downstream of Little Rock West-central Arkansas Arkansas River from Fort Smith to Little Rock South-central Arkansas Ouachita River
47

• Water Demand Forecast Report
Figure 18.4 Navigable Rivers by Water Resources Planning Region
19.0 Forecasts by Sources The water demands for all sectors, except navigation, are developed on the county level. As discussed in Section 16, water demands are replicated at the individual withdrawal point level and re-aggregated by source (i.e., groundwater aquifer or surface water basin). The forecasts of each sector are distributed among groundwater aquifers (defined by aquifer codes) and surface water basins (defined by HUC 8 codes). The percentage distribution of sector demand by county is reported in the appendices of the respective sections.
Table 19.1 shows the statewide water demand by sector, the base period percent of water by source for each sector, and the base period and 2050 MGD for each sector by source. Overall, about 71 percent of statewide water demand (including thermoelectric power withdrawals) is from groundwater sources. Because of assumptions made in the demand forecasting methodology of each sector, these percentages remain fairly constant to 2050.
48

• Water Demand Forecast Report
Table 19.1 Water Demand Forecast in MGD, with Thermoelectric Power Withdrawals
Sector Base Period Base Period MGD 2050 MGD
%GW %SW GW SW GW SW Crop Irrigation 84.2% 15.7% 7,427 1,388 8,459 1,580 Thermoelectric 0.3% 99.7% 3 1,174 3 1,351 Municipal 29.4% 70.6% 113 271 109 394 Industrial 24.6% 75.4% 72 219 52 149 Duck Habitat 36.4% 63.6% 94 165 94 165 Aquaculture 100.0% 0.0% 103 - 103 - Livestock 39.9% 60.1% 11 16 12 18 Self-Supplied Domestic 100.0% 0.0% 13 - 14 - Shale Gas 0.0% 100.0% - 11 - - Mining 15.5% 84.5% 1 5 2 12 Self-Supplied Commercial 17.5% 82.5% 1 4 1 6 TOTAL 7,838 3,254 8,849 3,675 71% 29% 71% 29%
20.0 Recommendations The AWP Update involves several major steps including the quantification of current and future water needs (referred to as water demand) in order to provide an answer to the question – How much water do we need? These estimates of future water demand are intended for statewide and regional planning purposes, and are not intended to replace local water resources planning efforts. Furthermore, the estimates of future water demand as provided in this report attempted to utilize consistent data and assumptions, along with uniform methodologies in order to provide reasonable estimates of future statewide and regional water use.
As always, this type of analysis is constrained by the available information. Self-reported information in data bases such as WUDBS, COA and CAPS is susceptible to error and omissions. One benefit of periodic updates to analyses such as this is that data collection methods are constantly improving. In particular, the ANRC and USGS should continue to develop procedures for improving the reporting and validation of self-reported water use information. In addition, geographic information such as the coordinates of water withdrawal points should be required as water use information is updated.
The ANRC may wish to collaborate with AIEA and the ADWS in a way that their respective projections of population and employment can be incorporated into future AWP Updates.
Some water-using sectors such as industry, mining, and agriculture are affected by factors external to the state, such as commodity price fluctuations and the global demand for goods and services. These external factors may affect water demands within the state. Thus, the water demand projections of the AWP should be periodically checked with actual water use records. Tracking of projected versus actual water use by sector may provide insights that can be used to refine the water demand forecasts for future AWP Updates.
Crop irrigation is the largest water use in the state, and is predominately supplied by groundwater. This presents an opportunity to balance water sources in a manner that will supply agriculture with a sustainable water supply portfolio. Accurate measurement of water withdrawals by source, such as aquifer code, location, and depth can refine the level of information used in balancing water supply.
49

• Water Demand Forecast Report
This page intentionally left blank.
50

Appendix A Population Projections by County and Scenario

Appendix B Employment Growth Rates by County

Appendix C Municipal Water Demand by County and Scenario (With and Without Conservation)

Appendix D Self-Supplied Domestic Water Demand by County and Scenario (With and Without Conservation)

Appendix E Self-Supplied Commercial Water Demand by County and Scenario

Appendix F Industrial Water Demand by County

Appendix G Mining Water Demand by County

Appendix H Thermoelectric Power Water Demand by Facility and Scenario (Withdrawal and Consumptive)

Appendix I Crop Irrigation Water Demand by County

Appendix J Livestock Water Demand by County

Appendix K Aquaculture Water Demand by County

Appendix L Waterfowl Management Water Demand by County

Appendix M Total Sector Water Demand by County