water detection using satellite images obtained through
TRANSCRIPT

Advances in Computational Sciences and Technology
ISSN 0973-6107 Volume 10, Number 6 (2017) pp. 1923-1940
© Research India Publications
http://www.ripublication.com
Water Detection using Satellite Images Obtained
through Remote Sensing
1 Himanshu Rana and 2 Nirvair Neeru
1Research Scholar, 2Assistant Professor 1,2Department of Computer Engineering, Punjabi University, Patiala, Punjab (India).
Abstract
Remote sensing (RS) using satellites images became a prevalent modern
technology which is being used in numerous applications. Remote sensing is
getting the data and information about any phenomenon or object without
making physical contact with it. It is used in various fields including, land
surveying, various Earth Science disciplines such as ecology, hydrology, etc.
and in geography. One of the interesting areas of research is the use of Remote
Sensing in water detection and management. In this paper, we will review the
research that makes use of water detection techniques using the satellite
images. We will review various technique and compare them to check their
results against each other. It will help to come up with the best technique that
can be used for our research.
Index Terms: Remote Sensing, Satellite, water detection.
I. INTRODUCTION
1.1.Overview
Water is one of the most important natural resources on the earth. It plays a significant
role in our day-to-day life. There are numerous resources of the consumable water
which include the rainfall, groundwater and the various surface water bodies such as
ponds, rivers, lakes, etc. [1]. But there are numerous competitive sectors including the
agriculture, infrastructure, domestic and industrial sectors. The major consumption of
water is dedicated to the agriculture sectors [2].

1924 Himanshu Rana and Nirvair Neeru
Many approaches and techniques have been used to conserve the water. But none of
them proved to be a complete way to get the sustainable growth [5]. Thus, there is a
high requirement of some strategy in which resources can be utilized in the best way
without degrading the quality of the water. Because of the lack of accurate data and
information, evaluating the performance of the implemented water conserving
approaches is not possible [8].
Apart from this, there are various water related issues which are being faced by many
people in the World. Floods are one of those major issues that hinder the progress of
happy life. Flood cause major damage to agriculture, people, and infrastructure. Thus
there is a high necessity to look for some strategies through which the flood affected
areas can be managed easily and quickly [10].
1.2.Remote Sensing
Remote sensing is the science and craft of getting data about, phenomenon, objects or
areas through the recording instruments, for example, scanners, cameras, lasers, linear
arrays situated on stages, for example, airplane or shuttles, without coming into
physical contact with the items phenomenon or area under investigation [7].
Remote sensors are used for the remote sensing applications. Remote sensors detect
the energy which is reflected from the Earth. The remote sensors can be mounted on
aircraft or on satellite. These can be either passive or active type. The passive remote
sensors respond to some external stimuli. They record natural energy which is
transmitted or reflected from the Earth. The reflected sunlight is the main source of
energy for the passive remote sensors [11].
Figure 1: Remote Sensing

Water Detection using Satellite Images Obtained through Remote Sensing 1925
On the other hand, active remote sensors take help of some internal stimuli in order to
retrieve information about the objects or phenomenon occurring on the Earth. For
example, in the laser-beam remote sensing system, a laser beam is directed toward the
Earth and the time taken by the beam to reflect back from the Earth is considered as
the main measure [15].
There are numerous applications of remote sensing which include but not limited to
the following:
1. Coastal Applications: There are various coastal applications that make use of the
remote sensing. It includes maps coastal features, monitor shoreline changes and
tracks a different kind of sediment transport [3].
2. Ocean Applications: The data and information can be obtained through the use of
remote sensing about the ocean. For example, measure ocean temperature and
wave height, monitor ocean circulation and current systems and track the ice
present on the sea, etc. are examples of ocean application using the remote sensing
technology. All of the data can be used to understand and manage the oceans in a
better way.
3. Natural Resource Management: There are numerous natural resources which
are being depleted day by day. There is a high necessity to save these natural
resources so that they can be used for the long term with effective and efficient
way. Map wetlands monitor land use, water detection and chart wildlife habitats
are examples of such applications that make use of the remote sensing. All of the
data and information obtained can be used for minimizing the damage that urban
environment has on nature. Thus significant strategies can be investigated to
protect these natural resources best.
4. Hazard Assessment: There are various applications of remote sensing in hazard
assessment including the tracking of hurricanes, flooding, and earthquakes. Thus
we can develop various strategies in order to prepare ourselves for the natural
disasters.
1.3.Water Detection using Satellite Images
One of the significant application of remote sensing from the applications described in
the previous section is the water detection on the Earth using the satellite images
retrieved through remote sensing [16].
Identification and monitoring of different water surfaces have been a tough
experiment for quite a while in remote sensing information processing. An extensive
number of studies are accessible in the important literature dealing in water and

1926 Himanshu Rana and Nirvair Neeru
wetness location and checking for land administration and protection. Various diverse
sorts of RS (remote sensing) information are helpful for some sort of water discovery.
However, the precision is exceedingly reliant on the info source, the processing
methodology and specifically the mix of the two [17].
Thus, it is apparent that the reliable information about the spatial distribution of the
surface water is necessary for numerous scientific disciplines. In simple words,
assessment of present as well future water resources, river dynamics, agriculture
suitability, river dynamics, wetland inventory, climate models, watershed analysis
environment monitoring, surface water survey and management, and , flood mapping
are some major areas that need information about the water.
The capability to monitor the global water supply through the satellite images is a
great effort in the remote sensing community. The remote sensing of water can be
described as observing water from a long distance and checking its availability,
properties, and gradual development without taking any water samples [3].
A thorough analysis of satellite images can play a significant role in discriminating
and differentiating the changes in the earth areas between different changes of
imaging [4]. Scientists and researchers are continuously putting their effort to design
and develop tools and techniques that can help in analyzing the changes in the earth
areas in more rapid and easy manner. A tool is a set of various interactive steps to
help in the analysis process. There are numerous analysis applications for flood,
agriculture and fuel type assessment [5]. Similarly, we can use these strategies to
detect the water on the surface of the earth.
1.4.Satellite Image processing
Till now, various image processing techniques have been introduced. These
techniques help to identify the water features using the data from the satellite. There
are single-band and multiband methods used for the image processing. Through the
single-band method, only one threshold value is used to extract the features from the
water. The error is common in the single-band method because of the mixing of water
pixels with the different cover types. But it has been said that classification techniques
provide a better result if used to extract the surface water than the single-band
methods [18].
The main dataset includes the information retrieved through the satellite images. It is
required to produce raw data from the previous images produced through several
satellites with some specific resolution. After that these images need to rectify and
corrected to measure the surface reflectance. It is necessary to organize the images
spatially into 1 X 1-degree cell area. Obtained images are organized in a data tiles. In
this way, through these data files a complete time series of observation for every

Water Detection using Satellite Images Obtained through Remote Sensing 1927
single pixel which can be used for analysis. It is shown in figure 2 [1].
Pixel quality
The images and observations obtained from the satellite are subject to many issues
especially the quality. The quality of observations from the satellite is associated with
numerous problems including the instrument saturation, topographic shading, cloud
shadows and instrument failure. Along with this, poor geolocation is also one of the
main factors that lead to poor pixel quality of the observed data and images. Pixel
saturation, band continuity, cloud shadow and terrain shadow are some quality
indicators that helps to improve the quality of the image.
II. LITERATURE SURVEY
Mueller, N. et al. (2016) observed 25 years of Landsat imagery across Australia for
accessing the information about the surface water. The tool used in the research
named as WOfS (Water Observations from Space) helped to identify and to manage
the surface resources water in Australia in a better way. A new way of information
retrieval was possible through the maps generated using WOfS. The combination of
large high-speed storage attached to supercomputer processors, and surface
reflectance data in a standard grid arrangement has enabled the development of a
single analysis that can be applied systematically through decades of data.
Approximately 2 × 10¹³ observations and 184,500 scenes spanning over 27 years
were used for the process. In this way, the continental map of the surface water was
produced [1].
Klemas, V. and Pieterse, A (2015) proposed a technique for water resources
detection in Arid and Semiarid Regions using the remote sensing. The condition of
the soil degradation and desert areas was obtained through the internally consistent
maps of arid regions. MCDM techniques were used to delineate potential ground
zones. Satellite remote sensors and airborne sensors were used for the water detection
[2].
Madhavana, S., et al. (2017) tried to improve the dust detection techniques. In order
to do so, multi-sensor measurements using the Aqua (A), Terra (T) and MODIS
images with OMI(Ozone Monitoring Instrument) were used. The identification of the
dust pixels was a simple task with the use of OMI-based aerosol type [3].
Arvinda, C. S., et al. (2016) used MODIS images in order to analyze the flood
affected areas. Mean shift and SOM techniques were utilized for the flood assessment.
The SOM algorithm was used before, during as well as after accessing the flood
affected area images. The flooded and non-flooded regions were differentiated
through the ROC performance evaluation parameters. At last, the result of the study

1928 Himanshu Rana and Nirvair Neeru
shows that proposed method is effective enough to provide a clear view of the flood
affected areas [4].
Baeye, M. et al. (2016) detected shipwrecks using ocean color satellite imagery in
turbid water. They demonstrated that wrecks generate SPM (Suspended Particulate
Matter) concentration signals that can be detected by using high- resolution ocean
color satellite data like Landsat-8. Surface SPM plumes extended downstream for up
to 4km from the wrecks, with the concentration ranging between 15 and 95 mg/l.
Surface SPM plumes with fully submerged shipwrecks were observed by them, and
they describe them regarding wrecks size and its geometry. So, SPM plumes were
indicators that a shipwreck was exposed at the seabed and certainly not buried [5].
Gierach, M. M., et al. (2016) detected wastewater diversion plumes in Southern
California. They examined the capabilities of multi-sensor satellite data to detect the
2006 HTP and 2012 OCSD wastewater diversions and their impact on water quality
in the SCB. Data included ocean color from MODIS-Aqua and SST from ASTER-
Terra. The result from this was applied to the recent HTP diversion, which occurred
from 21 September to November 2015 in response to the observation made during
2006 HTP diversion inspection [6].
Ovakoglo, G., et al. (2016) used MODIS satellite images for detailed Lake
Morphometric. They presented a methodology for easy updating the bathymetry of a
lake with large water level fluctuations using high temporal resolution satellite image.
It seemed to be possible to produce the lake DDM, using a time series of shorelines
digitized on the near-infrared band of MODIS satellite images. Two versions of the
DDM were produced to access the influence of seasonal water fluctuation. Their
evaluation was small and attributed to seasonal water ponds and vegetation as well as
natural sedimentation process. The application of this was limited to the exposed part
of the lake bottom; this methodology seems to be useful to cover the parts of the lake
that were too shallow to survey by boat [7].
Rokni, K. et al. (2015) gave a new approach for surface water change detection. They
introduced a new approach based on Integration of image fusion and image
classification techniques for surface water change detection. The result shows the high
performance by using the Gram Schmidt ANN and Gram Schmidt SVM approaches
which provide a very high accuracy results; this approach has the advantage of
producing a high-resolution multispectral image. In the end, the suggested approach
has been proven to be effective3 in detecting the water surface changes of Lake
Urmia, Iran [8].
Gupta, R., & Panchal, P. (2015) concentrated on cloud detection algorithm using
Discrete Wavelet Transformation (DWT) and realization of data on NOAA, VIRR

Water Detection using Satellite Images Obtained through Remote Sensing 1929
and MODIS datasets with double threshold values, applied in the visible region of
electromagnetic spectrum using pixel to pixel processing. The radiation in the
microwave region is low and maximum at the visible region. Therefore in this paper,
computation is done in the visible region. DWT is STFT (Short Time Fourier
Transformation). Equation (6) to Equation (12) show the mathematical operations of
proposed algorithm. In this paper, images are categorized into different ecological
surfaces such that water, soil, vegetation, snow. The proposed method can
differentiate the cloud from clear regions. The comparison is made between existing
method based on the color model, and proposed method was found to be better.
Limitation of proposed method is that it face some difficulties to differentiate between
thick clouds and snow/Ice [9].
Sarp, G., & Ozcelik, M (2016) represented the changes that occurred in the Lake
Burdur from the year 1987 to the year 2011. The images were obtained from the
Landsat TM and ETM+ for detecting the changes. Support Vector Machine (SVM)
classification and indexing, including the Normalized Difference Water Index
(NDWI), Modified NDWI (MNDWI) and Automated Water Extraction Index
(AWEI) were used to extract surface water from images. Overall SVM followed by
MNDWI, NDWI and AWEI got the best result among all the techniques [9].
III. TECHNIQUES
In this section, we will review the various techniques used in the satellite image
processing for retrieving the information about the water. Various techniques have
been adopted to get the high quality of pictures in order to get better information
about the presence of water.
Standard supervised maximum likelihood classification
After obtaining the MODIS images from the NASA website, the images covering the
Sindh province were classified. The standard supervised maximum likelihood
classification was used for the images. In this way desired inundated class was
translated into a shape file. Next, the visual interpretation was utilized for the
inundated areas. To exert a different kind of info-layers, the shape file was intersected
with the topographic maps [15].
1930 Himanshu Rana and Nirvair Neeru
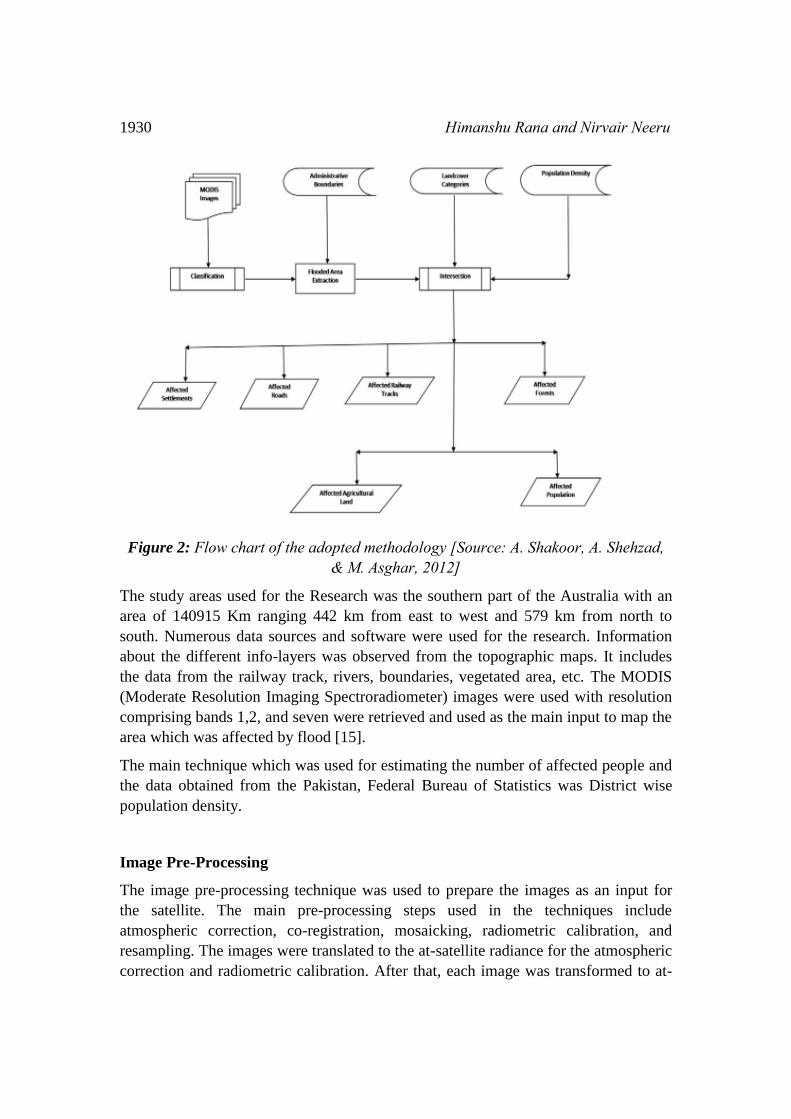
Figure 2: Flow chart of the adopted methodology [Source: A. Shakoor, A. Shehzad, & M. Asghar, 2012]
The study areas used for the Research was the southern part of the Australia with an
area of 140915 Km ranging 442 km from east to west and 579 km from north to
south. Numerous data sources and software were used for the research. Information
about the different info-layers was observed from the topographic maps. It includes
the data from the railway track, rivers, boundaries, vegetated area, etc. The MODIS
(Moderate Resolution Imaging Spectroradiometer) images were used with resolution
comprising bands 1,2, and seven were retrieved and used as the main input to map the
area which was affected by flood [15].
The main technique which was used for estimating the number of affected people and
the data obtained from the Pakistan, Federal Bureau of Statistics was District wise
population density.
Image Pre-Processing
The image pre-processing technique was used to prepare the images as an input for
the satellite. The main pre-processing steps used in the techniques include
atmospheric correction, co-registration, mosaicking, radiometric calibration, and
resampling. The images were translated to the at-satellite radiance for the atmospheric
correction and radiometric calibration. After that, each image was transformed to at-

Water Detection using Satellite Images Obtained through Remote Sensing 1931
satellite reflectance. The images containing the sun elevation and data acquisition rate
were obtained from the Landsat header satellite. At last, the images were converted to
surface reflectance from the at-satellite reflectance using the DOS (Dark Object
Subtraction) method [18].
The new images were then obtained by mosaicking to cover the entire study area. One
image was used as a reference for the co-registration of multi-temporal images. Root
Mean Square Error (RMSE) was used to co-register the images. At last nearest
neighbor method was utilized to resample the dataset as that of the size of the study
area [18].
Figure 3: Data after pre-processing [source: K. Rokni, A. Ahmad, A. Selamat, & S. Hazini]
Index/overlay GIS-based model
K. Khodaei, & H. R Nassery in the paper studied the semi-arid area. They delineated
the potential groundwater zones through identification of the porosity indicators. It
includes the vegetation, drainage pattern, drainage density, lineaments, etc.

1932 Himanshu Rana and Nirvair Neeru
Figure 4: Flow chart for Groundwater target area selection [source: K. Khodaei, & H. R. Nassery, 2011]
The tone, drainage pattern and texture characters were used to prepare the lithological
map of the study area from the images obtained from Landsat TM. Various digital
image processing techniques including the false color composite, band rationing,
principal component analysis, filtering, and classification were applied to obtain high
quality of images [20].
Water Classification
The water classification technique was utilized to analyze the areas of water. In this
technique, N observations for each tile which is stored in AGDC were taken. The
code 1 was used to define the pixel as water and code 0 to define the pixel as not
water.
The regression tree classification was used to obtain the water classification. The
regression tree classification that uses normalized difference rations (NDI) and
Landsat Spectral bands [1].

Water Detection using Satellite Images Obtained through Remote Sensing 1933
Figure 5: Cells and 20 tiles used to develop training data for the model [N. Mueller, A. Lewis, D. Roberts, S. Ring, R. Melrose, J. Sixsmith and A. Ip]
The figure shown above represents the 20 training tiles used as samples for the
regression tree. The each tile was broken into an object for obtaining the training
samples. After that objects were classified manually into 26 different classes
representing a different kind of water and non-water targets. The objects were
selected based on the principle that only includes pixels of necessary class [1].
The adopted technique shows the positive result as it was able to clearly differentiate
between the water and non-water bodies based on the water classification technique.
Groundwater Potential Model (GPM)
Weighted overlay technique was used for implementing the GIS (Geographical
Information System). The technique was used to determine the potential groundwater
value. Each scale value of reclassified layer was multiplied by its weight to determine
the potential groundwater value for a given area [19]. At last, all the resulting cell
values for were added to produce a final output representing the study area. The
greater potential for groundwater was defined with the higher sum values.
The presence of groundwater was classified into three categories including the low,
moderate and high potential for the groundwater [19].

1934 Himanshu Rana and Nirvair Neeru
Figure 6: Flow Chart representing different input, processing, and outputs during the study [source: N. Hammouri, A. El-Naqa, & M. Barakat]
IV. RESULT AND DISCUSSION
This section provides insight into the findings of the research and the discussion about
the various results obtained from the techniques used by the researchers shown in the
previous section.
The following table provides insight into the algorithms and technique used along
with the input and the results.
Year Researchers Algorithm/Method Input Results/ Solution
2012 M. Haq, M.
Akhtar, S.
Muhammad, S.
Paras, & J.
Rahmatullah
MODIS images with
topographic map
information retrieval were
used to determine the
affected people
Topographic
map and
MODIS images
The applied technique
is effective in
providing an overview
of the flood affected
area.
2014 K. Rokni, A.
Ahmad, A.
Selamat, & S.
Hazini
Principal Components of
multi-temporal NDWI
(NDWI-PCs)
Landsat 5-TM,
7-ETM+, and
8-OLI images
The surface area of
Urmia Lake decreased
to one-third in 2013
when compared to the
surface area of water in
2000.
2011 K. Khodaei, &
H. R Nassery
Groundwater target area
selection using GIS and
Remote sensing
procedure
Landsat 5-TM
data and
images
E (Excellent) and VW
(Very Well) groups
have been proposed as
the target area

Water Detection using Satellite Images Obtained through Remote Sensing 1935
2016 N. Mueller, A.
Lewis, D. Roberts,
S. Ring, R.
Melrose, J.
Sixsmith and A. Ip
a decision tree classifier
algorithm
Images
obtained from
Landsat 5 and
Landsat 7
Developed clear map
of the water present
across the Australia
2012 N. Hammouri, A.
El-Naqa, & M.
Barakat.
A groundwater potential
model
drainage and
Lineament and
densities
extracted using
an ortho-
rectified Land-
Sat 7 ETM+
and digital
elevation
model (DEM)
7% of study area found
to have a high potential
for groundwater. Apart
from this, 79% and
14% area have
moderate and low
potential for
groundwater.
Standard supervised maximum likelihood classification
Figure 7: Inundated area representation through MODIS image [source: A. Shakoor, A. Shehzad, & M. Asghar, 2012]
As shown in the above diagram, the selected technique is effective enough in
providing the information about the flood affected area. Remote sensing and
Geographical Information system (GIS) helped to detect the flood affected area as
well as the land cover features [15].

1936 Himanshu Rana and Nirvair Neeru
Image Pre-Processing
Figure 8: Map of Lake Urmia surface area changes [source: K. Rokni, A. Ahmad, A. Selamat, & S. Hazini]
The above figure provides a clear insight into the changes that occurred in Lake
Urmia from the year 2000 to 2013. In 2000, the total area of the lake was 4711 km
which remain only 1906 km in 2013 [18].
Index/overlay GIS-based model
Figure 9: Final Groundwater Potential map [source: K. Khodaei, & H. R. Nassery, 2011]

Water Detection using Satellite Images Obtained through Remote Sensing 1937
As shown in the above figure, the areas were divided into different legends. The
results of the study show that E (Excellent) and VW (Very Well) groups have been
proposed as the target area where groundwater exploration is possible [20].
Water Classification
Figure 10: WOfS filtered summary product for Australia [source: N. Mueller, A. Lewis, D. Roberts, S. Ring, R. Melrose, J. Sixsmith and A. Ip]
Above is the map which is generated using the WOfS product. It provides a source of
information about the flood plains in Australia. Along with this, it is the data source
for analysis and visualization of the surface water in Australia [1].
Groundwater Potential Model (GPM)
Figure 11: Groundwater potential Area Map [source: N. Hammouri, A. El-Naqa, & M. Barakat]

1938 Himanshu Rana and Nirvair Neeru
As shown in the above diagram, the result was classified into three different
categories. These classes include the low, moderate and high groundwater potential
area. It was found that 7%, 79% and 14% of the study area have high, moderate and
low potential for groundwater respectively
The Excellency of the results of all the described techniques is clear from the images
obtained from the study area. Technique 3 is not effective enough for representing the
water detection in an appropriate way because of the unclear boundary lines and use
of weak image processing techniques. Among all the techniques, technique 1 shows
clear view of the water detection area. Also, the technique 5 demonstrated a clear
view of the potential ground water using three classifications. We will use technique 1
and technique 5 utilizing the MODIS images with GIS and RS for detecting the water
under the study area.
V. CONCLUSION
Water is one of the most important natural resources which is key to our life. Though
most of the Earth area is filled with water, only small amount of water is available for
the drinking purpose. Various water conservation techniques have been used till now.
But management of water resources is necessary for accomplishing this task in an
effective way. Water detection through satellite images is one of the promising areas
for conserving the water through proper management. In this paper, we have reviewed
various water detection techniques implemented by the researchers. Image processing
is one of the significant parts of every remote sensing technique to get effective
results. The research review will help us to implement an effective technique for our
research.
VI. REFERENCES
[1] N. Mueller, A. Lewis, D. Roberts, S. Ring, R. Melrose, J. Sixsmith and A. Ip.
Water observations from space: Mapping surface water from 25years of
Landsat imagery across Australia. Remote Sensing of Environment, 174, pp:
341-352. 2016.
[2] V. Klemas, & A. Pieterse. Using Remote Sensing to Map and Monitor Water
Resources in Arid and Semiarid Regions. The Handbook of Environmental Chemistry, pp: 33-60, 2015.
[3] S. Madhavan, J. J. Qu, & X. Hao, Saharan dust detection using multi-sensor
satellite measurements. Heliyon, Vol. 3, Issue. 2, 2017.
[4] C. Arvind, A. Vanjare, S. Omkar, J. Senthilnath, V. Mani, & Diwakar, P.
Flood Assessment using Multi-temporal Modis Satellite Images. Procedia Computer Science, 89, 575-586, 2016.
[5] M. Baeye, R. Quinn, S. Deleu, & M. Fettweis. Detection of shipwrecks in

Water Detection using Satellite Images Obtained through Remote Sensing 1939
ocean colour satellite imagery. Journal of Archaeological Science, 66, 1-6.
2016.
[6] M. M. Gierach, B. Holt, R. Trinh, B. Jack Pan, & C. Rains. Satellite detection
of wastewater diversion plumes in Southern California. Estuarine, Coastal and Shelf Science, 2016.
[7] G. Ovakoglou, T. K. Alexandridis, T. L. Crisman, C. Skoulikaris, & G. S.,
Vergos. Use of MODIS satellite images for detailed Lake Morphometry:
Application to basins with large water level fluctuations. International Journal of Applied Earth Observation and Geoinformation, 51, 37-46, 2016.
[8] K. Rokni, A. Ahmad, K., Solaimani, & S. Hazini. A new approach for surface
water change detection: Integration of pixel level image fusion and image
classification techniques. International Journal of Applied Earth Observation and Geoinformation, 34, 226-234, 2015.
[9] Gupta, R., & Panchal, P. (2015). Cloud detection and its discrimination using
Discrete Wavelet Transform in the satellite images. 2015 International Conference on Communications and Signal Processing (ICCSP). doi:10.1109/iccsp.2015.7322699
[10] Sarp, G., & Ozcelik, M. (2016). Water body extraction and change detection
using time series: A case study of Lake Burdur, Turkey. Journal of Taibah University for Science. doi: 10.1016/j.jtusci.2016.04.005
[11] K. Saylam, R. A. Brown, & J. R. Hupp. Assessment of depth and turbidity
with airborne Lidar bathymetry and multiband satellite imagery in shallow
water bodies of the Alaskan North Slope. International Journal of Applied Earth Observation and Geoinformation, 58, 191-200, 2017.
[12] Gerhards, M., Rock, G., Schlerf, M., & Udelhoven, T. (2016). Water stress
detection in potato plants using leaf temperature, emissivity, and
reflectance. International Journal of Applied Earth Observation and Geoinformation, 53, 27-39. doi:10.1016/j.jag.2016.08.004
[13] Klemas, V. V. (n.d.). Sensors and Techniques for Observing Coastal
Ecosystems. Lecture Notes in Geoinformation and Cartography, 17-44.
doi:10.1007/978-3-540-88183-4_2
[14] Yucel, D. S., Yucel, M. A., & Baba, A. (2014). Change detection and
visualization of acid mine lakes using time series satellite image data in
geographic information systems (GIS): Can (Canakkale) County, NW
Turkey. Environmental Earth Sciences, 72(11), 4311-4323.
doi:10.1007/s12665-014-3330-6
[15] M. Haq, M. Akhtar, S. Muhammad, S. Paras, & J. Rahmatullah. Techniques of
Remote Sensing and GIS for flood monitoring and damage assessment: A case
study of Sindh province, Pakistan. The Egyptian Journal of Remote Sensing and Space Science, Vol. 15, No. 2, Pp: 135-141, 2012.
[16] A. Shakoor, A. Shehzad, & M. Asghar. Application of Remote Sensing

1940 Himanshu Rana and Nirvair Neeru
Techniques for Water Resources Planning and Management. 2006 International Conference on Advances in Space Technologies. 2006.
[17] M. El Bastawesy, R. R. Ali, D. M. Deocamp, & M. S., Al Baroudi. Detection
and Assessment of the Waterlogging in the Dryland Drainage Basins Using
Remote Sensing and GIS Techniques. IEEE Journal of Selected Topics in Applied Earth Observations and Remote Sensing, Vol. 5, Issue, 5, pp: 1564-
1571, 2012.
[18] K. Rokni, A. Ahmad, A. Selamat, & S. Hazini. Water Feature Extraction and
Change Detection Using Multitemporal Landsat Imagery. Remote Sensing,
Vol. 6, Issue 5, Pp: 4173-4189, 2014.
[19] N. Hammouri, A. El-Naqa, & M. Barakat. An Integrated Approach to
Groundwater Exploration Using Remote Sensing and Geographic Information
System. Journal of Water Resource and Protection, Vol. 4, No. 9, pp: 717-
724, 2012.
[20] K. Khodaei, & H. R. Nassery. Groundwater exploration using remote sensing
and geographic information systems in a semi-arid area (Southwest of Urmieh,
Northwest of Iran). Arabian Journal of Geosciences, Vol. 6, Issue. 4, Pp:
1229-1240, 2011.