water, energy and drought in –water energy availability and … · by bill mullican, p.g.,...
TRANSCRIPT

Water, energy and drought in Texas – waterenergy availability and scarcity complicatedenergy availability and scarcity complicated
institutional factors in a place with growing wdemand and regular droughts
By Bill Mullican, P.G.,
Presented toNational Academies
National Academy of SciencesNational Academy of Engineering
Institute of MedicineNational Research CouncilNational Research Council
Division on Engineering & Physical Sciences (DEPS)Meeting of the Board on Energy & Environmental Systems (BEES
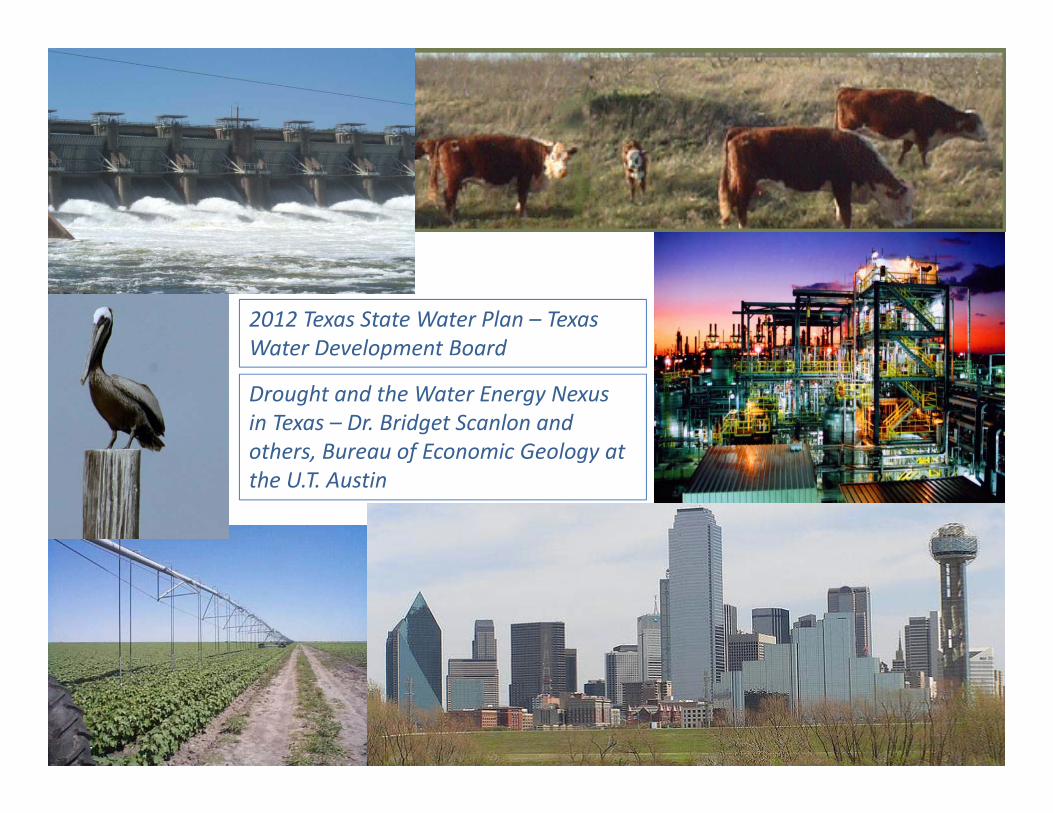
2012 Texas State Water Plan – Texas Water Development Board
Drought and the Water Energy Nexusin Texas – Dr. Bridget Scanlon and others, Bureau of Economic Geology at
ate e e op e t oa d
others, Bureau of Economic Geology at the U.T. Austin
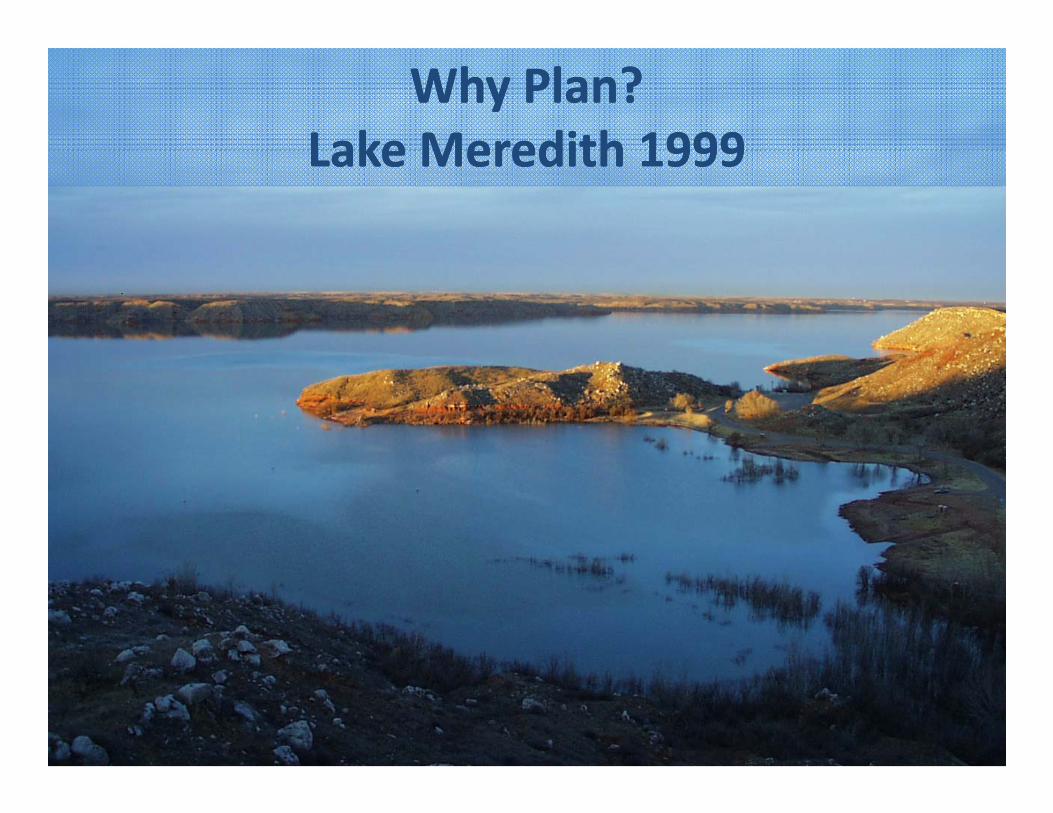
Why Plan?Why Plan?Lake Meredith 1999Lake Meredith 1999Lake Meredith 1999Lake Meredith 1999

Why Plan?Why Plan?Lake MeredithLake Meredith 20132013Lake Meredith Lake Meredith 20132013
Water Supply for 11 Cities onWater Supply for 11 Cities on thetheHigh Plains of TexasHigh Plains of Texas
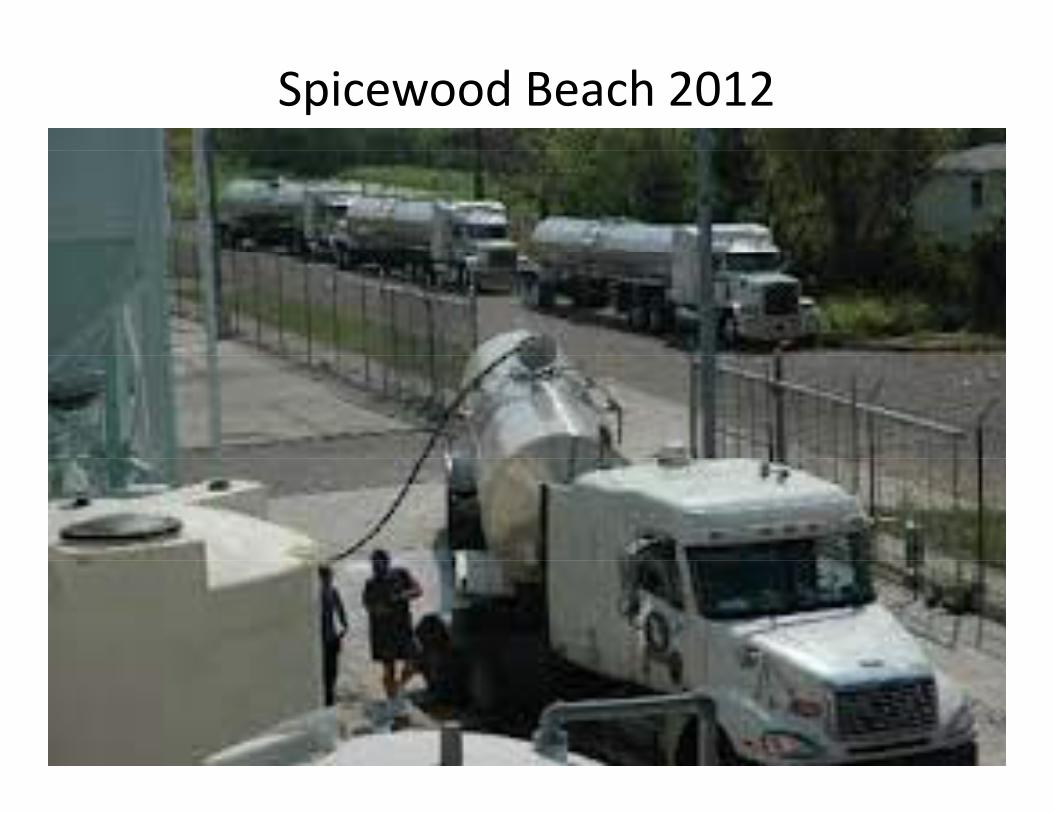
Spicewood Beach 2012
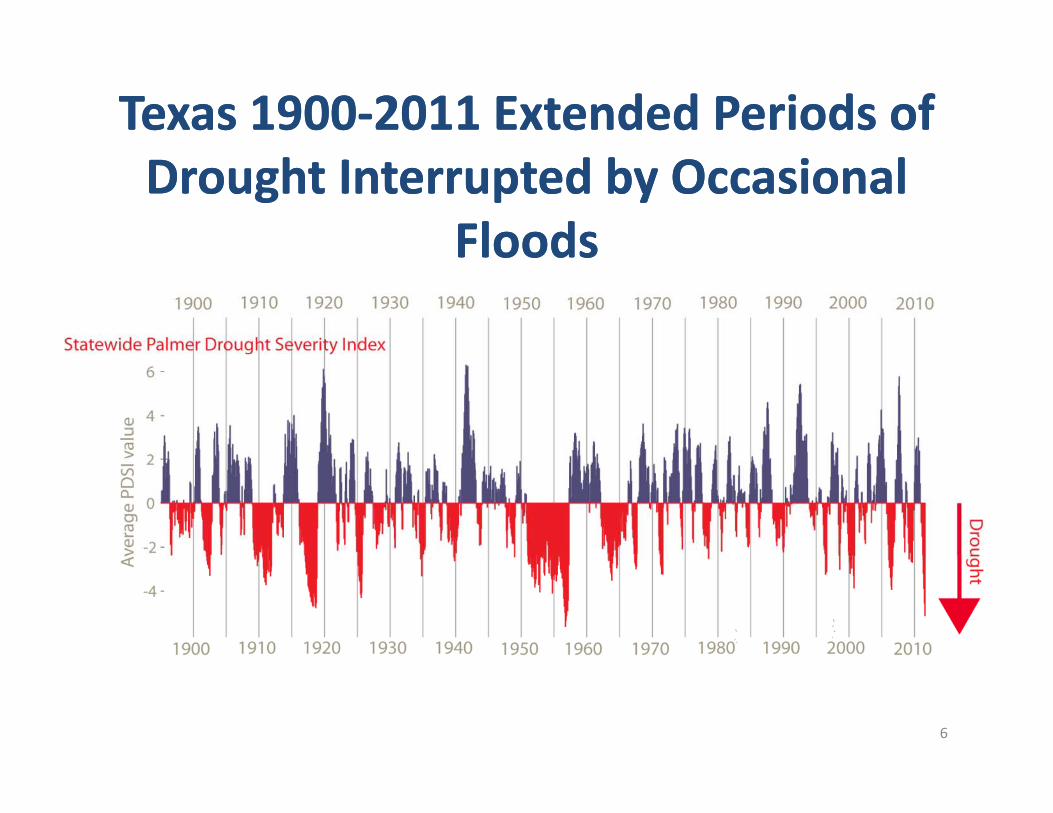
Texas 1900Texas 1900‐‐2011 Extended Periods of 2011 Extended Periods of Drought Interrupted by Occasional Drought Interrupted by Occasional
FloodsFloodsFloodsFloods
6
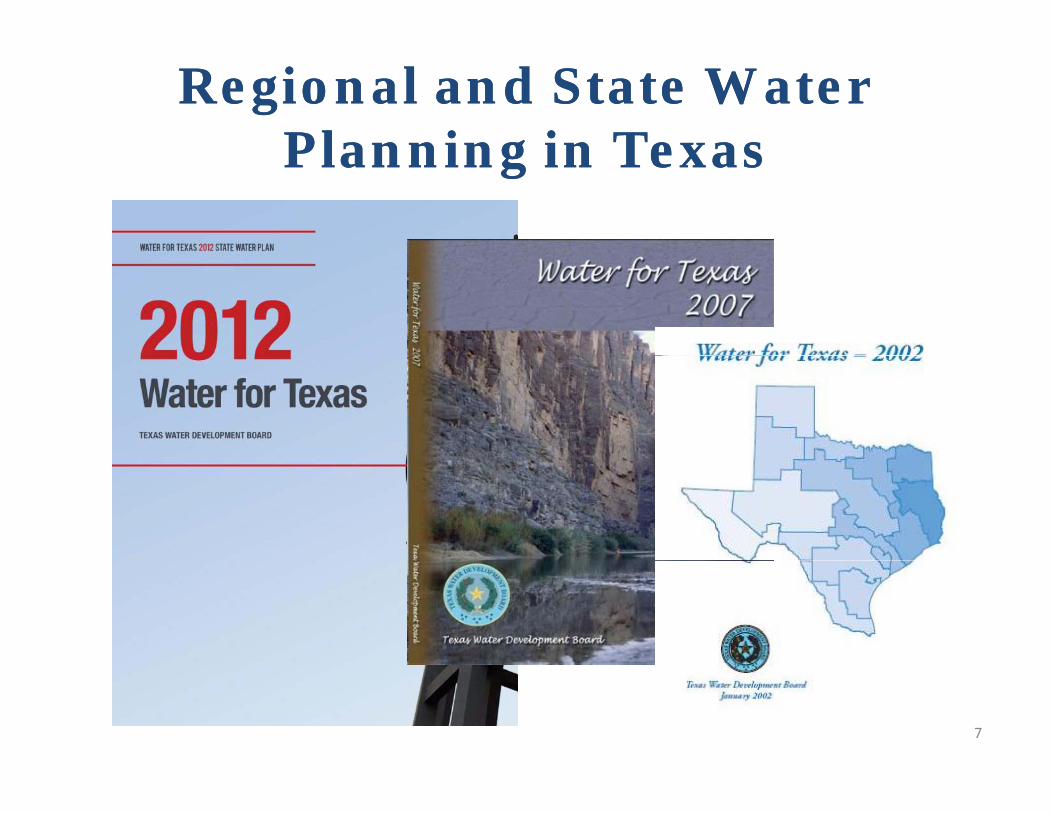
Regional and State WaterRegional and State WaterPlanning in TexasPlanning in TexasPlanning in TexasPlanning in Texas
7

Planning at the Planning at the Local LevelLocal Level •50-year planning horizon
•Population projectionsW d d j i
Cities: 971 (>500 pop) Utilities: 362
•Water demand projections•Water supply projections•Determination of needs/gaps•Recommend water management
County-Others: 254Manufacturing: 174 Steam-Electric: 85
strategies/projects
5
Livestock: 254 Mining: 229g 9Irrigation: 239
8
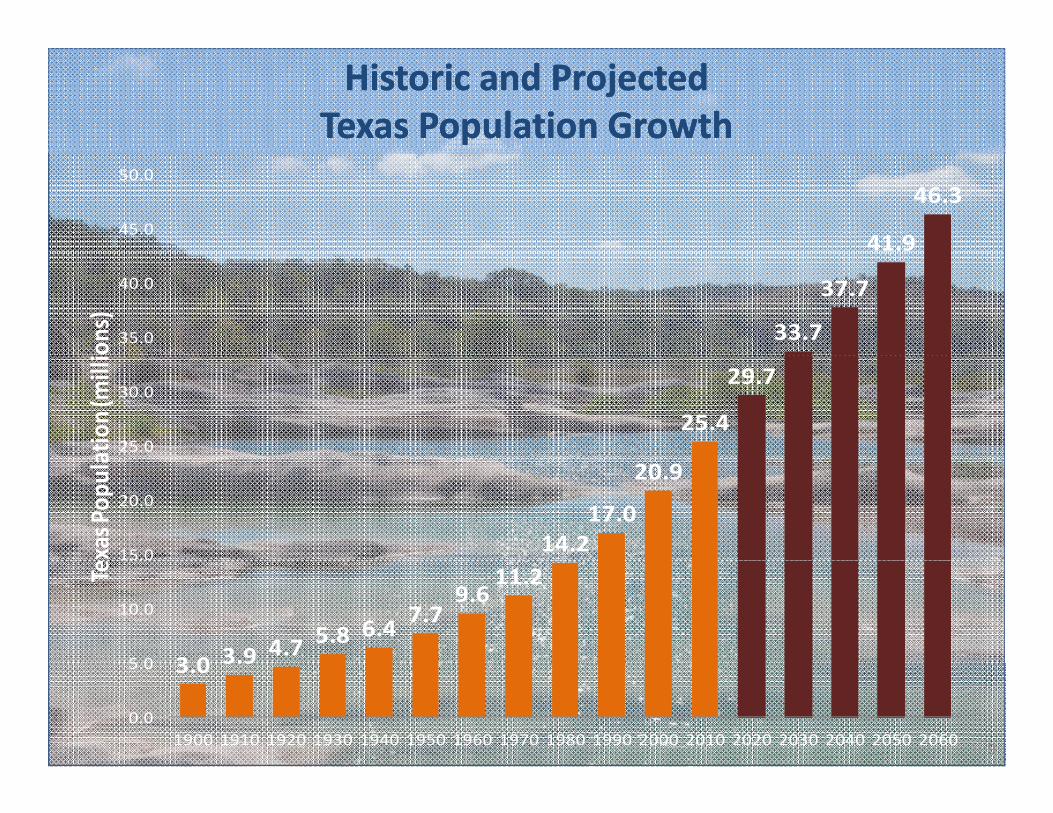
Historic and ProjectedHistoric and ProjectedTexas Population GrowthTexas Population Growth
41.9
46.345.0
50.0
33.7
37.7
35.0
40.0
ons)
25.4
29.7
25.0
30.0
ation (m
illi
14.217.0
20.9
15.0
20.0
xas P
opula
3 0 3.9 4.7 5.8 6.47.7
9.611.2
5 0
10.0
Te
9
3.0 3.9
0.0
5.0
1900 1910 1920 1930 1940 1950 1960 1970 1980 1990 2000 2010 2020 2030 2040 2050 2060 9
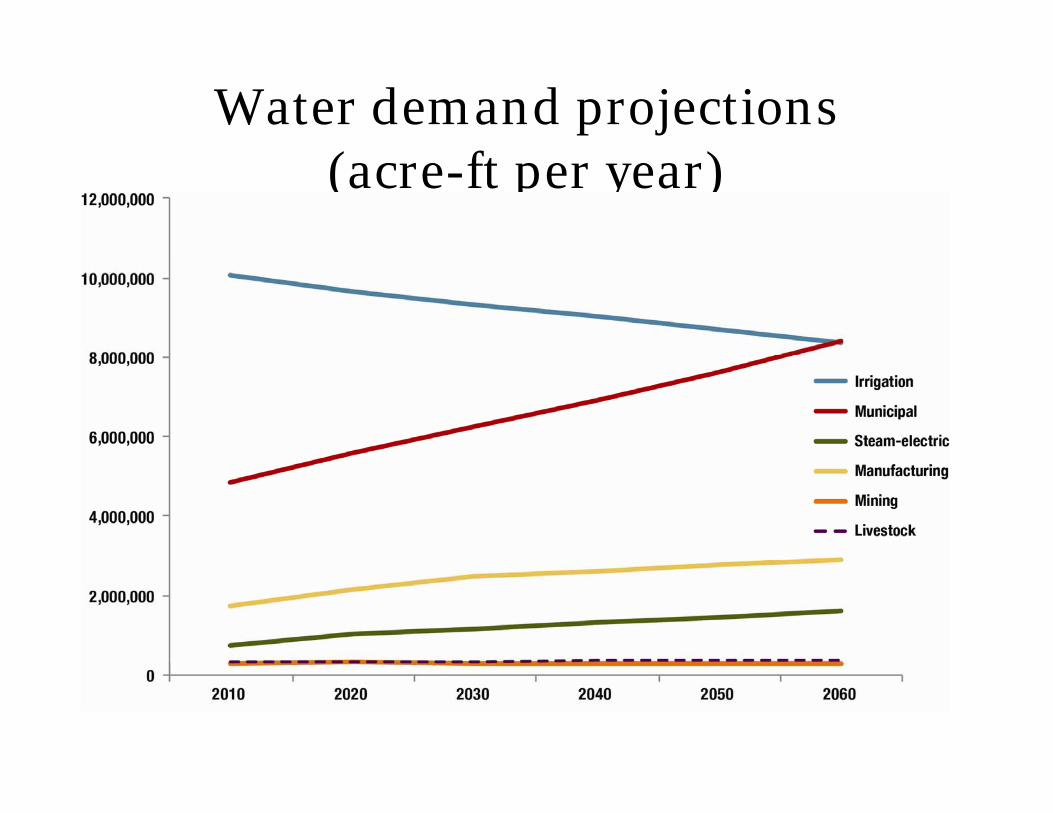
Water demand projections( f )(acre-ft per year)

Net Electricity Generation
WithdrawalWithdrawal
ConsumptionConsumption
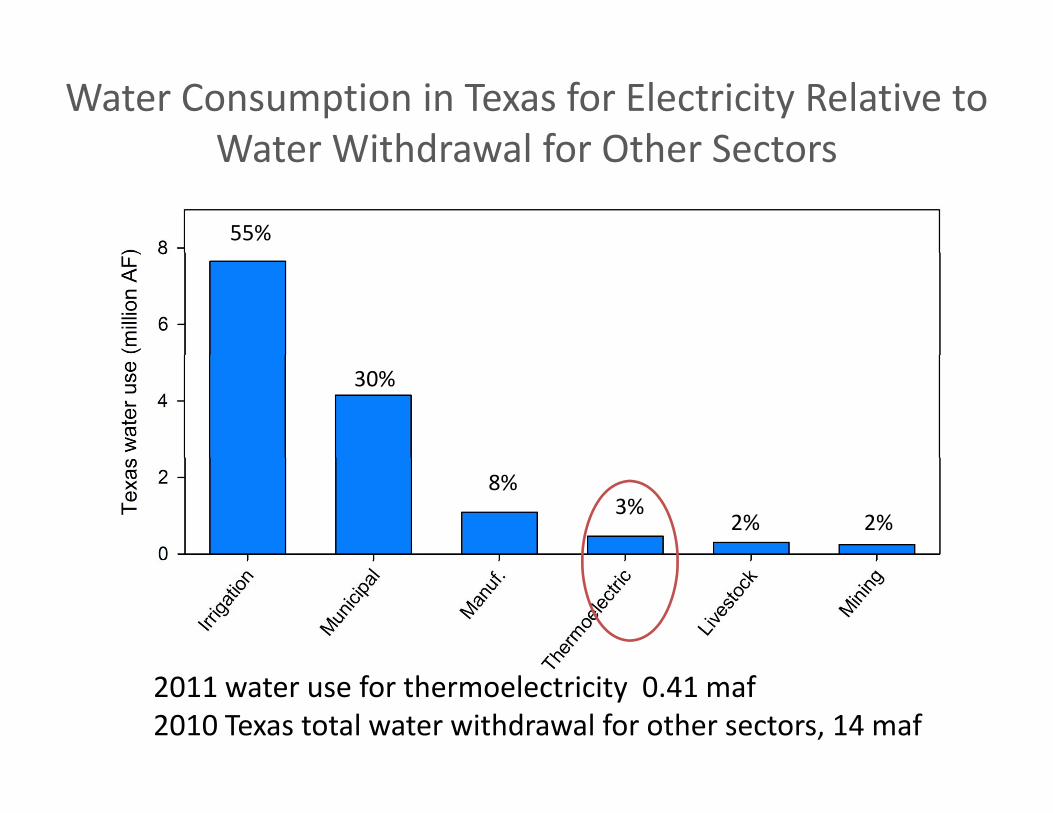
Water Consumption in Texas for Electricity Relative to Water Withdrawal for Other SectorsWater Withdrawal for Other Sectors
55%
30%
8%3%
2% 2%
2011 water use for thermoelectricity 0.41 maf2010 Texas total water withdrawal for other sectors, 14 maf
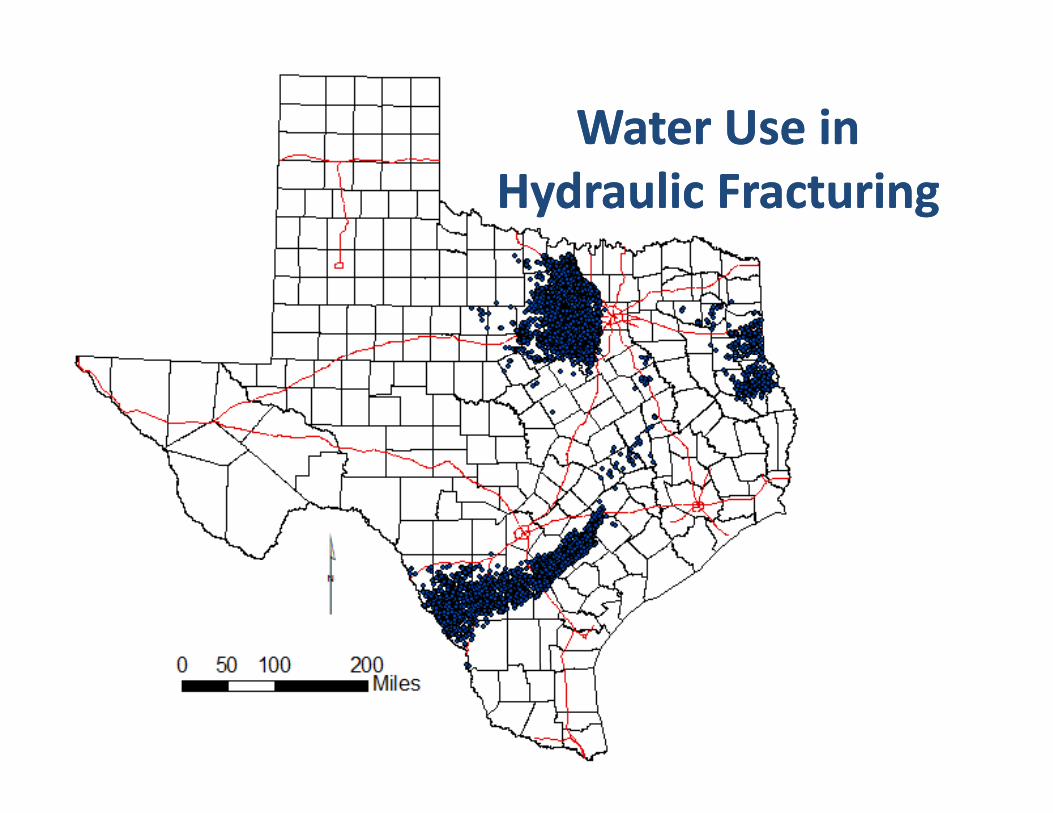
Water Use in Water Use in Hydraulic FracturingHydraulic Fracturing

Tracking Water Use in Hydraulic FracturingTracking Water Use in Hydraulic Fracturing
From J.P. Nicot, 2012
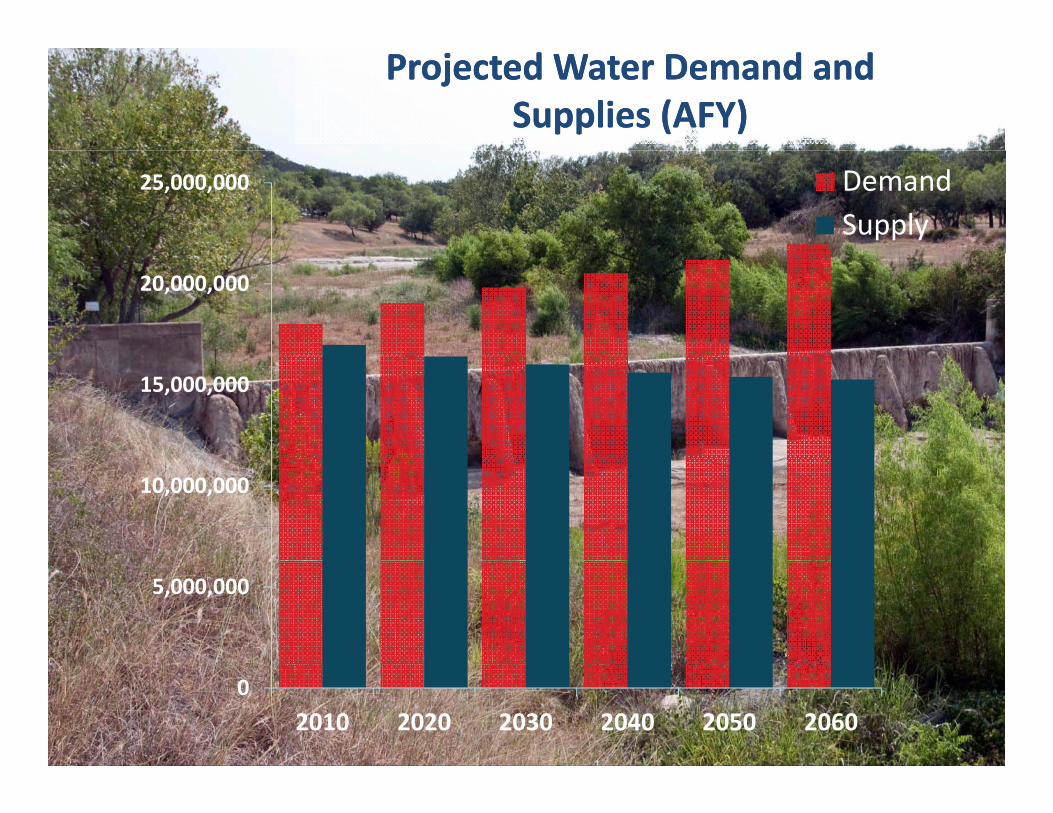
Projected Water Demand andProjected Water Demand andSupplies (AFY)Supplies (AFY)
25,000,000 DemandSupply
20,000,000
15,000,000
10,000,000
5,000,000
0
2010 2020 2030 2040 2050 2060

Projected water needs/gap (AFY)Projected water needs/gap (AFY)

What happens if Texas does not implement What happens if Texas does not implement water management strategies/projects in thewater management strategies/projects in thewater management strategies/projects in the water management strategies/projects in the
2012 State Water Plan?2012 State Water Plan?Lost income:Lost income: Lost jobs:Lost jobs:• $12 billion in 2010• $116 billion in 2060
Lost jobs:Lost jobs:
• 115,000 in 2010
• 1 million in 2060
Lost state and local Lost state and local
1 million in 2060
Lost population growth:Lost population growth:business taxes:business taxes:• $1 billion in 2010
Lost population growth:Lost population growth:
• 1.4 million in 2060
• $10 billion in 2060
17
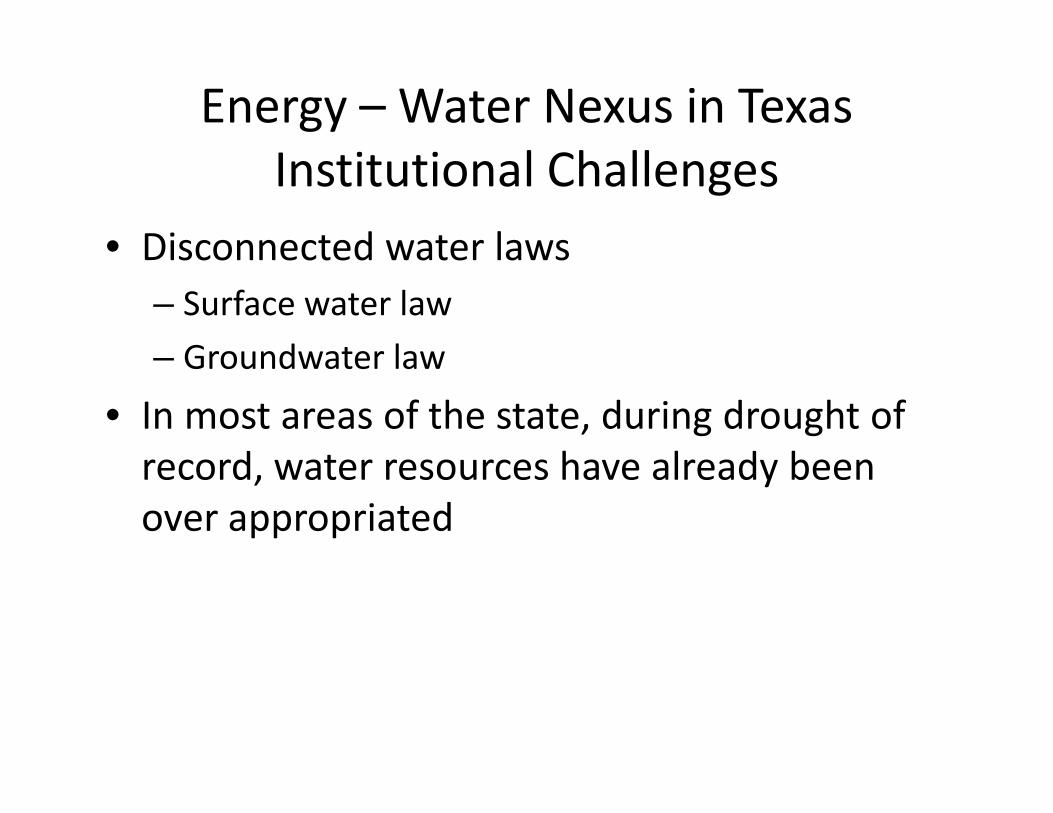
Energy – Water Nexus in Texasl h llInstitutional Challenges
• Disconnected water lawsDisconnected water laws– Surface water law
Groundwater law– Groundwater law
• In most areas of the state, during drought of d t h l d brecord, water resources have already been
over appropriated

Energy – Water Nexus in Texash h llOther Challenges
• Confusing terminologyConfusing terminology– Water use
Water withdrawals– Water withdrawals
– Water consumption
L k f i l b t f d t• Lack of simple, robust source of data
• Cost of infrastructure
• Energy sector deregulated
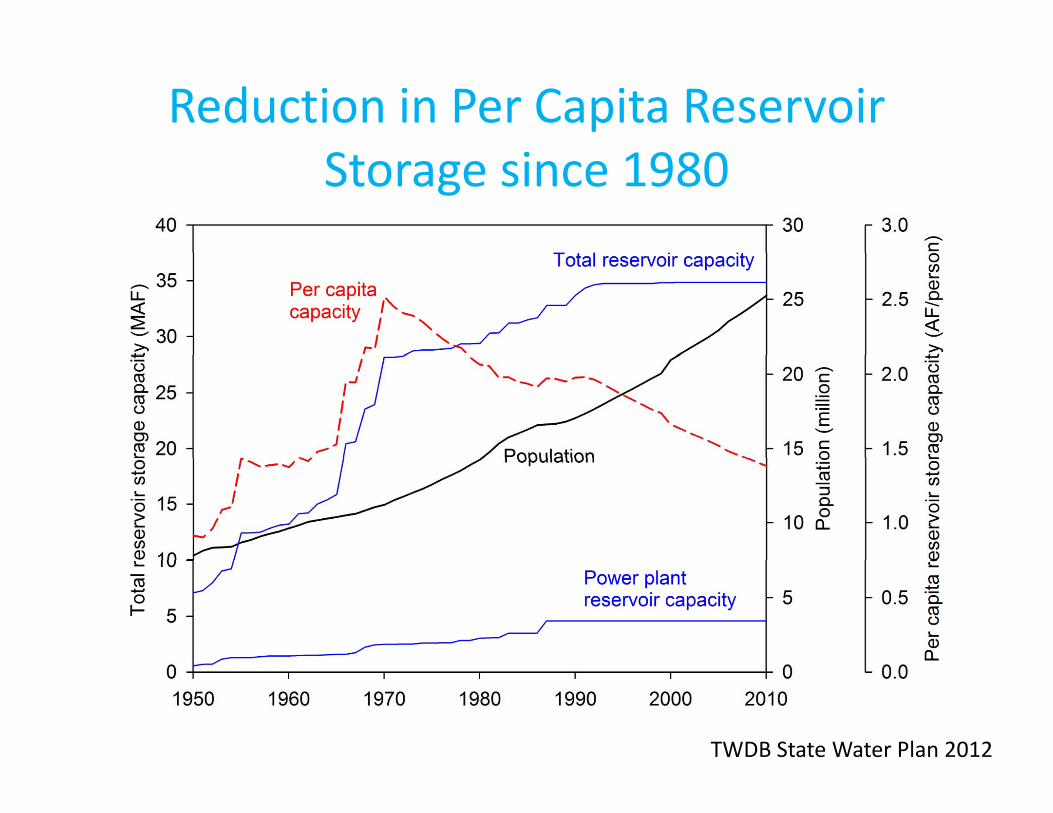
Reduction in Per Capita Reservoir Storage since 1980
TWDB State Water Plan 2012

Energy‐Water Nexus in TexaskTakeaway Points
• The energy‐water nexus is amplified duringThe energy water nexus is amplified during drought because electricity demands are maximized when water supplies are at a minimum
• Anything that reduces electricity generation capacity will exacerbate drought vulnerability
• Increasing electricity generation capacity can mitigate drought impacts caused by water shortages

Energy‐Water Nexus in TexaskTakeaway Points
• Water consumption 2010 and 2011 are theWater consumption 2010 and 2011 are the same (0.44 maf)
• Electricity generation 6% higher in 2011Electricity generation 6% higher in 2011• Therefore, drought vulnerability does not result from increased water demand forresult from increased water demand for thermoelectric generation but reduced water supplies caused by drought and increased water demand from other sectors (irrigation, municipal uses)


Thanks for the invite, and please, send some rain!
Questions!Questions!
25