water fluoridation and tooth decay: results from the 1966-1987 … · water fluoridation and tooth...
TRANSCRIPT

WATER FLUORIDATION AND TOOTH DECAY: RESULTS FROMTHE 1966-1987 NATIONAL SURVEY OF U.S. SCHOOLCHILDREN
by
John A. Yiamouyiannis*Delaware, Ohio, USA
SUMMARY: Data from dental examinations of 39,207 school-children, aged 5-17, in 84 areas throughout the United Statesare analyzed. Of these areas, 27 had been fluoridated forl7 years or more (F),30 had never been f luoridated (NF)'and 27 had been only partially fluoridated or fluoridatedfor less than l7 years (PF). No stat ist ical ly signif icant dif fer-ences rilere found in the decay rates of permanent teethor the percentages of decay-free children in the F, NF andPF areas. However, among S-year-olds, the decay rates ofdeciduous teeth were significantly lower in F than in NFareas.
KEY WORDS: Dental caries; Fluoridation; Schoolchildren; Tooth decay.
Introduction
It has become widely accepted among dental and public health profes-sionals that fluoridation reduces tooth decay by one-half to trvo-thirds (1,2).However, recent studies by public health dentists in New Zealand, Canadaand the United States have reported similar or lower tooth decay rates innonfluoridated areas as compared to fluoridated areas (3-6). Moreover findingsin the United States and worldwide show that, over the last 25 years, reduc-tions in tooth decay rates in nonfluoridated areas are comparable to thosein f luoridated areas (7-9).
From 1986 to 1987, dentists trained by the U.S. National Inst i tute ofDental Research (NIDR) performed dental examinations on 39,207 school-children, aged 5-17, in 84 areas throughout the United States. This surveyallowed a comparison of tooth decay of large numbers of people from a largenumber of areas, some of which have been fluoridated and some of whichhave not.
Materials and Methods
Through the United States Freedom of Information Act, we obtaineda printout of the dental records and a list of the 84 areas used in this survey.From these data, we calculated the number of decayed and filled deciduousteeth (dft) and the number of decayed, missing, and f i l led permanent teeth(DMFT) for each record and entered the resulting data into a computer. Allcalculations were triple-checked before being entered into the computer andall computer entries were double-checked.
By computer, each record (including the dft and DMFT scores of eachstudent) was placed in the appropriate age group. For each of the l3 age
*---SATt-water Foundation, 6439 Taggart Road, Delaware, ohio 43015, usA.
5 5

56 Yiamouyiannis
groups, average dft and DMFT rates per child were determined for each ofthe 84 areas. Age-adjusted DMFT rates for 5- to l7-year-olds were calculatedby adding the DMFT rates for each of the 13 age groups and dividing by1 3 0 0 ) .
We obtained data regarding the fluoridation status of the areas surveyedfrom Natural Fluoride Content of Community Water Supplies, FluoridationCdnsus 1969, Fluoridation Census 1975, and Fluoridation Census t9E5, allpublished by the U.S. Public Health Service. In some cases, local authoritieswere also contacted to determine the fluoridation status of an area.
Average DMFT (and dft) rates for the F, NF, and PF groups were cal-culated for each age. Average-age-adjusted DMFT (and dft) rates for theF, NF, and PF groups were calculated by taking the average of the age-adjusted rates for the respective groups (10).
The percentage of rrcaries-freett children was calculated for each age-groupfor each area. Age-adjusted trcaries-freett rates were also calculated. A studentwas considered to be ttcaries-freett so long as they had no DMFT or dft. Forexample, a chi ld who had lost al l their teeth and no longer had any leftto be decayed or filled would not be recorded as a rrcaries-free" student.
Through the United States Freedom of Information Act, we also obtainedresidence data for each of the above schoolchildren which allowed us to cal-culate tooth decay rates for those in F, NF, and PF areas who had livedat the same residence for their entire life.
The two-tailed t-test was used to determine 959o confidence intervalsand to determine stat ist ical signif icance (at the 959o confidence level). Atwo-sided Wilcoxon rank sum test ( l l ) was used to determine whether therewas a statistically significant difference (at the 95% confidence level) inthe rank order of the DMFT rates of F and NF areas.
Results
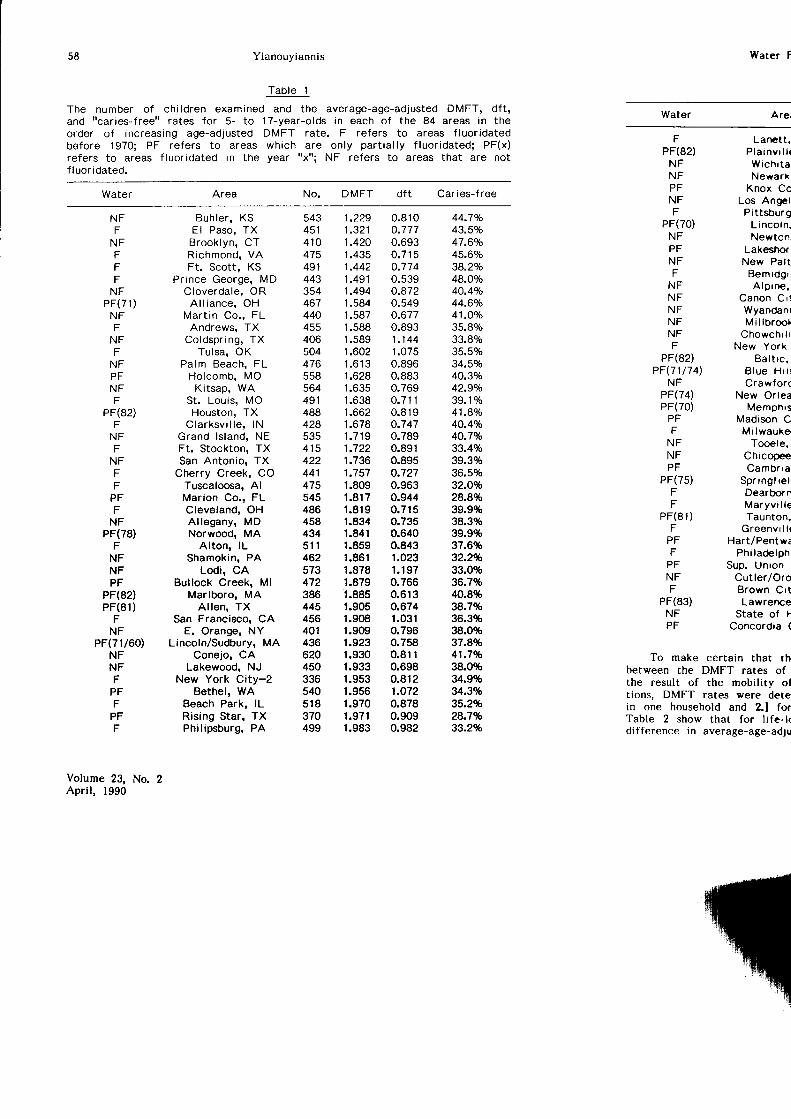
Table I presents the number of students examined and the age-adjustedDMFT rate for each of the 84 areas in the order of increasing tooth decayrate. There is no statistically significant difference in the rank order of theage-adjusted DMFT rates of F and NF areas. As can be seen by examinationof column l, there is no clustering of f luoridated areas at the top of thetable. In the quartile with the lowest age-adjusted DMFT rates, 9 are non-fluoridated, 3 are partially fluoridated, and 9 are fluoridated. In the quartilewith the highest DMFT rates, 5 are nonfluoridated, l0 are partially fluoridated,and 6 are fluoridated. Table I also indicates that there is no biased geo-graphical distribution of F and NF areas that is hiding some potential decay-preventive effect of water fluoridation.
There is no statistically significant difference between the average DMFTrates for the F and NF groups at any age (Figure l). The average DMFTrates of the PF groups are higher than those of the F and NF groups atevery age with the exception of l4-year-olds.
There is no statistically significant difference in the average-age-adjustedDMFT rates among the F, PF, and NF groups (Table 2). The average-age-
Volume 23, No. 2Apri l , 1990
Water F
Tooth decay in f luoftctalf luor idated (NF) areas: Pe
6.00
5.00DECAYED,MISSING, 4.OO
AND FILLEDPERMANENT 3.OO
TEETH(DMFT)PER 2.00
CHILD1.00
0.00
Average-age-adjusted DMFT tl i fe- long resident schoolchi lcrStandard deviat ions are grven '
No. otAreas
Fluoridated 27
Par t ia l l yFluoridated
27
Nonfluoridated 30
adjusted DMFT rates in F an95% confidence interval for tin NF areas is (-0.19, 0.251;the possibi l i ty that the DMFa tooth less than in the \Fof 95%, the possibl i ty that thof a tooth less than in the F
t$-c5 6

Ifl
Water Fluoridation and Tooth Decay
F igure 1
Tooth decay in f tuoridated (F), part ial ly f luoridated (pF), and non_fluoridated (NF) areas: Permanent Teeth.
57
6.00
5.00DECAYED,MtsstNG, 4.00
AND FILLEDPERMANENT 3.OO
TEETH(DMFT) PER 2.00
CHILD
1.00
0.005 6 7 I 9 1 0 1 1 1 2 1 3 1 4 1 5 1 6 1 7
AGE
Tabte 2
Average-age-adjusted DMFT rates for 39,207 U,s. schoolchi ldren and 17,336li fe- long resident schoolchi ldren in 84 areas throughout the united states.Standard deviat ions are given in parentheses.
Total L i fe - long
No. of No. ofAreas Students DMFr .1ft":1, DMFI
Fluoridated 27
P a r t i a l l y ^ 1F luor ida ted 1 l
Nonfluoridated 30
12'747 rola?l 6,272
t2,s7l tolol?l s,642
1 .97(0.46s)
2.25(0.470)
13,882 tol+'�0?l 5'422 tols?l
adjusted DMFT rates in F and NF areas are 1.96 and 1.99, respectively. The95% confidence interval for the DMFT rate in F areas minus the DMFT ratein NF areas is (-0.19,0.25); thus we can rule out, with a cerrainty of g5o/o,the possibility thar the DMFT rate in F areas is more than one-fourth ofa tooth less than in the NF areas. We can also rule out, with a certaintyof 95%, the possiblity that the DMFT rate in NF areas is more than one-fifthof a tooth less than in the F areas.
Fluoride
58 Yianouyiannis
Tab le 1
The number of chi ldren examined and the average-age-adjusted DMFT, dft,andr rcar ies- f reer r ra tes fo r 5 - to 17-year -o lds in each o f the 84 areas in theorder of increasing age-adjusted DMFT rate. F refers to areas f luoridatedbefore 1970; PF refers to areas which are only part ial ly f luoridated; PF(x)refers to areas f luoridated in the year "x"; NF refers to areas that are notf luoridated.
Water Area DMFT dft Car i es-f ree
Water F
Water Arei
N FF
N FFFF
N FP F ( 7 1 )
N FF
N FF
N FPFN FF
PF(82)F
NFF
NFFF
PFF
NFPF(78)
FNFNFPF
PF(82)PF(81)
FNF
PF(71160)NFNFF
PFF
PFF
Volume 23, No. 2Apri l , 1990
Buh ler , KSEl Paso, TXBrook lyn , CTRichmond, VAFt. Scott, KS
Prince George, MDCloverda le , OR
A l l i a n c e , O HMar t in Co. , FL
Andrews, TXColdspr ing , TX
Tu lsa , OKPalm Beach, FL
Holcomb, MOKitsap, WA
St . Lou is , MOHouston, TX
Clarksv i l le , lNGrand lsland, NEFt. Stockton, TXSan Antonio, TX
Cherry Creek, COTuscaloosa, AlMarion Co., FLCleveland, OHAl legany , MDNorwood, MA
Alton, lLShamokin, PA
Lodi, CABullock Creek, Ml
Marlboro, MAAl len , TX
San Francisco, CAE. Orange, NY
Lincoln/Sudbury, MAConejo, CA
Lakewood, NJNew York City-2
Bethel, WABeach Park, lLRising Star, TXPhil ipsburg, PA
F Lanett.PF(82) P la invr t l t
NF Wrchr ta ,NF Newark ,PF Knox CoNF Los AngetF Pittsburg
PF(70) L inco tn .NF Newton,PF LakeslrorrNF New Pa l tF Bemrdgr ,
NF A lprne .NF Canon Cr !NF WyandanrNF M i l lb roo lNF Chowchr l lF New York
PF(82) Ba l t rc .PF(71/74) B lue Hr l l
NF CrawforcPF(74) New OrleaPF(70) Memphrs
PF Madison CF Mi lwauker
NF Tooele,NF ChicopeePF Cambrra ,
PF(75) Spr ing f re t ,F DearbornF Maryv i l te
PF(81) Taunton.F Greenvr l l (
PF Hart/PentwaF Ph i lacb lph
PF Sup. Unron ,NF Cut le r /OroF Brorvn Crt
PF(83) Lawrenc€NF State of FPF Concordia (
To make certain that rhbetween the DMFT rates ofthe result of the mobil i t ;r oftions, DMFT rates were detein one household and 2l forTable 2 show that for l i fe- l<difference in average-age-ad.;u
No.
543 1.229451 1.321410 1 .420475 1.435491 1 .442443 1 .491354 1.494467 1.584440 1.587455 1.588406 1.589504 r.602476 1 .61 3558 1 .628564 1.635491 1 .638488 1.662428 1.6785 3 5 1 . 7 1 9415 1 .722422 1.736441 1.757475 1.809545 1.817486 1 .819458 1.834434 1.84151 1 1 .859462 1.861573 1.878472 1.879386 1.885445 1.905456 1.908401 r.909436 1.923620 1.930450 1.933336 1.953540 1.956518 1 .970370 1.971499 1.983
0.810o.777n Ao?
0 .715o.7740.539o.8720.5490.6770.8931 .1441.0750.896O.BB30.7690 . 7 1 10.819o.7470.7890.8910.8950.7270.9630.9440.7150.7350.6400.8431.0231 .1970.7660.6130.6741.031o.7960.7580.8110.6980.8121.O720.8780.9090.982
44.7%43.5%47.6%45.60/o38.2o/o48.OVo40.4Yo44.60/041.OVo35.89o33.8olo35.5%34.SVo40.3%42.9o/o39.1olo41.8Vo40.4Vo40.7%33.4%39.3%36.5%32.O%28.8%39.9%38.3%39.9%37.6%32.2%33.0%36.7%40.8%38.7%36.3%38.0%37.8%41.l4o38.0%34.9%343%35.2%28.7%33.2%

Water Fluoridation and Tooth Decay
Table 1 (Continued)
59
Water No. DMFT dft Caries-free
Lanett, ALP l a i n v i l l e , C TWich i ta , KSNewark, NJ
Knox Co., TNLos Angeles, CA
Pittsburgh, PAL inco ln , NENewton, KS
Lakeshore, MlNew Pa l tz , NY
Bemidg i , MNAlp ine , OR
Canon C i ty , COWyandank, NYMi l lb rook , NY
Chowch i l la , CANew York C i ty -1
Ba l t i c , SDB l u e H i l l , N ECrawford' PA
New Orleans, LAMemphis , TN
Madison Co. , MSMi lwaukee ' Wl
Tooele, UTChicopee, MACambr ia ' PA
Spr ing f ie ld , VTDearborn, MlMaryv i l le , TNTaunton' MA
Greenv i l le ' M lHart/Pentwater, Ml
Ph i lade lph ia , PASup. Un ion #41, vT
Cutler/Orosi, CABrown C i tY ' M lLawrence, MA
State of HawaiiConcordia Co., LA
To make certain that the absence of a stat ist ical ly signif icant dif ference
between the DMFT rates of schoolchildren living in F and NI areas was not
itre resutt of the mobility of schoolchildren, or their sex and racial composi-
tions, DMFT rates were ietermined for l.] those who spent their entire lives
in one household and 2.] for white males and white females. The results in
Table 2 show that for life-long residents, there is no statistically significant
difference ln average-age-adiusied DMFT rates in F and NF areas. In addition,
FPF(82)
N FN FPFN FF
PF(70)N FPFNFF
NFN FN FNFN FF
PF(82)PF(71/7 4)
N FPF(74)PF(70)
PFF
N FNFPF
PF(75)FF
PF(81)F
PFF
PFN FF
PF(83)NFP F
503 1.994436 2.006496 2.036494 2.038530 2.056540 2.063415 2.064476 2.076464 2.083486 2.088350 2 .110485 2.124397 2.133463 2.160396 2 .161332 2.179551 2 .181503 2 .190487 2.193480 2.218492 2.222459 2.251464 2.253493 2.259418 2.3495 1 9 2 . 3 1 2453 2.389532 2.460444 2.489491 2.496466 2.512445 2.515556 2.558455 2.584463 2.649487 2.710528 2.796512 2.972339 3 ,012293 3.294424 3.761
0.978 31 .9%0.795 39.3%0.878 33.5%0.869 35.9%1 . 1 5 2 3 1 . 3 %1.039 33.0o/o0.781 34.1Vo0.825 31 .5%1.225 31.1Vo0.781 32.6Vo0.751 34.8%1.001 29.31o0.974 36.70101 . 1 1 8 3 3 . 1 %0.828 34.7o/o0.716 32.29o1.073 33.0olo0.627 37.9%0.974 21.87o0.855 29.6%0.996 28.5%0.953 27.4Vo0.763 33 .1%1.455 26.4Vo0.909 29.9Vo1.458 24.3o/o0.862 34.2Vo1.039 27 .1Vo0.838 32.1Vo1.167 26.3Vo1.287 22.91o0.903 31.0%1.191 25 .3Vo1.344 24 .1%0.824 26.OVo0.907 26.1Vo1.742 19.2%1.229 22.5%1.262 17.6!o1.375 23.goh1.508 12.4Vo
Fluoride

Yianouyiannis
there are no statistically significant differences in tooth decay rates betweenpermanent residents of F and NF areas at any age {Figure 2A). If waterfluoridation rvere to have reduced tooth decay as measured by DMFT, toothdecay rates for life-long residents living in fluoridated areas should be lowerthan residents who had not spent their entire lives in these areas. This wasnot found to be the case. Figures 28 and 2C show that among white males
Figure 2A
Tooth decay in residents of fluoridated (F), nonfluoridated (NF), andpart ial ly f luoridated (PF) areas who l ived their entire l i fe in thesame household,
7.00
6.00
DECAYED, 5.00MI$SING,
AND FILLED 4.OOPERMANENT
TEETH 3.OO(DMFT)PER
CHILD 2.00
1.00
0.00
s 6 7 I 9 1 0 1 1 1 2 1 3 1 4 1 5 1 6 1 7
AGE
Figure 28
Tooth decay rates of white males.6
5Decayed,missing, 4and filled
permanent 3teetl
(DMFT) per 2child
1
5 6 7 I 9 1 0 1 ' t 1 2 1 3 1 4 1 5 1 6 1 7
Age
Volume 23, No 2April, 1990
Todr r
5Decayed,missing, 4and filled
permanent 3teeth
(DMFD Wr 2child
1
and white females (vhich tthere is no significant dffiany age group.
In contrast, notably br
Tooth decay in flucadfluoridated (NF) arec D
2.n
2.00
DECAYEDAND FTLLED 1.50DECIDUOUS
IEF'jL,ffi 1.oo
0.00
LL5 C
0.50
5 6

Water Fluoridation and Tooth Decay
Figure 2C
Tooth decay rates of white females'
6
5Decayed,missing, 4and filled
perm€rnent 3teeth
(DMFI) Wt 2child
1
0
Age
and white females (which make up about TOVo of all the children studied),there is no silnificant difference in DMFT rates in the F and NF areas at
any age group.
In contrast, notably lower tooth decay rates were observed in the deci-
Figure 3
Tooth decay in f luoridated (F), Part ial ly f luoridated (PF), and non-fluoridated (NF) areas: Deciduous Teeth.
2.50
2.00
1.50
1.00
0.50
0.005 6 7 8 9 1 0 1 1 1 2 1 3 1 4 1 5 1 6 1 7
AGE
Fluoride
6 l
DECAYEDAND FILLEDDECIDUOUSTEETH (dft)PER CHILD
5 6 7 I 9 1 0 1 1 1 2 1 3 1 4 1 5 1 6 1 7

62 Yianouyiannis
duous teeth of young children living in F areas. The 5-, 6-, and 7-year-oldsin the F group have dft rates 22o/o, 9o/o and 60lo lower than those of the NFgroup, rspectively (Figure 3). Although the average-age-adjusted dft ratesfor F, NF, and PF groups were not significantly different statistically, theywere higher for the NF groups (0.96 t0.25) for the PF Groups (0.93 +0'24),which in turn is sl ightly higher than the F group (0.89 t0.19).
To focus in on dft rates among children 5-8, the eight areas which com-menced water fluoridation between 1970 and 1978 were removed from thePF group and added to the F group. The 5-, 6-, and 7-year-olds in the newF (F*) group have dft rates 24o/o, l0o/o, and l0o/o lower than those of theNF group, respectively, and the dft rate of S-year-olds in the F* group issignificantly lower (p . 0.05) than that of the NF group.
Moreover among 5-, 6-, and 7-year-old life-long residents in the F* group,dft rates were 42o/o, l8o/o and I lolo lower than those of the NF group,respectively, and the dft rate of S-year-olds in the F* group was significantlylower (p . 0.002) than that of the NF group (Table 3). I f water f luoridationwere to have reduced tooth decay as measured by dft among 5-year-olds,tooth decay rates for l i fe- long 5-year-old residents l iving in f luoridated areasshould have been lower than those of residents who had not spent their entirel ives in these areas. This was found to be the case. From Table 3, i t canalso be seen that this large and significant reduction disappears after a coupleof years.
Fluoride may have caused a reduction in dft by delaying deciduous tootheruption. This is consistent with the fact that the dft rate in the F and F*groups reaches a maximum later than in the NF group. Fluoride-induced delaysin tooth eruption have been reviewed elsewhere (12,13) with contradictoryconclusions, but more recent studies examining S-year-olds have indicateddelayed eruption that could account for such a difference in tooth decayra tes (14) .
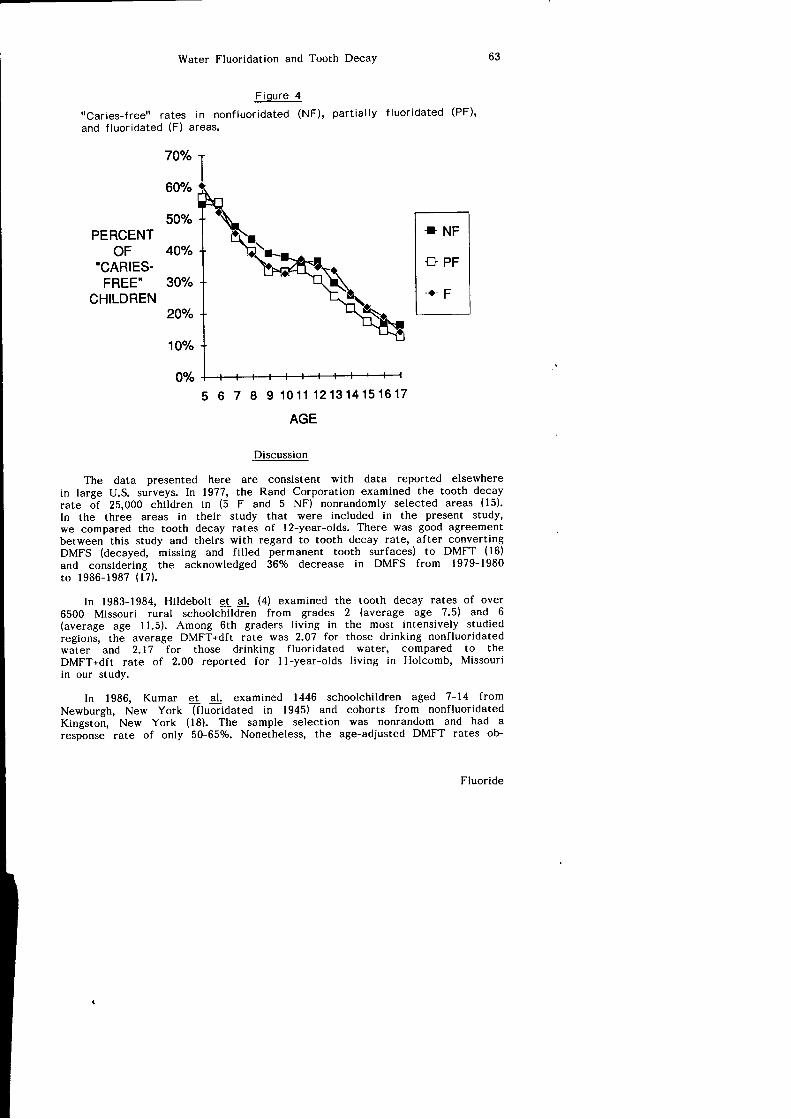
The percentage of decay-free children in F, PF, and NF areas is 34.5olo,31.9olo, and 35.1olo respectively. There is no stat ist icaly signif icant dif ferencebetween the average rtcaries-freerr rates for the F and NF groups at any age(Figure 4).
Table 3
Percentage change in dft rates in al l residents and l i fe- long residents ofF and F* areas in comoarison to NF areas.
Total Life-long
Age (NF-F)/NF (Nr-r*;751P (NF-F)/NF (NF-F*)/NF
Water Fl
rrCaries-freett rates in noand f luoridated (F) areas.
70o/o I
22%
9%
6%
-4%
10%' t%
24%(p . 0.05)
10%
36%(p . o.o2)
14%
5%
-5%
4z%o(p . 0.002)
l 8 %
1 t %
1 %
6o0/o
50"/"PERCENT
oF 40%"CARIES-
FREE' 30o/"CHILDREN
20o/o
10o/o
0o/o
The data presented herein large U.S. surveys. In 1977,rate of 25,000 chi ldren in (5In the three areas in theirwe compared the tooth deca!between this study and theirsDMFS (decayed, missing andand considering the acknoyleto 1986-1987 (17) .
In 1983-1984, Hi ldebolt et65OO Missouri rural schoolcF(average age I1.5). Among 6tregions, the average DMFT.dfrwater and 2.17 for thoseDMFT+dft rate of 2.00 reporrin our study.
In 1986, Kumar er al.Newburgh, New York (f lu&rd,Kingston, New York (16). Thresponse rate of only 50-65$.
6
I
8
Volume 23, No. 2Apri l , 1990
Water Fluoridation and Tooth Decay
F igure 4
"caries-free" rates in nonfluoridated (NF), part ial ly f luoridated (PF)'
and f luoridated (F) areas.
60Yo
50%PERCENT
OF"CARIES.
FREE"CHILDREN
4O"/"
30To
20T"
10To
0o/o
5 6 7 I 9 1 0 1 1 1 2 1 3 1 4 1 5 1 6 1 7
AGE
Discussion
The data presented here are consistent with data reported elsewherein large U.S. surveys. In 1977, the Rand Corporation examined the tooth decayrate of 25,000 chi ldren in (5 F and 5 NF) nonrandomly selected areas (15).
In the three areas in their study that were included in the present study,we compared the tooth decay rates of l2-year-olds. There was good agreementbetween this study and theirs with regard to tooth decay rate, after convertingDMFS (decayed, missing and filled permanent tooth surfaces) to DMFT (16)
and considering the acknowledged 367o decrease in DMFS from 1979-1980to 1986-1987 (17) .
In 1983-1984, Hi ldebolt et al. (4) examined the tooth decay rates of over6500 Missouri rural schoolchildren from grades 2 (average age 7'5) and 6(average age l l .5). Among 6th graders l iving in the most intensively studiedregioni, the average DMFT+dft rate was 2.07 for those drinking nonfluoridatedwater and 2.17 for those drinking f luoridated water, compared to theDMFT+dft rate of 2.00 reported for l l -year-olds l iving in Holcomb, Missouriin our study.
In 1986, Kumar et al. examined 1446 schoolchi ldren aged 7-14 fromNewburgh, New York (f luoridated in 1945) and cohorts from nonfluoridatedKingston, New York (18). The sample selection was nonrandom and had aresponse rate of only 50-650/o. Nonetheless, the age-adjusted DMFT rates ob-
Fluoride
63
70o/"

64 Yianouyiannis
served (1.5 for fluoridated Newburgh and 2.0 for nonfluoridated Kingston)were in l ine with the corresponding values obtained in this study for commun-it ies in the area (1.5 for nonfluoridated New Paltz, New york and 1.7 forfluoridated New York City).
Conclusions
Does water fluoridation reduce tooth decay? il This study and other recentstudies (3-8) show rhat there is currently no significant difference in toorhdecay rates in F and NF areas and that decreases in tooth decay rates overthe last 25 years have been comparable regardless of f luoridation status;i f this is true, there was no signif icant dif ference in the tooth decay ratesbetween rhese areas 25 years ago. i i l From lgz0 ro rhe present, total i luorideintake studies indicate an average intake of l-2 mg per day in nonfluoridatedareas and 3-5 mg per day in f luoridated areas (19,20); thus, i t is dif f icultto claim that the reason tooth decay dif ferentials between f luoridated andnonfluoridated areas have disappeared is because the fluoride intakes in theseareas are now similar. Furthermore, the substantial ly higher incidence ofdental f luorosis in f luoridated areas confirms that residenls in these areasare consuming substantial ly -higher levels of f luoride than those l iving in non-f luoridated areas (21-23). i i i l Dramatic reductions in tooth decay have occurredin developing countr ies where there is no water f luoridation and there isl i t t le reason to suspect that there would be elevated levels of f luoride inthe food chain (7,9,24.25). iv] In addit ion to recent studies, a number of earlystudies have also shown no signif icant reduction in tooth decay as a resultof water f luoridation (7,26-281. vl serious questions have been raised regardingthe rel iabi l i ty of earl ier studies claiming that f luoridation causes a reductionin tooth decay (29).
Acknowledgements
- I thank Kimberly Close-Hitt le, Jerry putnam, Margot yiamouyiannis, andopal Kuhn for their help in the calculat ion and veri f icat ion of summary dataas well as Ji l l Pit ts and chris Hiatt for their l ightning fast speed in enteringdata into our computer. without the generousity of Dr. Leo Roy, Dr. ReubenBenner, Dr. H. Charles Kaplan, Dr. Gerard Judd, Richard Baimakian, JohnC. Justice, Len Greenall, Mr. and Mrs. Andrew yimoyines, Wini Silko, AIMInternational, Inc., and other patrons of the center for Health Action andthe safe water Foundation, the preparation and publication of this art iclewould not have been possible. Finally, I thank Ray Fahey for correcting anerror we had made in assigning the fluoridation status of E. Orange, NJ.
Addendum
Recently Brunelle (30), using the same database that we used, reported260/o fewer dfs (decayed and filled deciduous tooth surfaces) in children whohad always resided in F communities than those who never lived in F commun-it ies. This f inding agrees reasonably well with the data outl ined in our Table3, which shows a srat ist ical ly signif icantly lower dft rate in l i fe- long S-year-oldresidents of fluoridated areas. However, by omission of age-specifi,c data,the Brunelle study covers up the fact that this difference in tooth decayis _no longer significant in 6-year-olds and disappears entirely among g-year-olds.
Volume 23, No. 2Apri l , 1990
Water f
Another recent study b1same database that we useqThis study has a number ol i t t le or no value.
l . I t contains extremely serwe found two values thithe DMFS figure for Iifrbe about 3, not 1.46 aS-year-olds who have carfrom the table (100%-97.he admitted that only lg= lolo, but refused to mak
2. I t fai ls to report the torareas surveyed. This covthe tooth decay rates ofThe Brunelle/Carlos studvthey produce misleadingthat Arizona and New Vin fact, not a single area
3. I t fai ls to control for gindiscriminantly and disprof the country into 2 gror:
4. I t fai ls to do the stat iststandard deviat ion and sthe values found for Fcalculations show that evrdoes not ref lect a stat isrNF groups.
5. I t fai ls to report the d:who were not l i fe-t ime tgroup). If fluoridation retgroup should have been rthat of the NF group. Ohad a DMFS rate higherthe F or NF groups.
6. It fails ro reporr the drin F and NF areas. Ourdone by Brunelle and Crbetter (although not signrfr
Brunelle and Carlos. as rcome under attack for pres€nments which promoted the f lpoor quality of their researchan isolated case.

Water Fluoridation and Tooth Decay
Another recent studY bY Brunelle and Carlos (3!), which also uses thein the F areas.
the study of
65
same database that we used, reports a l7,7Vo lower DMFS rate
This study has a number of major deficiencies which render
l i t t le or no value.
,
l .
3. It fails to control for geographical differences in tooth decay rates by
indiscriminanrly and dispropbrt ionately bunching chi ldren from al l parts
of the country into 2 groups' F and NF.
4, I t fai ls to do the stat ist ical analysis (or even provide the data, i .e. thenecessary to determine whether
It contains extremely serious errors. For example, by a curso-ry inspection'
w e f o u n d t w o v a l u e s t h a t a r e o f f b y l 0 0 o / o o r m o r e . I n t h e i r T a b l e 9 ,the DMFS figure for life-long F exposure residents of Region VII should
be about g, "not
1.46 as rep'-orted. From their Table 3, the percent of
S-year-olds who have caries is l.0olo, not the 2.7o/o that can be calculated
iro,n rt" table (100o/o-9?.3olo). When I pointed out this error to Dr. Carlos,
he admitted that only 19 out of the 1851 5-year-olds had caries: 19/1851= 1olo, but refused to make the correction (32)'
It fails to report the tooth decay rates for each of the E4 geographical
areas survey"d. thir covers up ihe fact that there is no difference in
the tooth decay rates of the fiuoridated and nonfluoridated areas surveyed'
The Brunelle/Carlos study even fails to list the areas studied' As a result'
they produce misleading illustrations; for example, their Figure 3 implies
thai Arizona and New Mexico have the lowest tooth decay rates, when,
in fact, not a single area was surveyed in either of the two states'
5.
b .
I t fai ls to report the data for the approximately 23,000 schoolchi ldren
who were not life-time residents of either the F or NF areas (the PF
group). If fluoridation reduced tooth decay' the DMFS rate of the PF
lroui' strouta have been greater than that of the F group and less than
ihat 'of the NF group. Our data indicate that the PF group would have
traa a OtvtRS ratL higher (although not significantly higher) than either
the F or NF grouPs'
It fails to rePort the data for the percentages of decay-free children
in F and NF areas. our data indicate that had these calculations been
Jone by Brunelle and Carlos, the results may have actug]lv indicated
better (although not significantly better) dental health in the NF areas.
Brunelle and carlos, as well as their employer, the NIDR, have recently
come under attack for presenting erroneous data and desi€ning poor experi-
ments which promored ihe fluoride mouthrinse program (33). The apparent
poor qual i ty oi their research regarding the 1986-1987 survey (30,31) is not
an isolated case.
standard deviat ion and sample number)the values found for F and NF areascalculat ions show that even i f their datadoes not ref lect a stat ist ical ly signif icantNF groups.
are signif icantly dif ferent. Ourwere accurate, the 17.7olo figure
difference between the F and
Fluoride
b b Yianouyiannis
References and Notes
Green, J.C., Louie, R. and Wycoff, S.J.: preventive Dentistry I . DentalCaries. J. Amer. Med. Assn., 262:3456-3463. 1989.Szpunar, S.M. and Burt, B.A.: Dental Caries, Fluorosis and Fluoride Exoo.sure in Michigan Schoolchildren. J. Dent. Res., 67:802, 1988.colquhoun, J.: Inf luence of social class and Fluoridation on chi ld DentalHealth. Community Dent. Oral Epidemiol., l3:37-41, 1985.Colquhoun, J.: Chi ld Dental Health Differences in New Zealand. CommunitvHealth Studies, l l :85-90, 1987.Gray, A.S.: Fluoridation: Time for a New Baseline? J. Canadian Dent.Assoc., 53:763-765, 1987.Hildebolt, C.F., Elvin-Lewis, M., Molnar, S., McKee, J.K., perkins, M.D.and Young, K.L.: Caries Prevalences Among Geochemical Regions ofMissouri. Amer. J. Physical Anthropol., 78:79-92, lgE9.Diesendorf, M.: The Mystery of Declining Tooth Decay. Nature, j22:l21-1 2 9 , 1 9 8 6 .Johnston, D.W., Grainger, R.M. and Ryan, R.K.: The Decl ine of Dentalcaries in ontario school chi ldren. J. canadian Dent. Assoc., s2:4l l-417.r 986.Luoma, A-R. and Ronnberg, K.: Twelve-Year Fol low-up of Caries preval-ence and Incidence in Children and Young Adults in Espoo, Finland.Community Dent. Oral Epidemiol., 15:29-32, 1987.Hill, A.B.: Medical Sratistics. Hodder and Stoughton, London, 1g77, p.183. while rhe numerous age-specif ic comparisons of the dental heal ihof children at different ages provides the best evidence, it is occasionallydesirable to have a summary rate to enable an overal l comparison ofdif ferent populat ions. For this purpose, we have used the age-standardizedor age-adjusted rates, in order to avoid giving disproportionate weightingto larger numbers of children from one particular age-group that wouldtend to distort the summary figure. In using these rates, a standard popu-lat ion must be chosen. The one most commonly used is the hypotheticalpopulat ion with equal populat ions at each age group, which merely resultsfrom taking an ari thmetic mean of the age-specif ic tooth decay ratesmeasured. In the above reference, Austin Bradford Hill addresses thismethod in a discussion of the handling of mortal i ty rates under a secHontitled rrThe Equivalent Average Death-Rate.tt Analogously, equal weightswere given to each of the 84 geographical areas to prevent a distortionwhich might be induced by the variat ion of the area sample sizes, sincecertain geographical areas have characteristically higher (or lower) toothdecay rates than others.
I l . wi lcoxon, F., Katt i , s.K. and wilcox, R.A.: cr i t ical Values and probabil i tyLevels for the wilcoxon Rank sum Test and the wilcoxon Signed RantTest. selected rables in Mathematical statistics, Markham publishingCo., Chicago, l :197, 201, 1970.
l .
2.
3.
5.
b.
7.
8.
9.
10.
Water
Demonstration Prograo.cA, 1962.
16. Jarvinen, S.: Epidemioof DMFS to DMFT. C-ot
17. Johnson, S. HHS l{ewsNational Institutes of Hr
18. Kumar, J.V., Green, E lFluorosis and Dental CAmer. J. Pub. Healt[ 7
19. Rose, D. and Marier, J.National Research Coun<
20. Featherstone, J.D.B. arNew York State RcrRochester, NY, lgEE.
21. Segreto, A.S., Coll ins,Study of Mott led EnanI 984.
22. Leveret, D.: Prevalencedated Communit ies - I4 6 : 1 8 4 - 1 8 7 , 1 9 8 6 .
23. Colquhoun, J.: Disf igunFluoride, 17:234-242, l9t
24. Poulsen, S., Amaratungrlogical Pattern of Denrl0-Year Period. Commun
25, Backman, B., Crossner,8-Year-Old Swedish ChiOral Epidemiol. , l0: l7E-l
26. Scrivener, C.: UnfavorabFluoridation of City W:3 0 : 4 6 5 , 1 9 5 1 .
27, Calagan, D.J.: Climate :4 7 : 1 5 9 - 1 7 0 , 1 9 5 3 .
28. Schroeder, P.: Dental HClinics. J. Dent. Res., 5l
29. Yiamouyiannis, J.: FlrxDelaware, Ohio, 19E6, pp
R
30. Brunelle, J.A.: Caries :rJ. Dent. Res, 69(Special
31. Brunelle, J.A. and CarkChildren and the EffectIssue) :723-728,1990.
32. Carlos, J.P.: Personal co33. Disney, J.A., Bohannarl
in Contesting the ConvrPrograms in the US,A. Q
t2.
13.
14.
1 5 .
Waldbott, G.L., Burgstahler, A.W. and McKinney, H.L.: Fluoridation, theGreat Dilemma. Coronado Press, Lawrence, Kansas, lg7E, 423 pp.El-Badrawy, H.E.: Dental Development in Optimal and Suboptimal FluorideCommunities. J. Canadian Dent. Assoc., 50:761-764, 1g84.Krylov, S.S. and Pemrolyd, K.: Deciduous Tooth Eruption and Fluorosisin the Case of Increased Fluorine Content in the Drinking Water.Stomatologiia (Mosk), 6l:75-77, 1982.Bell, R.M., Klein, S.P., Bohannan, H.M., Graves, R.C. and Disney, J.A.:Results of Baseline Dental Exams in the National preventive rientistry
Volume 23, No. 2Apri l , 1990
i{,il

Water Fluoridation and Tooth Decay
1984.Leveret, D.: Prevalence of Dental Fluorosis in Fluoridated and Nonfluori-dated Communities - A Preliminary Investigation. J. Pub. Health Dent.'46 :184-187, 1986.Colquhoun, J.: Disfiguring Dental Fluorosis in Auckland, New Zealand.Ffuoride, 17t234-242, 1984.Poulsen, S., AmaratunSe, A. and Risager, J.: Changes in the Epidemio-logical Pattern of Dental Caries in a Danish Rural Community over al0-Year Period. Community Dent. Oral Epidemiol., 10:345-351' 1982.Backman, 8., Crossner, C-G. and Holm, A-K.: Reduction of Caries inE-Year-Old Swedish Children between 1967 and 1979. Community Dent.Oral Epidemiol. , l0:178-181, 1983.
26. Scrivener, C.: Unfavorable Report from Kansas Community Using ArtificalFluoridation of City Water Supply for Three-Year Period. J. Dent. Res.'3 0 : 4 6 5 . 1 9 5 1 .Galagan, D.J.: Climate and Controlled Fluoridation. J. Amer. Dent. Assoc.,4 7 : 1 5 9 - 1 7 0 , 1 9 5 3 .Schroeder, P.: Dental Health in Children in Rural Regions without SchoolClinics. J. Dent. Res., S0(Supplement Part l) :1231' 1971.Yiamouyiannis, J.: Fluoride, the Aging Factor. Health Action Press,Delaware, Ohio, 1986, pp. 94-110.
References for Addendum
Brunelle, J.A.: Caries Attack in the Primary Dentition of U.S. Children.
J. Dent. Res, 69(Special Issue):180 [Abstr. No. 5751, 1990.brunelle, J.A. and Carlos, J.P.: Recent Trends in Dental Caries in U.S.Children and the Effect of Water Fluoridation. J. Dent. Res., 69(SpecialIssue):723-728, 1 990.Carlos, J.P.: Personal communication, 1989.Disney, J.A., Bohannan, H.M., Klein, S.P. and Bell, R.M.: A Case Studyin contesting the conventional wisdom: school-Based Fluoride MouthrinsePrograms in the USA. Community Dent. Oral Epidemiol., 18:46-56' 1990.
**********
Fluoride
67
Demonstration Program. R-2862-RWJ. Rand corporation, santa Monica,
cA, 1982.Jarvinen, s.: Epidemiologic characteristics of Dental caries: Relation
of OUFS to DMFT. Community Dent. Oral Epidemiol., ll:363-366, 1983'
Johnson, s. HHS News (U.S. Department of Health and Human Services:
National Inst i tutes of Health) June 21, 1988.Kumar, J.V., Green, E.L., Wallace, W. and Carnahan, T.: Trends in Dental
Fluoroiii and Dental Caries Prevalences in Newburgh and Kingston, NY.
Amer. J. Pub. Health, 79:565-569, 1989.Rose, D. and Marier, J.R.: Environmental Ftuoride, 1977. NRCC No' 16081'
Natlonal Research Council of Canada, Otgawa, Ontario, 1977' pp' 75-83'
Featherstone, J.D.B. and Shields, C.P.: A Study of Fluoride Intake in
New York 'state
Residents. 0114uc1288-1, Eastman Dental center,
Rochester, NY, 1988.21. Segreto, A.S., ' Col l ins, E.M., Camann, D. and Smith, C'T': A Current
Stridy of Moitled Enamel in Texas. J. Amer. Dent. Assoc., 108:56-59,
16.
17.
18.
19.
20.
22.
23.
24.
25.
27.
28.
t q
30.
3 1 .
32.33.