water for the lockyer: strategic business case
TRANSCRIPT
Water for the Lockyer
N245
PREPARED FOR THE DEPARTMENT OF NATURAL RESOURCES, MINES AND ENERGY
27 AUGUST 2019
STRATEGIC BUSINESS CASE
FINAL REPORT

1 Not Government Policy
Water for the Lockyer
Project No: IH12785
Document Title: Strategic Business Case
Document No.: 3
Revision: B
Date: 27 August 2019
Client Name: Department of Natural Resources, Mines and Energy
Client Contact: Dr Wai-Tong Wong
Project Manager: Matt Bradbury
Author: Matt Bradbury
Jacobs Australia Pty Limited
32 Cordelia Street
PO Box 3848
South Brisbane QLD 4101 Australia
T +61 7 3026 7100
F +61 7 3026 7300
www.jacobs.com
© Copyright 2019 Jacobs Australia Pty Limited.
Limitation: This document has been prepared on behalf of, and for the exclusive use of Jacobs’ client, and is subject to, and issued in
accordance with, the provisions of the contract between Jacobs and the client. Jacobs accepts no liability or responsibility whatsoever for, or in
respect of, any use of, or reliance upon, this document by any third party.
Document history and status
Revision Date Description By Review Approved
1A 6 May 2019 Response to DNRME and Building
Queensland comments
Matt
Bradbury
Tom
Vanderbyl
Matt Bradbury
1B 26 May
2019
Draft Report Matt
Bradbury
Tom
Vanderbyl
Matt Bradbury
1B 3 June
2019
Draft Report to PSC Matt
Bradbury
Tom
Vanderbyl
Matt Bradbury
2A 17 June
2019
Draft Report to incorporate PSC
comments
Matt
Bradbury
Tom
Vanderbyl
Matt Bradbury
3A 30 July
2019
Draft report to incorporate PWG and
PSC comments
Matt
Bradbury
Tom
Vanderbyl
Matt Bradbury
3B 27 August
2019
Final Report Matt
Bradbury
Tom
Vanderbyl
Approved by PSC on 27
Aug 2019

2 Not Government Policy
Contents
Acronyms and other abbreviations ............................................................................................. 4
Executive summary ...................................................................................................................... 5
1. Introduction ..................................................................................................................... 11
1.1 Background ....................................................................................................................... 11
1.2 Strategic alignment ........................................................................................................... 13
2. Previous studies ............................................................................................................. 15
2.1 Pre-feasibility study for the Lockyer Valley Council .......................................................... 15
2.2 NuWater Project Feasibility Study .................................................................................... 17
2.3 Queensland Urban Utilities Study (2012) ......................................................................... 18
2.4 Identified gaps ................................................................................................................... 18
3. Governance ..................................................................................................................... 20
3.1 Proposal owner ................................................................................................................. 20
3.2 Project Steering Committee .............................................................................................. 20
3.3 Project Working Group ...................................................................................................... 21
4. Methodology .................................................................................................................... 24
4.1 Risk approach ................................................................................................................... 24
4.2 Stakeholder engagement .................................................................................................. 24
4.3 Service need assessment ................................................................................................. 24
4.4 Options identification and assessment ............................................................................. 25
5. Service need .................................................................................................................... 27
5.1 Current state ..................................................................................................................... 27
5.2 Current state of demographics ......................................................................................... 28
5.3 Current state of agriculture ............................................................................................... 30
5.4 Summary of the current state ........................................................................................... 37
5.5 Documenting the service need ......................................................................................... 38
5.6 Potential additional demand for water .............................................................................. 39
5.7 Policy coordination ............................................................................................................ 44
5.8 Summary of the service need ........................................................................................... 47
6. Lockyer Valley economic opportunity assessment .................................................... 49
6.1 Key findings ...................................................................................................................... 49
6.2 Export opportunities .......................................................................................................... 50
7. Stakeholders ................................................................................................................... 53
7.1 Identifying stakeholders .................................................................................................... 53
7.2 Engagement mechanism .................................................................................................. 53
7.3 Consultation risks .............................................................................................................. 54
8. Benefits sought ............................................................................................................... 55
8.1 Benefit statements ............................................................................................................ 55
8.2 Relative importance of benefits ........................................................................................ 57
9. Strategic responses ........................................................................................................ 58
9.1 Investment logic mapping workshops ............................................................................... 58
9.2 Conclusion ........................................................................................................................ 59

3 Not Government Policy
10. Potential initiatives ......................................................................................................... 60
10.1 Initiatives that were identified ............................................................................................ 60
10.2 Alignment to the State Infrastructure Plan Priority Model ................................................. 62
11. Options generation and assessment ............................................................................ 64
11.1 Approach ........................................................................................................................... 64
11.2 Option longlist ................................................................................................................... 64
12. High-level consideration / Options filter ....................................................................... 77
12.1 Capital costs ..................................................................................................................... 78
12.2 Additional water (annual maximum consumption) ............................................................ 79
12.3 Average reliability .............................................................................................................. 80
12.4 Stakeholder support .......................................................................................................... 81
12.5 Technical feasibility ........................................................................................................... 82
12.6 Strategic considerations and state agencies’ support including competing interests ...... 84
12.7 Levelised costs and capacity to pay ................................................................................. 84
12.8 Economic net present value.............................................................................................. 85
12.9 Financial net present value ............................................................................................... 86
12.10 Summary of longlist assessment ...................................................................................... 87
12.11 Sensitivity analysis ............................................................................................................ 90
13. Option/s for further development .................................................................................. 92
13.1 Program of other new complementary options and Existing Options (Base Case).......... 92
13.2 Existing options ................................................................................................................. 94
13.3 Shortlisting ........................................................................................................................ 96
13.4 Further analysis of shortlisted infrastructure options ........................................................ 99
13.5 Findings of the analysis of shortlisted options ................................................................ 105
14. Matters for the Detailed Business Case to consider ................................................. 106
15. Conclusions .................................................................................................................. 107
16. Assurance ...................................................................................................................... 109
Appendix A. Calculation of economic benefits
Appendix B. Benefits register
Appendix C. Investment logic map
Appendix D. Risk Register
Appendix E. Stakeholder engagement plan
Appendix F. Full Long list
Appendix G. The water planning process
Appendix H. Letter from Seqwater
Appendix I. Letter from Government
Appendix J. Letter from the Lockyer Valley and Somerset Water Collaborative

4 Not Government Policy
Acronyms and other abbreviations
ASQ Agri-Science Queensland
BCDF Business Case Development Framework
BCR benefit–cost ratio
BQ Building Queensland
DAF Department of Agriculture and Fisheries (Queensland Government)
DES Department of Environment and Science (Queensland Government)
DESBT Department of Employment, Small Business and Training (Queensland
government)
DNRME Department of Natural Resources, Mines and Energy (Queensland
Government)
DPC Department of Premier and Cabinet (Queensland Government)
DSDMIP Department of State Development, Manufacturing, Infrastructure and Planning
(Queensland Government)
ha hectare
KPI key performance indicator
ML megalitre
NPV net present value
PRW purified recycled water
PSC Project Steering Committee
PV present value
PWG Project Working Group
QAAFI Queensland Alliance for Agriculture and Food Innovation
QTC Queensland Treasury Corporation
QUU Queensland Urban Utilities
SBC strategic business case
TIQ Trade Investment Queensland
WCRWS Western Corridor Recycled Water Scheme

5 Not Government Policy
Executive summary
This report presents the ‘Water for the Lockyer’ strategic business case (SBC)” under the Building
Queensland Business Case Development Framework. It provides a strategic-level assessment of the
opportunities, challenges, benefits and options of additional water supply for the Lockyer Valley.
Background
The Lockyer Valley in South East Queensland, 90 km west of Brisbane, is a highly productive
agricultural area. It is considered as one of the top 10 most fertile farming areas in the world and
grows the most diverse commercial range of fruit and vegetables in Australia. The study area consists
of the Lockyer Valley and Somerset regional council areas.
The total agricultural production is valued at over $469 million per year (2016–17), consisting almost
mainly of vegetables and livestock production. The Lockyer Valley is one of the most important food
bowl areas in Australia, supplying most of Australia’s vegetables during the winter months and
accounting for 28 per cent of Queensland’s total horticultural production. Significant industry
opportunities continue to emerge in the region, including specialist food processing, food packaging,
transport and storage and new agritourism developments.
The irrigation water that underpins production comes from a variety of sources, with groundwater
currently being the major source. Seqwater operates two irrigation schemes in the valley, the Central
Lockyer water supply scheme and the Lower Lockyer water supply scheme, while some producers
rely on farm storages and unsupplemented creeks for water.
Water, rather than land availability, is regarded as the limiting factor in production within the Lockyer
Valley. Groundwater and surface water sources are fully allocated. Existing water availability is
unreliable and is impacting on the productive capacity of the area. In the absence of additional water,
a significant expansion in production cannot occur. Yet, increased production could provide necessary
economic impetus, which has a higher unemployment rate than the rest of Queensland and a higher
level of social disadvantage.
This business case builds on the extensive reports and investigations that have been carried out over
the past 20 years in relation to additional water supply to irrigators in the area. It was developed in
collaboration and under the guidance of a Project Steering Committee, whose members are
government representatives, and a Project Working Group, comprising community and industry
stakeholders and government agencies. Extensive stakeholder consultation has been undertaken as
part of this investigation.
Previous studies
In 2018, Cardno carried out a pre-feasibility study, which estimated a potential additional demand for
water of 15,000 to 45,000 ML per year, based on bringing currently unused high-quality land into
production in the valley. Options that were identified for providing additional water were 1) water from
Lake Wivenhoe; 2) recycled water from local wastewater treatment plants; 3) recycled water from the
Western Corridor Recycled Water Scheme (WCRWS); and 4) improved on-farm efficiency.
The NuWater Project feasibility study by GHD in 2018 investigated a project to use recycled
wastewater from the greater Brisbane area to reduce nutrient discharge to Moreton Bay and to grow
agricultural production in the Lockyer Valley and the Darling Downs. GHD concluded that the project
was not commercially viable and that the long-term costs outweighed the benefits. These poor
economic and financial results were driven by the cost of pumping water over the Toowoomba Range
to the Darling Downs, which is substantially further and higher than the Lockyer. A smaller-scale
option of supplying just the Lockyer Valley was not assessed in detail.

6 Not Government Policy
Strategic business case
In this SBC, the problems and opportunities are identified as follows:
1) Availability of sustainable and reliable water supply limits opportunities for economic
development and growth.
2) Lack of cross-government (three-tier) policy coordination constrains investment.
3) Leveraging the region’s natural and competitive advantages would support economic growth.
The assessment and confirmation of the service need was informed through the development of a
socio-economic baseline, investigations into the current reliability of supply, previous demand studies,
stakeholder consultation, a land suitability assessment and consideration of market opportunities and
policy objectives relevant to the area. Results confirmed that the lack of a sustainable and reliable
water source was limiting the expansion of regional production, employment opportunities and
broader economic development.
Service need
The service need is represented by an opportunity to significantly grow the economy and
sustainability of the Lockyer region by 2030, with broader flow-on effects for South East Queensland,
by:
– leveraging the region's natural and competitive advantages
– improving water reliability, supply, use and sustainability.
A range of initiatives that would potentially help meet the service need was identified. They included
water trading; better policy, planning and coordination; applied research; improved efficiency and
operation of existing irrigation assets; increased flood harvesting capacity; local and regional
wastewater reuse; and sourcing additional water from the Wivenhoe Dam.
Longlist options
Following the multicriteria analysis of the 39 options, 22 options were not shortlisted, five options were
considered suitable to be included in a program of other complementary options that should be
pursued without a formal business case, and six options were already underway. Of the remaining
options, six were shortlisted for further consideration and analysis.
The five options considered as suitable for a program of other complementary options included
promoting public/private research investment, improve industry and policy coordination, promoting
public / private agribusiness development, implement on-farm initiatives and examine the feasibility of
deep aquifer drilling.
The six options considered to be already underway were supply chain improvement, market
opportunities study, water trading, on-farm irrigation efficiency improvements, investigations into
increasing diversion capacity and local wastewater recycling.
Shortlist options assumptions
The assumptions underpinning the shortlisted options will need to be reviewed in any future
investigations.
One important assumption in this SBC relates to maintaining the trigger levels for the operation of the
WCRWS unless required under the option proposed. However, the Water Security Program for South
East Queensland which contains the triggers for the operation of the WCRWS is reviewed by
Seqwater and the State Government to improve urban water security. Any future investigation will
need to consider the possibility that trigger levels may be changed to meet the needs of an increasing
South East Queensland urban population.

7 Not Government Policy
A second important assumption in this SBC relates to certain costs being recovered in water prices.
The water prices presented in this report are indicative only. They will need to be reviewed in any
further investigation including consideration of prices which are based on full cost recovery principles
(Appendix I). Full recovery principles include an appropriate return on, and of, capital as well as
ongoing operational and maintenance costs, and all comprehensive and complete costs associated
with the water infrastructure. Consideration should also be given to any previous commitments and
guidance from the State on forming a price.
Shortlist options
The six shortlisted options considered for further investigation were based on either the supply of
water to the Lockyer Valley directly from Wivenhoe Dam or from the Western Corridor Recycled
Water Scheme (WCRWS). All of the six shortlisted options will not impact on urban water supply
security (or level of service), flood mitigation outcomes or Seqwater’s dam safety obligations.
The shortlisted options for water from the Wivenhoe Dam were:
• Option 20—water is pumped from Wivenhoe Dam and delivered to the Lockyer
Valley’s existing irrigation dams via a new trunk main, and the existing
distribution network is used to deliver water to producers.
• Option 19—water is pumped from Wivenhoe Dam and delivered to the Lockyer
Valley’s existing irrigation dams via a new trunk main and a new distribution
network, and the existing irrigation dams are used to deliver water to producers.
• Option 23—water is pumped from Wivenhoe Dam and delivered directly to
customers in the Lockyer Valley, bypassing the existing irrigation dams.
A critical expectation from Seqwater, who own and operate Wivenhoe Dam, is that the ‘water from
Wivenhoe Dam’ options would need to ensure that SEQ urban water users be no worse off both in
terms of bulk water charges and water security. The ‘water from the Wivenhoe Dam’ options will
increase the use of recycled water releases from the WCRWS into the dam, in order to have no
impact on urban water security for SEQ. These options will require a consideration of changes to the
trigger levels of the WCRWS in order to supply more water to irrigators and maintain current levels of
urban water security. Along with the costs to supply water from Wivenhoe Dam, irrigators would also
need to pay for the earlier costs of using the WCRWS to ensure that the urban supply charges remain
unaffected.
The WCRWS is currently not supplying water and there are substantial costs to recommission the
scheme for the first time. Accordingly, Seqwater’s current preference is for any supply to Lockyer
Valley irrigators from Wivenhoe Dam to occur only after the WCRWS has been recommissioned for
urban water supply purposes.
The following options for the direct supply of water to the Lockyer Valley from the WCRWS were
examined:
• Option 31—Purified recycled water (PRW) is sourced from the WCRWS and
supplied to producers through existing irrigation dams and a new distribution
network following the recommissioning of the scheme.
• Option 32— PRW is sourced from the WCRWS and supplied to producers
through a new distribution network following the recommissioning of the
scheme.
• Option 24— PRW is sourced from the WCRWS and supplied to producers
through a new distribution network (pre-commissioning of WCRWS).
Under these ‘water to the Lockyer Valley from the WCRWS’ options, irrigators would be required to
pay for each megalitre produced for them. In contrast, the ‘water from the Wivenhoe Dam’ options
would require irrigators to pay for the water delivered from Wivenhoe Dam along with the bring
forward costs of WCRWS which would include incremental capital and operating costs. These bring
forward costs are therefore lower than the costs of the direct WCRWS supply options as the WCRWS

8 Not Government Policy
costs are not incurred the entire time of supply, but rather irrigators only contribute for the period for
which it is brought forward to operate for urban water supply purposes.
All six options would not result in an increase in the water level of Wivenhoe Dam compared to
current arrangements. These options would not impact adversely on flood mitigation outcomes
downstream of Wivenhoe Dam or on Seqwater’s ability to meet its dam safety obligations.
Under all shortlisted options, irrigators would be able to be supplied with water when the WCRWS is
not supplying water for urban purposes. However, when the scheme is needed for urban water use,
irrigators’ supply would be suspended until the scheme is not needed for urban water supply.
Current projections are that by 2050 the WCRWS would be required to supplement drinking water
supplies 20 per cent of the time, which means that irrigators would have access to water from
Wivenhoe Dam 80 per cent of the time. A climate change scenario was examined, which considered
the impact of a drier future climate on irrigators’ access to water. The drier climate change projection
was found to increase the probability of switching on the recycled water scheme to 44 per cent of the
time. Under such a scenario, irrigators might expect to have their access to water from Wivenhoe
Dam reduced to 56 per cent of the time.
The preliminary economic analysis showed a benefit–cost ratio of above 1.0 for two of the water from
Wivenhoe Dam options (options 19 and 23), which means that their benefits outweigh costs (as
shown in the table below). All of the WCRWS options had a benefit–cost ratio of below 1.0. The much
larger operating costs of the WCRWS options resulted in poorer performance in economic outcomes
and cost-reflective prices. For this reason, the water from Wivenhoe Dam options are preferred.
Shortlisted options—summary of SBC analysis
Option Present value
of costs
Present value of
benefits
Economic
net
present
value
Economic
benefit–cost
ratio
Water from Wivenhoe Dam
Option 20—Wivenhoe Dam water / new
trunk main / existing distribution network
$390m $240m –$150m 0.6
Option 19—Wivenhoe Dam water / new
trunk main / new distribution network/
existing irrigation dams
$440m $523m $83m 1.2
Option 23—Wivenhoe Dam water / new
distribution network / no irrigation dams
$440m $513m $73m 1.2
Water from the Western Corridor Recycled Water Scheme (WCRWS)
Option 31—WCRWS purified recycled water
(PRW) / irrigation dams / new distribution
network / post- recommissioning
$919m $608m –$311m 0.7
Option 32—WCRWS PRW / pipe to farm /
post-recommissioning
$919m $580m –$339m 0.6
Option 24—WCRWS PRW / irrigation dams /
new distribution network /pre-commissioning
of WCRWS
$1,051m $608m –$443m 0.6
Note: The table is based on preliminary analysis only. Figures are subject to change after more detailed analysis under the
next stage.

9 Not Government Policy
Risks and limitations
This strategic business case acknowledges the inherent limitations of this stage of analysis and sets
out the uncertainties that need to be resolved in a detailed business case.
The economic analysis undertaken is more than adequate for a strategic business case. However, it
is subject to limitations including the cost of each of the options is currently highly uncertain (+/- 50%)
and the agricultural benefits are based on a desk top study and high-level consultation with irrigators.
The willingness to pay of irrigators is also uncertain.
Accordingly, this strategic business case concludes that a detailed demand assessment and
willingness to pay study of irrigators in the Lockyer Valley should be undertaken as part of any future
detailed business case analysis. Increasing certainty about demand will mean that the detailed
business case will be able to focus on delivering specific volumes of water to identified demand
nodes. If a detailed business case is undertaken, the water from Wivenhoe Dam options should be
assessed and confirmed as the preferred options for further investigation. A detailed business case
would also reduce the uncertainty of the cost estimates.
Seqwater’s current preference is for any supply to Lockyer Valley irrigators from Wivenhoe Dam to
occur only after the WCRWS has been recommissioned for urban water supply purposes. The timing
of this recommissioning is highly uncertain as it depends on rainfall and dam levels. A detailed
business case would need to address this uncertainty and establish appropriate triggers for
construction of a new scheme. Further, any use of the WCRWS (either before or after
recommissioning) would need an adjustment to trigger levels to maintain the same level of urban
water security. Government would need to approve these adjustments.
The environmental and other regulatory risks can likely be managed for the preferred options (water
from Wivenhoe Dam). However, the cumulative impacts of the risks described here may result in no
option been technically feasible, particularly if the WCRWS is not yet recommissioned for urban use.
The combination of all the factors should be assessed in the detailed business case.
Conclusions and recommendations
The Water for the Lockyer SBC (which includes a part of the preliminary business case phase):
1) Finds that, in the context of the service need:
a) the Wivenhoe water options (options 19, 20 and 23) are, as a group, the most
economically and financially feasible infrastructure options.
b) Option 20 has a BCR lower than 1.0; restricts voluntary participation by individual
irrigators in securing additional water as the old and new products would be delivered
by the same distribution system; restricts the ability to deliver water to new customers;
and involves significant inefficiencies associated with delivering the additional water via
an aquifer recharge mechanism.
c) although the WCRWS options (options 24, 31 and 32) are the next most feasible
infrastructure options, they have significantly lower BCRs, of less than 1, and negative
NPVs, which are likely to result in very high annual variable charges.
2) Recommends that the Wivenhoe options (options 19 and 23) be considered as the
preferred option(s) for any future detailed analysis. In developing a Detailed Business Case,
the following needs to be taken into account:
a) matters raised by Seqwater in relation to the recommissioning of WCRWS, cost and
water security (Appendix H)
b) matters and principles raised in DNRME letter on behalf of PSC (Appendix I) in relation
to the availability and reliability of supply for the Lockyer due to population growth in
future, and the following assessment principles for the development of a detailed
business case:

10 Not Government Policy
i. The detailed business case must be developed in accordance with the Building
Queensland Business Case Development Framework.
ii. Economic assessment must occur in accordance with the Building Queensland
Cost Benefit Assessment guidelines with strict adherence to the appropriate
inclusions in costs and benefits.
iii. Pricing of water needs to occur in the first instance based on full cost recovery
principles (including return on, and of, capital as well as all ongoing operational
and maintenance costs).
iv. Demand for water from the additional water supply and security options need to be
assessed specifically in the context of the price at which water would be available.
v. Consideration of an appropriate level of customer commitment (i.e. commensurate
with the level of detail of the assessment) should be incorporated into the detailed
business case process.
vi. SEQ Urban water security cannot be negatively impacted by any of the options for
additional water supply or security.
vii. SEQ urban water users must not be responsible for any increase in costs
associated with any option considered.
c) Note the preferred alignment of the Inland Rail that traverses Lockyer Valley and
consult with the project proponent, the Australian Rail Track Corporation.
3) Recommends a detailed water demand survey and capacity to pay be conducted as part of
any future detailed business case analysis.
4) Recommends the following program of other new complementary options be considered in
parallel, for the detailed business case analysis:
a) Public / private research investment (option 11)
b) Industry / policy coordination review (option 4)
c) Public / private agribusiness development (option 5)
d) On-farm initiatives (option 2)
e) Deep aquifer investigation (option 30).
5) Notes that the base case of the detailed business case will include the following options
that are currently underway:
a) Supply chain improvements (option 1)
b) Market opportunities study (option 3)
c) Water trading (option 6)
d) On-farm irrigation efficiency (option 15)
e) Investigate increasing diversion capacity (option 7)
f) Local recycling (option 12).

11 Not Government Policy
1. Introduction
1.1 Background
The Lockyer Valley is located in South East Queensland (SEQ), about 90 kilometres west of the
Brisbane CBD. The study area comprises both local governments for the region, namely the Lockyer
Valley Regional Council and the Somerset Regional Council to the north (Figure 1.1).
Figure 1.1 : Map of Lockyer Valley—study area

12 Not Government Policy
Water for agriculture is the main demand in the region and primarily supplied from the Upper, Central
and Lower Lockyer groundwater aquifers. Approximately 60 per cent of water is used to grow crops,
30 per cent for irrigated pastures and 10 per cent for livestock drinking water, dairy or piggery
cleaning.1
Additional water is supplied from Seqwater’s Central and Lower Lockyer water supply schemes. The
lack of water supply and water security in the region is regarded by stakeholders as a major constraint
to investment and economic diversification.
1.1.1 Purpose of the strategic business case
This business case provides an assessment of the opportunities, problems and benefits for the
Lockyer Valley at a strategic level and identifies a shortlist of viable options for further investigation. In
addition, a program of non-infrastructure works is developed for further separate investigation and
possible implementation.
1.1.2 Business case development
This business case contains the elements of a strategic business case (SBC) (which is the first
document in the business case suite of the Building Queensland Business Case Development
Framework2 (BCDF) and some of the elements of a BCDF preliminary business case.
For simplicity, the combined business case is referred to in this report as the Water for the Lockyer
strategic business case.
The structure of the chapters in this business case is therefore an amalgamation of the structure for
strategic and preliminary business cases as set out in the Building Queensland BCDF (Figure 1.2).
Figure 1.2: Building Queensland Framework
This document does not indicate government’s policy or funding approval for infrastructure – this work
is only the first stage of business case and is subject to the outcomes of the next stage of a detailed
business case.
1 ABS, Water use on Australian Farms, 2016–17, cat. 4618.0. 2Strategic Business Case Guidance and Template Release 2 December 2016 and Preliminary Business Case Guidance and Template release 2 December 2016, http://buildingqueensland.qld.gov.au/frameworks/.
13 Not Government Policy
1.1.3 When a problem/opportunity was selected for consideration
Water supply in the Lockyer Valley has been subject to investigations since at least 1979, when the
Department of Environment and Resource Management undertook a study into land degradation in
the Lockyer catchment.3 A list of previous investigations is shown in Table 2.2.
1.1.4 Assurance processes
The governance and assurance processes in place for the development of this document are outlined
in Chapter 3. This document has been reviewed by the Project Steering Committee (PSC) and the
Project Working Group (PWG). However, its contents do not form government policy or funding
commitment for construction, nor should it be assumed that it reflects the views of any individuals of
either group.
1.2 Strategic alignment
1.2.1 Policy issues
It is important that major projects align with government policies and priorities, particularly if
government support is needed. Each longlisted option will be assessed in terms of its strategic
alignment. Government policies relevant to the project include:
Commonwealth Government
• National Water Initiative (2004)4
Queensland Government
• Our Future State: Advancing Queensland’s Priorities (2014)5
• Growing for Queensland6
• State Infrastructure Plan Part A (2016)7 and Part B (2019)8
• Queensland Bulk Water Opportunities Statement9 (QBWOS, July 2017)
• Queensland Agricultural Land Audit (May 2013)10
• SEQ Regional Plan 2017
• Water Plan (Moreton) 2007 (Water Plan)11
• Water for Life (2016)12
• Brisbane River Strategic Floodplain Management Plan (2019)13
• Vocational education and training (VET) Investment Plan
• Queensland Climate Transition Strategy14
3 Department of Environment and Resource Management, Land Degradation in the Lockyer Catchment, Division of Land Utilisation,
Technical Bulletin 39, Queensland Government, 1979. 4 COAG, Intergovernmental Agreement on a National Water Initiative, 25 April 2004,
http://www.agriculture.gov.au/SiteCollectionDocuments/water/Intergovernmental-Agreement-on-a-national-water-initiative.pdf. 5 Queensland Government, The Queensland Plan, 2014, https://www.queenslandplan.qld.gov.au/assets/images/qld-plan.pdf. 6 Queensland Government, Growing for Queensland, 2018, https://publications.qld.gov.au/dataset/growing-for-
queensland/resource/67a8d14f-1e2a-43db-9f1f-85d0ed47220d. 7 Department of State Development, Manufacturing, Infrastructure and Planning, State Development Plan, Queensland Government,
March 2016, https://www.dsdmip.qld.gov.au/infrastructure/state-infrastructure-plan.html. 8 https://www.dsdmip.qld.gov.au/resources/plan/sip/sip-part-b-2019.pdf 9 https://www.dews.qld.gov.au/__data/assets/pdf_file/0007/1266883/qld-bulk-water-opportunities-statement.pdf 10 Department of Agriculture and Fisheries, Queensland Agricultural Land Audit: South East Queensland, 2013,
https://www.daf.qld.gov.au/__data/assets/pdf_file/0011/74000/QALA-Ch13-SEQ.pdf. 11 Business Queensland, Moreton water plan area, https://www.business.qld.gov.au/industries/mining-energy-water/water/catchments-
planning/water-plan-areas/moreton. 12 Seqwater, Water for Life: South East Queensland’s Water Security Program 2016–2046, https://www.seqwater.com.au/waterforlife. 13 https://www.qra.qld.gov.au/brcfs 14 https://www.qld.gov.au/__data/assets/pdf_file/0026/67283/qld-climate-transition-strategy.pdf

14 Not Government Policy
• Queensland Climate Adaptation Strategy15
Local government
• Lockyer Economic Development Plan (2018)16
• Somerset Economic Development Plan (2015)17
South East Queensland City Deal (proposed)
City Deals are a mechanism to develop collaborative plans for growth, renewal and reform.18 The
concept was first introduced in 2016 under the Australian Government’s Smart Cities Plan. Each City
Deal represents a long-term commitment that outlines the investments, planning governance and
actions needed to implement them. The Smart Cities Plan wants to promote opportunities for not only
metropolitan cities but also regional cities.
1.2.2 Legal and regulatory consideration
The pre-feasibility report by Cardo in 2018 outlined the regulatory framework (see Appendix E).19
The Water Act 2000 (Water Act) provides the legislative framework for the sustainable planning,
allocation and management of water resources in Queensland (Appendix D). It requires that all
planning, allocation and use of water must advance sustainable management and efficient use of
water. Water plans provide the principal mechanism for achieving the requirements of the Water Act,
setting out detailed strategies and outcomes for water to be shared among water users, including the
environment.
Lockyer Creek is a sub-catchment in the Brisbane River and is managed under a subordinate
legislation—a water plan. The Moreton Water Plan has been in place since March 2007 and was
amended in 2009 and 2013 to address water allocation and management issues in other catchments
in the plan area. The Lockyer scheme is the only remaining water supply scheme in the Moreton plan
area that is still managed under interim arrangements.
The Moreton Water Plan is currently being amended to incorporate the management of water and will
provide a sustainable platform for water entitlements, development of water sharing rules and allow
for water trading. This step is necessary before any additional water supplies could be adequately
accounted for and provided to the Lockyer Valley. The instruments (e.g. resource operations licence
and operations manual) which implement the water plan can be developed to readily integrate the
additional water supplies.
The key aim of the amendment is to finalise management arrangements for the scheme in a way that:
• supports the current economic and employment profile in the Central Lockyer Valley region
• supports the existing agricultural industry and associated jobs
• ensures a more equitable share and management of the water resource across all water
users in the scheme.
15 https://www.qld.gov.au/__data/assets/pdf_file/0017/67301/qld-climate-adaptation-strategy.pdf 16 Stafford Strategy, Lockyer Valley Economic Development Plan 2018–2023, prepared for Lockyer Valley Regional Council, August
2018, https://www.lockyervalley.qld.gov.au/our-region/economic-and-regional-development/Documents/Economic%20and%20Development/Lockyer%20Economic%20Development%20Plan%202018%20-2023.pdf.
17 Somerset Regional Council, Somerset Economic Development Plan 2015 to 2020, http://www.somerset.qld.gov.au/economic-development-plan.
18 Queensland Treasury, City Deals in Queensland, Queensland Government, 2019, https://www.treasury.qld.gov.au/growing-queensland/queensland-city-deals/.
19 Cardno, Pre-feasibility: Water for agriculture productivity and sustainability, prepared for Lockyer Valley Regional Council, April 2018, https://ww-w.lockyervalley.qld.gov.au/our-services/environment-and-pest-management/Documents/360615-REP-03-D%20-%20Pre-feasiblity%20-%20water%20for%20agricultural%20sustainability.pdf.

15 Not Government Policy
2. Previous studies
For more than 20 years, stakeholders have been carrying out feasibility studies to evaluate
infrastructure solutions that would supply additional water to the Lockyer Valley for irrigated
agriculture. Recently the Commonwealth Government, through the National Water Initiative, funded
two pre-feasibility studies to investigate specific options for the region. These studies were carried out
by Cardno, for the Lockyer Valley Regional Council,20 and by GHD, for the Queensland Farmers’
Federation.21
Table 2.2 provides a list of key recent studies and those identified in the Cardno report.
2.1 Pre-feasibility study for the Lockyer Valley Council
The pre-feasibility study for the Lockyer Valley Regional Council by Cardno in 2018 was titled Water
for agriculture productivity and sustainability.
The study found that while demand cannot be accurately assessed, without a demand study and with
reference to the various water products able to be supplied and the likely cost of supply of these
products, the potential magnitude of demand can be estimated. The study estimated there is potential
additional demand of greater than 15,000 to 45,000 ML per year from bringing unused high-quality
land into production. Additional demand may also result from more intensive cropping, switching to
higher water use (and higher value) crops and substitution away from groundwater.
The Cardno report’s main findings were22:
1) The demand for and perceived value of potential water security options
depends on whether volumetric entitlements are in place for groundwater
abstraction or not. This is because groundwater when available is a
substitute to potential water security options. Therefore, the proposed
amendments to the water plan should be resolved as soon as possible to
reduce the uncertainty over water security in the Lockyer Valley.
2) Based on the identified need to secure water supply for existing agriculture
in the Lockyer Valley and the existence of potential supply options
identified in this pre-feasibility study, Cardno recommended that:
a) the service need (demand) across the region be defined in
detail
b) the identified shortlisted water supply options be further
progressed.
c) The above, (A) and (B) be progressed utilising the Business
Queensland Preliminary Business Case and Detailed
Business Case frameworks.
The report further recommended that:
Further investigation needs to address the further technical investigations required for each shortlisted option, and It may be preferable to complete a standalone demand assessment before progressing further with the Business Case so that the service need is clear.
Table 2.1 outlines the options that were recommended by Cardno for further consideration.
20 Cardno, Pre-feasibility: Water for agriculture productivity and sustainability, prepared for Lockyer Valley Regional Council, April 2018,
https://www.lockyervalley.qld.gov.au/our-services/environment-and-pest-management/Documents/360615-REP-03-D%20-%20Pre-feasiblity%20-%20water%20for%20agricultural%20sustainability.pdf.
21 GHD, NuWater Project Feasibility Study, prepared for Queensland Farmers’ Federation, March 2018, https://www.qff.org.au/projects/nuwater/.
22 Cardno, Pre-feasibility: Water for agriculture productivity and sustainability,, 2018, p. viii.

16 Not Government Policy
Table 2.1 : Recomended options for further consideration (Cardno, 2018)
Option Infrastructure Costs
Water from
Lake
Wivenhoe
Transfer pipeline and pump station from Lake Wivenhoe likely to the three major
storages—Lake Atkinson, Lake Clarendon and Bill Gunn Dam. The proposed trunk
network totals approximately 48.3 km, with diameters ranging in size from DN750 to
DN1000. There is potential to use part of the existing Lake Wivenhoe to Cressbrook
Dam pipeline as part of the transfer pipeline.
Distribution pumping and pipelines from the three major storages. Estimates project a
network equal to approximately 150 km of reticulation mains ranging in size from
DN375 to DN100.
Customer metering and telemetry.
Upfront cost of $71
to $108 million
Recycled
water from
local
wastewater
treatment
plants
Local recycled water distribution network which may include storage for low demand
periods
$110 to $1,288 per
ML— both opex and
capex
Recycled
water from
the
Western
Corridor
Recycled
Water
Scheme
Transfer pipeline and pump station from the Lowood Recycled Water Balance Tank to
the three major storages—Lake Atkinson, Lake Clarendon and Bill Gunn Dam. The
proposed trunk network totals approximately 53.8 km, with diameters ranging in size
from DN750 to DN1200. Distribution pumping and pipelines from the three major
storages. Estimates project a network equal to approximately 150 km of reticulation
ranging in size from DN375 to DN100. Customer metering and telemetry.
Alternatively, recycled water may be discharged into local creeks which would
recharge aquifers and the creeks would act as natural carriers. This would
substantially reduce infrastructure requirements
Upfront cost of $71
to $104 million
Improved
on-farm
efficiency
On-farm infrastructure may include:
• Monitoring equipment (e.g. soil moisture)
• Supervision and control equipment for irrigation
• Farm layout remodelling
• More efficient irrigation devices
Varies
Cardno23 also identified a number of previous studies relevant to the investigation as shown in Table
2.2.
Table 2.2 : Previous key studies summary
Year Author Title
1979 The Division of Land Utilisation,
Department of Environment and
Resource Management
Land Degradation in the Lockyer Catchment
1983 Queensland Water Resources
Commission Surface Water Branch
Lower Lockyer Creek System Atkinson Dam Performance
1999 Queensland Government Natural
Resources and Mines
Sustainability of Agricultural Systems using Recycled Water in the Lockyer
Valley and Darling Downs Area
2002 GHD SEQ Recycled Water Project—Infrastructure Costs Study
2002 Halliburton KBR Pty Ltd Lockyer Valley Hydrological Consultancy
2004 GHD Lockyer Valley Water Reliability Study
23 Cardno, Pre-feasibility: Water for agriculture productivity and sustainability, 2018, Appendix B.

17 Not Government Policy
Year Author Title
2005 The Department of Natural
Resources and Mines
Discussion paper—Declaration of the Whole Lockyer Valley as a
Subartesian Area
2007 Lockyer Valley Water Users Forum
INC & Capital Strategies Pty Ltd
Lockyer Valley Recycled Water Distribution Project Grant Application
2009 South East Queensland Healthy
Waterways Partnership
Implications of supply of purified recycled water to the Lockyer and Warrill
Valleys and mid-Brisbane River for groundwater recharge and irrigation
purposes
2012 Queensland Urban Utilities Options for recycled water supply to the Lockyer Valley – Investigation
Report
2012 Tim Ellis and Leif Wolf Impacts of Applying Purified Recycled Water (PRW) in the Lockyer Valley,
Qld: Soil Physical Assessment of PRW Application to Local Soils
2013 Leif Wolf Implications of using Purified Recycled Water as an Adjunct to Groundwater
Resources for Irrigation in the Lockyer Valley
2013 The Stafford Group Regional Food Sector Strategy
2016 Lisa Mary Kelly Further Closing the Integrated Total Water Cycle in the Lockyer Valley: A
Catchment Scale Integrated Water Resource Management Conceptual
Model (PhD Thesis)
2017 WSP Lockyer catchment preliminary socio-economic study
2018 GHD NuWater Project Feasibility Study
2018 Cardno Water for agriculture productivity and sustainability
2.2 NuWater Project Feasibility Study
A feasibility study and preliminary business case for the Queensland Farmers’ Federation was
developed by GHD, titled NuWater Project Feasibility Study (March 2018). This project was seeking
to meet the dual objectives of (1) managing environmental impacts associated with treating South
East Queensland’s wastewater and disposing the effluent to sea; and (2) growing agricultural and
industrial production in the Lockyer Valley and the Darling Downs.
This project included supply to the Lockyer Valley but mainly sought to deliver water to the Darling
Downs. The project was found to have an economic NPV of between –$1.3 billion and –$2.2 billion.
The BCR ranged from 0.23 to 0.33. GHD concluded that24:
the NPVs of all shortlisted options remain significantly negative for all
shortlisted options across all scenarios modelled.
The financial NPV ranged from –$1.6 billion to –$2.5 billion. GHD concluded that25:
The results from the financial and commercial analysis demonstrate that, for
all shortlisted options, the revenues derived from the project will be
insufficient to recover the financial costs to be incurred. The project will
therefore require significant government funding in order to be financially
viable (noting that no additional revenue sources beyond water users have
been identified).
These poor economic and financial results were driven by the cost of pumping water over the
Toowoomba range to the Darling Downs which is substantially further and higher than the Lockyer. A
smaller option of supplying just the Lockyer Valley was not assessed in detail. Table 2.3 summarised
the options that GHD shortlisted.
24 Cardno, Pre-feasibility: Water for agriculture productivity and sustainability, 2018, p vi. 25 Cardno, Pre-feasibility: Water for agriculture productivity and sustainability, 2018, p. vii.

18 Not Government Policy
Table 2.3 : Recomended shortlist (GHD, NuWater, 2018)
Option Infrastructure Present value of
capital costs
PRW WCRWS pipeline + construction of Heathwood PS and upgrade of Gibson Island
AWTP, including pipelines from Redcliffe STP to Sandgate STP and from Sandgate
STP to Luggage Point STP
.
$1.9 billion
Class A+ WCRWS pipeline + construction of Heathwood PS and upgrade of Gibson Island
AWTP
$1.5 billion
Class B/C
(as
produced)
WCRWS pipeline + construction of Heathwood PS $1.4 billion
PRW (LV)
/ Class
B/C (DD
WCRWS pipeline (current capacity) OR Pipeline from Bundamba AWTP to Lowood
Booster PS
$1.6 billion
This study concluded that pumping water over the Toowoomba range was not economically feasible.
It also identified that Lockyer Valley irrigators require a higher quality of water than Darling Downs
irrigators, due to the respective crop mixes.
2.3 Queensland Urban Utilities Study (2012)
The purpose of this study was to investigate a range of options for recycled water supply into the
Lockyer Valley, for QUUs consideration of further investigations.
Four options were considered to transfer treated water to a connection point on the Western Corridor
pipeline in the Lower Lockyer Valley, which would be the take-off point for a trunk main to service
water users in the Lockyer Valley:
• Option 1—Transfer PRW via the existing Western Corridor Scheme
• Option 2—Construction of a new pipeline to transfer Class A+ recycled water26
• Option 3—Supply PRW and ROC to the Lockyer Valley via the existing Western Corridor
Scheme and a new pipeline
• Option 4—Supply PRW to the Lockyer Valley and provide increased reverse osmosis
concentrate treatment.
The results of the preliminary options assessment identified that Option 1 provided the lowest whole
of life costs and it was adopted as the preferred method to transfer PRW to the Lockyer Valley.
2.4 Identified gaps
The Cardno pre-feasibility study identified the following issues that the preliminary business case and
detailed business case would need to consider:
1) The demand for different water products from both existing irrigators and
potential new entrants across the region and by locality across varying end
uses including horticulture and intensive animal husbandry
2) The impact on demand for other water products arising from proposed
amendments to the water plan to groundwater use within the Lockyer Valley
3) The potential for access to water resources, which may include:
26 Water quality definitions can be found at Department of Energy and Water Supply, Water quality guidelines for recycled water
schemes, Queensland Government, November 2008, https://www.dews.qld.gov.au/__data/assets/pdf_file/0019/45172/water-quality-guidelines.pdf.

19 Not Government Policy
a) existing allocations held by others, including the medium priority allocations in mid-
Brisbane
b) existing strategic reserves in South East Queensland
c) recycled water from the Western Corridor Recycled Water Scheme either through
a direct offtake or sourced indirectly from Wivenhoe Dam
4) The potential for the Lake Wivenhoe to Cressbrook Dam pipeline to form
part of a bulk transfer system as an alternative to a new pipeline
5) Other public infrastructure requirements necessary to support the identified
demand and supply options
6) In meeting the identified demands across the region, the option or
combination of options with the highest net economic and social benefit to
the Lockyer Valley
7) Environmental benefits arising from increased water security in the Lockyer
Valley.27
GHD identified constraints that would need to be addressed.
1) The Lockyer, Darling Downs and surrounding region are characterised by
the depth of opportunity for economic development and the magnitude of
constraints on this development. In some instances, the opportunity and
constraints are intertwined by complex internal and external forces, most
notably with respect to water availability, access to markets, approvals,
project lead-time to achieve a positive cash flow and downstream impacts of
irrigation development.28
2) Insufficient access to water supplies is a key constraint on the expansion of
production for several crops.29
Some of these constraints are addressed in this report. However, an enduring constraint is the
uncertainty of additional irrigation demand for water and a willingness to pay study. This constraint
needs to be addressed early in the detailed business case. The design (and therefore) cost of a
scheme depends on the quantum and location of demand.
27 Cardno, Pre-feasibility: Water for agriculture productivity and sustainability, 2018, p. 39. 28GHD, NuWater Project Feasibility Study 2017, p. 14. 29 GHD, NuWater Project Feasibility Study, 2017, p. 27.

20 Not Government Policy
3. Governance
3.1 Proposal owner
To oversee the development of this business case, the governance arrangements shown below were
put in place. The governance model includes stakeholders from state and local governments,
statutory bodies and irrigator representatives (Figure 3.1).
The Department of Natural Resources Mines and Energy (DNRME) is responsible for the strategic
business case (SBC) as the project owner. Building Queensland acts in an assist role in the
development of the SBC to provide advice and to ensure its consistency with the Business Case
Development Framework.
Figure 3.1 : Governance model
3.2 Project Steering Committee
The PSC consisted of government representatives and provided SBC development guidance. It
provided strategic direction, reviews, comments upon and/or endorsed project elements that affected
the SBC. The focus of the PSC was on:
• high-level strategic issues in the development of the SBC
• noting and/or endorsing key business case outputs and documentation as they are
developed
• considering the SBC and making a recommendation to the project owner.
The key matters for PSC deliberation were:
• key project documentation (e.g. business case work stream outputs such as technical
analysis and reports, business case management plan)
• major issues and risks associated with the project
• review of the draft SBC report
• endorsement of the final SBC report

21 Not Government Policy
• consideration of the SBC and making a recommendation to the chair.
The PSC members included representatives from:
• Department of Natural Resources, Mines and Energy (chair)
• Department of Premier and Cabinet
• Queensland Treasury
• Queensland Treasury Corporation
• Department of State Development, Manufacturing, Infrastructure and Planning
• Department of Agriculture and Fisheries
• Department of Environment and Science
• Building Queensland
• Seqwater
• Queensland Urban Utilities.
A summary of PSC meeting is shown in Table 3.1.
Table 3.1 : Summary of PSC meetings
Meeting number Date Topics Decisions made
1 9 November 2018 Update, Terms of Reference for
Project Steering Committee,
Business Case Management Plan
Endorsement of Terms of
Reference for Project Steering
Committee, Business Case
Management Plan
2 8 February 2019 Discussion of the service need Endorsement of Service Need
Statement
3 7 March 2019 Discussion of the longlist and
multicriteria analysis criteria
Endorsement of long list
4 4 April 2019 Review of ranked and shortlist Endorsement of shortlist
5 8 May 2019 Further SBC analysis on
shortlisted infrastructure options,
and non-infrastructure options
Endorsement of outcomes from
SBC for DBC consideration,
including program of new
complementary and Base Case
options.
6 12 June 2019 Presentation and review of draft
SBC Report.
The draft SBC Report is to be
provided to the PWG for review
and subsequent comments from
the PWG and PSC are to be
incorporated. PSC to approve final
SBC Report.
3.3 Project Working Group
The PWG provided guidance, input, direction and review to ensure that the project delivered the
outcomes outlined in the project’s purpose and objectives.
The focus of the PWG was to oversee the articulation of an agreed purpose that will lead to the
development of the SBC that:
• details the service need to be addressed
• identifies intended benefits

22 Not Government Policy
• includes undertaking an investment logic mapping exercise with stakeholders
• leads to a multicriteria assessment of a list of options.
The PWG comprised community and industry stakeholders and government agencies. The PWG
members included representatives from:
• Lockyer Valley and Somerset Water Collaborative (chair)
• Lockyer Valley Regional Council
• Somerset Regional Council
• Lockyer Valley Growers
• Lockyer Water Users Forum
• Lockyer Chamber of Commerce and Industry
• Queensland Urban Utilities
• Building Queensland
• Seqwater
• Department of Natural Resources, Mines and Energy
• Department of Agriculture and Fisheries
• Department of State Development, Manufacturing, Infrastructure and Planning
• Queensland Treasury
• Queensland Treasury Corporation.
A summary of PWG meetings is shown in Table 3.2.
Table 3.2 : Summary of PWG meetings
Meeting
number
Date Topics Decisions made
1 25 May
2018
Introduction and roles
2 2 July 2018 Role of Building Queensland
3 20 August
2018
Project update, Building Queensland
BCDF and draft Terms of reference for
PWG
Adopted Building Queensland BCDF and PWG to
be chaired by Stephen Robertson
4 2 October
2018
Terms of reference, formation of
Project Steering Committee
Finalisation of terms of reference
5 19
November
2018
Investment logic map—problem /
opportunity, benefits
Service need statements
6 17
December
2018
Review of investment logic map—
problem / opportunity, benefits
Service need statements
Continue Investment logic mapping
Strategic responses
Potential initiatives
Confirmation of problem / opportunity, benefits

23 Not Government Policy
Meeting
number
Date Topics Decisions made
7 29 January
2019
Review of investment logic mapping—
KPIs (of benefits), strategic responses,
potential initiatives
Risk workshop
8 25 February
2019
Overview of the longlist and feedback.
Assessment criteria for use in the multi
criteria analysis
Preliminary endorsement of the longlist and
assessment criteria.
9 16 April
2019
Review of ranked longlist and shortlist Endorsement of shortlist
10 14 May
2019
Discussion on further SBC analysis on
shortlisted infrastructure options, and
non-infrastructure options
Agreed with outcomes from SBC for detailed
business case consideration, including program of
new complementary and base case options.
11 18 June
2019
Presentation of draft SBC Report Comments to be provided for inclusion in the final
SBC report.
12 22 July 2019 Discussion of PWG written comments
on the draft SBC report.
Agreed response to PWG comments - to be
incorporated into the final SBC Report.

24 Not Government Policy
4. Methodology
A desktop study and gap analysis of work done to date (for example, prior studies) was undertaken to
capture previous work and to identify areas where additional work was required.
Several state agencies and local governments were actively involved. This ensured that all state and
local government portfolio interest were captured. Also, the PWG had a strong representation from
grower groups to provide an irrigation perspective.
QTC was engaged to explore economic opportunity given global trends (Chapter 6).
All the key elements were discussed with the Project Working Group (PWG) and the Project Steering
Committee (PSC). Details of the PWG and PSC are provided in Chapter 3. The main topics were the
service need, benefits, risks and potential initiatives, options long list, options short list and
recommendations. The service need, benefits, risks and potential initiatives are summarised in the
investment logic map (Appendix A).
The SBC is the first document in the business case suite of the Building Queensland BCDF. It aims to
ensure that the service need is substantiated and effectively articulated and that the benefits sought
are achieved through the proposed initiatives.
The SBC is developed in the pre-project phase and is used to determine whether there are problems
and opportunities to address. This SBC:
• provides evidence for the clearly articulated service need
• documents the benefits sought by responding to the service need and providing a minimum
benefit against which any options generated in the PBC can be compared
• identifies a range of strategic initiatives that might respond to the service need and achieve
some (or all) of the benefits sought
• provides decision-makers with the information needed to consider whether to further
progress the proposal.
4.1 Risk approach
The risk management approach is aligned with DNRME risk matrix and the relevant Australian
Standard AS/NZS ISO 31000:2009 Risk Management—Principles and Guidelines.
During a meeting of the PWG, a risk workshop was conducted. This process identified the material
risks to the development of the business case and risks associated with the delivery of any project
recommendations. Risk mitigation strategies were identified and implemented as needed. These
findings are summarised in the risk register (Appendix B).
4.2 Stakeholder engagement
Stakeholder engagement enables an understanding of the relationship between the objectives of a
project and the outcomes expected by stakeholders. Most of the stakeholder engagement took place
within the PWG (and some members of their organisation) and PSC, which represents a broad cross-
section of interested parties (see Chapter 7 for a summary of the stakeholders and their views and
Appendix D for the Stakeholder Engagement Plan).
4.3 Service need assessment
Assessment and confirmation of the service need was informed through the development of a socio-
economic baseline, investigations into the current reliability of supply, previous demand studies,
stakeholder consultation, a land suitability assessment and consideration of market opportunities and
policy objectives relevant to the area.

25 Not Government Policy
4.4 Options identification and assessment
Many practical options to address the service need, identified issues and opportunities of the Lockyer
Valley were considered. This was done through close collaboration and discussions with the PWG
and PSC. Through this process it was recognised that there may be more than one approach to solve
a problem or address an opportunity, and that in many situations multiple options will be required to
achieve the desired outcome. For example, a combination of ‘better use’ and ‘improve existing’ may
effectively delay the need for new infrastructure, while ‘reform’ in combination with ‘new’ could reduce
the cost of new infrastructure.
A workshop with relevant stakeholders was facilitated to explore all the possible infrastructure and
non-infrastructure solutions to address the identified issues. In this way information collected through
the needs assessment and engagement with key stakeholders about potential solutions was
leveraged.
The main approach to identifying options was through the ‘investment logic mapping’ approach, which
was undertaken by the PWG and then further considered and endorsed by the PSC. This approach
meant that a very wide cross-section of stakeholders could contribute to the option selection. In
addition, previous reports were considered, and their options were included.
4.4.1 Shortlisting
A multicriteria analysis workshop was used to rank all the identified options. Each option was
individually assessed against the established multicriteria analysis framework to develop a shortlist of
the most suitable options for further investigation. The multicriteria assessment criteria (Table 4.1)
were discussed and endorsed by the PWG and PSC.
Table 4.1 : Assessment criteria
Assessment criteria Weighting (per cent)
Additional water (annual maximum
volume)
10
Average availability 10
Capital costs (millions) 15
Stakeholder support 10
Technical feasibility 10
Strategic considerations and state
agencies support including competing
interests
10
Levelised costs and capacity to pay 15
Economic net present value 10
Financial net present value 10
Total 100
The focus of the multicriteria analysis workshop was to identify a shortlist of viable options that are
suitable from a social, economic, technical, environmental and water reliability perspective. This
allows specific attention and evaluation to be provided to the limited number of shortlisted options and
provides a greater level of confidence on the preferred option(s) identified at the conclusion of the
detailed analysis.
Specific investigations of each shortlisted option include appropriate technical and engineering
details, including, but not limited to, risks, opportunities and life cycle costs.

26 Not Government Policy
4.4.2 Next steps
This SBC recommends what activities should occur after completion of the business case. This
includes any options (including a program of new complementary options and existing base case
options) that have individual merit and could be progressed by the government or private investors.

27 Not Government Policy
5. Service need
The service need may result from a problem or opportunity, and this section includes evidence of why
it is necessary to address the problems and opportunities.
5.1 Current state
The current infrastructure is shown in Figure 5.1.
Figure 5.1 : Map of local infrastructure
28 Not Government Policy
5.2 Current state of demographics
5.2.1 Current state of the regional economy
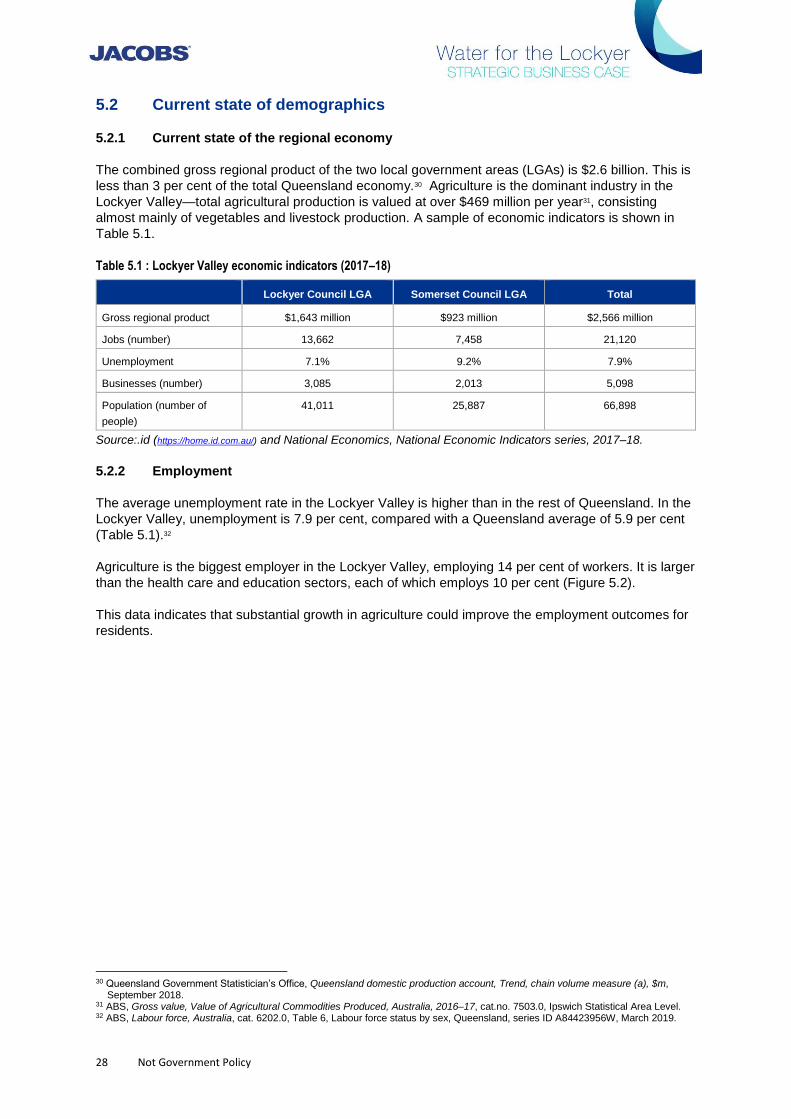
The combined gross regional product of the two local government areas (LGAs) is $2.6 billion. This is
less than 3 per cent of the total Queensland economy.30 Agriculture is the dominant industry in the
Lockyer Valley—total agricultural production is valued at over $469 million per year31, consisting
almost mainly of vegetables and livestock production. A sample of economic indicators is shown in
Table 5.1.
Table 5.1 : Lockyer Valley economic indicators (2017–18)
Lockyer Council LGA Somerset Council LGA Total
Gross regional product $1,643 million $923 million $2,566 million
Jobs (number) 13,662 7,458 21,120
Unemployment 7.1% 9.2% 7.9%
Businesses (number) 3,085 2,013 5,098
Population (number of
people)
41,011 25,887 66,898
Source:.id (https://home.id.com.au/) and National Economics, National Economic Indicators series, 2017–18.
5.2.2 Employment
The average unemployment rate in the Lockyer Valley is higher than in the rest of Queensland. In the
Lockyer Valley, unemployment is 7.9 per cent, compared with a Queensland average of 5.9 per cent
(Table 5.1).32
Agriculture is the biggest employer in the Lockyer Valley, employing 14 per cent of workers. It is larger
than the health care and education sectors, each of which employs 10 per cent (Figure 5.2).
This data indicates that substantial growth in agriculture could improve the employment outcomes for
residents.
30 Queensland Government Statistician’s Office, Queensland domestic production account, Trend, chain volume measure (a), $m,
September 2018. 31 ABS, Gross value, Value of Agricultural Commodities Produced, Australia, 2016–17, cat.no. 7503.0, Ipswich Statistical Area Level. 32 ABS, Labour force, Australia, cat. 6202.0, Table 6, Labour force status by sex, Queensland, series ID A84423956W, March 2019.

29 Not Government Policy
Figure 5.2 : Employment by sector
Source: Queensland Government Statistician’s Office, Queensland Treasury, Queensland Regional Profiles: Resident Profile for Lockyer Valley
(R) Local Government Area, 2016.
5.2.3 Population
The population of the Lockyer Valley is 66,000 and has been growing at 2.4 per cent annually over
the past 10 years. Over the same period, the Queensland population increased by 1.8 per cent
annually.
By 2041, the Lockyer Valley population is expected to reach 98,000—an increase of almost 50 per
cent over 25 years.33South East Queensland as a region is expected to increase by 55 per cent of the
same period. This will result in additional demand for the agricultural products grown in the Lockyer
Valley.
The level of socio-economic disadvantage in the Lockyer Valley is high, compared with the rest of
Queensland. Lockyer Valley residents are twice as likely to be highly disadvantaged and 90 per cent
less likely to be highly advantaged (Error! Reference source not found.3).
33 Queensland Government’s Statisticians Office, Qld Regional Profiles. (2016)
Agriculture, forestry and fishing
Health care and social assistance
Education and training
Retail trade
Construction
Manufacturing
Transport, postal and warehousing
Public administration and
safety
Accommodation and food services
Professional, scientific and technical services
Other services
Administrative and support services
Wholesale trade
Electricity, gas, water and waste services
Mining
Financial and insurance services Rental, hiring and real
estate services
Arts and recreation
services
Information media and
telecommunications

30 Not Government Policy
Figure 5.3 : Socio-economic disadvantage
Source: Queensland Government Statistician Office, Queensland Regional Profiles 2016.
5.2.4 Education
Educational attainment is lower in the Lockyer Valley than the rest of Queensland. In 2016, 52 per
cent of Lockyer Valley residents had a post-school qualification (bachelor’s degree, diploma or
certificate) compared with 59 per cent of the Queensland population.
The University of Queensland has an agricultural college at Gatton. This facility undertakes a range of
research functions and has a research farm of 1,100 hectares. The Gatton campus is home to the
School of Agriculture and Food Sciences, where students can take degrees in:
• Agribusiness
• Sustainable Agriculture
• Agricultural Science
• Food Technology.
The university teaches approximately 1,700 students each year. Graduates of the School of
Agriculture and Food Sciences are equipped with the skills needed to work on farms in the Lockyer
Valley.
5.3 Current state of agriculture
According to Trade and Investment Queensland:
The Lockyer Valley is one the top 10 most fertile farming areas in the world
and grows the most diverse commercial range of fruit and vegetables in
Australia. 34
The Lockyer Valley is also one of the most important food bowl areas in Australia, supplying most of
Australia’s vegetables during the winter months and typically accounting for 28 per cent of
Queensland’s total horticultural production. Significant industry opportunities continue to emerge in
the region including specialist food processing, food packaging, transport and storage, construction
and new agritourism developments. A diverse food processing sector is developing, which includes
34 Trade and Investment Queensland, Market profile Lockyer Valley, 24 October 2017,
https://www.tiq.qld.gov.au/download/business-interest/about-queensland/qld-regional-market-profiles/Market-Profile-Lockyer-Valley.pdf.
0
5
10
15
20
25
30
35
40
45
Quintile 1 (mostdisadvantaged)
Quintile 2 Quintile 3 Quintile 4 Quintile 5 (leastdisadvantaged)
Lockyer Valley Queensland

31 Not Government Policy
dairy manufacturers, small goods manufacturers and meat processors. The region has export
capabilities in agricultural technologies, services and equipment manufacturing.
Agriculture is the dominant industry in the Lockyer Valley—total agricultural production is valued at
over $469 million per year35, consisting almost mainly of vegetables and livestock production. A
breakdown is shown in Figure 5.4.
Figure 5.4 : Gross value of commodities in the Lockyer Valley, 2016–17
Source: ABS, Value of Agricultural Commodities Produced, Australia, 2016–17, cat. 7503.0, May 2018.
Vegetables contribute approximately half of the gross value of agricultural production. Most of the
irrigated agriculture relates to vegetable production, with beans, carrots and sweetcorn the largest
three crops measured by value of production. The breakdown varies from year to year, depending on
market and environmental conditions.
The crop mix are annual crop and can be planted and harvested each year. This approach allows for
production to rise and fall in line with water availability and with rainfall
5.3.1 Existing water use
Irrigators access water from a variety of sources. Over the past five years (2013–2017), the annual
water use has averaged approximately 40,000 megalitres (ML) for the Lockyer Valley. Irrigators
source their water from Seqwater irrigation schemes, on-farm storages, unsupplemented rivers and
creeks, and groundwater. Rainfall is captured in privately owned on-farm dams. However,
groundwater is the dominant source as is shown in Figure 5.5.
35 ABS, Gross value, Value of Agricultural Commodities Produced, Australia, 2016–17, cat.no. 7503.0, Ipswich Statistical Area Level.
Livestock
Nurseries, cut flowers, turf
Hay
Broadacre crops
Fruit and nuts
Other vegetables
Beans
Carrots
Sweet corn
Onions
Broccoli
Lettuces
Pumpkins
CabbagesPotatoes
Vegetables

32 Not Government Policy
Figure 5.5 : Water sources in the Lockyer Valley , 2013–2017 (ML)
Source: ABS, Water Use on Australian Farms, cat. no. 4618.0. Data has been collected by Statistical Area 4 since 2012–13.
In addition, crops are irrigated naturally by rainfall. The average annual rainfall is shown in Figure 5.6.
Figure 5.6 : Rainfall at the University of Queensland, Gatton (mm)
Source: BOM, station number 040082.
-
5,000
10,000
15,000
20,000
25,000
30,000
Channels or irrigationpipelines
On-farm dams or tanks Rivers, creeks, lakes, etc. Groundwater
2013 2014 2015 2016 2017
0
200
400
600
800
1000
1200
1400
1900 1910 1920 1930 1940 1950 1960 1970 1980 1990 2000 2010
Annual rainfall Ten year average rainfall

33 Not Government Policy
5.3.2 Groundwater
Groundwater resources provide a significant source of water for the Lockyer catchment, as evidenced
by the high concentration of bores located within the alluvial plains where irrigated agriculture is
undertaken. Streamflow within the waterways of the Lockyer catchment is interlinked with these
groundwater resources. From the 1940s there was a rapid increase in the number of bores drilled in
the catchment to access groundwater resources, resulting in a rapid increase in groundwater table
drawdown in selected areas. In 2013, an estimated 5,000 or more bores were accessing groundwater
resources within the Lockyer catchment.36
Intensive groundwater use can decrease water table levels resulting in adverse water quality impacts,
in terms of increased salinity, particularly during prolonged drier periods. Recent wet years, including
the flood events in 2011 and 2013, resulted in a major recharge of the groundwater system
demonstrating that the system is able to recover.36.
5.3.3 Existing Seqwater irrigation assets
Seqwater operates Wivenhoe and Somerset dams within the study area. These storages are
overwhelmingly used to supply urban water needs. A small volume of water allocations is available for
irrigators.
Seqwater operates two schemes in the Lockyer Valley—the Central Lockyer water supply scheme
(including the Morton Vale pipeline) and the Lower Lockyer water supply scheme. The existing water
storages and distribution assets for the schemes include the following:
• Bill Gunn Dam
• Clarendon Dam
• Atkinson Dam
• Kentville Weir
• Jordan 1 and 2 Weirs
• Wilson Weir
• Clarendon Weir
• Glenore Grove Weir
• Laidley Creek Diversion Weir
• Showgrounds Weir
• Crowley Vale Weir
• Morton Vale Pipeline.
The dams are off-stream storages that are filled by diverting water from nearby creeks during
significant flow events. Water is then released at a later time to supply customers. Accordingly, the
rate of inflow in constrained by the size of the pumps and diversions pipes/channels, and the dams
are not able to capture all the available water during flow events.
The Central Lockyer Valley scheme is supplied by Clarendon and Bill Gunn dams. The scheme
supplies water using the Morton Vale Pipeline, recharges the groundwater areas adjacent to Lockyer
Creek using the weirs, and supplies downstream area-based surface-water entitlements. This
scheme is shown in Figure 5.7.
36 Lockyer catchment preliminary socio-economic study, WSP, October 2017.

34 Not Government Policy
Figure 5.7 : Map of the Central Lockyer Valley water supply scheme

35 Not Government Policy
The Lower Lockyer water supply scheme was designed to supply surface water for irrigation. The
scheme is managed under the Moreton Water Plan (Water Management Protocol and Lower Lockyer
Valley Water Supply Scheme Operations Manual). A map of the scheme is shown in Figure 5.8.
Figure 5.8 : Map of the Lower Lockyer water supply scheme
Water reliability is low in the Seqwater schemes, relative to most other irrigation schemes in
Queensland, where reliability is generally targeted to be about 80 per cent for medium priority water
allocations. In the Central Lockyer Valley water supply scheme and the Lower Lockyer water supply

36 Not Government Policy
scheme the monthly reliabilities are both 50–65 per cent. There have been periods of very low water
availability, such as in the early 2000s, when supply was low. This is shown in Figure 5.9 and Figure
5.10
Figure 5.9 : Utilised storage capacity of Lockyer Valley irrigation dams (%)
These fluctuations result in variations in medium priority announced allocations. For example, in the
Lower Lockyer water supply scheme, during the period from 2008 to 2018, three years started with a
0 per cent announced allocation, while four years started with a 100 per cent allocation (Table 5.2).
Table 5.2 : Announced allocation—Lower Lockyer Valley water supply scheme
Year Lower Lockyer Valley
water supply scheme
announced allocation
(%)
2008 0–16
2009 13–63
2010 27–100
2011 100
2012 100
2013 100
2014 100
2015 81
2016 31
2017 0–10
2018 0–17
Note: Where a range is shown, the first number is the announced allocation at the beginning of the water year, and the last number is at the end.
Source: Seqwater, submission to the Queensland Competition Authority—appendix E, Rural irrigation price review 2020–24, 30 November 2018.
0
20
40
60
80
100
120
1986 1988 1990 1992 1994 1996 1998 2000 2002 2004 2006 2008 2010 2012 2014 2016 2018
Atkinson Clarendon Bill Gunn

37 Not Government Policy
Figure 5.10 : Volume of water released from Lockyer Valley irrigation dams (ML)
Source: Irrigators’ historical records.
It costs Seqwater approximately $2.5 million37 annually to operate these schemes. The Queensland
Government provides Seqwater with an annual community service obligation (a subsidy), of
approximately $1.7 million. This payment reflects the difference between total costs incurred by
Seqwater and revenue received from irrigators.
5.4 Summary of the current state
5.4.1 Impacts of the problem/opportunity
Agricultural production in the Lockyer Valley is highly dependent on water availability. Water
availability is unreliable.
The problems and opportunities that characterise the service need were identified and formulated as
follows:
1) Availability of sustainable and reliable water supply limits economic development
opportunities and growth
2) Lack of cross-government (three-tier) policy coordination constrains investment
3) Leveraging the region’s natural and competitive advantages would support economic
growth.
These statements are further discussed in section 5.5.1.
5.4.2 Timeframe and urgency
The low level of water availability in the irrigation dams is the main driver for an urgent solution.
Further, the finalisation of the water plan will specify more clearly each customer’s entitlement to
water. This may trigger a greater desire to augment current irrigation supplies.
37 Seqwater, Central Lockyer Valley Water Supply Scheme Annual Network Service Plan 2018–19 and Lower Lockyer Valley Water
Supply Scheme Annual Network Service Plan 2018–19.
-
2,000
4,000
6,000
8,000
10,000
12,000
14,000
16,000
18,000
1995 1997 1999 2001 2003 2005 2007 2009 2011 2013 2015
Bill Gunn Dam Lake Clarendon Atkinson Dam
38 Not Government Policy
5.4.3 Root causes and continuation of current state
The Lockyer Valley has many natural endowments, but access to adequate and reliable water is not
among them. During the workshops, participants considered that the social and economic upside was
large.
Without increasing water supply and reliability in the Lockyer Valley, a significant change in
agricultural output will likely not occur. This is consistent with the first problem statement (section
5.4.1).
5.4.4 Consequence of continuing the current state
If the current state is maintained, then it is expected that the following outcomes will continue:
• Unemployment will be higher than the Queensland average.
• Wages will be lower than the Queensland average.
• Socio-economic disadvantage will remain higher than in the rest of Queensland.
• Education attainment will remain lower than in the rest of Queensland.
5.4.5 Strategic alignment
All levels of government have a strong commitment to:
• appropriately allocating water
• investing in infrastructure that will result in additional local employment
• growing agricultural industries
• making efficient infrastructure decisions.
The service need is consistent with these strategic objectives (which are further detailed in 5.7)
5.5 Documenting the service need
5.5.1 Problem and opportunity statements
The Project Working Group (PWG) developed the service need through the investment logic mapping
workshops which was endorsed by the Project Steering Committee (PSC). These workshops were
informed by the work undertaken for previous studies (for example, NuWater and Cardno) and by
broad consultation (see Chapter 7).
The problems and opportunities that characterise the service need was identified and formulated as
follows:
1) Availability of sustainable and reliable water supply limits economic development
opportunities and growth
The Lockyer Valley experiences lower and more variable rainfall than the rest of South East
Queensland. Agriculture relies on irrigation from groundwater, which is in turn impacted by
droughts and floods. The agricultural sector shifted away from dairy, towards horticultural and
market gardening in the 1960s, aided by irrigation. Climate change is likely to reduce access to
water.
The analysis of groundwater and surface water indicated that these sources are fully allocated
and relatively unreliable.
The PWG considered this data as well as the water supply data (section 5.3) and concluded that
the availability and unreliability of water limits economic development opportunities and growth.

39 Not Government Policy
2) Lack of cross-government (three-tier) policy coordination constrains investment
Consultation with stakeholders revealed that interactions with the government can be uncoordinated.
Governments at all levels have an interest in increasing the productive capacity of the region, and it is
important that this is done in a coordinated fashion.
Improved coordination could increase investment and certainty among businesses. That could result
in additional regional investment, leading to additional local jobs being created. It would also support
agri-business and local value-add production.
The creation of new markets, especially export markets, requires a coordinated regional approach so
that economies of scale can be leveraged, and learnings applied across the region.
These issues were raised in the PWG workshops and it was agreed to include them a problem
statement.
3) Leveraging the region’s natural and competitive advantages would support economic
growth
QTC found that the region has significant natural endowments, which result in competitive
advantages:
The Lockyer Valley possesses fertile alluvial soils allowing it to grow the
most diverse commercial range of fruit and vegetables in Australia. The
Lockyer Valley supplies the majority of Australia's vegetables during the
winter months. Reportedly, there is technical potential to irrigate an
additional 15,000 hectares of suitable land in the Lockyer Valley.
Significant transport infrastructure traverses the region—highway access
to Brisbane and Toowoomba (the Toowoomba Second Range Crossing
is due for completion in 2019), and a railway line servicing Toowoomba
and further west. The Western corridor is bookended by Brisbane Airport
and Toowoomba Wellcamp Airport. Inland Rail may provide connectivity
to NSW and Victoria from the Rocklea station.
Significant industry experience and know-how are held by local growers.
The University of Queensland and University of Southern Queensland
offer research and training in agriculture. Numerous peak-bodies and
government agencies offer additional informational support.
The Lockyer Valley is located in the western growth corridor. The SEQ
population is forecast to increase by 1.9 million inhabitants by 2041, and
the economies of Asia are growing rapidly—a significant opportunity for
the Lockyer Valley. Free-trade agreements, most recently with China and
Indonesia, present opportunities to access international markets.38.
The SEQ city deal could also be leveraged to support a seamless connection between agricultural
production and access to markets.
The PWG considered these natural endowments and considered that the leverage of these natural
and competitive advantages could support economic growth.
5.6 Potential additional demand for water
A key question to address is: What is the demand for additional water? The best approach to forecast
additional demand is to undertake a detailed demand study and willingness to pay study, as
38 Trade and Investment Queensland, Market profile Lockyer Valley,24 October 2017, https://www.tiq.qld.gov.au/download/business-
interest/about-queensland/qld-regional-market-profiles/Market-Profile-Lockyer-Valley.pdf.

40 Not Government Policy
recommended by Cardno.39 In the absence of a detailed demand study, a study of the relevant factors
can provide a range of possible future scenarios.
The relevant factors include the availability of additional land, the price of the water relative to farm
incomes, an opportunity for double or triple cropping of existing irrigated land and the potential of a
market for any additional product.
5.6.1 Previous demand assessments
A demand assessment was undertaken during the NuWater project.40 This assessment found
confirmed additional demand of 2,650 ML in the Lockyer Valley, which was based on limited
responses from irrigators.
However, GHD (who undertook the study) experienced a low response rate. It found that the poor
response rate in the Lockyer Valley can be attributed, at least in part, to the uncertainly regarding the
future regulatory arrangements for the use of groundwater resources in the region. It concluded that
the outcomes from DNRME ongoing review of the sustainability of groundwater use in the Lockyer
Valley had the potential to have an impact on the level of demand for water from the project in the
Lockyer Valley.
Cardno undertook a high-level assessment and found that:
[An] approach to estimating the demand for water for agriculture is through a bottom-up
assessment by considering the crops produced and land under production in the Lockyer
Valley. Potential additional demand for water may arise from:
• Utilisation of high-quality land that is currently not in production
• More intensive use of existing land for cropping or animal husbandry
• Substitution for other sources if volumetric entitlements are in place for groundwater.
Estimating the level of potential additional demand is very difficult because of the
uncertainties involved. A simple estimate of demand arising from utilisation of high-quality
land that is currently not in production can be made by multiplying the land not in production
(approximately 15,000ha) by typical usage rates (1–3ML/ha/year) to arrive at 15–45
GL/year.
This is an upper bound for potential additional demand from usage of this land not in
production and does not account for ability or willingness to pay. Potential additional
demand arising from the other two drivers is too uncertain to be estimated even at a high
level. A rigorous demand assessment is needed to reliably estimate future potential
demand. However, potential future demand will be influenced by whether volumetric
entitlements are in place and a demand assessment should not be undertaken until there is
certainty in this area.41
5.6.2 Additional water demand
It is possible to increase agricultural production by either irrigating additional land or increasing
irrigation, which would result in additional water demand.
The 2012 Queensland Agricultural land audit identified approximately 111,000 hectares of class A
land and 19,000 hectares of class B land within the study area. These figures should be taken as
indicative only—they need to be confirmed through further investigation—but they identify locations
that could potentially contribute to increased production from the Lockyer Valley.
39 Cardno, Pre-feasibility study—Water for agriculture productivity and sustainability, pre-feasibility report prepared for Lockyer Valley Regional Council, 17 October 2017. 40 GHD, NuWater Project Feasibility Study, prepared for Queensland Farmers’ Federation, March 2018. 41 Cardno, 17 October 2017.

41 Not Government Policy
Class A land is land that is suitable for a wide range of current and potential crops with nil to moderate
limitations to production. Strategic cropping land corresponds to ‘class A’ agricultural land under the
Queensland agricultural land class system. ‘Class B’ land is limited crop land that is suitable for a
narrow range of current and potential crops. It is land that is marginal for current and potential crops
due to severe limitations but is highly suitable for pastures. Class B land may be suitable for cropping
with engineering or agronomic improvements.
The study area is defined to include both the Lockyer Valley and Somerset regional councils.
Most irrigators use the same plot of land to grow an average of 1.5 crops per year. However, for most
leafy vegetable crops, 8 to 16 weeks are needed between planting and harvesting. While land does
require some period of being fallow, irrigators said during consultation that an additional crop could be
planted each year if water was available. This would increase the number of crops per year to 2.5 (a
67 per cent increase) without needing additional land.
Based on a conservative estimate of Cardno’s findings, an additional 15,000 ha of Class A land is
available for agricultural production. Using a conservative application rate of 2.5 ML per hectare, a
further 37,500 ML per annum would be required for irrigation. Further, if existing land was planted for
an extra crop per year, this would result in 67 percent more water use—approximately 20,000 ML per
annum. Therefore, combining both existing and new land, an increased demand of 57,500 ML per
annum could be expected.
It is assumed that not every landholder would increase their production. For the purpose of estimating
costs and benefits, it has been assumed that additional demand would be 50,000 ML per year. It
could be much more, depending on the amount of additional land irrigated. Irrigation demand would
need to be thoroughly investigated during a detailed business case.
The suitable land is shown in Figure 5.11.

42 Not Government Policy
Figure 5.11 : Land mapping

43 Not Government Policy
5.6.3 Additional demand for agricultural product
For there to be additional demand for water, irrigators need to be able to profitably increase their
production. This can be done either by increasing supply into the domestic or international markets.
The Lockyer Valley already supplies a large portion of vegetables into the south east Queensland
market. As identified by QTC:
As Australia’s third-largest urban region, SEQ is home to one in seven Australians (3.4
million people) and is expected to attract an additional 1.9 million residents by 2041.42
It is reasonable to expect that the Lockyer could increase supply to service this market. The region
could also increase the share of production that is currently relatively low (turf, flowers, etc.). These
products require reliable water supply.
Another option is to increase supply into international markets. Presently, 6 per cent of output is
exported. There are significant barriers to increasing exports, however (discussed below).
While it is reasonable to expect additional demand for water over time, in the absence of a detailed
demand assessment, it is unknown whether commercial irrigators are prepared to take the risk of
expansion, and what type of water products they would pay for.
As recommended by Cardno, a detailed demand assessment and willing to pay study should be
undertaken to confirm additional demand, for both agricultural and associated industries.
5.6.4 Transport links and access to markets
The Lockyer Valley is strategically located in terms of transport. For example:
• The Lockyer Valley is linked by road to Brisbane and surrounds, including the Rocklea fruit
and vegetable markets, which the main markets serving South East Queensland. These
markets are less than one hour away from Gatton.
• It takes only two hours to travel to most of South East Queensland, which has a population
of 3.5 million.
• Commercial airports are not far away, for example Toowoomba’s Wellcamp (53 km) and
Brisbane (104 km).
• The Toowoomba Second Range Crossing is due for completion in 2019 will allow enhanced
freight routes bypassing Toowoomba city.
These transport links (which are already good and are still improving) could support the increase of
agricultural production. This was supported by QTC, who found that:
Transport infrastructure is not a material barrier. The Lockyer Valley has strength in
agricultural production and is served by good transport infrastructure in the form of
highways, ports, and airports. These competitive strengths allow the Lockyer Valley to
supply the majority of Australia's vegetable requirements during the winter months.
Stakeholders supported the view that regional transport infrastructure is a key strength
of the regional economy. Government continues to invest in these strengths e.g. Inland
Rail and the Toowoomba Second Range Crossing. Lockyer Valley Regional Council has
identified opportunities to build relationships with transport firms and growers, as well as
42 Trade and Investment Queensland, Market profile Lockyer Valley, 24 October 2017,
https://www.tiq.qld.gov.au/download/business-interest/about-queensland/qld-regional-market-profiles/Market-Profile-Lockyer-Valley.pdf.

44 Not Government Policy
a Gatton West Industrial Zone which could further leverage these competitive strengths.
It should continue to implement this strategy.43
5.7 Policy coordination
Discussions with stakeholders and the PWG identified that the application of government policy could
be better coordinated into a single regional approach. The relevant policies are outlined below.
5.7.1 Policy issues
Government policies relevant to the project include:
Commonwealth Government
• National Water initiative (2004).44 Under this initiative, governments have a responsibility to
ensure that water is allocated and used to achieve socially and economically beneficial
outcomes in a manner that is environmentally sustainable. This requires that prices reflect
the full costs and that water be properly managed before additional infrastructure is
constructed.
Queensland Government
• Our Future State: Advancing Queensland’s Priorities (2014).45 The relevant priorities include
creating jobs, increasing private sector investment and engaging more young
Queenslanders in education, training or work.
• Growing for Queensland.46 These initiatives set out how the Queensland Government plans
to enable the agricultural, fisheries and forestry sector to be innovative, responsive and
sustainable in the face of extraordinary opportunities and challenges.
• State Infrastructure Plan (2016).47 The plan outlines that the provision of efficient
infrastructure is a key enabler of this economic activity and can be met by making better use
of existing infrastructure—to leverage the opportunities of the new world economy,
Queensland’s regions will need to play to their advantages to grow local economies. From a
population of 4.7 million, Queensland is expected to grow to 7 million by 2036 and reach 10
million by 2061. Most of this growth will be in SEQ and some coastal centres. Part B (2019)
of the plan outlines six opportunities for water:
- Maintain water supplies to meet requirements, minimise flood risks and keep dams
safe.
- In partnership with local governments and water utilities, assess options to provide new
water sources to the northern part of SEQ where demand is forecast to exceed supply
by about 2040.
- Facilitate more efficient use of existing water resources and infrastructure assets and
optimise access through the continued expansion of water trading and flexible sharing
arrangements across the state.
- Consider the use of fit-for-purpose, alternative bulk water sources and opportunities to
meet future demands in innovative ways.
- Prioritise bulk water infrastructure proposals and improve assessment processes.
- Optimise existing infrastructure to maximise value.
43 Trade and Investment Queensland, Market profile Lockyer Valley,24 October 2017, https://www.tiq.qld.gov.au/download/business-
interest/about-queensland/qld-regional-market-profiles/Market-Profile-Lockyer-Valley.pdf 44 COAG, Intergovernmental Agreement on a National Water Initiative, 25 April 2004,
http://www.agriculture.gov.au/SiteCollectionDocuments/water/Intergovernmental-Agreement-on-a-national-water-initiative.pdf. 45 Queensland Government, The Queensland Plan, 2014, https://www.queenslandplan.qld.gov.au/assets/images/qld-plan.pdf. 46 Queensland Government, Growing for Queensland, 2018, https://publications.qld.gov.au/dataset/growing-for-
queensland/resource/67a8d14f-1e2a-43db-9f1f-85d0ed47220d. 47 Department of State Development, Manufacturing, Infrastructure and Planning, State Development Plan, Queensland Government,
March 2016, https://www.dsdmip.qld.gov.au/infrastructure/state-infrastructure-plan.html.

45 Not Government Policy
• Queensland Bulk Water Opportunities Statement48 (QBWOS, July 2017). It seeks to use
existing water resources and infrastructure more efficiently.
• Queensland Agricultural Land Audit (May 2013).49 The audit identifies land important to
current and future production and the constraints to development, highlighting the diversity
and importance of Queensland's agricultural industries across the state. It is a key reference
tool that will help guide investment in the agricultural sector and inform decision making to
ensure the best use of our agricultural land in the future.
• Department of Agriculture and Fisheries strategic plan, 2017–21.50 The plan commits to
creating conditions for successful agribusinesses and supply chains that encourage
innovation and productivity. It also seeks to assist people in agriculture and rural businesses
to respond to challenges and protect environmental values.
• SEQ Regional Plan 2017. The plan provides a regional framework for growth management,
and sets planning direction for sustainable growth, global economic competitiveness and
high-quality living by:
– harnessing regional economic strengths and clusters to compete globally
– ensuring land use and infrastructure planning are integrated
– valuing and protecting the natural environment, productive land, resources, landscapes
and cultural heritage.
• Water Plan (Moreton) 2007.51 The water plan defines the availability of water in the plan
area, identify priorities and mechanisms for dealing with future water requirements, provides
a framework for sustainably managing water and establish water entitlements for surface
water, groundwater and overland flow water. A new draft targeted amendment to the water
plan is expected to be released in mid-2019 for public consultation. This aims to set
sustainable extraction levels and flexible management arrangements for water within the
Central Lockyer Valley water supply scheme. The targeted amendment to the water plan is
scheduled to be finalised in 2019.
• Water for Life (2016).52 The Water Security Program is Seqwater's plan for providing the
region's drinking water over the next 30 years, including during times of drought and flood.
The Water Security Program focuses on meeting level of service objectives for South East
Queensland set by DNRME. The program covers urban use only and does not assess water
security for irrigation customers.
• Brisbane River Strategic Floodplain Management Plan, released in April 2019, outlines an
integrated catchment management planning approach that positions water security and
supply within the context of flood management, land use planning and landscape
management. Wivenhoe Dam also provides flood mitigation for the downstream floodplain.
The optimisation of water supply, flood mitigation and dam safety is a complex matter and is
being addressed by Seqwater. The options investigated do not affect the flood mitigation or
dam safety aspects of the dam.
• Vocational education and training (VET) Investment Plan53 supports the skills development
of those involved in agriculture sector by investing in a range of primary industry priority
qualifications based on industry skills need. In 2018-19, the VET Plan provided funding of
$19.4 million to support skills development for the primary industry sector, including
subsidies for apprentices and trainees, school students, Queenslanders seeking to gain
their first post-school qualification, and those seeking to gain higher level qualifications or
48 https://www.dews.qld.gov.au/__data/assets/pdf_file/0007/1266883/qld-bulk-water-opportunities-statement.pdf. 49 Department of Agriculture and Fisheries, Queensland Agricultural Land Audit: South East Queensland, 2013,
https://www.daf.qld.gov.au/__data/assets/pdf_file/0011/74000/QALA-Ch13-SEQ.pdf. 50 Department of Agriculture and Fisheries, Strategic Plan 2017–21, https://publications.qld.gov.au/dataset/strategic-plan-department-of-
agriculture-and-fisheries/resource/8ef395a4-0304-4cae-9755-e5061b8510c4. 51 Business Queensland, Moreton water plan area, https://www.business.qld.gov.au/industries/mining-energy-water/water/catchments-
planning/water-plan-areas/moreton. 52 Seqwater, Water for Life: South East Queensland’s Water Security Program 2016–2046, https://www.seqwater.com.au/waterforlife 53 https://desbt.qld.gov.au/training/docs-data/strategies/vetinvest

46 Not Government Policy
skill sets. In addition, the Regional Skills Investment Strategy project focuses on three key
industry sectors for the region i.e. agriculture, construction and hospitality where the Lockyer
Valley Regional Council has been approved $350,000 funding.
• Queensland Climate Transition Strategy. This strategy outlines the Queensland
Government’s target to reach zero net emissions by 2050 and the interim target for at least
a 30% reduction in emissions on 2005 levels by 2030.
• Queensland Climate Adaptation Strategy includes commitment to support industry-led
(through Queensland Farmers Federation, AgForce and Growcom) development of Sector
Adaptation Plans (SAP) and to work with the sector to address the priority actions identified
in each SAP. Under the Q-CAS Queensland Government has invested in eight industry lead
SAPs, including an Agriculture SAP. Under the Agriculture SAP key recommendations
identified by industry include:
1. Optimise access to climate hazard projections and hazard information,
2. Continue to develop and refine tools and resources that support farm, regional, supply
chain and industry-level management decision-making,
3. Support the delivery of facilitation and engagement programs,
4. Improve access to necessary finance and agriculture insurance,
5. Explore mechanisms to enable climate risk management and adaptation to be
addressed across agricultural supply chains, and
6. Enhance investment in programs and initiatives that support innovation and resilience.
Queensland Government has also invested in development of a high-level action plan for
the East Coast North Sub-cluster, managed by Queensland Farmers Federation, that
translates key recommendations from the Agriculture SAP for on-farm actions for all the
agricultural industries throughout this diverse region. The east coast north sub-cluster
includes the Fitzroy Basin Association, Burnett Mary Regional Group and Healthy Land and
Water Natural Resource Management (NRM) Groups.
Local government
• Lockyer Economic Development Plan (2018.)54 The plan identifies key opportunities for
economic growth and some challenges to address. The plan seeks to invest in skills
development across various sectors including health, retail, construction, education and
agriculture.
• Somerset Economic Development Plan (2015).55 The plan identifies opportunities as a
lifestyle region, Somerset needs to retain its scenic environment, its quality towns and
villages and maintain the ‘country lifestyle’ that is ‘really close to Brisbane’. The plan is
focused on job creation—strengthening the economy, creating local jobs in the region and
retaining strong agriculture, manufacturing and construction sectors in the economy.
5.7.2 South East Queensland City Deal
City Deals are a mechanism to develop collaborative plans for growth, renewal and reform. The
concept was first introduced in 2016 under the Australian Government’s Smart Cities Plan. Each City
Deal represents a long-term commitment that outlines the investments, planning governance and
actions needed to implement them. The Smart Cities Plan wants to promote opportunities for not only
metropolitan cities but also regional cities.
54 https://www.lockyervalley.qld.gov.au/our-region/economic-and-regional-
development/Documents/Economic%20and%20Development/Lockyer%20Economic%20Development%20Plan%202018%20-2023.pdf.
55 Somerset Regional Council, Somerset Economic Development Plan 2015 to 2020, http://www.somerset.qld.gov.au/economic-development-plan.

47 Not Government Policy
On 12 February 2019, the Queensland Government and the Council of Mayors (SEQ) jointly released
TransformingSEQ, in which they outlined their proposition to the Commonwealth Government for a
SEQ City Deal. The Australian Government has also confirmed its commitment to working with the
Queensland and local government councils in SEQ to develop a City Deal for the region.56
Water-related opportunities for the Lockyer Valley are specifically mentioned under
TransformingSEQ’s ‘jobs and skills’ domain:
An SEQ City Deal could focus on developing and implementing an
Agribusiness Strategy and Action Plan to realise the potential of:
- smart agriculture and next generation farming
- improved supply chains, including via the proposed Trade and Enterprise
Spine
- our robust biosecurity practices
- food provenance, assurance and data management
- our agricultural technology innovation.
It could also assist with examining further opportunities in relation to water
(such as improved water efficiency and use of recycled water) to increase
agricultural production and associated agribusiness in Priority Agricultural
Areas, such as the Lockyer Valley area.57
5.7.3 Conclusion
Based on feedback provided by stakeholders and through the PWG, there is a lack of a coordinated
approach to implementing the above policies. An increase in coordination may allow for streamlined
investment.
5.8 Summary of the service need
5.8.1 Impact of the problem
Despite water reliability challenges, the Lockyer Valley is one of the most productive farming areas in
Queensland, with significant comparative advantages and the potential to expand greatly.
The groundwater and surface water resources are, however, fully allocated and unreliable.
5.8.2 Why it is necessary to address the problem
The Lockyer Valley is a productive agricultural area with many natural endowments. It may be
possible to significantly improve water supply and reliability and the livelihood of residents. The
potential benefits that could accrue from meeting the problem include:
• increased agricultural production, value and economic activity
• increased agribusiness and local value-add production, value and activity
• additional regional investment
• creating local jobs
• encouraging commercially focused research and skill attainment
• development of new markets
56 S Morrison, City Deal for South East Queensland, media release, 12 February 2019, https://www.pm.gov.au/media/city-deal-south-
east-queensland. 57Queensland Government and Council of Mayors South East Queensland, TransformingSEQ: The SEQ City Deal Proposition,
February 2019, https://s3.treasury.qld.gov.au/files/TransformingSEQ_CityDealProposition_Final_2.pdf.

48 Not Government Policy
• supporting diversification, resilience, wellbeing and economic prosperity.
5.8.3 Timeframe
If additional water / more reliable water is provided into the Lockyer Valley, the benefits would start to
be realised almost immediately. This is because most of the agricultural production has a 16–20-week
gap between planting and harvest. Therefore, additional water could be applied immediately, and the
benefits could start to accrue within months of additional water becoming available.
5.8.4 Conclusion
The problems and opportunities that characterise the service need was identified and formulated as
follows:
• Availability of sustainable and reliable water supply limits economic development
opportunities and growth.
• Lack of cross-government (three-tier) policy coordination constrains investment.
• Leveraging the region’s natural and competitive advantages would support economic
growth.
These problems and opportunities are considered to have the same weighting. On this basis, the
service need statement can be described as follows.
The service need is represented by an opportunity to significantly grow the economy and
sustainability of the Lockyer region by 2030 with broader flow-on effects for South East Queensland
by:
– leveraging the region's natural and competitive advantages
– improving water reliability, supply, use and sustainability.
The aim to ‘significantly’ grow the economy and sustainability of the Lockyer region was deliberately
chosen to be unquantified. This was done to ensure that potential initiatives that may not meet a
certain threshold were not discarded as it may be possible to combine several initiatives. The
objective is for the economy to leverage opportunity, striving for a generational step-change.

49 Not Government Policy
6. Lockyer Valley economic opportunity assessment
DNRME engaged QTC in November 2018 to provide insight into how Lockyer Valley’s competitive
strengths can be leveraged to deliver sustainable economic growth and development. QTC found that
meeting the demand of a rapidly growing Asian middle class is often framed as a significant economic
opportunity for growers around the world. Nevertheless, there are many hurdles to overcome in order
to break into these growing foreign markets.
QTC’s assessment of key growth enablers points to greater innovation and entrepreneurship being
the key to unlock an economic step-change. QTC’s analysis and stakeholder consultation highlight
the following areas of strategic focus:
• Building the skill sets, knowledge, experience and culture of prospective exporters—this
includes addressing the lack of both scale and continuity of supply of individual businesses,
and the need to foster a demand-driven approach to export markets.
• Facilitating timely commercial market intelligence and market insights related to foreign
markets.
• Undertaking market research to understand product and packaging needs and opportunities
for each market, and the importance of consistent and focused brand messaging.58
These headline strategic actions will complement the region’s excellent transport infrastructure, fertile
soils, and collective skills and experience in agricultural production.
To realise opportunities in the region, it could be necessary to improve the flow of outside financial
capital into growers’ operations or investigate novel forms of industry cooperation.
In the absence of an economic step-change, it is likely that demand for Lockyer Valley’s agricultural
output will continue to increase with domestic population growth, particularly in South East
Queensland. However, increasing agricultural production may also hit resource constraints as the
impact of climate change develops.
Water infrastructure is, by itself, not likely to be a sufficient condition to achieving an economic step-
change.
Without regional economic step-change, options for economically viable water infrastructure
investment are necessarily more limited and dependent on domestic demand growth.
6.1 Key findings
6.1.1 The region is an important agricultural hub
Lockyer Valley is part of a functional economic region running from Toowoomba to
Brisbane. Agriculture is the cornerstone of the regional economy, supporting related activity
in transport, construction and manufacturing.
6.1.2 An economic step-change requires large, value-added markets
• An economic step-change will most likely be delivered through increased exports to rapidly
growing Asian markets. This offers potential rewards but comes with additional risks.
Currently only 6 per cent of regional product is exported.
• Australian horticultural exports are often not cost-competitive and need to compete on non-
price factors (e.g. quality).
58 Trade and Investment Queensland, Market profile Lockyer Valley, 24 October 2017,
https://www.tiq.qld.gov.au/download/business-interest/about-queensland/qld-regional-market-profiles/Market-Profile-Lockyer-Valley.pdf.

50 Not Government Policy
• It is necessary to augment existing strengths in agriculture with innovation and
entrepreneurship, to facilitate exports of premium agricultural products.
• Developing a demand-driven outlook and exploring further options for processing to meet
export demand could be elements of regional development driving a step-change.
6.1.3 Growers, industry and government can collaborate to drive value
• Some export impediments can be overcome. The following focus areas should be
prioritised:
- skill sets, knowledge, experience and culture of prospective exporters and lack of scale
and continuity of supply of individual businesses
- lack of timely commercial market intelligence and market insights; and understanding
product and packaging needs and opportunities for each market as well as the
importance of consistent and focused brand messaging.
• Market access remains an impediment in many markets, despite the increased prevalence
of free trade agreements. Understanding these restrictions will allow focus and inform future
investment decisions.
• If these impediments are addressed, other prerequisites for success appear to be in place.
Lockyer Valley can overcome Australia’s lack of global price competitiveness through
competing on quality (clean product) and specialisation.
6.1.4 Domestic demand
• In the absence of an export led step-change, domestic demand is still expected to grow.
Lockyer Valley is well placed to continue to meet this demand, both in South East
Queensland and nationally.
• Stakeholders acknowledged the risk of oversupply depressing commodity prices and
placing financial pressure on operators.
6.1.5 Water as a catalyst for change
• Additional water for agricultural production, by itself, is unlikely to deliver an economic step-
change.
• Increasing regional agricultural production may hit resource constraints through the impact
of climate change.
• The cost of building significant water infrastructure is likely to result in higher tariffs for those
wanting access to additional supply, than the tariffs that growers currently pay.
6.2 Export opportunities
The Port of Brisbane has the greatest export volume of the eastern capital city ports, but the lowest
value of exports, which demonstrates its comparatively lower-value commodities. Better leveraging
the capacity of South East Queensland’s major export gateway has potential to yield significant
economic returns. The challenge for the region is to increase the volume of high-value exports.
This is an area of opportunity for Lockyer Valley. While most of the regional output is consumed
locally or exported to domestic markets, there is potential to leverage off existing production to grow
the export potential of the region. However, although increased water security may be part of the
solution, the issues in developing a significant agriculture and agribusiness export capability within the
region are more complex than just addressing this matter. Only 6 per cent of output from the Lockyer
Valley is exported internationally, so developing export capability starts from a low base.

51 Not Government Policy
While increasing South East Queensland’s exposure to trade-related industry is a key plank of the
government's policy framework, including the proposed SEQ City Deal59, it is also important not to
ignore opportunities arising from servicing an increasing regional population. Meeting a material
portion of the demand for food in a growing South East Queensland also provides a strong future
economic base for the Lockyer Valley, without necessarily delivering a ‘step-change’ in the region’s
economic fortunes.
When stakeholders were asked why just 6 per cent of Lockyer Valley’s agricultural output is sold
abroad, they suggested that one impediment to export growth is the inability to meet reliability
standards in export contracts due to lack of water reliability. Farmers may therefore be reluctant to
focus on export opportunities.
An increase in water security in Lockyer Valley could drive an increase in agricultural output. It does
not automatically follow there will be an increase in demand, particularly for international exports,
where performance to date has been poor, and where other impediments remain.
While domestic demand, particularly in South East Queensland, will deliver steady incremental growth
opportunities, it will be more difficult to develop market share in international markets due to a greater
degree of international competition, informational barriers, real and perceived risks, and technical
barriers to trade.
Australian vegetable imports and production have both grown strongly since the early nineties.
Increased domestic consumption has likely constrained opportunities for export growth.
The largest vegetable export markets in 2016–17 were Singapore ($45 million), the United Arab
Emirates ($35 million), Japan ($35 million), Malaysia ($20 million) and Hong Kong ($15 million).The
most valuable export products in 2016/17 were carrots (37%), potatoes (11%), onions (7%),
cauliflower and broccoli (7%) and asparagus (13%). The Lockyer Valley produces high volumes of
cauliflower and broccoli.
6.2.1 Constraints on Australian export performance
Australian growers generally have competitive strength in quality, product integrity and safety,
seasonality and location. But growers must compensate for a lack of overall price competitiveness by
marketing innovative products. Stakeholder consultation generally supported these issues as
impediments to export growth.
AUSVEG has identified 10 ‘burning issues’ impacting on Australia’s export performance shown in
Figure 6.1.60
59 Queensland Treasury, TransformingSEQ: The SEQ City Deal Proposition, February 2019. 60 AUSVEG, Vegetable industry export strategy 2020, summary, https://ausveg.com.au/app/uploads/2018/02/VIES2020_summary.pdf.

52 Not Government Policy
Figure 6.1 : AUSVEG—constraints on agricultural exports

53 Not Government Policy
7. Stakeholders
7.1 Identifying stakeholders
Stakeholder engagement enables an understanding of the relationship between the objectives of a
project and the outcomes expected by stakeholders. It is also critical for developing a longlist of
options to solve the identified problem or opportunity—and for refining selection criteria that are
relevant to commercial irrigators, the environment, the community, Seqwater and the
government/regulators.
Stakeholder engagement was intentionally collaborative, with most stakeholder engagement taking
the form of workshops and discussions. The focus was on forming a shared understanding across all
stakeholders. Most of the stakeholder engagement took place within the PWG and PSC, which
represents a broad cross-section of interested parties.
7.1.1 Stakeholder details
Consultation took place with a wide range of stakeholders, most of whom were also represented on
the PWG, which met generally on a monthly basis, and the PSC. The PWG was established in May
2018 before the strategic business case commenced. A large amount of consultation had already
taken place (for the NuWater and Cardno reports61) and was underway (for the Moreton Water Plan
amendment). Therefore, to avoid ‘consultation fatigue’ the PSC and PWG were the main consultation
vehicles.
Consulted stakeholders are listed below (Table 7.1).
Table 7.1 : Consulted stakeholders
SECTOR STAKEHOLDER NEEDS AND EXPECTATIONS
Irrigators Lockyer Water Users Forum
(Brock Sutton), Lockyer Valley
Growers (Gordon Van Der Est),
Greg Banff, Anthony Staatz, Tim
Linan, Troy Qualischefski
Existing water users have an expectation that their issues
will be considered and addressed
Local business Lockyer Chamber of Commerce &
Industry
Representing local businesses with an expectation that
the project will consider broader economic issue.
Statutory bodies Seqwater Existing infrastructure owner with legal obligations for
dam safety and urban water supply that must be
maintained
Queensland Urban Utilities Existing infrastructure owner with potentially useful
assets in the area for supplying irrigators
Local government Lockyer Valley Regional Council,
Somerset Regional Council
Representing the local community with an expectation
that all sectors of the community can benefit
State government DNRME, DAF, DSDMIP,
Queensland Treasury, QTC,
Building Queensland
Representing the state’s interests with an expectation
that the business case is comprehensive, and the
process is collaborative
7.2 Engagement mechanism
Stakeholders were engaged directly or through the PWG and PSC.
61 Cardno, Pre-feasibility: Water for agriculture productivity and sustainability, prepared for Lockyer Valley Regional Council, April 2018;
GHD, NuWater Project Feasibility Study, prepared for Queensland Farmers’ Federation, March 2018.

54 Not Government Policy
7.2.1 Direct stakeholder engagement
The proposed stakeholders and the stakeholder engagement plan were endorsed by the PSC.
A register of consultation and meeting notes were maintained. In addition to PWG and PSC meetings,
additional meetings took place (Table 7.2).
Table 7.2 : Stakeholder meetings
DATE LOCATION ATTENDEES KEY TOPICS
30 October
2018
Gatton Irrigator representatives
and individual irrigators
• Irrigation need for water including reliability and volume
(service need)
• Longlist of options
• Economic benefits—gross margins and net margins / how
the water would be used / crops, yields and land area /
security of water
1 November
2018
Gatton Lockyer Valley Regional
Council
• Service need / the council’s need for water / reliability and
volume
• Longlist of options
• Selection criteria
1 November
2018
Esk Somerset Regional Council • Service need / the council’s need for water / reliability and
volume
• Longlist of options
• Selection criteria
7 November
2018
Brisbane Seqwater, DNRME,
Building Queensland
• Proposed longlist of options
• Identification of Seqwater’s current bulk water
strategies, studies / initiatives and any opportunities relevant
to the project
7.3 Consultation risks
Many of the identified risks (Appendix D) can be addressed through consultation. Therefore, the
stakeholder plan (Appendix E) has been developed to include all relevant stakeholders.

55 Not Government Policy
8. Benefits sought
8.1 Benefit statements
The PWG met to determine potential benefits that could arise from responding to the service need.
The benefits that it identified are:
• increased agricultural production, value and economic activity
• increased agribusiness and local value-add production, value and activity
• additional regional investment
• creating local jobs
• encouraging commercially focused research and skill attainment
• development of new markets
• supporting diversification, resilience, wellbeing and economic prosperity.
A record of the benefits is maintained in the Benefit Register (Appendix B). There are no assumptions
or dependencies that have an impact on the benefits sought.
8.1.1 Increased agricultural production, value and economic activity
If water volume and reliability is increased, agricultural production, value and economic activity will
increase, which would result in broader economic activity.
The beneficiaries include the farm owners, workers, suppliers and consumers.
Achieving this benefit may require investment in other supporting public infrastructure. It also requires
availability of skilled labour.
The key performance indicator (KPI) is value of agricultural production (in dollars). This benefit
should be measured using the value of agricultural commodities produced, published by the ABS.62
Given the primary beneficiaries will be irrigated agriculture, only crops63 (not livestock) will be
measured.
8.1.2 Increased agribusiness and local value-add production, value and activity
If agricultural output increases, then additional business activity can be expected. This business
activity could include agricultural inputs such as fertiliser, machinery or professional services. The
potential for local value-add industries would also increase. Such industries may package, process,
cool, dry, or extract the raw agriculture produce, and increase the value of the production before it
leaves the area.
The beneficiaries include the existing and new business and their workers.
The KPI is the number of new businesses, measured by the Counts of Australian Businesses,
published by the ABS64, for the Lockyer and Somerset councils.
8.1.3 Additional regional investment
It I expected that as the economic activity in the region increases, additional investment in capital will
be required. This additional capital will increase the productive capacity of the area and allow for the
unlocking of other benefits.
The beneficiaries include the business owners, workers, wholesale suppliers and local residents.
62 ABS, Value of Agricultural Commodities Produced, Australia, cat. 7503.0. 63 ABS commodity code 9013959. 64 ABS, Counts of Australian Businesses, including Entries and Exits, June 2014 to June 2018, cat. 8165.0

56 Not Government Policy
To undertake investment, businesses need to have access to credit, or sufficient equity.
The KPI is change in regional investment.
8.1.4 Creating local jobs
An increase in business activity will increase employment opportunities.
The beneficiaries include the unemployed (or under-employed) Lockyer Valley residents, and the
people who move into the area due to the availability of employment opportunities.
Potential new workers will need to have the required skills.
The KPI is the number of new jobs, measured by the data on small area labour markets, which is
published by the Australian Government Department of Employment, Skills, Small and Family
Business.65
8.1.5 Encouraging commercially focused research and skill attainment
If production increases, then it may become more commercially viable to undertake research specific to the Lockyer Valley—for example, research into developing seed and crop types and varieties that are best suited to the soils and climate of the Lockyer Valley. For this to occur, there needs to be sufficient scale so that there can be a return on the research investment. Collaboration with research and teaching institutions (universities and TAFE) could also occur.
The stakeholders and beneficiaries are the farm owners able the access the improved technologies
and the highly skilled workers undertaking the research.
Close collaboration with the local universities is required to undertake applied research.
Further, as the agricultural sector becomes increasingly automated and specialised, there will be a
greater need for highly trained employees and greater opportunities to become highly trained.
The KPI is a change in the number of people with post-school qualifications.66
8.1.6 Develop new markets
The Lockyer Valley supplies a significant portion of vegetables into the state and domestic markets. If
water volume and reliability is increased, then the Lockyer Valley can increase its production to meet
the growing domestic demand.
However, new exports markets could also be developed with access to reliable water. This will uncap
the potential of the Lockyer Valley and lead to a significant growth in export incomes.
The beneficiaries are the farm business, transport, logistics, processing and packaging business.
For exports to increase, there will need to be substantial investment in trading relationships, supply
chain and logistics. Further, access to markets can change quickly due to macro-political factors such
as tariff changes and import protocols.
The KPI is an increase in the dollar value of international exports from the Lockyer Valley.
8.1.7 Supporting diversification, resilience, wellbeing and economic prosperity (e.g. new
tourism)
A benefit sought is that the economy will diversify, and that economic prosperity will increase for all
residents of the Lockyer Valley—whether directly involved in agriculture or not.
It is expected that general wellbeing for residents and visitors (tourism) will be enhanced.
The KPIs are:
65 Department of Employment, Skills, Small and Family Business, Small Areal Labour Markets publication, Australian Government,
https://www.jobs.gov.au/small-area-labour-markets-publication. 66 ABS census data.

57 Not Government Policy
• a change in the number of new tourists spending time and money in the area
• an improvement in the index of relative socio-economic disadvantage.
8.2 Relative importance of benefits
The benefits are not all equal and have different impacts on different parties. To determine the
weighting of each benefit, the following factors were considered by the PWG, with each factor giving a
qualitative score of low, medium or high:
• Impact on stakeholders—will the benefit have a significant or immaterial impact? The bigger
the impact, the higher the score.
• Number of beneficiaries—will the benefits be distributed broadly or concentrated to just a
few beneficiaries? The greater the number of beneficiaries, the higher the score.
• Certainty of benefit—is the benefit likely to manifest or is it subject to significant uncertainty?
The more certain the benefit, the higher the score.
• Ability to measure—can the benefit sought be measured to determine whether the benefit
has been achieved? The easier the ability to measure, the higher the score.
The scoring is presented in Table 8.1.
Table 8.1 : Ranking of benefits
Benefit sought Impact on
stakeholders
Number of
beneficiaries
Certainty of
benefit
Ability to
measure
Weighting
Increased agricultural production,
value and economic activity
High Medium High High 25%
Increased agribusiness and local
value add production, value and
activity
High High Medium High 25%
Additional regional investment Medium Medium Medium Medium 10%
Creating local jobs High High Medium High 20%
Encouraging commercially
focused research and skill
attainment
Medium Medium Low Low 10%
Develop new markets Medium Low Low Low 5%
Supporting diversification,
resilience, wellbeing and
economic prosperity
Medium High Low Medium 5%
The weightings were applied through consultation with the PWG and PSC. These benefits informed
the multicriteria analysis criteria that were used to assess the options.

58 Not Government Policy
9. Strategic responses
This section describes the potential strategic responses to the identified service need. A valid
strategic response must have the potential to deliver some or all of the identified benefits and, in
doing so, address the related service need. To ensure it is sufficiently strategic, its implementation
must allow more than one possible solution.
Strategic responses usually fall into one or more of the below categories. Categories include
responses that:
• change demand
• improve productivity/efficiency
• change supply
• respond directly to the problem/opportunity
• influence the cause of the problem/opportunity
• address the effects/impacts of the problem.
9.1 Investment logic mapping workshops
Several investment logic mapping workshops were held with the PWG. The investment logic map was
endorsed by the PSC. These workshops were used to identify and develop the strategic responses.
Four strategic responses were identified to address the service need and obtain the benefits.
1) Improve policy settings and coordination
Two benefits could be achieved by improving policy settings and coordination.
Benefit sought Strategic response
Additional regional investment Improve policy settings and
coordination Encouraging commercially focused
research and skill attainment
This strategic response could attract additional regional investment by increasing investment certainty
and improving the overall investment environment. There is some evidence that policy coordination
can be improved and that government agencies can improve their alignment.
A related benefit is encouraging commercially focused research and skill attainment. This benefit
could be realised if policy settings encouraged investment into regionally targeted research. Skills
could also be developed if the research was undertaken in the region.
2) Promote, attract and achieve regional economic growth including addressing
impediments to export
Benefits sought Strategic response
Increased sustainable agricultural
production, value and economic
activity Promote, attract and achieve regional
economic growth including addressing
impediments to export Increased business and local value-
add production, value and activity
Additional regional investment
This strategic response could increase sustainable agricultural production, value and economic
activity by addressing the impediments to increasing export activity described in Chapter 6.

59 Not Government Policy
Increased sustainable agricultural production would lead to increased business activity and
opportunities for local value-add production. As economic activity increases, additional investment
could follow.
3) Improve water efficiency and innovation
It is critical that existing resources are used efficiently and effectively before additional resources are
provided. If not, then it is more efficient to optimise existing resources. This relates both to on-farm
water use and general agricultural productivity.
Benefits sought Strategic response
Increased sustainable agricultural
production, value and economic
activity Improve water efficiency and innovation
Additional regional investment
Develop new markets
An increase in water efficiency and innovation will likely lead to an increase in agricultural production,
value and economic activity. As the realisation of water efficiency often requires investment, additional
water saving projects will result in regional investment. Further, as the extra production is realised,
there will be investment in associated projects. Likewise, the additional production may allow for the
development of new markets.
4) Increase water supply and security
As identified in the service need, water availability is currently constrained. This limits the potential to
increase economic activity—both on-farm and through the broader regional economy. Several
significant benefits can be achieved if this constraint were addressed.
Benefits sought Strategic response
Increased sustainable agricultural
production, value and economic
activity
Increase water supply and security
Additional regional investment
Creating local jobs and improving
socio-economic outcomes
Encouraging commercially focused
research and skill attainment
Develop new markets
Supporting diversification, resilience,
wellbeing and economic prosperity
9.2 Conclusion
The investment logic mapping process (Appendix C) involving key stakeholders identified four
strategic responses that can assist in addressing the service need and delivering the identified
benefits. The four strategic responses include:
1) Improve policy settings and coordination.
2) Promote, attract and achieve regional economic growth including addressing impediments
to export.
3) Improve water efficiency and innovation.
4) Increase water supply and security.
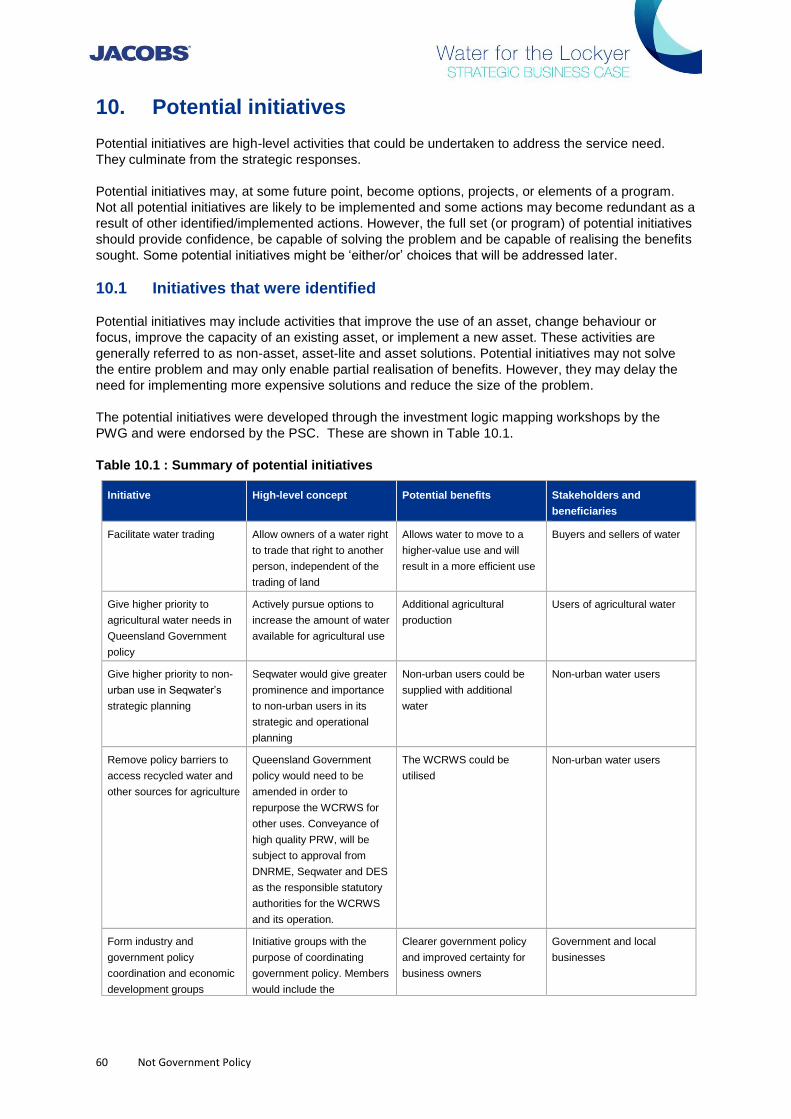
60 Not Government Policy
10. Potential initiatives
Potential initiatives are high-level activities that could be undertaken to address the service need.
They culminate from the strategic responses.
Potential initiatives may, at some future point, become options, projects, or elements of a program.
Not all potential initiatives are likely to be implemented and some actions may become redundant as a
result of other identified/implemented actions. However, the full set (or program) of potential initiatives
should provide confidence, be capable of solving the problem and be capable of realising the benefits
sought. Some potential initiatives might be ‘either/or’ choices that will be addressed later.
10.1 Initiatives that were identified
Potential initiatives may include activities that improve the use of an asset, change behaviour or
focus, improve the capacity of an existing asset, or implement a new asset. These activities are
generally referred to as non-asset, asset-lite and asset solutions. Potential initiatives may not solve
the entire problem and may only enable partial realisation of benefits. However, they may delay the
need for implementing more expensive solutions and reduce the size of the problem.
The potential initiatives were developed through the investment logic mapping workshops by the
PWG and were endorsed by the PSC. These are shown in Table 10.1.
Table 10.1 : Summary of potential initiatives
Initiative High-level concept Potential benefits Stakeholders and
beneficiaries
Facilitate water trading Allow owners of a water right
to trade that right to another
person, independent of the
trading of land
Allows water to move to a
higher-value use and will
result in a more efficient use
Buyers and sellers of water
Give higher priority to
agricultural water needs in
Queensland Government
policy
Actively pursue options to
increase the amount of water
available for agricultural use
Additional agricultural
production
Users of agricultural water
Give higher priority to non-
urban use in Seqwater’s
strategic planning
Seqwater would give greater
prominence and importance
to non-urban users in its
strategic and operational
planning
Non-urban users could be
supplied with additional
water
Non-urban water users
Remove policy barriers to
access recycled water and
other sources for agriculture
Queensland Government
policy would need to be
amended in order to
repurpose the WCRWS for
other uses. Conveyance of
high quality PRW, will be
subject to approval from
DNRME, Seqwater and DES
as the responsible statutory
authorities for the WCRWS
and its operation.
The WCRWS could be
utilised
Non-urban water users
Form industry and
government policy
coordination and economic
development groups
Initiative groups with the
purpose of coordinating
government policy. Members
would include the
Clearer government policy
and improved certainty for
business owners
Government and local
businesses

61 Not Government Policy
Initiative High-level concept Potential benefits Stakeholders and
beneficiaries
focused on the
Lockyer/Somerset region
government, utilities and
industry
Develop a supply value
chain for the region
In order to encourage an
export industry, the logistics
of exporting could be
strengthened, including
transport, refrigeration,
value-add and processing
Increased capacity to export Businesses involved in the
supply value chain
Facilitate applied research
in and for the Lockyer
Valley
The region has an
agricultural university.
Region-specific research
could improve productivity
and yields through enhanced
seeds and improved
harvesting to suit local
conditions
Increased agricultural
production
Businesses and universities
Increase efficiency of
Seqwater’s existing
irrigation assets
Seqwater could maintain and
operate its assets to improve
the reliability of the water
supplies. For example, weirs
could be de-silted so that
additional storage could be
available
Improved storages and
reliability
Seqwater and irrigators
Improve efficiency of
existing assets by improving
flood harvesting capacity
Improve the pumps or
channel diversion capacity to
allow Seqwater to pump
more into Atkinson,
Clarendon and Bill Gunn
dams during flow events
Additional water will be
stored and then used for
irrigation
Seqwater customers
Facilitate more efficient on-
farm water use
It is essential that current
resources are maximised
before additional activities
are undertaken. This would
involve measuring existing
efficiency and then improving
efficiency, perhaps through
government programs
Increased agricultural
production
Irrigators
Introduce recycled water
into the Lockyer/Somerset
region (direct to farm, into
Seqwater irrigation dams,
managed aquifer recharge)
The WCRWS is located in
Bundamba, just outside the
Lockyer Valley. It is designed
to supply water for urban
use, when dam levels drop
below certain triggers. When
not needed for urban use,
the recycled water could be
provided to irrigators
Additional water for irrigators
and improved utilisation of an
asset
Seqwater, the government,
Queensland Urban Utilities
(QUU) and irrigators
Source water from
Wivenhoe Dam
Allow irrigators to take water
from Wivenhoe Dam in a
way that does not impact
Seqwater’s existing urban
security objectives or dam
safety obligations
Additional water for irrigators Seqwater, the government,
QUU and irrigators

62 Not Government Policy
Initiative High-level concept Potential benefits Stakeholders and
beneficiaries
Extend distribution network
Extend the existing
distribution network so that
additional irrigators can
access regulated water
supplies
Additional water for irrigators New water accessors
10.2 Alignment to the State Infrastructure Plan Priority Model
The State Infrastructure Plan ranks initiatives from most preferred (reform) to least preferred (new) as
shown in Figure 10.1.
Figure 10.1 : State Infrastructure Plan Priority Model
Source: State Infrastructure Plan (2016)
Each of the potential initiatives has been categorised according to the State Infrastructure Plan. Most
of the potential initiatives are reform-related (Table 10.2).
Table 10.2 : Alignment with the State Infrastructure Plan
Reform Better use Improve existing New
Facilitate water trading Increase efficiency
of Seqwater’s
existing irrigation
assets
Introduce recycled water into the
Lockyer/Somerset region (direct to farm,
into Seqwater irrigation dams, managed
aquifer recharge)
Extend
distribution
network
Give higher priority to agricultural water
needs in Queensland Government
policy
Facilitate more
efficient on-farm
water use
Source water from Wivenhoe Dam -
Give higher priority to non-urban use in
Seqwater’s strategic planning
- Improve efficiency of existing assets by
improving flood harvesting capacity
-

63 Not Government Policy
Reform Better use Improve existing New
Remove policy barriers to access
recycled water and other sources for
agriculture
- - -
Form industry and government policy
coordination and economic development
groups focused on the
Lockyer/Somerset region
- - -
Develop a supply value chain for the
region
- - -
Facilitate applied research in and for the
Lockyer
- - -

64 Not Government Policy
11. Options generation and assessment
The generation and critical interrogation of options capable of meeting the identified service need is a
central deliverable of this business case. A list of project options (solutions) for analysis was
generated and considered against the benefits sought.
11.1 Approach
All options were included on the longlist. This reflected the desire not to exclude options without due
consideration. This SBC is designed to be a comprehensive high-level assessment based on previous
work. The longlist of options was generated by:
• reviewing the potential initiatives (see Chapter 10) and then considering what activities are
needed to implement that activity; in some cases, one potential initiative resulted in several
options and in other instances, an option involves several potential initiatives
• considering, for each of the potential initiatives identified in the SBC, the activities necessary to
implement that initiative—this included non-asset initiatives (i.e. reform and better use initiatives)
• reviewing the work already undertaken—particularly the reports by Cardno and GHD (for
NuWater)67, whose options were all included
• consulting widely. This was initially done in the PWG, where most of the options were generated.
Further consultation was undertaken with the PSC, where additional options were added.
This approach ensured that all options previously considered, and all options contemplated by
contemporary stakeholders were included.
11.2 Option longlist
Thirty-nine options were identified. Some of the options have similarities and can be grouped together
into categories.
11.2.1 Water from Wivenhoe Dam options
The first suite of options involves sourcing water from Wivenhoe Dam. All of these options include:
• taking water from Wivenhoe Dam
• consideration of amending the trigger levels for replenishing Wivenhoe with water from the
WCRWS to ensure that irrigators can be supplied without impacting on urban water supply
security
• suspending irrigation supplies when the WCRWS is turned on, until the WCRWS is turned
off.
• Due to the interconnectedness of the WCRWS and Wivenhoe Dam for urban water supply,
and the significance of its initial recommissioning for urban water supply, it is the preference
of Seqwater that any supply to the Lockyer Valley irrigators from Wivenhoe Dam, would
occur only after the WCRWS had already been recommissioning for urban water supply
purposes.
Figure 11.1 shows an example of the trunk infrastructure that would be required for this suite of
options (options 19 and 20). Table 11.1 provides a description of these options.
67 Cardno, Pre-feasibility: Water for agriculture productivity and sustainability, prepared for Lockyer Valley Regional Council, April 2018;
GHD, NuWater Project Feasibility Study, prepared for Queensland Farmers’ Federation, March 2018.

65 Not Government Policy
Figure 11.1: Water from Wivenhoe option

66 Not Government Policy
Table 11.1 : Water from Wivenhoe Dam options
Option
number
Option name Description Benefits to be achieved Stakeholders Timeframe
19 Water from
Wivenhoe Dam /
new trunk main /
new distribution
network
• Water from Wivenhoe/Somerset
Dam
• New small diameter trunk main
supplying raw water to Atkinson
Dam, Lake Clarendon and Lake
Dyer (Figure 11.1)
• New distribution network to the
farm gate (not shown as the
location is highly uncertain)
• Increased sustainable
agricultural production,
value and economic
activity
• Additional regional
investment
• Seqwater
• QUU
• Governments
• Irrigators
2–3 years
20 Water from
Wivenhoe Dam /
new trunk main /
existing distribution
network
• Water from Wivenhoe/Somerset
dam
• New small-diameter trunk main
supplying raw water to Atkinson
Dam, Lake Clarendon and Lake
Dyer (Figure 11.1)
• Existing distribution networks /
managed aquifer recharge. (as per
Figure F.)
• Increased sustainable
agricultural production,
value and economic
activity
• Additional regional
investment
• Supporting
diversification,
resilience, wellbeing
and economic
prosperity
• Seqwater
• QUU
• Governments
• irrigators
2–3 years
23 Water from
Wivenhoe Dam /
new distribution
network / no
irrigation dams
• Water from Wivenhoe/Somerset
Dam
• No trunk main and no use of
irrigation dams
• The new distribution network
(small pipes) takes water from the
dam to farm
• Increased sustainable
agricultural production,
value and economic
activity
• Additional regional
investment
• Seqwater
• QUU
• Governments
• Irrigators
2–3 years
11.2.2 Water from Wivenhoe Dam—utilising the existing Toowoomba pipeline
A permutation of the above options is to use the existing Toowoomba pipeline. It was considered that this may
reduce the length of new trunk mains needed. However, the length of trunk mains is likely increased using this
option. Further, the existing pipeline also has a more limited capacity than what would likely be required and is
needed to supply Toowoomba—therefore, access would be constrained.
Figure 11.2 and Table 11.2 provide some descriptions of these options.

67 Not Government Policy
Figure 11.2: Water from Wivenhoe Dam through the existing Toowoomba pipeline
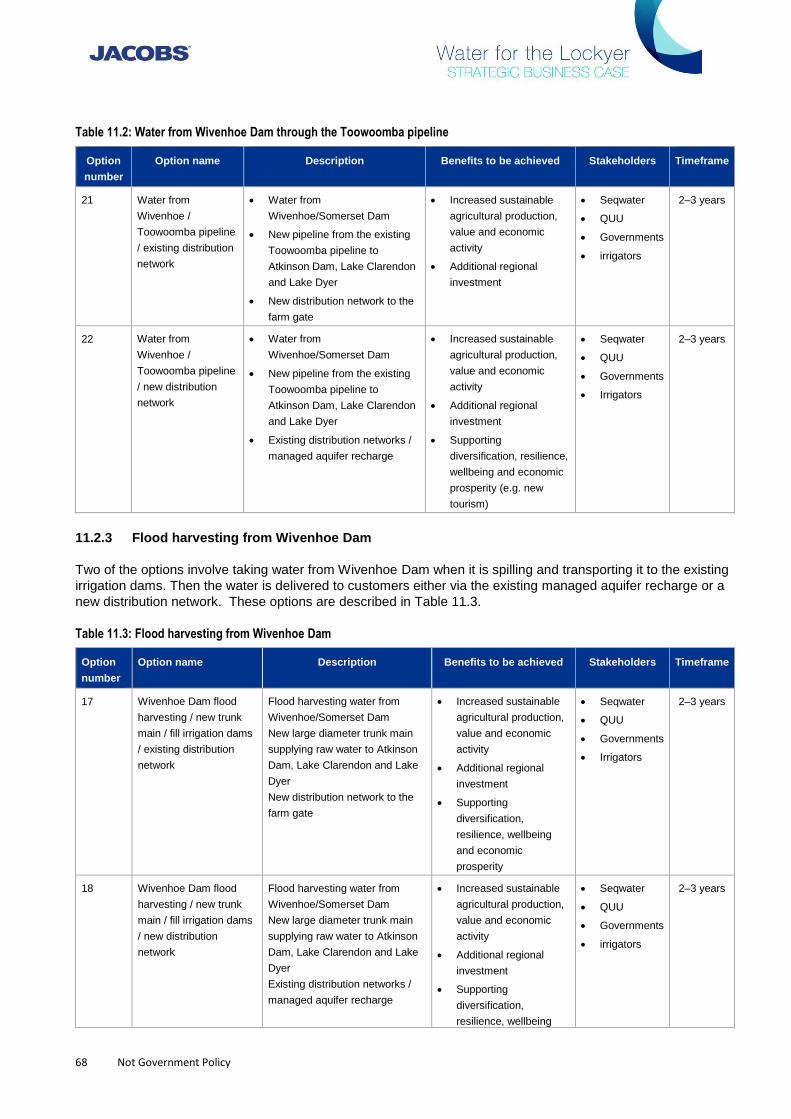
68 Not Government Policy
Table 11.2: Water from Wivenhoe Dam through the Toowoomba pipeline
Option
number
Option name Description Benefits to be achieved Stakeholders Timeframe
21 Water from
Wivenhoe /
Toowoomba pipeline
/ existing distribution
network
• Water from
Wivenhoe/Somerset Dam
• New pipeline from the existing
Toowoomba pipeline to
Atkinson Dam, Lake Clarendon
and Lake Dyer
• New distribution network to the
farm gate
• Increased sustainable
agricultural production,
value and economic
activity
• Additional regional
investment
• Seqwater
• QUU
• Governments
• irrigators
2–3 years
22 Water from
Wivenhoe /
Toowoomba pipeline
/ new distribution
network
• Water from
Wivenhoe/Somerset Dam
• New pipeline from the existing
Toowoomba pipeline to
Atkinson Dam, Lake Clarendon
and Lake Dyer
• Existing distribution networks /
managed aquifer recharge
• Increased sustainable
agricultural production,
value and economic
activity
• Additional regional
investment
• Supporting
diversification, resilience,
wellbeing and economic
prosperity (e.g. new
tourism)
• Seqwater
• QUU
• Governments
• Irrigators
2–3 years
11.2.3 Flood harvesting from Wivenhoe Dam
Two of the options involve taking water from Wivenhoe Dam when it is spilling and transporting it to the existing
irrigation dams. Then the water is delivered to customers either via the existing managed aquifer recharge or a
new distribution network. These options are described in Table 11.3.
Table 11.3: Flood harvesting from Wivenhoe Dam
Option
number
Option name Description Benefits to be achieved Stakeholders Timeframe
17 Wivenhoe Dam flood
harvesting / new trunk
main / fill irrigation dams
/ existing distribution
network
Flood harvesting water from
Wivenhoe/Somerset Dam
New large diameter trunk main
supplying raw water to Atkinson
Dam, Lake Clarendon and Lake
Dyer
New distribution network to the
farm gate
• Increased sustainable
agricultural production,
value and economic
activity
• Additional regional
investment
• Supporting
diversification,
resilience, wellbeing
and economic
prosperity
• Seqwater
• QUU
• Governments
• Irrigators
2–3 years
18 Wivenhoe Dam flood
harvesting / new trunk
main / fill irrigation dams
/ new distribution
network
Flood harvesting water from
Wivenhoe/Somerset Dam
New large diameter trunk main
supplying raw water to Atkinson
Dam, Lake Clarendon and Lake
Dyer
Existing distribution networks /
managed aquifer recharge
• Increased sustainable
agricultural production,
value and economic
activity
• Additional regional
investment
• Supporting
diversification,
resilience, wellbeing
• Seqwater
• QUU
• Governments
• irrigators
2–3 years

69 Not Government Policy
Option
number
Option name Description Benefits to be achieved Stakeholders Timeframe
and economic
prosperity
This option requires there to be capacity within the irrigation dams to accommodate the water when Wivenhoe
Dam is spilling. Wivenhoe Dam had seven spill events (Figure 11.3, indicated in blue) over the past 33 years.
Of these seven events, the Lockyer irrigation dams had significant capacity in only three (Figure 11.3, indicated
in green).
Figure 11.3 : Wivenhoe Dam levels
11.2.4 Water from the Western Corridor Recycled Water Scheme
A suite of options relate to sourcing recycled water from the WCRWS. An example of the infrastructure needed is shown in
Figure 11.4.
Under these options:
• The WCRWS would be operated to supply water to irrigators.
• As required for urban water security, the WCRWS would be used to supplement Wivenhoe Dam. At
this point, the supply to irrigators would be suspended.
• The options include consideration of both PRW and A+ supplies. Both supplies are (more than)
suitable for irrigation. If PRW is used (options 24, 25, 26, 31, 32 and 33), then the existing pipeline
from Bundamba to Wivenhoe Dam could be used to transport the water part-way (until past Lowood).
When needed, the water would continue to Wivenhoe Dam.
• If A+ water was transported in the existing pipeline, then Seqwater could not use this pipeline to
supplement Wivenhoe. Instead, these options (options 27, 28, 29, 34, 35, 36) assume direct potable

70 Not Government Policy
reuse, where PRW is transported from Bundamba directly to Mt Crosby, for direct inclusion in drinking
water supplies. This would require a very substantial change to government policy.
• The WCRWS needs to be recommissioned before it can be used again. The approximate cost of
recommissioning is $180 million. If the WCRWS was to be turned on for the benefit of irrigators, it is
appropriate that they pay this cost. However, irrigators can avoid this cost if the WCRWS is already
switched on for urban water supply. The options below consider both scenarios.
• The options also consider three delivery infrastructure options:
- Trunk mains connecting the existing irrigation dams and building a new distribution network
- Trunk mains connecting the existing irrigation dams and using the existing distribution network
- Not using the existing irrigation dams and delivering directly to farms.
Figure 11.4 and Table 11.4 provide further details

71 Not Government Policy
Figure 11.4: Water from the WCRWS
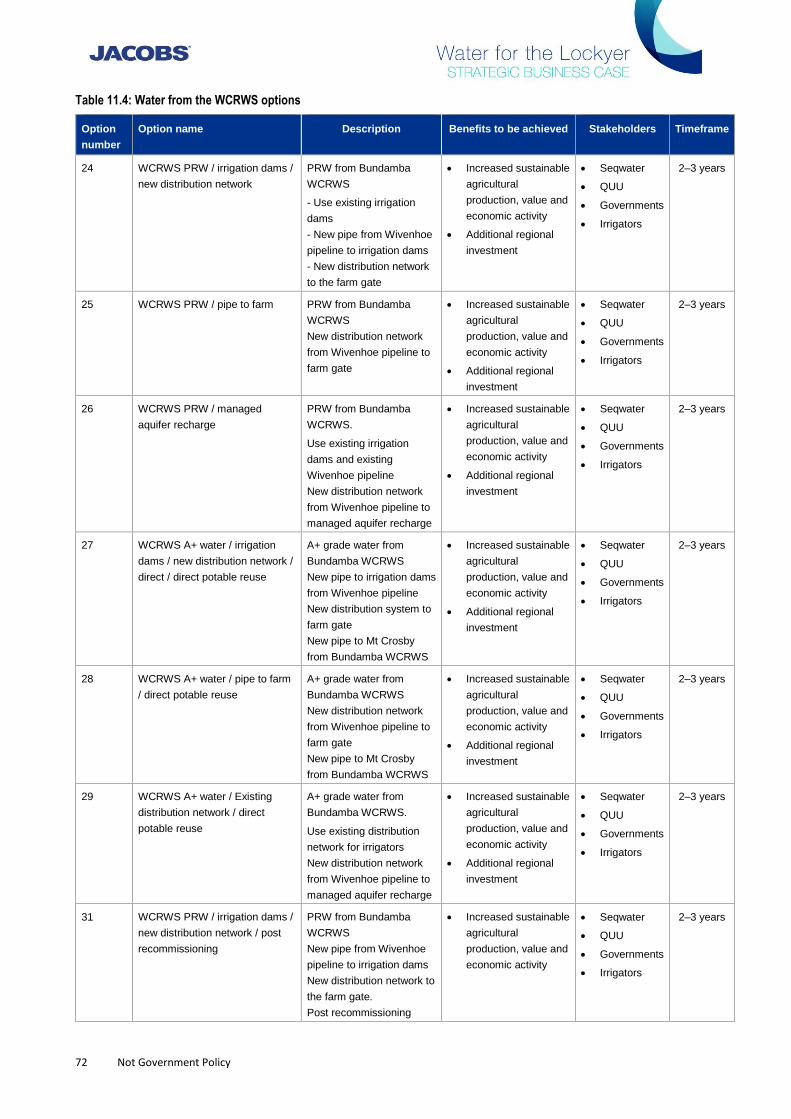
72 Not Government Policy
Table 11.4: Water from the WCRWS options
Option
number
Option name Description Benefits to be achieved Stakeholders Timeframe
24 WCRWS PRW / irrigation dams /
new distribution network
PRW from Bundamba
WCRWS
- Use existing irrigation
dams
- New pipe from Wivenhoe
pipeline to irrigation dams
- New distribution network
to the farm gate
• Increased sustainable
agricultural
production, value and
economic activity
• Additional regional
investment
• Seqwater
• QUU
• Governments
• Irrigators
2–3 years
25 WCRWS PRW / pipe to farm PRW from Bundamba
WCRWS
New distribution network
from Wivenhoe pipeline to
farm gate
• Increased sustainable
agricultural
production, value and
economic activity
• Additional regional
investment
• Seqwater
• QUU
• Governments
• Irrigators
2–3 years
26 WCRWS PRW / managed
aquifer recharge
PRW from Bundamba
WCRWS.
Use existing irrigation
dams and existing
Wivenhoe pipeline
New distribution network
from Wivenhoe pipeline to
managed aquifer recharge
• Increased sustainable
agricultural
production, value and
economic activity
• Additional regional
investment
• Seqwater
• QUU
• Governments
• Irrigators
2–3 years
27 WCRWS A+ water / irrigation
dams / new distribution network /
direct / direct potable reuse
A+ grade water from
Bundamba WCRWS
New pipe to irrigation dams
from Wivenhoe pipeline
New distribution system to
farm gate
New pipe to Mt Crosby
from Bundamba WCRWS
• Increased sustainable
agricultural
production, value and
economic activity
• Additional regional
investment
• Seqwater
• QUU
• Governments
• Irrigators
2–3 years
28 WCRWS A+ water / pipe to farm
/ direct potable reuse
A+ grade water from
Bundamba WCRWS
New distribution network
from Wivenhoe pipeline to
farm gate
New pipe to Mt Crosby
from Bundamba WCRWS
• Increased sustainable
agricultural
production, value and
economic activity
• Additional regional
investment
• Seqwater
• QUU
• Governments
• Irrigators
2–3 years
29 WCRWS A+ water / Existing
distribution network / direct
potable reuse
A+ grade water from
Bundamba WCRWS.
Use existing distribution
network for irrigators
New distribution network
from Wivenhoe pipeline to
managed aquifer recharge
• Increased sustainable
agricultural
production, value and
economic activity
• Additional regional
investment
• Seqwater
• QUU
• Governments
• Irrigators
2–3 years
31 WCRWS PRW / irrigation dams /
new distribution network / post
recommissioning
PRW from Bundamba
WCRWS
New pipe from Wivenhoe
pipeline to irrigation dams
New distribution network to
the farm gate.
Post recommissioning
• Increased sustainable
agricultural
production, value and
economic activity
• Seqwater
• QUU
• Governments
• Irrigators
2–3 years

73 Not Government Policy
Option
number
Option name Description Benefits to be achieved Stakeholders Timeframe
32 WCRWS PRW / pipe to farm /
post recommissioning
PRW from Bundamba
WCRWS
New distribution network
from Wivenhoe pipeline to
farm gate
Post recommissioning
• Increased sustainable
agricultural
production, value and
economic activity
• Additional regional
investment
• Seqwater
• QUU
• Governments
• Irrigators
2–3 years
33 WCRWS PRW / managed
aquifer recharge / post
recommissioning
PRW from Bundamba
WCRWS
New distribution network
from Wivenhoe pipeline to
managed aquifer recharge
Post recommissioning
• Increased sustainable
agricultural
production, value and
economic activity
• Additional regional
investment
• Seqwater
• QUU
• Governments
• Irrigators
2–3 years
34 WCRWS A+ water / irrigation
dams / new distribution network /
direct / direct potable reuse / post
recommissioning
A+ grade water from
Bundamba WCRWS.
New pipe to irrigation dams
from Wivenhoe pipeline.
New distribution system to
farm gate.
New pipe to Mt Crosby
from Bundamba WCRWS.
Post recommissioning
• Increased sustainable
agricultural
production, value and
economic activity
• Additional regional
investment
• Seqwater
• QUU
• Governments
• Irrigators
2–3 years
35 WCRWS A+ water / pipe to farm
/ direct potable reuse / post
recommissioning
A+ grade water from
Bundamba WCRWS
New distribution network
from Wivenhoe pipeline to
farm gate
New pipe to Mt Crosby
from Bundamba WCRWS
Post recommissioning
• Increased sustainable
agricultural
production, value and
economic activity
• Additional regional
investment
• Seqwater
• QUU
• Governments
• Irrigators
2–3 years
36 WCRWS A+ water / managed
aquifer recharge / direct potable
reuse / post recommissioning
A+ grade water from
Bundamba WCRWS.
New distribution network
from Wivenhoe pipeline to
managed aquifer recharge
Post recommissioning
• Increased sustainable
agricultural
production, value and
economic activity
• Additional regional
investment
• Seqwater
• QUU
• Governments
• Irrigators
2–3 years
11.2.5 Water from Queensland Urban Utilities Bundamba water treatment plant
QUU owns a water treatment plant at Bundamba which provides feed water for the WCRWS. These options
investigate whether A+ water from this plant could be used by Lockyer irrigators.
The three same infrastructure scenarios are included:
• Trunk mains connecting the existing irrigation dams and building a new distribution network
• Trunk mains connecting the existing irrigation dams and using the existing distribution network
• Not using the existing irrigation dams and delivering directly to farms.
Table 11.5 provides extra detail for these options.

74 Not Government Policy
Table 11.5: Water from QUU
Option
number
Option name Description Benefits to be achieved Stakeholders Timeframe
37 QUU A+ / irrigation
dams / new distribution
network
A+ grade water from QUU
Bundamba water
treatment plant
New pipe to irrigation
dams
New distribution system to
farm gate
• Increased sustainable
agricultural production, value
and economic activity
• Additional regional investment
• Seqwater
• QUU
• Governments
• Irrigators
5+ years
38 QUU A+ / pipe to farm A+ grade water from QUU
Bundamba water
treatment plant
New distribution network to
farm gate
• Increased sustainable
agricultural production, value
and economic activity
• Additional regional investment
• Seqwater
• QUU
• Governments
• Irrigators
5+ years
39 QUU A+ / managed
aquifer recharge
A+ grade water from QUU
Bundamba water
treatment plant
New pipe to irrigation
dams
Existing managed aquifer
recharge
• Increased sustainable
agricultural production, value
and economic activity
• Additional regional investment
• Seqwater
• QUU
• Governments
• Irrigators
5+ years
11.2.6 Policy and coordination
A number of the options relate to policy and coordination roles to be undertaken by government, organisation or
private. These are shown below in Table 11.6.
Table 11.6 : Policy and coordination options
Option
number
Option name Description Benefits to be
achieved
Stakeholders Timeframe
1 Supply chain
improvements
Develop a supply value chain for the region
and address supply chain gaps and
constraints
• Increased
business and
local value add
production, value
and activity.
• Develop new
markets
• Irrigators
• Local
businesses
1 year
2 On-farm
initiatives
Growcom is currently undertaking a number of
initiatives (e.g. Hort360 South-East
Queensland) that are focused on promoting
best management practice within the
horticulture industry, as well as addressing
nutrient and sediment loss in catchments
where this is a known issue. There would be
value in these initiatives also identifying where
water availability is (or is likely to become) a
constraint to maximising on-farm production
within the sustainable best management
practice context.
• Increased
sustainable
agricultural
production, value
and economic
activity
• Irrigators 1 year
3 Market
opportunities
study
Identifying the regional, state and national
market implications of the Lockyer growing its
• Increased
business and
local value add
• Irrigators 1 year

75 Not Government Policy
Option
number
Option name Description Benefits to be
achieved
Stakeholders Timeframe
production in the future; also, development of
export markets
production, value
and activity.
• Develop new
markets
• Australian and
Queensland
governments
4 Industry/policy
coordination
review
The PSC considered that past examples
suggest that it may be more effective for one
group (rather than two separate groups) to
oversee and drive the industry and
government policy coordination aspect and the
economic development aspect. Review of
examples deployed elsewhere might include:
- South East Queensland Council of Mayors
- Regional planning clusters
- Regional natural resource management
groups
- RDAs
If specific funding were to be directed to
infrastructure investment in the Lockyer Valley,
the group(s) might also provide a useful
governance vehicle for steering and
overseeing such initiatives.
• Increased
business and
local value add
production, value
and activity.
• Develop new
markets
• Irrigators
• Local
businesses
• governments
1 year
5 Public/private
agribusiness
development
The PSC considered that a number of co-
investment approaches currently being
deployed might inform the model to be applied
in the Lockyer Valley. These include R&D
programs managed by Hort innovation, urban
water alliance, Department of innovation.
As UQ (Gatton) and USQ both have an
existing presence in the region, they are well-
positioned to be key delivery partners in R&D
co-investment programs for the Lockyer
Valley.
• Encouraging
commercially
focused research
and skill
attainment
• Irrigators
• Governments
• Universities
1 year
6 Water trading Improve mechanisms to allow (or encourage)
water trading
• Increased
sustainable
agricultural
production, value
and economic
activity
• Irrigators 1 year
11 Public/private
research
investment
Government partnership / co-investment to
attract a private sector research investment in
the Lockyer Valley
• Encouraging
commercially
focussed
research and skill
attainment
• Universities
• Governments
• Irrigators
ongoing
15 On-farm
irrigation
efficiency
Improve on-farm irrigation efficiency • Increased
sustainable
agricultural
production, value
and economic
activity
• Irrigators
• Governments
ongoing
11.2.7 Seqwater options
A number of the options are within Seqwater’s area of operations, as described below in Table 11.7.

76 Not Government Policy
Table 11.7: Seqwater options
Option
number
Option name Description Benefits to be achieved Stakeholders Timeframe
7 Increase
diversion
capacity
Seqwater to investigate whether
pump/channel capacity can be increased
to better utilise the off-stream storages
• Increased sustainable
agricultural production,
value and economic
activity
• Irrigators
• Seqwater
2–3 years
8 Weir and
channel
improvements
Increasing the effectiveness of existing
weirs (potentially through desilting) and/or
existing channels
• Increased sustainable
agricultural production,
value and economic
activity
• Irrigators
• Seqwater
2–3 years
9 New weirs New irrigation weirs • Increased sustainable
agricultural production,
value and economic
activity
• Irrigators
• Seqwater
2–3 years
10 Inter-catchment
transfer
Water from other area in South East
Queensland (for example, Paradise Dam)
to improve reliability of the grid and allow
irrigators to access water from Wivenhoe
Dam
• Increased sustainable
agricultural production,
value and economic
activity
• Creating local jobs
and improving socio-
economic outcomes
• Irrigators
• Seqwater
• Governments
5+ years
11.2.8 Private sector options
The options for the private sector to advance are shown below in Table 11.8.
Table 11.8: Private sector options
Option
number
Option name Description Benefits to be achieved Stakeholders Timeframe
12 Local recycled
water
Recycled water from local
treatment plants directly to the
farm gate
• Increased sustainable
agricultural production, value
and economic activity
• QUU
• Irrigators
1 year
13 Saline water
use
Treated saline groundwater
resources in the Lockyer Valley
• Increased sustainable
agricultural production, value
and economic activity
• Irrigators 1 year
14 Greywater
reuse
Greywater reuse • Increased sustainable
agricultural production, value
and economic activity
• Government
• Irrigators
1 year
16 Desalination on
coast
Build a desalination plant on the
coast and pipe the water to the
Lockyer
• Increased sustainable
agricultural production, value
and economic activity
• Irrigators
• governments
5+ years
30 Deep Aquifer Access very deep artesian water
by drilling very deeply
• Increased sustainable
agricultural production, value
and economic activity
• Irrigators 2 years

77 Not Government Policy
12. High-level consideration / Options filter
By assessing and ranking each of the options presented, the most favourable options can be identified and
assessed in greater detail.
To undertake this assessment, a series of assessment criteria were established. These criteria, which were
agreed by the PWG and PSC, support the identified benefits sought. The nine criteria were established through
consultation with stakeholders. This broad consultation led to a relatively large number of criteria. There is some
overlap between the criteria—for example, capital costs are an input into the economic and financial net present
values and the levelised costs. However, the PSC and PWG considered that each criterion was suitable for
inclusion.
The weighing of each reflects the relative importance that the PWG and PSC placed on each criterion.
Sensitivity analysis was also undertaken to test whether there was a material change in an option’s score if
changes were made to the criteria scoring process.
Each option was then scored against each of these criteria so that a combined score could be derived for each
option. This would allow all of the 39 options to be ranked, relative to each other. For the qualitative criteria,
there was naturally judgement required for the scoring. In the first instance, Jacobs provided the scores, which
were then modified and confirmed by the PSC and PWG.
Table 12.1 lists the assessment criteria and the weighting applied.
Table 12.1 : Assessment criteria
Assessment criterion Weighting
Capital costs 15%
Additional water (annual maximum consumption) 10%
Average reliability 10%
Stakeholder support 10%
Technical feasibility 10%
Strategic considerations and state agencies support including
competing interests
10%
Levelised costs and capacity to pay 15%
Economic net present value 10%
Financial net present value 10%
Total 100%
To score each option against the criteria, the definition was established for each score, as shown in Table 12.2.
Table 12.2 : Assessment criteria cut-offs
0 1 2 3 4 5
Capital costs ($m) > $500 $201 to $500 $101 to $200 $51 to $100 $10 to $50 < $10
Additional water
GL/a 0 0 to 5 6 to 10 11 to 20 31 to 30 >30
Average availability < 21% 21 to 40% 41 to 60% 61 to 80% 81 to 90% > 91%
Economic NPV ($m) < –$200 –$199 to –$100 –$99 to $0 $1 to $200 $201 to $500 > $500
Financial NPV ($m) Less than –$200 –$199 to –$100 –$99 to $0 $1 to $200 $201 to $500 > $500
Stakeholder
support
All stakeholders
strongly oppose
Stakeholders
oppose
Indifference / mix
of support and
opposition
Support from
all
stakeholders
High support
from all
stakeholders
Very high
support from all
stakeholders

78 Not Government Policy
0 1 2 3 4 5
Technical feasibility Impossible
Hard—many
problems to
overcome across
disciplines
Difficult—many
problems to
overcome across
a discipline
Moderate—
some problems
Easy—few
problems
Simple—no
material
problems
Strategic
considerations
including
competing interests
Fully inconsistent
and/or not
supported by
Government
Mainly
inconsistent
Neither
consistent nor
inconsistent
Some
inconsistency
Mostly
consistent
Fully consistent
Levelised costs per
ML > $3,000 $2,999 to $1,000 $999 to $500
$400 to $499
(or n.a.) $300 to $399
< $300
12.1 Capital costs
The capital costs for each option have been estimated. Where possible, existing estimates have been used
based on the reports produced by Cardno and GHD.68 Where no existing estimate was available, we applied our
engineering judgement to develop a high-level estimate. These estimates are accurate to +/- 50 per cent and is
considered to be acceptable for this purpose of relative ranking for the SBC (refer Table 12.3).
Table 12.3 : Capital costs
Option number
Option description Capital cost ($ m)
Score Original source
1 Supply chain improvements – 5
2 On-farm initiatives – 5
3 Market opportunities study – 5
4 Industry/policy coordination review – 5
5 Public/private agribusiness development – 5
6 Water trading – 5
7 Increase diversion capacity 1 5 Jacobs
8 Weir and channel improvements 5 5 Jacobs
9 New weirs 25 4 Jacobs
10 Inter-catchment transfer 499 1 Jacobs
11 Public/private research investment 5 5 Jacobs
12 Local recycled water 25 4 Jacobs
13 Saline water use 25 4 Jacobs
14 Greywater reuse 25 4 Jacobs
15 On-farm irrigation efficiency 38 4 Jacobs
16 Desalination on coast 750 0 Jacobs
17
Wivenhoe flood harvesting / new trunk main / fill irrigation dams / existing
distribution network 101 2
Cardno
18
Wivenhoe flood harvesting / new trunk main / fill irrigation dams / new
distribution network 151 2
Cardno
19 Water from Wivenhoe / new trunk main / new distribution network 130 2 Cardno
20 Water from Wivenhoe / new trunk main / existing distribution network 80 3 Cardno
21 Water from Wivenhoe / Toowoomba pipeline / existing distribution network 79 3 Cardno
22 Water from Wivenhoe / Toowoomba pipeline / new distribution network 129 2 Cardno
23 Water from Wivenhoe / new distribution network / no irrigation dams 130 2 Cardno
24 WCRWS PRW / irrigation dams / new distribution network 378 1 GHD
25 WCRWS PRW / pipe to farm 378 1 GHD
26 WCRWS PRW / managed aquifer recharge 329 1 GHD
27
WCRWS A+ water / irrigation dams / new distribution network / direct / direct
potable reuse 378 1
GHD
68 Cardno, Pre-feasibility: Water for agriculture productivity and sustainability, prepared for Lockyer Valley Regional Council, April 2018; GHD,
NuWater Project Feasibility Study, prepared for Queensland Farmers’ Federation, March 2018.

79 Not Government Policy
Option number
Option description Capital cost ($ m)
Score Original source
28 WCRWS A+ water / pipe to farm / direct potable reuse 378 1 GHD
29 WCRWS A+ water / Existing distribution network / direct potable reuse 329 1 GHD
30 deep aquifer 3 5 Jacobs
31
WCRWS PRW / irrigation dams / new distribution network / post
recommissioning 121 2
GHD
32 WCRWS PRW / pipe to farm / post recommissioning 121 2 GHD
33 WCRWS PRW / managed aquifer recharge / post recommissioning 72 3 GHD
34
WCRWS A+ water / irrigation dams / new distribution network / direct / direct
potable reuse / post recommissioning 121 2
GHD
35
WCRWS A+ water / pipe to farm / direct potable reuse / post
recommissioning 121 2
GHD
36
WCRWS A+ water / managed aquifer recharge / direct potable reuse / post
recommissioning 72 3
GHD
37 QUU A+ / irrigation dams / new distribution network 159 2 Jacobs
38 QUU A+ / pipe to farm 159 2 Jacobs
39 QUU A+ / managed aquifer recharge 72 3 Jacobs
12.2 Additional water (annual maximum consumption)
Some of the options can provide additional water to irrigators in the study area. An estimate of the maximum
annual additional water is shown in Table 12.4.
Table 12.4 : Additional water
Option number
Option description Additional water (ML)
Score
1 Supply chain improvements – 0
2 On-farm initiatives – 0
3 Market opportunities study – 0
4 Industry/policy coordination review – 0
5 Public/private agribusiness development – 0
6 Water trading 5,000 2
7 Increase diversion capacity 1,000 1
8 Weir and channel improvements 1,000 1
9 New weirs 1,000 1
10 Inter-catchment transfer 50,000 5
11 Public/private research investment - 0
12 Local recycled water 4,400 1
13 Saline water use 1,275 1
14 Greywater reuse 4,400 1
15 On-farm irrigation efficiency 5,000 2
16 Desalination on coast 50,000 5
17 Wivenhoe flood harvesting / new trunk main / fill irrigation dams / existing distribution network
50,000 5
18 Wivenhoe flood harvesting / new trunk main / fill irrigation dams / new distribution network
50,000 5
19 Water from Wivenhoe / new trunk main / new distribution network 50,000 5
20 Water from Wivenhoe / new trunk main / existing distribution network 50,000 5
21 Water from Wivenhoe / Toowoomba pipeline / existing distribution network 15,000 3
22 Water from Wivenhoe / Toowoomba pipeline / new distribution network 15,000 3
23 Water from Wivenhoe / new distribution network / no irrigation dams 50,000 5
24 WCRWS PRW / irrigation dams / new distribution network 50,000 5
25 WCRWS PRW / pipe to farm 50,000 5
26 WCRWS PRW / managed aquifer recharge 50,000 5

80 Not Government Policy
Option number
Option description Additional water (ML)
Score
27 WCRWS A+ water / irrigation dams / new distribution network / direct / direct potable reuse
50,000 5
28 WCRWS A+ water / pipe to farm / direct potable reuse 50,000 5
29 WCRWS A+ water / existing distribution network / direct potable reuse 50,000 5
30 Deep aquifer 1,274 1
31 WCRWS PRW / irrigation dams / new distribution network / post recommissioning 50,000 5
32 WCRWS PRW / pipe to farm / post recommissioning 50,000 5
33 WCRWS PRW / managed aquifer recharge / post recommissioning 50,000 5
34 WCRWS A+ water / irrigation dams / new distribution network / direct / direct potable reuse / post recommissioning
50,000 5
35 WCRWS A+ water / pipe to farm / direct potable reuse / post recommissioning 50,000 5
36 WCRWS A+ water / managed aquifer recharge / direct potable reuse / post recommissioning
50,000 5
37 QUU A+ / irrigation dams / new distribution network 11,000 3
38 QUU A+ / pipe to farm 11,000 3
39 QUU A+ / managed aquifer recharge 11,000 3
12.3 Average reliability
The different water products can have different reliability. For the purpose of this assessment, we have
estimated the long-term average reliability (Table 12.5).
The reliability takes into account the reliability of the source of water and the amount of water lost during
delivery. For example, the desalination option has a reliability of 100 per cent, as it is not dependent on climate.
Also, the use of the existing distribution networks (as opposed to constructing a new piped network) impacts the
reliability. For example, the use of the existing managed aquifer recharge is less reliable than a new pipe due to
the losses with the aquifer.
Table 12.5 : Average reliability
Option number
Option description Average availability
(%)
Score
1 Supply chain improvements NA 0
2 On-farm initiatives NA 0
3 Market opportunities study NA 0
4 Industry/policy coordination review NA 0
5 Public/private agribusiness development NA 0
6 Water trading 50% 2
7 Increase diversion capacity 50% 2
8 Weir and channel improvements 80% 4
9 New weirs 80% 4
10 Inter-catchment transfer 80% 4
11 Public/private research investment NA 0
12 Local recycled water 100% 5
13 Saline water use 80% 4
14 Greywater reuse 100% 5
15 On-farm irrigation efficiency 65% 3
16 Desalination on coast 100% 5
17 Wivenhoe flood harvesting / new trunk main / fill irrigation dams / existing distribution network 6% 0
18 Wivenhoe flood harvesting / new trunk main / fill irrigation dams / new distribution network 6% 0
19 Water from Wivenhoe / new trunk main / new distribution network 66% 3
20 Water from Wivenhoe / new trunk main / existing distribution network 33% 1
21 Water from Wivenhoe / Toowoomba pipeline / existing distribution network 33% 1
22 Water from Wivenhoe / Toowoomba pipeline / new distribution network 66% 3
23 Water from Wivenhoe / new distribution network / no irrigation dams 66% 3
24 WCRWS PRW / irrigation dams / new distribution network 70% 3
25 WCRWS PRW / pipe to farm 66% 3
26 WCRWS PRW / managed aquifer recharge 33% 1
27 WCRWS A+ water / irrigation dams / new distribution network / direct / direct potable reuse 70% 3

81 Not Government Policy
Option number
Option description Average availability
(%)
Score
28 WCRWS A+ water / pipe to farm / direct potable reuse 66% 3
29 WCRWS A+ water / existing distribution network / direct potable reuse 33% 1
30 Deep aquifer 80% 4
31 WCRWS PRW / irrigation dams / new distribution network / post recommissioning 70% 3
32 WCRWS PRW / pipe to farm / post recommissioning 66% 3
33 WCRWS PRW / managed aquifer recharge / post recommissioning 33% 1
34 WCRWS A+ water / irrigation dams / new distribution network / direct / direct potable reuse / post recommissioning 70% 3
35 WCRWS A+ water / pipe to farm / direct potable reuse / post recommissioning 66% 3
36 WCRWS A+ water / managed aquifer recharge / direct potable reuse / post recommissioning 33% 1
37 QUU A+ / irrigation dams / new distribution network 100% 5
38 QUU A+ / pipe to farm 100% 5
39 QUU A+ / Managed aquifer recharge 50% 2
12.4 Stakeholder support
There are many stakeholders and it is important to determine their views and incorporate that into the
assessment. The stakeholders used in this assessment is principally the PWG (and other key growers), as they
represent a fairly broad range of potential users of the water. The level of stakeholder support is shown in Table
12.6.
Table 12.6 : Stakeholder support
Option number
Option description Stakeholder support Score
1 Supply chain improvements Support from all stakeholders 3
2 On-farm initiatives Very high support from all stakeholders 5
3 Market opportunities study Very high support from all stakeholders 5
4 Industry/policy coordination review Very high support from all stakeholders 5
5 Public/private agribusiness development Support from all stakeholders 3
6 Water trading Support from all stakeholders 3
7 Increase diversion capacity Support from all stakeholders 3
8 Weir and channel improvements Support from all stakeholders 3
9 New weirs Indifference / mix of support and
opposition 2
10 Inter-catchment transfer Indifference / mix of support and
opposition 2
11 Public/private research investment Very high support from all stakeholders 5
12 Local recycled water Indifference / mix of support and
opposition 2
13 Saline water use Indifference / mix of support and
opposition 2
14 Greywater reuse Indifference / mix of support and
opposition 2
15 On-farm irrigation efficiency Very high support from all stakeholders 5
16 Desalination on coast Stakeholders oppose 1
17 Wivenhoe flood harvesting / new trunk main / fill irrigation dams /
existing distribution network Very high support from all stakeholders 5
18 Wivenhoe flood harvesting / new trunk main / fill irrigation dams /
new distribution network Very high support from all stakeholders 5
19 Water from Wivenhoe / new trunk main / new distribution network Very high support from all stakeholders 5
20 Water from Wivenhoe / new trunk main / existing distribution
network Very high support from all stakeholders 5
21 Water from Wivenhoe / Toowoomba pipeline / existing distribution
network Very high support from all stakeholders 5

82 Not Government Policy
Option number
Option description Stakeholder support Score
22 Water from Wivenhoe / Toowoomba pipeline / new distribution
network Very high support from all stakeholders 5
23 Water from Wivenhoe / new distribution network / no irrigation
dams High support from all stakeholders 4
24 WCRWS PRW / irrigation dams / new distribution network High support from all stakeholders 4
25 WCRWS PRW / pipe to farm Support from all stakeholders 3
26 WCRWS PRW / managed aquifer recharge Indifference / mix of support and
opposition 2
27 WCRWS A+ water / irrigation dams / new distribution network /
direct / direct potable reuse High support from all stakeholders 4
28 WCRWS A+ water / pipe to farm / direct potable reuse Support from all stakeholders 3
29 WCRWS A+ water / existing distribution network / direct potable
reuse
Indifference / mix of support and
opposition 2
30 Deep aquifer Support from all stakeholders 3
31 WCRWS PRW / irrigation dams / new distribution network / post
recommissioning High support from all stakeholders 4
32 WCRWS PRW / pipe to farm / post recommissioning Support from all stakeholders 3
33 WCRWS PRW / managed aquifer recharge / post
recommissioning
Indifference / mix of support and
opposition 2
34 WCRWS A+ water / irrigation dams / new distribution network /
direct / direct potable reuse / post recommissioning High support from all stakeholders 4
35 WCRWS A+ water / pipe to farm / direct potable reuse / post
recommissioning Support from all stakeholders 3
36 WCRWS A+ water / managed aquifer recharge / direct potable
reuse / post recommissioning
Indifference / mix of support and
opposition 2
37 QUU A+ / irrigation dams / new distribution network High support from all stakeholders 4
38 QUU A+ / pipe to farm Support from all stakeholders 3
39 QUU A+ / managed aquifer recharge Indifference / mix of support and
opposition 2
12.5 Technical feasibility
For an option to be viable, it needs to be technically feasible from an engineering, environmental, legal and
regulatory perspective. An overall assessment has been undertaken (Table 12.7).
Table 12.7 : Technical feasibility
Option number
Option description Technical feasibility Score
1 Supply chain improvements Moderate—some problems 3
2 On-farm initiatives Moderate—some problems 3
3 Market opportunities study Simple—no material problems 5
4 Industry/policy coordination review Easy—few problems 4
5 Public/private agribusiness development Moderate—some problems 3
6 Water trading Easy—few problems 4
7 Increase diversion capacity Moderate—some problems 3
8 Weir and channel improvements Easy—few problems 4
9 New weirs Moderate—some problems 3
10 Inter-catchment transfer Hard—many problems to overcome across disciplines 1
11 Public/private research investment Easy—few problems 4

83 Not Government Policy
Option number
Option description Technical feasibility Score
12 Local recycled water Moderate—some problems 3
13 Saline water use Moderate—some problems 3
14 Greywater reuse Easy—few problems 4
15 On-farm irrigation efficiency Easy—few problems 4
16 Desalination on coast Hard—many problems to overcome across disciplines 1
17 Wivenhoe flood harvesting / new trunk main / fill irrigation dams / existing distribution network
Difficult—many problems to overcome across a discipline 2
18 Wivenhoe flood harvesting / new trunk main / fill irrigation dams / new distribution network
Difficult—many problems to overcome across a discipline 2
19 Water from Wivenhoe / new trunk main / new distribution network Easy—few problems 4
20 Water from Wivenhoe / new trunk main / existing distribution network Easy—few problems 4
21 Water from Wivenhoe / Toowoomba pipeline / existing distribution network Moderate—some problems 3
22 Water from Wivenhoe / Toowoomba pipeline / new distribution network Moderate—some problems 3
23 Water from Wivenhoe / new distribution network / no irrigation dams Easy—few problems 4
24 WCRWS PRW / irrigation dams / new distribution network Moderate—some problems 3
25 WCRWS PRW / pipe to farm Difficult—many problems to overcome across a discipline 2
26 WCRWS PRW / managed aquifer recharge Moderate—some problems 3
27 WCRWS A+ water / irrigation dams / new distribution network / direct / direct potable reuse Moderate—some problems 3
28 WCRWS A+ water / pipe to farm / direct potable reuse Difficult—many problems to overcome across a discipline 2
29 WCRWS A+ water / existing distribution network / direct potable reuse Moderate—some problems 3
30 Deep Aquifer Difficult—many problems to overcome across a discipline 2
31 WCRWS PRW / irrigation dams / new distribution network / post recommissioning Moderate—some problems 3
32 WCRWS PRW / pipe to farm / post recommissioning Difficult—many problems to overcome across a discipline 2
33 WCRWS PRW / managed aquifer recharge / post recommissioning Moderate—some problems 3
34 WCRWS A+ water / irrigation dams / new distribution network / direct / direct potable reuse / post recommissioning Moderate—some problems 3
35 WCRWS A+ water / pipe to farm / direct potable reuse / post recommissioning
Difficult—many problems to overcome across a discipline 2
36 WCRWS A+ water / managed aquifer recharge / direct potable reuse / post recommissioning Moderate—problems 3
37 QUU A+ / irrigation dams / new distribution network Moderate—some problems 3
38 QUU A+ / pipe to farm Difficult—many problems to overcome across a discipline 2
39 QUU A+ / managed aquifer recharge Moderate—some problems 3

84 Not Government Policy
12.6 Strategic considerations and state agencies’ support including competing interests
The role of the state is to balance the competing interests and make decisions in the interests of everyone.
Taking the competing factors into account, the alignment of each option with the state’s strategic considerations
was scored (Table 12.8).
Table 12.8 :Strategic considerations
Option number
Option description Strategic considerations
Score
1 Supply chain improvements Fully consistent 5
2 On-farm initiatives Fully consistent 5
3 Market opportunities study Fully consistent 5
4 Industry/policy coordination review Fully consistent 5
5 Public/private agribusiness development Fully consistent 5
6 Water trading Fully consistent 5
7 Increase diversion capacity Fully consistent 5
8 Weir and channel improvements Some inconsistency 2
9 New weirs Some inconsistency 2
10 Inter-catchment transfer Some inconsistency 2
11 Public/private research investment Fully consistent 5
12 Local recycled water Fully consistent 5
13 Saline water use Fully consistent 5
14 Greywater reuse Fully consistent 5
15 On-farm irrigation efficiency Fully consistent 5
16 Desalination on coast Mainly inconsistent 1
17 Wivenhoe flood harvesting / new trunk main / fill irrigation dams / existing distribution network Fully consistent 5
18 Wivenhoe flood harvesting / new trunk main / fill irrigation dams / new distribution network Fully consistent 5
19 Water from Wivenhoe / new trunk main / new distribution network Fully consistent 5
20 Water from Wivenhoe / new trunk main / existing distribution network Fully consistent 5
21 Water from Wivenhoe / Toowoomba pipeline / existing distribution network Fully consistent 5
22 Water from Wivenhoe / Toowoomba pipeline / new distribution network Fully consistent 5
23 Water from Wivenhoe / new distribution network / no irrigation dams Fully consistent 5
24 WCRWS PRW / irrigation dams / new distribution network Fully consistent 5
25 WCRWS PRW / pipe to farm Fully consistent 5
26 WCRWS PRW / managed aquifer recharge Fully consistent 5
27 WCRWS A+ water / irrigation dams / new distribution network / direct / direct potable reuse Mainly inconsistent 1
28 WCRWS A+ water / pipe to farm / direct potable reuse Mainly inconsistent 1
29 WCRWS A+ water / existing distribution network / direct potable reuse Mainly inconsistent 1
30 Deep aquifer Some inconsistency 2
31 WCRWS PRW / irrigation dams / new distribution network / post recommissioning Fully consistent 5
32 WCRWS PRW / pipe to farm / post recommissioning Fully consistent 5
33 WCRWS PRW / managed aquifer recharge / post recommissioning Fully consistent 5
34 WCRWS A+ water / irrigation dams / new distribution network / direct / direct potable reuse / post recommissioning Mainly inconsistent 1
35 WCRWS A+ water / pipe to farm / direct potable reuse / post recommissioning Mainly inconsistent 1
36 WCRWS A+ water / managed aquifer recharge / direct potable reuse / post recommissioning Mainly inconsistent 1
37 QUU A+ / irrigation dams / new distribution network Mainly inconsistent 1
38 QUU A+ / pipe to farm Mainly inconsistent 1
39 QUU A+ / managed aquifer recharge Mainly inconsistent 1
12.7 Levelised costs and capacity to pay
The levelised cost of each option represents the annual amount that would need to be paid per megalitre per
year to recover the identified upfront capex and ongoing opex calculated over 30 years is shown in Table 12.9.
Table 12.9 : Levelised costs
Option number
Option description Levelised cost ($/ML)
Multicriteria analysis score
1 Supply chain improvements – 5
2 On-farm initiatives – 5

85 Not Government Policy
Option number
Option description Levelised cost ($/ML)
Multicriteria analysis score
3 Market opportunities study – 5
4 Industry/policy coordination review – 5
5 Public/private agribusiness development – 5
6 Water trading 4 5
7 Increase diversion capacity 361 4
8 Weir and channel improvements 1,129 1
9 New weirs 3,143 0
10 Inter-catchment transfer 2,880 1
11 Public/private research investment – 5
12 Local recycled water 1,440 1
13 Saline water use 6,877 0
14 Greywater reuse 1,617 1
15 On-farm irrigation efficiency 966 2
16 Desalination on coast 3,209 0
17 Wivenhoe flood harvesting / new trunk main / fill irrigation dams / existing distribution network
2,907 1
18 Wivenhoe flood harvesting / new trunk main / fill irrigation dams / new distribution network
4,346 0
19 Water from Wivenhoe / new trunk main / new distribution network 443 3
20 Water from Wivenhoe / new trunk main / existing distribution network 695 2
21 Water from Wivenhoe / Toowoomba pipeline / existing distribution network 2,302 1
22 Water from Wivenhoe / Toowoomba pipeline / new distribution network 1,558 1
23 Water from Wivenhoe / new distribution network / no irrigation dams 470 3
24 WCRWS PRW / irrigation dams / new distribution network 2,722 1
25 WCRWS PRW / pipe to farm 2,887 1
26 WCRWS PRW / managed aquifer recharge 5,536 0
27 WCRWS A+ water / irrigation dams / new distribution network / direct / direct potable reuse
2,285 1
28 WCRWS A+ water / pipe to farm / direct potable reuse 2,424 1
29 WCRWS A+ water / existing distribution network / direct potable reuse 4,610 0
30 Deep aquifer 335 4
31 WCRWS PRW / irrigation dams / new distribution network / post recommissioning
2,128 1
32 WCRWS PRW / pipe to farm / post recommissioning 2,257 1
33 WCRWS PRW / managed aquifer recharge / post recommissioning 4,277 0
34 WCRWS A+ water / irrigation dams / new distribution network / direct / direct potable reuse / post recommissioning
1,692 1
35 WCRWS A+ water / pipe to farm / direct potable reuse / post recommissioning
1,795 1
36 WCRWS A+ water / managed aquifer recharge / direct potable reuse / post recommissioning
3,352 0
37 QUU A+ / irrigation dams / new distribution network 1,625 1
38 QUU A+ / pipe to farm 1,625 1
39 QUU A+ / managed aquifer recharge 1,977 1
12.8 Economic net present value
An economic NPV determines whether the benefits of a project are greater than the costs. Full details are
shown in Appendix A. Similar to the capex estimates, the present value of costs and benefits are subject to
significant uncertainty in this stage of the assessment. However, for the purpose of ranking, we have
established a high-level assessment of benefits and costs. This is considered to be acceptable for the purpose
of relative rankings for the SBC. A more detailed assessment is described for shortlisted options in Chapter 13.
The economic benefits include additional agricultural production, avoided environmental abatement costs,
recreational and tourism benefits.
The economic costs include upfront capex and the NPV of opex (Table 12.10).

86 Not Government Policy
Table 12.10 : Economic net present value
Option number
Option description Score
1 Supply chain improvements 2
2 On-farm initiatives 2
3 Market opportunities study 2
4 Industry/policy coordination review 2
5 Public/private agribusiness development 2
6 Water trading 3
7 Increase diversion capacity 3
8 Weir and channel improvements 3
9 New weirs 2
10 Inter-catchment transfer 1
11 Public/private research investment 2
12 Local recycled water 3
13 Saline water use 2
14 Greywater reuse 3
15 On-farm irrigation efficiency 3
16 Desalination on coast 0
17 Wivenhoe flood harvesting / new trunk main / fill irrigation dams / existing distribution network 2
18 Wivenhoe flood harvesting / new trunk main / fill irrigation dams / new distribution network 2
19 Water from Wivenhoe / new trunk main / new distribution network 5
20 Water from Wivenhoe / new trunk main / existing distribution network 4
21 Water from Wivenhoe / Toowoomba pipeline / existing distribution network 3
22 Water from Wivenhoe / Toowoomba pipeline / new distribution network 3
23 Water from Wivenhoe / new distribution network / no irrigation dams 5
24 WCRWS PRW / irrigation dams / new distribution network 3
25 WCRWS PRW / pipe to farm 3
26 WCRWS PRW / managed aquifer recharge 0
27 WCRWS A+ water / irrigation dams / new distribution network / direct / direct potable reuse 4
28 WCRWS A+ water / pipe to farm / direct potable reuse 3
29 WCRWS A+ water / existing distribution network / direct potable reuse 0
30 Deep aquifer 3
31 WCRWS PRW / irrigation dams / new distribution network / post recommissioning 4
32 WCRWS PRW / pipe to farm / post recommissioning 4
33 WCRWS PRW / managed aquifer recharge / post recommissioning 0
34 WCRWS A+ water / irrigation dams / new distribution network / direct / direct potable reuse / post recommissioning 4
35 WCRWS A+ water / pipe to farm / direct potable reuse / post recommissioning 4
36 WCRWS A+ water / managed aquifer recharge / direct potable reuse / post recommissioning 1
37 QUU A+ / irrigation dams / new distribution network 3
38 QUU A+ / pipe to farm 3
39 QUU A+ / managed aquifer recharge 3
12.9 Financial net present value
The financial NPV estimates the profitability of the option. As for the economic net present value, the present
value of costs and benefits are subject to significant uncertainty in this stage of the assessment. It is
acknowledged that the net present value uses capital costs, operating costs, water volume and reliability as
inputs, which are assessment criteria in their own right.
For the purpose of this high-level assessment, we have assumed that irrigators would pay $4,000/ML, with an
annual ongoing charge of $400/ML. These amounts do not seek to show an estimate of an irrigators capacity to
pay, but rather are used simply for relative ranking purposes only for the SBC. The results are shown in Table
12.11.
Table 12.11 : Financial net present value
Option number
Option description Score
1 Supply chain improvements 2
2 On-farm initiatives 2
3 Market opportunities study 2
4 Industry/policy coordination review 2
5 Public/private agribusiness development 2
6 Water trading 4
7 Increase diversion capacity 3

87 Not Government Policy
Option number
Option description Score
8 Weir and channel improvements 2
9 New weirs 2
10 Inter-catchment transfer 0
11 Public/private research investment 2
12 Local recycled water 1
13 Saline water use 1
14 Greywater reuse 1
15 On-farm irrigation efficiency 2
16 Desalination on coast 0
17 Wivenhoe flood harvesting / new trunk main / fill irrigation dams / existing distribution network 1
18 Wivenhoe flood harvesting / new trunk main / fill irrigation dams / new distribution network 1
19 Water from Wivenhoe / new trunk main / new distribution network 5
20 Water from Wivenhoe / new trunk main / existing distribution network 3
21 Water from Wivenhoe / Toowoomba pipeline / existing distribution network 1
22 Water from Wivenhoe / Toowoomba pipeline / new distribution network 1
23 Water from Wivenhoe / new distribution network / no irrigation dams 5
24 WCRWS PRW / irrigation dams / new distribution network 0
25 WCRWS PRW / pipe to farm 0
26 WCRWS PRW / managed aquifer recharge 0
27 WCRWS A+ water / irrigation dams / new distribution network / direct / direct potable reuse 0
28 WCRWS A+ water / pipe to farm / direct potable reuse 0
29 WCRWS A+ water / existing distribution network / direct potable reuse 0
30 Deep Aquifer 3
31 WCRWS PRW / irrigation dams / new distribution network / post recommissioning 0
32 WCRWS PRW / pipe to farm / post recommissioning 0
33 WCRWS PRW / managed aquifer recharge / post recommissioning 0
34 WCRWS A+ water / irrigation dams / new distribution network / direct / direct potable reuse / post recommissioning 0
35 WCRWS A+ water / pipe to farm / direct potable reuse / post recommissioning 0
36 WCRWS A+ water / managed aquifer recharge / direct potable reuse / post recommissioning 0
37 QUU A+ / irrigation dams / new distribution network 1
38 QUU A+ / pipe to farm 1
39 QUU A+ / managed aquifer recharge 1
12.10 Summary of longlist assessment
The results of these assessment are provided in the ranked longlist in Figure 11.1 and Figure 11.2. The options
that best meet the agreed criteria achieve the best scores and are ranked more highly that options that do not
achieve the assessment criteria as well.
This section provides relativity for further analysis. A multicriteria analysis output alone should not be relied on
to determine a shortlist. Further, some caution needs to be applied, as options may just fall to one side of
several assessment criteria. Accordingly, sensitivity analysis was undertaken to ensure that the ranked longlist
is robust, and that a material re-ordering does not occur if the criteria cut-offs are moved.

88 Not Government Policy
Figure 11.1: Ranked longlist
- 0.5 1.0 1.5 2.0 2.5 3.0 3.5 4.0 4.5
Desalination on coast
WCRWS A+ water / Existing distribution network / direct potable reuse
WCRWS PRW / Managed Aquifer Recharge
WCRWS A+ water / Managed Aquifer Recharge / direct potable reuse / post recommissioning
Inter-catchment transfer
WCRWS A+ water / pipe to farm / direct potable reuse
WCRWS PRW / Managed Aquifer Recharge / post recommissioning
QUU A+ / Managed Aquifer Recharge
New weirs
QUU A+ / pipe to farm
WCRWS A+ water / pipe to farm / direct potable reuse / post recommissioning
Wivenhoe flood harvesting / new trunk main / fill irrigation dams / new distribution network
WCRWS A+ water / irrigation dams / new distribution network / direct / direct potable reuse
WCRWS PRW / pipe to farm
Saline water use
QUU A+ / irrigation dams / new distribution network
Wivenhoe flood harvesting / new trunk main / fill irrigation dams / existing distribution…
WCRWS A+ water / irrigation dams / new distribution network / direct / direct potable reuse…
WCRWS PRW / irrigation dams / new distribution network
WCRWS PRW / pipe to farm / post recommissioning
Water from Wivenhoe / Toowoomba pipeline / existing distribution network
Local recycled water
Water from Wivenhoe / Toowoomba pipeline / new distribution network
Weir and channel improvements
Greywater reuse
WCRWS PRW / irrigation dams / new distribution network / post recommissioning
Public/private agribusiness development
Supply chain improvements
Deep Aquifer
On-farm initiatives
Industry/policy coordination review
Public/private research investment
On-farm irrigation efficiency
Increase diversion capacity
Market opportunities study
Water from Wivenhoe / new trunk main / existing distribution network
Water trading
Water from Wivenhoe / new distribution network / no irrigation dams
Water from Wivenhoe / new trunk main / new distribution networkFinancial NetPresent Value ($million)
Economic NetPresent Value ($million)
Capital cost ($million)
Stakeholdersupport
Additional water
Technical feasibility
Levelized costs andcapacity to pay
Average availability
Strategicconsiderations andState agenciessupport includingcompeting interests

89 Not Government Policy
Figure 11.2: Ranked longlist
- 0.50 1.00 1.50 2.00 2.50 3.00 3.50 4.00 4.50
16 - Desalination on coast29 - WCRWS A+ water / Existing distribution network / direct potable reuse
26 - WCRWS PRW / Managed Aquifer Recharge36 - WCRWS A+ water / Managed Aquifer Recharge / direct potable reuse / post…
10 - Inter-catchment transfer28 - WCRWS A+ water / pipe to farm / direct potable reuse
33 - WCRWS PRW / Managed Aquifer Recharge / post recommissioning39 - QUU A+ / Managed Aquifer Recharge
9 - New weirs38 - QUU A+ / pipe to farm
35 - WCRWS A+ water / pipe to farm / direct potable reuse / post recommissioning18 - Wivenhoe flood harvesting / new trunk main / fill irrigation dams / new distribution…
27 - WCRWS A+ water / irrigation dams / new distribution network / direct / direct potable…25 - WCRWS PRW / pipe to farm
13 - Saline water use37 - QUU A+ / irrigation dams / new distribution network
17 - Wivenhoe flood harvesting / new trunk main / fill irrigation dams / existing distribution…34 - WCRWS A+ water / irrigation dams / new distribution network / direct / direct potable…
24 - WCRWS PRW / irrigation dams / new distribution network32 - WCRWS PRW / pipe to farm / post recommissioning
21 - Water from Wivenhoe / Toowoomba pipeline / existing distribution network12 - Local recycled water
22 - Water from Wivenhoe / Toowoomba pipeline / new distribution network8 - Weir and channel improvements
14 - Greywater reuse31 - WCRWS PRW / irrigation dams / new distribution network / post recommissioning
5 - Public/private agribusiness development1 - Supply chain improvements
30 - Deep Aquifer2 - On-farm initiatives
4 - Industry/policy coordination review11 - Public/private research investment
15 - On-farm irrigation efficiency7 - Increase diversion capacity
3 - Market opportunities study20 - Water from Wivenhoe / new trunk main / existing distribution network
6 - Water trading23 - Water from Wivenhoe / new distribution network / no irrigation dams
19 - Water from Wivenhoe / new trunk main / new distribution network
Policy/coordination
Seqwater
Private sector
Flood harvesting from Wivenhoe
Access from Wivenhoe
Source from WCRWS

90 Not Government Policy
12.11 Sensitivity analysis
An important step to verify the ranking is to undertake sensitivity analysis. This process tests the robustness of
the original rankings and can confirm that the original ranking is sound, and not prone to material changes with
a variation to the quantitative cut-offs.
To test whether changing the cut-offs for the assessment criteria materially changes the ranking, sensitivity
analysis of the quantitative criteria (i.e. capital cost, additional water, volume of water, Economic NPV and
Financial NPV) has been undertaken (see Table 12.2).
The ranks were recalculated for an additional eight model runs after varying the cut-offs by +/- 5 per cent, 10 per
cent, 20 per cent and 50 per cent.
The black dots show the original ranking. Additional dots then show the new ranking after the cut-offs have
been altered. The smaller the vertical spread of dots, the less sensitive an option is to changes in the
quantitative cut offs.
This analysis shows that most of the options only vary a few places, even when the quantitative cut offs are
varied by +/- 50 per cent. Importantly, the top ten options exhibit low levels of variability, providing confidence
that the rankings are robust. No mid-ranked options materially improve under this sensitivity testing. This
means that none of these options significantly improve their ranking, even when cut offs are significantly
changed.

91 Not Government Policy
Figure 11.3: Outcomes of sensitivity analysis

92 Not Government Policy
13. Option/s for further development
13.1 Program of other new complementary options and Existing Options (Base Case)
This business case has identified a number of initiatives that should be pursued. Individually, they may have a
small impact. However, collectively they could substantially address the identified service need.
It is recommended that these options be pursued by the identified government agency, parallel to a detailed
business case framework. Depending on timing, some of these initiatives may form the base case of a future
detailed business case (Table 13.1)
Table 13.1 : Program of other new complementary options
Option Description Proposed
Coordinator
Proposed
collaborators
Scope of works* Timeline Benefits
On-farm
initiatives
(Option 2)
Promoting Best
Management
Practice within
the irrigation
industry.
Lockyer
Valley and
Somerset
Water
Collaborative
• Lockyer
Valley
Growers,
Growcom,
Ausveg,
Horticulture
Innovation
Australia,
DAF
• Promote and
implement initiatives
that aim to maximise
efficient and
sustainable on-farm
water management,
farm operations and
agricultural production
in the Lockyer Valley.
• Utilise the intelligence
from the collaborative
project with Growcom
to target future
investment.
• Utilise research and
projects from other
international regions
(eg. UAE) to assist in
providing advice
regarding water use,
management and re-
use for best
horticultural
productive outcomes.
• Encourage production
stocktake
assessments and
encourage (through
incentives and
business
development
opportunities) new
innovative farming
practices (particularly
on marginal land)
including intensified
greenhouse
opportunities.
Ongoing A more
efficient
agricultural
sector that
implements
informed BMP
decisions.
Confidence
that all parties
are working
collaboratively
for the same
end goal.
Industry /
policy
coordination
One group
(rather than two
separate groups)
DAF • DPC,
DESBT,
DNRME,
• Stakeholder
review/evaluation of
the effectiveness and
1 year Allows for
industry and
government
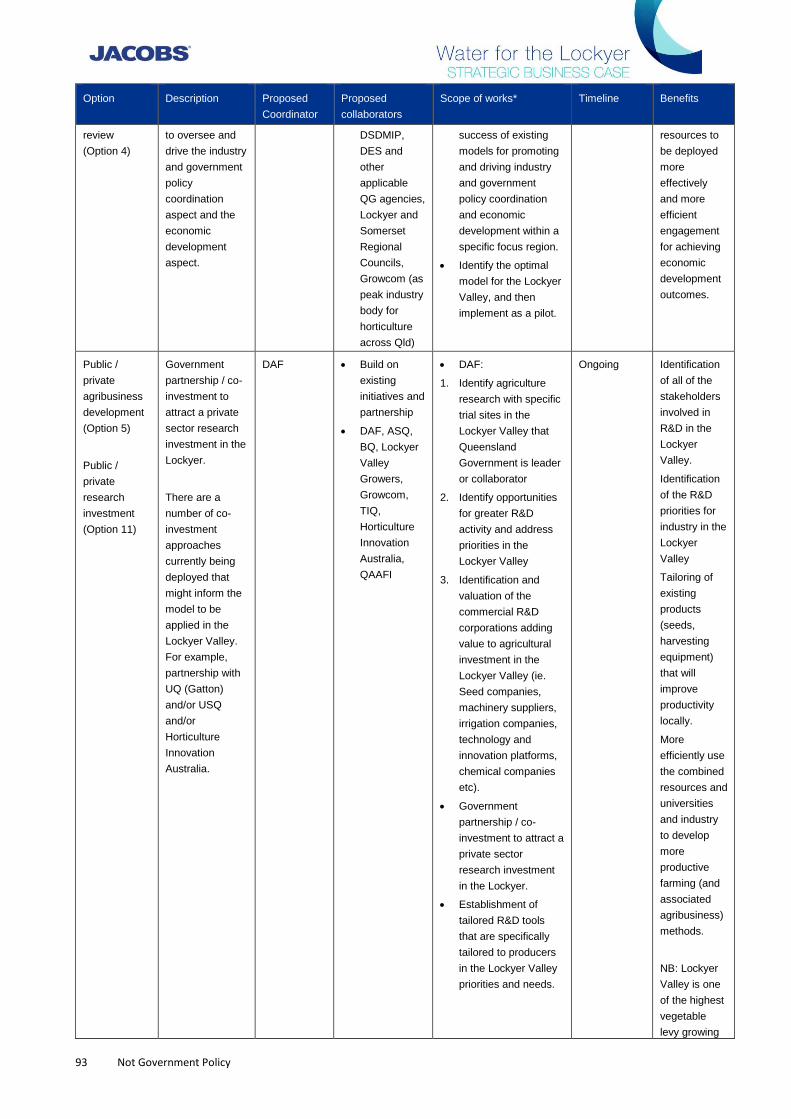
93 Not Government Policy
Option Description Proposed
Coordinator
Proposed
collaborators
Scope of works* Timeline Benefits
review
(Option 4)
to oversee and
drive the industry
and government
policy
coordination
aspect and the
economic
development
aspect.
DSDMIP,
DES and
other
applicable
QG agencies,
Lockyer and
Somerset
Regional
Councils,
Growcom (as
peak industry
body for
horticulture
across Qld)
success of existing
models for promoting
and driving industry
and government
policy coordination
and economic
development within a
specific focus region.
• Identify the optimal
model for the Lockyer
Valley, and then
implement as a pilot.
resources to
be deployed
more
effectively
and more
efficient
engagement
for achieving
economic
development
outcomes.
Public /
private
agribusiness
development
(Option 5)
Public /
private
research
investment
(Option 11)
Government
partnership / co-
investment to
attract a private
sector research
investment in the
Lockyer.
There are a
number of co-
investment
approaches
currently being
deployed that
might inform the
model to be
applied in the
Lockyer Valley.
For example,
partnership with
UQ (Gatton)
and/or USQ
and/or
Horticulture
Innovation
Australia.
DAF
• Build on
existing
initiatives and
partnership
• DAF, ASQ,
BQ, Lockyer
Valley
Growers,
Growcom,
TIQ,
Horticulture
Innovation
Australia,
QAAFI
• DAF:
1. Identify agriculture
research with specific
trial sites in the
Lockyer Valley that
Queensland
Government is leader
or collaborator
2. Identify opportunities
for greater R&D
activity and address
priorities in the
Lockyer Valley
3. Identification and
valuation of the
commercial R&D
corporations adding
value to agricultural
investment in the
Lockyer Valley (ie.
Seed companies,
machinery suppliers,
irrigation companies,
technology and
innovation platforms,
chemical companies
etc).
• Government
partnership / co-
investment to attract a
private sector
research investment
in the Lockyer.
• Establishment of
tailored R&D tools
that are specifically
tailored to producers
in the Lockyer Valley
priorities and needs.
Ongoing Identification
of all of the
stakeholders
involved in
R&D in the
Lockyer
Valley.
Identification
of the R&D
priorities for
industry in the
Lockyer
Valley
Tailoring of
existing
products
(seeds,
harvesting
equipment)
that will
improve
productivity
locally.
More
efficiently use
the combined
resources and
universities
and industry
to develop
more
productive
farming (and
associated
agribusiness)
methods.
NB: Lockyer
Valley is one
of the highest
vegetable
levy growing

94 Not Government Policy
Option Description Proposed
Coordinator
Proposed
collaborators
Scope of works* Timeline Benefits
regions in
Australia
Deep aquifer
investigation
(Option 30)
Access deep
artesian water by
drilling allowed
under the Great
Artesian Basin
and Other
Regional
Aquifers Water
Plan.
Private Individuals or enterprise
may wish to commission
drilling in their own
farm/area of interest.
Ongoing Additional
water supply
*Scope of works may need to be further investigated by proposed coordinator
13.2 Existing options
A number of the identified options have already commenced, or related investigations have commenced. It is
appropriate that these investigations continue. However, the options were not included in the shortlist, as they
already have a process to implement them (Table 13.2).
Table 13.2 :Existing options—projects already underway
Option Description Lead/Proposed
Coordinator
Scope of works Timeline Benefit
Supply chain
improvements
(Option 1)
Develop a supply
value chain for the
region and address
supply chain gaps
and constraints.
Lockyer Valley
Regional
Council
• Undertake a consultancy study to
examine, describe and quantify
any impediments in the supply
chain to meet new markets, with a
focus on meeting domestic
consumer expectations (more
processed vegetables) and export
markets.
• Once identified, propose activities
and solutions to overcome
impediments.
1 year Allows for
government
resources to be
deployed more
effectively.
Allow for
additional
support to train
producers in
meeting market
expectations
including
domestic and
export markets.
Engages whole
supply chain in
the project, not
just water users/
horticultural
producers.
Market
opportunities
study (Option 3)
Identifying the
regional, state and
national market
implications of the
Lockyer growing its
production in the
future. Plus,
development of
export markets.
Lockyer Valley
Regional
Council
• Undertake a consultancy study to
examine, describe and quantify
whether there is domestic and
international demand for additional
agricultural produce. Examine
both existing and potential crops
(including food and nursery crops)
• Identify current and emerging
consumer trends both domestically
and internationally
1 year Provides
investment
certainty for
irrigators and
Government by
determining
whether a market
exists for
additional
agriculture
produce.

95 Not Government Policy
Option Description Lead/Proposed
Coordinator
Scope of works Timeline Benefit
• Identify the likely catalysts for, and
impediments to, meeting the
additional demand.
Utilise intelligence from existing
studies including those from northern
Australia, previous DAF funded
projects (USQ/ Deloitte), DAF research
(ASQ/RED), Horticulture Innovation
Australia, Ausveg and Lockyer Valley
Growers Inc whom have all
implemented market development
projects in the last five years.
Consultation to include DESBT
Ensures that
duplication of
activity is
reduced.
Ensures that
studies are
utilised
effectively
Water trading
(Option 6) –
upon finalisation
of Moreton
Water Plan
amendment
Improve
mechanisms to
allow (or
encourage) water
trading.
DNRME • A new draft water plan package
was released on 14 August 2019
for public consultation.
• Finalisation of the draft water plan
amendment is scheduled for end
of 2019, and the remainder of the
planning instruments in early 2020.
• When finalised, the water plan
amendment will provide the
framework for determining
volumetric limits on groundwater
allocations.
September
–December
2019
Allows the
conversion of
water
entitlements to
tradeable
allocations which
drives efficient
and effective
water use.
On-farm
irrigation
efficiency
(Option 15) –
impending work
by Growcom
Improve on-farm
irrigation efficiency.
Lockyer Valley
and Somerset
Water
Collaborative
Assess the spatial extent of irrigated
agriculture in the Lockyer, current
irrigation water use and management
practices, wider market, environmental
trends influencing industry, analyse
water use efficiency and opportunities
for improvements.
9 months To work directly
with irrigators to
increase water
efficiency in
agricultural
industries
Increase
diversion
capacity (Option
7) –
investigation by
Seqwater
Seqwater to
investigate whether
pump/channel
capacity can be
increased to better
utilise the off-
stream storages.
Seqwater • Seqwater has engaged a specialist
consultant to prepare a list of
capital infrastructure investment
options, related to the upgrade of
existing diversion infrastructure, to
improve water harvesting
performance in the Central
Lockyer. They have identified a
number of potential capital
improvement projects that could
improve water harvesting
capacity. On the basis of
estimated costs and benefits they
have recommended two projects
for further investigation through the
development of a detailed
business case. Any costs
associated with these projects will
be considered by the QCA as part
of the next price path review.
• Subject to the finalisation of
Seqwater’s review, there may be a
need to adjust the rules by which
2-5 years Increased water
supply and
improved
reliability

96 Not Government Policy
Option Description Lead/Proposed
Coordinator
Scope of works Timeline Benefit
the water may be taken within the
relevant water planning
instruments.
Weir and
channel
improvements
(Option 8)
Seqwater • Seqwater is currently developing a
project plan to undertake desilting
of groundwater recharge weirs in
the Central Lockyer. The project
plan will form part of the
application process for any
environmental / development
approvals required to undertake
this project. Seqwater will begin
the desilting of the weirs as soon
as the necessary approvals have
been obtained (currently planned
for 2020). Other weir and channel
improvement projects identified to
date include clearing of the
channel between Lockyer Creek
and Redbank Creek, and clearing
of Redbank Creek from Jordan 2
Weir up to Redbank Creek Pump
Station. Any costs associated with
these projects will be considered
by the QCA as part of the next
price path review.
• The consultant referenced above
in Option 7 also identified two
minor capital projects, related to
the upgrade of automated
monitoring equipment, that would
improve scheme efficiency and
Seqwater is assessing the merit of
these currently.
• Under the proposed water
planning changes, Seqwater will
be required to monitor and report
on the performance of the Central
Lockyer Valley Water Supply
Scheme through a 5-year
diagnostic assessment of the
effectiveness of the operational
improvements it has made in
delivering better water supply and
security outcomes for its
customers.
5 years Increased water
supply and
improved
reliability
Local recycling
(Option 12) -
40% to-date by
QUU
Supply directly to
farms with recycled
water from local
treatment plants.
QUU • Investigate further opportunities for
recycled water supply direct to
farms from local treatment plants
Ongoing Additional water
for agriculture
13.3 Shortlisting
The options that are already subject to a separate process, or are in the program of other new complementary
options and Existing Options (Base Case), were not selected as the options for additional analysis. All the

97 Not Government Policy
longlisted options are shown below (Table 13.3). A brief explanation has been given when an option is excluded
from the shortlist. This is consistent with the ranked longlist.
Table 13.3 : Selection of shortlist
Option
number
Option description Approach Reason
1 Supply chain improvements Already
underway
• Requires an overall approach to determining any supply chain
impediments.
2 On-farm initiatives Include in
Program of other
new
complementary
options (Base
Case)
• This approach could include a grant or subsidy scheme and is
therefore best undertaken by government / organisation.
3 Market opportunities study Already
underway
• Requires an overall approach to determining whether a market
exists for existing and potential crops. This needs to be
undertaken without bias for any crop.
4 Industry/policy coordination review Include in
Program of other
new
complementary
options (Base
Case)
• Requires an overall approach to coordinating policy. Best
undertaken by government, including consultation with the
Department of Employment, Small Business and Training
(DESBT).
5 Public/private agribusiness
development
Include in
Program of other
new
complementary
options (Base
Case)
• Requires an overall approach to industry development. Best
undertaken by government.
6 Water trading Already
underway
• The amendment to the water plan is already underway by
DNRME to introduce water trading
7 Increase diversion capacity Already
underway
• Seqwater is already investigating
8 Weir and channel improvements Already
underway
• This option is likely to improve the historical performance of the
existing supplemented recharge scheme which Seqwater is
already investigating
9 New weirs Not shortlisted • This option produces little additional water at a high $/ML cost
10 Inter-catchment transfer Not shortlisted • This option is very expensive
11 Public/private research investment Include in
Program of other
new
complementary
options (Base
Case)
• Requires an overall approach to coordinate public and private
investment. Best undertaken by the government.
12 Local recycled water Already
underway
• QUU are already supplying local recycled water
13 Saline water use Not shortlisted • This option is very expensive
14 Greywater reuse Not shortlisted • This option is very expensive and produces little additional
water
15 On-farm irrigation efficiency Already
underway
• This option scores well and already subject to an alternative
investigation

98 Not Government Policy
Option
number
Option description Approach Reason
16 Desalination on coast Not shortlisted • This option results in very negative financial and economic
NPVs
17 Wivenhoe flood harvesting / new
trunk main / fill irrigation dams /
existing distribution network
Not shortlisted • Wivenhoe flood harvesting creates a water product which
reliability is too low for irrigation
18 Wivenhoe flood harvesting / new
trunk main / fill irrigation dams /
new distribution network
Not shortlisted • Wivenhoe flood harvesting creates a water product which
reliability is too low for irrigation
19 Water from Wivenhoe / new trunk
main / new distribution network
Shortlisted • Ranks number 1 in the MCA analysis
20 Water from Wivenhoe / new trunk
main / existing distribution network
Shortlisted • Ranks number 4 in the MCA analysis
21 Water from Wivenhoe /
Toowoomba pipeline / existing
distribution network
Not shortlisted • The Toowoomba pipeline does not have the required capacity,
is needed for Toowoomba and does not provide cost savings
as it is not located in a place that would save capex
22 Water from Wivenhoe /
Toowoomba pipeline / new
distribution network
Not shortlisted • The Toowoomba pipeline does not have the required capacity,
is needed for Toowoomba and does not provide cost savings
as it is not located in a place that would save capex
23 Water from Wivenhoe / new
distribution network / no irrigation
dams
Shortlisted • Ranks number 2 in the multicriteria analysis
24 WCRWS PRW / irrigation dams /
new distribution network
Shortlisted • This option has not ranked well but is included for additional
analysis to provide a range of potential future options
25 WCRWS PRW / pipe to farm Not shortlisted • Has a significantly negative financial NPV
26 WCRWS PRW / managed aquifer
recharge
Not shortlisted • Has a significantly negative financial and economic NPV and
has a cost per megalitre that is prohibitively expensive
27 WCRWS A+ water / irrigation
dams / new distribution network /
direct / direct potable reuse
Not shortlisted • Has a significantly negative financial NPV
28 WCRWS A+ water / pipe to farm /
direct potable reuse
Not shortlisted • Has a significantly negative financial NPV
29 WCRWS A+ water / existing
distribution network / direct potable
reuse
Not shortlisted • Has a significantly negative financial and economic NPV and
has a cost/ML that is prohibitively expensive
30 Deep aquifer investigation Include in
Program of other
new
complementary
options (Base
Case)
• Produces only a small volume of water and is investigated
further through the Program of other new complementary
options and Existing Options (Base Case)
31 WCRWS PRW / irrigation dams /
new distribution network / post
recommissioning
Shortlisted • This is the highest ranked WCRWS options. Although the
WCRWS options do not score as well as the water from
Wivenhoe infrastructure option, it was considered reasonable
to subject both infrastructure options to further analysis
32 WCRWS PRW / pipe to farm / post
recommissioning
Shortlisted • This is the second highest ranked WCRWS options. Although
the WCRWS options do not score as well as the water from
Wivenhoe infrastructure option, it was considered reasonable
to subject both infrastructure options to further analysis
33 WCRWS PRW / managed aquifer
recharge / post recommissioning
Not shortlisted • Has a significantly negative financial and economic NPV and
has a cost per megalitre that is prohibitively expensive

99 Not Government Policy
Option
number
Option description Approach Reason
34 WCRWS A+ water / irrigation
dams / new distribution network /
direct / direct potable reuse / post
recommissioning
Not shortlisted • Has a significantly negative financial NPV
35 WCRWS A+ water / pipe to farm /
direct potable reuse / post
recommissioning
Not shortlisted • Has a significantly negative financial NPV
36 WCRWS A+ water / managed
aquifer recharge / direct potable
reuse / post recommissioning
Not shortlisted • Has a significantly negative financial NPV and has a cost/ML
that is prohibitively expensive
37 QUU A+ / irrigation dams / new
distribution network
Not shortlisted • Has a cost/ML that is prohibitively expensive
38 QUU A+ / pipe to farm Not shortlisted • No fatal flaw but ranked 30 out of 39
39 QUU A+ / managed aquifer
recharge
Not shortlisted • No fatal flaw but ranked 32 out of 39
Note: The bundled options for Wivenhoe Water and WCRWS are highlighted in the table.
On this basis, two bundles of options were identified for further examination in this SBC. These options are:
1) Water from Wivenhoe Dam
- Wivenhoe Dam allocation / new trunk main / existing distribution network (option 20)
- Wivenhoe Dam allocation / new trunk main / new distribution network/ existing irrigation dams
(option 19)
- Wivenhoe Dam allocation / new distribution network / no irrigation dams (option 23)
2) Water from the WCRWS
- WCRWS PRW / irrigation dams / new distribution network / post-recommissioning (option 31)
- WCRWS PRW / pipe to farm / post-recommissioning (option 32)
- WCRWS PRW / irrigation dams / new distribution network (option 24)
13.4 Further analysis of shortlisted infrastructure options
This section considers the two bundles of shortlisted options and examines them further under the SBC. This
approach means that any ‘fatal flaws’ can be identified earlier than the detailed business case. The additional
factors examined are:
• reliability
• environment
• policy and legal
• economics
• average costs.
13.4.1 Reliability
The suites of options have an identical reliability. In both cases, when the WCRWS is turned on, any supply to
the irrigators would cease. The WCRWS has trigger points when it is recommissioned and operated. Currently,
it is recommissioned when the combined dam levels fall to 60 per cent. However, it is expected that this trigger
level will increase to operate at 70 per cent after it has been recommissioned for urban water supply.

100 Not Government Policy
The below Figure 13.1 shows a simulation of the levels of the Wivenhoe and Somerset dams based on actual
historical inflows and an assumed 600 ML per day extraction for urban use. That shows the frequency that the
dam levels have dropped below 70 per cent over the past 130 years69.
Figure 13.1 : Wivenhoe / Somerset inflows and extractions
Also relevant is the projected frequency that the WCRWS will be switched on in any given year. Current
projections are that by 2050, the WCRWS would be in use 20 per cent of the time, meaning that irrigators would
have access to water from Wivenhoe Dam 80 per cent of the time. This kind of reliability is similar to other
Queensland irrigation schemes.
However, the projection that includes a climate change forecast has a 44 per cent probability of switching on the
WCRWS, meaning that irrigators would have access to water from Wivenhoe Dam 56 per cent of the time
(Table 13.4).
Table 13.4 :Probability of turning on the WCRWS
2020 2030 2050
Probability of interruption—
without climate change
6% 12% 20%
Probability of interruption—with
climate change
19% 32% 44%
13.4.2 Environment
GHD70 undertook a desktop review of environmental factors and supplemented and consolidated previous
environmental investigations and reference material with current state and Commonwealth environmental data
layers, to provide a description of the existing environment and environmental values within and surrounding the
project footprint.
GHD found the following endangered flora:
• The Brigalow (Acacia harpophylla dominant and codominant) TEC
• The Swamp Tea-tree (Melaleuca irbyana).
69 The trigger level is based on the water levels across a larger number of dams than only Wivenhoe and Somerset. 70 GHD, NuWater Project Feasibility Study, prepared for Queensland Farmers’ Federation, March 2018, p. 97.

101 Not Government Policy
The mitigation of environmental impacts will require an effective management framework and implementation.
The project will require detailed environmental management plans. Figure 13.2 shows the areas with matters of
state environmental significance.

102 Not Government Policy
Figure 13.2 : Matters of state environmental significance

103 Not Government Policy
13.4.3 Policy and legal
The water from Wivenhoe options will require a change in government policy. The government and Seqwater
will need to be willing to change the trigger levels of the WCRWS in order to supply additional water to irrigators.
The review of trigger levels is currently the subject of a different process.
Seqwater has indicated that their expectation is that urban water supply should not be worse off (either in bulk
water charges or water security) due to supply to Lockyer Valley irrigators. Additionally, it is Seqwater’s
preference that any supply to Lockyer Valley irrigators under the options occur only after the WCRWS has
already been recommissioned for urban water supply purposes, as this is a significant task.
However, this is government policy, which can be altered should the government be persuaded of the merits.
It is expected that irrigators will not purchase a water allocation. They would enter into a supply agreement with
Seqwater, which would specify the conditions of supply.
To be supplied directly from the WCRWS, there would be a need for additional approvals.
The WCRWS is an approved scheme to deliver high quality recycled water (PRW) for indirect potable reuse
under approvals obtained through the Water Act 2000 (Qld) as well as the Environmental Protection Act 1994
(Qld) authorities for the operation of the relevant advanced water treatment plants.
The potential for this scheme to be appropriated for a use other than its intended purpose, in particular
conveyance of high quality PRW, will be subject to approval from DNRME, Seqwater and DES as the
responsible statutory authorities for the WCRWS and its operation.
All of the options considered have needed to have no negative impact on the urban level of service, dam safety
obligations, and the flood mitigation capacity of any storage.
13.4.4 Economic assessment
The economic assessment has been done in accordance with Building Queensland Cost Benefit Analysis
Guide. The detail of the calculation of economic benefits is presented in Appendix A.
A summary of the economic metrics is shown in Table 13.5 and Table 13.6.
Table 13.5 : Upfront and ongoing costs
Option Upfront capex
($m)
PV of opex
($m)
PV of total
costs ($m)
Water from Wivenhoe Dam
Option 20—Wivenhoe Dam water / new trunk main / existing distribution network 80 310 390
Option 19—Wivenhoe Dam water / new trunk main / new distribution network/
existing irrigation dams
130 310 440
Option 23—Wivenhoe Dam water / new distribution network / no irrigation dams 131 310 440
Water from the WCRWS
Option 31—WCRWS purified recycled water (PRW) / irrigation dams / new
distribution network / post- recommissioning
119 800 919
Option 32—WCRWS PRW / pipe to farm / post-recommissioning 119 800 919
Option 24—WCRWS PRW / irrigation dams / new distribution network /pre-
commissioning of WCRWS
251 800 1,051
104 Not Government Policy
Table 13.6 : Economic outcomes
Option PV of costs
($m)
PV of benefits
($m)
Economic NPV
($m)
Economic
BCR
Water from Wivenhoe Dam
Option 20—Wivenhoe Dam water / new trunk main / existing
distribution network
390 240 –150 0.6
Option 19—Wivenhoe Dam water / new trunk main / new
distribution network/ existing irrigation dams
440 523 83 1.2
Option 23—Wivenhoe Dam water / new distribution network / no
irrigation dams
440 513 73 1.2
Water from the WCRWS
Option 31—WCRWS purified recycled water (PRW) / irrigation
dams / new distribution network / post- recommissioning
919 608 –311 0.7
Option 32—WCRWS PRW / pipe to farm / post-recommissioning 919 580 –339 0.6
Option 24—WCRWS PRW / irrigation dams / new distribution
network /pre-commissioning of WCRWS
1,051 608 –443 0.6
This analysis shows that the ‘water from Wivenhoe Dam’ options (options 19 and 23) have positive NPVs and
BCRs above 1.0. Conversely, all of the ‘water from the WCRWS’ options have negative NPVs and BCRs below
1.0. A BCR of 1.0 is when benefits exactly equal costs.
A similar process will be undertaken in the Detailed Business Case to determine economic benefits. The
detailed demand assessment should involve a number of interviews with potential customers to determine
demand and economic benefits. The type of information needed is:
• Demand for additional water (volume and reliability)
• Additional crop grown
• Costs to apply additional water
• Revenue received from using additional water
• Overall changes in business cash-flow as a result of additional water
• Water quality requirements for the additional water.
WSP were commissioned by Somerset and Lockyer Valley Councils and the Lockyer Water Users Forum to
assess the impact of additional water. WSP found that:
An additional 100,000 ML/annum of water for irrigation purposes was estimated to
generate approximately $640 million in additional gross value. Of this approximately
$585 million was attributed to vegetables for human consumption, $4.4 million to hay
and silage and $50 million to nurseries, cut flowers and cultivated turf.
13.4.5 Long-term average annual cost
Based on the upfront capital and ongoing operating costs, the long-term average annual costs have been
calculated. The assumption is that there is no government grant or subsidy.
The upfront cost reflects the upfront capital divided by the total volume of megalitres sold (assumed to be
50,000 ML). The annual fixed costs are incurred irrespective of whether water is available. The variable costs
are incurred in order to make a water delivery. Costs are shown in Table 13.7.

105 Not Government Policy
Table 13.7 : Long-term average annual cost (per ML)
Option Upfront cost
(one-off) ($)
Annual fixed
cost ($)
Annual variable
cost ($)
Water from Wivenhoe Dam
Option 20—Wivenhoe Dam water / new trunk main / existing distribution
network
1,600 400 20
Option 19—Wivenhoe Dam water / new trunk main / new distribution
network/ existing irrigation dams
2,600 400 100
Option 23—Wivenhoe Dam water / new distribution network / no irrigation
dams
2,600 400 100
Water from the WCRWS
Option 31—WCRWS purified recycled water (PRW) / irrigation dams / new
distribution network / post- recommissioning
5,000 0 1,300
Option 32—WCRWS PRW / pipe to farm / post-recommissioning 2,400 0 1,300
Option 24—WCRWS PRW / irrigation dams / new distribution network /pre-
commissioning of WCRWS
2,400 0 1,300
While a detailed demand assessment has not been undertaken, the cost-reflective charges for the Water from
WCRWS are very likely to be above irrigators’ capacity to pay. The prices for Water from Wivenhoe are likely
high but may be acceptable to irrigators.
13.5 Findings of the analysis of shortlisted options
The examination of the shortlisted options concludes that for reliability, environmental and
Legal/regulatory/policy, both options are similar. However, the much larger operating costs of the WCRWS
options result in poorer performance in economic outcomes and cost-reflective prices. For this reason, the water
from Wivenhoe Dam options are preferred. The summary is presented in Table 13.8.
Table 13.8 : Summary of shortlist analysis
Topic Water from Wivenhoe Dam Water from the WCRWS
Reliability and climate change sensitivity Climate change presents a risk to reliability. Climate change presents a risk to reliability.
Environmental Approvals would be needed. Likely to be
environmentally acceptable
Approvals would be needed. Likely to be
environmentally acceptable
Legal/regulatory/policy Requires Government approval for
Wivenhoe water to be used for this project
and for consideration of altering the trigger
levels for the use of the WCRWS.
Approvals required through the Water Act
2000 (Qld) as well as Environmental
Protection Act 1994
Economics Positive NPV in some scenarios All negative NPVs
Cost-reflective prices May be affordable – will not know for sure
until a demand assessment and capacity to
pay study is done.
Probably not affordable – will not know for
sure until a demand assessment and
capacity to pay study is done.

106 Not Government Policy
14. Matters for the Detailed Business Case to consider
Three key stakeholder groups requested that a series of principles be taken into account during the Detailed
Business Case. These were communicated in the form of letters, which are attached to this report. A summary
is shown below.
DNRME (on behalf of the PSC) requested that the following principles be taken into account:
• The DBC must be developed in accordance with the Building Queensland Business Case
Development Framework.
• Economic assessment must occur in accordance with the Building Queensland Cost Benefit
Assessment guidelines with strict adherence to the appropriate inclusions in costs and benefits.
• Pricing of water needs to occur in the first instance based on full cost recovery principles (including
return on, and of, capital as well as all ongoing operational and maintenance costs).
• Demand for water from the additional water supply and security options need to be assessed
specifically in the context of the price at which water would be available.
• Consideration of an appropriate level of customer commitment (i.e. commensurate with the level of
detail of the assessment) should be incorporated into the DBC process.
• SEQ Urban water security cannot be negatively impacted by any of the options for additional water
supply or security.
• SEQ urban water users must not be responsible for any increase in costs associated with any option
considered.
Seqwater provided a list of considerations and constraints to be factored into any subsequent business case.
These include:
• Seqwater’s preference is that any supply to Lockyer Valley irrigators should occur only after the
WCWRS had already be recommissioned for urban water supply purposes
• Seqwater should be no worse off in terms of regulated bulk water charges or water security
• Arrangements should be consistent with the water planning regime
• Seqwater has a strong preference to not invest in or own new assets to connect the Lockyer Valley.
The Lockyer Valley Somerset Water Collaborative also provided feedback on the draft report, attached as
Appendix J. This feedback has been addressed in this final version.

107 Not Government Policy
15. Conclusions
The Water for the Lockyer SBC (which includes a part of the preliminary business case phase):
1) Finds that, in the context of the service need:
a) the Wivenhoe water options (options 19, 20 and 23) are, as a group, the most economically and
financially feasible infrastructure options.
b) Option 20 has a BCR lower than 1.0; restricts voluntary participation by individual irrigators in
securing additional water as the old and new products would be delivered by the same
distribution system; restricts the ability to deliver water to new customers; and involves significant
inefficiencies associated with delivering the additional water via an aquifer recharge mechanism.
c) although the WCRWS options (options 24, 31 and 32) are the next most feasible infrastructure
options, they have significantly lower BCRs, of less than 1, and negative NPVs, which are likely to
result in very high annual variable charges.
2) Recommends that the Wivenhoe options (options 19 and 23) be considered as the preferred
option(s) for any future detailed analysis. In developing a Detailed Business Case, the following needs
to be taken into account:
a) matters raised by Seqwater in relation to the recommissioning of WCRWS, cost and water
security (Appendix H).
b) matters and principles raised in DNRME letter on behalf of PSC (Appendix I) in relation to the
availability and reliability of supply for the Lockyer due to population growth in future, and the
following assessment principles for the development of a detailed business case:
i. The detailed business case must be developed in accordance with the Building Queensland
Business Case Development Framework.
ii. Economic assessment must occur in accordance with the Building Queensland Cost Benefit
Assessment guidelines with strict adherence to the appropriate inclusions in costs and
benefits.
iii. Pricing of water needs to occur in the first instance based on full cost recovery principles
(including return on, and of, capital as well as all ongoing operational and maintenance
costs).
iv. Demand for water from the additional water supply and security options need to be assessed
specifically in the context of the price at which water would be available.
v. Consideration of an appropriate level of customer commitment (i.e. commensurate with the
level of detail of the assessment) should be incorporated into the detailed business case
process.
vi. SEQ Urban water security cannot be negatively impacted by any of the options for additional
water supply or security.
vii. SEQ urban water users must not be responsible for any increase in costs associated with
any option considered.
c) Note the preferred alignment of the Inland Rail that traverses Lockyer Valley and consult with the
project proponent, the Australian Rail Track Corporation.
3) Recommends a detailed water demand survey and capacity to pay be conducted as part of any future
detailed business case analysis.
4) Recommends the following program of other new complementary options be considered in parallel,
for the detailed business case analysis:
- Public / private research investment (option 11)
- Industry / policy coordination review (option 4)
- Public / private agribusiness development (option 5)
- On-farm initiatives (option 2)

108 Not Government Policy
- Deep aquifer investigation (option 30).
5) Notes that the base case of the detailed business case will include the following options that are
currently underway:
- Supply chain improvements (option 1)
- Market opportunities study (option 3)
- Water trading (option 6)
- On-farm irrigation efficiency (option 15)
- Investigate increasing diversion capacity (option 7)
- Local recycling (option 12).

109 Not Government Policy
16. Assurance
This report has been developed within the governance approach outlined in Chapter 3.
The PWG provided overall guidance, input, direction and review to ensure that this business case delivered the
outcomes outlined in the project’s purpose and objectives.
The PWG oversaw the articulation of an agreed purpose and the development of an SBC that:
• details the service need to be addressed
• identifies intended benefits
• includes undertaking an investment logic mapping exercise with stakeholders
• leads to a multicriteria assessment of a list of options
The PSC provided oversight of the development of the SBC. It provided strategic direction, reviews, comments
upon and/or endorses project elements that will affect the SBC. The focus of the PSC is on:
• high-level strategic issues in the development of the SBC
• noting and/or endorsing key business case outputs and documentation as they are developed
• considering the SBC and making a recommendation to the project owner.
The contents of this report does not form government policy or funding commitment for construction, nor should
it be assumed that it reflects the views of any individuals of either group.

Appendix A. Calculation of economic benefits
A.1 Method
The use of water for agricultural purposes will materially increase the economic value of production in the
Lockyer Valley. This economic benefit has been calculated specifically for the region surrounding the project.
The additional water will be used for two broad purposes. The first is to expand agricultural production onto
land that is not used for crops but other agricultural uses. The second is to use the water to plant an
additional crop on land that is already irrigated.
The estimated economic benefit excludes improved yields of existing crops at existing planting frequencies,
which for this assessment are assumed to offer only a marginal benefit. In reality, this marginal benefit may
be more significant than Jacobs has assumed; however, our analysis is intentionally conservative (rather
than optimistic).
The process used to calculate the economic benefit is as follows:
• Convert available gross margins into net margins by subtracting fixed costs per hectare.
• Determine the amount of water likely to be used per hectare for each crop type and cropping areas.
• Determine the annual net margin of each crop (per ML) and convert the annual net margin into a
30-year net present value (NPV) / the economic benefit per ML,
• Multiply scheme yield estimates (nominal volume times reliability) to determine volumes of water by
the NPV of the net margin, to estimate economic value contributed by water (i.e. total economic
benefit is determined by multiplying volume of water by the NPV of net margins per ML).
A detailed demand assessment has not been undertaken, so additional demand is unknown. To account for
this uncertainty, we have assumed a range of additional water uses: low (20,000 ML per year), medium
(40,000 ML per year) and high (50,000 ML per year). This is in addition to the water the growers’ access
from other sources.
A.2 Agricultural margins
The most common form of agricultural margin is a gross margin which equals the gross income of an
enterprise minus the variable costs of that enterprise. Marsden Jacobs, as part of the amended water plan,
estimated the gross margins for various crops in the Lockyer Valley, as follows in Table A.1:

111 Not Government Policy
Table A.1 : Lockyer Valley gross margins, ranked by value
Crop Gross margin per
hectare ($/ha)
Cauliflowers 21,219
Lettuces 11,520
Potatoes 7,641
Broccoli 4,339
Sweet corn 4,130
Onions 3,750
Cabbages 3,470
Beans 3,000
Pumpkins 1,460
Simple average 6,725
Gross margins were also calculated by Synergies, as part of the NuWater. The MJA gross margins are
slightly lower (more conservative) than Synergies’. MJA also published the irrigator reference group gross
margins, which are generally higher than both consultant estimates. Therefore, to maintain Jacobs’
conservative approach we have adopted the lowest set of numbers, as estimated and published by MJA.
A comparison of the Synergies, MJA and irrigator reference group gross margins is shown below in Figure
A.1.
Figure A.1: Comparison of the Synergies, MJA and irrigator reference group gross margins
Source: MJA XXXX
However, a gross margin does not fully reflect a farm’s profitability. Rather, gross margins can overstate
economic benefits depending on the estimation of on-farm economic costs. A net margin is required, which
equals gross margin minus fixed costs. This is an appropriate and conservative estimate of economic
benefit, which obviates the needs to account for on-farm costs separately (as part of estimating project
costs).
Fixed costs are specific to each enterprise and depend on the geography, crop type, land preparation /
landform costs, land tax and council rates, assumed owner’s and other permanent salaries, and levels of

112 Not Government Policy
debt and the cost of debt. As a demand study has not been undertaken, we do not know with certainty to
which crops the additional water would be applied. Therefore, we have assumed that each of the crops in
Table A.1 will be grown in equal proportion—taking a portfolio approach and using a simple average.
Upfront fixed costs have been estimated assuming a 15-hectare farm, as shown in Table A.2.
Table A.2 : Lockyer Valley upfront fixed costs
Item Cost ($)
Clearing, levelling land and landform (for beds) 30,000
On-farm pipework and hydrants 15,000
Access to irrigation network 70,000
Contingency 35,000
Total ($ per 15 ha farm) 150,000
Total ($/ha) 10,000
Source: stakeholder consultation and industry knowledge
This equates to $10,000 per ha for upfront establishment costs. Based on a real discount rate of 7% over 40
years, this results in an annualized cost of $750 per ha. However, these costs are only required, if new land
is needed. In many cases, already prepared land could be further utilised.
The opportunity cost for cleared land is zero as without water it is assumed that crops cannot be grown, and
grazing will not take place on fallow land. The opportunity cost of grazing / uncleared land is $400 per ha, for
forgone livestock production.
We have also identified the ongoing fixed costs of operation to be based on:
• $2,800 per hectare, based on an additional 0.5 FTE for a 15-ha farm (i.e. annual FTE salary of
$84,000).
We have assumed a 50/50 split between cleared and uncleared land.
Once these costs are subtracted from the gross margin per hectare, the resulting net margin is calculated
below for both grazing (uncleared) and existing cropping (cleared) land (Table A.3).
Table A.3 : Lockyer Valley net margin calculation
Item Value for grazing (uncleared) land ($) Value for cropping (cleared) land ($)
Gross margin (per ha) 6,725 6,725
- opportunity cost 400 -
- upfront establishment costs (annualised) 750 -
- ongoing fixed costs 2,800 2,800
Net margin (per ha) 2,775 3,925
Average water use 3 3
Net margin (per ML) 972 1,375
Assumed simple average water use for the portfolio of possible crops that could be grown with additional
water is just under 3 ML/ha. This analysis shows that the average net margin for crops in the Lockyer Valley
is between $972/ML and $1,375/ML.
A.3 Present value of increased agricultural production

113 Not Government Policy
The annual figure is then converted to a present value of economic benefits, using a real discount rate of 7%
over 30 years. The present value is between $11,818/ML (uncleared land) and $17,058/ML (cleared land).
As a comparison, GHD found the present value of the economic benefit to be $21,04071/ML. Based on our
water use scenarios, the economic benefit of additional agricultural production is $202 million to $505 million
(Table A.4). A range of water use scenarios are shown, noting that the core scenario used to estimate
capital and operating costs is an additional 50,000 ML.
Table A.4 : Lockyer Valley net margin calculation (7%)
Item Value
(uncleared)
Value
(cleared)
Total
Net margin (per ML) 952 1,375
NPV of net margin - over 30 years (per ML) 11,818 17,058
Average reliability 70% 70%
NPV ($m)—additional water (20,000 ML) 83 119 202
NPV ($m)—additional water (40,000 ML) 165 239 404
NPV ($m)—additional water (50,000 ML) 207 299 505
A.4 Sensitivity analysis—present value of economic benefit
Assessments for discount rates of 4 per cent and 10 per cent show that benefits range from $154 million to
$704 million.
Table A.5 : Lockyer Valley net margin calculation—discount rate 10% real
Item Value
(uncleared)
Value
(cleared)
Total
Net margin (per ML) 952 1,375
NPV of net margin - over 30 years (per ML) 8,978 12,959
Average reliability 70% 70%
NPV ($m)—additional water (20,000 ML) 63 91 154
NPV ($m)—additional water (40,000 ML) 126 181 307
NPV ($m)—additional water (50,000 ML) 157 227 384
Table A.6 : Lockyer Valley net margin calculation – Discount rate 4% real
Item Value
(uncleared)
Value
(cleared)
Total
Net margin (per ML) 952 1,375
NPV of net margin - over 30 years (per ML) 16,468 23,771
Average reliability 70% 70%
NPV ($m)—additional water (20,000 ML) 115 166 282
NPV ($m)—additional water (40,000 ML) 231 333 563
NPV ($m)—additional water (50,000 ML) 288 416 704
71 GHD, Table 10-1. Calculation: $157,800,000 divided by 7,500 ML

114 Not Government Policy
Appendix B. Benefits register
Benefit description Related to problem
/ opportunity
statement:
Related stakeholder/s and
potential beneficiaries
Possible measures Weighting
Increased agricultural
production, value and economic
activity
1,3 Farm owners, workers,
suppliers and consumers.
Value of agricultural
production ($).
25%
Increased agri-business and
local value add production, value
and activity
1,3 Existing and new business
and their workers.
Number of new businesses 25%
Additional regional investment 1,2 Business owners, workers,
wholesale suppliers and
local residents.
Change in regional
investment
10%
Creating local jobs 1,2,3 Unemployed and under-
employed
New jobs will be measured
by the Small Area Labour
Markets Australia
20%
Encouraging commercially
focused research and skill
attainment
1,2 Farm owners and the highly
skilled workers
To be developed 10%
Develop new markets
1,2 Farm business, transport,
logistics, processing and
packaging business.
International exports 5%
Supporting diversification,
resilience, wellbeing and
economic prosperity (e.g. New
tourism)
3 Residents and tourists Change in the number of
new tourists spending time
and money in the area
Index of relative socio-
economic disadvantage
5%

115 Not Government Policy
Appendix C. Investment logic map

116 Not Government Policy
Appendix D. Risk Register
The risk management approach is aligned with the DNRME risk matrix. This risk relates to the success of the
SBC being implemented to the next DBC stage.
Table D1 : DNRME Risk Analysis and Scoring Matrix
Likelihood / consequence Insignificant Minor Moderate Major Catastrophic
Almost certain Medium (11) Medium (16) High (20) Extreme (23) Extreme (25)
Likely Low (7) Medium (12) High (17) High (21) Extreme (24)
Possible Low (4) Medium (8) Medium (13) High (18) High (22)
Unlikely Low (2) Low (5) Medium (9) Medium (14) High (19)
Rare Low (1) Low (3) Low (6) Medium (10) Medium (15)
Source: (Department of Natural Resources, Mines and Energy, 2017, p. 15)
Table D2 : DNRME risk likelihood categories
Likelihood Description Example to assist stakeholders
Almost certain The event is expected to occur in most circumstances May occur once a year or more
Likely The event will probably occur in many circumstances May occur once every 3 years
Possible Identified factors indicate the event could occur at some time May occur once every 10 years
Unlikely The event could occur at some time but is not expected May occur once every 30 years
Rare The event may occur only in exceptional circumstances May occur once every 100 years
Source: (Department of Natural Resources, Mines and Energy, 2017, p. 15).
The range from ‘yearly’ to ‘every 100 years’ is appropriate for water infrastructure related risks.
Table D3 : Risk consequences—impact on realisation of benefits
Insignificant Minor Moderate Major Catastrophic
Negligible impact on
realisation of project
benefits
Minor impact on
realisation of project
benefits
Moderate impact on
realisation of project
benefits
Major impact on
realisation of project
benefits
Catastrophic impact on
realisation of project benefits—
cannot be realised
Source: Adapted from (Department of Natural Resources, Mines and Energy, 2017).

117 Not Government Policy
Figure D.2 : DNRME risk management process adopted
Source: (Department of Natural Resources, Mines and Energy, 2017, p. 2).
A risk register was developed by the PWG.
Table D.4 : Risk register
Risk
description
Trigger Impact Likelihood Consequence Rating Control
strategy
Risk of industry
being
Government-led
rather than
market-led
Introduction of
policy, regulation
or legislation.
Markets signal
will be affected,
and inefficient
decisions could
be made.
Unlikely Moderate Medium Government to
not intervene in
markets.
Risk that there
is not additional
demand
Completion of a
demand
assessment.
Project would
not proceed.
Possible Moderate Medium Engage an
experienced
party with an
understanding of
irrigation to
forecast demand
A change of
Government
Commonwealth
election
Possible change
in NWIDF policy
and/or delay in
project
progression
Likely Moderate High Comply with
good business
case practices
with an
unbiased
assessment.

118 Not Government Policy
Risk
description
Trigger Impact Likelihood Consequence Rating Control
strategy
Water plan Finalisation of
the water plan
Existing water
use practices
may need to
change
Likely Minor Medium Priority by
government
Biosecurity A biosecurity
threat is found
that limits the
capacity to grow
and sell
produce.
Reduction in
output, reduced
demand for
additional water.
Possible Moderate Medium Continue to
monitor
biosecurity
threats
Climate change
and
sustainability
Change in
temperature
and/or rainfall.
Climate change
may result in an
increase in
number and
severity of
extreme events
and resulting
crop failures.
Possible Moderate Medium Continue to
monitor climate
forecasts.
Stakeholders
do not support
project
Lack of
stakeholder
support or
opposition
Possible Moderate Medium Continue to
engage with
stakeholders
Seqwater Support for the
options affecting
Seqwater
Low or no
support would
make many
options difficult
or impossible
Unlikely Moderate Medium Continue to
engage with
Seqwater who is
a member of
PWG and PSC

119 Not Government Policy
Appendix E. Stakeholder engagement plan
A stakeholder management plan was developed by Jacobs to deliver this business case. The plan was
endorsed by the PSC (add date). It is replicated below:
Stakeholder engagement activities in the SBC stage can support:
• greater understanding of different stakeholders’ perceptions of the service need, which can help in
identifying appropriate initiatives
• effective identification of stakeholders’ expectations regarding the potential project and the benefits
they seek
• better outcomes and greater accuracy in identifying possible strategic responses, business
changes and potential initiatives
• establishment of ‘social license’
• effective risk management
• improved project outcomes resulting from liaison between agencies when there are overlapping
jurisdictions or when approvals are required from multiple departments or independent regulatory
agencies (these improved project outcomes may relate to time, cost and user satisfaction).
Stakeholder engagement enables an understanding of the relationship between the objectives of a project
and the outcomes expected by stakeholders. However, we understand that the irrigators of the Lockyer
Valley may be experiencing ‘consultation fatigue’. Accordingly, we propose a targeted (yet comprehensive)
approach that focuses on key and committed stakeholders.
Where possible, we will leverage the results of previous consultation. We want to avoid asking people the
same questions again.
The objectives of consultation will be to discuss the:
• service need
• options available to meet the service need.
The approach and timing will likely change over time to meet the organic needs of the project. Material
departures will be discussed with DNRME.
Table E1 provides a list of key stakeholders identified to be interested and of influence to the SBC.
Table E1 : Stakeholders
Sector Stakeholder Approach Timing
Irrigators Lockyer Water Users Forum
(Brock Sutton), Lockyer Valley
Growers (Gordon Van Der
Est)
Individual phone calls and discussions
Be introduced to other interested and
knowledgeable irrigators (3 to 5). Visit on-farm to
minimise inconvenience to the irrigator, and to gain
the most benefit from consultation.
Interaction within the Project Working Group
Public meeting and forums, if required.
Undertake the majority of
individual irrigation
consultation in October and
November 2018.
Local
business
Lockyer Chamber of
Commerce & Industry
Individual phone calls and discussions
Undertake consultation in
October to March 2019.
Statutory
bodies
Seqwater Consultation with Seqwater is required as water
may be sourced from their bulk water supply
assets and they have a priority of ensuring water
security objectives.
Discussions regarding options
and water availability will
occur December 2018 to June
2019.

120 Not Government Policy
Sector Stakeholder Approach Timing
Interaction within the Project Working Group
Discussions regarding individual options with
knowledgeable officers
Queensland Urban Utilities QUU are focused on facilitating economic
development in the Lockyer Valley with the use of
water
Interaction within the Project Working Group
Discussions regarding individual options with
knowledgeable officers
Undertake consultation in
November 2018 to March
2019.
Local
Government
Lockyer Valley Regional
Council, Somerset Regional
Council
Individual phone calls and face-to-face discussions
Interaction within the Project Working Group
Undertake consultation in
October to March 2019.
Ongoing consultation will
occur through the Project
Working Group.
State
Government
DNRME, DAF, DSDMIP, Qld
Treasury, QTC, Building
Queensland
Weekly meetings with DNRME and Building
Queensland, and other parties, as required.
Interaction within the Project Working Group,
Project Steering Committee and individual
discussions, as needed.
Presentation to Project
Steering Committee as
required.
Note: All members of the PWG have the same level of influence within PWG meetings. However, there can be a differentiation outside of this group.

121 Not Government Policy
Appendix F. Full Long list
Option
number
Option name Description Benefits to be achieved
1 Supply chain
improvements
Develop a supply value chain for the region and address supply
chain gaps and constraints
• Increased business
and local value add
production, value and
activity.
• Develop new
markets
2 On-farm initiatives Growcom is currently undertaking a number of initiatives (e.g.
Hort360 South-East Queensland) that are focused on promoting
best management practice within the horticulture industry, as
well as addressing nutrient and sediment loss in catchments
where this is a known issue. There would be value in these
initiatives also identifying where water availability is (or is likely to
become) a constraint to maximising on-farm production within
the sustainable best management practice context.
• Increased
sustainable
agricultural
production, value and
economic activity
3 Market opportunities
study
Identifying the regional, state and national market implications of
the Lockyer growing its production in the future; also,
development of export markets
• Increased business
and local value add
production, value and
activity.
• Develop new
markets
4 Industry/policy
coordination review
The PSC considered that past examples suggest that it may be
more effective for one group (rather than two separate groups) to
oversee and drive the industry and government policy
coordination aspect and the economic development aspect.
Review of examples deployed elsewhere might include:
- South East Queensland Council of Mayors
- Regional planning clusters
- Regional natural resource management groups
- RDAs
If specific funding were to be directed to infrastructure
investment in the Lockyer Valley, the group(s) might also provide
a useful governance vehicle for steering and overseeing such
initiatives.
• Increased business
and local value add
production, value and
activity.
• Develop new
markets
5 Public/private
agribusiness development
The PSC considered that a number of co-investment approaches
currently being deployed might inform the model to be applied in
the Lockyer Valley. These include R&D programs managed by
Hort innovation, urban water alliance, Department of innovation.
As UQ (Gatton) and USQ both have an existing presence in the
region, they are well-positioned to be key delivery partners in
R&D co-investment programs for the Lockyer Valley.
• Encouraging
commercially
focused research
and skill attainment
6 Water trading Improve mechanisms to allow (or encourage) water trading • Increased
sustainable
agricultural
production, value and
economic activity

122 Not Government Policy
Option
number
Option name Description Benefits to be achieved
7 Increase diversion
capacity
Seqwater to investigate whether pump/channel capacity can be
increased to better utilise the off-stream storages
• Increased
sustainable
agricultural
production, value and
economic activity
8 Weir and channel
improvements
Increasing the effectiveness of existing weirs (potentially through
desilting) and/or existing channels
• Increased
sustainable
agricultural
production, value and
economic activity
9 New weirs New irrigation weirs • Increased
sustainable
agricultural
production, value and
economic activity
10 Inter-catchment transfer Water from other area in South East Queensland (for example,
Paradise Dam) to improve reliability of the grid and allow
irrigators to access water from Wivenhoe Dam
• Increased
sustainable
agricultural
production, value and
economic activity
• Creating local jobs
and improving socio-
economic outcomes
11 Public/private research
investment
Government partnership / co-investment to attract a private
sector research investment in the Lockyer Valley
• Encouraging
commercially
focussed research
and skill attainment
12 Local recycled water Recycled water from local treatment plants directly to the farm
gate
• Increased
sustainable
agricultural
production, value and
economic activity
13 Saline water use Treated saline groundwater resources in the Lockyer Valley • Increased
sustainable
agricultural
production, value and
economic activity
14 Greywater reuse Greywater reuse • Increased
sustainable
agricultural
production, value and
economic activity
15 On-farm irrigation
efficiency
Improve on-farm irrigation efficiency • Increased
sustainable
agricultural
production, value and
economic activity
16 Desalination on coast Build a desalination plant on the coast and pipe the water to the
Lockyer
• Increased
sustainable
agricultural

123 Not Government Policy
Option
number
Option name Description Benefits to be achieved
production, value and
economic activity
17 Wivenhoe Dam flood
harvesting / new trunk
main / fill irrigation dams /
existing distribution
network
Flood harvesting water from Wivenhoe/Somerset Dam
New large diameter trunk main supplying raw water to Atkinson
Dam, Lake Clarendon and Lake Dyer
New distribution network to the farm gate
• Increased
sustainable
agricultural
production, value and
economic activity
• Additional regional
investment
• Supporting
diversification,
resilience, wellbeing
and economic
prosperity
18 Wivenhoe Dam flood
harvesting / new trunk
main / fill irrigation dams /
new distribution network
Flood harvesting water from Wivenhoe/Somerset Dam
New large diameter trunk main supplying raw water to Atkinson
Dam, Lake Clarendon and Lake Dyer
Existing distribution networks / managed aquifer recharge
• Increased
sustainable
agricultural
production, value and
economic activity
• Additional regional
investment
• Supporting
diversification,
resilience, wellbeing
and economic
prosperity
19 Water from Wivenhoe
Dam / new trunk main /
new distribution network
• Water from Wivenhoe/Somerset Dam
• New small diameter trunk main supplying raw water to
Atkinson Dam, Lake Clarendon and Lake Dyer (Figure 11.1)
New distribution network to the farm gate (not shown as the
location is highly uncertain)
• Increased
sustainable
agricultural
production, value and
economic activity
• Additional regional
investment
20 Water from Wivenhoe /
new trunk main / existing
distribution network
• Water from Wivenhoe/Somerset dam
• New small-diameter trunk main supplying raw water to
Atkinson Dam, Lake Clarendon and Lake Dyer (Figure 11.1)
Existing distribution networks / managed aquifer recharge.
• Increased
sustainable
agricultural
production, value and
economic activity
• Additional regional
investment
• Supporting
diversification,
resilience, wellbeing
and economic
prosperity
21 Water from Wivenhoe /
Toowoomba pipeline /
existing distribution
network
• Water from Wivenhoe/Somerset Dam
• New pipeline from the existing Toowoomba pipeline to
Atkinson Dam, Lake Clarendon and Lake Dyer
New distribution network to the farm gate
• Increased
sustainable
agricultural
production, value and
economic activity

124 Not Government Policy
Option
number
Option name Description Benefits to be achieved
• Additional regional
investment
22 Water from Wivenhoe /
Toowoomba pipeline /
new distribution network
• Water from Wivenhoe/Somerset Dam
• New pipeline from the existing Toowoomba pipeline to
Atkinson Dam, Lake Clarendon and Lake Dyer
Existing distribution networks / managed aquifer recharge
• Increased
sustainable
agricultural
production, value and
economic activity
• Additional regional
investment
• Supporting
diversification,
resilience, wellbeing
and economic
prosperity (e.g. new
tourism)
23 Water from Wivenhoe
Dam / new distribution
network / no irrigation
dams
• Water from Wivenhoe/Somerset Dam
• No trunk main and no use of irrigation dams
The new distribution network (small pipes) takes water from the
dam to farm
• Increased
sustainable
agricultural
production, value and
economic activity
• Additional regional
investment
24 WCRWS PRW / irrigation
dams / new distribution
network
PRW from Bundamba WCRWS
- Use existing irrigation dams
- New pipe from Wivenhoe pipeline to irrigation dams
- New distribution network to the farm gate
• Increased
sustainable
agricultural
production, value and
economic activity
• Additional regional
investment
25 WCRWS PRW / pipe to
farm
PRW from Bundamba WCRWS
New distribution network from Wivenhoe pipeline to farm gate
• Increased
sustainable
agricultural
production, value and
economic activity
• Additional regional
investment
26 WCRWS PRW / managed
aquifer recharge
PRW from Bundamba WCRWS.
Use existing irrigation dams and existing Wivenhoe pipeline
New distribution network from Wivenhoe pipeline to managed
aquifer recharge
• Increased
sustainable
agricultural
production, value and
economic activity
• Additional regional
investment
27 WCRWS A+ water /
irrigation dams / new
distribution network /
direct / direct potable
reuse
A+ grade water from Bundamba WCRWS
New pipe to irrigation dams from Wivenhoe pipeline
New distribution system to farm gate
New pipe to Mt Crosby from Bundamba WCRWS
• Increased
sustainable
agricultural
production, value and
economic activity
• Additional regional
investment

125 Not Government Policy
Option
number
Option name Description Benefits to be achieved
28 WCRWS A+ water / pipe
to farm / direct potable
reuse
A+ grade water from Bundamba WCRWS
New distribution network from Wivenhoe pipeline to farm gate
New pipe to Mt Crosby from Bundamba WCRWS
• Increased
sustainable
agricultural
production, value and
economic activity
• Additional regional
investment
29 WCRWS A+ water /
Existing distribution
network / direct potable
reuse
A+ grade water from Bundamba WCRWS.
Use existing distribution network for irrigators
New distribution network from Wivenhoe pipeline to managed
aquifer recharge
• Increased
sustainable
agricultural
production, value and
economic activity
• Additional regional
investment
30 Deep Aquifer Access very deep artesian water by drilling very deeply • Increased
sustainable
agricultural
production, value and
economic activity
31 WCRWS PRW / irrigation
dams / new distribution
network / post
recommissioning
PRW from Bundamba WCRWS
New pipe from Wivenhoe pipeline to irrigation dams
New distribution network to the farm gate.
Post recommissioning
• Increased
sustainable
agricultural
production, value and
economic activity
•
32 WCRWS PRW / pipe to
farm / post
recommissioning
PRW from Bundamba WCRWS
New distribution network from Wivenhoe pipeline to farm gate
Post recommissioning
• Increased
sustainable
agricultural
production, value and
economic activity
• Additional regional
investment
33 WCRWS PRW / managed
aquifer recharge / post
recommissioning
PRW from Bundamba WCRWS
New distribution network from Wivenhoe pipeline to managed
aquifer recharge
Post recommissioning
• Increased
sustainable
agricultural
production, value and
economic activity
• Additional regional
investment
34 WCRWS A+ water /
irrigation dams / new
distribution network /
direct / direct potable
reuse / post
recommissioning
A+ grade water from Bundamba WCRWS.
New pipe to irrigation dams from Wivenhoe pipeline.
New distribution system to farm gate.
New pipe to Mt Crosby from Bundamba WCRWS.
Post recommissioning
• Increased
sustainable
agricultural
production, value and
economic activity
• Additional regional
investment
35 WCRWS A+ water / pipe
to farm / direct potable
reuse / post
recommissioning
A+ grade water from Bundamba WCRWS
New distribution network from Wivenhoe pipeline to farm gate
New pipe to Mt Crosby from Bundamba WCRWS
Post recommissioning
• Increased
sustainable
agricultural
production, value and
economic activity

126 Not Government Policy
Option
number
Option name Description Benefits to be achieved
• Additional regional
investment
36 WCRWS A+ water /
managed aquifer
recharge / direct potable
reuse / post
recommissioning
A+ grade water from Bundamba WCRWS.
New distribution network from Wivenhoe pipeline to managed
aquifer recharge
Post recommissioning
• Increased
sustainable
agricultural
production, value and
economic activity
• Additional regional
investment
37 QUU A+ / irrigation dams
/ new distribution network
A+ grade water from QUU Bundamba water treatment plant
New pipe to irrigation dams
New distribution system to farm gate
• Increased
sustainable
agricultural
production, value and
economic activity
• Additional regional
investment
38 QUU A+ / pipe to farm A+ grade water from QUU Bundamba water treatment plant
New distribution network to farm gate
• Increased
sustainable
agricultural
production, value and
economic activity
• Additional regional
investment
39 QUU A+ / managed
aquifer recharge
A+ grade water from QUU Bundamba water treatment plant
New pipe to irrigation dams
Existing managed aquifer recharge
• Increased
sustainable
agricultural
production, value and
economic activity
• Additional regional
investment

127 Not Government Policy
Appendix G. The water planning process
G.1 Legislation
The Water Act 2000 (Water Act) provides the legislative framework for the sustainable planning, allocation
and management of water resources in Queensland. It requires that all planning, allocation and use of water
must ‘advance sustainable management and efficient use of water’.
Water plans provide the principal mechanism for achieving the requirements of the Water Act, setting out
detailed strategies and outcomes for water to be shared among water users, including the environment. The
water planning framework consists of:
• overarching legislation: Water Act
• subordinate legislation: Water Regulation 2016 and the Water plan
• statutory instruments: water entitlement notice and a water management protocol
• other associated documents: resource operations license and operations manual.
The water plan may apply to rivers, lakes, springs, overland flow and underground water. Water plans
balance the needs of water users (e.g. towns, agriculture and other industries) and the environment.
G.2 Developing water plans
The development process generally includes the following stages:
• Technical assessments (environmental, economic, social, hydrologic and cultural data)
• Preliminary stakeholder consultation
• Preparation of a draft water plan
• Publication of draft plan and opportunity for public submissions
• Consideration of submissions
• Finalisation and approval of water plan.
G.3 Implementing water plans
Water plans are implemented through a range of documents, developed in consultation with water users.
The following table explains each document.

128 Not Government Policy
Table F1: Queensland's water planning framework documents
Current framework
(as at Dec 2016) Contents of new document
Water plans
• Water covered by the plan
• Desired outcomes, measures and strategies for achieving the outcomes
• Performance indicators
• Amounts of water available for consumptive use and future use
• Specifications of water management areas and trading zones (previously in
ROP)
• Criteria for deciding water licences (previously in ROP)
Water management protocols • Water dealing/trading rules
• Water sharing rules for unsupplemented water
• Seasonal water assignment rules
• Any volumes of unallocated water reserved for particular purposes or stated
locations
Resource operations licences
or
Distribution operations licences
• Roles and responsibilities of scheme operators to achieve the outcomes of the
water plan
• Details of the infrastructure used to operate the scheme
• Watercourse authorised to be used for distribution of water
• Environmental management rules
• Monitoring and reporting requirements
Water supply scheme operations
manuals
• Operational rules for the scheme
• Water releases from dams
• Water sharing rules
• Seasonal assignment rules
Water entitlement notices • Temporary documents to convert, grant or amend water entitlement
G.4 Amendment to the Moreton Water Plan
G.4.1 Background
The Moreton Water Plan has been in place since March 2007 and was amended in 2009 and 2013 to
address water allocation and management issues in other catchments in the plan area. The Central Lockyer
Valley water supply scheme is the only remaining water supply scheme in the Moreton plan area which is still
managed under interim arrangements. The key aim of the amendment is to finalise management
arrangements for the scheme in a way that:
• supports the current economic and employment profile in the Central Lockyer Valley region
• supports the existing agricultural industry and associated jobs

129 Not Government Policy
• ensures a more equitable share and management of the water resource across all water users in
the scheme.
The amendment to the plan will allow any additional supply into the Lockyer to be accommodated.
G.5 Central Lockyer water supply scheme
G.5.1 Background
Releases are made from Bill Gunn Dam and Lake Clarendon into Laidley and Lockyer creeks to recharge
the adjoining alluvial aquifer and to provide surface water for pumping.
In 1991 the benefitted groundwater area was defined based on an understanding of the benefits of releases
down Laidley Creek and into Lockyer Creek from Bill Gunn dam. In 1997 the benefitted groundwater area
was expanded to include that area that would benefit from releases from Lake Clarendon down Lockyer
Creek. A map of this benefitted area is shown in Figure F.1.
G.5.2 Releases from Bill Gunn Dam and Lake Clarendon
Bill Gunn Dam releases water into Showgrounds Weir on Laidley Creek (Figure F.1). The upstream point of
the full supply storage in this weir is AMTD 19.1 km. The first releases from Bill Gunn Dam were made in
1988. When first constructed, water from this dam was released down Laidley Creek to its junction with
Lockyer Creek and beyond to Kentville Weir at AMTD 46.4 km on Lockyer Creek.
Water is released from Lake Clarendon into Jordan Weir, which backs up to AMTD 70.9 km on Lockyer
Creek. releases continue down the Lockyer Creek to Kentville Weir. The first water was released from Lake
Clarendon in February 1996.
Releases are made strategically from both dams to service the supplemented areas of Laidley and Lockyer
creeks as described above.
Releases generally occur after a natural flow event. Water is harvested into the dams during the natural flow
event and releases are made from the dams as the natural flow reduces and/or stops. The benefits of
releases are to maintain groundwater levels in the good recharge areas at a higher level for longer which
allows more time for groundwater from these areas to move down gradient through the aquifer to other
areas. Releases at higher rates will generally result in higher heads in the creeks and higher recharge rates,
although where weirs are present. they have the advantage of maintaining higher heads from lower flow
rates.

130 Not Government Policy
Figure F.1 : Map of benefitted boundary as at 1997 determinations

131 Not Government Policy
Appendix H. Letter from Seqwater


132 Not Government Policy
Appendix I. Letter from Government

Queensland Government
Department of
14 June 2019
Natural Resources, Mines and Energy
To whom it may concern
The purpose of this letter is to provide input from the State Government's Project Steering Committee in the development of the Water for the Lockyer Project, as the consideration of the opportunity to achieve a step change economic outcome for the Lockyer and Somerset Regions, moves from the strategic business case to detailed business case phase.
In moving forward, it is important to acknowledge that Wivenhoe Dam and the Western Corridor Water Recycling Scheme (WCRWS) are key bulk water supply assets within the South East Queensland Water Grid which has been developed by the Queensland Government to provide water security for urban populations (and the associated businesses) in South East Queensland.
The costs of developing and operating these assets are currently being recouped from urban water and industrial customers in South East Queensland.
The population of South East Queensland is expected to grow by almost two million people by 2041. As a result, South East Queensland's requirements for urban water are expected to grow substantially.
Consequentially, the availability and reliability of these water sources for any use such as irrigation water for the Lockyer are likely to diminish as the urban population of South East Queensland expands.
Any business case and investment decisions regarding the use of these assets needs to adequately consider these facts and any risks that they may pose to any investment, either on farm, or in the development of future infrastructure to provide water to the Lockyer Valley.
The Water Security Program for South East Queensland contains a series of triggers for the recommissioning of the Western Corridor Recycled Water Scheme assets.
With current combined SEQ Dam Levels below 70%, Seqwater and the State Government are currently reviewing recommissioning arrangements and costs.
The timing of recommissioning of the Western Corridor assets is entirely related to dam levels and urban water security for SEQ.
Level 5, 1 William Street PO BOX 15216, City East Queensland 4002 Australia Telephone +61 7 (07) 3096 6334 www.dnrme.q1d.gov.au ABN 59 020 847 551

In terms of the Water for the Lockyer project some key facts are worth documenting;
• If the WCRWS is not to be used for augmenting urban water supply there may be impacts to both the WCRWS and the Wivenhoe options in the Strategic Business Case in terms of costs, benefits and pricing.
• The WCRWS options for supply to Lockyer are put forward on the basis of the WCRWS being available as a source for the Lockyer after being "turned on" for urban water supply. The costs associated with this option would significantly increase if this assumption was not realised i.e. if the WCRWS were turned on solely for the supply to Lockyer which is acknowledged in the report as prohibitive.
• In terms of the Wivenhoe option in the Strategic Business Case, the ability to supply significant volumes of water from Wivenhoe to the Lockyer Valley is underpinned by the ability to bring the WCRWS into operation earlier than would otherwise be the case to ensure no net impact on SEQ urban water security. Furthermore, the costs associated with a "bring forward" are to be factored into the price at which water would be made available to irrigators.
To provide direction to any future detailed business case assessment the Queensland Government Project Steering Committee has identified a series of principles and approaches which should underpin any detailed business case assessment (Attachment 1).
In closing, it is also important to recognise that the Queensland Government reserves all of its decision making authority on this matter.
Yours sincerely
David Wiskar Executive Director, Water Policy, Policy Division
Attachment
Principles for the Development of a Detailed Business Case (DBC) Water for the Lockyer
• The DBC must be developed in accordance with the Building Queensland Business Case Development Framework.
• Economic assessment must occur in accordance with the Building Queensland Cost Benefit Assessment guidelines with strict adherence to the appropriate inclusions in costs and benefits.
• Pricing of water needs to occur in the first instance based on full cost recovery principles (including return on, and of, capital as well as all ongoing operational and maintenance costs).
• Demand for water from the additional water supply and security options need to be assessed specifically in the context of the price at which water would be available.
• Consideration of an appropriate level of customer commitment (i.e. commensurate with the level of detail of the assessment) should be incorporated into the DBC process.
• SEQ Urban water security cannot be negatively impacted by any of the options for additional water supply or security.
• SEQ urban water users must not be responsible for any increase in costs associated with any option considered.

133 Not Government Policy
Appendix J. Letter from the Lockyer Valley and Somerset Water Collaborative
Note: The issues raised in the attachment to the letter have been discussed at the PWG meeting on 22 July
2019 and the agreed response incorporated in this report.

LOCKYER VALLEY+ SOMERSET
WATER COLLABORATIVE
Kind regards
Project Office
Lockyer Valley Regional Council
P 0 Box 82, Gatton, Old 4343
Phone: 1300 005872
www.lvandswatercollaborative.com.au
19 July 2019
Mr David Wiskar
Executive Director
Water Policy I Policy Division
Department of Natural Resources, Mines and Energy
Dear David,
Following completion of the Draft Strategic Business Case for the Water for the Lockyer Project by
Jacobs Advisory, the Lockyer Valley & Somerset Water Collaborative recently conducted a workshop
to consider its contents and recommendations. The workshop was held on Thursday 4 July and was
facilitated by Tom Vanderbyl (Badu Advisory). We also benefited from the attendance and input
from Matt Bradbury.
The Collaborative also consider the letters from Seqwater and yourself that have been attached as
appendices to the draft report.
I have attached a table which lists a range of issues which the Collaborative would like addressed
prior to the finalisation of the Strategic Business Case. A number of these issues will be taken on
Board by Jacobs as matters of clarification, however others may require broader consideration.
Stephen Robertson
Chair — Lockyer Valley Somerset Water Collaborative
P : 0447 068 569
Project Office
Lockyer Valley Regional Council
PO Box 82 Gatton, Old 4343
www.lvandswatercollaborative.com.au
P : 1300 005 872
Project Partners
(L..) Somerset
"11,414LOCKYER - Chamber of Commerce • :II
& Indusby Eueosiug Our Rzeion
Urban! 1 ihues
UNUC lockyer water 11- frior$ forum
REGIONAL COUNCIL

Stra
teg
ic q
uett
ion
s /
issu
e,
The LVSWC notes that at Section 5.3.3. (p31 of the • With respect to further consideration of Option 7 — Increase Diversion Capacity and Option 8 - Weir & Report) the various assets and schemes owned and Channel Improvements, the draft Strategic Business Case be updated to: operated by Seqwater in the Lockyer Somerset • note and detail the work proposed to be undertaken to upgrade and improve or redesign the regions and the past performance of some of these operational efficiencies of existing water assets including weirs and channels.
assets are listed. • note that, as a consequence DNRME may need to refine the rules by which the water may be taken • re Clause 5 of the recommendations, change "may" to "will".
The LVSWC understands that Seqwater is undertaking
work to assess ways to improve the operational efficiencies of these assets including a review of operational rules and capital upgrades.
The LVSWC further notes that Seqwater's letter to DNRME (attachment H) also does not refer to this
body of work.
Grower representatives of LVSWC noted that the • Suggest including a paragraph in the SBC referring to the type of information that will be required (noting that
Gross margins approach adopted in the draft SBC this will not be the same as that required by Building Queensland) in preparation for discussions with growers does not reflect how their members assess on-farm in advance of undertaking the demand assessment
infrastructure investment opportunities. It is more • Reference 2017 WSP Report - Lockyer catchment preliminary socio-economic study re: farm gate information common that growers adopt a farm gate value • Review Appendix A para 2 (p107) to remove suggestion that the new water would be used for grazing — methodology, perhaps replace with lower value uses.
Page 39. re increase in crop cycles from 1.5 to 2.5 per • add clarification to para on page 39 that the draft SBC has assumed that not every landholder would take up annum does not seem to translate to a corresponding the opportunity to increase crop production/cycles which would conservatively result in 50,000 ML additional increase in production demand (although this could be significantly more).
Page 61. Table 10.1 - LVSWC seeks to clarify who • Move these options to the ongoing list in the Conclusions (as well as the relevant tables in the body of the
should lead complimentary options with respect to report) future market opportunities and supply chain • Re: Market Opportunities & Supply Chain Improvement Studies — Lockyer Valley Regional Council is offering to
improvements studies? Note at p96. (Table 13.4) lead collaboration with industry (including securing sources of funding).
currently 'Government' listed as responsible for
undertaking these studies.
• Need to benchmark existing to enable measurement of activities undertaken from this point in time.

Str
ate
gic
que
ttio
nt / i
While important, and given the number of
recommended actions, LVSWC is concerned that the
work on the list of complementary options may slow
down the work required to develop a Detailed
Business Case.
• LVSWC acknowledges that work on the complementary options are important however the priority action is
the developing Detailed Business Case. LVSWC is seeking assurances that should the Water for the Locker
Project proceed to the next stage Detailed Business Case, that this work will not be unduly delayed or
distracted by work on the list of complimentary options.
Page 105 Conclusions Recommendation 2 LVSWC
Grower Representatives consider that that Option 20
is sufficiently different to options 19 and 23 that it
should be uncoupled from the preferred options going forward as it would involve more complex
management arrangements arising from recharge of
water to the aquifer
•
•
Recommend add third dot point to recommendation 2 referring specifically to Option 20 and to
correspondence from Growers to DNRME outlining their concerns regarding implications for water metering
across the whole valley.
LVSWC requests that this correspondence be attached to the SBC as an appendix.
LVSWC notes Seqwater's strong preference regarding
ownership and funding of infrastructure to facilitate
delivery and distribution of new water supplies to the
Lockyer Valley & Somerset regions. It is further noted
that Seqwater proposes developing a joint position
with DNRME on the governance and decision-making
framework in this regard.
• LVSWC seeks early engagement with Seqwater and DNRME to consider options on how new water
infrastructure might be owned and managed including models of local management as part of development of
the detailed Business Case.
Page 103 13.4.5 (Cost Reflective Pricing) LVSWC is
concerned about the impact of requiring irrigators to pay fixed charges in years that supplies receive no
water. This may be a significant disincentive for
growers to enter into long term contracts and
therefore undermine the business case.
• LVSWC request analysis of options for how fixed and variable charges may be structured around water
availability as part of the development of the detailed business case. One option to consider to enable consideration of a wide range of options is to replace the term "annual fixed charge" with "long-term average
annual cost" in the SBC.

N245
Jacobs is one of the world’s largest and most diverse providers
of full-spectrum technical, professional and construction services
for industrial, commercial and government organisations globally.
For more information visit www.jacobs.com