water framework directive development of classification ... of the... · water framework directive...
TRANSCRIPT
Water Framework Directive development of
classification tools for ecological assessment:
Macroalgae Species Richness
Wells, E., Wilkinson, M., Wood, P.,
Scanlan, C. & Best. M.
Water Framework Directive – United Kingdom Technical
Advisory Group (WFD-UKTAG)
UK TAG Report - Macroalgae on Intertidal Rocky Shores
Page | 1
Contents
1. Summary ....................................................................................................................................... 6
2. Background to the Water Framework Directive (WFD) .......................................................... 6
3. UK Process of WFD Development ............................................................................................ 8
3.1. UK TAG ................................................................................................................................ 8
3.2. MPTT .................................................................................................................................... 9
4. Normative definitions ................................................................................................................. 10
4.1. Evolution of Expanded Normative Definitions .............................................................. 12
4.2. Reference Conditions ....................................................................................................... 14
4.3. Ecological Quality Status ................................................................................................. 15
5. Macroalgae Species Composition Tool .................................................................................. 16
5.1. Background to the Rocky Shore Macroalgae Tool ...................................................... 18
5.2. Development of Database ............................................................................................... 19
5.3. Development of Tool ........................................................................................................ 21
5.3.1. Geographic Variation ............................................................................................... 21
5.3.2. Reduced Species List .............................................................................................. 25
5.3.3. Natural Environmental Variables ........................................................................... 29
5.3.4. Species Composition ............................................................................................... 32
5.4. Establishing Class Boundaries ....................................................................................... 33
5.5. Metric System .................................................................................................................... 34
5.5.1. Full Species Richness Metric ................................................................................. 34
5.5.2. Reduced Species Richness Metric ........................................................................ 37
5.5.3. Summary of the Classification Process ................................................................ 42
5.6. Application of the Rocky Shore Macroalgae Tool ........................................................ 43
5.7. Worked Example ............................................................................................................... 44
5.7.1. Case Study – Milford Haven ................................................................................... 44

UK TAG Report - Macroalgae on Intertidal Rocky Shores
Page | 2
5.7.2. Case Study – Outer Solway South ........................................................................ 49
6. Response to Pressure ............................................................................................................... 51
6.1. Response to Pressure Gradient ..................................................................................... 53
7. Levels of Confidence ................................................................................................................. 55
7.1. Confidence in Sampling Frequency ............................................................................... 55
7.2. Confidence in Data ........................................................................................................... 56
7.3. Confidence of Classification ............................................................................................ 57
8. European Intercalibration .......................................................................................................... 61
9. References .................................................................................................................................. 66

UK TAG Report - Macroalgae on Intertidal Rocky Shores
Page | 3
List of Tables
Table 1: Number of sampled shores held within the database for each of the geographical
areas.
Table 2: Species lists for each of the defined geographic areas of Northern Ireland, Scotland
and Northern England, and Southern England, Republic of Ireland and Wales.
Table 3: Field sampling sheet to record basic shore descriptions with scores indicating the
weighting of each of the shore characteristics to be used in the final scoring system.
Table 4: Descriptions of the different functional groups used in placing species into the two
ecological status groups indicating functional groups as modified by Wells (2002) from Littler
et al (1983).
Table 5: Calculation of ‘de-shoring’ factor for all possible shore description values based on
the predicted levels of species richness
Table 6: Macroalgae species richness and composition index scoring system and final
classification boundaries.
Table 7: Boundaries values the five parameters for Scotland/Northern England area.
Table 8: Boundaries values for the five parameters for England/Wales/RoI.
Table 9: Boundaries values for the five parameters for Northern Ireland.
Table 10: Calculation of ‘de-shoring’ factor for all possible shore description values based on
the predicted levels of species richness from a reduced species list
Table 11: Metric component results for 5 sites within Milford Haven using the full species list
Table 12: Metric component results for 5 sites within Milford Haven using the reduced
species list
Table 13: Final quality status and EQR for Milford Haven including the maximum, minimum
EQR values for the individual components, Standard deviation and standard error using the
full species list.
Table 14: Final quality status and EQR for Milford Haven including the maximum, minimum
EQR values for the individual components, Standard deviation and standard error using the
reduced species list.
Table 15: Metric component results for 10 sites within the Outer Solway South using the full
species list
Table 16: Final quality status and EQR for the Outer Solway South including the individual
site classifications, Standard deviation and standard error using the reduced species list.

UK TAG Report - Macroalgae on Intertidal Rocky Shores
Page | 4
Table 17: Cumulative species lists from Traill, Wilkinson and Scanlan and Wells
demonstrate the initial high levels of diversity prior to the outfalls followed by its decline
during the period of effluent discharge (1986-1987) and subsequent and gradual recovery.
Table 18: Application of the Confidence of Class.
Table 19: Level of confidence associated with sampling effort based on the number of
sampling occasions within the 6 year sampling period and the total number of sites sampled
within a single water body.
Table 20: Macroalgae reduced species list metric scoring system for the UK, RoI and
Norway.
Table 21: Reduced species list for the intercalibration process for the UK, RoI and Norway.

UK TAG Report - Macroalgae on Intertidal Rocky Shores
Page | 5
List of Figures
Figure 1: Suggested Ecological Quality Ratio; Annex V, 1.4.1 (From COAST Guidance,
Vincent et al., 2002).
Figure 2: MDS plot showing the similarities in species composition and richness between
countries in the UK and RoI.
Figure 3: Multidimensional scaling showing the similarities in species composition and
richness between just England, RoI, Scotland and Wales with a 2d minimum stress of 0.19.
Figure 4: Map of the UK and Republic of Ireland indicating the boundaries used for the
compilation of the three reduced species lists whereby spots represent those sites for which
species records are available and have been used in the algal database for establishing
such geographic boundaries.
Figure 5: Exponential model for the relationship between shore description and species
richness.
Figure 6: Exponential model for the relationship between shore description and species
richness using a reduced species list.
Figure 7: Flow chart summarising the main stages of an assessment of macroalgae on
rocky shores
Figure 8: Map of macroalgae sampling locations in Milford Haven
Figure 9: EQR values for the full species list for individual sites within Milford Haven with
error bars representing the standard error.
Figure 10: EQR values for the reduced species list for individual sites within Milford Haven
with error bars representing the standard error.
Figure 11: EQR values for the full species list for individual sites within the Outer Solway
South with error bars representing the standard error.
Figure 12: Numerical species richness totals for Joppa during 1977 & 1987 (Wilkinson et al
Figure 13: Sampling scheme for RSL tool
Figure 14: Power curve describing the relationship between EQR variability and mean EQR
Figure 15: Illustration of the effect of the logit transformation of EQR

UK TAG Report - Macroalgae on Intertidal Rocky Shores
Page | 6
1. Summary
This report discusses the Water Framework Directive Rocky shore macroalgal species
richness tool. The report consists of a general background to the WFD, the management
groups, normative definitions and reference conditions.
With these in mind the provenance of the tool is discussed emphasising that species
richness has been shown to remain constant in the absence of anthropogenic disturbance.
Abundance is highly variable and dependent upon natural as well as anthropogenic
pressures, therefore it is not considered to be a valid measure of quality. Ephemeral or
opportunist algae come and go; often there is a cycle from Fucoid to barnacle domination,
hence levels of species richness are more important than the individual levels of species
coverage.
Ideally a “full species list” (FSL) is used; however, the identification of over 700 intertidal
seaweed species requires high levels of taxonomic expertise. Therefore a “reduced species
list” (RSL) was derived. There are 3 RSLs for the UK comprising around 70 taxa each and
100 taxa overall.
The development of the algal database, reference and threshold setting are discussed
together with the need to take account of the variability of the shore and the response to
pressures.
Consideration is also given to calculating the final EQR using worked examples, and of
calculating the confidence of classification.
2. Background to the Water Framework Directive (WFD)
The Water Framework Directive 2000/60/EC (WFD, 2000) governs the protection,
improvement and sustainable use of inland surface waters, transitional waters (TW), coastal
waters (CW) and groundwater. The Directive, which came into effect on 22nd December
2000, updates existing water legislation and establishes a new integrated water
management system based on river basin planning. The key aims of the WFD are out lined
below:
To prevent further deterioration and protect and enhance the status of aquatic
ecosystems and associated wetlands;
To promote sustainable use of water; and provide sufficient supply of good quality
surface water and groundwater.
To reduce pollution of waters from priority substances
To prevent deterioration in the status and to progressively reduce pollution of
groundwater; and

UK TAG Report - Macroalgae on Intertidal Rocky Shores
Page | 7
To contribute to mitigating the effects of floods and droughts.
The main purpose under Water Framework Directive guidelines is to develop robust
ecological quality objectives (EQOs) for assessment of anthropogenic / human induced
pressures in TWs and CWs by looking beyond the drivers of change and linking physical and
chemical conditions with a measurable biological response in the community.
The Water Framework Directive requires that defined areas of waters (i.e. water bodies)
“achieve good ecological and good chemical status” by 2015 unless there are grounds for
derogation. Annex V of the Water Framework Directive 2000/60/EC specifies the quality
elements and normative definitions on which the classification of ecological and chemical
status is based. Normative definitions outline what aspects of the biological elements should
be assessed and is the main driver behind the tool development.
The Directive’s requirements include ecological status and chemical status classification
schemes for surface water bodies which will differ for rivers, lakes, transitional waters and
coastal waters. Heavily modified and artificial water bodies will be assessed in relation to
their ecological potential and chemical status classification schemes. The quality elements
addressed in Annex V for assessing ecological status and ecological potential are:
biological quality elements;
general physico-chemical quality elements;
environmental Quality Standards (EQSs) for synthetic and non-synthetic pollutants;
and
hydromorphological quality elements.
The specific biological requirements for transitional waters are:
the composition and abundance of phytoplankton,
macroalgae
angiosperms,
benthic invertebrates
fish fauna.
For coastal waters the biological elements are:
composition and abundance of phytoplankton,
aquatic flora (macroalgae and angiosperms)
benthic invertebrates.
For the ecological status and ecological potential classification schemes, the Directive
provides detailed normative definitions of the degree of human disturbance to each relevant
quality element that is consistent with each of the ecological status/potential classes. These
definitions have been used to develop classification tools and appropriate numeric class

UK TAG Report - Macroalgae on Intertidal Rocky Shores
Page | 8
boundaries for each quality element. The results of applying these classification tools are
used to determine the status of each water body or group of water bodies.
Therefore the UK was required to put into place a regime of monitoring water bodies that
supports monitoring their status in terms of risk of not meeting the objectives of WFD by
2006. This requires the UK to establish both national monitoring framework and classification
schemes as well as contributing to the European intercalibration process. This report
outlines progress to date on the development of the rocky shore macroalgae classification
tools, mainly within coastal waters, to support assessment of the biological quality elements.
3. UK Process of WFD Development
3.1. UK TAG
The WFD UKTAG is the United Kingdom Technical Advisory Group (UKTAG) supporting the
implementation of the European Community (EC) Water Framework Directive (Directive
2000/60/EC). It is a partnership of experts from the UK conservation and environment
agencies and the Department of Environment and Local Government for the Republic of
Ireland which meets quarterly. Its main function is to provide coordinated advice on technical
aspects of the implementation of the Water Framework Directive (WFD). This aims to
facilitate a coordinated approached to the identification and characterisation of water bodies
based on their physical attributes and furthermore assessing the risk of such water bodies
failing to achieve the WFD's environmental objectives. It works alongside various experts,
and government and stakeholder groups, to develop common approaches to implementation
based on classification systems within the UK, guided by UK environmental standards, and
further used for intercalibration across Europe. This guidance work is timetabled enabling a
framework for general WFD implementation including monitoring, which commenced in
December 2006, and setting environmental objectives under the WFD within the UK and
Europe.
Overall the UK TAG group initially provided guidance on;
Development of typology of surface waters (describing water bodies into common
types) and establishment of type specific reference conditions for the
classification of UK waters;
The definition and subsequent analysis of pressures and impacts for the
assignment of water bodies to risk categories;
The development of classification tools and methods that will support monitoring
of ecological status.
Development of an overall monitoring framework that supports meeting the
different requirements of the Directives and future Program of Measures including
operational and surveillance monitoring to track base-line changes in status of UK
water bodies as well as compliance monitoring.

UK TAG Report - Macroalgae on Intertidal Rocky Shores
Page | 9
Production of initial reports for the European Commission on characterisation and
pressures and impacts analysis.
Assist with Europe intercalibration process (known as ECOSTAT) that will support
defining the thresholds between statuses of water bodies under the WFD (high,
good, moderate, poor).
The UKTAG initiated the development of the classification tools, during the 2003/04 period,
with the lakes, rivers and marine task teams formed and tasked to: ‘coordinate the
adaptation and development of suitable surface water classification tools for the biological
quality elements’ under the compliance of the European Common Implementation Strategy
(CIS). Some of these elements historically are part of UK classification systems whilst others
pose new requirements to support assessment of ecological status. To help implement its
work programme, UKTAG has established a number of specialist groups:
Task teams and steering groups comprising experts from the environment and
conservation agencies. These are focused on specific themes or actions (e.g. lakes,
rivers, river basin planning etc). These groups may initiate new research programs.
Drafting Groups - Small short-lived groups of experts charged with producing specific
advice (e.g. drinking water guidance).
The Marine Task Team (MTT) leads the development of classification systems within
Transitional and coastal, providing further guidance to the relevant subgroups including the
Marine Plants Task Team (MPTT).
3.2. MPTT
The Marine Plants Task Team consists of a number of represents from various government
agencies to provide expertise on the translation, development and implementation of the
WFD. It met every 4-6 months to discuss progress within the phytoplankton, macroalgae and
angiosperm classification tools as driven by the MTT and UK TAG. The Marine Plant Task
Team’s role has been to translate the WFD legislative report into practical ecological and
scientific classification methods for marine plants and in so doing have developed a number
of classification tools to represent the requirements of the WFD.
Within this group the UK and RoI representatives have had to ensure harmonisation of
ecological classification systems across respective systems to ensure a coherent approach
by both member states. The tools are being developed both 'in house' and by consultants
and funded from a number of sources including the environment agencies, SNIFFER, and
the Irish North South (SHARE) project, which is INTERREG funded and is being managed
jointly between authorities in Northern Ireland and the Republic of Ireland. The approach
includes the:
review and adaptation of existing methods for potential to support classification
schemes under the WFD;
development of new tools for elements not previously monitored in the UK;

UK TAG Report - Macroalgae on Intertidal Rocky Shores
Page | 10
assessing which parameters have the best correlation for assessing pressures and
impacts;
development of reference conditions from which to base boundary criteria;
trialling such tools in the assessment of ecological quality status; and
review, comparison and agreement of methods with EU Members States to comply
with intercalibration requirements
This document describes the process involved in the development stages of the macroalgae
tool considering its theoretical and practical elements, subsequent implementation and
inclusion in the European Intercalibration process. The tools are grounded in scientific
knowledge and published research, but wherever there is uncertainty or a scarcity of
quantitative scientific evidence the precautionary principle has been invoked.
4. Normative definitions
The criteria by which ecological status should be evaluated are detailed in the normative
definitions in Annex V (1.2) of the Water Framework Directive. Normative definitions provide
definitions of ecological quality and the values for the quality elements of ecological status
for coastal and transitional waters. They describe the various aspects of macroalgae that
must be used in the ecological status assessment of a water body. Indices (‘tools’ or
‘metrics’) have been developed to address these aspects of the normative definitions for
each of the five status classes. The WFD normative definitions specify which aspects of
each biological quality element must be assessed, and the plants tools have been
developed accordingly.
The normative definitions relating to macroalgae are outlined below for transitional and
coastal waters.
Transitional Waters
HIGH The composition of macroalgal taxa is consistent with undisturbed conditions.
There are no detectable changes in macroalgal over due to anthropogenic
activities.
GOOD There are slight changes in the composition and abundance of macroalgal
taxa compared to the type-specific communities. Such changes do not
indicate any accelerated growth of phytobenthos or higher forms of plant life
resulting in undesirable disturbance to the balance of organisms present in
the water body or to the physico-chemical quality of the water.
MODERATE The composition of macroalgal taxa differs moderately from type-specific
conditions and is significantly more distorted than at good quality. Moderate
changes in the average macroalgal abundance are evident and may be such
as to result in an undesirable disturbance to the balance of organisms
UK TAG Report - Macroalgae on Intertidal Rocky Shores
Page | 11
present in the water body.
POOR Major alterations to the values of the biological quality elements for the
surface water body type.
Relevant biological communities deviate substantially from those normally
associated with the surface water body type under undisturbed conditions.
BAD Severe alterations to the values of the biological quality elements for the
surface water body type.
Large portions of the relevant biological communities normally associated
with the surface water body type under undisturbed conditions are absent.
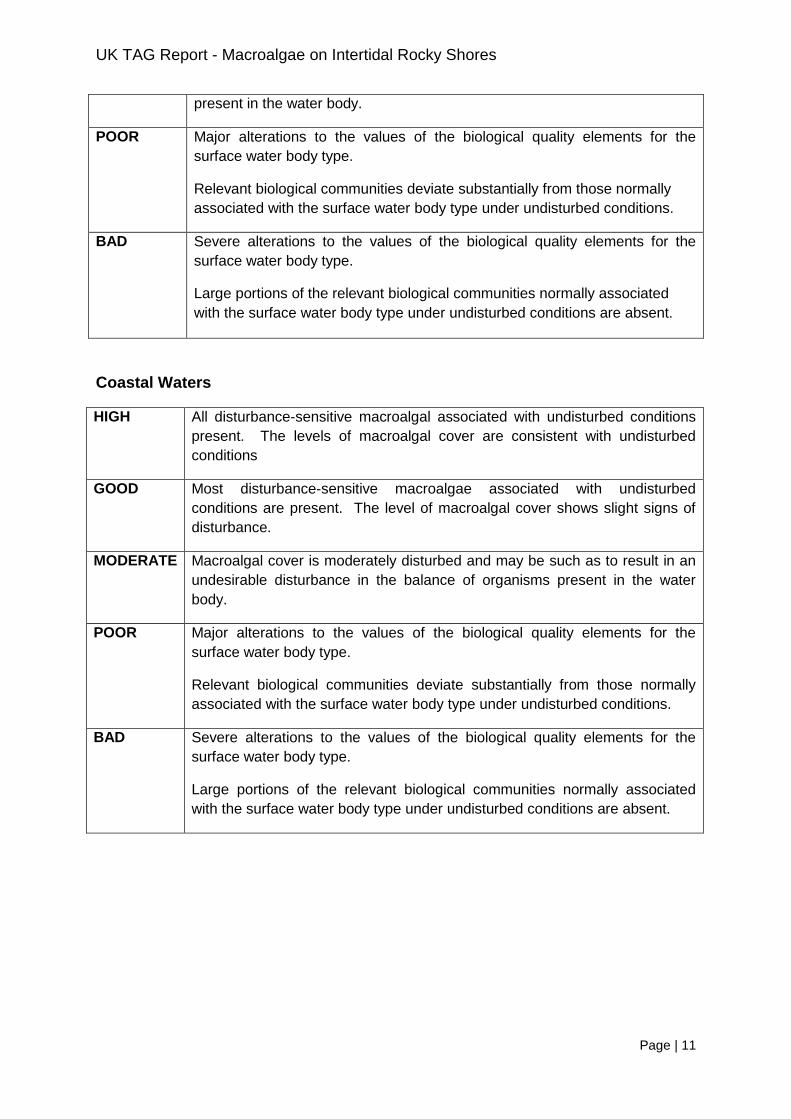
Coastal Waters
HIGH All disturbance-sensitive macroalgal associated with undisturbed conditions
present. The levels of macroalgal cover are consistent with undisturbed
conditions
GOOD Most disturbance-sensitive macroalgae associated with undisturbed
conditions are present. The level of macroalgal cover shows slight signs of
disturbance.
MODERATE Macroalgal cover is moderately disturbed and may be such as to result in an
undesirable disturbance in the balance of organisms present in the water
body.
POOR Major alterations to the values of the biological quality elements for the
surface water body type.
Relevant biological communities deviate substantially from those normally
associated with the surface water body type under undisturbed conditions.
BAD Severe alterations to the values of the biological quality elements for the
surface water body type.
Large portions of the relevant biological communities normally associated
with the surface water body type under undisturbed conditions are absent.
UK TAG Report - Macroalgae on Intertidal Rocky Shores
Page | 12
4.1. Evolution of Expanded Normative Definitions
These Normative definitions have been expanded by the MPTT (Dublin 2004) to provide
examples of how they apply directly to the composition of macroalgae within Coastal waters.
These descriptions form the basis for the development of the rocky shore macroalgae tool
currently being used for WFD ecological assessment. Expansion of the normative definitions
have not been included for transitional waters as this tool can only be applied to coastal
waters or where the outer reaches of transitional waters are representative of fully saline
rocky shores. So the expanded definitions incorporate all instances in which the tool may be
applied.
UK TAG Report - Macroalgae on Intertidal Rocky Shores
Page | 13
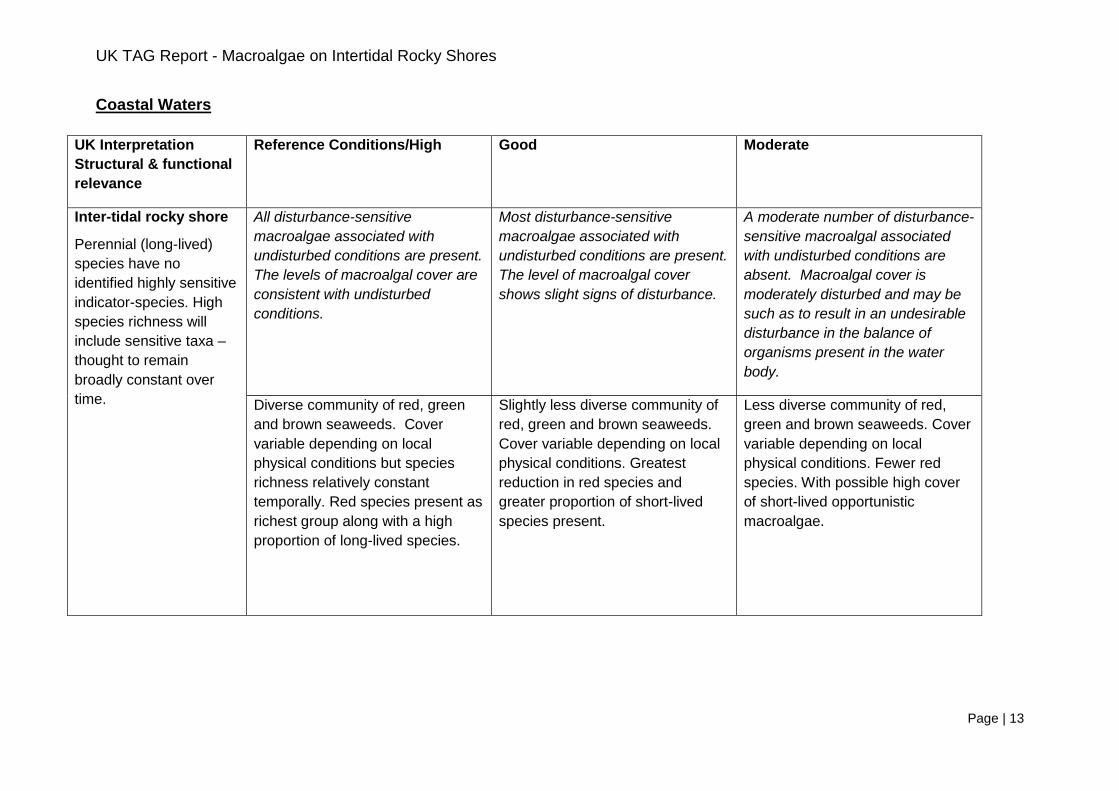
Coastal Waters
UK Interpretation
Structural & functional
relevance
Reference Conditions/High Good Moderate
Inter-tidal rocky shore
Perennial (long-lived)
species have no
identified highly sensitive
indicator-species. High
species richness will
include sensitive taxa –
thought to remain
broadly constant over
time.
All disturbance-sensitive
macroalgae associated with
undisturbed conditions are present.
The levels of macroalgal cover are
consistent with undisturbed
conditions.
Most disturbance-sensitive
macroalgae associated with
undisturbed conditions are present.
The level of macroalgal cover
shows slight signs of disturbance.
A moderate number of disturbance-
sensitive macroalgal associated
with undisturbed conditions are
absent. Macroalgal cover is
moderately disturbed and may be
such as to result in an undesirable
disturbance in the balance of
organisms present in the water
body.
Diverse community of red, green
and brown seaweeds. Cover
variable depending on local
physical conditions but species
richness relatively constant
temporally. Red species present as
richest group along with a high
proportion of long-lived species.
Slightly less diverse community of
red, green and brown seaweeds.
Cover variable depending on local
physical conditions. Greatest
reduction in red species and
greater proportion of short-lived
species present.
Less diverse community of red,
green and brown seaweeds. Cover
variable depending on local
physical conditions. Fewer red
species. With possible high cover
of short-lived opportunistic
macroalgae.
UK TAG Report - Macroalgae on Intertidal Rocky Shores
Page | 14
4.2. Reference Conditions
The Water Framework Directive states type-specific biological reference conditions
may be spatially based, based on modelling, or derived using a combination of these
methods. For spatially based type-specific biological reference conditions, Member
States are developing a reference network for each surface water body type.
Predictive models or hind-casting methods should use historical, palaeological and
other available data. Where it is not possible to use these methods, expert
judgement may be used to establish such conditions (Annex II 1.3).
To a large extent, suitable substrate dictates the potential macroalgae assemblage
likely to colonise in a waterbody. Defining type-specific reference conditions is
problematic because for transitional waters substratum characteristics only partially
inform the typology, and in coastal waters the substratum is not a defining
characteristic of typology at all. This means reference conditions are not type-
specific; rather they may vary within a type or may be common across types. Three
macroalgae tools have been developed for transitional and coastal waters depending
on substratum.
For macroalgae on rocky shores predictive models of macroalgae community
composition and abundance under varying environmental conditions do not exist;
consequently this is not a viable approach for establishing reference conditions.
Reference conditions have been established using a combination of expert
judgement and data from sites considered to be near pristine. Historic macroalgal
species lists exist for a small number of sites and these have been used to inform
reference conditions. From the marine benthic algal database the species records
from those sites deemed as ‘high quality’ were used from which to set reference
conditions. This decision was taken as such comprehensive species lists should
ideally be representative of high quality shores with which other shores will be
compared, and will therefore act as a reference condition.
High Status
The taxonomic composition corresponds totally or nearly totally with undisturbed
conditions and disturbance sensitive taxa are present. Also there are no detectable
changes in macroalgae abundance due to anthropogenic activities. The species
composition is unaltered from reference conditions. There is a diverse community of
red, green and brown seaweeds with high levels of species richness. Cover is
variable depending on local physical conditions but species richness remains
relatively constant over time. Red species are present as richest group along with a
high proportion of long-lived species including brown algae. Opportunist and green
species should constitute a lower proportion of the algae present
Good status
Most disturbance-sensitive macroalgae associated with undisturbed conditions are
present. The level of macroalgal cover shows slight signs of disturbance. There is a
slight deviation from the reference conditions. There is a slightly less diverse
community of red, green and brown seaweeds with a corresponding decrease in

UK TAG Report - Macroalgae on Intertidal Rocky Shores
Page | 15
species richness. Cover is variable depending on local physical conditions. The
greatest reduction is in red species and a greater proportion of short-lived species is
present. The proportion of brown species stays relatively constant.
Moderate status
A moderate number of disturbance-sensitive macroalgae associated with undisturbed
conditions are absent. Macroalgal cover is moderately disturbed and may be such
as to result in an undesirable disturbance in the balance of organisms present in the
water body. Moderate status is characterised by a moderate deviation from the
reference conditions. There is a less diverse community of red, green and brown
seaweeds. Cover is variable depending on local physical conditions. There is a
decrease in the proportion of red species with a possible high cover of short-lived
opportunistic macroalgae. The algal community shows a greater dominance of green,
opportunist and ephemeral species. Fewer brown species are present but in similar
proportions.
4.3. Ecological Quality Status
Once reference conditions are established, the departure from these environmental
settings can be measured. The degree of deviation sets boundaries for each of the
ecological status classes. The boundaries between each of the status classes need
to be described and criteria established which reflect the normative definitions.
Annex V 1.4.1 of the Directive states “the results of the (classification) system shall
be expressed as ecological quality ratios for the purposes of classification of
ecological status. These ratios shall represent the relationship between the values of
the biological parameters observed for a given body of surface water and the values
for these parameters in the reference conditions applicable to that body. The ratio
shall be expressed as a numerical value between zero and one, with high ecological
status represented by values close to one and bad ecological status by values close
to zero.” Figure 1 illustrates this concept.
Figure 1: Suggested Ecological Quality Ratio; Annex V, 1.4.1 (From COAST
Guidance, Vincent et al., 2002).
UK TAG Report - Macroalgae on Intertidal Rocky Shores
Page | 16
The comparison of monitoring results with the reference conditions derives the EQR.
The values of the EQR then set for each ecological status class must ensure that the
water body meets the normative definition for that status class given in Annex V
(Tables 1.2, 1.2.3. or 1.2.4). As such the reference conditions form the anchor for
the whole ecological assessment. Ecological status classes will be defined by their
deviation from reference.
5. Macroalgae Species Composition Tool
This paper explains in greater detail the basis of the tool described in Wells et al.
2007.
Annex V of the Water Framework Directive (WFD) states macroalgae are a biological
quality element to be used in defining ecological status of a transitional or coastal
water body. Specifically it outlines the criteria that need to be related to type-specific
reference conditions for macroalgae:
Taxonomic composition corresponds totally or nearly totally with undisturbed
conditions.
There are no detectable changes in macroalgae abundance due to
anthropogenic activities.
Regarding the composition of macroalgae the WFD states that for high quality ‘all
sensitive taxa should be present’. However, it is not known which species are the
sensitive ones in any particular situation, and as sensitive species tend to be less
abundant members of the community, they will not be constantly present even under
good water quality conditions. Additionally, the taxonomic composition of macroalgae
displays considerable variation particularly in relation to the shift from a coastal to
transitional water body requiring the community structure of the extremes of these
two environments to be considered separately. Measuring species composition is
also highly dependent upon the intertidal substrate, requiring hard and often stable
substrate to which to attach. In contrast, detecting changes in macroalgae
abundance is most applicable in sedimentary intertidal areas. Therefore the following
tool was developed to be used primarily for coastal waters, but may be used on
shores within the outer extent of transitional waters where hard substrate is present
and salinity is not markedly reduced.
Macroalgae communities are able to provide a good means of assessing ecological
quality. Such communities are quick to respond to changes in the environment often
providing visible effects. Changes in species richness are often indicative of a
change in the environment induced by human activity. These impacts are also
reflected in a change in the macroalgae species assemblage, often causing a shift
from larger long-lived perennial species to fast-growing, opportunist species, which
are able to take advantage of the more adverse conditions and lack of competition. A
shore may also visibly respond to an increase in anthropogenic activity through a
general decline in algal abundance and cover whereby an algal-dominated
UK TAG Report - Macroalgae on Intertidal Rocky Shores
Page | 17
community may be replaced by sessile and filter feeding fauna. High levels of
suspended solids may interfere with the settlement and growth of macroalgal
sporelings on rocks and may decrease the light penetration particularly within rock
pools (Read et al., 1983). However, abundance is highly variable and dependent
upon natural as well as anthropogenic pressures and therefore is not an ideal
measure of quality, whereas species richness is known to remain constant in the
absence of anthropogenic disturbance.
The effects of sewage pollution were observed at two sites within the Firth of Forth
whereby a large reduction in species richness was accompanied by a high biomass
of Mytilus edulis and Balanus balanoides, which proceeded to dominate the shore.
Such replacement is regarded as typical of chronic pollution by domestic sewage
with pools filled with high levels of suspended matter, deep mud and empty shells
(Knight and Johnston, 1981 and Johnston, 1972). Changes in community structure,
due to the presence of dominant Mytilus and Balanus communities, are capable of
inhibiting growth of algae. This, combined with the direct and/or indirect stress of
adverse effects such as increased suspended matter, reduced light for
photosynthesis and competition for space, ensures recolonisation by macroalgal
communities is inhibited.
However, within intertidal rocky shore communities ephemeral algal species come
and go over several time scales, resulting in variable species composition between
months, seasons and years. Records of species composition are also known to vary
on consecutive days solely through variability in conducting algal field sampling
(Wells, 2002). The abundance of macroalgae on rocky shores can also undergo
massive changes over a period of a few years due to natural variability, for example
from almost total fucoid domination to barnacle domination and back again over 10-
15 years. In contrast species richness remains broadly constant, in the absence of
environmental alteration, over days, months, seasons and years. This was originally
shown by Wilkinson & Tittley (1979) for various shores in the Firth of Forth and
proposed as a better measure of seaweed community stability than the detailed
listing of actual species present, and later substantiated by Wells (2002).
Detailed records have also shown increases in species richness with recovery from
severe pollution using shores subjected to coal mine waste in Co. Durham (Edwards,
1975, Wilkinson, 1998). Wells & Wilkinson (2003) have further confirmed the
constancy of species richness on high quality shores using regular surveys in
Orkney, during which species richness remained stable in consecutive years despite
seasonal fluctuations with summer peaks and winter troughs. It is apparent from
these studies that changes in the intertidal environment through adverse impacts are
reflected in levels of species richness, suggesting this numerical value is a more
appropriate measure of quality than detailed lists of species present.
Unfortunately, intertidal rocky shore environments are also highly variable and this
not only affects the overall composition but also the level of species richness found,
even within areas devoid of human interference. Intertidal algal communities
generally display zonation patterns from the top to the bottom of the shore often with
very distinct bands. These different zones can vary both in their relative height and
extent on the shore as a result of levels of exposure. Sheltered shores are often

UK TAG Report - Macroalgae on Intertidal Rocky Shores
Page | 18
characterised by a dense abundance of fucoids with a distinct transition from upper
to lower shore. This presence of fucoids becomes less apparent as shores become
more exposed, initially forming a more mosaic pattern of faunal and floral species
and later becoming highly dominated by barnacles, mussels and limpets. However
despite exposure appearing to contribute to the abundance and zonation patterns of
algae in the intertidal there is no significant impact on the levels of species richness.
Further studies of the overall shores structure, using data compiled for the Northern
Ireland Littoral Survey (Wilkinson et al., 1988), have indicated a link between species
richness and localised intertidal variables (Wells & Wilkinson, 2002).
These changes in macroalgal communities, as a response to changes in
environmental health, are only reflected within coastal water bodies and occasionally
the outer reaches of transitional waters depending on their shore structure. The
nature of the transitional waters environment, particularly the upper reaches, is very
varied and need to be considered separately. Other tools are being developed for
transitional waters.
5.1. Background to the Rocky Shore Macroalgae Tool
As already stated, ephemeral species come and go from communities on various
time scales varying from months to years. However species richness remains broadly
constant in the absence of environmental alteration. This was originally shown by
Wilkinson & Tittley (1979) for various shores in the Firth of Forth and proposed as a
better measure of seaweed community stability than the detailed listing of actual
species present, later found by Wells (2002). Subsequently it has been shown by
Wilkinson (1998) that species richness increases with recovery from severe pollution
using shores subjected to coal mine waste in Co. Durham (Edwards, 1975). Wells &
Wilkinson (2003) confirmed the constancy of species richness on high quality shores
using regular surveys in Orkney and have shown the importance of taking account of
seasonal variation in establishing a level of species richness for a shore. Therefore
the decision was made in July 2002 by the MPTT to concentrate on numerical
species richness of intertidal rocky shores as a measure of quality rather than
comprehensive listings of species presence.
Unfortunately, the identification of intertidal seaweed species requires high levels of
taxonomic expertise. Therefore one alternative means of recording qualitative
species data would be to implement the use of a reduced species list (RSL) whereby
the number of species from the RSL will be in proportion to total species richness
acting as a surrogate. The list would be composed of species (approximately 70) that
contribute most significantly to the overall species composition of the rocky shores of
a particular type within a geographical area, and this would act as a checklist.
The first requirement was to establish the level of total species richness to be
expected on different shores of varying ecological quality and shore type. Therefore a
database was compiled of species records on a range of shores throughout the
British Isles and the Republic of Ireland. This database was used to seek a reduced

UK TAG Report - Macroalgae on Intertidal Rocky Shores
Page | 19
species list to be used as a surrogate for total species richness. The definitive quality
criterion is the full species richness, the reduced species lists merely acts as a link
between the quality status and species richness. If we accept that a rich shore has
between 60 and 100 species then we should be able to select a smaller species
number, more or less universally present on such shores, which would be in
proportion to the full richness. Such a reduced list could be selected to be those
species that might be reasonably identified unambiguously by biologists in the
agencies that were not seaweed experts.
5.2. Development of Database
An extensive database was developed to ascertain ranges of species richness,
incorporating a variety of sites from around the UK and Republic of Ireland and
consisting of species records from a number of known sources. Some were
published in the scientific literature; some as industrial contract reports or PhD, MSc
and BSc theses, but all were restricted to set criteria:
Intertidal surveys only
Single occasion sampling
Expert taxonomy
Summer month sampling
Similar sampling effort
No known anthropogenic influence
These criteria were imposed in order to provide broadly consistent records so
comparisons between lists from various locations and times could be made. Many
publications in the scientific literature obtain the maximum possible species list for a
shore by amalgamating records collected over several seasons or years and may
also collate recordings from different collectors at widely different dates. This leads
to the majority of published lists being incomparable as they result in a cumulative
taxa list; therefore, only surveys carried out on a single sampling occasion were
included. Most single occasion lists compiled by environmental consultants are
restricted to the common, easily identifiable species, whereas comprehensive lists
compiled by authoritative workers of known taxonomic expertise were required. A
similar degree of sampling effort for each survey was also required, incorporating
time spent on the shore, area surveyed and the number of samplers involved in the
survey. Surveys must also have been undertaken in summer months to standardise
lists for seasonal species richness. Sublittoral records were omitted, as this is a
different environment from the littoral. Shores that were considered to be subject to
anthropogenic influences were also rejected. Other records omitted included those
shores described as harbours, estuaries, saltmarshes and inner sea lochs as these
would be expected to support a smaller number of species. Meeting these
requirements limited the number of published lists that could be used. Species were
recorded as present or absent since few sources gave abundance data. Several
sources of species records met the inclusion criteria particularly well, as described in
the following sections.
Northern Ireland Littoral Survey
UK TAG Report - Macroalgae on Intertidal Rocky Shores
Page | 20
This survey was carried out by Heriot-Watt University, Edinburgh for the Department
of the Environment (Northern Ireland) to enable classification of the different types of
littoral communities found around the coastline of Northern Ireland in order to
appraise the conservation value of the intertidal region (Wilkinson et al., 1988). It
was carried out between 1984 and 1988 and encompassed total seaweed presence
and semi-quantitative abundance data from transects on 128 rocky seashores. This
was accompanied by equally detailed information on the animal communities present
and the physical nature of the environment. It is particularly useful in this respect as
it allowed abundance and other abiotic factors to be taken into consideration. These
Northern Irish results were supplemented by shore species records supplied by the
Northern Irish Environment and Heritage Service (2002-2003), previously unrecorded
shores and repeat surveys of shores from the Northern Ireland Littoral Survey (pers.
comm. Dr. Emma Wells).
British Phycological Society Field Meetings
Members of the British Phycological Society (BPS) undertook surveys during field
meetings, predominantly between 1969 and 1978. These field meetings covered a
diverse range of coastal sites around the UK with broadly consistent sampling effort
and level of taxonomic expertise. This provides truly comparable data and gives a
fair representation of the level of seaweed species richness at that time, with site
selection within the areas being biased in favour of shores un-impacted by
anthropogenic influences.
Channel Tunnel Environmental Impact Assessment
The Institute of Offshore Engineering (IOE) of Heriot-Watt University carried out this
survey for the Channel Tunnel Group. It was an Environmental Impact Assessment
(EIA) on the effect of spoil disposal on two seashores near Dover, Kent, after the
construction of twin railway tunnels (IOE, 1985). Subsequent monitoring during
construction of the channel tunnel included full species lists and quantitative
abundance of common species on fixed transects.
University Theses
Under the supervision of Dr. Martin Wilkinson many Heriot-Watt University
undergraduates and postgraduates have provided useful species records to good
levels of taxonomic quality. This is particularly the case with a Ph.D. thesis looking at
seaweed biodiversity on intertidal rocky seashores (Wells, 2002). This thesis
provides extensive species lists for surveys of shores in Kent, furthering IOE work,
and shores around the Orkney Isles. Several M.Sc. and B.Sc. dissertations were
also used.
Other Literature Sources
Firth of Forth unpublished records of Dr. M. Wilkinson and Mr. I. Tittley (Natural
History Museum, London) collected in the 1980s have been included (Wilkinson,
unpublished) as have several other sources ranging from published scientific
literature to ‘grey’ literature such as consultancy reports by the Natural History
Museum (NHM) for English Nature and Anglian Water, which were particularly useful.

UK TAG Report - Macroalgae on Intertidal Rocky Shores
Page | 21
The UK and RoI now has a large benthic marine algal database on which the original
metric system was based and from which boundaries were derived. This dataset is
held as an Excel file within the Environment Agency and SEPA. There was no
national monitoring programme for macroalgae within the UK prior to the
commencement of the WFD so the initial database consisted of records from known
data sources and grey literature. Several sites have been studied within the last few
years as a consequence of the WFD for both the Intercalibration process, as
subsequent sampling under the requirements of the WFD programme, and as a part
of the requirement to obtain additional data for a variety of different quality sites
covering the full extent of the UK. Data from the RoI using different methodologies
has also been included in this database.
5.3. Development of Tool
In order to develop such a monitoring tool, species records and site details held
within the database were used in conjunction with expert opinion, within the MPTT, to
extract the following information:
1. What are the effects of geographical location on the levels of species richness
and overall composition? If there are regional variations, should there be a
separate RSL for each of these regions (or member states)?
2. How many species should be used to compile a reduced species list to
adequately represent community richness?
3. What is the level of taxonomic resolution deemed to be acceptable for the
identification of those species in the RSL? Some species are relatively easy to
identify taxonomically such as the fucoids, whereas within other genera such as
Ulothrix and Enteromorpha the taxa are less morphologically distinct and
therefore require a higher taxonomic competency.
4. What are the effects of environmental variables on the levels of species richness
and overall composition, and how will this affect the final RSL and levels of
species richness?
5. What is the general composition of algae to be found on shores of high quality?
6. How and where will the limits be set for high, good, moderate and poor quality,
and how will the ecological quality classes from full species richness translate
into numbers in the reduced species list?
5.3.1. Geographic Variation
Marine algae, like other organisms, show geographical distributions, whereby
transitions are recognised by the changes in composition of the coastal flora and
fauna and surface seawater isotherms. Water temperature was thought to be the
main factor governing the geographical distribution of species (Lüning, 1990).
However, Prescott (1969) suggested that the north-south distribution patterns are
determined by temperature, and east-west distributions are related to a greater

UK TAG Report - Macroalgae on Intertidal Rocky Shores
Page | 22
number of factors such as water currents and ancient inter-ocean connections. Often
restrictions on algal growth are due to high or low survival limitations including lethal
limits set by the tolerance of the hardiest life-history stage, reproductive limits and
growth limits (Lüning, 1990; Lobban & Harrison, 1994).
It was suggested by Maggs (1986) that many species consist of geographical
ecotypes with regards to environmental responses. In any one site the algal
composition represents a complex mixture of species in different parts of their
geographical ranges, regarded in the British Isles as northern, southern and
widespread species (Maggs, 1986).
As a consequence the variable species composition of different areas around the
British Isles should be incorporated into the establishment of a reduced species list in
order to account for these geographical variations. It is likely that many of the species
will be common to most areas, but it is also anticipated that some species may be
more frequently recorded on southern or northern shores as a consequence of their
distribution limits.
The coastline was broadly split into 10 different geographic areas based on the sites
for which species records were present within the database (Table 1). An analysis of
similarity (ANOSIM) was calculated to determine the level of similarity or dissimilarity
between the sample groups. ANOSIM calculates a sample statistic R of between 0
and 1, where R=1 represents a strong difference between groups.
Table 1: Number of sampled shores held within the database for each of the
geographical areas.
The greatest degree of significant difference was found between Northern Ireland
and all other areas with R>0.5 for all comparisons. Although there was a greater
affinity between some areas than others, the rest of the results appeared relatively
inconclusive (Figure 2). Data from Northern Ireland were subsequently removed from
the analysis and a second ANOSIM calculation was run. The results of the second
test showed some significant similarities between Wales and southern England and
Republic of Ireland. The northern areas of Scotland, Shetland, Orkney and Northern

UK TAG Report - Macroalgae on Intertidal Rocky Shores
Page | 23
England also showed a similar affinity towards each other. These areas have been
plotted on a multi dimensional scaling diagram (Figure 3). The northern regions
appear to clump together, however the southern regions show a broad degree of
scatter. Some of these more dispersed sites are located on the Island of Lundy, off
the coast of Southern Wales where slightly more unusual species have been
recorded. With few site records for such a large geographic area it is difficult to
establish any significant boundaries for the southern half of England, Wales and the
Republic of Ireland.
Figure 2: MDS plot showing the similarities in species composition and richness
between countries in the UK and RoI.

UK TAG Report - Macroalgae on Intertidal Rocky Shores
Page | 24
Figure 3: Multidimensional scaling showing the similarities in species composition
and richness between England, RoI, Scotland and Wales only with a 2d minimum
stress of 0.19.
Consequently the British Isles has been broadly segregated into three main areas
(Figure 4) based on the geographic distribution of site records and the results these
have produced. The exact boundary between northern and southern England has
been partly driven by the physical nature of the dividing areas. The Wash, north
Norfolk, Merseyside and Lancashire are primarily sedimentary areas with little or no
algal growth and therefore provide a natural break in the rocky shore coastline. It is
likely that with time and increased data the boundaries of these three geographic
areas may shift, but these are the current geographic boundaries used for the
compilation of the three reduced species lists.

UK TAG Report - Macroalgae on Intertidal Rocky Shores
Page | 25
Figure 4: Map of the UK and Republic of Ireland indicating the boundaries used for
the compilation of the three reduced species lists whereby spots represent those
sites for which species records are available and have been used in the algal
database for establishing such geographic boundaries.
5.3.2. Reduced Species List
Unfortunately, the identification of intertidal seaweed species, necessary to record an
accurate level of species richness, requires high levels of taxonomic expertise. An
Northern Ireland and
the north of the
Republic of IrelandScotland and northern
England including
Scottish islands
Southern England, Wales and
the Republic of Ireland
UK TAG Report - Macroalgae on Intertidal Rocky Shores
Page | 26
alternative means of recording qualitative species data is the implementation of a
reduced species list (RSL) whereby the number of species from the RSL is in
proportion to the total species richness. The list is composed of species
(approximately 70) that contribute most significantly to the overall species
composition of rocky shores of a particular type within a geographical area, and this
would act as a surrogate to the production of a full species list. The benefits of this
approach are the requirement of a lower level of taxonomic experience and
familiarisation with fewer algal species.
After compilation of the database, members of the UK Marine Plants Task Team
tentatively assigned each site a level of quality, between poor and good, based on
expert knowledge of each of the sites. Only the species records from those sites
deemed as ‘high quality’ were used when extracting reduced species lists. This
decision was taken as the final reduced species lists should ideally be representative
of high quality shores with which other shores will be compared and therefore act as
a reference condition.
The species lists were compiled by selecting those species which occurred most
frequently throughout the range of shore types on high quality shores. The minimum
frequency of occurrence of each species depended on the total number of sites
available for analysis. There are approximately 885 species of seaweed recorded in
the algal database based on the Marine Conservation Society checklist compiled by
Guiry (1997), although some of these species may currently only have records for
northern France, so the UK total is actually lower than 885. This tools aims to reduce
the number of species required for identification to approximately 70 algal species.
The frequency of the top 70 species varied according to the geographic area. For
Northern Ireland species that occurred on >55 high quality shores out of a possible
142 were included, for Scotland and Northern England the frequency was a minimum
of 36 out of 86 and for southern England, Wales and the Republic of Ireland species
occurring on >17 out of 55 were included.
It was further decided that a number of species would be difficult to identify to
species level or locate on the shore, even for many trained algal taxonomists.
Therefore, for a select few species, identification has been limited to the level of
genus only, although microscopic identification would still be required. These genera
include Blidingia, Enteromorpha, Ulothrix, Ectocarpus, Ralfsia, Gelidium,
Audouinella, Ceramium except for C. nodulosum and C. shuttleworthianum and
Polysiphonia species except for P. lanosa and P. fucoides, as it was thought that
these species of Polysiphonia and Ceramium would be comparatively easy to
distinguish and are also common. Calcareous encrusting red algae were aggregated
to the level only of “calcareous encrusters”. The final species to be used within the
three reduced species lists are tabulated below (Table 2). Note: The genus name
Enteromorpha has been retained for practical purposes, rather than Ulva, as
recommended by Hayden et al (2003). It has a different morphology, and is also
recognised as a separate taxon for the purposes of the WFD macroalgal blooming
tool.

UK TAG Report - Macroalgae on Intertidal Rocky Shores
Page | 27
Table 2: Species lists for each of the defined geographic areas of Northern Ireland,
Scotland and Northern England, and Southern England, Republic of Ireland and
Wales.
Zone in which taxa applicable for
assessments
Species Colour Opportunists ESG
Scotland /
Northern
England
England
/ Wales
Northern
Ireland
Alaria esculenta Phaeophyta 1 * *
Ascophyllum nodosum Phaeophyta 1 * * *
Asperococcus fistulosus Phaeophyta 1 * *
Chorda filum Phaeophyta 1 * *
Chordaria flagelliformis Phaeophyta 2 *
Cladostephus spongious Phaeophyta 2 * * *
Desmarestia aculeata Phaeophyta 2 *
Dictyosiphon foeniculaceus Phaeophyta 2 *
Dictyota dichotoma Phaeophyta 2 * * *
Ectocarpus sp. Phaeophyta * 2 * * *
Elachista fucicola Phaeophyta 2 * * *
Fucus serratus Phaeophyta 1 * * *
Fucus spiralis Phaeophyta 1 * * *
Fucus vesiculosus Phaeophyta 1 * * *
Halidrys siliquosa Phaeophyta 1 * * *
Himanthalia elongata Phaeophyta 1 * * *
Laminaria digitata Phaeophyta 1 * * *
Laminaria hyperborea Phaeophyta 1 * *
Laminaria saccharina Phaeophyta 1 * * *
Leathesia difformis Phaeophyta 1 * * *
Litosiphon laminariae Phaeophyta 2 *
Pelvetia canaliculata Phaeophyta 1 * * *
Petalonia fascia Phaeophyta 2 *
Pilayella littoralis Phaeophyta * 2 * * *
Ralfsia sp. Phaeophyta 1 * * *
Saccorhiza polyschides Phaeophyta 1 *
Scytosiphon lomentaria Phaeophyta 1 * * *
Sphacelaria sp. Phaeophyta 2 *
Spongonema tomentosum Phaeophyta 2 * *
Blidingia sp. Chlorophyta * 2 * * *
Bryopsis plumosa Chlorophyta 2 *
Chaetomorpha linum Chlorophyta * 2 * * *
Chaetomorpha mediterranea Chlorophyta * 2 * *
Chaetomorpha melagonium Chlorophyta 2 * *
Cladophora albida Chlorophyta 2 *
Cladophora rupestris Chlorophyta 2 * * *
Cladophora sericea Chlorophyta 2 * * *
Enteromorpha sp. Chlorophyta * 2 * * *
Monostroma grevillei Chlorophyta 2 *
Rhizoclonium tortuosum Chlorophyta 2 *
Spongomorpha arcta Chlorophyta 2 *
Sykidion moorei Chlorophyta 2 *

UK TAG Report - Macroalgae on Intertidal Rocky Shores
Page | 28
Ulothrix sp. Chlorophyta 2 *
Ulva lactuca Chlorophyta * 2 * * *
Aglaothamnion/Callithamnion sp. Rhodophyta 2 * * *
Ahnfeltia plicata Rhodophyta 1 * * *
Audouinella purpurea Rhodophyta 2 *
Audouinella sp. Rhodophyta 2 *
Calcareous encrusters Rhodophyta 1 * * *
Callophyllis laciniata Rhodophyta 1 *
Catenella caespitosa Rhodophyta 1 * *
Ceramium nodulosum Rhodophyta 2 * * *
Ceramium shuttleworthanium Rhodophyta 2 * * *
Ceramium sp. Rhodophyta 2 *
Chondrus crispus Rhodophyta 1 * * *
Corallina officinalis Rhodophyta 1 * * *
Cryptopleura ramosa Rhodophyta 2 * * *
Cystoclonium purpureum Rhodophyta 1 * * *
Delesseria sanguinea Rhodophyta 2 *
Dilsea carnosa Rhodophyta 1 * * *
Dumontia contorta Rhodophyta 1 * * *
Erythrotrichia carnea Rhodophyta 2 * *
Furcellaria lumbricalis Rhodophyta 1 * * *
Gastroclonium ovatum Rhodophyta 1 *
Gelidium sp. Rhodophyta 1 * *
Gracilaria gracilis Rhodophyta 1 *
Halurus equisetifolius Rhodophyta 2 *
Halurus flosculosus Rhodophyta 2 *
Heterosiphonia plumosa Rhodophyta 2 *
Hildenbrandia rubra Rhodophyta 1 * *
Hypoglossum hypoglossoides Rhodophyta 2 *
Lomentaria articulata Rhodophyta 1 * * *
Lomentaria clavellosa Rhodophyta 1 *
Mastocarpus stellatus Rhodophyta 1 * * *
Melobesia membranacea Rhodophyta 1 *
Membranoptera alata Rhodophyta 2 * * *
Nemalion helminthoides Rhodophyta 1 *
Odonthalia dentata Rhodophyta 1 * *
Osmundea hybrida Rhodophyta 1 * * *
Osmundea pinnatifida Rhodophyta 1 * * *
Palmaria palmata Rhodophyta 1 * * *
Phycodrys rubens Rhodophyta 2 *
Phyllophora sp. Rhodophyta 1 * * *
Plocamium cartilagineum Rhodophyta 2 * * *
Plumaria plumosa Rhodophyta 2 * * *
Polyides rotundus Rhodophyta 1 * *
Polysiphonia fucoides Rhodophyta 2 * * *
Polysiphonia lanosa Rhodophyta 2 * * *
Polysiphonia sp. Rhodophyta 2 * * *
Porphyra leucosticta Rhodophyta * 2 *
Porphyra umbilicalis Rhodophyta * 2 * * *
Ptilota gunneri Rhodophyta 2 *
Rhodomela confervoides Rhodophyta 2 * * *
Rhodothamniella floridula Rhodophyta 2 * * *

UK TAG Report - Macroalgae on Intertidal Rocky Shores
Page | 29
5.3.3. Natural Environmental Variables
The ability to produce a single reduced species list with which to represent and
categorise all shores around the British Isles is a rather optimistic approach as there
are likely to be several geographical and environmental variables that will interfere
with this proposal. There is also a need to acknowledge the various typologies
established for the purpose of the WFD and how to account for these including
reference conditions for each typology. Therefore, the initial approach used in
establishing the reduced species list was to analyse the effects of certain
environmental factors, specifically those used to categorize the typologies. The NILS
(Wilkinson et al, 1988) provided the best information for a large area of coastline from
which to assess the effects of exposure, shore type, and habitat type/number on the
overall species composition of a shore. These data included not only biologically rich
sites, but also ‘typical’ and ‘poor’ sites as well as representing a full range of physical
habitat types and their associated biological communities. In addition geographic
location and the effects of latitude were analysed using the benthic algal species
database.
A recent study of the effects of environmental variables (Wells & Wilkinson, 2002)
showed certain factors contributed more significantly than others to the overall
species richness and species composition. The conclusions drawn from this study
helped to contribute to the development of the tool by enabling the MPTT to establish
those factors that need to be considered in the compilation of the RSL and whether a
single list would suffice for the whole of the British Isles and Republic of Ireland and
cover all typologies.
Exposure is known to affect the distribution of intertidal algal species. Sheltered
shores tend to be characterised by a dense covering of fucoids, moderately exposed
shores exhibit a less abundant but mosaic distribution of fauna and flora and
exposed shores are characterised by their limited algal abundance and wide lichen
zone on the upper littoral. However despite exposure appearing to contribute to the
abundance and zonation patterns of algae in the intertidal there is no significant
impact on the levels of species richness. Exposed shores did result in slightly lower
average species richness (but not significantly different to shores of other exposure
ratings); this may well be due to their limited abundance making them harder to
locate. There was also little difference in species composition between shores of
varying exposure level, therefore it was concluded that exposure is likely to have very
little impact on the final RSL(s).
The physical type of shore is broadly described by the most dominant substrate type
or structure present such as rock platforms, outcrops, boulders and pebbles; this is
referred to as the dominant shore type. This has been shown to contribute
significantly to the levels of species richness with certain substrates more habitable
due to their stability and attachment properties. Statistical comparisons were made of
average species richness between different shore types using one way analysis of
variance with Tukey’s test (with family error rate of 5%). The results indicated rock

UK TAG Report - Macroalgae on Intertidal Rocky Shores
Page | 30
ridges, outcrops and platforms have significantly higher species richness than shores
consisting predominantly of boulders, pebbles and vertical rock. This is probably due
to the levels of stability offered by large fixed areas of hard substrate compared with
pebbles and boulders, which are less stable and unable to support climax
communities as effectively. Therefore the following shore types are listed in
descending order of their contribution to the level of species richness:
Rock ridges/outcrops/platforms > Irregular rock and boulders > steep/vertical rock >
pebbles, stones and small rocks > shingle and gravel.
Subhabitat type and number have a similar effect to shore type with statistical
analysis indicating the presence of particular subhabitat types resulting in higher
levels of species richness. Large, wide rock pools provide very favourable habitats by
limiting the effects of desiccation providing a more tolerable environment than is
experienced on open rock. The following subhabitat types are given in descending
order of their contribution to the level of species richness:
wide shallow/large/deep rockpools > basic rockpools and crevices > overhangs >
caves.
Equally, with increasing number of subhabitat types there is a significant increase in
the levels of algal species richness recorded, as higher subhabitat diversity results in
higher species diversity. The presence of naturally occurring turbidity and sand scour
can also result in reduced numbers of perennial taxa and domination by opportunist
annuals such as Enteromorpha and Ulva (Mathieson et al., 1991; Chapman, 1943;
Daly & Mathieson, 1977; Sousa, 1979 & 1984), which may similarly be experienced
by unstable chalk shores located in the south east of England (Tittley & Price, 1978)
and can therefore decrease species richness further. These variables need to be
considered when establishing levels of species richness to be expected on shores of
varying ecological quality status.
The requirement to encompass the natural variations that occur over the coastline of
the British Isles such as shore details has led to the development of a field sampling
sheet (Figure 3) and scoring system which then contributes to the overall quality
classification. The use of shore descriptions within the development of a rocky
intertidal macroalgae tool is to normalise the species richness whereby shores that
have high species richness due to favourable environmental conditions can be
compared equitably with shores of low species richness due to unfavourable natural
conditions. The numbers in the sampling sheet attached to each of the shore
types/habitat types are based on how much they contribute to the overall species
richness, for example rock ridges/platforms/outcrops has a high value of 4 whereas
shingle/gravel only scores 0 because this substratum type does not lend itself to high
numbers of algal species. The sampling sheet also leaves space for brief shore
descriptions as well as basic details on the site name, times of sampling etc. The
dominant biota information does not contribute to the overall scoring system but may
be useful in subsequent years to explain any ecological change and may help to
identify shifts in the benthic invertebrate community.
The individual scores from the field sampling sheet are subsequently totalled to
produce a final score which is later applied to the metric. For those factors, such as

UK TAG Report - Macroalgae on Intertidal Rocky Shores
Page | 31
shore type and habitat type, where more than one description may be recorded on
the sampling sheet, only the highest score is used in the final scoring system.
Table 3: Field sampling sheet to record basic shore descriptions with scores
indicating the weighting of each of the shore characteristics to be used in the final
scoring system.
General Information
Shore Name Date
Water Body Tidal Height
Grid Ref. Time of Low Tide
Shore Descriptions
Presence of Turbidity (known to be non-anthropogenic)
Yes =0 Sand Scour Yes =0 No =2
No =2 Chalk Shore Yes =0 No =2
Dominant Shore Type Subhabitats
Rock Ridges/Outcrops/Platforms =4 Wide Shallow Rock Pools (>3m wide and <50cm deep)
=4
Irregular Rock =3
Boulders large, medium and small =3 Large Rockpools (>6m long) =4
Steep/Vertical Rock =2 Deep Rockpools (50% >100cm deep) =4
Non-specific hard substrate =2 Basic Rockpools =3
Pebbles/Stones/SmallRocks =1 Large Crevices =3
Shingle/Gravel = 0 Large Overhangs and Vertical Rock =2
Dominant Biota Others habitats (please specify) =2
Ascophyllum
Fucoid
Rhodophyta mosaics Caves =1
Chlorophyta None =0
Mussels Total Number of Subhabitats
Barnacles >4 3 2 1 0
Limpets
Periwinkles
General Comments

UK TAG Report - Macroalgae on Intertidal Rocky Shores
Page | 32
5.3.4. Species Composition
Species richness provides an excellent tool for using macroalgae communities as a
measure of ecological quality; however, this does not incorporate any measure of
composition as required by the WFD. Individual species present vary considerably
due to the constant turnover of ephemeral species but general measures of
composition may be used as an alternative means of indicating a shift in the
community structure. In order to identify the potential occurrence of correlations
between community composition and quality status, members of the Marine Plants
Task Team tentatively assigned each site within the marine benthic algal database a
level of quality; High, Good, Moderate, Poor or Bad. This was based on expert
knowledge of each of the sites irrespective of their species number and considering
the proximity and magnitude of direct and indirect pollution sources. This could later
be used to establish the quality status boundary levels for each class. Such
measures of community structure include the proportions of Rhodophyta and
Chlorophyta calculated as the number of species within these divisions as a
percentage of the total species richness.
The Rhodophyta constitute a high proportion of small filamentous and delicate
species and show an increase in species numbers with increasing environmental
quality. The Chlorophyta species, although small and often filamentous, are able to
adapt more readily to changes in the environment whereby proportions increase with
decreasing quality status. In contrast many Phaeophyta species are large, solid,
fleshy and relatively hardy, and are more likely to remain constant. Consequently the
changes in proportion of Rhodophyta and Chlorophyta species have been
considered to be indicative of anthropogenic influences and shifts in quality status.
Other alternative measures of species composition include the ratio of ecological
status groups (ESG’s) and proportion of opportunist species. ESG’s can be used to
indicate shifts in the ecosystem from a pristine state (ESG 1 – late successionals or
perennials) to a degraded state (ESG 2 – opportunists or annuals). This is achieved
by using the following ratio ESG 1/ESG 2 (Orfanidis et al, 2001). The allocation of
each species into one of the two ESG groups is also broadly based on a functional
group system devised primarily by Littler et al (1983) and later adapted by Wells
(2002) (Table 4).
The opportunist species include Blidingia spp., Chaetomorpha linum, Chaetomorpha
mediterranea, Enteromorpha spp., Ulva lactuca, Ectocarpus spp., Pilayella littoralis,
Porphyra spp. Nuisance blooms of particularly rapidly growing macroalgae can have
deleterious effects on intertidal communities (Soulsby et al., 1982; Tubbs & Tubbs,
1983; den Hartog, 1994) whereby excessive biomass would be considered as
moderate, poor or bad quality status (Wilkinson & Wood, 2003), albeit primarily on
sedimentary shores.
Table 4: Descriptions of the different functional groups used in placing species into
the two ecological status groups indicating functional groups as modified by Wells
(2002) from Littler et al. (1983).

UK TAG Report - Macroalgae on Intertidal Rocky Shores
Page | 33
5.4. Establishing Class Boundaries
Each of the species richness and composition attributes was compared with the
subjective quality status to ensure they followed the expected trends. Species
richness and the proportion of opportunists and Rhodophyta show a distinct trend
with subjective increases in quality status, however, the proportion of Chlorophyta
and the ESG ratio are less defined with less distinct boundaries between the good
and moderate status classes. This is the most significant boundary as this
distinguishes between an acceptable and unacceptable level of quality requiring
mitigation according to the WFD. Further statistical analyses were run on the results
to establish a level of significant difference between quality status groups.
All datasets were tested for normality (Kolmogorov-Smirnov test) and homogeneity of
variance (Levene’s test) to see if a one-way Analysis of Variance (ANOVA) could be
used. All datasets failed at least one of these tests so a non-parametric equivalent
Kruskal-Wallis test was used, whereby there is a statistically significant difference (P
= <0.001) when the differences in the median values among the treatment groups
are greater than would be expected by chance.
Each of the species parameters showed a significant difference between groups with
p=<0.001. High and poor quality status contributed most to this significant difference,
with the moderate class showing less difference with the other groups. The less
distinguishable boundary around the moderate quality class may be attributed in part
to the low number of shores represented within this class and the high level of
variability within each group, indicated by the levels of standard deviation. Further
data would be required to clarify some of these trends and refine the boundaries.

UK TAG Report - Macroalgae on Intertidal Rocky Shores
Page | 34
From these predicted levels of ecological quality, boundary levels were established
for the levels of species richness to be expected. The same was achieved for the
proportions of Chlorophyta, Rhodophyta, the ratio of ESGs and the proportion of
opportunist species. Each of the parameters has a range of values which equates to
a quality status of High, Good, Moderate, Poor and Bad. The final metric system
works by establishing the ranges for each parameter and finding its associated
quality status score. These individual scores are averaged to produce a final score of
ecological quality status.
The boundary values were based solely on the predicted quality status values and by
matching these up with the overall scoring system; no statistical methods were used
as the results were far too variable.
5.5. Metric System
5.5.1. Full Species Richness Metric
The metric system is based on the five main parameters of the tools;
Species Richness (Total number of taxa – Nt); This is normalised to shore
diversity acting as a correction for the level of species richness.
Using data from reference or near reference sites a graph was plotted to show the
level of correlation between species richness and shore description (Figure 5)
displaying a non-linear relationship between the two variables. This relationship can
be described by an exponential-type model of the form:
)exp(cSHOREbaRICHNESS
where a, b and c are parameters to be estimated from the data. Using least squares,
these parameters were estimated to be:
a = 16.543 b = 7.150 c = 0.122
Therefore for each value of shore description there is a level of species richness that
is to be expected for reference conditions from which a normalisation factor has been
produced. This can be seen in Table 5. This factor was based around an average
shore description of 15. The actual level of species richness can then be compared
with the predicted level of species richness by applying the ‘de-shoring factor’. An
example is given below:
Site X in the North-east of England has a shore description of 10 and a species
richness of 51. The expected level of species richness for this shore description is
40.73 with a de-shoring factor of 1.50 (see Table 5). Therefore the final value for
species richness is:
RICHNESS = 51 x 1.50 = 76.50
This is the final value to be input to the metric system.

UK TAG Report - Macroalgae on Intertidal Rocky Shores
Page | 35
Table 5: Calculation of normalisation for all possible shore description values based
on the predicted levels of species richness for the Full Species List
0
20
40
60
80
100
120
6 8 10 12 14 16 18 20
Shore Description
Sp
ecie
s R
ich
nes
s
Figure 5: Exponential model for the relationship between shore description and
species richness for the Full Species List
Shore
description
Predicted
richness
De-shoring
factor
5 29.69 2.06
6 31.40 1.94
7 33.32 1.83
8 35.50 1.72
9 37.96 1.61
10 40.73 1.50
11 43.87 1.39
12 47.71 1.29
13 51.42 1.19
14 55.94 1.09
15 61.04 1.00
16 66.81 0.91
17 73.33 0.83
18 80.69 0.76
19 89.01 0.69
20 98.40 0.62

UK TAG Report - Macroalgae on Intertidal Rocky Shores
Page | 36
Proportion of Chlorophyta (green) species – PCh: The observed parameter value,
proportion of Chlorophyta taxa should be calculated as such:
PCh = NCh x 100
Nt
Proportion of Rhodophyta (red) species – PRh: The observed parameter value,
proportion of Rhodophyta taxa should be calculated as such:
PRh = NRh x 100
Nt
Proportion of Opportunist species – POpp: The observed parameter value,
proportion of opportunist taxa should be calculated as such:
POpp = NOpp x 100
Nt
Ratio of ESG1 to ESG2 – RESG: Taxa should be assigned to either of two ecological
status groups, ESG1 and ESG2. The observed parameter value, ratio of ESG groups
should be calculated as such:
RESG = NESG1
NESG2
For each of the described parameters the ecological quality status range for classes
bad, poor, moderate, good and high was calculated using the following metrics
(Table 6). These levels were based broadly on the midpoint between the upper and
lower points of error bars from adjacent quality classes.
Table 6: Macroalgae species richness and composition index scoring system and
final classification boundaries For the Full Species List
Quality High Good Moderate Poor Bad
Subscore 0.8-1.0 0.6-0.8 0.4-0.6 0.2-0.4 0-0.2
Species richness ≥ 55 (-80) 35-55 20-35 5-20 0-5
Proportion of Chlorophyta ≤ 25 (-0) 25-30 30-40 40-60 60-100
Proportion of Rhodophyta ≥ 47 (-100) 42-47 32-42 15-32 0-15
ESG Ratio ≥ 0.65 (-1.0) 0.5 – 0.65 0.35 – 0.5 0.1 – 0.35 0-0.1
Proportion of opportunists ≤ 15 (-0) 15-22 22-35 35-45 45-100

UK TAG Report - Macroalgae on Intertidal Rocky Shores
Page | 37
The final metric system works on a sliding scale to enable an accurate EQR value to
be calculated for each of the different parameters, an average of these values is then
used to establish the final classification status. For the calculation of the sub-score
for each of the parameters this requires two variations of a basic equation.
For Species Richness, Proportion of Rhodophyta species and the Ratio of
ESG’s, all of which increase in value with increasing EQR, use the following
equation:
EQR = Value – Lower class range x EQR band width + Lower EQR band range
Class width
Example using a value for species richness: 34 – this lies between 20 and 35 and
with an EQR between 0.4-0.6) therefore:
Score = {(34 – 20)/15 x 0.2} + 0.4
Score = 0.187 + 0.4 = 0.587
For the Proportion of Chlorophyta and Proportion of Opportunist species both of
which decrease in value with increasing EQR, use the following equation:
EQR = Upper EQR Band range - Value – Lower class range x EQR band width
Class width
Example using a value for the proportion of greens: 29.4 – this lies between 25 and
30 and with an EQR between 0.6-0.8)
Score = 0.8 - {(29.4 – 25)/5 x 0.2}
Score = 0.8 – 0.176 = 0.624
5.5.2. Reduced Species Richness Metric
As with the use of a full species list five parameters were also used, for which
ecological quality status boundaries were devised. To establish the quality
boundaries for each of the parameters the reduced species lists were applied to all
the records within the database including those sites considered to be of good,
moderate and poor quality. Quality status boundaries were then established using

UK TAG Report - Macroalgae on Intertidal Rocky Shores
Page | 38
the same method as with the full species list i.e. the midpoint between upper and
lower error bars on adjacent quality classes.
The boundary values were based solely on the predicted quality status values and by
matching these up with the overall scoring system; no statistical methods were used
as the results were far too variable. Unfortunately there have been no shores
surveyed within Northern Ireland that were thought to be of poor quality so the
moderate/poor boundary value for this area would need to be refined once further
data have been collected. The boundary values vary between the different areas but
this is mainly as a result of the difference in reduced species lists between areas.
Tables 7, 8 and 9 show the classification scoring system for each of the geographic
areas.
Table 7: Boundary values for the five parameters for Scotland/Northern England
Score
EQR ≥0.8 – 1.0 ≥0.6– <0.8 ≥0.4 – <0.6 ≥0.2 – <0.4 0 – <0.2
High Good Moderate Poor Bad
RSL 35-70 25-35 17-25 5-17 0-5
Greens 0-12 12-20 20-30 30-80 80-100
Reds 55-100 45-55 35-45 15-35 0-15
ESG 1.0-1.2 0.8-1.0 0.7-0.8 0.2-0.7 0-0.2
Opportunist 0-10 10-15 15-25 25-50 50-100
Table 8: Boundary values for the five parameters for England/Wales/RoI
Score
EQR ≥0.8 – 1.0 ≥0.6– <0.8 ≥0.4 – <0.6 ≥0.2 – <0.4 0 – <0.2
High Good Moderate Poor Bad
RSL 35-69 25-35 15-25 5-15 0-5
Greens 0-15 15-20 20-25 25-80 80-100
Reds 55-100 45-55 40-45 15-40 0-15
ESG 1.0-1.2 0.80-1.0 0.55-0.8 0.2-0.55 0-0.2
Opportunist 0-10 10-15 15-25 25-50 50-100

UK TAG Report - Macroalgae on Intertidal Rocky Shores
Page | 39
Table 9: Boundary values for the five parameters for Northern Ireland
Score
≥0.8 – 1.0 ≥0.6– <0.8 ≥0.4 – <0.6 ≥0.2 – <0.4 0 – <0.2
High Good Moderate Poor Bad
RSL 34-68 20-34 10-20 3-10 0-3
Green 0-20 20-30 30-45 45-80 80-100
Red 45-100 35-45 25-35 10-25 0-10
ESG 0.80-1.2 0.6-0.80 0.40-0.6 0.2-0.40 0-0.2
Opportunist 0-15 15-25 25-35 35-50 50-100
A de-shoring factor has also been calculated for the reduced species lists and was
achieved in the same way as for the full species list. The parameters for a, b and c
are estimated to be:
a = 14.210 b = 4.925 c = 0.108
Therefore for each value of shore description there is a level of species richness that
is to be expected for reference conditions from which a ‘de-shoring factor’ has been
produced. This can be seen in Table 10 with the exponential model displayed in
Figure 6. This factor was based around an average shore description of 15. The
actual level of species richness can then be compared with the predicted level of
species richness by applying the ‘de-shoring factor’.

UK TAG Report - Macroalgae on Intertidal Rocky Shores
Page | 40
Table 10: Calculation of the ‘de-shoring’ factor for all possible shore description
values based on the predicted levels of species richness from a reduced species list
0
10
20
30
40
50
60
70
6 8 10 12 14 16 18 20
Shore Description
Sp
ecie
s R
ich
ness
Figure 6: Exponential model for the relationship between shore description and
species richness using a reduced species list
The final metric system also works on the same sliding scale, as with the full species
list, to enable an accurate EQR value to be calculated for each of the different
parameters: an average of these values is then used to establish the final
Shore
description
Predicted
richness
De-shoring
factor
5 22.66 1.72
6 23.62 1.65
7 24.70 1.58
8 25.89 1.51
9 27.22 1.44
10 28.70 1.36
11 30.36 1.29
12 32.20 1.21
13 34.25 1.14
14 36.53 1.07
15 39.08 1.00
16 41.91 0.93
17 45.07 0.87
18 48.58 0.80
19 52.50 0.74
20 56.87 0.69

UK TAG Report - Macroalgae on Intertidal Rocky Shores
Page | 41
classification status. For the calculation of the EQR value for each of the parameters
this requires two slightly different calculations.
For Species Richness, Proportion of Rhodophyta species and the Ratio of
ESG’s, all of which increase in value with increasing EQR, use the following
equation:
EQR = Value – Lower class range x EQR band width + Lower EQR band range
Class width
For the Proportion of Chlorophyta and Proportion of Opportunist species, both
of which decrease in value with increasing EQR, use the following equation:
EQR = Upper EQR Band range - Value – Lower class range x EQR band width
Class width
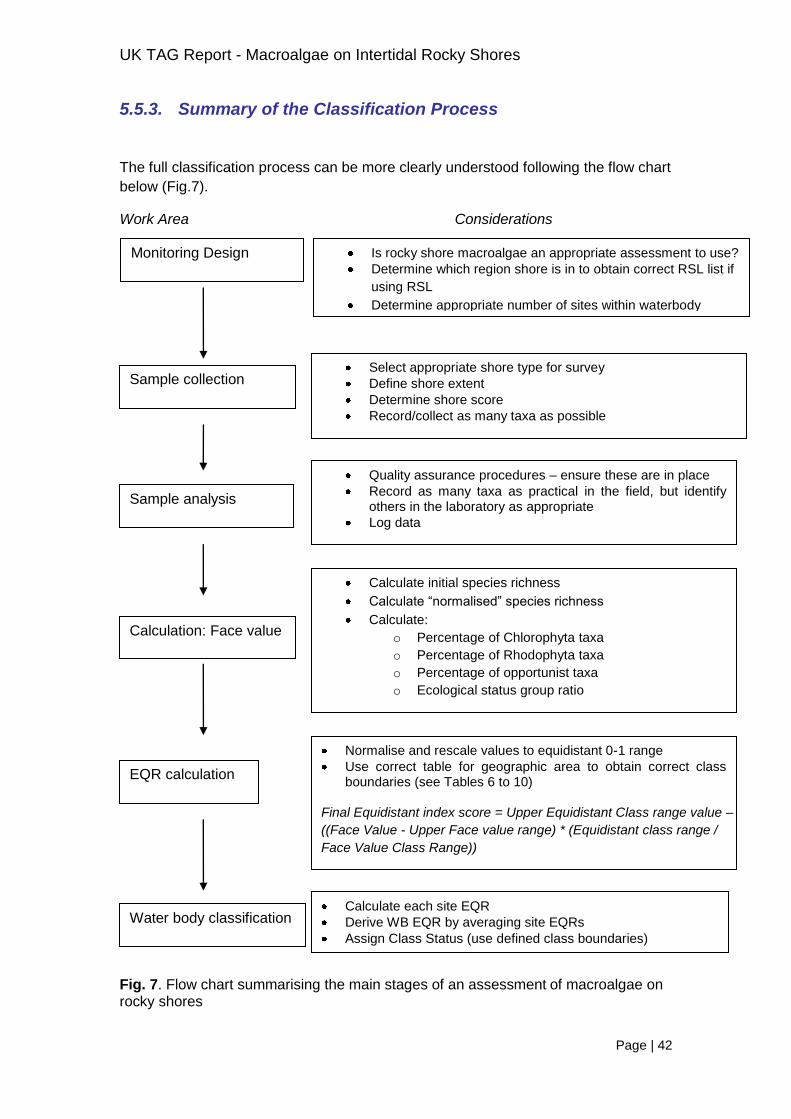
UK TAG Report - Macroalgae on Intertidal Rocky Shores
Page | 42
5.5.3. Summary of the Classification Process
The full classification process can be more clearly understood following the flow chart
below (Fig.7).
Work Area Considerations
Fig. 7. Flow chart summarising the main stages of an assessment of macroalgae on rocky shores
Monitoring Design Is rocky shore macroalgae an appropriate assessment to use?
Determine which region shore is in to obtain correct RSL list if
using RSL
Determine appropriate number of sites within waterbody
Sample collection Select appropriate shore type for survey
Define shore extent
Determine shore score
Record/collect as many taxa as possible
Sample analysis
Quality assurance procedures – ensure these are in place
Record as many taxa as practical in the field, but identify others in the laboratory as appropriate
Log data
Calculation: Face value
Calculate initial species richness
Calculate “normalised” species richness
Calculate:
o Percentage of Chlorophyta taxa
o Percentage of Rhodophyta taxa
o Percentage of opportunist taxa
o Ecological status group ratio
Water body classification Calculate each site EQR
Derive WB EQR by averaging site EQRs
Assign Class Status (use defined class boundaries)
Calculate Confidence of Class and Risk of Misclassification
EQR calculation
Normalise and rescale values to equidistant 0-1 range
Use correct table for geographic area to obtain correct class boundaries (see Tables 6 to 10)
Final Equidistant index score = Upper Equidistant Class range value –
((Face Value - Upper Face value range) * (Equidistant class range /
Face Value Class Range))

UK TAG Report - Macroalgae on Intertidal Rocky Shores
Page | 43
5.6. Application of the Rocky Shore Macroalgae Tool
The rocky shore macroalgae tool has been designed primarily for use in open coastal
water bodies. It may be applied to the outer reaches of transitional water bodies
where hard substrate is present and salinity is not markedly reduced, but care should
be taken in interpreting results. The natural decrease of species diversity from the
mouth to the head of a transitional water along with the decreased presence of
natural rocky substrate is likely to result in a low ecological quality ratio and status
when compared with the open coast. Therefore it is recommended that where
possible an alternative biological tool be used such as monitoring the extent of fucoid
growth (Wilkinson et al, 2007) or the presence of macroalgae blooms (Scanlan et al,
2007; Wells et al., 2010), depending on the pressure present in the transitional
waterbody.
This tool is also only applicable where the natural substratum consists primarily of
solid bedrock, such as rocky outcrops, ridges and platforms or extensive areas of
large boulders. Cobble, shingle and sandy shores are too unstable to support the
attachment of a diverse community of algae and, although it may be possible for
some opportunist species to survive such conditions, this will not yield a high
diversity of algae and may misclassify the water body.
It is suggested that a minimum of 3 shores should be sampled within any water body
(depending on waterbody size), and that each individual shore should ideally be
sampled a total of 3 times during the first 6 year reporting cycle in order to gain some
idea of natural variation. It is recommended that on at least one occasion in the six
year cycle a full comprehensive species list be compiled. The reduced species lists
act as a surrogate to the full species list, which achieves a higher level in the
confidence of classification. The reduced species lists enable a more rapid survey to
be completed. Where classification status using the reduced species list lies on or
near a status class boundary, or does not achieve a good or high status, it is
recommended that ideally a full species list be compiled to validate the classification
and ensure correct classification is obtained. A full species list would always be the
more desirable method as it will account more accurately for natural variation and
natural turnover of species, but may not always be possible.
Sampling should commence no earlier than late April and be extended no later than
early October. Consideration should be given to possible effects of severe
winter/spring weather on the start of the growth season. There is an annual turnover
of species diversity and richness with the winter months exhibiting a much lower algal
richness; therefore it is essential that sampling be achieved at the time of maximum
species richness. It is possible for natural blooms of opportunists to occur on the
rocky shore, i.e. not as a result of anthropogenic influences. These are not to be
considered as detrimental to the natural environment, especially if recorded during
late spring when it is common for small algal blooms to occur. Naturally high levels of
algal coverage do not tend to result in a decrease of species richness. Algal
coverage exhibits high levels of variability both throughout the year and between
years. If a slight bloom of an opportunist such as Ulva, Enteromorpha, Ectocarpus or

UK TAG Report - Macroalgae on Intertidal Rocky Shores
Page | 44
Pylaiella has been recorded it would be advisable to revisit the site at a later date
when the bloom will have had a chance to dissipate. If there is still cause for concern,
a full species list should be compiled to ascertain whether the coverage is affecting
the levels of species richness.
Where a water body is known to have localised anthropogenic influences, the area of
concern should be sampled to enable the impacts to be assessed. However, in this
instance it may also be necessary to sample more sites; if the impact is very
localised this may have too much weighting on the overall classification of the water
body. A small source of anthropogenic disturbance may be having minimal impact on
the wider surrounding environment.
The major issue concerned with monitoring species richness is the level of taxonomic
expertise and field survey ability required. This has been tackled in part by the use of
the reduced species lists, but there is still a requirement for appropriate training and
quality assurance. Field survey guides and detailed identification guidance have
been produced to assist with this task but these need to be used in conjunction with
an appropriate training regime and the maintenance of competence in survey
technique and algal identification.
5.7. Worked Example
The tool has been applied to two areas from which macroalgae species lists were
collected as part of the development stage of the tool.
5.7.1. Case Study – Milford Haven
Five intertidal rocky shore sites within the water body of Milford Haven were sampled
in 2004 for the application of both the full species list tool and the reduced species list
tool (Figure 8).
UK TAG Report - Macroalgae on Intertidal Rocky Shores
Page | 45
Figure 8: Map of macroalgae sampling locations in Milford Haven
For each of the sites a full species list was recorded from which the reduced species
list could also be abstracted. The previously described metric system could then be
applied to both the full and reduced species lists, including the appropriate correction
factors for species richness. For each of the sites an overall site EQR was calculated;
these results are given in Tables 11 and 12.

UK TAG Report - Macroalgae on Intertidal Rocky Shores
Page | 46
Table 11: Metric component results for 5 sites within Milford Haven using the full species list
Full Species list
Site Name
Shore
Description
Species
richness
Corrected
SR Value % greens Value % Reds Value ESG Value % Opport Value EQR
Quality
Class
West Angle 16 94 84.6 1.00 19.15 0.85 55.32 0.83 0.71 0.83 11.70 0.84 0.87 HIGH
Angle Bay 7 33 79.86 1.00 30.30 0.59 33.33 0.43 0.57 0.70 24.24 0.57 0.66 GOOD
Sawdern Point 9 54 104.76 1.00 20.37 0.84 50.00 0.81 0.64 0.78 12.96 0.83 0.85 HIGH
Fort Hubberston 13 66 81.84 1.00 22.73 0.82 46.97 0.80 0.43 0.51 16.67 0.75 0.78 GOOD
Pembroke Ferry 13 56 69.44 0.92 32.14 0.56 48.21 0.80 0.47 0.56 21.43 0.62 0.69 GOOD
Table 12: Metric component results for 5 sites within Milford Haven using the reduced species list
Reduced species list for Wales
Site Name
Shore
Description
Species
richness
Corrected
SR Value % greens Value % Reds Value ESG Value % Opport Value EQR
Quality
Class
West Angle 16 53 49.29 0.88 15.09 0.80 54.72 0.79 1.12 0.92 13.21 0.67 0.81 HIGH
Angle Bay 7 23 35.19 0.80 17.39 0.70 39.13 0.39 0.92 0.72 21.74 0.47 0.62 GOOD
Sawdern Point 9 38 54.72 0.92 13.16 0.82 55.26 0.80 1.00 0.80 13.16 0.67 0.80 HIGH
Fort Hubberston 13 41 46.74 0.87 14.63 0.80 53.66 0.77 0.86 0.66 17.07 0.56 0.73 GOOD
Pembroke Ferry 13 33 37.62 0.82 18.18 0.67 51.52 0.73 1.20 1.00 21.21 0.48 0.74 GOOD

UK TAG Report - Macroalgae on Intertidal Rocky Shores
Page | 47
The final EQR value and ecological status class were further calculated using the
average of each individual shore within the waterbody. Tables 13 and 14 show the
level of variation attached to the EQR values within each of the individual elements
for each shore and for each shore within the waterbody. This is achieved for both full
and reduced species lists.
Table 13: Final quality status and EQR for Milford Haven including the maximum &
minimum EQR values for the individual components, standard deviation and
standard error using the Full Species List
Full Species list
Site Name EQR Quality
Class Min Max St Dev St Error
West Angle 0.87 HIGH 0.83 1.00 0.072 0.032
Angle Bay 0.66 GOOD 0.43 1.00 0.214 0.096
Sawdern Point 0.85 HIGH 0.78 1.00 0.086 0.038
Fort Hubberston 0.78 GOOD 0.51 1.00 0.175 0.078
Pembroke Ferry 0.69 GOOD 0.56 0.92 0.160 0.072
Average 0.77 GOOD 0.141 0.063
Table 14: Final quality status and EQR for Milford Haven including the maximum &
minimum EQR values for the individual components, standard deviation and
standard error using the Reduced Species List
Reduced species list
Site Name EQR Quality
Class Min Max St Dev St Error
West Angle 0.81 HIGH 0.67 0.88 0.096 0.043
Angle Bay 0.62 GOOD 0.39 0.80 0.177 0.079
Sawdern Point 0.80 HIGH 0.67 0.92 0.087 0.039
Fort Hubberston 0.73 GOOD 0.56 0.87 0.123 0.055
Pembroke Ferry 0.74 GOOD 0.48 1.00 0.192 0.086
Average 0.74 GOOD 0.135 0.060
The final classification for the water body of Milford Haven is based on the
assumption that for this individual metric the final EQR is an average of the EQR for
each site. The average EQR for the FSL is 0.77 equating to Good status and with a
standard error of 0.066 this results in a range of 0.70 – 0.84. Applying the calculation
for confidence of class discussed in Section 7 the standard error is 0.042 with 74.8%
confidence that it lies within the Good status class and 99% of the water body being
of Good or higher status. The EQR using the reduced species list is slightly lower at
0.74 with a range of 0.68 – 0.8. This range is also still well within the Good class with
a confidence of 93.7 of the quality status being Good and 99.3% of it being Good or
higher. The high level of consistency between the full and reduced species lists
suggests at this stage the reduced species list acts well as a surrogate to the full

UK TAG Report - Macroalgae on Intertidal Rocky Shores
Page | 48
species list. Although the sites sit well within the good class some individual site
classifications are close to the Moderate boundary, and therefore it would be
advisable to monitor such areas more closely to ensure classification status does not
decline. This is further emphasized by viewing the individual site error bars which
shows the range at Angle Bay to cross into Moderate status (Figures 9 and 10).
However using the confidence of class this still shows a high confidence of Good
classification.
0.00
0.20
0.40
0.60
0.80
1.00
West Angle Angle Bay Sawdern Point Fort Hubberston
Pembroke Ferry
EQ
R V
alu
e
Site Name
Figure 9: EQR values for the Full Species List for individual sites within Milford
Haven with error bars representing the standard error
0.00
0.20
0.40
0.60
0.80
1.00
West Angle Angle Bay Sawdern Point Fort Hubberston
Pembroke Ferry
EQ
R V
alu
e
Site Name
Figure 10: EQR values for the Reduced Species List for individual sites within Milford
Haven with error bars representing the standard error
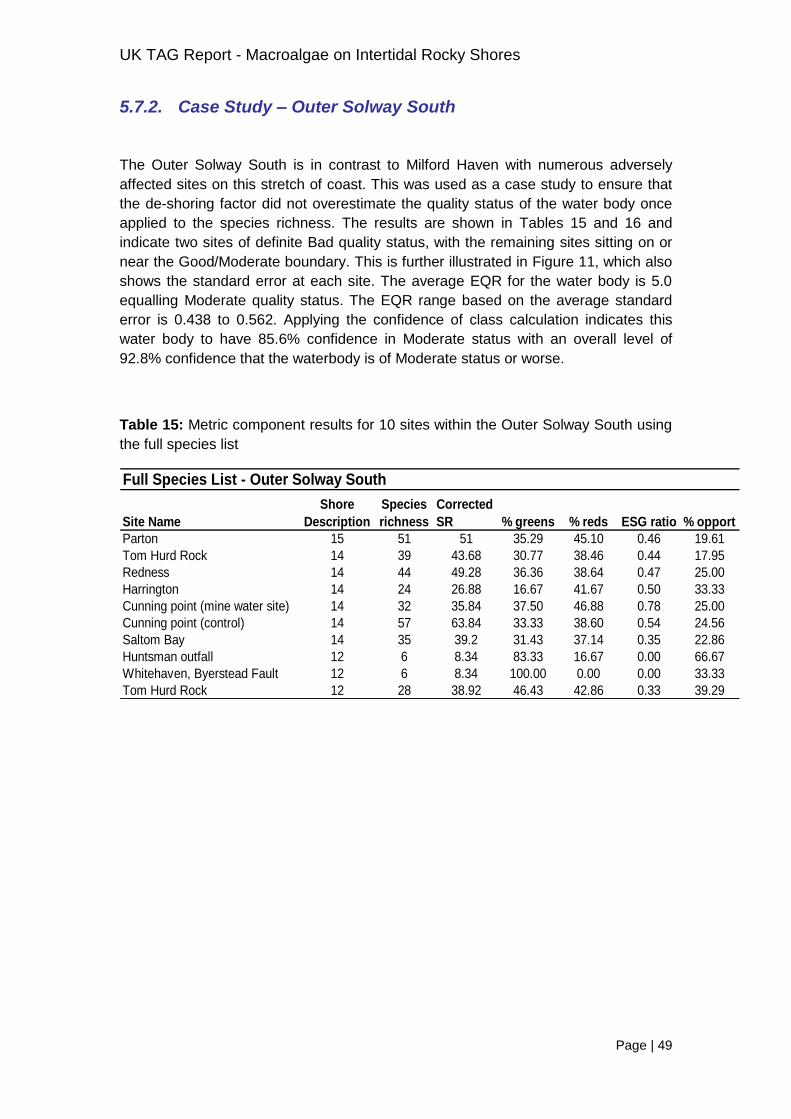
UK TAG Report - Macroalgae on Intertidal Rocky Shores
Page | 49
5.7.2. Case Study – Outer Solway South
The Outer Solway South is in contrast to Milford Haven with numerous adversely
affected sites on this stretch of coast. This was used as a case study to ensure that
the de-shoring factor did not overestimate the quality status of the water body once
applied to the species richness. The results are shown in Tables 15 and 16 and
indicate two sites of definite Bad quality status, with the remaining sites sitting on or
near the Good/Moderate boundary. This is further illustrated in Figure 11, which also
shows the standard error at each site. The average EQR for the water body is 5.0
equalling Moderate quality status. The EQR range based on the average standard
error is 0.438 to 0.562. Applying the confidence of class calculation indicates this
water body to have 85.6% confidence in Moderate status with an overall level of
92.8% confidence that the waterbody is of Moderate status or worse.
Table 15: Metric component results for 10 sites within the Outer Solway South using
the full species list
Full Species List - Outer Solway South
Site Name
Shore
Description
Species
richness
Corrected
SR % greens % reds ESG ratio % opport
Parton 15 51 51 35.29 45.10 0.46 19.61
Tom Hurd Rock 14 39 43.68 30.77 38.46 0.44 17.95
Redness 14 44 49.28 36.36 38.64 0.47 25.00
Harrington 14 24 26.88 16.67 41.67 0.50 33.33
Cunning point (mine water site) 14 32 35.84 37.50 46.88 0.78 25.00
Cunning point (control) 14 57 63.84 33.33 38.60 0.54 24.56
Saltom Bay 14 35 39.2 31.43 37.14 0.35 22.86
Huntsman outfall 12 6 8.34 83.33 16.67 0.00 66.67
Whitehaven, Byerstead Fault 12 6 8.34 100.00 0.00 0.00 33.33
Tom Hurd Rock 12 28 38.92 46.43 42.86 0.33 39.29

UK TAG Report - Macroalgae on Intertidal Rocky Shores
Page | 50
Table 16: Final quality status and EQR for the Outer Solway South including the
individual site classifications, Standard deviation and standard error using the
reduced species list
Full Species List - Outer Solway South
Site Name
Corrected
SR % greens % Reds ESG % Opport EQR
Quality
Class StDev St Error
Parton 0.76 0.49 0.77 0.54 0.67 0.65 GOOD 0.126 0.056
Tom Hurd Rock 0.69 0.58 0.53 0.53 0.72 0.61 GOOD 0.088 0.040
Redness 0.74 0.47 0.53 0.56 0.55 0.57 MODERATE 0.101 0.045
Harrington 0.49 0.87 0.59 0.60 0.43 0.60 MODERATE 0.168 0.075
Cunning point (mine water site) 0.61 0.45 0.80 0.87 0.55 0.66 GOOD 0.175 0.078
Cunning point (control) 0.87 0.53 0.53 0.65 0.56 0.63 GOOD 0.143 0.064
Saltom Bay 0.64 0.57 0.50 0.40 0.59 0.54 MODERATE 0.094 0.042
Huntsman outfall 0.24 0.08 0.22 0.00 0.12 0.13 BAD 0.100 0.045
Whitehaven, Byerstead Fault 0.24 0.00 0.00 0.00 0.43 0.13 BAD 0.194 0.087
Tom Hurd Rock 0.64 0.34 0.74 0.39 0.31 0.48 MODERATE 0.195 0.087
Average 0.50 0.139 0.062
0.00
0.20
0.40
0.60
0.80
1.00
Par
ton
Tom
Hu
rd R
ock
Re
dn
ess
Har
rin
gto
n
Cu
nn
ing
po
int
(min
e w
ate
r sit
e)
Cu
nn
ing
po
int
(co
ntr
ol)
Salt
om
Bay
Hu
nts
man
ou
tfal
l
Wh
ite
hav
en
, B
yers
tead
Fau
lt
Tom
Hu
rd R
ock
EQR
Val
ue
Site Name
Figure 11: EQR values for the full species list for individual sites within the Outer
Solway South with error bars representing the standard error

UK TAG Report - Macroalgae on Intertidal Rocky Shores
Page | 51
6. Response to Pressure
The WFD requires the characteristics used in the assessment of water bodies to show
evidence of response to changes in the natural environment through both direct and indirect
anthropomorphic pressures such as;
toxic substances
morphological pressures & alterations more specifically habitat modification,
point source discharges or general pollution,
increased nutrients leading to eutrophication,
abstraction & flow regulation,
presence of alien species, and
general stress
The primary pressures thought to cause a shift in the balance of intertidal macroalgae
communities are toxic substances, habitat modification and point source discharges, which
may in turn lead to problems of eutrophication through increased nutrients.
Toxic Substances
Increased toxic substances present on intertidal areas through industrial run-off and trickle
streams can produce seriously undesirable conditions, the presence of sulphur reducing
bacteria and a general decrease in species richness and abundance. Freshwater run-off or
outflows reducing salinity can also lead to a dominance of more tolerant species such as the
opportunist macroalgae, whereby less tolerant species may be restricted in both richness
and abundance. Mine water is an example of toxic waste that often filters through rocky
shores often causing an orange colouration on the rock surface and changing the pH of the
surrounding area (e.g. Whitehaven, Byerstead fault in the Outer Solway South (see worked
example).
Habitat Modification
Habitat loss or degradation may occur through coastal morphological change including
construction of flood defences, harbours or slipways, dredging activity causing removal of
habitats, and increased sedimentation and excess deposition. Increased morphological
pressure can lead to loss or complete removal of coastal habitats with a change or loss of
algal communities, and a shift in community structure from long lived perennial species to
ephemeral, opportunist species which can dominate the community and restrict continued
growth of other faunal and floral species.

UK TAG Report - Macroalgae on Intertidal Rocky Shores
Page | 52
Degradation through coastal morphological change or increased pressure, specifically
dredging activity, also causes increased sedimentation and excess deposition. This can lead
to smothering and light limitation causing a dominance of tolerant macroalgae species and
restricting growth of less tolerant species resulting in a community transition from algal
dominated to animal dominated due to an increase in filter feeders and an overall change in
environmental conditions
As morphological pressures increase, the available intertidal habitat for suitable attachment
of marine benthic algae decreases, causing a decrease in levels of species richness and
ESG ratio and a shift in the proportions of red and green algal species. These effects may
also result from increased sediment deposition.
Point Source Discharges
This mainly refers to sewage outfalls which were known to be located close to shore often
contributing to increased sedimentation. These can lead to increased levels of nutrients and
contribute to problems of eutrophication as detailed below. Discharges are often responsible
for shifts in community structure and can lead to complete removal of algal communities as
described in section 5.1.
Increased Nutrients and Eutrophication
Marine plants are a key component of the ecology of shallow coastal and transitional water
environments. In healthy shallow coastal waters with a balanced nutrient regime the
dominant primary producers are perennial benthic macrophytes such as seagrasses or long-
lived seaweeds, with seasonal opportunistic macroalgae or phytoplankton playing a lesser
role in biomass and production (Schramm & Nienhuis, 1996).
Increased nutrient inputs from both direct and indirect sources such as sewage outfalls and
land run-off contribute to eutrophication problems and increased suspended sediment levels.
Increasing nutrient loading increases blooms of ‘nutrient opportunists’ in particular fast-
growing epiphytic macroalgae and bloom-forming phytoplankton taxa; macrophytes and
perennial macroalgae decline and finally disappear. These heavy, uncontrolled, opportunist
macroalgal blooms (e.g. Ulva and Enteromorpha spp.) replace perennial slow-growing
macrophytes with further nutrient increases. The changes in benthic vegetation due to
eutrophication are a series of direct and indirect affects that feedback and self-accelerate
and are which are difficult to control once initiated (Schramm & Nienhuis, 1996).
Increased nutrient levels can lead to excessive algal growth, which may then smother the
diverse understorey. This can cause decreased species richness and a transition in species
composition from long-lived perennial algae to fast-growing ephemeral algae restricting the
abundance of sensitive species. Additional responses may be an undesirable shallow anoxic
level in more sedimentary habitats, as well as excess suspended particulate matter resulting
from increased nutrients and runoff leading to light limitation. This impact can result in a
community transition from algal dominated to animal dominated due to an increase in filter
feeders and an overall change in environmental conditions.
Therefore intertidal macroalgae communities are likely to show a response to elevated
nutrient concentrations through increasing proportions of opportunistic macroalgae with a
corresponding decline in the levels of species richness.

UK TAG Report - Macroalgae on Intertidal Rocky Shores
Page | 53
6.1. Response to Pressure Gradient
Assessing the impacts of anthropogenic disturbance is often difficult due to the lack of long-
term or historical data and the ability to discriminate between natural and anthropogenically
induced changes. This is hindered further by the lack of algal data pre and post adverse
influence. However, two shores within the Firth of Forth, Edinburgh provide an ideal
opportunity for observing long term changes in macroalgae community composition, owing
to the unique set of data collected during significant changes in the pollution loading and
subsequent abatement of sewage pollution.
The City of Edinburgh, on the east coast of Scotland, stretches over 15km of coastline on
the southern shore of the Firth of Forth (Smyth, 1968). It used to be the most extensively
used sea area around Scotland (McLusky, 1987), receiving approximately 270 consented
effluent discharges including a series of nine main outfall pipes subjected to varying
degrees of treatment (Read et al, 1982; Leatherland, 1987). The Seafield Sewage
Treatment Works were commissioned in April 1978, and by 1980 the new system treated
92% of Edinburgh’s sewage with a subsequent dramatic improvement in water quality (Read
et al, 1982).
Since the improved sewerage system, there have been marked changes in the intertidal
benthic fauna and flora. Observations before 1978 showed definite effects of pollution stress,
with an absence of macroalgae and macroinvertebrate species and increased presence of
indicator species (Read et al, 1983). The reduced diversity was attributed partly to the
presence of high suspended solids interfering with the settlement and growth of macroalgal
sporelings on rocks and decreasing light penetration (Read et al, 1983). As water quality
improved, populations of pollution indicator species either declined or totally disappeared
such as mat formations of Polydora ciliata and Fabricia sabella. In response many new and
previously unrecorded species became established including Laminaria spp., Verrucaria sp.
(a lichen) and Chondria sp. (Read et al, 1983). Some of the most notable changes occurred
at Joppa and Granton.
Initial macroalgae records by Traill (1886) provide evidence of high levels of diversity, which
showed considerable decline by 1961 (Knight & Johnston, 1981). The large reduction in
species richness since Traill (1886) was accompanied by a high biomass of Mytilus edulis
and Balanus balanoides, which proceeded to dominate the shore. Such replacement is
regarded as typical of chronic domestic sewage pollution with pools filled with high levels of
suspended matter, deep mud and empty shells (Knight & Johnston, 1981; Johnston, 1972).
Similarly, at Granton a decline in species richness was observed, but was replaced by
extensive mats of polychaetes (Wilkinson et al, 1987). These communities can inhibit growth
of algae and ensure macroalgal communities are prevented from recolonising the habitat.
Following sewage abatement, Granton initially returned to a macroalgae community believed
to be comparable to Traill (1886), but this was later replaced by mussel-barnacle dominance.
At Joppa the shore remained mussel-barnacle dominated. Joppa’s failure to return to its
prior state may be attributed to the pollution-induced mussel-barnacle community being
regarded as a climax community, and highly stable compared with the easily dislodged
replacement community of polychaetes at Granton.

UK TAG Report - Macroalgae on Intertidal Rocky Shores
Page | 54
In many situations any attempts to assess pollution effects is faced with lack of baseline data
from which to work, such as the absence of accurate records of the presence and status of
individual species in a given area at a given time (Johnston, 1971). At Joppa detailed
species lists are provided for 1977 and 1987 (Wilkinson, Scanlan & Tittley, unpublished) and
in 2000 (Wells, 2002). These data show the impact of pollution and subsequent recovery.
Species records at Joppa show a considerable change in species richness from 1977 to
2000 (Figure 12). During 1977 there were only 31 species recorded, which amounts to 54%
of the species recorded in more recent years. The gradual increase in species richness to 57
recorded in 2000 correlates with the cessation of pollution in 1978 and reflects the
subsequent recovery. This increase is reflected in all the algal divisions, although the
dominant division has changed from Chlorophyta in 1977 to Rhodophyta in 2000 suggesting
a significant shift in species composition and general community structure. The species
composition responds well to the predictions. The initial high levels of Chlorophyta suggest a
dominance of opportunist species and a much lower level of perennial and sensitive species.
Over time the number of perennial and sensitive Rhodophyta species has responded well to
the improved environmental conditions, allowing a more diverse community to become
established.
Figure 12: Numerical species richness totals for Joppa during 1977 and 1987 (Wilkinson et
al, unpublished) and 2000 (Wells, 2002) including separate totals for each of the algal
divisions, Chlorophyta, Phaeophyta and Rhodophyta
Table 17: Cumulative species lists for Joppa from Traill, Wilkinson & Scanlan, and Wells
demonstrate the initial high levels of diversity prior to the outfalls, followed by decline during
the period of effluent discharge (1986-1987) and subsequent and gradual recovery

UK TAG Report - Macroalgae on Intertidal Rocky Shores
Page | 55
Traill 1881-
1886
Wilkinson and
Scanlan 1986-
1987
Wells
2000-2001
Total 20th and
21st century
Chlorophyta 17 27 29 31
Phaeophyta 37 15 17 21
Rhodophyta 58 37 40 50
Total 112 79 86 102
7. Levels of Confidence
The outcomes of the tools being developed will govern the action, if any, to be taken on a
particular area. Therefore, there needs to be a high level of confidence in the sampling
frequency, data collected and the tools ability to accurately classify the ecological status of a
water body.
7.1. Confidence in Sampling Frequency
It has been suggested that for intertidal rocky shore macroalgae sampling a single sampling
occasion per year undertaken during the spring/summer period is adequately representative
of the state of that individual site. However species composition is known to vary
considerably throughout the year due to species tolerances and life histories; this level of
variability may also be experienced when sampling the same site on consecutive days. This
may affect the proportions of greens, reds and opportunists and ESG ratio. Similarly species
richness, although remaining broadly constant on an annual cycle in the absence of
anthropogenic impact, does experience slight seasonal fluctuations. Therefore it is important
to ensure that these variations in species composition and richness do not affect the result
and final classification using the tool. A second aspect required to ensure confidence in the
data is the amount collected within a waterbody. Sampling a single site over an extended
area of coastline is not a true representation of the quality status of the waterbody as a
whole.
The factors that need to be considered in the confidence of sampling frequency include the
following
1. The size of the water body – for small water bodies 2-3 sites should be adequate to
classify the area, however for much larger water bodies a greater number of sites
should be considered (3-5).

UK TAG Report - Macroalgae on Intertidal Rocky Shores
Page | 56
2. Presence of hard substrate – intertidal macroalgae communities require the presence
of hard substratum, however some areas of the coastline are predominantly
sedimentary with some water bodies having no appropriate sites to survey. In this
instance the tool should not be considered and only used where applicable. This may
limited the amount of data collected.
3. Presence of localised impacts – in water bodies where there is known localised
impact it would be advisable to sample a variety of sites to include both affected and
non-affected areas, as focusing solely on affected sites will produce a false overview
of the waterbody as a whole. These may require investigative monitoring.
The number of sites is likely to vary between waterbodies and therefore cannot be detailed
specifically, but it is useful to combine it with the number of sampling occasions to give a
good estimate of the general level of confidence. Therefore, sampling a single site on one
occasion over the 6 year reporting cycle is likely to give a lower confidence result than
sampling 3 sites within a water body every 2 years (Table 19).
Table 19: Level of confidence associated with sampling effort based on the number of
sampling occasions within the 6 year sampling period and the total number of sites sampled
within a single water body
Number of Sites (indicative)
Number
of
sampling
occasions
1 2 3
1 Very Low
Confidence
Low Medium
Confidence
2 Low
confidence
Medium
Confidence
High
Confidence
3 Medium
Confidence
High
Confidence
Very hIgh
Confidence
7.2. Confidence in Data
The confidence here lies with the field surveyors’ ability to adequately collect all the required
data to an appropriate standard. This is something which is being addressed both internally
within each of the competent monitoring authorities and externally through proficiency testing
schemes and workshops. For example an external proficiency testing scheme is run by the
National Marine Biological Analytical Quality Control (NMBAQC) Committee using
identification ring tests circulated to participants. The participating laboratories are able to
test their identification skills and identify areas needing additional training; where
identification and field skills are lacking there will be limited confidence in data collected.

UK TAG Report - Macroalgae on Intertidal Rocky Shores
Page | 57
7.3. Confidence of Classification
Collaborations between the EA and WRc have produced a statistically robust means of
calculating the overall level of confidence in the quality status assessment using the full and
reduced species lists. Extracts have been taken from the initial draft report from WRc (see
Davey, 2009) to demonstrate how the confidence of class (C of C) calculation works. The
system has been termed PIRATES (Precision In Rocky shores Analysed To Extract
Statistics). It has been designed to perform calculations for multiple waterbodies
simultaneously and gives the confidence of class over the whole reporting period.
Surveys of macroalgal community composition are conducted on one or more rocky shores
in each waterbody, on one or more occasions during each reporting period. Each survey
yields five sub-metric values, which are averaged to give a Survey EQR between 0 and 1.
Status is defined by a Final EQR, which is the mean of the Survey EQR values (Figure 13).
The confidence of class takes account of the uncertainty in the final status assessment
arising from spatial and temporal variation in the Survey EQR results.
Submetric 1 Submetric 3
Submetric 2 Submetric 4
Submetric 5
Survey EQR
Final EQR
Waterbody
Rocky shore
(unsurveyed)
Rocky shore
surveyed
Average of n surveys
performed on one or more
shores over time
Figure 13: Sampling scheme for RSL tool
Where only one survey is undertaken with a single EQR result, the variability cannot be
measured directly, but can be estimated indirectly using data from other waterbodies.
Therefore, the standard deviation is instead estimated from the mean EQR using an

UK TAG Report - Macroalgae on Intertidal Rocky Shores
Page | 58
approach developed by Ellis & Adriaenssens (2006) to estimate the likely spatio-temporal
variability in Survey EQR as a function of the mean Survey EQR in a waterbody (Figure 13).
The approach seeks to model the combined spatial and temporal variability in survey EQR
results, as measured by their standard deviation, as a function of the mean EQR in a
waterbody. Variability is expected to be greatest in waterbodies of moderate status (EQR ≈
0.5), and to get progressively smaller as the mean EQR tends towards 0 or 1, e.g. to have a
mean EQR of exactly 0 (or 1), all surveys must yield EQR values of 0 (or 1) – i.e. there must
be no variation among surveys. A power curve is used to capture this ∩-shaped relationship.
Figure 14 illustrates a typical dataset with a power curve fitted to it. Each black dot
represents one waterbody, the blue squares represent the anchor points at Mean EQR = 0
and Mean EQR = 1, and the red line represents the best-fit power curve. The curve can be
used to estimate the standard deviation in a water body with a single survey.
0.00
0.05
0.10
0.15
0.20
0.25
0.0 0.1 0.2 0.3 0.4 0.5 0.6 0.7 0.8 0.9 1.0
Mean EQR
Sta
nd
ard
devia
tio
n o
f E
QR
Figure 14: A power curve describing the relationship between EQR variability and mean
EQR
After estimating the EQR and its associated uncertainty, it is necessary to decide on a
suitable statistical model for the uncertainty in the EQR. The simplest option is to assume
that the EQR uncertainty is normally distributed around the specified true EQR value, with
the predicted standard deviation. However, although this model is quite acceptable for most
values of EQR it becomes unsatisfactory at either extreme, because the assumed normal
distribution ‘spills’ outside the permitted 0-1 range. For this reason Ellis & Adriaenssens
(2006) adopted the logit transformation.

UK TAG Report - Macroalgae on Intertidal Rocky Shores
Page | 59
Figure 15 shows the situation in which the assumed EQR mean and standard error are 0.85
and 0.10, respectively. Under the simple normality assumption, an appreciable part of the
right-hand tail spills beyond EQR = 1. In contrast, the logit transformation ensures that the
error distribution ends asymptotically at 1 (at the expense of a longer left-hand tail so as to
achieve the required standard deviation).
0.0
0.1
0.2
0.3
0.4
0.5
0.6
0.3 0.4 0.5 0.6 0.7 0.8 0.9 1 1.1 1.2
Observed EQR
Pro
bab
ilit
y d
en
sit
y
Normal without transformation
Normal using logit transformation
Assumed mean EQR
Figure 15: Illustration of the effect of the logit transformation of EQR
Because the EQRs that make up the Mean EQR result are just a random sample from a
population of possible EQR results, the Final EQR and its standard error are then converted
to a confidence of class using the t-distribution, which takes into account the additional
sampling error.
PIRATES is held within an Excel spreadsheet which calculates the mean EQR and
confidence of class for the FSL and RSL Tools. It performs calculations for multiple
waterbodies and gives the confidence of class over the whole reporting period. The system
assumes that surveys are conducted across the waterbody and throughout the reporting
period to give a representative measure of the level of spatial and temporal variability and
sampling error around the Final EQR is normally distributed.
PIRATES calculates both the face value class (based on the Final EQR) and probability of
the waterbody being in each of the five status classes. Occasionally the face value class
may not be the same as the most probable class given by the CofC assessment. This is
perfectly correct, and arises because the EQR is constrained to take values between 0 and
1. It typically occurs when the mean EQR is close to a boundary between two classes. For
example, consider a waterbody with a Final EQR of 0.78, just below the High/Good

UK TAG Report - Macroalgae on Intertidal Rocky Shores
Page | 60
boundary - the face value class will be Good, but the CofC may say 50% High, 40% Good
and 10% Moderate, which 'averages out' at Good. Thus, there is no contradiction between
the face value result, which relates to the long-term expected EQR value, and the CofC,
which presents the distribution of outcomes that are expected to arise due to random
variation.
An example is provided in Table 18 below to show how the CofC works. Where only a single
EQR is available the standard deviation is predicted by fitting a power curve to predict the
SD of Survey EQRs from the Final EQR.
Table 18: Application of the Confidence of Class.
Confidence of class (%)
Wate
rBo
dy N
am
e
No
. o
f su
rveys
Mean
EQ
R
SD
- o
bserv
ed
SD
- p
red
icte
d
SE
of
mean
Face V
alu
e C
lass
Hig
h
Go
od
Mo
dera
te
Po
or
Bad
Go
od
OrB
ett
er
Mo
dera
teO
rWo
rse
Anglesey North 1 0.801 0.049 0.049 High 50.7 39.8 4.2 1.9 3.5 90.5 9.5
AVON 1 0.821 0.045 0.045 High 63.4 28.2 3.5 1.7 3.3 91.5 8.5
Barnstaple Bay 2 0.804 0.081 0.057 High 52.4 42.1 3.6 1.1 0.8 94.5 5.5
Bideford Bay 1 0.746 0.059 0.059 Good 25.3 60.9 7.2 2.6 4.0 86.2 13.8
Bridgwater Bay 1 0.543 0.098 0.098 Moderate 10.1 23.1 47.7 11.2 7.9 33.2 66.8
Bristol Channel Inner South 2 0.743 0.008 0.006 Good 0.4 99.5 0.1 0.0 0.0 99.9 0.1
Bristol Channel Outer North 4 0.632 0.116 0.058 Good 1.4 67.7 29.9 0.9 0.1 69.1 30.9
Caernarfon Bay North 2 0.827 0.044 0.031 High 75.0 23.3 1.1 0.3 0.3 98.3 1.7
Cardigan Bay Central 2 0.757 0.002 0.001 Good 0.0 99.9 0.0 0.0 0.0 100.0 0.0
Cardigan Bay North 3 0.797 0.031 0.018 Good 44.2 55.6 0.1 0.0 0.0 99.8 0.2
Carmarthen Bay 4 0.740 0.038 0.019 Good 1.4 98.5 0.1 0.0 0.0 99.9 0.1
Cornwall North 2 0.800 0.009 0.006 Good 49.9 50.0 0.1 0.0 0.0 99.9 0.1
Cornwall South 4 0.794 0.047 0.024 Good 39.8 60.0 0.1 0.0 0.0 99.9 0.1
Cumbria 2 0.587 0.126 0.089 Moderate 5.3 39.6 46.3 6.7 2.1 45.0 55.0
Dorset / Hampshire 1 0.795 0.050 0.050 Good 46.9 43.3 4.4 1.9 3.5 90.1 9.9
EASTERN YAR 1 0.714 0.065 0.065 Good 19.0 63.2 10.3 3.2 4.4 82.1 17.9
Fal / Helford 4 0.775 0.031 0.016 Good 8.8 91.2 0.0 0.0 0.0 100.0 0.0
Farne Islands to Newton Haven 3 0.835 0.031 0.018 High 91.5 8.4 0.1 0.0 0.0 99.9 0.1
HELFORD 2 0.777 0.113 0.080 Good 39.8 49.7 7.0 2.0 1.5 89.5 10.5
Holyhead Bay 1 0.788 0.051 0.051 Good 42.2 47.4 4.8 2.0 3.6 89.6 10.4
Holyhead Strait 1 0.885 0.032 0.032 High 85.6 8.3 2.0 1.2 2.9 93.9 6.1
Isle of Wight East 2 0.863 0.014 0.010 High 98.5 1.4 0.1 0.0 0.0 99.8 0.2
Kent North 4 0.680 0.019 0.010 Good 0.0 99.9 0.1 0.0 0.0 99.9 0.1
Step1. Check that data
pulled in correctly for all
waterbodies.

UK TAG Report - Macroalgae on Intertidal Rocky Shores
Page | 61
8. European Intercalibration
The UK takes part in the European intercalibration process (known as Intercal and managed
for the European Commission by the Joint Research Centre [JRC], ECOSTAT). This
process is designed to ensure comparability of assessment across Member States, and to
harmonise quality status thresholds. The intercalibration process is aimed at consistency
and comparability of the classification results of the monitoring systems developed by
member states for each of the biological quality elements. Its main aims are to establish
boundary values between High and Good status, and Good and Moderate status, and that
these correspond between member states. This is achieved by ensuring each member
state’s assessment method is calibrated against agreed benchmark conditions to ensure
results from different methods are equivalent in measuring the impacts of pressures. The
intercalibration exercise is also designed to ensure that the Good status class boundaries
used in the classification schemes are in-line with the WFD’s normative definitions.
Many of the member states have been monitoring different aspects of the marine
environment and different biological parameters. Therefore, data may not always be
available to enable a direct comparison or to establish a tool/classification system which can
be carried across all countries.
The tool that has been developed by the UK to encompass the composition aspect of algal
communities focuses solely on rocky intertidal seashores. Unfortunately many of the
countries within the North East Atlantic geographic area do not possess shores with
comparable environmental conditions. Within the UK there are many shores with large
intertidal extent subjected to broad tidal ranges, often with dense communities of algae
growing within a number of habitats and subhabitats. Although France exhibits a similar
coastline, other countries such as the Netherlands, Denmark and Sweden are subjected to a
limited tidal range, lack of hard substrate and little in the way of intertidal algal communities.
As a result many of these countries have very limited data on intertidal algal species lists
and are unable to participate in this particular tool development and classification system.
However, during the first round of intercalibration Norway (not an EU member state, but part
of the European Economic Area) showed interest in adopting the tool for CW-NEA1/26 and
data were submitted for comparison. These data have been tested using the UK macroalgae
composition tool, the results of which can be used to assess the intercalibration capabilities
of this particular tool.
The data from Norway showed the species lists to be less extensive, with a lower level of
species richness. This may have a negative effect on the tool resulting in a lower level of
classification. However, the other elements within the tools should help even this out slightly.
This should also be a good indication as to the robust nature of the tool.
As of June 2007 the scoring system for the common indices below were agreed by Ireland,
Norway, and the UK. These common indices for this intercalibration metric describe species
richness and composition based on a reduced species list (Table 21) devised specifically for
the boundary setting protocol and classification tool development process. The boundary

UK TAG Report - Macroalgae on Intertidal Rocky Shores
Page | 62
values are slightly different between regions due to the varying levels of diversity and
composition (Table 20).
Table 20: Macroalgae reduced species list metric scoring system for the UK, RoI and
Norway.
0.8 - 1.0 0.6 - 0.8 0.4 - 0.6 0.2 - 0.4 0 - 0.2
High Good Moderate Poor Bad
Scotland 35-70 25-35 17-25 5-17 0-5
England/Wales/RoI 35-69 25-35 15-25 5-15 0-5
NI 34-68 20-34 10-20 3-10 0-3
Norway 33-68 20-33 10-20 4-10 0-4
Scotland 0-12 12-20 20-30 30-80 80-100
England/Wales/RoI 0-15 15-20 20-25 25-80 80-100
NI 0-20 20-30 30-45 45-80 80-100
Norway 0-20 20-30 30-45 45-80 80-100
Scotland 55-100 45-55 35-45 15-35 0-15
England/Wales/RoI 55-100 45-55 40-45 15-40 0-15
NI 45-100 35-45 25-35 10-25 0-10
Norway 40-100 30-40 22-30 10-22 0-10
Scotland 1.0-1.2 0.8-1.0 0.7-0.8 0.2-0.7 0-0.2
England/Wales/RoI 1.0-1.2 0.8-1.0 0.55-0.8 0.2-0.55 0-0.2
NI 0.8-1.2 0.6-0.8 0.4-0.6 0.2-0.4 0-0.2
Norway 0.8-1.2 0.6-0.8 0.4-0.6 0.2-0.4 0-0.2
Scotland 0-10 10-15 15-25 25-50 50-100
England/Wales/RoI 0-10 10-15 15-25 25-50 50-100
NI 0-15 15-25 25-35 35-50 50-100
Norway 0-15 15-25 25-35 35-50 50-100
Opportunist
EQR
Quality Class
RSL
Greens
Reds
ESG
The ‘de-shoring factor’ has also been incorporated to adjust the level of species richness
according to the overall description of the shore using an exponential-type model of the form:
RICHNESS = a + b exp (cSHORE)
where a, b and c are parameters to be estimated from the data. Using least squares, these
parameters were estimated to be:
a = 14.210 b = 4.925 c = 0.108
The final metric system works on a sliding scale to enable an accurate EQR value to be
calculated for each of the different parameters, an average of these values is then used to
establish the final classification status.
Where a shore description is not available the uncorrected level of species richness is to be
put into the final metric, although the level of confidence in the overall result may be reduced
slightly.
The above scoring system for the indices for this metric gives EQR boundaries of:
H/G 0.80
G/M 0.60
M/P 0.40

UK TAG Report - Macroalgae on Intertidal Rocky Shores
Page | 63
P/B 0.20
The average EQR is used to classify this metric.
Table 21: Reduced species list for the intercalibration process for the UK, RoI and Norway.
Zone in which taxa applicable for
assessments
Species Colour Opport ESG Norway
England
/ Wales
/ Ireland
Northern
Ireland
Scotland
/ Northern
England
Blidingia minima Chlorophyta * 2 1 1 1 1
Bryopsis plumosa Chlorophyta 2 1
Chaetomorpha sp. Chlorophyta 2 1
Chaetomorpha linum Chlorophyta * 2 1 1 1
Chaetomorpha mediterranea Chlorophyta * 2 1 1
Chaetomorpha melagonium Chlorophyta 2 1 1 1
Cladophora albida 4 Chlorophyta 2 1
Cladophora rupestris Chlorophyta 2 1 1 1 1
Cladophora sericea 4 Chlorophyta 2 1 1 1
Cladophora sp incl.4 Chlorophyta 2 1
Enteromorpha sp. Chlorophyta * 2 1 1 1 1
Monostroma grevillei Chlorophyta 2 1 1
Rhizoclonium tortuosum Chlorophyta 2 1
Acrosiphonia sp incl.1 Chlorophyta 2 1
Spongomorpha aeruginosa / pallida 2 Chlorophyta 2
Spongomorpha arcta 1 Chlorophyta 2 1
Spongomorpha sp.incl.2 Chlorophyta 2 1
Halochlorococcum moorei Chlorophyta 2 1
Ulothrix sp 3 Chlorophyta 2 1
Ulothrix/Urospora 3 Chlorophyta 2 1
Ulva lactuca Chlorophyta * 2 1 1 1 1
Prasiola sp. Chlorophyta 2 1
Alaria esculenta Phaeophyta 1 1 1 1
Ascophyllum nodosum Phaeophyta 1 1 1 1 1
Asperococcus fistulosus Phaeophyta 1 1 1 1
Chorda filum Phaeophyta 1 1 1 1
Chorda tomentosa Phaeophyta 2 1
Chordaria flagelliformis Phaeophyta 2 1 1
Cladostephus spongious Phaeophyta 2 1 1 1 1
Desmarestia aculeata Phaeophyta 2 1 1
Dictyosiphon foeniculaceus Phaeophyta 2 1 1
Dictyota dichotoma Phaeophyta 2 1 1 1
Ectocarpus sp. Phaeophyta * 2 1 1 1 1
Elachista fucicola Phaeophyta 2 1 1 1 1
Fucus evanescens Phaeophyta 1 1
Fucus serratus Phaeophyta 1 1 1 1 1
Fucus spiralis Phaeophyta 1 1 1 1 1
Fucus vesiculosus Phaeophyta 1 1 1 1 1
Halidrys siliquosa Phaeophyta 1 1 1 1 1
Himanthalia elongata Phaeophyta 1 1 1 1 1

UK TAG Report - Macroalgae on Intertidal Rocky Shores
Page | 64
Laminaria digitata Phaeophyta 1 1 1 1 1
Laminaria hyperborea Phaeophyta 1 1 1 1
Laminaria saccharina Phaeophyta 1 1 1 1 1
Leathesia difformis Phaeophyta 1 1 1 1 1
Litosiphon laminariae Phaeophyta 2 1
Mesogloia vermiculata Phaeophyta 2 1
Pelvetia canaliculata Phaeophyta 1 1 1 1 1
Petalonia fascia Phaeophyta 2 1 1
Pilayella littoralis Phaeophyta * 2 1 1 1 1
Ralfsia sp. Phaeophyta 1 1 1 1 1
Saccorhiza polyschides Phaeophyta 1 1
Scytosiphon lomentaria Phaeophyta 1 1 1 1 1
Sphacelaria sp Phaeophyta 2 1 1
Spongonema tomentosum Phaeophyta 2 1 1 1
Saccorhiza dermatodea Phaeophyta 1 1
Acrochaetium alariae Rhodophyta 2 1
Aglaothamnion/Callithamnion Rhodophyta 2 1 1 1 1
Ahnfeltia plicata Rhodophyta 1 1 1 1 1
Aglaothamnion sepositum Rhodophyta 2 1
Audouinella purpurea Rhodophyta 2 1 1
Audouinella sp Rhodophyta 2 1 1
Bangia atropurpurea Rhodophyta 2 1
Brogniartella byssoides Rhodophyta 2 1
Calcareous encrusters Rhodophyta 1 1 1 1 1
Callophyllis laciniata Rhodophyta 1 1
Catenella caespitosa Rhodophyta 1 1 1
Ceramium nodulosum Rhodophyta 2 1 1 1 1
Ceramium shuttleworthanium Rhodophyta 2 1 1 1 1
Ceramium sp. Rhodophyta 2 1 1
Chondrus crispus Rhodophyta 1 1 1 1 1
Corallina officinalis Rhodophyta 1 1 1 1 1
Cryptopleura ramosa Rhodophyta 2 1 1 1
Cystoclonium purpureum Rhodophyta 1 1 1 1 1
Delesseria sanguinea Rhodophyta 2 1
Dilsea carnosa Rhodophyta 1 1 1 1
Dumontia contorta Rhodophyta 1 1 1 1 1
Erythrotrichia carnea Rhodophyta 2 1 1 1
Furcellaria lumbricalis Rhodophyta 1 1 1 1 1
Gastroclonium ovatum Rhodophyta 1 1
Gelidium sp. Rhodophyta 1 1 1
Gracilaria gracilis Rhodophyta 1 1
Halurus equisetifolius Rhodophyta 2 1
Halurus flosculosus Rhodophyta 2 1
Heterosiphonia plumosa Rhodophyta 2 1
Hildenbrandia rubra Rhodophyta 1 1 1 1
Hypoglossum hypoglossoides Rhodophyta 2 1
Lomentaria articulata Rhodophyta 1 1 1 1 1
Lomentaria clavellosa Rhodophyta 1 1 1
Mastocarpus stellatus Rhodophyta 1 1 1 1 1
Melobesia membranacea Rhodophyta 1 1 1
Membranoptera alata Rhodophyta 2 1 1 1 1
Nemalion helminthoides Rhodophyta 1 1

UK TAG Report - Macroalgae on Intertidal Rocky Shores
Page | 65
Odonthalia dentata Rhodophyta 1 ? 1 1
Osmundea hybrida Rhodophyta 1 1 1 1
Osmundea sp Rhodophyta 1 1
Osmundea pinnatifida Rhodophyta 1 1 1 1
Devaleraea ramentacea Rhodophyta 2 1
Palmaria palmata Rhodophyta 1 1 1 1 1
Phycodrys rubens Rhodophyta 2 1 1
Phyllophora sp. incl. Coccotylus
truncata Rhodophyta 1 1 1 1 1
Plocamium cartilagineum Rhodophyta 2 ? 1 1 1
Plumaria plumosa Rhodophyta 2 1 1 1 1
Polyides rotundus Rhodophyta 1 1 1 1
Polysiphonia fucoides Rhodophyta 2 1 1 1 1
Polysiphonia lanosa Rhodophyta 2 1 1 1 1
Polysiphonia sp. Rhodophyta 2 1 1 1 1
Porphyra leucosticta Rhodophyta * 2 ? 1
Porphyra linearis Rhodophyta * 2 1
Porphyra umbilicalis Rhodophyta * 2 1 1 1 1
Ptilota gunneri Rhodophyta 2 1 1
Rhodomela confervoides Rhodophyta 2 1 1 1 1
Rhodothamniella floridula Rhodophyta 2 1 1 1
Nemalion helminthoides Rhodophyta 1 1 1
Total 69 68 70
Other species that might be
considered are:
Cruoria pellita (southern to sector
19), Chylocladia verticillata (southern
to sector 15),
Gloiosiphonia capillaris (southern to
sector 19)
The RSL tool was intercalibrated successfully in Phase 1 of intercal (European Commission,
2008; Carletti & Heiskanen, 2009) with no changes to the UK’s tool class boundaries.
However, further guidance from the Commission on response to pressures requires to be
investigated in Phase 2 of Intercalibration.

UK TAG Report - Macroalgae on Intertidal Rocky Shores
Page | 66
9. References
Carletti,A. & Heiskanen, A.-S. 2009 (Eds). Water Framework Directive Intercalibration
Technical Report. Part 3: Coastal and Transitional Waters. JRC EUR 23838 EN/3 - 2009
Chapman, V.J. 1943. Zonation of marine algae on the seashore. Proceedings of the Linnean
Society of London, 154, 239-253.
Daly, M.A. & Mathieson, A.C. 1977. The effects of sand movement on intertidal seaweeds
and selected invertebrates at Bound Rock, New Hampshire, USA. Marine Biology, 43, 45-
55.
Davey, A. (2009). Confidence of Class for WFD Marine Plant Tools. WRC report EA7954.
34 pp.
Den Hartog, C. 1994. Suffocation of a littoral Zostera bed by Enteromorpha radiata. Aquatic
Botany, 47: 21-28.
Edwards, P. 1975. An assessment of possible pollution effects over a century on the benthic
marine algae of Co. Durham, England. Botanical Journal of the Linnean Society, 70, 269-
305.
Ellis, J. and Adriaenssens, V. 2006. Uncertainty estimation for monitoring results by the
WFD biological classification tools. Bristol: Environment Agency
European Commission, 2008. Commission of 2008 establishing, pursuant to Directive
2000/60/EA of the European Parliament and of the Council, the values of the Member State
monitoring system classifications as a result of the Intercalibration exercise. Commission of
the European Communities.
Guiry, M.D., 1997. Benthic red, brown and green algae. In: Howson, C.M. and Picton, B.E.
The species directory of the marine fauna and flora of the British Isles and surrounding seas.
The Ulster Museum and the Marine Conservation Society, Belfast and Ross-on-Wye.
Hayden, H.S., Blomster, J., Maggs, C.M., Silva, P.C., Stanhope, M.J. and Waaland, J.R.
2003. Linnaeus was right all along: Ulva and Enteromorpha are not distinct genera. Eur. J.
Phycol. 38, 277-294.
Institute of Offshore Engineering (IOE), 1985. Channel Fixed Link EIA Report no.6 Marine
Ecology & Fisheries. Report to Channel Tunnel Group/France Manche from the Institute of
Offshore Engineering, Heriot-Watt University.
Johnston, C.S., 1972. Macroalgae and their Environment. Proceedings of the Royal Society
of Edinburgh. 71B, 195-207.
Knight, S.J. and Johnston, C.S., 1981. Effects of pollution on the seaweed distribution in the
Firth of Forth. Proceedings of the 8th International Seaweed Symposium. Bangor, 1974. 383
– 387.

UK TAG Report - Macroalgae on Intertidal Rocky Shores
Page | 67
Leatherland, T.M., 1987. The estuary and Firth of Forth, Scotland: uses and aims.
Proceedings of the Royal Society of Edinburgh. 93B, 285-297.
Littler, M.M., D.S. Littler, and Taylor, P.R., 1983. Evolutionary strategies in a tropical barrier
reef system: functional form groups of marine macroalgae. Journal of Phycology. 19, 229-
237.
Lobban, C.S. and Harrison, P.J., 1994. Seaweed ecology and physiology. Cambridge
University Press, Cambridge.
Lüning, K., 1990. Seaweeds. Their environment, biogeography and ecophysiology. John
Wiley and Sons, New York, USA.
Maggs, C. A. 1986. Scottish Marine Macroalgae: A Distributional Checklist, Biogeographical
Analysis and Literature Abstract. Nature Conservancy Council, Peterborough.
Mathieson, A.C., Penniman, C.A. & Harris L.G. 1991. Northwest Atlantic Rocky Shore
Ecology. In Mathieson, A.C. & Nienhuis, P.H.(eds.) Ecosystems of the World. Vol. 24
Intertidal and Littoral Ecosystems. 109-191.
McLusky, D.S., 1987. Introduction. Proceedings of the Royal Society of Edinburgh. 93B, 7-
10.
Orfanidis, S., Panayotidis, P. and Stamatis, N. 2001. Ecological evaluation of transitional and
coastal waters: A marine benthic macrophytes-based model. Mediterranean Marine Science.
2/2, 45-65.
Prescott, G.W., 1969. The Algae: A Review. Thomas Nelson and Sons Ltd, London.
Read, P.A., Anderson, K.J., Matthews, J.E., Watson, P.G., Halliday, M.C. and Shiells, G.M.,
1983. Effects of pollution on the benthos of the Firth of Forth. Marine Pollution Bulletin. 14,
12-16.
Read, P.A., Anderson, K.J., Matthews, J.E., Watson, P.G., Halliday, M.C. and Shiells, G.M.,
1982. Water quality in the Firth of Forth. Marine Pollution Bulletin. 13, 421-425.
Scanlan, C., Foden, J., Wells, E. and Best, M.A., 2007. The monitoring of opportunistic
macroalgal blooms for the Water Framework Directive. Marine Pollution Bulletin. 55, 162 –
171.
Schramm,W. & Nienhuis,P.H. (1996). Marine Benthic Vegetation (Eds.) Springer, Berlin.
Smyth, J.C., 1968. The fauna of a polluted shore in the Firth of Forth. Helgoländer
Wissenschaftliche Meeresuntersuchungen.17, 216-223.
Soulsby, P.G., Lowthion, D. & Houston, M. 1982. Effects of macroalgal mats on the ecology
of intertidal mudflats. Marine Pollution Bulletin, 13: 162-166.
Sousa, W.P. 1979. Disturbance in marine intertidal boulder fields: the non-equilibrium
maintenance of species diversity. Ecology. 60, 1225 – 1239.
Sousa, W.P. 1984. The role of disturbance in natural communities. Ann. Rev. Ecol. Syst., 15,
353-391.

UK TAG Report - Macroalgae on Intertidal Rocky Shores
Page | 68
Tittley, I. and Price, J.H., 1978. The benthic marine algae of the eastern English Channel: a
preliminary floristic and ecological account. Botanica Marina. 21, 499 – 512.
Traill, G.W., 1886. The Marine Algae of Joppa. Transactions and Proceedings of the
Botanical Society of Edinburgh. 16, 395-402.
Tubbs, C.R. & Tubbs, H.M. 1983. Macroalgal mats in Langstone Harbour, Hampshire,
England. Marine Pollution Bulletin, 14:148-149.
Vincent, C., Heinrich, H., Edwards, A., Nygaard, K. and Haythornwaite, J., 2002. Guidance
on typology, reference conditions and classification system for transitional and coastal
waters. Final draft. Produced by CIS Working Group 2.4 (COAST), Common Implementation
Strategy of the Water Framework Directive. Brussels: European Commission.
Water Framework Directive (2000). Directive 2000/60/EC of the European Parliament and
the Council of 23rd October 2000 establishing a framework for Community action in the field
of water policy. European Communities Official Journal L327 22.12.2000, 73pp.
Wells, E. 2002. Seaweed Species Biodiversity on Rocky Intertidal Seashores in the British
Isles. Ph.D. Thesis, Heriot-Watt University, Edinburgh.
Wells, E. and Wilkinson, M. 2002. Intertidal seaweed biodiversity in relation to environmental
factors – a case study from Northern Ireland. Marine Biodiversity in Ireland and Adjacent
Waters, Ulster Museum, Belfast.
Wells, E. and Wilkinson, M. 2003. Intertidal seaweed biodiversity of Orkney. Coastal Zone
Topics. 5, 25-30.
Wells, E., Wood, P., Wilkinson, M. & Scanlan, C. 2007. The use of macroalgal species
richness and composition on intertidal rocky seashores in the assessment of ecologcial
quality under the European Water Framework Directive. Marine Pollution Bulletin. 55, 151 –
161.
Wells, E., Best, M., Scanlan, C. & Foden, J. 2010. Water Framework Directive development
of classification tools for ecological assessment. UKTAG Technical Document. Publ.
UKTAG
Wilkinson, M. 1998. Intertidal Macroalgae in Relation to the Disposal of Colliery Waste on
the Coastline of County Durham. Report to Durham County Council from Department of
Biological Sciences, Heriot-Watt University. pp37.
Wilkinson, M., Fuller, I.A., Telfer, T.C., Moore, C.G. and Kingston, P.F., 1988. A
Conservation Oriented Survey of the Intertidal Seashore of Northern Ireland. Institute of
Offshore Engineering, Heriot-Watt University, Edinburgh.
Wilkinson, M., Scanlan, C. M. and Tittley, I., 1987. The attached algal flora of the estuary
and Firth of Forth. Scotland. Proceedings of the Royal Society of Edinburgh. 93B, 343-354.
Wilkinson, M. and Tittley, I., 1979. The marine Algae of Elie: A reassessment. Botanica
Marina. 22, 249-256.
UK TAG Report - Macroalgae on Intertidal Rocky Shores
Page | 69
Wilkinson, M. & Wood, P. 2003. Type-specific reference conditions for macroalgae and
angiosperms in Scottish transitional and coastal waters: Report to Scottish Environment
Protection Agency. SEPA Project Reference 230/4136. Heriot-Watt University, Edinburgh,
105 pp.
Wilkinson, M., Wood, P., Wells, E. & Scanlan, C. 2007. Using attached macroalgae to
assess ecological status of British estuaries for the European Water Framework Directive.
Marine Pollution Bulletin. 55, 136 – 150