water, history and the australian city - home page - … · water, history and the australian city...
TRANSCRIPT

Water, history and the Australian cityUrbanism, suburbanism and watering a dry continent, 1788-2015Lionel Frost, Andrea Gaynor, Jenny Gregory, Ruth Morgan, Seamus O’Hanlon, Peter Spearritt, John Young

2 | Water, history and the Australian city
Water, history and the Australian city Urbanism, suburbanism and water in a dry continent, 1788-2015 Understanding social processes to achieve water sensitive cities (Project A2.1) A2.1 – 2 - 2016
This report provides the historical context for Australian urban and suburban development in the period since European colonisation in 1788.
Author
Lionel Frost1, 4, Andrea Gaynor2, 4, Jenny Gregory2, 4, Ruth Morgan1, 4, Seamus O’Hanlon1, 4, Peter Spearritt3, 4, John Young1
1 Monash University 2 The University of Western Australia 3 The University of Queensland 4 CRC for Water Sensitive Cities
© 2016 Cooperative Research Centre for Water Sensitive Cities Pty Ltd.
This work is copyright. Apart from any use permitted under the Copyright Act 1968, no part of it may be reproduced by any process without written permission from the publisher. Requests and inquiries concerning reproduction rights should be directed to the publisher.
Publisher
Cooperative Research Centre for Water Sensitive Cities
Level 1, 8 Scenic Blvd, Clayton Campus Monash University Clayton, VIC 3800
p. +61 3 9902 4985 e. [email protected] w. www.watersensitivecities.org.au
Date of publication: July 2016
ISBN: 978-1-921912-38-2
An appropriate citation for this document is: Frost, L., Gaynor, A., Gregory, J., Morgan, R., O’Hanlon, S., Spearritt, P and Young, P. (2016) Water, history and the Australian city: urbanism, suburbanism and water in a dry continent, 1788-2015, Melbourne, Australia: Cooperative Research Centre for Water Sensitive Cities.
Disclaimer
The CRC for Water Sensitive Cities has endeavoured to ensure that all information in this publication is correct. It makes no warranty with regard to the accuracy of the information provided and will not be liable if the information is inaccurate, incomplete or out of date nor be liable for any direct or indirect damages arising from its use. The contents of this publication should not be used as a substitute for seeking independent professional advice.

CRC for Water Sensitive Cities | 3
Table of contents
Table of figures 5
Executive summary 6
Introduction: water, history and the Australian city 8
Part One: From Greater Brisbane to the ‘200 Kilometre City’ 10
Low densities and the ubiquitous ‘Queenslander’ 10
The coming of Greater Brisbane 12
The American invasion 12
A car-based metropolis 13
Suburban subdivision and the sewering of Brisbane 13
Belated modernisation 15
The decline of manufacturing and the rise of service industries 16
The making of the 200 kilometre city 17
From flood to drought 19
The water grid and desalination to the rescue 20
The shock of the 2011 flood 21
Conclusion 22
Part Two: Melbourne - watering the suburban city 23
Introduction: the origins of sprawl 23
Water and colonial Melbourne 23
Problems of growth 25
Addressing environmental disamenity 26
Twentieth Century Melbourne: from depression to Fordism to Neo-liberalism 29
The collapse of the boom: Federation and the lead up to the First World War 29
The interwar years 30
Postwar: Heartbreak Streets 32
1960s and 1970s: Fordism, new dams and sewerage 34
Post-1980s: the turn to economic rationalism, pricing, pipelines and desalination 35
Conclusion 36
4 | Water, history and the Australian city
Part Three: Perth - water for a sandy city 37
Introduction 37
Living with wells and cesspits: 1829-1886 38
The gold boom and water needs: 1887-1917 38
Continuing water crises: 1918-1925 39
The era of big dams commences: 1925-1945 41
Suburban and industrial expansion: 1946-1959 42
The thirst increases and a new boom begins: 1960-1969 44
Scarcity returns: 1970-1978 45
A growing water consciousness: 1978-1994 47
Curbing consumption: 1994-2000 48
Water crisis: 2001-2005 48
Drought-proofing a drying city: 2006-2015 49
Conclusion 51
Conclusion: urban water sensitivity 53
Timelines 54
References 56
Introduction 56
Part one 56
Part two 57
Part three 59
Table of contents (cont.)

CRC for Water Sensitive Cities | 5
Figure 1: Private home size in Greater Brisbane 11
Figure 2: The Sewering of Brisbane 14
Figure 3: Employment by Sector Post-War Brisbane 16
Figure 4: Twenty-First Century Brisbane Population 17
Figure 5: South East Queensland Population Densities, 2006. 18
Figure 6: Hoddle’s Grid 23
Figure 7: The Yarra and its Tributaries 24
Figure 8: Melbourne, 1901. 28
Figure 9: Melbourne Urban Densities, 1929. 30
Figure 10: ‘Californian’ Bungalow, Preston, 1932. 31
Figure 11: ‘Heartbreak Street’, Moorabbin, 1955. 33
Figure 12: Melbourne Statistical District, 1970. 34
Figure 13: Plan showing existing and proposed water supply of Perth and suburbs, 1903. 40
Figure 14: Plan for the Perth Metropolitan Area 43
Figure 15: Perth estimated annual average daily water usage 44
Figure 16: Water Corporation Drinking Water Supply, Integrated Water Supply Scheme, 2011. 50
Table of figures

6 | Water, history and the Australian city
Executive summary This report provides the historical context for Australian urban and suburban development in the period since European colonisation in 1788. The report is a deliverable for Cooperative Research Centre for Water Sensitive Cities (CRCWSC) project on ‘Understanding social processes to achieve water sensitive cities’ (Project A2.1).
While the major focus is the three key node cities of the CRCWSC (Brisbane, Melbourne and Perth) the report also provides background information on the histories of other Australian cities and locates the Australian urban experience within international contexts of the ‘settler societies’ of the so-called New World.
The key three cities have differing early histories as well as climate and topographic differences – sub-tropical and hilly Brisbane, temperate and flat Melbourne, and Mediterranean and flat Perth. Despite these differences, residents of each of these cities as with residents of all Australian cities - have from at least since the late nineteenth century demonstrated a clear preference for suburban rather than urban living, and a strong preference for low-density, detached dwellings over higher-density attached ones. They have also demonstrated a willingness to wear the elevated private costs associated with these dwelling and ‘lifestyle’ choices.
In this report we draw on the historical concept of ‘path dependency’ - that is the key constraining roles that decisions made or not made in the past have on contemporary practices and policy options. This central concept leads us to argue that as planners, engineers
and policy-makers seek to move us towards a more water sensitive future, rather than try to impose new morphologies, habits and practices on a likely unwilling Australian public, they should instead actively work with new and existing suburban communities to adapt received ideas about residential and dwelling cultures to these new hydrological constraints.
While the report makes clear that Australians have traditionally been profligate with water, we also demonstrate that they have always shown a remarkable willingness to adapt water habits and usage during times of crisis. Our report proves that whereas in the past planners and governments have traditionally looked to ‘big engineering’ solutions such as newer and ever-larger dams (or more recently desalination plants) in order to deal with issues around water supply and demand, in practice two important but administratively simple and cheap policy changes have had the greatest impact: water pricing and public education campaigns.
The latter has been especially effective during periods of drought. The historical evidence overwhelmingly demonstrates that once the impacts of drought and wasteful usage of water have been explained, urban Australians have adapted their water use and behaviours to fit the short-term need for restraint. We see no reason why that should not remain the case into the future. We thus recommend that in a climate change-influenced water constrained-future, public education campaigns about the importance of water sensitivity should become a permanent component of public policy.

CRC for Water Sensitive Cities | 7

8 | Water, history and the Australian city
Introduction: water, history and the Australian city While Australia’s self-image, and that which we like to project to the world, is of a rural or ‘Bush’ people, the reality is the nation is one of the most urbanised societies in the world. More than 60% of Australians live in the eight State and Territory capitals, and nearly 40% in the two largest cities, Sydney and Melbourne alone. This has long been the case, with each of the six colonies founded as urban settlements which have remained their individual state’s dominant population centre to this day.
But Australian cities are unusual in that rather than being compact and dominated by high-density apartment blocks and other tall buildings as is the case in major cities internationally, the most notable feature is the predominance of the single-storey detached family homes as the standard dwelling type. The appeal of the detached house and the ‘idea of home’, thus means that while Australians are urbanites, the lived experience of most us has always been overwhelmingly suburban. Australia’s foremost urban historian Graeme Davison has argued that Australia rather than the United States is likely the world’s first suburban nation.1
The ubiquity of the detached single family dwelling and the amount of space occupied by each of these millions of ‘homes’ means that our metropolitan areas are some of the largest and lowest density in the world. The largest city, Sydney, today has a metropolitan population of more than four million in an area of more than 12,000 square kilometres and thus a population density of less than 400 per square kilometre. The smallest capital, Hobart, contains 212,000 people spread across nearly 1200 square kilometres at density of only 123 people per square kilometre.2
These numbers are low by international standards, and even by those of similarly suburban nations such as Canada where for example, Greater Vancouver has over 800 people per square kilometre.3 In further contrast, in more densely-settled European urban regions such as Greater Paris and Greater Berlin the figures are closer to 4000 people per square kilometre, nearly ten times those of our most densely populated city, Sydney.
Australia’s major urban settlements are thus not really cities at all in the way this term is understood in most other parts of the world. Australia’s major urban areas are reflective of the values and tastes of the immigrant ‘settler’ societies founded in the English-speaking New Worlds of North America and Australasia in the last decades of the eighteenth century and the first decades of the nineteenth. Economic historian Lionel Frost has argued that Australia’s cities, especially Melbourne, Adelaide and Perth should thus be seen, like their counterparts on the west coast of North America, as part of a ‘new urban frontier’ – cities dominated by detached single-family houses, and thus low-density and sprawling.4 Sydney, Brisbane and Hobart have different foundational stories to these other later cities, and their higher dwelling densities and layouts reflect both their hilly topographical locations and unplanned early development, but in the twentieth century even these places became suburban in form on their ever-expanding peripheries as the detached single-family house became the national dwelling standard.
While this emphasis on suburban rather than urban life is rooted in the past, it still retains its appeal today. The form and culture of contemporary Australian cities reflect decisions made by previous generations, an example of what historians call ‘path-dependency’ – the idea that the present is a function of decisions and ideas that come to us from the past. While historians and contemporary commentators are increasingly uncovering stories of Australians who seek or have sought a more urban style of life in apartments and other higher-density dwelling types, the suburban ideal remains central to how most Australians desire to live. This holds not just for Australians of Anglo-Saxon or Celtic origin. Australian cities have amongst the highest levels of overseas-born residents anywhere in the world. In Sydney, Melbourne and Perth about 40% of residents are overseas-born, with at least another 20% having at least one overseas-born parent. These immigrants come from more than 200 different cultures, with increasing numbers having no link to British social or cultural traditions. Yet most remain wedded to the idea of ownership of a single-family detached suburban dwelling.
CRC for Water Sensitive Cities | 9
This historical and continuing preference for suburban rather than urban life and the associated low population and dwelling density in Australia means that providing fixed urban services such as water, sewerage and transport are expensive, both because of the sheer vastness of the rails and pipes these things need in an extensive urban area, but also because the cost per person/dwelling is enormous. Whereas in a densely built-up area these costs are shared between thousands of residents per square kilometre, in most Australian cities it is at best hundreds. As we demonstrate throughout this report Australians have been happy to bear the burden of those costs, and demonstrated a preparedness to accept high public costs in order to benefit from the high private amenity of low-density living– or possibly to go without such urban services and thus suffer poor public amenity in order to capture the high private gains of low taxation.
Such low dwelling densities and an emphasis on expensive private rather than public uses of space might suggest that Australian urban and dwelling traditions are wasteful and will need to change in response to the demands and realities of water scarcity and a changing climate. There is no question that Australian cities have traditionally been ‘thirsty’, especially in their uses of water for greening ‘unproductive’ or ‘ornamental’ spaces such as gardens and lawns. But such spaces have also been productive when used for growing food, or as permeable sinks for excess rainwater. It may be that what at first has looked to be a proclivity to use spaces unproductively, wastefully and thirstily might actually provide useful guides to how to better use water resources into the future.
The following report documents the urban histories of three Australian cities, Brisbane, Melbourne and Perth from the times of their foundations through to the present. In doing so we show that the form and cultures of contemporary cities are functions of their histories – for good or otherwise. While not solely focussed on water supply and usage per se, throughout we show how water availability and scarcity has shaped the structures and functions of these three Australian cities through different periods of population growth, economic change, land use and drought. In line with our project brief, the main focus here is on the three nodes cities of the CRC, Brisbane, Melbourne and Perth, but throughout the report some reference is made to Australia’s other major urban centres, which while all having their own distinct histories and trajectories share many of the features of the three discussed in detail here. So while this report is a history of the three node cities, it should also be seen as a history of Australian urbanism.

10 | Water, history and the Australian city
Part One: From Greater Brisbane to the ‘200 Kilometre City’ In 1925 Brisbane became the only Australian capital city to have metropolitan local government status conferred on it by an act of state parliament, taking in all the municipalities and shires within 10 miles (16.1km) of the General Post Office (GPO). Greater Sydney and Greater Melbourne movements had also tried to create metropolitan-wide councils, but proud municipality and shire fiefdoms in those cities successfully fought against the notion of ‘City’ government in the southern capitals. Brisbane became the nearest that Australia has ever got to a city state, controlling water, sewerage, electricity, trams, buses and roads.1
Situated on the Brisbane River, the city centre is on the north side of the river and 15 km in a straight line from the river mouth on Moreton Bay. The metropolitan area had a population of nearly 120,000 in 1901, compared with 29,000 in the Brisbane municipality and 25,500 in South Brisbane. A port city, with some elegant colonial buildings, Brisbane’s nineteenth century economy revolved around exporting agricultural products, usually in raw form, but sometimes, as in the case of sugar, in processed form.
By the time of Federation, the city had already experienced a number of very serious floods, and flood waters, to state the obvious, do not fall neatly within municipal boundaries. No other Australian capital city has experienced so many disastrous floods, and that has long been a leitmotif of attitudes to water in Brisbane. With one and a half metres of rainfall per annum, and the potential for flooding, there is usually, in the public mind, too much water, so a prolonged drought comes as an unexpected shock.
Significant floods had occurred in the 1840s and the late 1880s, but in February 1893 there were three flood events, one of them 4.5 metres higher than the previous record. Boats were left aground in the botanical gardens and the Eagle Farm flats. The Indooroopilly Bridge was washed away, along with the much more substantial Victoria Bridge, which linked South Brisbane with the city centre. Major points of inundation included Milton, back up Breakfast Creek spreading to Bowen Hills, two-thirds of the city centre, South Brisbane, back up Norman Creek to Stones Corner and Coorparoo, from Oxley Creek across to Rocklea and upstream to Acacia Ridge.
Flood mitigation by upstream reservoirs in 1893 was beyond the colony’s resources or its need for water storage. Metropolitan Brisbane was well supplied by both the Enoggera and Gold Creek reservoirs (1886). A small storage on Cabbage Tree Creek, a tributary of the Brisbane River at Kholo, was completed in 1916. Known as Lake Manchester, it did not fill until the 1920s because of a rain-shadow effect from the Daguilar Range.
The Somerset Dam on the Stanley River near Kilcoy became the first major dam for the growing metropolis. Begun in 1935, the dam took 20 years to complete, with work ceasing during the war. It mitigated flood conditions in 1955, 40% of its capacity being kept unfilled for flood control. While Brisbane remained relatively compact, reticulated water connections were available to most houses in urban areas, with tanks in most of the rural parts of the former shires, where residential densities were so low that reticulated water could not be justified.
Low densities and the ubiquitous ‘Queenslander’ Brisbane largely escaped overcrowding and meagre house allotments. Concerned about small allotments in Petrie Terrace, Paddington and Woolloongabba, the government legislated in 1885 for minimum allotments of 16 perches, say 10 metres by 40 metres. Those houses in Brisbane that were not connected to the water supply had plenty of room for a tank, usually on a wooden stand, at the rear of the block. Smaller residential blocks, even in the inner city, were far larger than the three-to-five metre frontages to be found in inner metropolitan Sydney and Melbourne. Population densities reflected the difference: the 1921 census recorded densities of 12-13 people per acre in South Brisbane and Brisbane; in Sydney, Glebe had 44, Newtown 64 and Paddington 65; and in Melbourne, Fitzroy had 38 and Richmond 30. In Brisbane the middle class could easily afford a ‘Queenslander’, an elegant cottage on stilts with wide verandas and ornate timberwork, well-suited to the often oppressive summers. The middle class chose house locations on the ridges, where breezes kept summer bearable. Local saw mills provided cheap hardwood for frames and weatherboard planks for cladding, with corrugated iron roofs. In the working class suburbs much more modest houses were often built two rooms at a time, with an add-on kitchen at the back. The cheapest blocks of land were in the hollows, and when they were near rivers and creeks, the blocks most likely to flood.

CRC for Water Sensitive Cities | 11
The wealthiest residents sought out elevated sites overlooking the river, so Hamilton (with a tram in 1899) saw a bevy of grand mansions constructed, some still of wood. New upper-working and middle-class suburbs experienced their own onset of largesse with larger houses. A comparison of two census districts in 1911, and a further comparison with 1933 data shows a pronounced trend away from four room houses toward six room houses:
Suburbs in Census district Private houses (% of Total)
Four Rooms Six Rooms
Brisbane Central, Petrie Terrace,
Spring Hill, Fortitude Valley (1911)
19.5 21.9
Red Hill, Paddington, Kelvin Grove,
Ashgrove (1911)
17.4 25.1
Kelvin Grove, Ashgrove (1933) 13.2 35.9
Figure 1. Private home size in Greater Brisbane (Source: Commonwealth Census, 1911, 1933).
Similar percentages for four and six roomed houses are found in 1933 for the tram line suburbs of Lutwyche and Wooloowin, Annerley and Greenslopes, and Norman Park and Morningside.
The new houses were built on blocks of 16 perches or more, and often on two consolidated blocks, giving relatively low housing densities. Such densities yielded low population catchments for retailing centres, resulting in small local centres and neighbourhood stores and leaving the city centre and Fortitude Valley as Brisbane’s dominant retail centres. Each was effectively fed by radial tram and train networks.
The river had nearly continuous wharves from Victoria Bridge to Kangaroo Point (except the Botanic Gardens and
Government House shoreline), and opposite Government House the railway wharves were a terminus for the South Brisbane railway line. The line intersected three tramlines at Five Ways (Ipswich Road, Stanley Street). Downstream from Kangaroo Point there were the sugar refinery wharf (New Farm), wharves near Breakfast Creek and the gas works. Much of Brisbane’s economy revolved around processing agricultural products for local consumption and export to the southern states, from sugar and canneries to breweries and flour mills. Most manufacturing aimed at local markets and the state more generally, with regular freighters plying the Queensland coast and the completion of the rail line to Cairns by the late 1920s. Small clothing and boot factories thrived under tariff protection, but cars and white goods were usually imported from Britain, or in some cases, from Sydney or Melbourne.

12 | Water, history and the Australian city
The coming of Greater Brisbane
The management of wharves and bridges could not be left to the fragmented system of metropolitan local government, and neither could water and sewerage nor the privately-owned tramway system. The Ryan Labor Government (1915-1916) determined on local government reform and amalgamation. A thorough democrat, Premier Ryan wanted the local government franchise extended to all adults and the new council to assume responsibility for the Metropolitan Water and Sewerage Board. The Labor Party was attracted to the notion of municipal enterprise, from electric tramways and electric light (a municipally-owned power station could provide both) to the ownership and control of food markets and milk distribution. It also wanted a Greater Brisbane to own and operate ferries, the fire brigade and the wharves, to build bridges and control traffic, much of it still horse-drawn.
The inner urban areas, including the municipalities of Brisbane and South Brisbane were relatively dense, with approximately 3,000 people per square kilometre, while nearby towns, including Ashgrove, in the inner west, and Sandgate, on Moreton Bay, the latter both a residential area and a seaside escape, had 1700 people per square kilometre. But beyond these built up areas the population was sparse, with most of the rest of the new Greater Brisbane having between 40 and 200 people per square kilometre. Most commercial interests opposed such a large council area, arguing that five miles from the GPO was more sensible than ten, because in that case the inner areas, with a much more substantial rate base (88 per cent of the rate income within the five mile radius), would subsidise the periphery. The Town Planning Association supported the idea of an all-encompassing metropolitan area, arguing that it would make for much better long term town planning. 2
The City of Brisbane, established in 1925 occupied 972 sq. km, a large enough area in which to vest control of water, sewerage, tramways, wharves, electricity and fire brigades. William Jolly, the former mayor of the by-now subsumed municipality of Windsor, was elected Lord Mayor, coming to office at a time of relative prosperity. The Council set in train cross-river bridge building: the Grey Street/William Jolly Bridge west of Victoria Bridge opened in 1932 and the Story Bridge at Kangaroo Point, built between 1935 and 1940, providing much needed jobs as the state tried to shake off the Great Depression. Neither bridge had provision for trams, which continued to rely on the Victoria Bridge to connect South Brisbane with the City. Even more remarkably, neither had provision for rail, so railway passengers from the Cleveland and Beenleigh lines, including the closer in southern suburbs, had to get off the train at South Brisbane (also the terminus for the train from Sydney) and hop on a tram to get to the City or
Fortitude Valley. All the major state government offices, elegant stone buildings from the latter quarter of the 19th century, were in the city centre, with the colonial, now state government parliament just up the road, overlooking the Botanic Gardens. Brunswick and Wickham Streets in ‘the Valley’ were home to three department stores: McWhirters on the corner was the prime example. The rail and tram networks meant that most suburban workers were within easy reach of major centres of employment, in and near the city centre, as were the hospitals. Racetracks and the showgrounds were served by rail, but golf courses were located and built to service their middle-class, car-owning members.
When the new City Hall opened in 1930, a commanding structure built of Helidon sandstone, its clock tower could be seen from miles around. It remained the dominant symbol of Brisbane, and often of Queensland as well, from 1930 to the early l960s, when 20 storey office buildings began to hide it from view. As the seat of metropolitan government, it was the only City Hall in Australia, all the other capitals have Town Halls, overseeing small central-city municipalities, as most still do. 3
The American invasion The Pacific War transformed Brisbane into a garrison city during 1942-43. The combined effect of petrol rationing and American and Australian services personnel saw tram patronage surge to 34.75 million passenger journeys in 1941-42; the previous highest figure had been 24.09 million in 1928. Eagle Farm, Victoria Park, Nudgee and Woolloongabba were vast encampments, while South Brisbane provided them with entertainment. Black American soldiers were restricted to the South Brisbane area, and not allowed into the city. General Macarthur set up headquarters in the city centre. Archerfield aerodrome housed American B26 bombers. Evans Deakin shipyards were kept busy at Kangaroo Point and a large graving dock was built downstream, north of Morningside.4
The coming of peace ushered in a minor eclipse of the Queenslander house design as shortages dictated a more austere form of building. Fibro replaced wood as the cheapest building material. A few new suburbs emerged: Wavell Heights (named after General Wavell), Belmont and Mt Gravatt. The last two places had tram extensions (1948-51), appropriate while car ownership remained low. The post-war housing shortage was addressed by the
CRC for Water Sensitive Cities | 13
State Housing Commission (Stafford, Seven Hills) and the War Services Homes Commission (Wavell Heights, Indooroopilly), both enjoying substantial federal funds, as Housing Commissions did in other states. Except for Indooroopilly, the new estates were some way from train stations and tram lines, and car-dependent suburbs would soon emerge. The Commission’s Inala town development incorporated up-to-date design, but lacked access to good public transport.
A car-based metropolis A lack of building activity in central Brisbane in the 1950s did not detract from its role as a retailing destination. Central city shopping boomed as cars remained expensive and most adult women did not have drivers’ licences. Strong radial public transport services continued to dominate the journey to work, school and shop. By the 1960s the growth of metropolitan population and motor traffic was putting central Brisbane’s streets under strain. Three river bridges disgorged traffic from the south side of the river into the central business district. Up river, the Centenary Bridge (1960) at Jindalee helped traffic in the rapidly growing western suburbs. Closer in, relief came in 1969 with the widening of the Story Bridge approaches, and the opening of the fourth Victoria Bridge, often known as the Melbourne Street Bridge, replacing the 1897 bridge, itself a rebuild after the 1893 flood.
The tramway system closed in 1969, the final straw a fire at the remaining large depot, at Paddington. The trams had provided Brisbane with intimate shopping streets, not unlike in Melbourne, but of a more modest scale. Brisbane’s tramway closure was the last in Australia, and one of the last in the English-speaking world, leaving Melbourne as Australia’s only remaining tramway system, and one of the largest in the world. The American firm of Wilbur Smith was hired by the state government to recommend a transport plan for Brisbane. The centrepiece of the plan, an expressway alongside the banks of the Brisbane River, proclaimed as a triumph of modernity by the Bjelke Petersen government, disfigured the city, and has remained an eyesore ever since. An integral part of this expressway system, the Captain Cook Bridge, which linked Kangaroo Point/Southbank to the city, had no provision for cyclists or pedestrians. The car and the freeway were the keys to the future, confirmed by the opening of the Gateway Bridge and motorway in 1985, enabling motorists to drive between the Sunshine and Gold Coasts, avoiding
the city centre. Again the new bridge had no provision for cyclists or pedestrians. 5
Railway electrification had been delayed until the 1970s, when some suburban trains were still pulled by steam engines. Brisbane at the time had a kind of archaic charm, like an overgrown country town. In 1978 the railways were turned into a truly suburban network when the South Brisbane and Roma Street stations were linked by the Merivale Bridge over the Brisbane River, partly built because of the need to modernise Brisbane for the Commonwealth Games in 1982. No longer did railway travellers from the south have to hop off at South Brisbane and catch a tram to the city.
Suburban subdivision and the sewering of Brisbane Between 1947 and 1961, the metropolitan population increased from 413,300 to 621,550, the latter figure including Redcliffe and part of Pine Rivers shire. Suburban expansion was the focus of activity, exemplified by Allan and Stark building Australia’s first stand-alone drive-in shopping centre at Chermside in 1957, with over 700 car spaces. Following American precedent, Melbourne retailer Ken Myer could see the potential for such a development in Australia. Such grand, car-based complexes took much longer to get approval for in Sydney and Melbourne, because warring municipalities in those cities argued over the impact on their traditional shopping strips. But with a metropolitan-wide council, competing municipalities had been eliminated three decades earlier.6 The other striking examples of suburbanisation were the removal of the wholesale food market from Roma Street to Rocklea in 1962, on a cheap, flood prone site, and the closure of an inner city brewery. The Fourex brewery at Milton remained determinedly inner city, as it still does. Extraordinarily, a Paul’s/Parmalat milk factory, at Kuripla Point, next door to the new Gallery of Modern Art, continues to function, a working reminder of an earlier Brisbane, when industry clung to the river banks.
14 | Water, history and the Australian city
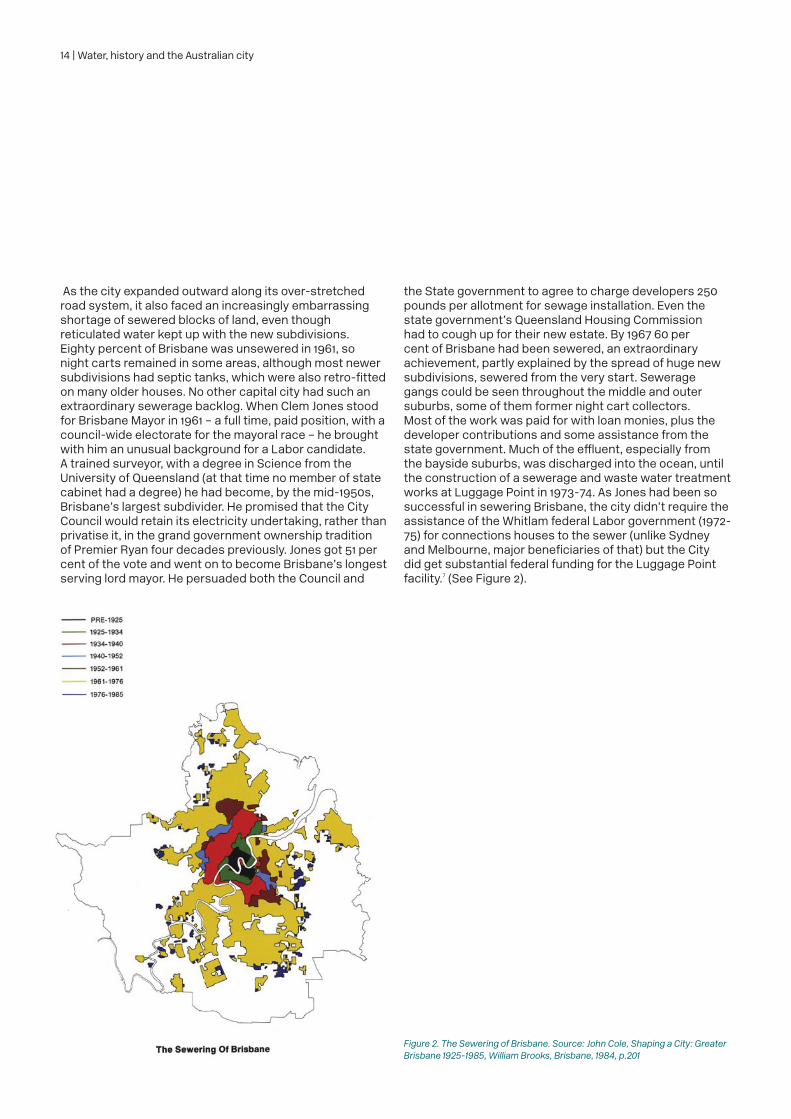
As the city expanded outward along its over-stretched road system, it also faced an increasingly embarrassing shortage of sewered blocks of land, even though reticulated water kept up with the new subdivisions. Eighty percent of Brisbane was unsewered in 1961, so night carts remained in some areas, although most newer subdivisions had septic tanks, which were also retro-fitted on many older houses. No other capital city had such an extraordinary sewerage backlog. When Clem Jones stood for Brisbane Mayor in 1961 – a full time, paid position, with a council-wide electorate for the mayoral race – he brought with him an unusual background for a Labor candidate. A trained surveyor, with a degree in Science from the University of Queensland (at that time no member of state cabinet had a degree) he had become, by the mid-1950s, Brisbane’s largest subdivider. He promised that the City Council would retain its electricity undertaking, rather than privatise it, in the grand government ownership tradition of Premier Ryan four decades previously. Jones got 51 per cent of the vote and went on to become Brisbane’s longest serving lord mayor. He persuaded both the Council and
Figure 2. The Sewering of Brisbane. Source: John Cole, Shaping a City: Greater Brisbane 1925-1985, William Brooks, Brisbane, 1984, p.201
the State government to agree to charge developers 250 pounds per allotment for sewage installation. Even the state government’s Queensland Housing Commission had to cough up for their new estate. By 1967 60 per cent of Brisbane had been sewered, an extraordinary achievement, partly explained by the spread of huge new subdivisions, sewered from the very start. Sewerage gangs could be seen throughout the middle and outer suburbs, some of them former night cart collectors. Most of the work was paid for with loan monies, plus the developer contributions and some assistance from the state government. Much of the effluent, especially from the bayside suburbs, was discharged into the ocean, until the construction of a sewerage and waste water treatment works at Luggage Point in 1973-74. As Jones had been so successful in sewering Brisbane, the city didn’t require the assistance of the Whitlam federal Labor government (1972-75) for connections houses to the sewer (unlike Sydney and Melbourne, major beneficiaries of that) but the City did get substantial federal funding for the Luggage Point facility.7 (See Figure 2).

CRC for Water Sensitive Cities | 15
Belated modernisation
High-rise buildings and other signs of modernity came to Brisbane in the 1960s. After recovery from the 1961 credit squeeze, commercial pressure and interstate example succeeded in raising the building height limit, which had been 132 feet. The 22-storey Torbreck apartment building at Highgate Hill became the most spectacular example (1962). It towered over the Queenslanders below, and local residents all agreed that it represented the slums of the future. It proved an unusual structure in Brisbane at the time, because the Gold Coast had already become the centre of tourist and retirement led apartment building. A Strata Titles Act, introduced in 1965, made it easier to raise an owner-occupier or investor mortgage for apartments. ‘Six packs’, two floors of apartments with ground level parking underneath, spread throughout the inner suburbs before town planning regulations protected the old ‘Queenslanders’, which have again come under attack again in the last few years from high rise apartment developers in West End and Woolloongabba.8
Old wharves, redundant rail yards and airfields were abandoned or put to new uses. Fisherman’s Islands at the mouth of the Brisbane River became the site of major grain and bulk goods shipping, linked by railway to the city in 1980. Abandoned wharves in South Brisbane were later converted to gardens and river promenades. The airport, at Eagle Farm, relocated seawards reclaiming low-lying land abutting Moreton Bay. But with only one runway it had reached peak capacity by 2014. At least a privately-financed airport train, unveiled in 2001, gets travellers to the airport promptly, as in Sydney, without having to fear delays from a freeway accident, a curse on the Tullamarine freeway in Melbourne.
The World Expo in 1988 marked a significant turning point in Brisbane’s modernisation. But there were earlier post-war milestones as well, including completion of metropolitan sewering, the new Botanic Gardens at Mount Coot-tha, the Commonwealth Games (1982), Griffith University at Nathan/Mount Gravatt (1975), and the King George V Square in front of the City Hall. The Bjelke-Petersen government’s overnight demolition of the elegant, colonial Bellevue Hotel in 1979 and the Cloudland dance hall in 1982 alerted many Brisbane residents to the loss of the city’s heritage. The state government belatedly created a Heritage Council but it has never exercised much power in a city and a state where the rights of private property owners are invariably considered sacrosanct.9
When the Roma Street wholesale markets were closed in 1964 and moved to Rocklea, the land was not put up for sale but reserved for public gardens. The Roma Street Transit Centre opened in 1991 to cater for intra- and interstate bus lines, with connections to both suburban
and intrastate rail. The Roma Street Parklands finally opened in 2001. When compared with Adelaide and Melbourne, Brisbane lacks parks and reserves near its centre. It also lacks tree-lined boulevards, owing perhaps to Governor Gipps’ original narrow thoroughfares. The one grand boulevard, the river, was shackled to industry until the 1970s, but the recovery of the shorelines and their conversion to parks and pathways gave it ‘kerbing’ and ‘nature strips’. The commencement of City Cat ferries (1996) offered residents of riverside suburbs a new and relaxing form of commuting. A water-based recreational space of a different kind was proclaimed in 1993 with the Moreton Bay marine park. Moreton Island, while supervised by the National Parks Service, remains under Brisbane City Council administration.
The distinctive features of twenty-first century Brisbane are its increasing resemblance to other capital city office precincts, with forecourts, decorative plants and outdoor cafes. Queen Street’s signature silver bullet trams last ran in 1969, but the street’s unusual width has provided for a shopping mall with generous outdoor seating and dining areas. With its sub-tropical persona, the mild winter climate means that it is embraced year round. Beyond the central retail area elegant sandstone government and commercial buildings have survived, with a number farewelling their clerks and accountants, substituting hotel patrons, tourists and casino visitors. The historic Customs House (1888), a relic of customs being imposed in each colony, was purchased by The University of Queensland from the federal government, and includes meeting, dining and gallery space. In 2008 the Brisbane City Council agreed to underpin City Hall which was in danger of gradual sinking on inadequate foundations. An expensive heritage revamp has returned it to its former glory.
The Clem 7 tunnel, named after Lord Mayor, Clem Jones, takes vehicles from Woolloongabba (entrances from Ipswich Road and the Pacific Motorway) and Kangaroo Point (entrance from Shafston Avenue) to Bowen Hills, connecting to Lutwyche Road and the inner city bypass. Built between September 2006 and March 2010, the tunnel, paid for by a private consortium, cost over four billion dollars, with the Brisbane City Council donating land for approaches and exits. The tunnel, directly under the Story Bridge, could have been configured to include another rail crossing for the Brisbane River, but regrettably, did not. As the Story Bridge remains untolled, the tunnel only gets one third of its predicted patronage. The company went broke and the tunnel has been taken over by the Melbourne-based Transurban consortium. Brisbane City Council, once the proud owner of key transport assets, has, along with the state government, placed them in private hands.10
16 | Water, history and the Australian city
The decline of manufacturing and the rise of service industries
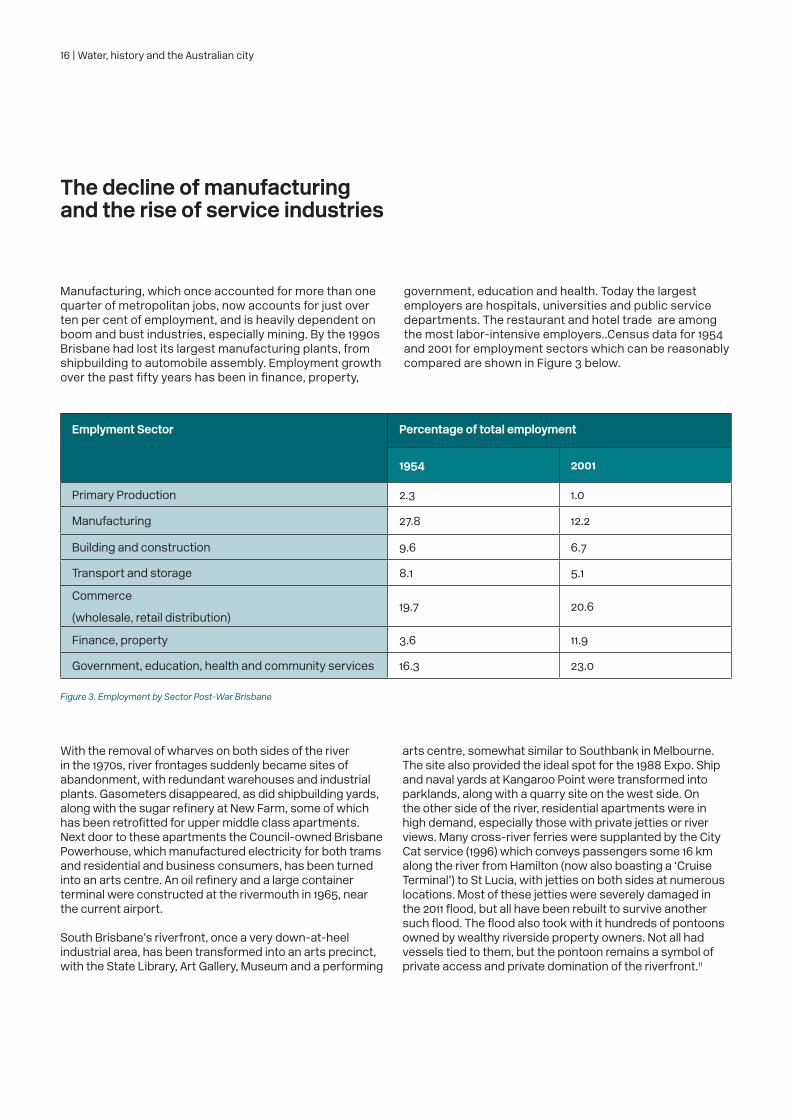
Manufacturing, which once accounted for more than one quarter of metropolitan jobs, now accounts for just over ten per cent of employment, and is heavily dependent on boom and bust industries, especially mining. By the 1990s Brisbane had lost its largest manufacturing plants, from shipbuilding to automobile assembly. Employment growth over the past fifty years has been in finance, property,
government, education and health. Today the largest employers are hospitals, universities and public service departments. The restaurant and hotel trade are among the most labor-intensive employers..Census data for 1954 and 2001 for employment sectors which can be reasonably compared are shown in Figure 3 below.
Emplyment Sector Percentage of total employment
1954 2001
Primary Production 2.3 1.0
Manufacturing 27.8 12.2
Building and construction 9.6 6.7
Transport and storage 8.1 5.1
Commerce
(wholesale, retail distribution)19.7 20.6
Finance, property 3.6 11.9
Government, education, health and community services 16.3 23.0
Figure 3. Employment by Sector Post-War Brisbane
With the removal of wharves on both sides of the river in the 1970s, river frontages suddenly became sites of abandonment, with redundant warehouses and industrial plants. Gasometers disappeared, as did shipbuilding yards, along with the sugar refinery at New Farm, some of which has been retrofitted for upper middle class apartments. Next door to these apartments the Council-owned Brisbane Powerhouse, which manufactured electricity for both trams and residential and business consumers, has been turned into an arts centre. An oil refinery and a large container terminal were constructed at the rivermouth in 1965, near the current airport.
South Brisbane’s riverfront, once a very down-at-heel industrial area, has been transformed into an arts precinct, with the State Library, Art Gallery, Museum and a performing
arts centre, somewhat similar to Southbank in Melbourne. The site also provided the ideal spot for the 1988 Expo. Ship and naval yards at Kangaroo Point were transformed into parklands, along with a quarry site on the west side. On the other side of the river, residential apartments were in high demand, especially those with private jetties or river views. Many cross-river ferries were supplanted by the City Cat service (1996) which conveys passengers some 16 km along the river from Hamilton (now also boasting a ‘Cruise Terminal’) to St Lucia, with jetties on both sides at numerous locations. Most of these jetties were severely damaged in the 2011 flood, but all have been rebuilt to survive another such flood. The flood also took with it hundreds of pontoons owned by wealthy riverside property owners. Not all had vessels tied to them, but the pontoon remains a symbol of private access and private domination of the riverfront.11

CRC for Water Sensitive Cities | 17
The making of the 200 kilometre city
When in 1925 Greater Brisbane was created out of two cities, a few towns, and the 12 mostly rural shires that constituted three quarters of its area, the population numbered 210,000. In 1947 Greater Brisbane had the same perimeter but its core had bulged to over 410,000. Greater Brisbane in 2001 was shaped like a plant, with railway lines spreading out to Ipswich, Boronia Heights, Beenleigh and Wynnum/Cleveland. To the north stems went to Albany Creek, Petrie/Caboolture, Redcliffe and Sandgate. Railway patronage fell sharply in the 1960s and 1970s, so by the late 1980s the road system accounted for 95 per cent of all travel.
In 1961 the railway from Nerang to Coolangatta and Tweed Heads was closed: road traffic was taking over and the farm freight was decreasing. The state government Treasurer at the time suggested that if Gold Coast commuters needed to get to Brisbane to work they could catch a helicopter. Cars, especially the Australian-built Holden and Falcon, captured the imagination of male drivers and more and more women obtained car licences. Two-car households became common. Thirty years after it lost its coastal railway, electors in the Gold Coast’s rapidly-growing suburbs were promised a completely new railway line from Beenleigh, via Helensvale to Robina. The line, running much farther inland than the original Gold Coast line, opened in 1997, running back through Brisbane Central, and on to the privately-financed line to Brisbane Airport. By then Greater Brisbane stretched south along the Pacific Motorway, and north along the Glass House Mountains Road and Bruce Highway to Maroochydore and Noosa. Greater Brisbane had been subsumed into a 200 kilometre linear coastal city.
As it grew, metropolitan Brisbane changed its orientation. Until the mid-twentieth century it was predominantly on an east-west axis, a product of the days when Ipswich serviced the Darling Downs and provided much of south Queensland’s coal, and Redland, Redcliffe and Sandgate
were the coastal watering places and a metropolitan ‘salad bowl’. The coastal north was unproductive wallum country and the south coast a destination for holiday flats, with both Ansett and TAA offering attractive packages to southerners, along with campers, who mostly drove. A desire for beach-front living, accessed by the private car and, on the north coast, a road financed by the private sector, began the post-war north-south axis. Sandmining removed sand dunes and got rid of the black rutile residue, turning the beaches white, claimed to be more appealing to holiday makers. Just back from the beach, sand mines, once exhausted, added to the stock of subdividable land, especially from Broadbeach to Tugun.12
The Bjelke Petersen government, dominated by rural and mining interests, legislated to allow canal development on both the Sunshine and Gold Coasts, mimicking the coastal estates of Florida. Mangroves and sand dunes gave way to pumped-out subdivisions. Unsewered blocks were sold cheaply on both coasts, usually without kerbing or guttering. Fibro holiday houses were popular, before population growth and investor interest saw fibro give way to brick, and later, especially on sites overlooking the beach, to huge apartment blocks. Retirees flooded in from the southern states, Brisbane and rural Queensland. As the population grew, so did service industries, and both coasts developed more complex economies, all built around car and truck transport. Both coasts also invested in their airports, once owned by the Commonwealth government, but now leased to private consortia.
The extent of the 200 kilometre city is shown in Figure 2, indicating contiguous urbanisation above 50 people per square kilometre. The only major green breaks in the entire 200 kilometres left are on the Sunshine Coast, where pine plantations are still to be found on either side of the freeway. But developers have already been given permission to turn some of these into new housing estates.13 The “200 km city” had census counts of:
2001 2006 2011
Greater Brisbane 1,627,535 1,763,131 1,977,315
Gold Coast 396,588 482,325 507,642
Sunshine Coast (Caloundra to Noosa) 192,397 276,265 306,909
Total 2,216,520 2,521,721 2,791,866
Figure 4. Twenty-First Century Brisbane Population

18 | Water, history and the Australian city
Figure 5. South East Queensland Population Densities, 2006. Source: Department of Infrastructure and Planning, Queensland, 2006

CRC for Water Sensitive Cities | 19
From flood to drought
After the devastating floods of 1893, the river continued to experience occasional flooding. The Somerset Dam on the tributary Stanley River provided some flood mitigation after 1956, but it was not enough to stem the effects of cyclone Wanda dumping torrential rainfall on the catchment area in January 1974. Oxley Creek, flowing through a flat catchment area, experienced higher levels of flooding than in 1893. The flood-affected areas around Breakfast Creek, Norman Creek, Milton, South Brisbane, Yeronga and Cabela Creek were much the same in both years. The Botanic Gardens were also inundated on both occasions. The 1974 event hastened the construction of the Wivenhoe Dam (1985) on the Brisbane River. At 1.15 million mega litres, three times the capacity of the Somerset, it is positioned to impound floodwaters from all the Brisbane River’s tributaries upstream of Esk, as well as overflow from the Somerset. About fifty per cent of the Brisbane River catchment is above the Wivenhoe Dam, with the Bremer and Lockyer Creeks the main catchments below it. Wivenhoe is a relatively shallow dam, so its lack of depth leads to high evaporation, not normally a problem, except in the case of a prolonged drought.
The 1893 and 1974 flood contours were well mapped and new subdivisions were forced to reserve flood-prone land as open space. But recommendations after the 1974 flood to buy back properties that had been flooded were largely ignored by both the Brisbane City Council and the State Government, even though that could have been done very cheaply at the time.
Floods in Brisbane were a visible reminder that water was almost always plentiful, in a city that averages 1500mm of rain per annum. The proportion of properties with water meters fell from 80 per cent in the late l930s to six per cent in the l980s. While per capita consumption figures were still calculated by the BCC for the whole metropolitan area, most households and many businesses had no idea how much water they used. Installing meters to the hundreds of thousands of unmetered properties became such a political hot potato that both sides in the Brisbane City Council promised not to install any more. In late l984 thousands of brand new water meters were buried at Boondall, a tip and wetlands area north-west of the airport. They await liberation by future archaeologists. Neither the dominant ALP group in Brisbane City Council nor its opponents wanted to be seen measuring, let alone charging individual ratepayers for the amount of water they used. Water – as much of it as any household or business wanted or needed – was seen as an inalienable right.14
The policy of not installing water meters, even for new subdivisions, continued until the late l980s. This changed in 1989 when the Council realised the revenue potential of charging by the amount of water consumed, and in the six
years between l990 and l995 218,000 new water meters, in black plastic containers flush with the nature strip, were installed throughout the most recent subdivisions in Brisbane.15 Suddenly households could be informed, as detailed on their quarterly rates bill of how much water they were actually using. But this didn’t stop the sprinklers because water was plentiful and extraordinarily cheap, less than $1 for 1000 litres. The catchment areas and the dams, which filled from time to time with deluge rains, seemed able to keep up with demand.
Only 17 per cent of South-east Queensland (SEQ) is held in state forests and national parks, compared to 43 per cent of Greater Sydney. One obvious result is that the catchment areas for dams in SEQ are nowhere near the quality of those of Sydney. Because so much of the environment of SEQ was carved up into small rural landholdings by the early l950s, when it came to locating new dams they ended up to the north-west of the city in a relatively dry catchment area, a site selected as much to prevent flooding as to collect and store water.
By 2005 SEQ was experiencing its worst drought in 100 years. Even Gold Coast property developers got worried at the thought that the water might run out. Imagine the indignity of having to buy in water – via truck – from northern New South Wales to fill up your swimming pool and international tourists could not understand why, in this self-proclaimed sub-tropical paradise, all the beach showers were turned off. It hardly went with the Gold Coast’s image of sunshine, instant palm plantings and unlimited largesse, from meter maids and schoolies week to champagne at motorsports.16
The Beattie Labor government became alarmed by the water crisis, as did state governments in all the mainland states. Every member of the public knew about the water crisis, for the remarkably obvious reason that there was not much rain, especially no ‘deluge rains’, which every few summers used to fill up the Wivenhoe and Somerset dams. Suburban streets the length and breadth of Australia’s ‘fastest growing urban region’, courtesy of interstate migration, as the Beattie government would want to boast, rang out with neighbourly exhortations for rain. Nature strips, once watered, were now brown and so were the lawns. Hardy shrubs gave up.
Successive bureaucrats and ministers ignored the warning signs, sounded as early as l997 by experts in the Department of Natural Resources and Mines, which in various guises had the biggest group of hydrologists and others responsible for assessing water resources and calibrating those resources with consumption patterns. The failure to follow this advice reflects badly on senior government bureaucrats and a succession of government ministers.

20 | Water, history and the Australian city
The tone of Water for Queensland was grim. ‘If Queenslanders are to maintain the lifestyle they currently take for granted, it is essential that demand for water is reduced and supplies are increased, so that economic growth and wealth creation can continue’. The document boldly acknowledged the defeat of the Toowoomba referendum on recycled water, which media-savvy opponents had labelled as ‘Poowoomba’, but stated that ‘recycling within residential and non-residential developments will need to be introduced’. It gave the Beattie government the ‘water grid’ terminology, the catch phrase to solve everything, and announced the following infrastructure for ‘the short term to 2016’, viz. a Gold Coast desalination facility (45,000 ML/a), subsuming an already proposed plan by the Gold Coast Council, a Western corridor recycling scheme (30,000 ML/aa) and Traveston dam stage I (70,000 ML/a).
A raft of smaller projects were also announced. The Government paid lip service to some of the environmental impacts, especially of the desalination plant, where the contemplation of alternatives got short shrift, while the Traveston dam proposal attracted a voluminous report with dozens of mitigation measures. The report pointed out that only 6-7 per cent of treated effluent in SEQ was currently recycled, mainly for golf courses and sporting ovals. It also pointed out that the Western Corridor recycling scheme would make water available to the Taronga, Tarong North and Swanbank Power stations. It had much less to say about how much it would cost to move all this water around SEQ, including the fact that the pipes need continuous water flow to remain operational.
The ‘water grid’, and an extensive advertising campaign for water-wise initiatives and tank subsidies saw Premier Beattie win a fourth term with little loss of seats. The National Party had failed dismally to command attention on the water issue, shooting itself in the foot when one of its senior politicians, Lawrence Springborg, suggested that evidence that male Danish fish developed female characteristics when swimming in recycled water could have implications for ‘feminisation’ in Queensland. Alongside its campaign for subsidised water tanks and water efficient household items, the state government also mandated water plans for businesses and schools. Huge tanks suddenly appeared at major industrial installations, from the airport to warehouses and food manufacturing operations. Householders demonstrated a remarkable degree of compliance with severe water restrictions, with very few prosecutions needed. In 2008 the urban residents of SEQ got their per capita consumption down to 112 litres per day, somewhat better than Melbourne at
The Department of Natural Resources and Mines released a draft strategy for water supply in SEQ in August 2004 and a much more alarmist, but well-argued, Interim Report in November 2005, which included the- at that time- amazing proposition that consumption might have to be limited to 300 litres per person per day. As the Executive Summary put it, ‘If significant inflows to the Wivenhoe, Somerset and North Pine are not received by around February 2006, SEQ will be in the grip of the worst drought in recorded history’. The report pointed out that these dams were last full in February 2001 and had only minimum inflow in 2004. By November 2005 the dams were below 35 per cent capacity.
In the following months dam levels continued to fall precipitously. Generous state government and local council tank subsidies were introduced, with householders installing more than 5000 litre tank capacity able to recoup up to $2200. Tens of thousands of households took up the offer. All new government, commercial and residential structures were encouraged to collect rainwater on site. Level 2 water restrictions, which had been introduced in October 2005, were made more stringent, with Level 3 introduced in June 2006 (hoses banned) and level 4 in November 2006 (bucket watering for just a few hours a week). Greywater recycling for gardening purposes became legal under BCC regulations in late 2006. Brisbane, a dusty city in dry winters, became dustier still as the brave new world of freeway tunnelling projects, proclaimed by Lord Mayor Campbell Newman, with the implicit backing of the Labor State Government, created huge piles of shale and dirt. Cynics wondered out loud who would tunnel for cars at a time when the very supply of potable water for the metropolis hung in the balance.17
The water grid and desalination to the rescue In August 2006 the now rebranded Department of Natural Resources and Water, issued its Water for Queensland, a long term solution report that proclaimed the concept of the ‘water grid’ as the way forward. The analogy with the electricity grid amused some commentators, even though electricity is rather easier to manufacture than potable water and comes with a vast distribution network already in place. The ‘grid’ came with the added irony that the region’s power stations were still using potable water when they should have been using recycled water for cooling purposes.

CRC for Water Sensitive Cities | 21
145 litres, vastly better than the profligate Sydney (230 litres) or Perth, which never got below 289 litres, didn’t require businesses to have a water plan, and only banned sprinklers in winter. The residents of Perth have never heeded the late George Seddon’s advice, delivered in 1970, that they should ‘fear the hose’.18
Following the success of the reverse osmosis technology in the Kwinana desalination plant, opened to supply drought-prone Perth in 2006, the Gold Coast City council embarked on a desalination plant at Tugun, fearing that if the drought did not break Brisbane would get preference for potable water over the ‘Coast’. Premier Beattie, like equally worried Premiers in New South Wales and Victoria, decided on a much larger plant, taking over the Gold Coast initiative and doubling its capacity to 125 mega litres a day. Opened in February 2009, at a cost of $1.2 billion, the plant, abutting the Coolangatta Airport, encountered rusting problems and temporarily closed in December 2010, not just because of rust, but because heavy rains in late 2008 and the early months of 2009 saw the region’s dams at 73 per cent of capacity. The state government has recently taken the Hinze Dam off the Gold Coast City Council and given it to a statutory authority, SEQ Water. Nobody needed expensive desalinated water, requiring vast amounts of coal-powered electricity for every stage of the production process. Meanwhile the Hinze Dam, named after the pioneering grandparents of a local government Minister, had its dam wall raised for the third time in 2011. With a modest storage capacity of 310 mega litres, the dam, with a 207 square kilometre catchment, also provides flood migration for the Nerang River. As rainfall in the parts of the catchment is often over two metres per annum this dam will only run dry in an exceptional drought.19
The shock of the 2011 flood Within 10 months of the Toowoomba pipeline opening the Bureau of Meteorology predicted rainy La Niña conditions. Saturating rains fell during December 2010, falling on the Dividing Range escarpment near Toowoomba, barely 20 km from the Brisbane River system’s headwaters. Over 280 mm of rain fell near Esk in a couple of days before 10 January 2011. It had been estimated that 300mm in a few days could fill Somerset and Wivenhoe: in fact they had been well filled since March 2010. As population growth and Toowoomba’s dependence on the Wivenhoe weighed against heavy precautionary outflows, only limited measures were possible to mitigate downstream flooding.
Massive inflows from the Bremer River, Lockyer Creek and small water ways such as the Oxley Creek compounded the problems faced by engineers who had to decide how to stagger water releases from the Wivenhoe dam, necessary to protect the dam wall from undue pressure if not possible collapse.
The spring rains in 2010 broke records, saturating the landscape and filling dams after Queensland’s prolonged drought in 2001-08. The Brisbane River catchment received heavy rainfall in January 2011, flash-flooding watercourses below Wivenhoe and overwhelming Wivenhoe’s mitigation capacity. In many places the 1974 flood was repeated in January 2011, spectacularly so around the Oxley flood plain (Rocklea, Tennyson) in Fairfield and Yeronga and the old watercourses through Auchenflower and Milton. Further downstream, South Bank, West End and New Farm experienced costly river-edge damage.
Flood levels for the 1893 and 1974 events had been well mapped. In the ‘centenary suburbs’ such as Sinnamon Park and Jindalee flood-prone parts were given over to golf courses and open space. In some cases, however, house subdivisions were a shade too close to the open spaces to keep dry in 2011. The allure of river views continued to see new apartment blocks located near the river banks. Basement car parks, including storage facilities and electrical control boxes flooded in dozens of apartments and public buildings, including the South Brisbane arts precinct. Many of these projects dated from the 1980s, when assurances about Wivenhoe flood mitigation were abroad, and the assurances seemed to continue unquestioned into the twenty-first century. Elite apartment buildings developed on the site of the old Power Station at Tennyson, which completely flooded in 1974, flooded again in 2011, and lost power for three months, with all inhabitants evacuated. Successive government reports about the aftermath of all these floods strongly recommended more resumption of flood prone land. Most recommendations were ignored, as in 1974, so a large Bunnings hardware store at Rocklea, flooded in 2011, was rebuilt, courtesy of insurance, on exactly the same site. The state government and the Brisbane City Council continue to be reluctant to resume flood prone land, even though it can be very cheaply done just after a flood, as its value plummets.20

22 | Water, history and the Australian city
Conclusion
Urban water quality has long been a problem in south-east Queensland, with the Oxley, Breakfast, Norman and Bulimba streams contributing varying degrees of murkiness to the Brisbane River. Until the 1990s most people, other than ecologists, regarded mangroves as dirty and unsightly, so they were regularly removed without protest. Public understanding of the pre-conditions for a healthy water supply remains modest. The Healthy Waterways partnership, a creation of the local government authorities in southeast Queensland, has been issuing a ‘report card’ on water quality in the Brisbane River, its tributaries and Moreton Bay since 2001. Urbanisation of the Brisbane River system has been extensive, and because of the lack of greenspace, in the form of state forests and national parks, and the extensive deforestation for agriculture, the catchment areas for Greater Brisbane’s water supply, with the notable exception of the Hinze Dam (which has the Lamington National Park as its backdrop) are far from pristine, and not nearly as healthy as the catchment areas for many of Sydney’s dams.
Floods, in particular, undermine river banks and mangroves and have a very deleterious impact on water quality, not just in the Brisbane River but in Moreton
Bay, which, with a reduction of industries polluting the waterways, is gradually getting healthier, behind the barrier of its great sand islands, Stradbroke and Moreton. But Moreton Bay and the Brisbane River still have stormwater outlets, so nearby gutters still feed untreated water into the major waterways.
Over the past ten years Brisbane has again become a city where water tanks are a common sight, to be found in over one quarter of suburban houses, including slim line tanks on smaller blocks, and at almost all major suburban business and government structures, especially those with large roof catchment areas, including railway and bus stations, schools and hospitals. The new found popularity of tanks, where people could now water their gardens without guilt, had the extra impact of making some of the populace more aware of water quality, because the quality of the water at the height of the drought was smelly and murky, so householders rightly wondered what was in it.
Water authorities have traditionally been resistant to water tanks, because possibly they raise management issues that are beyond bureaucratic control. Tanks gave many householders a modest sense of autonomy, much like the attraction of solar power. The implications of householders moving away from conventional grids are still to play out.

CRC for Water Sensitive Cities | 23
Introduction: the origins of sprawl
Contemporary folklore has it that Melbourne’s suburban sprawl is a product of the post Second World War period when the coming of the car gave ordinary citizens the freedom to live ‘the suburban dream’ of the house on the quarter acre block. In reality, Melbourne has always been a sprawling, low density suburban city. Located on a flat plain of easily-developable potential residential land, and shaped by a Victorian-era culture that placed great store on the sanctity of the detached private ‘home’, Melbourne was suburban rather than urban in character, from almost the outset of settlement/dispossession in the 1830s.1 Later the development of the most extensive railway system in Australia meant that by the end of the century, in the words of visiting American author Mark Twain, Melbourne already sprawled over ‘an immense area of ground’.2 In the twentieth century that size was augmented by the coming of the car, and the freeway, which combined to give Melbourne one of the largest and least dense urban footprints of any metropolitan area in the world – nearly 10,000 square kilometres. In this section of the report, then, we document the story of Melbourne and the possibilities and difficulties of watering what has always been a vast suburban city.
Water and colonial Melbourne
When rival syndicates headed by squatters from Tasmania chose to establish a camp on the banks of the Yarra River in 1835, where Melbourne would be sited, water was the prime consideration. A commercial base for the pastoral occupation of the Port Phillip District (now Victoria) required access to overseas trade routes, by salt water, and fresh water was essential for any permanent settlement. Melbourne lies at the mouth of a large river system, some ten kilometres up the Yarra River, at a point known as The Falls (near the foot of Queen Street), where a natural elevation separated salt water from fresh. After the Port Phillip District was officially recognised in 1836, Robert Hoddle was appointed senior surveyor and pegged out an oblong grid of streets to align with the course of river. The mouth of the Yarra Valley rainfall catchment formed a delta with the Saltwater (Maribyrnong) River delta before entering Hobson’s Bay. On the low floodplain land where South Melbourne, Port Melbourne and West Melbourne developed, the land was naturally swampy and drained into a series of lagoons. Initially choked with trunks and branches, the Yarra was gradually charted and cleared, and quays were built between Queen and Spencer streets. Punts, ferries and later bridges crossed the river. At the river mouth, Williamstown, with its deep harbour became the major port, while large ships also landed at Sandridge (Port Melbourne).
Part Two: Melbourne - watering the suburban city
Figure 6. Hoddle’s Grid. Source: Victorian Public Record Office VPRS 8168/P2 Historic Plan Collection, Unit 6167

24 | Water, history and the Australian city
Figure 7. The Yarra and its Tributaries. Source: Tony Dingle & Carolyn Rasmussen, Vital Connections, 1991
On the eve of the gold rush, Melbourne was a thriving, if raw town of 29,000, serving a wealthy pastoral hinterland. In 1852, Melbourne, the entry port to the Victorian goldfields, was the fastest growing city in the world.3 By 1861 the city’s population had reached 125,000. Melbourne was larger than San Francisco, the gateway to the Californian goldfields, which had a population of 56,000 by 1860. These were ‘instant cities’ that grew quickly in the face of shortages of suitable building land and deep water close to the centre, inadequate supplies of potable water, and serious shortages of adequate housing.4 Like San Francisco, Melbourne ‘functioned much as a modern airport terminal does: it thronged with new arrivals who were mainly concerned with getting to other places and the needed goods and services it supplied were scarce and expensive’.5
Initially, Melburnians bucketed water from the Yarra at low tide to avoid contamination from seawater, and sunk private wells and harvested rainwater.6 Private water carters drew supplies from a large tank with a charcoal filtering system at the foot of Elizabeth Street, built in 1849, or by pumping from the river. Water was loaded into barrels on carts for weekly delivery to barrels near the front gates of houses, but complaints were made about the rising costs of and deteriorating quality of the water.7 The river was used for bathing, and was the major outlet for open drains and street channels carrying the contents of cesspits.

CRC for Water Sensitive Cities | 25
The Melbourne Corporation (Town Council) was established in 1842, with responsibility for the provision of water supplies and sewerage. The Council considered the issue of water quality as early as 1843, when the feasibility of building a reservoir on the Yarra that would supply the town with reticulated water was investigated.8 An 1848 Council report into Melbourne’s sanitation concluded that ‘diseases which prevail at particular seasons in Melbourne, may be attributed to the crowding, the want of water, the absence of sewerage, the non-removal of decayed animal and vegetable refuse, and the poisonous liquid and gaseous matter generated within the City’.9 The Council lacked the taxing and borrowing powers to build water supply and drainage infrastructure and its requests for funds from the New South Wales government were ignored. After Separation from New South Wales in 1851, the Victorian Legislative Council assumed responsibility for Melbourne’s sanitation, through the creation of a Commission of Water Supply and Sewers. The City Council’s surveyor, James Blackburn, linked the poor quality of water from the Yarra to pollution from factories, drains and dead animals, and identified the Plenty River, a northern tributary of the Yarra, fed by creeks flowing south from the Plenty Ranges, as the most appropriate water supply source.10 In 1853, the colonial government took out a debenture loan of £600,000 to allow the Commissioners to construct an amended version of Blackburn’s scheme, with a reservoir at Yan Yean, 30 kilometres from Melbourne. When it was opened in 1857, Yan Yean was one of the largest artificial reservoirs in the world.
The new Commissioners did not address the issue of building sewers. Edwin Chadwick’s report on the public health implications of crowded housing and poor sanitation in British cities was completed in 1842, but the Metropolitan Board of Works, charged with improving London’s sewerage and water supply, was not created until 1855.11 John Snow linked the incidence of cholera with water drawn from the sewage-polluted Thames in 1854. However, adequate funds were not made available to the Board by parliament until after the ‘big stink’ of 1858, when hot weather and low water levels in the Thames caused sewage to stagnate. The first stages of engineer Joseph Bazalgette’s construction of a system of interceptor sewers, cross-cutting those emptying into the Thames, were not completed until 1865. Inadequate sewers, and resulting increases in infant mortality rates, were then characteristic of European and North American cities. In the 1850s, Melbourne’s sanitation did not lag behind that of contemporary cities.
Problems of growth
Dingle and Rasmussen observe that Melbourne’s growth altered the natural water cycle of the local area.12 Prior to white settlement, rainfall was absorbed into subsoil, used by plants, evaporated, or drained into the tributaries of the Yarra. House roofs and paved streets were impervious, increasing the runoff that drained to the Yarra. City streets interfered with natural drainage, and street channels (with bridges and crossing points for pedestrians) had to cope with greater volumes of increasingly dirty water. Waterlogged soil had to absorb more rainfall than before white settlement. Serious flooding of the Yarra occurred in 1839, 1863 and 1891.13 Throughout Melbourne, most blocks sloped to the rear, so household drains emptied into shallow central gutters in the rights-of-way at the back, which provided access for night cart men and the delivery of coal and wood. As population grew, cheap water from Yan Yean encouraged greater usage. While the technology to store rainfall from the Plenty Ranges and distribute it to Melbourne was state of the art, the technology to allow water to escape was not. There were underground drains in Melbourne, Collingwood, Fitzroy, Prahran, and Richmond, but these could not be properly flushed out and cleansed. The Merri and Moonee Ponds creeks were trunk sewage outlets for a large population, but were stagnant in dry weather.
As in industrial cities, flat land close to river banks in Melbourne was a magnet for industries that needed water for steam engines and processing, access to cheap supplies of coal and a ready means of disposing of wastes. The Yarra and Saltwater rivers were an example of ‘common resources’, the term used by economists to refer to things that people cannot be prevented from using, and for which usage by one person reduces the amount that is available to other people. This form of market failure – the ‘tragedy of the commons’ – occurs when property rights are not well defined, and firms that seek to maximise profits exhaust resources because they have no incentive to conserve them. The owners of Collingwood and Richmond slaughter yards, tanneries, soap and candle works, and wool washing and sheepskins firms used the Yarra as a sewer. Stormwater and seepage from cesspits ran along open drains from higher ground and through street gutters to the river. Open drains that led directly to the Yarra, such as the Reilly Street Drain that ran through Collingwood, carried stormwater, sewage and butchers’ waste, and caused flooding in low-lying areas.14 In the 1890s, a Scottish traveller claimed that the Yarra was ‘the filthiest piece of water I ever had the misfortune to be afloat on’.15

26 | Water, history and the Australian city
As we have seen from virtually the beginning of white settlement, the building of Australian cities was dominated by a preference for suburban, rather than town, living. The first Australian suburbs were near to town centres, pioneered as suburbs by generally wealthy people who walked or took private carriages to town jobs. The new colonial government responded to Melbourne’s housing shortages by exempting land outside the central grid from the Melbourne Building Act that mandated fireproof construction and minimum street widths. As a result, land to the east of the city was bought and subdivided into small lots by speculators. The new suburbs, Collingwood, Richmond and Fitzroy, resisted annexation and became municipalities in 1854, 1855 and 1858 respectively. South Melbourne (known initially as Emerald Hill) began as a gold rush shanty town and by 1891 was the most populous municipality outside the City of Melbourne. The central grid was extended northwards in 1852 to form the suburb of Carlton, which being elevated and well drained, developed as a fashionable place of residence. This belt of inner suburbs offered low-rent housing that was within walking distance of the city and local workplaces. Small-scale manufacturing firms, such as the boot and clothing trades, developed here. By the early twentieth century, larger scale manufacturing had developed in industries such as clothing, food processing, brewing, heavy engineering, saw milling and woodworking, flour milling, and the manufacture of matches. Worker housing tended to take the form of terraces or cottages of two or three main rooms, with a kitchen at the rear. The houses of even skilled workers had no inside tap and no hot water. Lean-to washhouses doubled as bathrooms, with a pan toilet near a back laneway.16
Outside this ring of inner suburbs, families bought or rented new, detached houses, even though there were cheaper but smaller dwellings available closer to the city centre. A revealed preference for comfortable housing space, and a flexible supply response from the building industry, is evident in the growth of the urban housing stock, in terms of both the number of rooms and housing units per capita.17 Galvanised iron roofing, prefabricated joinery, machine cutting and dressing of timber, and mechanised brick production reduced construction costs. In the 1880s, when the population of ‘Marvellous Melbourne’ grew from 268,000 to 473,000, new commuter suburbs developed to the south and east along railway and trams lines to Brighton, Camberwell, and Caulfield. Cottages in working-class suburbs to the north and west, such as Brunswick and Footscray reproduced, in cheaper materials and reduced dimensions, the villas found in middle-class suburbs.18
Advertisements for blocks of land in Footscray invited working-class families to ‘compare the health, pleasure and comfort of life in a cottage surrounded by its own garden, continuously freshened by the fresh breezes of the country and ocean, with life in a cooped-up cottage in the crowded suburbs immediately adjacent to Melbourne’.19 Single-family dwellings in such a setting offered adequate, even aspirational housing by the standards of the late nineteenth century, but the infrastructure that serviced them left much to be desired. In the late 1880s only three of Footscray’s 200 streets were sealed with road metal, and street drains were earth ditches usually set higher than housing lots. Backyard cesspits and privies were used; when full they could be covered with earth and the outhouse moved to another part of the property, where a new hole was dug. However, these relied on low population densities and could not be used safely once a neighbourhood was fully built up. Where pan toilets were used, the contents were emptied into a larger pan by a night cart man (so named because they worked at night to minimise the impact of the smell on residents), then taken to market gardens and sold as fertiliser. As suburbs expanded, night men had to travel further to find buyers, and so had an incentive to shorten their trip by dumping the contents surreptitiously on vacant land, a roadside, or in waterways.
Addressing environmental disamenity
In all, colonial Melbourne was a smelly and dangerously unhealthy place. Death rates from typhoid are ‘a sensitive indicator of filthy environments’ and provide a general measure of the quality of life in urban areas. Contemporaries regarded a typhoid death rate greater than 20 per 100,000 of the population as a sign of polluted water supplies. In the 1880s, typhoid death rates in the 47 largest US cities generally exceeded this benchmark, averaging 58. Despite having an abundant and relatively pure water supply,Melbourne’s death rate from typhoid averaged 66 from 1880-4, and peaked at 126 during the epidemic of 1889. These rates are comparable to those of the unhealthiest cities of Europe and North America, such as St Petersburg, Milan, Belfast, and Chicago.20

CRC for Water Sensitive Cities | 27
In part, Melbourne’s environmental disamenity reflected the fragmentation of municipal government. Australian colonial governments were much stronger than their municipal counterparts. They worked actively to restrict the power of their potential rivals by taking responsibility for aspects of urban infrastructure and establishing new municipalities to keep local government decentralised.21 Councils lacked the authority and resources to build sewers themselves, and could only take action by requiring noxious industries to be licenced and punishing polluters. Furthermore, Melbourne was such a decentralised city – in 1891 its built up area was seven times than that of Sydney, although its population was only 20 per cent greater – that the cost of investing in a sewerage system was high, as pipes and channels had to be spread over long distances.22 The low and flat topography of the city, and distance from any tidal outlet, also increased costs, as wastes would have to be pumped to a distant sewage farm for treatment.
Victoria’s Department of Water Supply was more actively involved in issues relating to Melbourne’s water supply and drainage than those of sewerage.23 In response to flooding, the Yarra was dredged and its meandering course realigned below the Botanic Gardens. Coode Canal (1886) shortened the river’s course near its mouth. Polluted lagoons at South Melbourne (now Albert Park Lake), Port Melbourne and West Melbourne were drained. When Yan Yean opened in 1857, Melbourne’s population was around 100,000. Although supplies were at times erratic and the quality was initially poor (there were complaints that the water tasted of vegetable matter), the system operated without any threat of serious water shortage until 1875. By that time Melbourne’s population had risen to around a quarter of a million. A new pipeline from Yan Yean to the Preston Reservoir was built to increase capacity. In 1878, an aqueduct near Yan Yean was washed away in a flood and plans were developed to ensure the reliability of water supplies. A new source tapped at the Watts River (later expanded into Maroondah Dam) expanded the Yarra catchment to include the Upper Yarra. Wallaby Creek, north of the Great Divide was diverted towards Melbourne, which saved the city from water shortage in 1881. By 1890, Melbourne’s nearly half a million inhabitants consumed an average of 50 gallons (227 litres) per day, with that figure nearly doubling on summer days when gardens needed watering. Few British cities had water supply systems that could supply half that amount.24
After two decades of debate, and a worsening public health crisis in the 1880s, the Victorian parliament created a Melbourne and Metropolitan Board of Works (MMBW) to operate the city’s water supply, stormwater drains and build a sewerage system.25 The MMBW took over the debts for Yan Yean from the Department of Water Supply, and work on the sewerage system began in 1897.
There is a debate amongst Australian economic historians as to whether the decision to create the MMBW was driven by concern of the social costs of poor sanitation (typhoid epidemics and pollution) that impacted on society as a whole, or the private costs (taxes, charges and rents) that came out of people’s pockets. While plans to build a comprehensive sewerage system in Melbourne were approved in 1890, following the typhoid epidemic of the previous year, Sinclair contends that this decision was delayed until the estimated cost was no greater than that of alternative methods of disposal.26 In contemporary overseas cities, the issue of private costs was central to the advancement, or delay, in providing modern sanitary infrastructure. As Briggs observes, ‘Throughout the Victorian age, the most effective argument for sanitary reform was that it would actually save money in the long run, not squander it’.27 As population density increases, labour-intensive methods of waste disposal become more costly. Growing city populations provide economies of scale to offset high cost of capital-intensive infrastructure. At some stage a growing city reaches a point at which cost of maintaining old, inefficient technology would equal that of replacing with new, more efficient methods. At that point, a city will pursue the rational course and build a sewerage system.
Merrett’s response to Sinclair’s argument suggests a more optimistic view of contemporary attitudes towards private and social costs. The anticipated cost of sewerage to the householder was in fact double that of old system of pan collection.28 Pan collection costs not as high as Sinclair suggests. Thousands of households, especially in the outer suburbs, used backyard cesspits that provided free sanitation, so change to a compulsory system of sewerage would necessarily represent an increase in private costs. All ratepayers were required to have drains connecting to main sewer built at their own expense, and required fittings – lavatories and cisterns – increased costs further. Merrett concludes that these extra up-front charges would have met the costs of pan collection for another decade. The apparent lack of concern for private costs of investment reflected Melbourne’s general wealth and willingness to pay for improvements to the quality of urban life. In British and American cities, the effectiveness of sewerage systems was often compromised by a resistance to higher charges, which resulted in systems being constructed and operated cheaply.29
By the end of the colonial period, the worst of Melbourne’s sanitation crisis and abuse of its waterways was over.30 Most noxious industries had relocated to from the Yarra to the more distant Maribyrnong. Each year, more and more houses were connected to the Maroondah water supply and the sewerage farm at Werribee.

28 | Water, history and the Australian city
Figure 8. Melbourne, 1901. Source: Sand’s and McDougall’s, State Library Victoria.

CRC for Water Sensitive Cities | 29
Twentieth Century Melbourne: from depression to Fordism to Neo-liberalism While boomtime ‘Marvellous Melbourne’ was physically vast, in reality much of the metropolitan area was undeveloped open space, with huge gaps of farming and other land between its suburban railway stations and villages. Development based around the railway saw the metropolitan area extend more than twenty kilometres outwards from the CBD in some directions in a series of radial lines that gave the city a ‘star’ shape with distinct retail and residential nodes around suburban stations along each point of the star.
Like all cities Melbourne is ‘path-dependent’ and so early decisions about the shape and culture of the city still influence how it operates today. So whereas, as we have seen, the story of nineteenth century Melbourne was about the genesis of the sprawling suburban city, that of the twentieth century is of the filling-in of the gaps between existing suburban nodes and the ‘middle-aged spread’ of an urban model that had been essentially formed in the earliest decades of the city’s existence. The coming of the car and the freeway after the Second World War did not, therefore, make Melbourne a sprawling city. Rather it extended and exacerbated a trend that had been developing for more than a century. And while recent decades have seen the extension of the suburban ‘footprint’ well beyond the limits of the train system, for much of the twentieth century suburban development simply filled in the missing gaps between sparsely-populated semi-rural villages that were developed adjacent to railway stations in the 1880s and earlier. In this section of the report, then, we uncover the story of twentieth century Melbourne and the emergence of the contemporary post-industrial city of the early twenty-first century.
The collapse of the boom: Federation and the lead up to the First World War
The collapse of the Marvellous Melbourne land boom in the early 1890s left an economic hangover that was to take more than a decade to subside. The extent of oversupply of suburban residential land serviced by the railways was so great that some of it was not built-on for another half
century. When the inevitable collapse of the land boom came, these stretches of undeveloped land and smaller parcels of yet-to-be built upon blocks between houses even in near-city neighbourhoods created a huge bank of low-value undeveloped land awaiting residential development. More immediately, the sprawl of essentially linked villages had to be serviced with roads, lighting, gas, water and sewerage. Servicing the residents of these distant nodes with the comforts of urban and suburban life was not considered much of a problem while demand for land, property and labour, and incomes remained high during the boom, but became serious issues when incomes and thus private and government revenues fell after the collapse. Whereas contemporary thinking had it that the free market would eventually provide these services, in reality throughout the boom the private sector was interested in short-term profit which came from selling land and property rather than providing long-term services. After the boom collapsed there were few private businesses left who were willing or able to take on that task.
Finding a solution to these problems thus fell to governments. As we have seen, the task of providing water and sewerage became the responsibility of the publicly-owned Melbourne and Metropolitan Board of Works (MMBW) founded in 1891. By the time of the outbreak of the First World War the Board had made great headway in dealing with the backlog of water supply and, according to its official historians Dingle and Rasmussen, ‘five to seven thousand houses each year’ were being connected to Melbourne’s water supply system.31 Many of these were houses that had been built in the boom years, albeit more those in the inner suburbs than in the more distant suburban villages pegged out and listed for sale at the height of the speculative frenzy. But others were new houses, built in the semi-and-detached ‘Federation’ style that became popular around the turn of the century. In these years there was little if any enlargement of the urban footprint and the fact that most of these new houses were built on vacant land in existing subdivisions made connection to the system easier. A growing population did, however, mean that new sources of supply were needed, but rather than expend scarce money on a new reservoir, for the time being existing sources were ‘coaxed’ into supplying more than their usual amounts of water. Connection to the sewerage system was less successful, especially in the (then) outer suburbs, which continued to rely on the pan system for disposal of what was euphemistically termed ‘night soil’.

30 | Water, history and the Australian city
La Trobe Valley saw the electrification of the suburban railway system (thus increasing speeds and allowing for closer spacing of stations) and the electrification and expansion of the tramway system.33 These technological changes allowed the empty gaps between suburbs still left over from the 1880s to be filled in with new houses, often in the then fashionable and American-influenced ‘Californian Bungalow’ style. Thus while in the 1920s Melbourne’s suburban footprint did not expand outwards it did become more dense in the inner and middle ring. Growth was especially notable in suburbs such as working-class Coburg, Footscray and Preston, all five to ten kilometres north and west of the city centre. Cheap and reliable electricity also underpinned industrialisation and the expansion of factory production in these areas, while further out and to the south and east in Malvern and Caulfield the emphasis was more on residential expansion and access to office employment in the CBD.
The interwar years
After the carnage of the war, the 1920s was a time of relative prosperity and economic growth. The population of metropolitan Melbourne increased from 767,000 in 1921 to just over a million by early 1929 before it dropped back again during the Great Depression.32 The number of dwellings increased from under 160,000 to nearly 230,000. While a time of prosperity for some, the idea that the Twenties were ‘roaring’ is pretty much a myth, with the decade characterised by sustained high levels of unemployment. At no time throughout the decade did Victoria’s unemployment rate drop below 6% and for most of the period it was closer to 10%. For those with jobs, rising incomes and government financial support for home ownership meant that the suburban dream again became an achievable aspiration.
Changes in technology, including the rapid expansion of electricity production powered by brown coal from the
Figure 9. Melbourne Urban Densities, 1929. Source: Metropolitan Town Planning Commission, Plan of General Development: Report of the Metropolitan Town Planning Commission, (Melbourne: MTPC, 1929).

CRC for Water Sensitive Cities | 31
As in Britain after the First World War, returning soldiers were promised ‘homes fit for heroes’, but in contrast to the British model of a sizeable publicly-funded and supplied residential sector, in Melbourne and Australia, the private sector was expected to take the lead in housing provision. While Australian governments, federal, state and local did not build many houses themselves, they did support home-ownership by providing access to secure mortgages to those who could help themselves. The Victorian Housing Act of 1920 empowered the State Savings Bank of Victoria to create a ‘credit foncier’ department which would lend money to mostly skilled male white and blue collar workers to buy approved new houses with repayment over periods of up to 30 years. ‘Approved’ houses were invariably detached double-fronted Californian bungalows of four or five rooms, which depending on suburb and income, would be built of timber or brick. A very small number were brick veneer.
Block sizes were also larger than had been the case in the nineteenth century, especially in working-class areas to the north and west of the city. As in that earlier period larger block sizes meant that residential and population densities were low and thus services expensive to provide. Gardens and outdoor spaces in front and out back also meant that these blocks were ‘thirsty’ in their water needs, but these spaces also allowed for the cultivation of fresh fruit and vegetables as well as eggs and similar foods for household consumption. The design and specifications of houses approved for such government-backed mortgages were carefully scrutinised, with the designation ‘State Bank house’ quickly becoming a by-word for solidity, craftsmanship and quality. This remains true to this day. Austere by modern standards, State Bank houses came complete with ‘all mod-cons’, including piped gas and later electricity, reticulated water supply, an internal or semi-external flushing toilet, and in most cases a gas or wood-fired hot water system that provided hot running water to the kitchen, bathroom and laundry.34
Figure 10. ‘Californian’ Bungalow, Preston, 1932. Source: Museum Victoria.

32 | Water, history and the Australian city
In order to provide water for this growing and spreading population the MMBW embarked on a series of dam-building schemes in the 1920s and early 1930s. Major projects included the Maroondah (22,000 megalitres (ML) 1927), the O’Shannassy (3,000 ML 1928) and the Silvan Reservoirs (40,000 ML 1932), all of which were located in the Upper Yarra catchment zone.35 Between them these three projects increased the metropolitan water supply by 65,000 megalitres, or more than double the existing capacity (the Yan Yean Reservoir’s capacity was 30,000 ML). Sewerage and the disposal of night soil remained a problem in the new outer areas, with the MMBW struggling to keep up with demand. ‘By 1926 more than 17,000 properties remained unsewered’ in Melbourne, which while obviously unacceptable to locals, was less than a quarter of the equivalent figure for Sydney’.36 As had long been the case, most of these unsewered houses were in the newer outer suburbs and those areas developed at the extremities of the 1880s suburban railway lines. The proportion of unsewered houses did not decline appreciably until well into the 1960s.
While the Depression of the early 1930s saw drastic reductions in the levels of residential development, there was some new construction but it was highly-localised and targeted at particular niche markets. Future prolific developer AV Jennings began building detached brick houses in the south-eastern suburbs of Caulfield and Murrumbeena in 1932, while a company associated with Eric Humphries (father of comedian Barry) developed the old Camberwell golf course into the Golf Links Estate later in the decade.37 Closer to the city centre other developers turned their hand to the building of two- and three-storey blocks of flats, thus increasing the residential and population densities of suburbs such as St Kilda, East Melbourne, Toorak and South Yarra. As in the 1920s, most dwellings built in the 1930s were routinely equipped with the latest technologies such as hot running water and in the more luxurious suburbs, domestic appliances such as washing machines.38
New dwellings were also built for and by the public sector in outer areas and on reclaimed and ‘brownfield’ sites within the existing built-up metropolitan area. The establishment of the Housing Commission of Victoria in 1938 saw an acceleration of these processes, with its earliest public housing estates erected on reclaimed swampland in Fishermans Bend and former racecourses in Richmond and Ascot Vale. In each of these estates housing was a mixture of terraces, flats and more traditional detached dwellings. And while publicly-provided dwellings lacked the luxury features now common in the private sector, they all came with running water and internal bathrooms, and in the case of Ascot Vale communal
rooftop laundries. The increasing densities associated with new dwellings and new estates meant that while providing water and sewerage facilities may have been cheaper overall, individual patterns of consumption were increasing. By the time of the outbreak of the Second World War in 1939 per capita consumption of water had increased to over 300 litres per day.39
Postwar: Heartbreak Streets
As early as 1942, and thus while victory was in no way assured, state and federal governments began to contemplate and plan for the postwar world. While social security, employment and education were central to plans for a better future, the provision of quality affordable housing was the cornerstone of most Australians’ ideas of what constituted the basis of a worthwhile postwar order. Demand pressures brought about by the low volume of residential building in the 1930s combined with its total cessation during most of the war meant that by 1945 estimates of the shortage of housing nationally were put at 300,000, with the most severe shortages and overcrowding in the inner regions of the major cities. After the war this backlog, combined with the high number of marriages and the baby boom meant that many people’s housing experiences were far from satisfactory. Homes imagined while in battle or a POW camp or while waiting for a loved one to return remained elusive as couples bunked-in with their parents or took rooms in overcrowded boarding and lodging houses in the inner city. In the early postwar years both the Victorian Housing Commission and private builders sought to tackle the backlog, but the demand was overwhelming. Shortages of materials and labour as well as new demand from a rapidly developing immigration program meant that new solutions were needed. The Housing Commission looked to industrialised forms of building while the private sector, possibly correctly, complained about unfair competition from a public sector provider and on-going problems with supplies of and access to materials and labour.40
Despairing of ever getting a home of their own, large numbers of citizens decided to solve their housing problem themselves and set about building their own homes using skills picked up while away at war or on the job as they went along. House plans and specifications were easy to come by through architectural sites such as The Age’s ‘Small Home Service’, while land supply was not a problem as blocks of

CRC for Water Sensitive Cities | 33
farmland and orchards between the radial railway lines were divided up into 50’ by 50’ blocks and sold off, often with only a rudimentary water supply as the sole connected service. The houses were built at night and on weekends, sometimes taking years to complete. In the meantime couples and sometimes children lived and slept in garages, tents and other rudimentary dwellings on site.
Whole suburbs of such ‘owner-built’ houses appeared on the fringes of Melbourne, especially in the southern
Figure 11. ‘Heartbreak Street’, Moorabbin, 1955. Source: Kingston Historical Society.
and eastern suburbs. Soon dubbed ‘heartbreak streets’, these places were often rather bleak – hot and dusty in summer and cold, wet and muddy in winter. Many of these houses had no gas, no electricity, no sewerage, no roads or footpaths, and at best access to an intermittent public transport service. Many residents had limited access to water on their individual block, with many reliant on a communal tap located at the end of an unmade, muddy street. Sewerage disposal remained either the province of the night soil cart, or increasingly the backyard septic tank.
Rather than catching up with demand, rapid population growth and uncoordinated building simply made matters worse for the MMBW. By 1955, ‘properties without sewerage numbered 52,140, and barely half the new buildings each year were being connected’.41 The increasing urban footprint not only expanded the built-upon size of the city, but also the impermeability of its surface area. As a result runoff and hence flooding increased, as did the possibility of
raw sewerage entering the drainage system when septic tanks overflowed. As in the nineteenth century then, in the mid-twentieth century Melburnians en masse opted for the sanctity of the private house and private affluence over the provision of public goods and services. But, given the labour, materials and financial shortages of the period these were as much enforced choices as personal ones.

34 | Water, history and the Australian city
1960s and 1970s: Fordism, new dams and sewerage
Melbourne’s population doubled between the censuses of 1947 and 1971, rising from just over 1.2m to more than 2.5m. The physical size of the metropolitan area expanded dramatically as the former spoke-shaped city, based on the radial public transport network was filled in as residents took to the car for work, shopping and personal journeys. As Graeme Davison has shown, in 1951 ‘scarcely one Melburnian in ten had journeyed to work by car’, but by 1966 that figure was almost three quarters.42 As people moved to new houses on the suburban fringe, so too did their jobs, and later their shops. In 1961 higher education moved to the periphery, when Monash University opened at Clayton in the southeast.43 As with the suburban factories, offices and shopping centres, Monash was designed along Modernist lines and came to symbolise the primacy of the postwar Fordist production regime of big business, big unions and big government.
Along with the Housing Commission (HCV), the Country Roads Board (CRB), the State Electricity Commission
(SEC) and the State Rivers and Water Supply Commission (SRWSC), in the postwar years the MMBW was both a major player in the Fordist economy and increasingly seen as one of the major problems with it. The metropolitan water and sewerage supply as well as it planning authority, and strongly committed to engineering solutions for overcoming the problems of contemporary urban life, by the 1970s for many the MMBW and its staff had come to symbolise the high-handed, technocratism that seemed to be characteristic of modern bureaucracies.
Technocratic solutions to water shortages essentially involved building more and ever-larger dams, usually in anticipation of population growth, but also at various times as a reaction to drought and water shortages. The Upper Yarra Reservoir (200,000 ML) was completed in 1957, while Tarago, a small dam (37,500 ML) designed to service the rapidly growing outer southern metropolitan regions of Westernport and the Mornington Peninsula, was completed in 1969 before being enlarged in 1971. The Cardinia Reservoir (287,000 ML), located in the outer south-eastern suburbs was completed in 1973, the same year as the Greenvale (27,000 ML), which services the outer northwest of the city. Each of the reservoirs had been long-planned, but their development was hastened by the major drought of 1966-7 when Melbourne experienced its driest year on record (up until then). In 1967 only 388 mm of rain fell on the city, less than 60% of the annual average. The February figure was less than 10% of the average. Water shortages and restrictions on use were implemented to cope, but in a technocratic age new dams were considered the ultimate solution to all such problems.
‘Droughtproofing’ the city became a catchcry of policy in the 1970s, which saw the development of the Sugarloaf Reservoir (96,000 ML) to service the northern, western and central suburbs, which was completed in 1981, and the massive Thomson Reservoir, with a capacity of more than one million megalitres, which came on stream in 1984. In building Thomson the MMBW and the government more than doubled Melbourne’s water storage capacity and had, it was believed, permanently solved the water shortage issue. But as we shall see, after the 1980s emphasis moved away from capacity-expansion towards water-saving measures and instituting policies to dramatically reduce consumption. Thomson remains the last reservoir built in Melbourne, even though droughts in the early 1980s and especially the early 2000s led to shortages and the potential for the city to literally run out of water.
Figure 12. Melbourne Statistical District, 1970. Source: Australian Bureau of Statistics and State Library Victoria.
CRC for Water Sensitive Cities | 35
(albeit with a spike to 240 litres in the early 2000s before drought again hit hard).
But while per capita consumption remained roughly constant throughout those years, the population of Melbourne grew rapidly, especially from the late-1990s onwards. A metropolitan population of just under 3 million in 1986 had swelled to nearly 4.25 million by 2015, a rise of more than 40% without any corresponding increase in water supply. This rapid population growth combined with a long and severe drought lasting from 1997 to 2010 led to the adoption of ever tighter water restrictions and appeals to limit water use. By April 2007 ‘Stage 3a’ restrictions, which banned the watering of lawns and severely limited other outdoor uses were in place, while consumers were urged to limit daily usage to 155 litres per person. Melburnians heeded the conservation message, with per capita consumption declining from 247 litres per day in 2000/1 to under 150 by 2010.45
As continuing drought conditions saw the Thomson Reservoir’s holdings decline to 16% capacity by 2009, the fear of ‘running out’ and the potential for an associated political backlash saw the state government revert to old ideas about ‘big engineering’ solutions to water problems. Two major (and very expensive) projects were thus initiated by the then ALP government in the early 2000s to revive the idea of ‘droughtproofing’ the city. The first was the ‘North-South Pipeline’, a 70 kilometre diversion of water from the Goulburn River and its irrigation catchment to the Sugarloaf Reservoir and ultimately, Melbourne. Completed ahead of schedule (and below budget at $625m rather than $750m), in the period of its operation between February and May 2010 the pipeline delivered 16.7 billion litres of water, before it was rendered unnecessary after heavy rainfall in September of that year. It was later ‘plugged’ by the new Liberal government of Ted Baillieu, elected in November 2010.46
The second major water project undertaken by the ALP government was the construction of a desalination plant at Wonthaggi to the southeast of the city. Built as a public-private partnership between the State Government and the Aquasure consortium, the plant was designed to supply up to 150,000 ML to the system each year at a minimum cost of more than $18b over 27 years. The sting in the tail was that as part of the public-private partnership deal the consortium were guaranteed an annual income whether or not any water was actually needed or supplied.47 From the time of completion in 2012 until the present no water has been ordered and the plant is currently mothballed awaiting the next drought, when it may or may not act as the saviour of the rapidly growing and still thirsty city.
Post-1980s: the turn to economic rationalism, pricing, pipelines and desalination
A growing backlash against the anti-democratic nature of semi-government organisations saw a number of them either remade as government departments responsible to a cabinet minister or corporatized and eventually privatised in the 1980s and 1990s. These processes took place under both Labor and Liberal governments, and reflected the turn towards market-based policies (or neo-liberalism) after the collapse of the Fordism economic order in the 1970s and 1980s. The MMBW was organisationally restructured in 1982, but perhaps more importantly its methods of allocating and pricing water were reconfigured towards a more user-pays system.
As Dingle and Rasmussen show, relatively good rainfall in the 1970s meant that lessons about conserving water learnt during the late-1960s were largely forgotten in the following decade. So too, the idea that the Thomson Reservoir would ‘droughtproof’ the city meant that water use, especially for domestic purposes grew faster than population. While industrial use of water stabilised in the 1970s, partly as a result of deindustrialisation and the growing importance of services over sometimes water-intensive manufacturing production, ’domestic consumption inside the home’ went ‘up fifteen per cent’. More troublingly, domestic water consumed outside the house rose by fifty-two percent during the same period.44 The on-demand hot water services, dishwashers, multiple bathrooms and toilets, and daily or twice daily showers that became the suburban norm in affluent postwar Australia, were thus responsible for a rapid increase in water consumption. But the biggest problem was not these luxuries but the continued use of scarce potable water for watering gardens, cleaning driveways and other non-essential uses. Melburnians obviously loved their gardens, but because water charges were mostly based on the rateable value of a property and only minimally on actual usage, such wasteful use of a scarce resource meant that such behaviour came at minimal or no cost to the householder. This was especially the case if they lived in a big, expensive house which attracted high rates and thus ‘free’ water.
The drought of 1982-3 was, like that of 1967, a major catalyst for change. An advertising campaign that warned against being a ‘Wally with water’ by not turning off taps and using water to clean driveways helped to reduce per capita consumption, but perhaps more importantly a new charging system introduced in 1986, in which households were charged for excess water use over a certain minimum, meant that users – including tenants – directly paid for their water consumption, albeit months after usage. The introduction of this ‘price signal’ had the desired effect, with per capita water consumption remaining roughly constant from the late-1980s to today

36 | Water, history and the Australian city
Conclusion Melbourne’s history shows that processes of change in the supply of clean water and the draining and removal of dirty water were and are strongly ‘path-dependent’, a term and a concept that, as we have seen, has been increasingly used by social scientists (economists in particular) to analyse outcomes that reflect the trend, or path, of previous outcomes, rather than current conditions. Water issues especially reflect the interplay between environmental constraints, which do not change quickly, human choices, which reflect long-established preferences, and previous decisions that cannot be undone. Melbourne’s water history was highly sensitive to initial conditions, with the town being sited on flat land near the mouth of a large river system. The site was beneficial for trade and commercial prosperity, but was prone to flooding. Waterways provided ample natural water, but these were soon polluted. During the nineteenth century Melburnians responded to the resulting problems through public investment in water supply, drainage, and sewerage systems, the quality of which reflected the general affluence of the population.
A revealed preference for living in detached houses in new suburbs, despite cheaper, but older housing and vacant land being available closer to the city centre also shaped the nature of demand for water and associated infrastructure. In the nineteenth and twentieth centuries and into the twenty-first, a desire to live in new, progressively larger houses pushed the suburban frontier to recently-rural areas that require effective roads, footpaths and drains. While there is some emerging evidence that some contemporary Melburnians are seeking higher-density dwellings and a more urban lifestyle than has previously been the norm, for the majority the detached suburban home with its own front and back garden retains its allure. The power that these historical forces wield over attitudes to Melburnians’ sense of themselves and their city suggests that Melbourne will likely retain its sprawling, suburban character well into the future. Adapting these preferences to the pressures imposed by a more water-constrained future will likely be one of the major public policy tasks of the twenty-first century.

CRC for Water Sensitive Cities | 37
Introduction Perth has frequently been characterised as the most isolated city in the world, but it shares many of the characteristics of other Australian capital cities including suburban sprawl. Founded by the British as the capital of the Swan River Colony in 1829, the city is mid-way up the Swan River on the coastal plain between the Darling Range and the Indian Ocean. For much of the nineteenth century, the Perth area covered three centres of population along the river: the port of Fremantle; the capital of Perth, 18km up river; and the market town of Guildford, 14km further up river and gateway to the fertile farming lands of the upper reaches of the Swan and Avon Rivers. Most housing was built around these centres and, following the introduction of convicts in 1850, around convict depots and pensioner guard villages on road and river transport routes. Fresh water was obtained from the river, lakes, swamps and wells, with the proximity of wells and cesspits dug in sandy soil facilitating frequent outbreaks of disease.
From the 1880s, large tracts of land were subdivided for suburban development with the opening of the Fremantle-Perth-Guildford railway (1881) and the likelihood of self-government (1890). When gold was discovered in Western Australia in the late 1880s, Perth’s population quadrupled and suburban settlement spread along rail and tram lines. By 1911 the city of Perth was ringed with suburbs and the pattern of suburban sprawl had been set. By then piped water, supplementing natural sources and rainwater tanks, was available to some inner city homes from Victoria Dam in the hills.
With the increasing use of motor transport following the First World War came residential segregation whereby suburbs were increasingly socially differentiated on the basis of housing type, building materials and levels of home ownership. The needs of an increasing population, water famines, and an emphasis on engineering solutions to society’s problems, heralded the era of big dams in Perth. The Hills Water Supply Scheme, a series of dams constructed in the Darling Range from the mid-1920s, gradually provided water to the suburbs through a reticulated system. As well as delivering water at the turn of a tap in most homes, it facilitated the expansion of a suburban culture of excessive water use, as neat lawns and leafy gardens became important indicators of respectability. A surge in population after the Second World War led to further suburban expansion, so that when the 1955 Stephenson-Hepburn Plan for the Metropolitan Area of Perth and Fremantle was enacted into legislation, the metropolitan area was redefined as an area of 5,000 sq km defined by the natural boundaries of sea and hills, thus setting an agenda for further sprawl. The government’s 1970 attempt to restrict suburban development to designated corridors with major
sub-regional centres near the outer limit of each corridor largely failed in the midst of further population increase and development pressures underpinned by an iron ore and nickel boom. The provision of piped water largely kept up with demand, though the 1970s saw a succession of dry years that led to water restrictions and the introduction of a user-pays system of water pricing in order to reduce consumption. This had some impact on domestic water use patterns, though many residents installed bores for garden use. Sewerage services did not expand at the same rate and many households depended on septic tanks.
Concerns about unrestrained outer suburban growth and the cost of providing infrastructure to sprawling suburbs led to the development of the 1990 Metroplan, which championed urban consolidation, resulting in increased housing density in some suburbs and the redevelopment of disused industrial sites for housing. This trend increased in 2010 when the government released Directions 2031 demanding high-density development around transport hubs.1 During the mining boom of the early twenty-first century Perth was Australia’s fastest growing capital city, with its population reaching two million in 2015. Population, development, social and cultural pressures are such that suburbs have continued to sprawl and, while the quarter acre block may have shrunk to an eighth of an acre in many new suburbs, most Perth families continue to aspire to a suburban house and garden. Today the metropolitan region of Perth stretches over 110km from north to south and 80km east to west, covering an area of 6,418 sq km. Such a vast area poses considerable challenges for the provision and maintenance of water supply infrastructure.
Perth has a Mediterranean climate, with hot dry summers and more than half of its average annual rainfall of 843.3mm (33.4in) falling in winter. Another major challenge faced by the city is a decline in average annual rainfall of around 10-15 per cent since the mid-1970s, associated with a much larger decline in streamflow into reservoirs. Groundwater levels have also been falling. In 2012-13 the average annual water use per person in Perth was reported to be 254kL. With a water supply now dependent on groundwater and desalination, the needs of a population forecast to reach 2.2 million in 2031 will put further pressure on regional water resources. Path dependence, whereby decisions made in the past limit present choices, means that in the medium term at least, the people of Perth will most likely continue to rely on a centralised system of water supply. While a house and a garden in the suburbs remains a preference for many Australians, further suburban sprawl poses problems for the provision of infrastructure to supply water to each home. With diminishing rainfall, rainwater tanks may not be the answer. In any event, cultural change will be essential.
Part Three: Perth - water for a sandy city
38 | Water, history and the Australian city
Living with wells and cesspits: 1829-1886
When the site for a capital was chosen in 1829, the northern part of the town of Perth was located on freshwater lakes that were part of a chain stretching to the north and south of what would become Perth’s metropolitan area. These were utilised by Aboriginal groups for fresh water and game, with each lake having significance as a camping, fishing or meeting place. The wetlands were also important for colonists, providing a source of fresh water as well as game. However there were frequent complaints that the water was brackish and the wetlands were prone to flooding. During the winters of 1842 and 1847 the chain of lakes flooded inundating much of the town. Drainage was begun with the construction of an open drain from Wellington St (on Lake Kingston) to Claise Brook, which ran into the river at East Perth.2 Most of the lakes were drained in the following decades to prevent flooding, to create market gardens and for subdivision as town lots. This influenced natural drainage patterns and thus well levels, and the quality of water deteriorated further.
As the town developed, sanitary conditions created by seasonal flooding and the quality of the soil — peat in the wetlands and sand in other areas — became more concerning. Claise Brook became known as a natural sewer and in the 1870s was partly bricked to channel its contents into the river. In the sandy soil of Perth’s coastal plain, wells were frequently contaminated by nearby cesspits. Disease was rife, with Perth compared to a dunghill in 1878.3 It was not until 1885 that a Commission was established to investigate sanitation and water supply.4 Witnesses gave extensive evidence of squalor and filth, especially in the poorer parts of the Perth and Fremantle. The Commission recommended that cesspits be abolished, a Central Board of Health with authority over the whole colony and District Boards of Health in each town be established. Each was to have an Inspector of Nuisances. It also recommended an English model in which local government was responsible for sanitation and public health services, even though the model had been shown to be inadequate in Sydney and Melbourne. It was not until 1893, for example, that the City of Perth introduced a double-pan sewage collection service, with night cart contractors disposing of sewage at a Council Sewerage Farm.5
The Commission also identified four sources of water — wells, catchment from the roofs of houses stored in tanks, Perth’s lakes, and rivers and brooks in the Darling Range (some fifteen miles east of the Perth). It recommended that the government prepare, and discuss with private contractors, a comprehensive scheme of water supply from the Darling Range to be developed when funds were available.
In the meantime, there were storage tanks. Iron tanks were imported to the colony from the 1840s, but the invention of corrugated iron revolutionized these. Locally manufactured corrugated iron rainwater tanks were regularly advertised in Perth from 1891 onwards.6 Nevertheless, only affluent citizens could afford these and the water stored in them rarely lasted from one rainy season to another. Wells were still the main source of supply and when diseases like typhoid and diphtheria became endemic in Fremantle, a pure water supply was urgent. To reticulate Fremantle, pipe mains were laid in 1888 from the Convict Establishment where water was supplied from wells and tunnels hewn into the limestone under the prison.
The gold boom and water needs: 1887-1917
The Commission’s final suggestion had been a pipeline from the Darling Range. Population pressures were emerging with the discovery of gold. Perth was the stopping off point for thousands en route to the Kimberley in the mid-1880s, then the Yilgarn and Pilbara and most significantly in 1892 the Coolgardie and Kalgoorlie fields. In 1887 two civil engineers, Henry Saunders and James Barratt, submitted a scheme to the Perth City Council for a water supply for the city. This would involve the construction of a dam with a storage capacity of 140 million gallons (636 ML) on Munday Brook, linked by a gravity fed pipeline to a service reservoir on Mt Eliza overlooking Perth, from which the city would be reticulated. The City could not fund such a scheme, but enthusiastically supported it. The Government baulked at the cost, arguing that water supply was the responsibility of local government, as in England. In 1889, the City Council signed an agreement with Neil McNeil and Company, a Melbourne-based syndicate, to build and operate the scheme. Saunders, who had sold his plan to McNeil, had become a City Councillor in 1888. Civil engineer, entrepreneur and politician, Edward Keane (MLA 1886, MLC for Perth 1889, City Councillor 1890 and Mayor of Perth, 1891-92), was the local member of the syndicate.
Under the Water Works Act of 1889, the City gained the right to purchase and manage the scheme. Within months of the opening of Victoria Dam in 1891, the City of Perth Waterworks Company, with Keane as Chair, took over the scheme.7 Under the 1889 Act, a minimum domestic service – defined as one water closet and one bath – and an optional metered service for the garden, was to be provided. But, under regulations

CRC for Water Sensitive Cities | 39
introduced in 1891, the more rates paid, the more water a ratepayer was entitled to.8
The supply of water was soon inadequate. The city’s population surged from around 14,000 people to 70,700 between 1891 and 1901, a fivefold increase. Tent cities and boarding houses sprang up around the city to accommodate gold seekers, most from the depressed Eastern States, en route to the goldfields. The summer of 1896-97 was very hot and daily water consumption rose from an already high 238,000 gallons (0.9 ML) in 1895 to 537,000 gallons (2.) ML).9 Water had to be carted in some parts of the city and there were justifiable fears of a water famine.10 The City of Perth Waterworks Company received widespread complaints about intermittent availability of water, loss of pressure, high charges and contamination. As the press pointed out, Perth’s wealthiest residents drew water from the mains before it reached Mt Eliza Reservoir, from whence it was piped to other areas. English-style gardens with green lawns were important markers of wealth and status, and on one summer’s day a mere 195 ratepayers used more than a third of the available piped water. These included politicians and senior civil servants, who ‘squandered water on their green lawns and imported trees’.11 Sprinklers were then banned.12 But ordinary citizens were not spared from criticism, with the press accusing those living in boarding houses, of ‘indiscriminate and sinful waste of water’.13
The Metropolitan Water Works Act 1896 was enacted to take over the company and the newly created Metropolitan Waterworks Board undertook remedial works to improve the water supply. C.Y. O’Connor, Engineer-in-Chief of the Public Works Department, recommended greater use of artesian bores and they became an important source of water.14 Forty artesian bores are known to have been drilled on the coastal plain throughout the metropolitan area between 1895 and 1912.
At this time, however, the Government was preoccupied with providing water to the Eastern Goldfields where prospectors were dying of thirst or disease. The mines, some owned by the largest gold producers in the world, also needed water for their operations. The Goldfields Water Supply Scheme, engineered by O’Connor, included the construction of Mundaring Weir in the Darling Range and a pipeline 560 kilometres to Kalgoorlie. Announced in 1896, it was completed in 1903. In 2005 it was still the longest pipeline in the world.15 Hartley has concluded that no single Western Australian public works project has consumed such a large percentage of government resources.16 The investment in urban water supply was reduced in consequence.
With water supply and sanitary services in Perth and Fremantle at a breaking point, typhoid followed in epidemic proportions. At its highest point, the urban death rate reached 134 in 1897 in a population of only around 70,000. The government’s response over the next decade was to call for a report, purify the water supply by an aeration process, increase the size of catchment reservoirs, extend mains and take over private supplies in suburban areas. To fund these initiatives, it increased the water rate to 2 shillings per 1000 gallons (double the cost of water in Melbourne and Sydney). Sewerage was inadequate with householders still relying on cesspits or, in the city, a twice-weekly pan service provided by the Council. Sewerage Treatment Works on Burswood Island, opposite the outfall from Claise Brook, had been in operation since 1906, but it took time to construct a reticulation network of deep sewerage pipes and pumping stations. By the end of 1910, 291 miles (468 km) of pipes had been laid. House connections began in 1911 and, within two years in an initial rush, some 2,500 properties were connected to deep sewerage. Fremantle’s sewerage system was commissioned in 1912 with a main sewer to three septic tanks near Robb’s Jetty where effluent was pumped into the sea.17
Continuing water crises: 1918-1925 The provision of water was still inadequate. The years following World War One saw further suburban expansion and further pressure on water supply and sewerage. The increasing birth rate and assisted immigration from Britain led to a population surge and the housing market was boosted by the Commonwealth War Service Homes Act 1918, which enabled ex-servicemen who had served overseas to obtain loans to build or purchase a ‘home for heroes’ on easy repayment terms. In 1921, the average house had 4.67 rooms, while the population density reached 4.72 people per acre in well-to-do Claremont and 7.77 per acre in middling Subiaco.
The existing water supply from Victoria Reservoir was insufficient to supply the expanding city. A Metropolitan Water Supply, Sewerage and Drainage Department had been established in 1921 to focus on the metropolitan area alone. The Engineer-in-Charge, F.W. Lawson, reorganized the metropolitan water supply by installing new distribution mains from Victoria Dam and modern pumping equipment.

40 | Water, history and the Australian city
The press continued to attack ‘the contemptuous indifference’ of the government. Scarcity and poor quality of water was ‘the culmination of years of apathy’. During the summer, some areas had been without water for hours, so that people had to beg for water from neighbours with rainwater tanks.21 At a public meeting in March 1923, National Country Party Premier Mitchell was forced to promise an improved supply in the form of the Hills Water Supply Scheme. It would take years to complete.
The situation was worse at the beginning of the next summer. Consumption had increased because, according to the government, new larger pipes replacing smaller corroded pipes enabled the water to run too quickly. Within a month, despite restrictions on the use of sprinklers, water supply ceased entirely in the suburb of Mt Lawley: there was no water for drinking, cooking, washing, or flushing toilets. In some suburbs the water was cut off for hours, in others the water came through, but at greatly reduced pressure and was the ‘colour of dark coffee’. Water had to be carted in and there were calls for a Royal Commission. By February 1924 in virtually all the higher areas of the city and suburbs, water was either non-existent or flowing at a trickle. The explanation was that a main had burst. When a City Council water cart drove into Mt Hawthorn and started sprinkling the dusty roads, ‘tired dads, with the wails of their wives and kiddies ringing in their ears’, took over the cart. They slowly drove the cart from house to house, with a crier preceding them calling out ‘Water! Bring out your tins’. The press noted that the Minister and a department that ‘could not successfully manage a lolly stall’ had forced people into ‘a spirit of Bolshevism’.22
In these years, sewerage connections had also lagged behind population growth and suburban expansion so that in 1921 only 48 per cent of dwellings in the metropolitan area were sewered. Even so, as the amount of sewage processed had increased, complaints about the smell from the Burswood Island treatment works had become frequent and the level of nutrients discharged into the river had led to excessive amounts of algae. The number of filter beds had been increased to nine leading to further pollution. Dredging was the immediate solution but, after a section of one of the filter bed walls collapsed, a Select Committee was set up in 1924 to report upon the operations of the Metropolitan Water Supply, Sewerage and Drainage (MWSSD) Department. One result was the construction of Sewerage Treatment Works in Subiaco, completed in 1926, with an ocean outfall.
Separate suburban reticulation systems were connected to Perth’s reticulation system and the use of artesian water was increased. This was still not sufficient: the 90,000 customers served in 1912 virtually doubled to 178,000 by 1925.18 At that rate of growth, it was not surprising that there was another water crisis.
In early January 1920, as the summer began to heat up, the press began to use the term ‘water famine’. Water restrictions were again put in place. Street watering (many roads were not sealed) and the use of garden sprinklers were banned. The Government commissioned a report on future water supplies by E.G. Ritchie, a Melbourne hydraulic engineer. He visited Perth during winter but his recommendations, which did not impress the local engineers, simply tinkered round the edges.19
At the start of the next summer, the press were on the case again, pointing out that the government had done practically nothing to prepare Perth for the summer and complaining about the construction of a ‘tin-pot’ dam at Pickering Brook, when it would have been possible to utilize the winter overflow from Mundaring Weir (used for country and goldfields water supply). The quality of water was still an issue. In suburbs to the north of Perth it was ‘frequently dirty brown’ and contained ‘an excess of solids’. Testing showed it to be satisfactory, but the press was doubtful, suggesting that residents should ‘boil their water before drinking it.’20
Figure 13. Plan showing existing and proposed water supply of Perth and suburbs, 1903. Source: Engineers Australia (Western Australian Division), Recognition of Perth’s First Public Water Supply Scheme for an Engineering Heritage Marker, Perth, Engineers Australia (WA), 2012
CRC for Water Sensitive Cities | 41
The era of big dams commences: 1925-1945
The Hills Water Supply Scheme that the Premier had announced was also investigated by the Select Committee. It provided for two pipehead diversion dams (on the upper Canning River and on Wungong Brook) and storage dams on Churchman Brook and the Canning River. The Committee lacked engineering expertise, and its report rehearsed the history of metropolitan water supply, assessed its governance, and attempted to analyse complex engineering and financial issues relating to the Hills Scheme.23 To avoid major capital expenditure on other works, it proposed an investigation into using Mundaring Weir for metropolitan as well as agricultural and goldfields water supply, and increasing its storage capacity. Churchman’s Brook Dam was to be completed as soon as possible. A series of other recommendations were made, including the introduction of a flat rate for water for gardens and other purposes, but most other major recommendations related to sewerage and drainage. Only 48 per cent of dwellings in the metropolitan area were then sewered and this only increased to 50 per cent by 1933.
The Committee was ‘trenchant in its criticism’ of the administration of the MWSSD Department. The Department was to be handed over to a Board. The report was particularly critical of the Engineer-in-Charge of the Department, hydraulic engineer F.W. Lawson. Like O’Connor before him, Lawson succumbed to the strain of the inquiry and press criticism, and shot himself. Two suicides by those in charge of water supply, albeit two decades apart, demonstrates the extraordinary pressures on those charged with delivering water to an expanding population.
Churchman’s Brook Dam and the two pipehead diversion dams were completed in 1925. These gave a major boost to the water supply, and saw the percentage of artesian water in the supply to drop from 81 to 47 per cent. With the Depression of the 1930s, as Hunt notes, employment and water policy became intertwined. Report after report had recommended that a major dam should be built on Canning River and it was an integral part of the Hills Scheme.24 The costs had always been prohibitive, but now
labour was available cheaply through the Sustenance Relief Scheme and this was used on both sewerage and water works. Men on sustenance began to clear the Canning Dam site in 1930 and construction commenced in 1933. Over 300 men were employed. Canning Dam was designed by Russell Dumas, a dynamo who had been appointed Chief Engineer of the MWSSD Department in 1934 and would go on to lead the implementation of the government’s development policies in the postwar era. Construction techniques using bulk concrete were new to Australia. Conditions were dangerous and there were numerous accidents, particularly during concrete pours, and some deaths. On completion the dam held 20,000 million gallons (76,000 ML) when full, compared with Mundaring Weir, which held 4,500 million gallons (17,000 ML). The local press concluded that, like the completion of Mundaring Weir and the provision of water to the goldfields in 1903, the opening of Canning Dam in 1940 marked an ‘epoch in water conservation’ proving beyond doubt the capacity of the Darling Range.25 Many believed that Perth’s water supply had finally achieved maturity after five decades of ad hoc development.
In providing a reliable and abundant supply of water to the people of Perth, Canning Dam facilitated the expansion of a suburban culture of profligate water use, particularly outside the home. As water restrictions had been eased after the 1920s crisis, well-kept, green front gardens featuring lawns, exotic trees, shrubs and annuals had become an important marker of suburban respectability.26 By the 1940s backyards might also include expanses of lawn maintained for purposes of recreation, utility and aesthetics, as well as fruit trees and vegetable patches. Such features could only be maintained with an abundant, affordable and reliable water supply.
The expansion of metropolitan water supply was not a priority for the state government during the war years. However, in spite of the loss of workers to the military, work continued on a range of infrastructure projects and the public water supply was supplemented with an increasing amount of groundwater.

42 | Water, history and the Australian city
Suburban and industrial expansion: 1946-1959
As the war ended and servicemen and women returned, the anxieties and privations of the war years gave way to a widespread longing for domestic comfort. In 1946 the population of Perth was 268,000, but it would increase rapidly due to immigration and the local baby boom. In Perth, as elsewhere, the pent-up demand for housing saw rapid suburban expansion as housing materials gradually became available. In this context, metropolitan water supply works were seen as essential to provide for a higher standard of living and a growing population, as well as being an important source of employment for returned servicemen. New bores were sunk, piped reticulation extended, and new sewerage, drainage and water treatment works constructed. By 1947, two-thirds of Perth dwellings were connected to a sewer; the remainder used septic tanks or the pan system.27 The rapid expansion of the urban water network rested on the assumption there was an unlimited amount of water available for provision to the growing suburbs.
At the 1947 census, only around 2 per cent of Perth houses were without running water. However, residents of many working-class suburbs were still carrying cold water from room to room and wastewater from inside to outside. For example, a cheap rented house in Inglewood in 1941 had no kitchen sink and the only tap in the house was in the combined bathroom-washhouse.28 In the postwar decades, households sought greater convenience and cleanliness. As new homes were constructed and the existing housing stock expanded and renovated, indoor plumbing became more elaborate and appliances such as washing machines more popular, with little thought for water conservation.
However, even as early as 1947, cracks started to appear in the illusion of limitless water. High temperatures and power shortages, which put pumping stations out of order, led to intermittent restrictions on sprinklers and fixed hoses in the summers of 1947 and 1948 in some suburbs, and the summers of 1949 and 1950 in the whole metropolitan area.29 While some water restrictions were due to supply-side technical failures, restrictions due to water shortage were implemented sporadically throughout the 1950s under conditions of low winter rainfall followed by high summer temperatures.
Perth householders had reportedly gone ‘bore mad’ at the threat of restrictions in the summer of 1959.30 At that time, the government encouraged the installation of private bores to reduce scheme water demand, in spite of potential environmental effects and the possibility that the cost of bore installation would create ‘a new form of class distinction’.31
The numerous water restrictions of the 1950s also stimulated a nascent appreciation of the need for water conservation among some members of the public. Some even wrote to the Daily News to advocate more stringent restrictions and greater efforts to encourage water conservation.32 And indeed, over the 1950s, mean daily consumption of scheme water per capita fell. However, change was short-lived: once restrictions were eased in January 1960, stores reported a ‘rush on sprinklers’ and consumption reached a new peak. Restrictions had not fundamentally altered Perth householders’ view of water as a commodity that was generally abundant and affordable.
In this era, expansion was not limited to residential suburbs. In 1952 the state government and Anglo-Iranian Oil agreed to construct a port and oil refinery at Kwinana, then a small holiday resort about 40km south of the CBD. To sweeten the deal, the Western Australian Government agreed to provide a potable water supply for both the refinery and the Kwinana town site, built to accommodate refinery workers.33 It was hoped that Kwinana would be the catalyst for development of a much larger industrial complex and the state’s provision of infrastructure, including water, was seen as playing an important role in bringing this vision to fruition. The development of Kwinana, spearheaded by Russell Dumas, marked a change in the state government’s development strategy, involving increases in the scale of private capital as well as the extent of government concessions and infrastructure provision for new development projects. Underpinning this shift was a new, grander vision for Western Australia, and a concomitant enthusiasm for large-scale development projects. Initially associated most strongly with Dumas, the new development ideology was eagerly taken up within the Liberal Party and would later achieve its fullest expression in the coalition governments of David Brand (1959-71) and Charles Court (1974-1982).34

CRC for Water Sensitive Cities | 43
The damming of the Serpentine River, inland from Kwinana, played an important role in enabling the development of both industries and suburbs with significant water requirements. Indeed, the southern industrial complex, which later expanded to include a range of processing and manufacturing activities, would come to be a significant metropolitan consumer of water. The first stage of the Serpentine project was opened in November 1957, and four years later the entire project was complete. At this time, large infrastructure and engineering projects such as dams were seen as the epitome of progress and as such they enjoyed widespread public support.
Dumas’ grander visions for the state in the 1950s also saw the advent of metropolitan planning in Perth with the appointment of Professor Gordon Stephenson as town planning consultant to the Western Australian government. In 1955 he and Western Australian Town Planning Commissioner Alistair Hepburn produced The Plan for the Metropolitan Region, Perth and Fremantle, commonly referred to as the Stephenson-Hepburn Report. The report revealed that in the mid-1950s, population densities per acre ranged from 22.1 in Fremantle and 20.8 in the City of Perth to 16.9 in Claremont and Subiaco municipalities and to 2.5 in outer metropolitan suburbs. The Report promoted decentralisation, with new suburbs to be developed both to the south and north on the outskirts of the then metropolitan region. Though the Report recommended development of an extensive rail network, the political culture of the time favoured private automobiles as the dominant mode of transport. Tram services were terminated in 1958, leaving only a rudimentary rail network to support higher-density development, while freeway construction supported the private motorist and facilitated the expansion of low-density suburbia.
Though the focus of the Report was land-use and transport planning, Stephenson and Hepburn were aware of water resources as a limiting factor in urban development. For example, they noted that ‘certain types of industry, such as that producing synthetic fibres, would be precluded from operating in the Region unless completely new sources of water supply are found’.35 However, through the assumption that the growing population would be accommodated mainly in low-density suburban housing, the Report supported existing patterns of domestic water use, particularly with respect to gardens. In 1963 the Report formed the basis for the Metropolitan Region Scheme, the statutory plan for Perth.
Figure 14. Plan for the Perth Metropolitan Area. Source: The Plan for the Metropolitan Region, Perth and Fremantle, Stephenson-Hepburn, 1955

44 | Water, history and the Australian city
The thirst increases and a new boom begins: 1960-1969
The 1960s were almost free of metropolitan water restrictions after the completion of Serpentine Dam in 1961 coincided with a relatively wet decade. As the government assured the people of Perth that it could meet their demand for water, consumption increased (see fig. 15 below). Internal water consumption patterns had changed in Perth as in other major Australian cities, with the Australian Consumers Association estimating in the mid-1970s that almost every Australian home had a washing machine.36
The 1960s saw a range of significant developments in the state beyond the metropolitan region. Premier David Brand persuaded the Commonwealth Government to end the embargo on iron-ore exports that had been imposed in 1938 for strategic reasons. The Minister for Industrial Development, Charles Court, worked to attract multinational capital to the iron-ore rich Pilbara, and by 1969 Western Australia was exporting iron ore valued at $132 million per year. Oil and nickel production also fed a booming economy that would generate an influx of wealth and people of a level not seen since the gold boom of the 1890s. Between 1947 and 1971 the population of Perth increased by 158 per cent - the highest rate of growth of any major Australian city.
Figure 15. Perth estimated annual average daily water usage. Source: Adapted from D.R. Williamson, ‘Statistics of water use’, 1975.
Decade (calendar years) Total use (ML per day) Garden use
Garden use (annual average) ML per day
Summer garden use ML per day
1945-54 129.2 66.4 128.0
1955-64 205.6 115.8 228.1
1965-74 369.7 200.7 402.8
Even before the boom of the late 1960s, as the Serpentine water was becoming available, it was anticipated that Perth would struggle to meet the water demands of a growing population. As in the past, water managers and their political masters believed that the way to avoid water scarcity was further source development. Influenced by developments in the USA, in 1963 the government directed a new team of hydrogeologists to investigate the potential for groundwater to meet domestic supply needs.37 Their work revealed extensive reserves in the south-west coastal region, in both superficial and deep formations. Groundwater resources would be increasingly exploited in the 1970s. In the meantime, in keeping with the Brand coalition government’s emphasis on ‘bigness’ in development projects, and drawing on revenue generated by the mineral boom, a large-scale scheme to draw water from the Dandalup River was approved and work commenced in 1969.
Such appliances contributed to increasing indoor water consumption. From the mid-1940s to the mid-1970s, however, gardens accounted for just over half of all water use, rising to around 70 per cent in summer. The fact that garden water use increased while average block sizes decreased over this period suggests that many Perth householders were cultivating more elaborate gardens containing plants with higher water requirements.

CRC for Water Sensitive Cities | 45
In these boom years some attention was also given to sewering the booming suburbs. The wastewater treatment plant at Subiaco was expanded and a new plant constructed in the southern region. Both discharged treated effluent offshore. In 1963 the government also launched a £19 million scheme to sewer properties in southern suburbs. However, even with such measures, by 1966 the proportion of sewered dwellings had fallen to just over 50 per cent; by 1971 it was only 40 per cent.38 In the context of rapid population growth, water managers prioritised supply over sewerage, with septic tanks considered an acceptable, cheaper alternative on Perth’s sandy soils.
In this era of abundant supply, Perth residents continued to use more water than their eastern states counterparts: by the early 1970s Perth’s average per capita consumption was around 1.3 times that of Sydney and Adelaide, and 1.5 times that of Melbourne. The growing population was still being housed predominantly in low-density suburbs. For the first time water conservation began to enter the consciousness of developers, though even in more water-conscious developments, the public areas were grassy and most private household gardens were planted in traditional water-thirsty fashion.39 Often, water for gardens was provided by bores.
Scarcity returns: 1970-1978
The Water Board, too, increasingly turned to groundwater to augment the public water supply. The first groundwater scheme was commissioned at Mirrabooka in 1970. A landmark study released in 1973, the South West Regional Water Planning Study, supported the use of groundwater and further bores were sunk at Gwelup in 1974 and Wanneroo in 1976. At the same time, water from the Dandalup river scheme was becoming available. The North Dandalup pipehead dam was completed in 1971 and the 208,000 ML South Dandalup dam would be completed in 1974. The last dam of the scheme, at Wungong, became operational in 1978. However, dams require rain, and the mid-1970s saw the onset of a shift to a hotter and drier climate in the South West. From 1985, when recording of dam levels began, to 2015, the South Dandalup dam had never reached even 40 per cent of capacity.40
In the 1970s the government believed that water scarcity posed a potential limit to economic growth. With few fresh surface water sources in the South West remaining available for exploitation, other options for expanding the water supply were canvassed, including a pipeline from the Fitzroy River in the far north of the state, the towing of icebergs from Antarctica, and the utilisation of groundwater and surface water supplies. That the government chose to pursue the latter reflects a shift in the Western Australian water sector from a ‘heroic’ to a more ‘mature’ phase less wedded to large construction projects and a narrow engineering focus.41 The economic downturn of the 1970s and growing influence of neo-liberal ideas also encouraged an increasing focus on economic efficiency and productivity.
Indicative of the shift away from a narrow technical approach to water management are the attempts by the Water Board in the 1970s to curb public demand for water through education. In the wake of the hot and dry summer of 1971/2 the Board implemented a voluntary water conservation programme involving publication of details of daily and weekly water consumption and targets in the West Australian newspaper. However, actual consumption appeared to correlate most closely with temperature, suggesting that the public generally failed to respond to this approach. Water conservation at this time was not encouraged by the Water Board’s decision to increase household water allowances. The probable increase in consumption resulting from the granting of more free water to each household was likely not offset by the simultaneous increase in excess water use charges. Water restrictions returned in January 1974.42
Another voluntary water conservation campaign was launched in late 1976, again involving publication of a weekly ‘Water Budget’ in the West Australian, as well as broadcasting daily water targets each night on Channel Seven. This was complemented by a broader media campaign that reinforced gender stereotypes as it encouraged water conservation both inside the home (by women), and in the garden (by men).43 The effectiveness of the campaign is difficult to gauge, given the prevailing mild weather and apparent correlation between water consumption and temperature, though several Perth residents – mostly women - wrote to the West Australian to suggest ways in which water could be conserved.

46 | Water, history and the Australian city
Some suggestions, such as tipping wastewater from the kitchen sink onto the garden, flouted health regulations, under which it was only permissible to use water from showers, baths, basins and the rinse cycles of washing machines on gardens.44 Ultimately, any savings achieved through voluntary conservation by engaged citizens were insufficient and restrictions were again implemented in mid-1977, which lasted until 1979.
In this context, the local gardening press attempted to calm anxious gardeners by providing advice on water conservation in the garden, for example by heavy mulching. Some also encouraged greater use of drought-resistant native plants. Increasing interest in native plants was discernible in Perth by 1959, when it was decided to establish a 100 acre botanic garden featuring Western Australian flora in Kings Park, adjacent to the CBD. However, native plants did not achieve significant popularity as domestic garden subjects until the 1970s. By then, specialist nurseries had been established in Perth; in their advertising they urged gardeners to ‘Go Native, Save Water’. Government moves to encourage more climate-appropriate gardening had begun in the North West, motivated by the high cost of water supply, but in the wake of growing demand and dry seasons the idea was taken up in other official contexts. For example, in 1977 the Forests Department published a booklet on Planning Your Garden to Conserve Water.45
The growing popularity of native plants in Perth gardens reflected local pressures on water supply as well as national trends, which increasingly saw native plant gardens as markers of ‘good taste and ecological awareness’.46 A study of domestic water use in Perth reported that in 1976 and 1977, seven per cent of properties reported an increased area of native plants; this figure would steadily increase in subsequent years. The turn to native gardens can, however, be overstated: the study also revealed that in the same years, the percentage of properties reporting an increased area of paving was 10 per cent and 11 per cent respectively.47 This shift to hard landscaping may in some cases have been motivated by water conservation, though in others it likely reflected the increasing popularity of outdoor living, which in many cases included a swimming pool.
The rapid suburban expansion of this era saw the introduction of small, temporary wastewater treatment plants with on-site disposal. These were gradually decommissioned as the growing sewerage network connected the suburbs to centralised wastewater treatment plants with ocean outfalls. In 1973 Gough Whitlam’s Commonwealth Government had introduced a scheme to fund the comprehensive sewerage of Australian cities and towns. In Western Australia this was largely used in the construction of main sewers, pumping stations and treatment facilities. By 1976 still just over half of all dwellings w ere unsewered, and it was estimated that sewering the backlog would cost approximately $800 million.48

CRC for Water Sensitive Cities | 47
A growing water consciousness: 1978-1994
In 1977 the conservative Court government commissioned a review of metropolitan water supply management by Binnie International, an engineering firm. It found that the cost of supplying water to Perth was increasing and would continue to increase. Incorporating the views of local and international free-market thinkers, the report recommended that water managers engage in long-term planning for increasing demand for water. In doing so they should adopt corporate objectives and prioritise economic efficiency, including universal metering and charging users a price for water that at least covered the cost of its provision, that is, a user-pays basis for household water consumption. The Metropolitan Water Board implemented this recommendation in mid-1978.49
Although some residents were unhappy with the introduction of user pays, it proved to be particularly effective in reducing water use in Perth’s gardens. In contrast to the mid-1970s, over half of the average household’s scheme water consumption occurred inside the home in the mid-1980s. It is important to note, however, that the observed reduction in water use did not account for the boom in backyard bore installation during the late 1970s and early 1980s. Private bores were not metered or monitored (which remains the case), but the Metropolitan Water Authority estimated that bore users consumed upwards of seven times as much water in their gardens as those without bores.50 Despite some concerns about the impact of backyard bores on groundwater reserves, many bore-owners believed they were helping to alleviate the pressure on scheme water supplies and thus contributing to the Water Board’s effort to conserve water. Perth people’s ongoing commitment to maintaining particularly verdant gardens in this period seems at odds with a contemporaneous rise in ecological awareness. By the end of the 1970s, the people of Perth were becoming increasingly aware of the toll that unchecked development had taken on their state’s natural environment. As the state’s population ticked over the one million mark in the 1980s, this growth and the sprawling suburbs of Perth placed additional pressures on the city’s water supplies. Meanwhile, many Western Australians had become disenchanted with the ability of urban planners and water managers to adequately address these environmental challenges, and were critical of the state-wide development imperative. However, the prevailing view of the home and garden as separate from the wider environment allowed the issue of urban water scarcity to be demarcated from the emerging environmental consciousness.51
The city’s growing dependence on groundwater was not limited to backyard bore use. By the end of the 1970s, up to 50 per cent of Perth’s supplies were drawn from its groundwater schemes on the Gnangara Mound. The Mound, which lies beneath Perth’s northern suburbs, sustains the long chain of wetlands, lakes and swamps along the Swan Coastal Plain, which local residents were beginning to appreciate, not only in terms of their value as water supplies for local market gardens and pine plantations but as places for recreation and as habitats for local flora and fauna.52
Spurred by the environmental impacts of urbanisation, which had cost over 50 per cent of the Swan Coastal Plain’s wetlands, a small coterie of Perth planners began to advocate the principle of ‘water sensitive design’ in the 1980s and early 1990s. This approach attempted to reconcile water resource planning with planning for the growth of metropolitan Perth. Although this concept did not find mainstream support in Perth at that time, the stormwater aspects of the framework were further developed in eastern Australia later in the decade.53
By the late 1980s, the northern expansion of Perth’s suburbs had outpaced the growth of the sewerage network such that the city’s northwest had the most residential septic tanks in the metropolitan region. In fact, compared to other Australian capital cities, Perth had the largest proportion of properties that were not connected to sewerage. This widespread reliance on septic tank sewerage disposal hindered further urban consolidation, which may have alleviated some of the environmental pressures of urban sprawl. To remedy this dependence on septic tanks, the state government mandated the provision of reticulated sewerage to all new subdivisions.54 Responding to this increased demand, the Metropolitan Water Board (from 1982, the Metropolitan Water Authority) began to expand the capacity of the city’s wastewater treatment plants at Subiaco, Woodman Point, and Beenyup.55 In the mid-1990s, the government also commenced a decade-long program to sewer established suburbs, where over 20 per cent of properties were still reliant on septic tanks and leach drains for wastewater disposal.56

48 | Water, history and the Australian city
Curbing consumption: 1994-2000
Low metropolitan dam storages after the dry winter of 1994 led the Liberal government to impose the first water restrictions on Perth householders since the late-1970s. The relatively moderate restrictions commenced on 1 November and prohibited the use of garden sprinklers between 8am and 8pm (later, 9am to 6pm) in the areas serviced by the Integrated Water Supply Scheme – Perth, Mandurah and the eastern Goldfields. Although these restrictions were intended to be temporary, they have remained in place. In light of the backlash of the 1970s restrictions, these moderate measures were met with little resistance from householders. Although the relatively mild nature of this program of restrictions may have mitigated a backlash, residents’ muted response was likely the result of having assimilated water conservation messages over the past decade or so as part of a wider awareness of environmental concerns.57
In the wake of the reorganisation of state’s water authorities, whereby the Water Authority of Western Australia was corporatised and re-named the Water Corporation, water managers convened a workshop in early 1996 to address the recent low levels of rainfall in the South West and its implications for water management. The workshop participants identified a new regional climate equilibrium of lower winter rainfall and as a result, water managers lowered their expectations accordingly. With demand expected to exceed supply, the Water Corporation brought forward its plans to expand and develop the region’s water supplies. Although greater curbs on water consumption might have delayed this resource development, it was politically unpopular to enforce tighter water restrictions or to raise water rates to expensive infrastructure investments. Already the government had sought to cushion the effects of user pays on consumers, thus weakening the price signal and reducing the incentive to reduce water use in Perth.58
In 1997 the state government campaigned to encourage households to sink bores to reduce demands on scheme water and alleviate pressures on the environment. The Water Corporation estimated that nearly a third of Perth households had bores at this time.59 Drawing on bores that tapped into shallow groundwater reserves, the government argued, could go some way to lower the water table, which had risen in some areas due to urban development. As backyard bores remained unlicensed, unmetered, and therefore, unmonitored, such a strategy, argued local environmentalists, contradicted measures to protect the groundwater reserves of the Swan Coastal Plain.60 These groundwater reserves were growing especially important for scheme water supplies, as dams were becoming increasingly unviable sources of water supply in Perth’s drying climate. By the year 2000,
total water scheme consumption in Perth had increased by at least 25 per cent since 1990, although demand management strategies and the introduction of water restrictions in 1994 had kept per capita demand largely at bay.61
Water crisis: 2001-2005 The dry winter of 2001 delivered the lowest stream flows to Perth’s dams since the drought of 1914. The Water Corporation increased its draw on groundwater reserves and tightened water restrictions on its customers to ensure sufficient supplies. In addition to the prohibition of sprinklers during the day, customers were now forbidden from using their sprinklers more than twice a week. Bore owners were also restricted to using their bores at night. The government also increased prices for those households who used more than 550kL of scheme water a year.
The tightening of water restrictions and higher prices helped to reduce water consumption in Perth from over 180kL per head per year in 2000/2001 to about 150kL the following year.62 The government again encouraged residents to invest in these independent supplies to relieve the pressures on scheme water. The government also relaxed regulations on the use of grey water in suburban gardens and later offered small rebates on less thirsty showerheads, washing machines and toilet cisterns, as well as rainwater tanks. Although fewer than 10 per cent of households invested in a rainwater tank, more than a quarter had a bore to ensure their gardens did not suffer.63
As the reduction in consumption suggests, most consumers were receptive to the need to conserve scheme water. Many remained concerned, however, about the consequences of such measures for the appearance of their gardens and their suburbs generally. The people of Perth were just as anxious about maintaining their lawns and gardens as they had been in the late 1970s. After a hiatus during the 1980s and early 1990s, consumers had begun to use as much water outside the home as they had before the introduction of user pays in the late 1970s. During this time, observed environmental historian George Seddon, Perth had ‘gone palm’, favouring lush and thirsty greenery over more hardy species that could withstand dry spells.64 Although homes were occupying a larger proportion of the residential block, leaving less space for outdoor areas, these spaces had become sites of

CRC for Water Sensitive Cities | 49
entertainment, recreation and conspicuous consumption. From elites through to the aspirational working class, front gardens especially were places of spectacle, which required large amounts of water to maintain their verdant appearance to residents and visitors.65 As a resident from the leafy, riverside suburb of Applecross explained, ‘If you drive down the street and everybody has got reasonable lawns and one’s got a dead patch, it’s like pointing the finger of scorn isn’t it’.66
Following the dry conditions of 2001 and 2002, the state government announced in early 2002 its intentions to utilise seawater desalination technology to supply water for Perth. Under this plan, a reverse osmosis desalination plant would be constructed in the vicinity of the southern suburbs of Kwinana or East Rockingham, which would provide scheme water during periods of ‘drought emergency’, that is, to avert total sprinkler bans. This plan to utilise desalination technology was met with staunch opposition from environmentalists, rural politicians, and the press. In light of their concerns, in February 2003 the Government briefly turned its attentions to tapping the South West Yarragadee aquifer in the South West Capes region. These ongoing concerns about Perth’s water future in the lead up to the 2005 state election revived the prospect of piping water from the Kimberley region to Perth. Although the government had committed to the seawater desalination plant in late 2004, the popular support for the idea of the Kimberley pipeline forced the government to undertake a more detailed study of the plan. Before this study was completed, however, the Opposition announced on the eve of the 2005 election that a Coalition government would build a canal to utilise the vast water resources of the Kimberley for the South West. In spite of the popular appeal of the Kimberley canal, the project proved to be the undoing of the Coalition during the 2005 electoral campaign. The Coalition failed to win the confidence of the electorate at the polls, ushering in the Labor government for a second term.
Drought-proofing a drying city: 2006-2015
In November 2006, Perth residents became the first in Australia to sip desalinated seawater from the Perth Seawater Desalination Plant at Kwinana. The desalination plant provided 17 per cent of Perth’s supplies. Other state governments took note and before long, desalination plants were planned in similarly drought-affected areas, including the Gold Coast, Sydney, Melbourne and Adelaide. Although other states followed, the Western Australian government invested twice as much in the development of water supplies between 2001 and 2006 as its counterparts in Sydney, Melbourne, Brisbane and Adelaide. The provision of additional supplies arguably undermined the government’s promotion of household water conservation as a comparison of household water use across Australian cities in 2005 revealed that Perth was third behind Canberra and Adelaide, despite the city’s heavy reliance on backyard bores.67
By 2005, the state government considered that the electorate would not tolerate tighter limits on water consumption and pledged that they would reduce the likelihood of a total ban on water sprinklers from one year in thirty, to just one year in two hundred. This represented an extremely conservative approach to water planning.68
Australians in other capital cities, meanwhile, were likely to face sprinkler bans once every twenty-five years. The possible effects on the plant nursery, turf growing, lawn mowing, and swimming pool industries also played a role. Such a conservative policy, however, demanded the development of further supplies. As the South West Yarragadee option continued to divide the electorate after the state election, the government committed to the construction of a second desalination plant in 2007 at Binningup (the Southern Seawater Desalination Plant), which was completed in 2011 (Fig. 16). The need for a second desalination plant was vindicated by the dry winter of 2010, which was the driest year since records began. In response, the government imposed total sprinkler bans during the winter months of June, July and August. Bores were also restricted to just three days per week, affecting about a quarter of Perth households. Despite his earlier reservations about seawater desalination, Coalition Premier Colin Barnett (elected in 2008) claimed that the expansion of this plant in 2013 now ensured that Perth was ‘basically drought-proof’.69 His rhetoric countered the association of local water challenges with wider challenges of water scarcity and anthropogenic climate change, which had been growing over the past decade. The increased reliance on seawater desalination reflected the Water Corporation’s 2009 commitment to ‘Water forever, whatever the weather’, such that Perth would be ‘drought-proof’ by 2022.70

50 | Water, history and the Australian city
This strategy also emphasised the need for demand management, with the aim of reducing water use by 15 per cent (compared to 2007/08 levels) by 2030, from 147kL per year to 125kL per year. There are other environmental costs of ‘drought-proofing’ to consider. The marine environments of Perth’s desalination plants are sensitive to the hypersaline discharge that is produced in the purification process. These plants not only have the potential to pollute the marine environment, but also the atmosphere due to their carbon emissions. When desalination technology was first mooted as a solution to Perth’s water crisis, critics were quick to point out the irony of the situation: a desalination plant would emit atmospheric gases – the very gases causing anthropogenic climate change, which was contributing to the region’s drying trend. Mindful of this carbon footprint, the Water Corporation has offset the energy requirements of its desalination plants with wind and solar technology.
In response to the deteriorating condition of the groundwater reserves of the Swan Coastal Plain and the ongoing decline in rainfall, the government commenced a trial to replenish the Gnangara Mound with treated wastewater in 2011. The total volume of this program of aquifer recharge was equivalent to about 2 per cent of the amount of treated wastewater discharged from Perth’s treatment plants.71 The nature of this plan has been surprisingly uncontroversial – Perth has certainly been no ‘Poo-woomba’. In 2006, residents of the Queensland town of Toowoomba voted against plans to add recycled wastewater to local water supplies, despite the prospect of severe water restrictions. Mindful of the potential for this outcome, the Western Australian government has not sought the people’s permission, but instead surveyed Water Corporation customers and found three-quarters in support of the scheme. Significantly, the recycling of wastewater in Perth is an altogether different prospect than that which faced the residents of Toowoomba. There, recycled wastewater would be added to dams, but Perth faces a more palatable prospect. Following methods long practiced in California’s Orange County, recycled water is replenishing groundwater reserves under the suburbs, which as the state’s water minister promised in 2013, will ‘underpin Perth’s water security’.72
The Water Corporation commenced construction of a Groundwater Replenishment Scheme at its Beenyup Wastewater Treatment Plant in late 2014, which it aims to complete in 2016. As of April 2015, the Water Corporation plans to expand the Alkimos Plant (built in 2010), and complete the construction of a plant in East Rockingham to accommodate the city’s growth
Findings from the national Climate Council in early 2015 highlighted the importance of diversifying Perth’s water supplies and curbing water demand. According to the ‘Thirsty Country’ report, average annual stream flow into Perth’s dams has decreased by nearly 80 per cent since the mid-1970s. Furthermore, the report estimated that demand would outstrip the city’s supplies by 2030.73 Already the Premier has flagged the possibility of additional desalination plants to meet this demand, which suggests that the government is reluctant to enforce tougher water conservation measures. Whether the rhetoric of ‘climate independence’ and ‘drought-proofing’ helps to support or undermine water conservation in Perth’s suburbs remains to be seen.
Figure 16. Water Corporation Drinking Water Supply, Integrated Water Supply Scheme, 2011. Source: http://www.watercorporation.com.au/-/media/files/teachers/posters/iwss-water-supply-map.pdf?la=en%20%3E

CRC for Water Sensitive Cities | 51
Conclusion Underlying the availability and provision of a water supply for Perth are specific climatic and environmental conditions. In a warm temperate climate such as Perth’s, most rainfall occurs in winter, summers are hot and dry. There is a chain of wetlands on the coastal plain but the soil is generally sandy. In this context, European settlement had unintended consequences. The draining of wetlands to accommodate the emerging town of Perth compromised natural drainage, and reliance on wells sunk near cesspits in sandy soils in both Perth and Fremantle led to frequent outbreaks of disease during the nineteenth century.
The discovery of gold in the late 1880s led to the quadrupling of Perth’s population over a decade and rapid suburban development. Water supplies were soon inadequate. A reservoir, east of the city in the Darling Ranges, was completed in 1891 by private enterprise, but was soon taken over by local government. Neither was able to provide a pure or reliable water supply. Disease followed with typhoid reaching epidemic proportions. Under pressure in the midst of a water crisis, the State Government took over the water supply in 1896. Reliance on artesian bores to supplement hills water increased and Perth’s first water restrictions were implemented.
Sewage disposal by local government was not introduced until the 1890s and the State Government’s first sewerage treatment works were not in operation until 1906. But sewerage connections lagged behind population growth. In 1921 less than half of Perth dwellings were sewered and the rest relied on septic tanks, a pattern which has continued.
Following WWI, continued population growth showed the inadequacy of existing supplies and services. Popular pressure during another water crisis in the 1920s led to the government’s decision to build a series of dams under the rubric of ‘The Hills Water Supply Scheme’. With the completion of Canning Dam in 1940, facilitated by cheap labour during depression, Perth now had a reliable, affordable water supply. This achievement, however, facilitated the development of a suburban culture of profligate water use, particularly outside the home. In the context of low-density suburban development and cheap water supply, gardens accounted for over half of all water use, rising to 70 per cent in summer. Water use patterns were essentially unchanged by periodic water restrictions and voluntary water conservation schemes.
Strongly pro-development state governments saw an important role for the state in economic development and equated large engineering schemes with progress. They looked first to dams to meet projected increases in industrial and domestic demand for water. But sustained and rapid urban growth combined with declining rainfall saw even an ambitious and well-funded programme of source development fail to keep up with domestic and industrial demand for water.
Federal funding assisted in the expansion of sewerage in the early 1970s, but half of all dwellings were still without sewerage when the funding ceased. The state government soon compelled developers to provide reticulated sewerage in all new subdivisions. From the early 1990s, government accelerated its efforts to sewer Perth’s northern suburbs to keep pace with suburban growth. Many Perth properties remained reliant on septic tanks and this has hindered urban consolidation.
The impact of a user pays system for water (introduced in 1978) lasted into the 1980s but, by the end of the decade, charges no longer provided sufficient incentive to reduce water use. To curb demand and delay the development of additional water supplies, a moderate level of restrictions was introduced in 1994. But the total sprinkler ban introduced in 1978 continued to influence water demand management so that this measure has not been used since, despite ‘crisis’ conditions in the early 2000s and the ongoing drying trend.
Groundwater has become an increasingly important source of water supply for Perth, particularly as the drying trend reduces the effectiveness of surface water supplies (dams). Private bores were subject to restriction for the first time in 2010, reflecting growing community concern about the impact of bores on groundwater supplies and their quality. As Perth faced its second driest winter on record, applying restrictions to bores suggested an attempt to impose a more uniform program of water restrictions on Perth households. Since then, urban growth along the Swan Coastal Plain has put further stress on groundwater supplies and water managers predict demand will exceed water supplies by 2020.

52 | Water, history and the Australian city
Although total demand continues to grow, the demand for water responded to water restrictions and public education campaigns in the early 2000s. The water ‘crisis’ of those years prompted ambitious source development, focused on reverse osmosis seawater desalination, with the state government and the Water Corporation seeing this technology as central to their vision of climate independence and secure water supplies.
Water provision and use in Perth has been shaped by a range of environmental, economic, political and cultural features. From very early in the city’s development, however, there has been a sustained focus on securing water supply, with less attention given to both demand management and sewerage. The building of a dam, or indeed a high-tech desalination plant, has been more visible and heroic than providing for wastewater disposal (or reuse) or producing workable frameworks for equitably sharing a finite resource.

CRC for Water Sensitive Cities | 53
While we believe Australians will be unlikely to significantly modify their long-held dwelling preferences, they will likely respond to a range of incentives to change their water use practices. As we have shown throughout this report, urban Australians have long demonstrated a willingness to adapt their water usage in the face of drought and other such water crises. In reviewing the development of the management of water in these three cities, and especially in the development of reticulation and storage systems, we note the importance of the engineering profession in often both providing or calibrating the hydrological data and making recommendations for storage reservoirs and new dams. Until the 1980s most of their recommendations, with the exception of governments purchasing flood prone land, were implemented, usually with bipartisan political support. Few public policy-professionals questioned the wisdom of building new dams, and even fewer suggested that householders could manage what water they had more wisely.
But while planners and policy-makers embarked on ever-larger engineering solutions to water-availability issues, the historical record shows that ordinary citizens have always willingly adapted to exhortations to curtail usage or adopt more sustainable water practices for the duration of water crises, such as droughts. Financial incentives in the form of price signals and user charges have clearly been important in achieving changes in water use practices over time, but as we have seen in each of our case studies here so too have public education campaigns and decisions to trust the peoples’ sense of civic duty and responsibility to their fellow citizens been important drivers of major reductions in consumption and wastage.
The experiences of Australian cities during numerous droughts and other water crises over more than two centuries suggests that such successes and the lessons learnt are soon forgotten or abandoned when ‘normal’ conditions return. In a future with a likely new normal of lower rainfall, abandoning these policies and forgetting these lessons is no longer an option. As historians with an interest in the urban and wider environment, and as citizens with a personal stake in a better future, we are strongly of the view that good public policy in the area of water-use (as in all others) must be historically-informed in order that the lessons of the past inform and influence practice in the present and into the future.
Conclusion: urban water sensitivity Almost 230 years after the founding of modern Australia, cities and urban areas remain the dominant sites of population settlement and growth and key drivers of the state and national economies. As in the nineteenth century rural and regional Australia remain important sources of export income derived from mineral resources and agricultural goods, but the cities are increasingly linked into the global economy as entrepots for ideas and value-added financial services, education, biotechnological and cultural endeavours. As gateways to the nation they are also overwhelmingly the sites of first settlement for immigrants and short-term visitors. Enhancing the efficiency and productivity of the cities thus remains an important task for policy-makers and citizens. So too does the need to ensure that the growing cities remain environmentally and hydrologically sustainable.
In documenting the histories and stories of adaptation to water availability and scarcity in three key cities and in Australia more generally we have suggested that rather than seek to impose new, and allegedly more water sensitive morphological forms onto the existing city, future planners and policy makers should seek to understand why Australians have chosen to live as they have and do and work with them to improve water usage outcomes in the cities as they are rather than as they might be. Rather than seek to change ideas and attitudes that have deep historical and cultural roots, adaptation rather than imposition will, we argue, be much more likely to have a successful and lasting impact on behaviours around water usage and sensitivity. While there is no question that Australia’s cities need to become more water sensitive and less wasteful of this likely declining resource, we believe it highly unlikely that Australian families will give up their revealed preferences for low-density modes of living without a fight. Suburbia and the ‘lifestyle’ that it affords is intrinsic to Australians’ understandings of themselves, and has been for numerous generations now. As we have shown throughout this report the ways in which Australians live today reflects powerful historical and cultural ideas and path-dependencies that will likely be very hard to shift – should we even want to. The forms and structures that our cities take today were largely laid out from their earliest years. Our sense as historians of those cities is that future water-sensitivity and environmental sustainability will need to adapt to the lived realities of these cities as they are or could be, rather than as they might have been had their histories been somehow different.
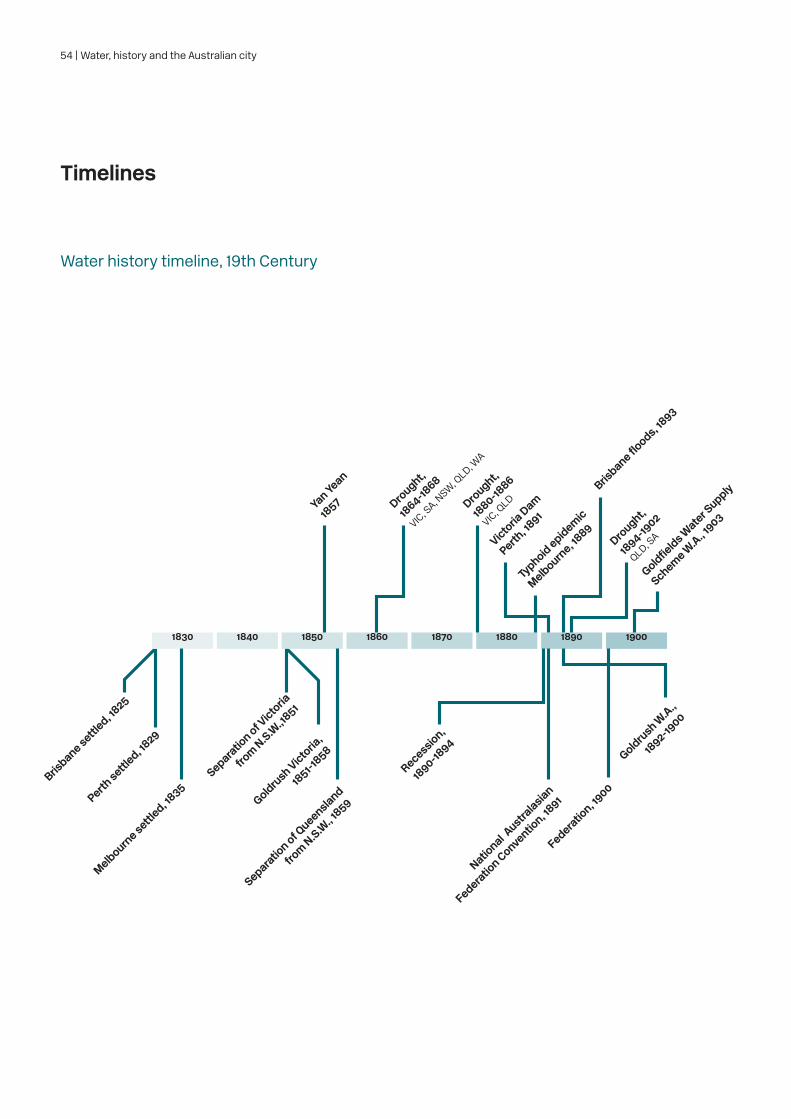
54 | Water, history and the Australian city
Timelines
Water history timeline, 19th Century
1830 1860 18901840 1870 19001850 1880
Perth settl
ed, 1829
Brisbane settl
ed, 1825
Separation of V
ictoria
from N.S.W
.,1851
Goldrush Victoria
,
1851-1
858
Melbourne settl
ed, 1835
Victoria Dam
Perth, 18
91
Typhoid epidemic
Melbourne, 18
89
Goldfields Water S
upply
Scheme W.A., 1
903Dro
ught,
1864-18
68
VIC, SA, N
SW, QLD, W
A
VIC, QLD
QLD, SA
Drought,
1880-18
86
Yan Yean
1857
Drought,
1894-19
02
Brisbane floods, 18
93
Separation of Q
ueensland
from N.S.W
., 1859
Recession,
1890-18
94Goldru
sh W.A.,
1892-19
00
Federation, 19
00
National A
ustralasian
Federation Conventio
n, 1891

CRC for Water Sensitive Cities | 55
NSW, QLD, V
ICVIC, W
A
VIC, WA, Q
LD
VIC, WA
QLD, VIC, W
A
VIC
Water history timeline, 20th and 21st Century
1910 1940 1970 20001920 1950 1980 20101930 1960 1990
World W
ar I,
1914
-18
Depression,
1929-3
9
World W
ar II,
1939-4
5
Drought,
1918
-20
Drought,
1911-
16
Drought,
1976-79
Silvan Reservoir
Melbourne, 19
32
Canning Dam
Perth, 19
40 South Dandalup
Dam Perth, 19
73
Cardinia
Reservoir
Melbourne,
1973
Thomson Dam
Melbourne, 19
84
Wivenhoe Dam
Brisbane, 19
85
Desalinatio
n Plant
Brisbane, 2
009
Desalinatio
n Plant
Perth, 2
005
Desalinatio
n Plant
Melbourne, 2
012
Drought,
1937-4
7Dro
ught,
1965-6
8Dro
ught,
1982-8
7Dro
ught,
1995-2010
Vietnam W
ar,
1962-75
1st Oil S
hock,
1973
1st Gulf W
ar,
1991
Recession,
1990-9
3
2nd Gulf War,
2003-2011
Global Financial
Crisis, 2
007

56 | Water, history and the Australian city
References
Introduction1 Graeme Davison, “Australia the First Suburban Nation?”, Journal of Urban History 22 (1), 1995: 40-74; Tony Dingle and Andrew Brown-May,”Yarra River,” in The Encyclopedia of Melbourne, eds. Andrew May, Graeme Davison, and Shurlee Swain (Melbourne: Cambridge University Press, 2005).
2 This data on the populations, size and density of Australian cities at the time of the 2011 Census is derived from: Australian Bureau of Statistics,”2011 Census Quickstats”,http://www.abs.gov.au/websitedbs/censushome.nsf/home/quickstats?opendocument&navpos=220. Accessed on: August 19, 2015.
3 On the population and density of Greater Vancouver see: Statistics Canada,”Census Metropolitan Area of Vancouver”,https://www12.statcan.gc.ca/census-recensement/2011/as-sa/fogs-spg/Facts-cma-eng.cfm?LANG=Eng&GK=CMA&GC=933. Accessed on: August 19, 2015.
4 Lionel Frost, The New Urban Frontier: Urbanisation and City-Building in Australasia and the American West (Sydney: University of New South Wales Press, 1991).
Part One1 The most comprehensive analysis of Brisbane in the 20th century remains John R. Cole, Shaping a City: Greater Brisbane 1925-1985 (Brisbane: William Brooks, 1984). It is drawn on throughout this article. Other major sources include entries in the Queensland Historical Atlas website, qhaltas.com.au.
2 Ibid.
3 Peter Spearritt, ed. Seeing Brisbane: 1881-2001 (Brisbane: The Brisbane Institute, 2002), 31-46.
4 Raymond Evans, A History of Queensland (Melbourne: Cambridge University Press, 2007).
5 Luke Keogh and Peter Spearritt,”Where Did the Trams Go”,http://www.qhatlas.com.au/where-did-trams-go. Accessed on: August 19, 2015.
6 Peter Spearitt,”Suburban Cathedrals: The Rise of the Drive-in Shopping Centre,” in The Cream Brick Frontier, eds. Graeme Davison, Tony Dingle, and Seamus O’Hanlon, Monash Publication in History (Melbourne: Monash University Publishing, 1995).
7 Cole, Shaping a City, 193-289.
8 See regular newsletters issued by Councillor Helen Abrahams, Gabba Ward, Brisbane City Council, 2013-15
9 Rod Fisher, ‘Nocturnal demolitions: the long march towards heritage legislation in Queensland, in J.Rickard and P.Spearritt eds, Packaging the Past?,(Melbourne University Press, 1991)
10 These issues are canvassed in a number of chapters in B.Gleeson and W.Steele eds., in A Climate for Growth: Planning South-East Queensland (Brisbane, University of Queensland Press, 2010)
11 The best document on the river remains P.Davie et.al.eds., The Brisbane River: source book for the future, (Brisbane: Queensland Museum) 1990 which includes an analysis of water quality, bridges, water front development and the social geography of settlement.

CRC for Water Sensitive Cities | 57
12 Ian Webster Morley, Black Sands: A History of the Mineral Sand Mining Industry in Eastern Australia (Brisbane: University of Queensland Press, 1981).
13 Peter Spearritt, “The 200 Km City: Brisbane, the Gold Coast, and the Sunshine Coast”, Australian Economic History Review 49 (1), 2009.
14 Peter Spearritt,”The Water Crisis in Southeast Queensland: How Desalination Turned the Region into Carbon Emission Heaven,” in Troubled Waters: Confronting the Water Crisis in Australia’s Cities, ed. Patrick Troy (Canberra: Australian National University Press, 2008); Ruth Morgan, Running Out? Water in Western Australia (Perth: University of West Australia Publishing, 2015).
15 Figures supplied by Brisbane City Council water division, October 2007. Figures on water meters prior to 1990 from Brisbane City Council archives, including Brisbane Statistics and Brisbane Yearbooks
16 Virginia Rigney, Sold!: The Gold Coast Real Estate Dream (Surfers Paradise: Gold Coast City Art Gallery, 2006).
17 Spearritt, “The Water Crisis in Southeast Queensland”, 18-36.
18 See the extensive discussion in attitudes to garden watering in Perth in: Morgan, Running Out?
19 Queensland Audit Office, Maintenance of Water Infrastructure Assets (Brisbane: Queensland Audit Office, 2013).
20 Owen Powell,”Brisbane Floods: 1893 to the Summer of Sorrow”,http://qhatlas.com.au/brisbane-floods-1893-summer-sorrow. Accessed on: August 19, 2015; Margaret Cook,”Did Clem Jones Save Brisbane from Flood?”,http://qhatlas.com.au/did-clem-jones-save-brisbane-flood. Accessed on: August 19, 2015; Luke Keogh,”City of the Damned: How the Media Embraced the Brisbane Floods”,http://qhatlas.com.au/city-damned-how-media-embraced-brisbane-floods. Accessed on: August 19, 2015.
Part Two1 Davison, “First Suburban Nation”.
2 Mark Twain and R.G. Robertson, Mark Twain in Australia and New Zealand (New York: Penguin, 1973), 161.
3 Graeme Davison,”Gold-Rush Melbourne,” in Gold: Forgotten Histories and Lost Objects of Australia, eds. Iain McCalman, Alexander Cook, and Andrew Reeves (New York: Cambridge University Press, 2001), 52.
4 Gunther Barth, Instant Cities: Urbanization and the Rise of San Francisco and Denver (New York: Oxford University Press, 1975); James Belich, Replenishing the Earth: The Settler Revolution and the Rise of the Anglo-World (New York: Oxford University Press, 2011).
5 Lionel Frost, “‘Metallic Nerves’: San Francisco and Its Hinterland During and after the Gold Rush”, Australian Economic History Review 50 (2), 2010: 131.
6 James Viggers, Haylee Weaver, and David Lindenmayer, Melbourne’s Water Catchments: Perspectives on a World-Class Water Supply (Collingwood: CSIRO, 2013), 3.
7 Robert David La Nauze, Engineer to Marvellous Melbourne: The Life and Times of William Thwaites (North Melbourne: Australian Scholarly Publishing, 2011).; Tony Dingle and Helen Doyle, Yan Yean: A History of Melbourne’s Early Water Supply (Melbourne: Public Record Office, 2003).
8 Dingle and Doyle, Yan Yean.
9 Argus, September 22, 1848.
10 “Report of the City Surveyor, No. 40,” The Argus, May 26 1851.

58 | Water, history and the Australian city
11 La Nauze, Engineer to Marvellous Melbourne.
12 Tony Dingle and Carolyn Rasmussen, Vital Connections: Melbourne and Its Board of Works, 1891-1991 (Ringwood: McPhee Gribble, 1991).
13 Tony Dingle,”Floods and Drainage “ in The Encyclopedia of Melbourne, ed. Andrew May, Davison, Graeme, Swain, Shurlee (Melbourne: Cambridge University Press, 2005), 274.
14 Bernard Barrett, The Inner Suburbs: The Evolution of an Industrial Area (Carlton: Melbourne University Press, 1971).
15 Quoted by Dingle and Brown-May, “Yarra”, 788.
16 Lionel Frost,”Urbanisation,” in The Cambridge Economic History of Australia, eds. Simon Ville and Glenn Withers (Cambridge: Cambridge University Press, 2014).
17 Noel George Butlin, Investment in Australian Economic Development, 1861-1900 (Cambridge: Cambridge University Press, 2013); Nicholas Brown,”Making Oneself Comfortable, or More Rooms Than Persons,” in A History of European Housing in Australia, ed. Patrick Troy (Cambridge: Cambridge University Press, 2000), 107-124.
18 Graeme Davison, The Rise and Fall of Marvellous Melbourne (Carlton: Melbourne University Press, 2002).
19 Quoted by Lionel Frost, The New Urban Frontier, 147-148.
20 Calculated from data in the Victorian Statistical Registers. See also: Tony Dingle, Settling (Sydney: Fairfax, Syme & Weldon Associates, 1984), 164; Frost, The New Urban Frontier, 151. W. A. Sinclair, “Economic Growth and Well-Being: Melbourne 1870-1914”, Economic Record 51 (134), 1975: 154.
21 David Dunstan, Governing the Metropolis: Politics, Technology and Social Change in a Victorian City: Melbourne, 1850-1891 (Carlton: Melbourne University Press, 1984).
22 Frost, The New Urban Frontier, 26-27.
23 La Nauze, Engineer to Marvellous Melbourne.
24 Dingle and Rasmussen, Vital Connections, 29.
25 Ibid.
26 Sinclair, “Economic Growth”.
27 Asa Briggs, Victorian Cities, vol. 2 (Los Angeles: University of California Press, 1965), 21.
28 D. T. Merrett, “Economic Growth and Well-Being: Melbourne 1870-1914: A Comment”, Economic Record 53 (142&143), 1977: 262-271.
29 Frost, The New Urban Frontier, 139-145.
30 Dingle and Brown-May, “Yarra”.
31 Dingle and Rasmussen, Vital Connections, 120.
32 Metropolitan Town Planning Commission, Plan of General Development: Report of the Metropolitan Town Planning Commission (Melbourne: Metropolitan Town Planning Commission, 1929), 25.
33 On the development of the La Trobe Valley and the State Electricity Commission at this time see: Meredith Fletcher, Digging People up for Coal: A History of Yallourn (Carlton: Melbourne University Press, 2002).
34 Peter Cuffley, Australian Houses of the Twenties & Thirties (Melbourne: Five Mile Press, 1993), 17.

CRC for Water Sensitive Cities | 59
35 Unless otherwise stated this and the following information on dam building in the 1920s and 1930s comes from: Melbourne Water Melbourne Water,”History of Our Water Supply System”,http://www.melbournewater.com.au/aboutus/historyandheritage/History-of-our-water-supply-system/Pages/history-of-our-water-supply-system.aspx. Accessed on: August 19, 2015.
36 Dingle and Rasmussen, Vital Connections, 160.
37 For the history of the AV Jennings company see: Donald Stuart Garden, Builders to the Nation: The AV Jennings Story (Carlton: Melbourne University Press, 1992).
38 On the impact of technological change on domestic water consumption in Australia see Graeme Davison,”Down the Gurgler: Historical Influences on Australian Domestic Water Consumption,” in Troubled Waters: Confronting the Water Crisis in Australia’s Cities, ed. Patrick Troy (Canberra: Australian National University Press, 2008), 37-65; On the development of flats in the interwar years see: Seamus O’Hanlon, Together Apart: Boarding House, Hostel and Flat Life in Pre-War Melbourne (Melbourne: Australian Scholarly Publishing, 2002).
39 Dingle and Rasmussen, Vital Connections, 400.
40 On the national postwar housing shortage see: Commonwealth Housing Commission, Final Report, 25th August 1944 (Ministry of Post-war Reconstruction, 1944). On efforts to overcome the shortages see: Tony Dingle and Seamus O’Hanlon,”Modernism Versus Domesticity: The Contest to Shape Melbourne’s Homes, 1945-1960,” in The Forgotten Fifties: Aspects of Australian Society and Culture in the 1950’s, eds. John Murphy and Judith Smart (Melbourne: Melbourne University Press, 1997), 107-118; Patrick Troy, Accommodating Australians: Commonwealth Government Involvement in Housing (Annandale: The Federation Press, 2012). On postwar reconstruction more generally see: Stuart Macintyre, Australia’s Boldest Experiment: War and Reconstruction in the 1940s (Sydney: NewSouth, 2015).
41 Dingle and Rasmussen, Vital Connections, 216.
42 Graeme Davison, Car Wars: How the Car Won Our Hearts and Conquered Our Cities (Crows Nest: Allen & Unwin, 2004), 26.
43 On the Modernist influences on the planning and design of Monash University see: Graeme Davison and Kate Murphy, University Unlimited: The Monash Story (Crows Nest: Allen & Unwin, 2012).
44 Dingle and Rasmussen, Vital Connections, 368.
45 Melbourne Water, Water Outlook for Melbourne (Melbourne: Melbourne Water, 2013), 2.
46 Lin Crase, Nicholas Pawsey, and Bethany Cooper, “The Closure of Melbourne’s North-South Pipeline: A Case of Hydraulic Autarky”, Economic Papers 33 (2), 2014: 117.
47 Information on the uses and costs of the Wonthaggi desalination plant comes from Melbourne Water,”Desalination”,http://www.melbournewater.com.au/whatwedo/supply-water/Pages/Desalination.aspx Accessed on: August 19, 2015. Age March 27, 2014
Part Three1 Directions 2031 plans for a 50 per cent increase in the current average residential density 10 dwellings per gross urban zoned hectare; and, has set a target of 15 dwellings per gross urban zoned hectare of land in new development areas.
2 Hugo Bekle, “The Wetlands Lost: Drainage of the Perth Lake Systems”, Western Geographer June, 1981: 23-24.
3 Western Australian Times, January 18, 1878, 2; Inquirer, January 23, 1878, 3.
4 Report of the Commission Appointed to Inquire into and Report Upon the Sanitary Condition of the City of Perth and the Town of Fremantle: Especially with Regard to the Questions of Water Supply and the Disposal of Sewage, (Perth: Government Printer, 1885).

60 | Water, history and the Australian city
5 Geoffrey Bolton and S.J. Hunt, “Cleansing the Dunghill: Water Supply and Sanitation in Perth 1878-1912”, Studies in Western Australian History 2, 1978: 5,10.
6 The first advertisements for corrugated iron tanks in the daily newspapers include: Daily News, November 10, 1891, 3; Daily News, February 28 1893, 4.
7 H. E Hunt, Perth’s Early Water Supplies (Perth: W.A. Division, Institution of Engineers Aust, 1984), 7-8.
8 Water-Works Act (Victoria 53 1889 No. 13), 6-7.
9 Institution of Engineers Australia. Western Australia Division. Engineering Heritage Sub-Committee, Perth’s First Public Water Supply Scheme (Perth: Institution of Engineers Australia, 2012), 32.
10 Bolton and Hunt, “Cleansing the Dunghill”: 12; Tom Stannage, The People of Perth: A Social History of Western Australia’s Capital City (Perth: Perth City Council, 1979), 275-276.
11 Bolton and Hunt, “Cleansing the Dunghill”: 12-13. Stannage, People of Perth, 275-276.
12 West Australian, January 14, 1897, 5.
13 Daily News, January 20, 1897.
14 K.J. Kelsall, A Brief History of Perth Water Supply: 1829-1985 (Perth: Water Corporation, 2005), 10.
15 Ann Brake,”Golden Pipeline “ in Historical Encyclopedia of Western Australia, eds. Jenny Gregory and Janice Gothard (Nedlands: University of Western Australia Press, 2009); Richard G Hartley, River of Steel: A History of the Western Australian Goldfields and Agricultural Water Supply 1895-2003 (Bassendean: Access Press, 2007); Vera Whittington, Gold and Typhoid. Two Fevers (Nedlands: Universityof Western Australia Press 1986).
16 Hartley, River of Steel, 85.
17 S.J. Hunt, Water, the Abiding Challenge (Perth: Metropolitan Water Board, 1980), 63.
18 Hunt, Perth’s Early Water Supplies, 19.
19 E.G. Ritchie, Report on Question of Augmenting the Water Supply to the Metropolitan Area (Perth: unpublished typescript, 1920).
20 West Australian, January 23, 1922, 6; Kelsall, Brief History of Perth Water Supply, 12; Bolton and Hunt, “Cleansing the Dunghill”: 15.
21 West Australian, March 16, 1923, 8.
22 Sunday Times, February 24, 1924, 1.
23 A. Lovekin, Report of the Select Committee of the Legislative Council Appointed to Inquire into the Operations of the Metropolitan Water Supply, Sewerage and Drainage Department (Perth: Government Printer, 1924).
24 Jenny Gregory,”The Opening of Canning Dam,” in Celebrations in Western Australian History, eds. L. Layman and T. Stannage, Studies in Western Australian History (Nedlands: Centre for Western Australian History, Dept. of History, University of Western Australia, 1989).
25 Sunday Times, September 8, 1940, 7.
26 Katie Holmes,”In Her Master’s House and Garden,” in A History of European Housing in Australia, ed. Patrick Troy (Cambridge: Cambridge University Press, 2000), 164; Katie Holmes,””In Spite of It All, the Garden Still Stands”: Gardens, Landscape and Cultural History,” in Cultural History in Australia, eds. H.M. Teo and R. White, In Spite of It All, the Garden Still Stands (Sydney: University of New South Wales Press, 2003), 184; K. R. Freestone,”Planning, Housing, Gardening: Home as a Garden Suburb,” in A History of European Housing in Australia, ed. Patrick Troy (Canbridge: Cambridge University Press, 2000), 133.

CRC for Water Sensitive Cities | 61
27 S.J. Hunt, A History of Water Supply, Sewerage and Drainage in Metropolitan Perth (Perth: Metropolitan Water Supply, Sewerage and Drainage Board, 1979).
28 Ruth Barton, “Household Technology in Western Australia 1900-1950”, Oral History Association of Australia Journal (7), 1985: 111-112.
29 Restrictions were also imposed when the Canning Dam’s concrete contour channel collapsed in 1950.
30 Ruth Morgan, “Running Out? An Environmental History of Climate and Water in the Southwest of Western Australia, 1829 to 2006” (PhD Thesis, University of Western Australia, 2012), 185.
31 F. Devine, ‘Water – it’s a question of getting it’, West Australian, October 2, 1959, 4; see also ‘Well, well, well’, Daily News, 2 October 2, 1959, 1. Both cited in Ruth Morgan, “A Thirsty City: An Environmental History of Water Supply and Demand in 1970s Perth, Western Australia”, Studies in Western Australian History 27, 2011: 21.
32 ‘My Idea’, letter, Daily News, October 5,1959, 4. See also for example M. Shaw, ‘Restrict use of sprinklers now’, Daily News, September 8,1959, 8; C. Hillary, ‘Make the best of water cuts’, West Australian, October 8,1958, 6; G. Wilson, letter, West Australian, April 6,1960, 6; Save Water, letter, Daily News, October 6,1959, 4. All cited in Morgan, ‘Thirsty City’, 23.
33 Sarah Brown, “‘Imagining ‘Environment’ in Australian Suburbia: An Environmental History of the Suburban Landscapes of Canberra and Perth, 1946‐1996’” (PhD Thesis, University of Western Australia, 2008), 101.
34 L. Layman, ‘Development Ideology in Western Australia, 1933-1965’, Historical Studies 79, 1982: 234-260.
35 G. Stephenson and J.A. Hepburn, Plan for the Metropolitan Region, Perth and Fremantle, Western Australia, 1955: A Report Prepared for the Government of Western Australia (Perth: Government Printer, 1955), 53.
36 ‘Large automatic washing machines’, Choice, 17, 10, 1976, 312. Cited in Morgan, “A Thirsty City”: 83.
37 B. Bunbury, Till the Stream Runs Dry: A History of Hydrography in Western Australia (Perth: Government of Western Australia, Department of Water, 2010), 23.
38 Hunt, History of Water Supply, 164.
39 Brown, “Imagining Environment”, 159.
40 ‘Water Technologies - Surface Water Schemes - Dams - South Dandalup Dam - South Dandalup Dam Storage Volume’, spreadsheet received from Water Corporation via email, January 22, 2015.
41 J.M. Powell, Watering the Western Third: Water, Land and Community in Western Australia, 1826-1998 (Perth: Water and Rivers Commission, 1998), 65; Ruth Morgan,”Our Most Precious Mineral: Water for Perth, Western Australia, in the 1970s Resource Boom,” in Urban Transformations: Proceedings of the 11th Urban History Planning History Conference, eds. J. J. Gregory, A. Gaynor, and S. McQuade (Perth: University of Western Australia), 180,183.
42 Morgan, “A Thirsty City”: 83-84.
43 Ibid., 89-90.
44 See for example I. M. James, ‘Water supply’, West Australian, December 13, 1957, 6; E. Irwin, ‘Ways to save water’, West Australian, October 21, 1976, .43; K. M. Bradshaw, letter, West Australian, July 16, 1977, 6. The Public Health Department’s response is detailed in ‘Danger seen in reusing water’, West Australian, December 2, 1977, 16. All cited in Morgan, “Thirsty City”: 42.
45 R.J. Edmiston and B.J. Beggs, Planning Your Garden to Conserve Water (Perth: Forests Department of Western Australia, 1977).
46 T. Hogan, ““Nature Strip”: Australian Suburbia and the Enculturation of Nature”, Thesis Eleven 74, 2003: 56.
47 Metropolitan Water Authority, Domestic Water Use in Perth, Western Australia (Leederville: Metropolitan Water Centre, 1985), 65.
62 | Water, history and the Australian city
48 Sewerage and Drainage Board Metropolitan Water Supply, Annual Report (Perth: Metropolitan Water Supply, Sewerage and Drainage Board, 1977), 6.
49 G.J. Syme, S.J. Kantola, and J.F. Thomas,”Water Resources and the Quarter-Acre Block,” in People and the Man Made Environment, eds. R. Thorne and S.J. Arden (Sydney: University of Sydney, 1989), 183. Binnie International (Australia), Development Study (Leederville: Metropolitan Water Supply, Sewerage and Drainage Board, 1977), 45-46.
50 Metropolitan Water Authority, Domestic Water Use, 13,40,63.
51 Morgan, Running Out?, 123-124,139-140.
52 Perth’s northern suburbs had extended along the Swan Coastal Plain in accordance with the 1970 Corridor Plan. The Metropolitan Region Planning Authority had adopted this plan in 1970 as the basis for future planning of the Perth Metropolitan Region. S. McQuade, “Shaping Perth’s Suburban Landscapes: Post-1970s Suburban Planning and Development”, Studies in Western Australian History 27, 2011: 186.
53 C. Lloyd,”Water, Sewerage and Drainage,” in Technological Change and the City, ed. Patrick Troy (Sydney: Federation Press, 1995), 73; C.D. Hedgcock and M. Mouritz,”Water Sensitive Residential Design: A Vision for a Browner City?,” in A Vision for a Greener City: 1994 National Greening Australia Conference, ed. M.A. Scheltema (Canberra: Greening Australia, 1994), 143; T.H.F. Wong, “Water Sensitive Urban Design - the Journey Thus Far”, Australian Journal of Water Resources 10 (3), 2006: 213-222.
54 I. Alexander and Western Australian Planning Commission,”Report of the Select Committee Appointed to Inquire into Effluent Disposal in the Perth Metropolitan Region, Western Australia”, WA Legislative Assembly, http://www.planning.wa.gov.au/dop_pub_pdf/pb07Nov1995.pdf. Accessed on: August 24 2015
55 Water Corporation, Subiaco Wastewater Treatment Plant (Subiaco: Water Corporation, 2009); Water Authority, Wastewater 2040: Issues Paper (Leederville: Water Authority, 1995); Water Corporation, Woodman Point Wastewater Treatment Plant (Subiaco: Water Corporation, 2009); Water Corporation, Beenyup Wastewater Treatment Plant (Subiaco: Water Corporation, 2009).
56 Western Australian Planning Commission,”Government Sewerage Policy Perth Metropolitan Region”,http://www.planning.wa.gov.au/dop_pub_pdf/pb07Nov1995.pdf. Accessed on: August 24, 2015; Western Australian Planning Commission,”Government Sewerage Policy: Perth Metropolitan Region’”,http://www.planning.wa.gov.au/dop_pub_pdf/pb07Nov1995.pdf. Accessed on: April 1, 2015; Office of Waste Management,”Government Sewerage Policy: Perth Metropolitan Region”, WA Office of Waste Management, http://www.public.health.wa.gov.au/cproot/1355/2/Government_Sewerage_Policy-Perth_Metropolitan_Region.pdf. Accessed on: July 28 2015.
57 Morgan, Running Out?, 160.
58 Ibid., 161-162.
59 D. J McFarlane et al., An Integrated Supply Demand Planning (ISDP) Model for Perth Client Report to WA Government (Canberra: CSIRO 2006), 19.
60 Morgan, Running Out?, 166.
61 Water Corporation, Annual Report for the Year Ended 30th June 2000 (Leederville: Water Corporation, 2000), 27.
62 Australian Academy of Technological Sciences and Engineering, Perth’s Water Balance: The Way Forward (Melbourne: Australian Academy of Technological Sciences and Engineering, 2002), 11.
63 Australian Bureau of Statisics,” ‘Water Choices of Perth Households’, Western Australian Statistical Indicators, 2010, No.1367.5, “ Australian Bureau of Statisics, http://www.abs.gov.au/ausstats/[email protected]/Latestproducts/1367.5Feature%20Article82010?opendocument&tabname=Summary&prodno=1367.5&issue=2010&num=&view=. Accessed on: April 1, 2015.
64 G. Seddon, Landprints (Oakleigh: Cambridge University Press, 1997), 105.
65 T. Hall, The Life and Death of the Australian Backyard (Collingwood: CSIRO, 2010), 41-72, 88, 116-119.
CRC for Water Sensitive Cities | 63
66 Cited in Tim Kurz et al., “The Ways That People Talk About Natural Resources: Discursive Strategies as Barriers to Environmentally Sustainable Practices”, British Journal of Social Psychology 44 (4), 2005: 609.
67 D. McFarlane, Context Report on South West Water Resources (Canberra: CSIRO, 2005), 69.
68 John Marsden and Phil Pickering, Securing Australia’s Urban Water Supplies: Opportunities and Impediments (Camberwell: Marsden Jacob Associates, 2006); Water Corporation, Source Development Plan 2005-2050: An Overview (Perth: Water Corporation, 2005 ), 3.
69 C. Barnett,”Premier Says Desal with “Drought-Proof” Perth”, Australian Broadcasting Corporation http://www.abc.net.au/news/2013-01-23/second-stage-of-desalination-plant-opened/4480588/?site=southwestwa Accessed on: July 28, 2015.
70 Water Corporation, Water Forever, Whatever the Weather (Leederville: Water Corporation, 2013).
71 Bureau of Meteorology,”Perth Water Resources and Systems”,http://www.bom.gov.au/water/nwa/2012/perth/notes/waterresourcesandsystems.shtml#Urban_water_system. Accessed on: July 28, 2015.
72 T. Redman cited in M. Hopkin,”Recycled Waste Water Gets Go-Ahead in Perth”, WA Today, http://www.watoday.com.au/wa-news/recycled-waste-water-gets-goahead-for-perth-20130801-2r10k.html. Accessed on: July 28, 2015.
73 W. Steffen,”Thirsty Country: Climate Change and Drought in Australia “, Climate Council, https://www.climatecouncil.org.au/droughtreport2015. Accessed on: April 10, 2015.

[email protected] www.watersensitivecities.org.auLevel 1, 8 Scenic BoulevardMonash UniversityClayton VIC 3800
Cooperative Research Centre for Water Sensitive Cities