water loss bmp revision jim metropulos andrew chastain-howley
TRANSCRIPT
Water Loss BMP RevisionWater Loss BMP RevisionWater Loss BMP RevisionWater Loss BMP Revision
Jim MetropulosAndrew Chastain-Howley
BMP 1.2 Proposal HighlightsBMP 1.2 Proposal Highlights
• Goal is improvement measured by reduction in water loss per connection
• Benchmarking exercise in fifth year to determine a specific ‘meet or exceed’ water loss target
BMP 1.2 BMP 1.2 A.ImplementationA.Implementation
• Standard Water Balance• Validation (4 years) - Using Data
Grading• Economic Values• Component Analysis• Interventions - to Reduce Losses (M36)• Customer Leak Policy
BMP 1.2 BMP 1.2 B. ImplementationB. Implementation
• Agencies with MOU before Dec 31, 2008– Implement Before July 1, 2009
• Others– Implement by one year after signing MOU
• Benchmark Water Loss PI’s (after first 4 years of data)

BMP 1.2 BMP 1.2 C. Coverage RequirementsC. Coverage Requirements
• Audit Using AWWA Software. Test source and production meters
• Improve data accuracy to level IV using software grading.
• Seek Training• Years 5 to 10 - Show progress in water
loss control• Repair all reported leaks and breaks• Proactively search and repair unreported
leaks
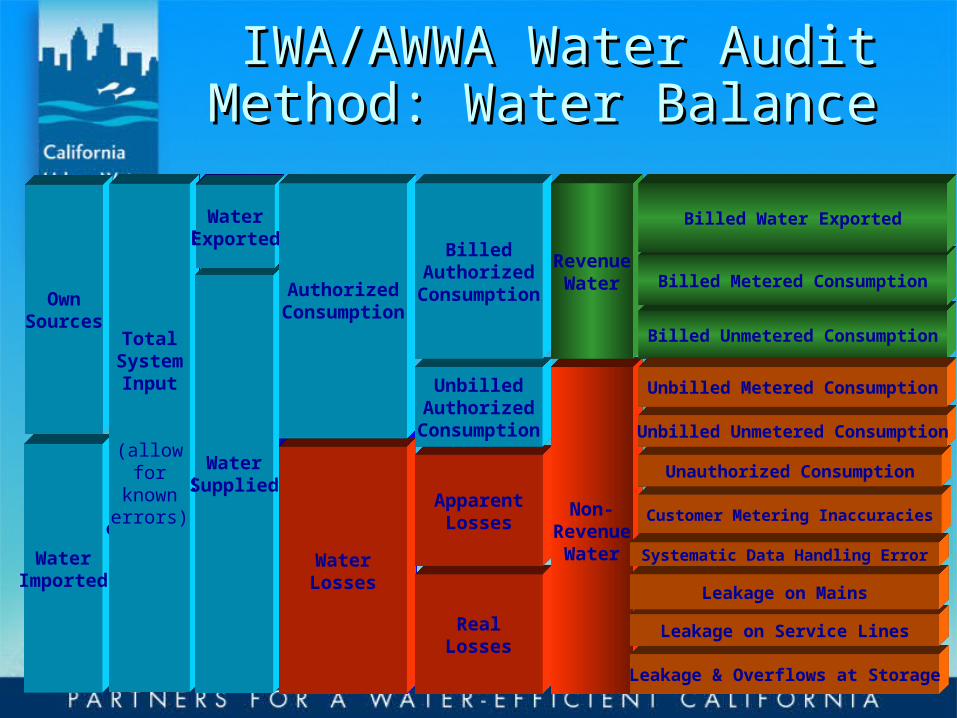
IWA/AWWA Water Audit IWA/AWWA Water Audit Method: Water BalanceMethod: Water Balance
WaterImported
OwnSources
TotalSystem
Input
( allowfor
knownerrors )
TotalSystem
Input
(allowfor
knownerrors)
WaterSupplied
WaterExported
WaterSupplied
WaterExported
WaterLosses
AuthorizedConsumption
WaterLosses
AuthorizedConsumption
RealLosses
ApparentLosses
UnbilledAuthorized
Consumption
BilledAuthorized
Consumption
Non-Revenue
Water
RevenueWater
Leakage & Overflows at Storage
Billed Unmetered Consumption
Billed Metered Consumption
Billed Water Exported
Leakage on Service Lines
Leakage on Mains
Customer Metering Inaccuracies
Unauthorized Consumption
Unbilled Unmetered Consumption
Unbilled Metered Consumption
Systematic Data Handling Error
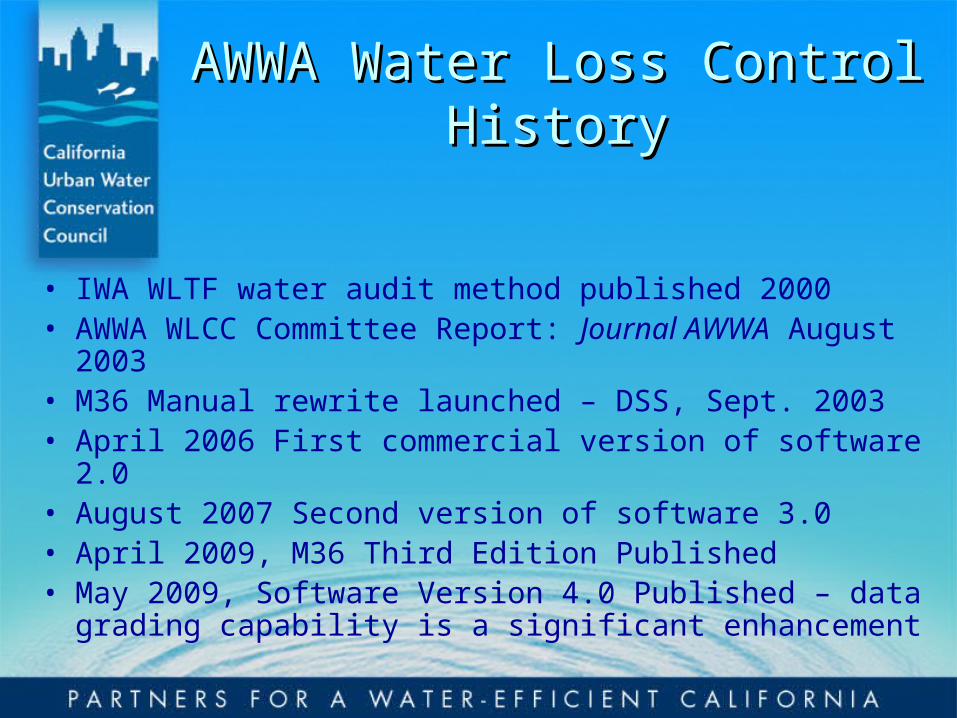
AWWA Water Loss Control AWWA Water Loss Control HistoryHistory
• IWA WLTF water audit method published 2000• AWWA WLCC Committee Report: Journal AWWA August
2003• M36 Manual rewrite launched – DSS, Sept. 2003• April 2006 First commercial version of software 2.0• August 2007 Second version of software 3.0• April 2009, M36 Third Edition Published• May 2009, Software Version 4.0 Published – data grading
capability is a significant enhancement
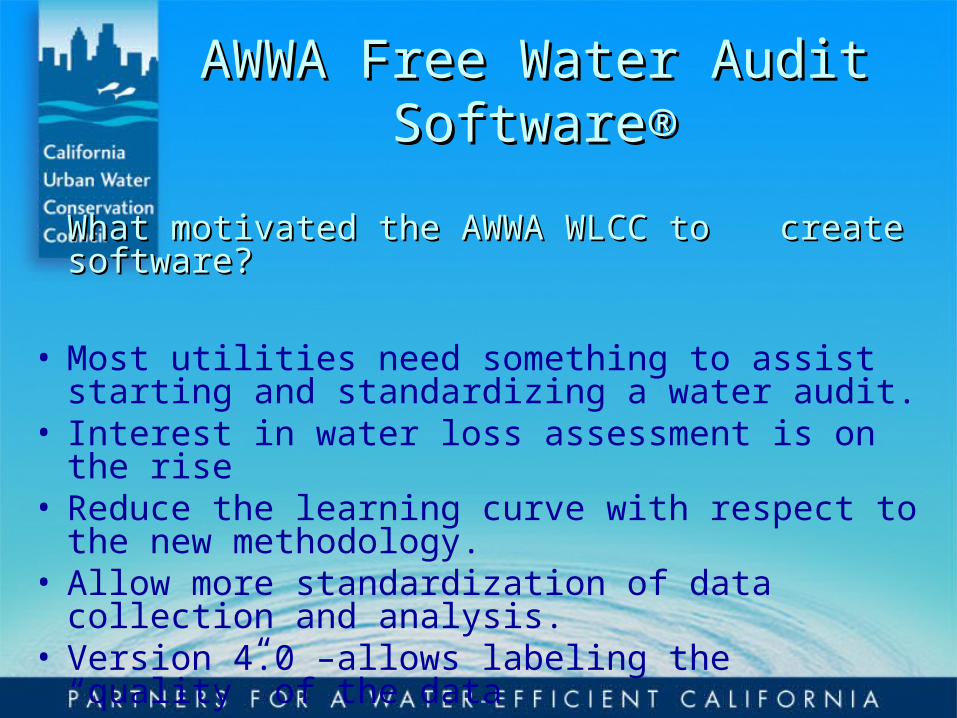
AWWA Free Water Audit AWWA Free Water Audit SoftwareSoftware®®
What motivated the AWWA WLCC to What motivated the AWWA WLCC to create software?create software?
• Most utilities need something to assist starting and standardizing a water audit.
• Interest in water loss assessment is on the rise• Reduce the learning curve with respect to the new
methodology.• Allow more standardization of data collection and
analysis.• Version 4.0 –allows labeling the “quality” of the data
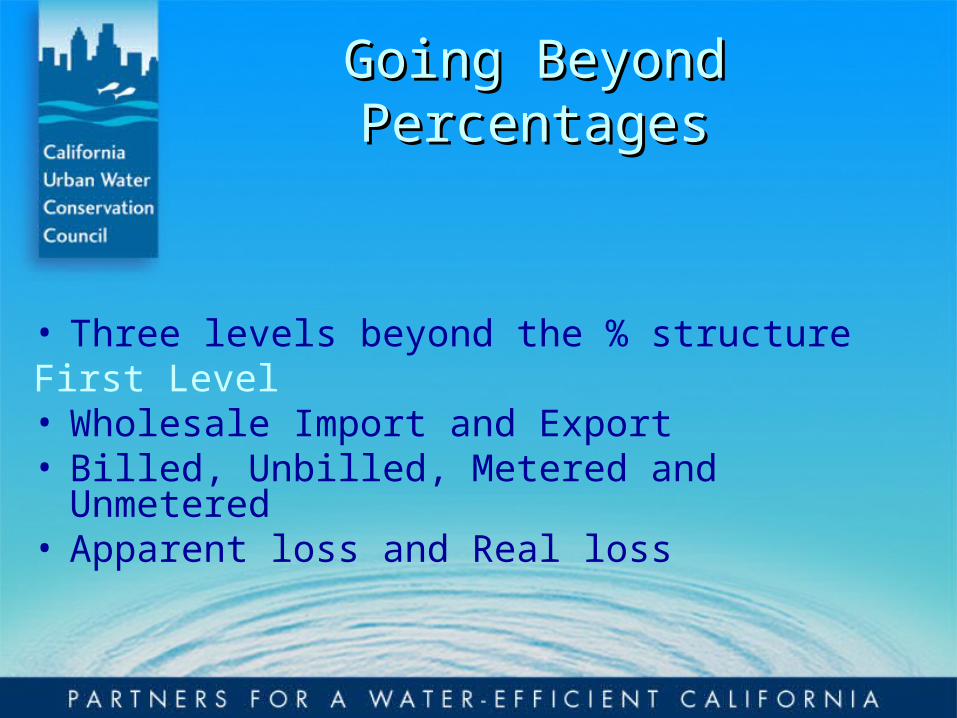
Going Beyond PercentagesGoing Beyond Percentages
• Three levels beyond the % structureFirst Level• Wholesale Import and Export• Billed, Unbilled, Metered and Unmetered• Apparent loss and Real loss
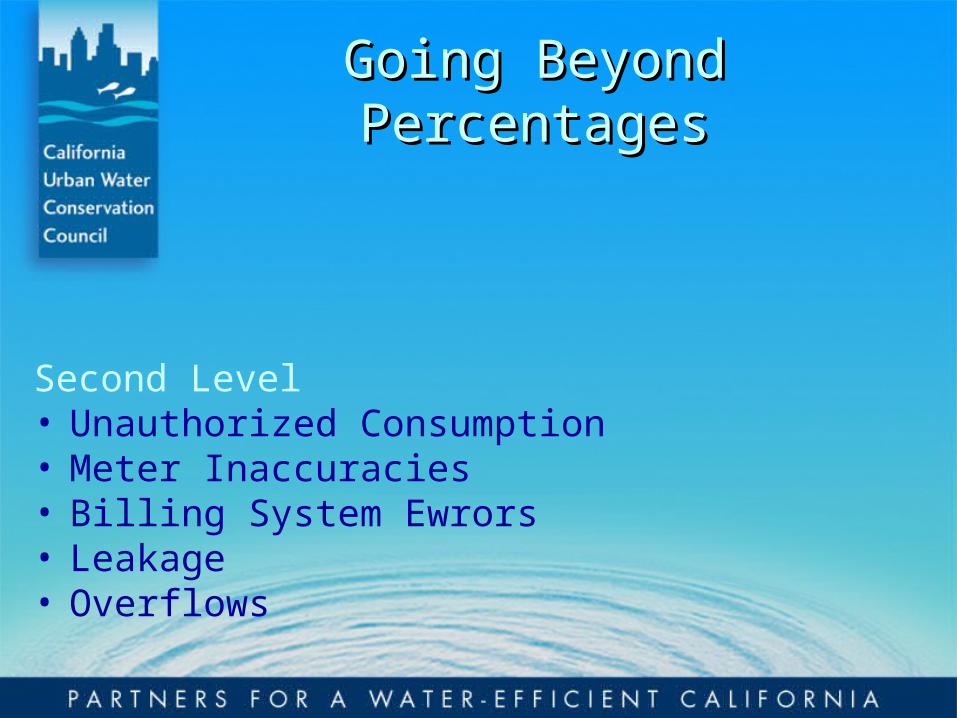
Going Beyond PercentagesGoing Beyond Percentages
Second Level• Unauthorized Consumption• Meter Inaccuracies• Billing System Ewrors• Leakage• Overflows
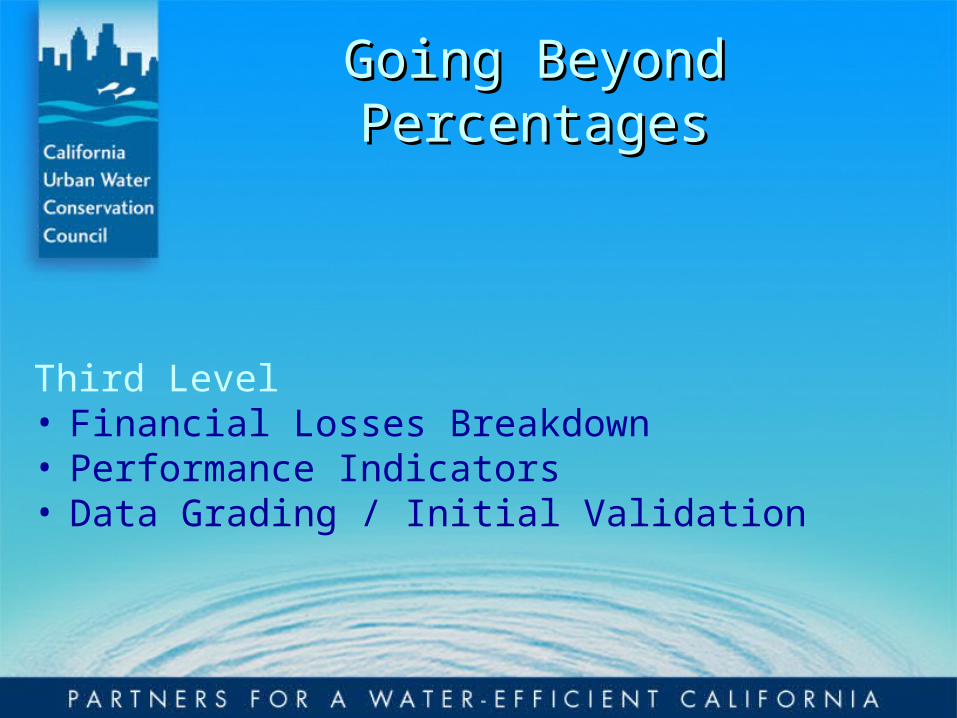
Going Beyond PercentagesGoing Beyond Percentages
Third Level• Financial Losses Breakdown• Performance Indicators• Data Grading / Initial Validation
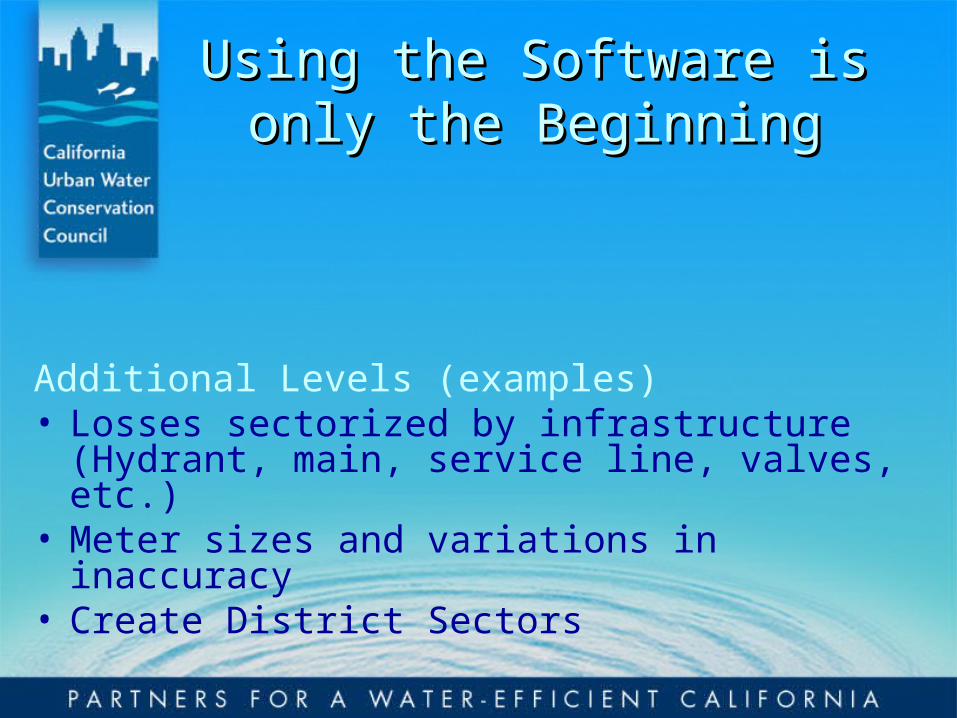
Using the Software is only the Using the Software is only the BeginningBeginning
Additional Levels (examples)• Losses sectorized by infrastructure (Hydrant, main,
service line, valves, etc.)• Meter sizes and variations in inaccuracy• Create District Sectors
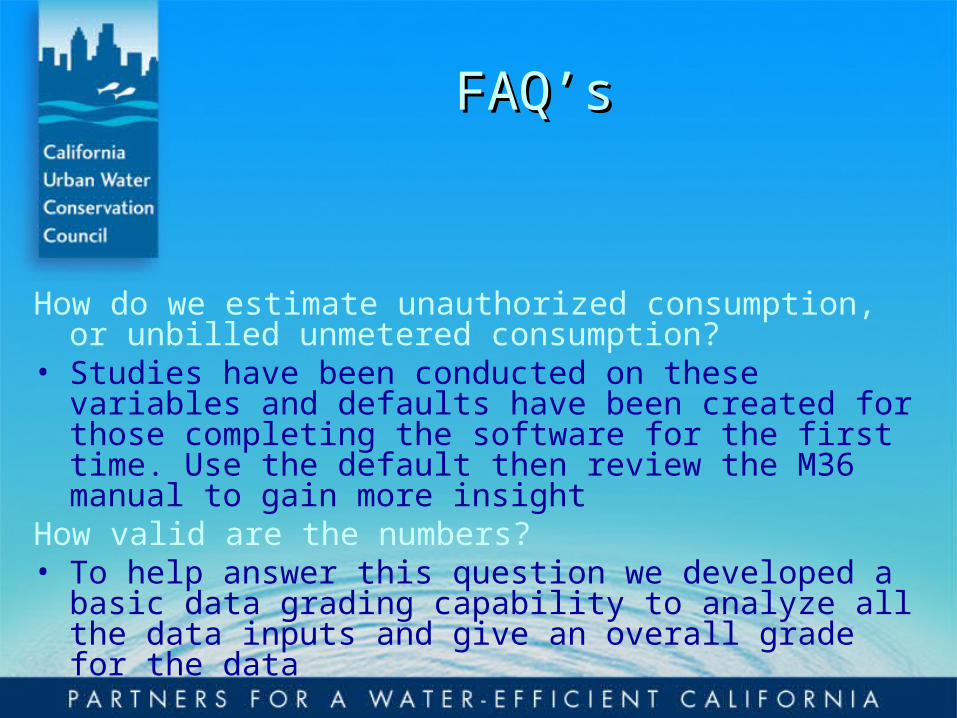
FAQ’sFAQ’s
How do we estimate unauthorized consumption, or unbilled unmetered consumption?
• Studies have been conducted on these variables and defaults have been created for those completing the software for the first time. Use the default then review the M36 manual to gain more insight
How valid are the numbers?• To help answer this question we developed a basic data
grading capability to analyze all the data inputs and give an overall grade for the data
AWWA Free Water Audit AWWA Free Water Audit SoftwareSoftware®®
A few people to credit….A few people to credit….
• David Sayers, Delaware River Basin Commission – main software developer
• George Kunkel, Philadelphia Water Department• Andrew Chastain-Howley, Miya• David Goff, Goff Water Audits and Engineering• Alain Lalonde, Veritec• Over 30 beta test utilities
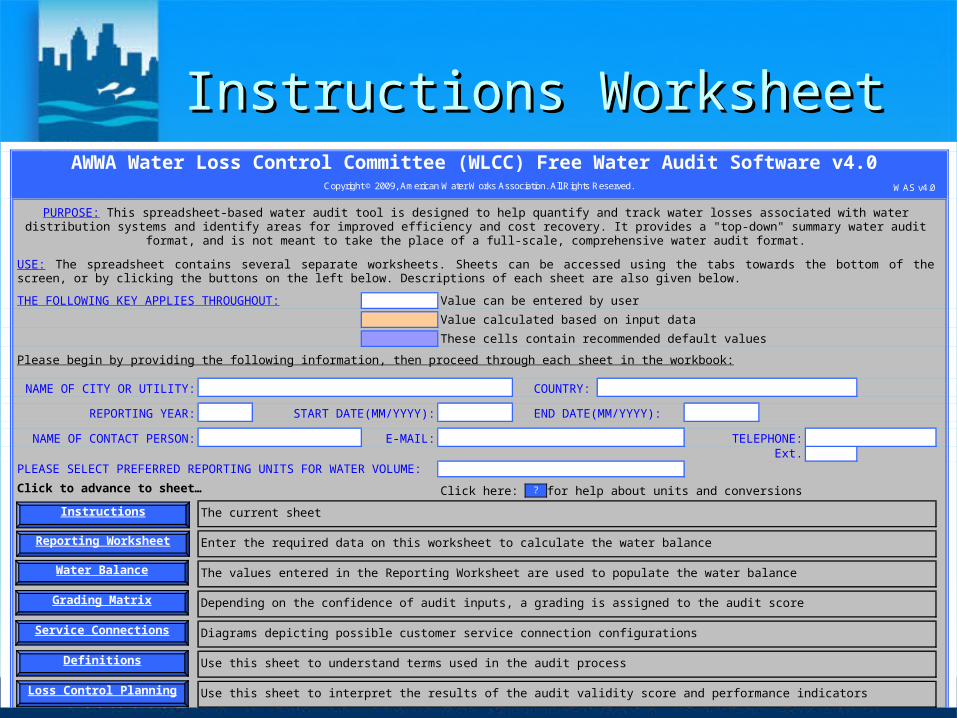
Instructions WorksheetInstructions Worksheet
THE FOLLOWING KEY APPLIES THROUGHOUT: Value can be entered by user
Value calculated based on input data
These cells contain recommended default values
Please begin by providing the following information, then proceed through each sheet in the workbook:
NAME OF CITY OR UTILITY: COUNTRY:
REPORTING YEAR: START DATE(MM/YYYY): END DATE(MM/YYYY):
NAME OF CONTACT PERSON: E-MAIL:Ext.
PLEASE SELECT PREFERRED REPORTING UNITS FOR WATER VOLUME:
Click to advance to sheet… Click here: for help about units and conversions
Depending on the confidence of audit inputs, a grading is assigned to the audit score
Use this sheet to understand terms used in the audit process
Use this sheet to interpret the results of the audit validity score and performance indicators
Diagrams depicting possible customer service connection configurations
The current sheet
The values entered in the Reporting Worksheet are used to populate the water balance
TELEPHONE:
Enter the required data on this worksheet to calculate the water balance
AWWA Water Loss Control Committee (WLCC) Free Water Audit Software v4.0
USE: The spreadsheet contains several separate worksheets. Sheets can be accessed using the tabs towards the bottom of thescreen, or by clicking the buttons on the left below. Descriptions of each sheet are also given below.
PURPOSE: This spreadsheet-based water audit tool is designed to help quantify and track water losses associated with water distribution systems and identify areas for improved efficiency and cost recovery. It provides a "top-down" summary water audit
format, and is not meant to take the place of a full-scale, comprehensive water audit format.
Instructions
Reporting Worksheet
Loss Control Planning
Water Balance
Definitions
Copyright © 2009, American Water Works Association. All Rights Reserved. WAS v4.0
?
Gr adi ng Mat r i x
Ser vi ce Connect i ons
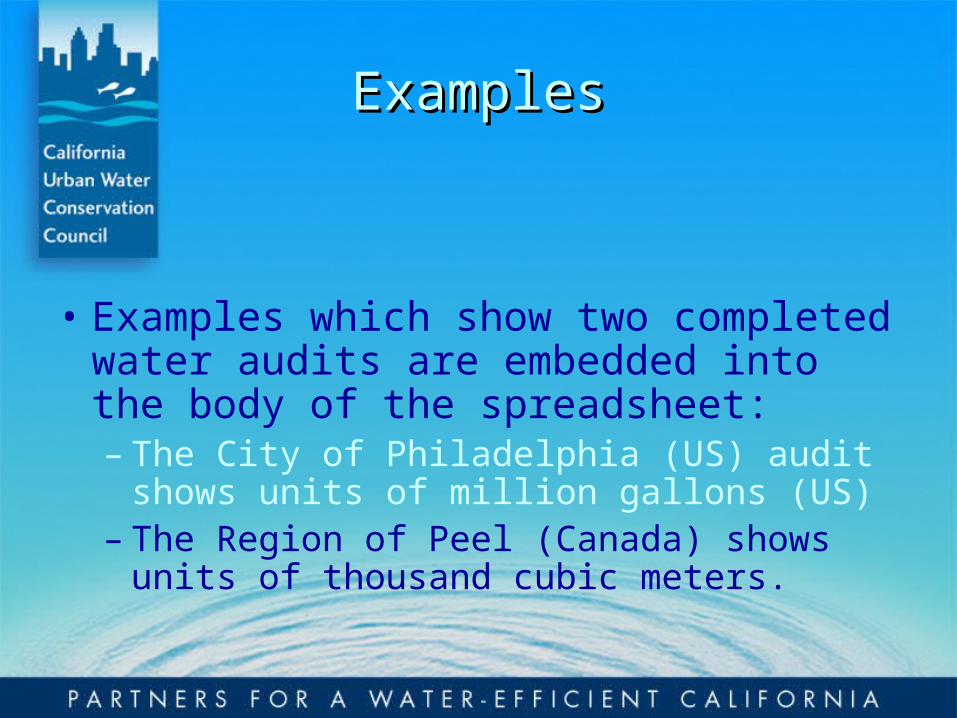
ExamplesExamples
• Examples which show two completed water audits are embedded into the body of the spreadsheet:– The City of Philadelphia (US) audit shows
units of million gallons (US)– The Region of Peel (Canada) shows units of
thousand cubic meters.
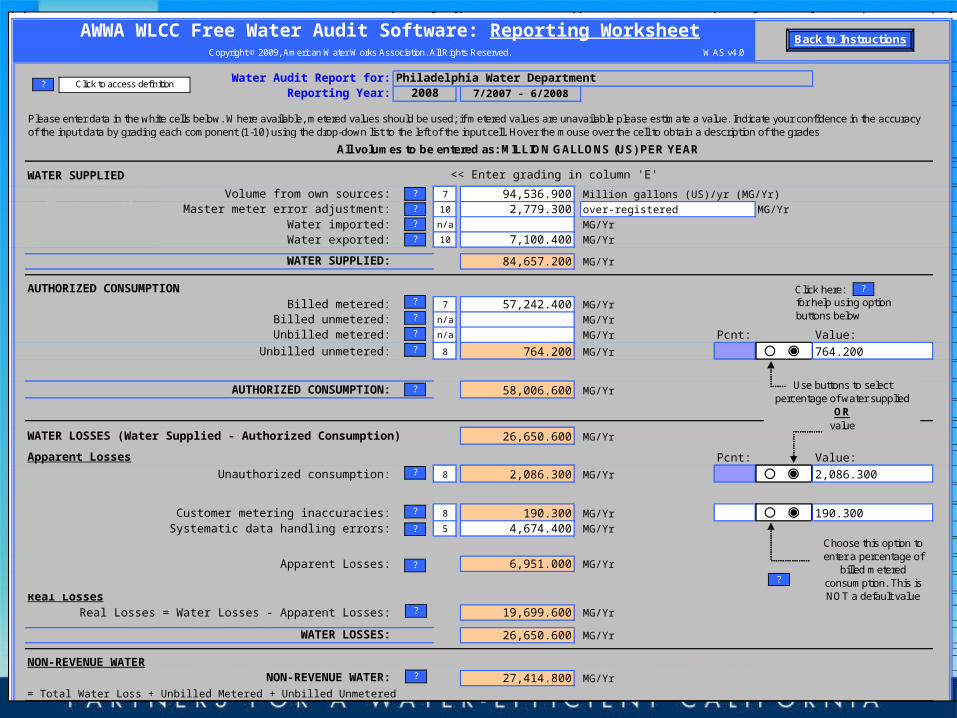
Reporting WorksheetWater Audit Report for: Philadelphia Water DepartmentReporting Year:
All volumes to be entered as: MILLION GALLONS (US) PER YEAR
WATER SUPPLI ED
Vol ume f r om own sour ces: 7 94, 536. 900 Mi l l i on gal l ons ( US) / yr ( MG/ Yr )
Mast er met er er r or adj ust ment : 10 2, 779. 300Wat er i mpor t ed: n/ a MG/ Yr
Wat er expor t ed: 10 7, 100. 400 MG/ Yr
WATER SUPPLI ED: 84, 657. 200 MG/ Yr.
AUTHORI ZED CONSUMPTI ONBi l l ed met er ed: 7 57, 242. 400 MG/ Yr
Bi l l ed unmet er ed: n/ a MG/ Yr
Unbi l l ed met er ed: n/ a MG/ Yr Pcnt : Val ue:
Unbi l l ed unmet er ed: 8 764. 200 MG/ Yr 1. 25%
AUTHORI ZED CONSUMPTI ON: 58, 006. 600 MG/ Yr
WATER LOSSES ( Wat er Suppl i ed - Aut hor i zed Consumpt i on) 26, 650. 600 MG/ Yr
Appar ent Losses Pcnt : Val ue:
Unaut hor i zed consumpt i on: 8 2, 086. 300 MG/ Yr 0. 25%
Cust omer met er i ng i naccur aci es: 8 190. 300 MG/ Yr
Syst emat i c dat a handl i ng er r or s: 5 4, 674. 400 MG/ Yr
Appar ent Losses: 6, 951. 000 MG/ Yr
Real LossesReal Losses = Wat er Losses - Appar ent Losses: 19, 699. 600 MG/ Yr
WATER LOSSES: 26, 650. 600 MG/ Yr
NON- REVENUE WATERNON- REVENUE WATER: 27, 414. 800 MG/ Yr
= Tot al Wat er Loss + Unbi l l ed Met er ed + Unbi l l ed Unmet er ed
2, 086. 300
764. 200
AWWA WLCC Fr ee Wat er Audi t Sof t war e: Repor t i ng Wor ksheet
2008
over - r egi st er ed
7/ 2007 - 6/ 2008
<< Ent er gr adi ng i n col umn ' E'
MG/ Yr
190. 300
Choose this option to enter a percentage of
billed metered consumption. This is NOT a default value
?
?
?
?
?
? Click to access definition
?
?
Back to Instructions
Please enter data in the white cells below. Where available, metered values should be used; if metered values are unavailable please estimate a value. Indicate your confidence in the accuracy of the input data by grading each component (1-10) using the drop-down list to the left of the input cell. Hover the mouse over the cell to obtain a description of the grades
?
?
?
?
Use buttons to selectpercentage of water supplied
ORvalue
?Click here: for help using option buttons below
WAS v4.0
?
Copyright © 2009, American Water Works Association. All Rights Reserved.
?
?
?
?
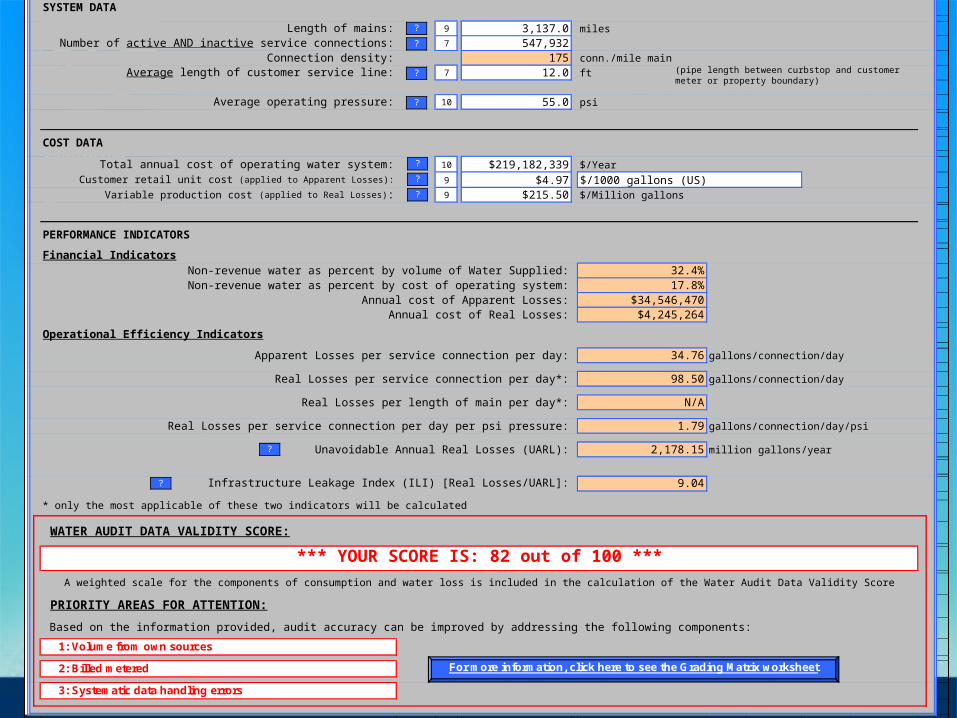
SYSTEM DATA
Length of mains: 9 3,137.0 miles
Number of active AND inactive service connections: 7 547,932Connection density: 175 conn./mile main
Average length of customer service line: 7 12.0 ft
Average operating pressure: 10 55.0 psi
COST DATA
Total annual cost of operating water system: 10 $219,182,339 $/Year
Customer retail unit cost (applied to Apparent Losses): 9 $4.97Variable production cost (applied to Real Losses): 9 $215.50 $/Million gallons
PERFORMANCE INDICATORS
Financial IndicatorsNon-revenue water as percent by volume of Water Supplied: 32.4%Non-revenue water as percent by cost of operating system: 17.8%
Annual cost of Apparent Losses: $34,546,470Annual cost of Real Losses: $4,245,264
Operational Efficiency Indicators
Apparent Losses per service connection per day: 34.76 gallons/connection/day
Real Losses per service connection per day*: 98.50 gallons/connection/day
Real Losses per length of main per day*: N/A
Real Losses per service connection per day per psi pressure: 1.79 gallons/connection/day/psi
Unavoidable Annual Real Losses (UARL): 2,178.15 million gallons/year
9.04
* only the most applicable of these two indicators will be calculated
WATER AUDIT DATA VALIDITY SCORE:
PRIORITY AREAS FOR ATTENTION:
1: Volume from own sources
2: Billed metered
3: Systematic data handling errors
$/ 1000 gal l ons ( US)
A wei ght ed scal e f or t he component s of consumpt i on and wat er l oss i s i nc l uded i n t he cal cul at i on of t he Wat er Audi t Dat a Val i di t y Scor e
Based on t he i nf or mat i on pr ovi ded, audi t accur acy can be i mpr oved by addr essi ng t he f ol l owi ng component s:
* * * YOUR SCORE I S: 82 out of 100 * * *
I nf r ast r uct ur e Leakage I ndex ( I LI ) [ Real Losses/ UARL] :
?
?
?
?
?
?
?
?
?
( pi pe l engt h bet ween cur bst op and cust omer met er or pr oper t y boundar y)
For more information, click here to see the Grading Matrix worksheet
AWWA WLCC Free Water Audit Software: Customer Service Line Diagrams
Copyright © 2009, American Water Works Association. All Rights Reserved. WAS v4.0Back to Instructions
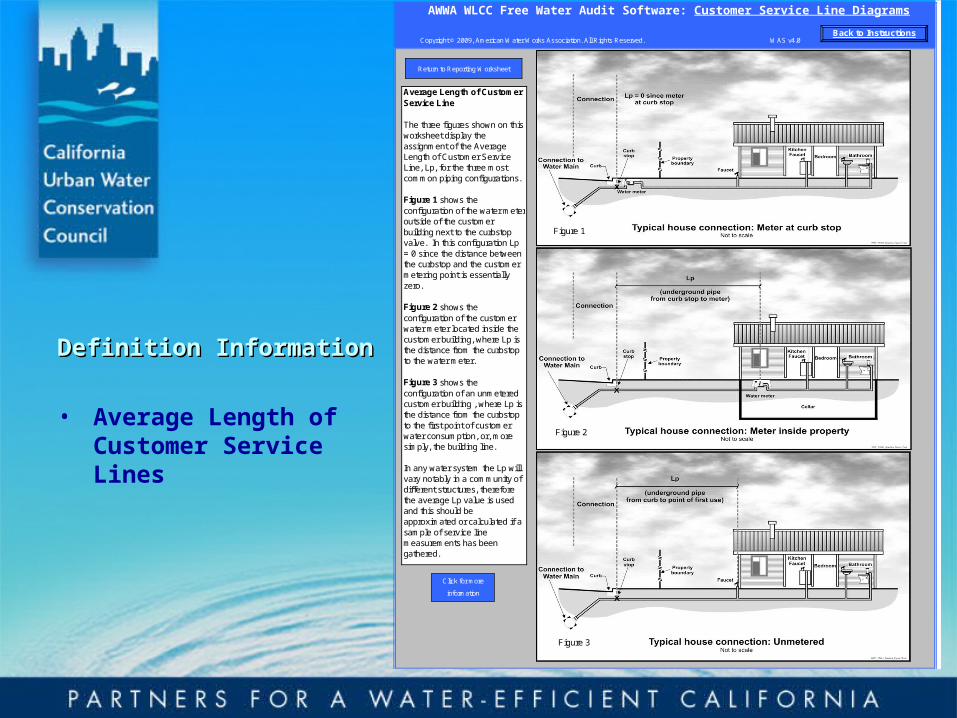
Average Length of Customer Service Line
The three figures shown on this worksheet display the assignment of the Average Length of Customer Service Line, Lp, for the three most common piping configurations.
Figure 1 shows the configuration of the water meter outside of the customer building next to the curbstop valve. In this configuration Lp = 0 since the distance between the curbstop and the customer metering point is essentially zero.
Figure 2 shows the configuration of the customer water meter located inside the customer building, where Lp is the distance from the curbstop to the water meter.
Figure 3 shows the configuration of an unmetered customer building , where Lp is the distance from the curbstop to the first point of customer water consumption, or, more simply, the building line.
In any water system the Lp will vary notably in a community of different structures, therefore the average Lp value is used and this should be approximated or calculated if a sample of service line measurements has been gathered.
Return to Reporting Worksheet
Figure 1
Figure 2
Figure 3
Click for more
information
Definition InformationDefinition Information
• Average Length of Customer Service Lines
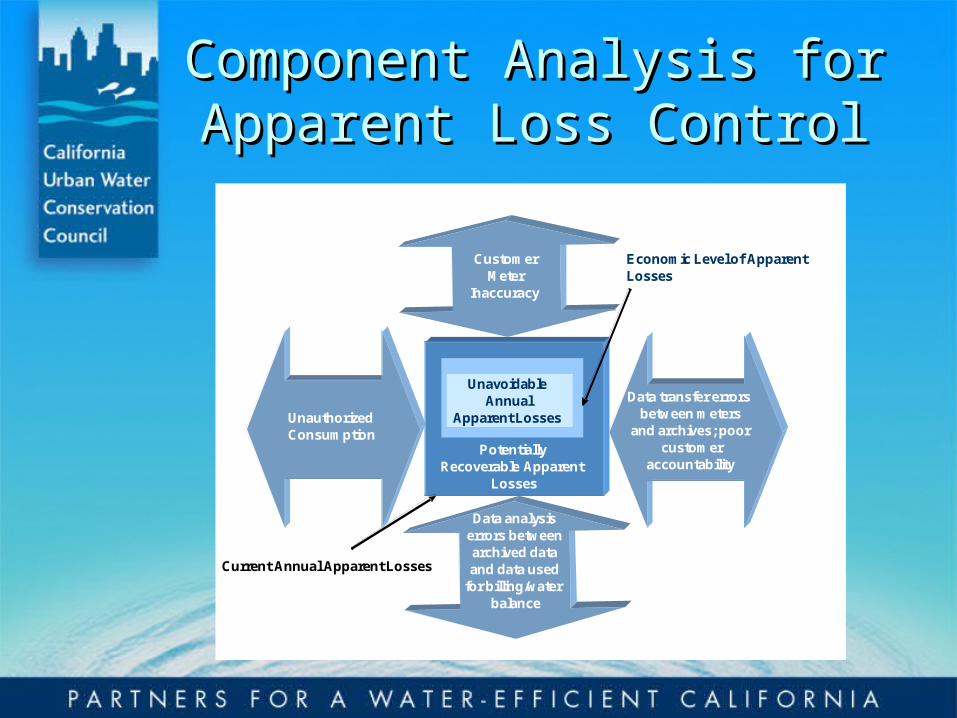
Component Analysis for Component Analysis for Apparent Loss ControlApparent Loss Control
UnavoidableAnnual
Apparent Losses
Current Annual Apparent Losses
Economic Level of Apparent Losses
Potentially Recoverable Apparent
Losses
Customer Meter
Inaccuracy
Data analysis errors between archived data and data used
for billing/water balance
Unauthorized Consumption
Data transfer errors between meters
and archives; poor customer
accountability

Component Analysis for Real Component Analysis for Real Loss (Leakage) ControlLoss (Leakage) Control
UnavoidableAnnual
Real LossesSpeed and Quality
of repairsActive
Leakage Control
Pipeline andAsset Management
Selection,Installation,
Maintenance,Renewal,
Replacement
Current Annual Real Losses
Economic Level of Real Losses
•
PressureManagement
Potentially Recoverable Real
Losses
Losses flex with pressure
BMP 1.2 BMP 1.2 A.ImplementationA.Implementation
• Standard Water Balance• Validation (4 years) - Using Data Grading• Economic Values• Component Analysis• Interventions - to Reduce Losses (M36)• Customer Leak Policy

BMP 1.2 BMP 1.2 B. ImplementationB. Implementation
• Agencies with MOU before Dec 31, 2008– Implement Before July 1, 2009
• Others– Implement by one year after signing MOU
• Benchmark Water Loss PI’s (after first 4 years of data)
BMP 1.2 BMP 1.2 C. Coverage RequirementsC. Coverage Requirements
• Audit Using AWWA Software. Test source and production meters
• Improve data accuracy to level IV using software grading.
• Seek Training• Years 5 to 10 - Show progress in water
loss control• Repair all reported leaks and breaks• Proactively search and repair unreported
leaks

BMP 1.2 BMP 1.2 D. Requirements for Documenting D. Requirements for Documenting
BMP ImplementionBMP Implemention
• Submit BMP every reporting cycle