water management in the tucson region session_final.pdf · • drought • water management model...
TRANSCRIPT

Water Management in the Tucson Region

The SWAN Project & The Tucson Basin Case Study


SWAN working group – Integration Poster

• photos

Collaborative efforts of the last 4 years.

SWAN Key Findings

We did not get here alone:
• Edward Curley• Claire Zucker• Julia Fonseca• Evan Canfield• Brian Powell• Tom Buschatzke• David Modeer• Randy Serraglio• Ralph Marra• Gita Bodner
• Eve Halper• Kathy Chavez• Charlie Ester• David Godlewsky• Greg Harris• Brad Lancaster• Michael McNulty• Mohammed
Mahmoud• Michelle Moreno• Claire Zugmeier
• Linda Stitzer• Jeff Tannler• Wally Wilson• Mead Mier
…and others
THANK YOU !

SWAN case study:
Coalitions in Water Management in Arizona
Murielle CoeurdrayJoan CortinasBrian O’Neill
Franck Poupeau

• General objectives of the researchAnalysis on contemporary water conflicts in Arizona:• Drought• Water management model• Key research questionsi- How can we understand the emergence of water conflicts in Arizonaii- Which are the social agents involved in those conflicts? What are their resources, their positions, their system of beliefs and the structure of the political subsystem in which they evolve?

PERIOD STRUCTURAL HISTORY DOMINANT COALITIONS
1890s-1920s
Federal LevelWater for a New America
Government Agencies, Local Elites of the Western Economy
1920s-1960s
Inter-States LevelLegal issues to share the Colorado River
Governors, Senators, Lawyers, State Commissions & Agencies
1960s-2010s
Local LevelsCAP in Tucson: Urban Sprawl, Water Quality and Mega-Drought
Municipal/County Administrations, Developers
Genesis and structures of the field of water management

White House’s Council on Environmental Quality CEQTo ensure that federal agencies meet their obligations of the ACT
EPA veto power
WHITE HOUSE
House Committee on Natural Resources- Subcommitee on Energy and Mineral Resources
- Subcommittee on FisheriesSubcommittee on Indian and Alaska Native Affairs- Subcommittee on Public Lands and Environmental Regulation
- Subcommitte on Water and Power
Army Corps of EngineersBureau of Reclamation
Bureau of Land ManagementUS Forest Service
Bureau of Indian Affairs
Federal Agencies
FEDERAL AUTHORITIES
Federal Courts
Arizona State Agencies (permit delivering)Arizona Department of Water Resources ADWR /Colorado River Mgmt
Arizona Department of Environmental QualityArizona Water Banking Authority (AWBA)
Arizona Corporation Commission Water Infrastructure Finance Authority of Arizona
Arizona State Courts
TRIBAL NATION
Ak-Chin Indian Community; Salt River Pima Maricopa Indian Community; Fort McDowell Indian Community; Yavapai Prescott Apache Tribe; Pueblo of Zuni; San Carlos Apache Nation (Salt, Black, and San Pedro River claims only); Gila River Indian Community; Tohono O'odham (San Xavier, Schuck Toak, and
Gila Bend Districts only); and White Mountain Apache Tribe
Senate committee on environment
AdministrativePermit deliveringPublic participation
Judicial
Arizona State LegislatureSenate House of
Representatives
Arizona State Authorities
AdministrativePermit deliveringStakeholder group
judicial
Congress US institute for Environmental Conflict resolution, 1998
NEPA 1969-70Signed by Pdt Nixon
National EnvironmentalPolicy Act
EIS Environmental Impact Statement-The lead agency as the public agency which has the principal responsibility for carrying out or approving a project- Cooperating agencies
Indian Water rights settlement
CAP 1968Central Arizona Project
disputes settlement
SUPREME COURT of the USWinters v. United States
(1908)/Water rights were reservedfor tribes as an implication of the treaties that created the reservationswith the intention of allowingAmerican Indian settlements to become self reliant and self sufficient
Wyoming v. Colorado1872Prior appropriation water rights
Groundwater Management Act(1980) signed by GovBabittcreation of ADWR and TAMAs
Prior appropriationdoctrine/In the westernpart of the country, waterownership is controlled bythe appropriative systemRights to water belong tothe first user who puts thewater to beneficial usePublic water code 1919
Arizona water settlement act
Water management in the Southwest
Tribal Nation Navajo /hopi Tribeat issue
Cap settlementapproved by Congress
successs
pending
failure Navajo powergeneratingstation
US bureau of Reclamation 24,3% +Salt River Project 21,7%
Los Angeles Dept of Water and Power 21,2 %
Arizona Public Service 14,0%
NV Energy 11,3%Tucson Electricity Power 7,5%
Tucson Phoenix
CAP
Arizona Municipal Water UsersAssociation (AMWUA)
EPA Bart proposal
1968 Colorado River Basin Project Act,B Reclamation participatinginterest in the NGS, used to providepower to the CAP
Municipal Water UsersMunicipal Water Providers
Arizona Water SettlementactNon indian Priority CAP water reallocation to the ADWR
Indian grassroots organization
Legalframework
US HOUSE OF REPRESENTATIVES
senate Congress
Betterthan Bart
CAWCDE D FundGila RiverNavajo NSRPDOIW. R.A
Farmers, industrialsector
COUNTY DISTRICT
CITYTOWNS
PIMA COUNTYCentral Arizona Water Conservation CAWCD Central Arizona Groundwater Replenishment CAGRDMetropolitan Water District
PrIvateWater Providers
Oro ValleyGreen ValleySahuarita
Action forcing mechanism
ARIZONA
environmentalists
CAP


Outcomes
• Analyzing the social conditions of production of water policy: how coalitions shape mobilizations, conflict, consensus
• In the TCS, the interest is to understand the emergence and dissemination of a water conservation policy => role of Pima County and apparition of a new coalition (with State agencies and other public institutions, including Phoenix)
• From Tucson/Phoenix antagonism to an understanding of the role of growing peripheral cities
Eliza Benites – SWAN Meeting, February 17th
The Social Logic of Urban Sprawl

TitleThe
Social Logic of Urban Sprawl

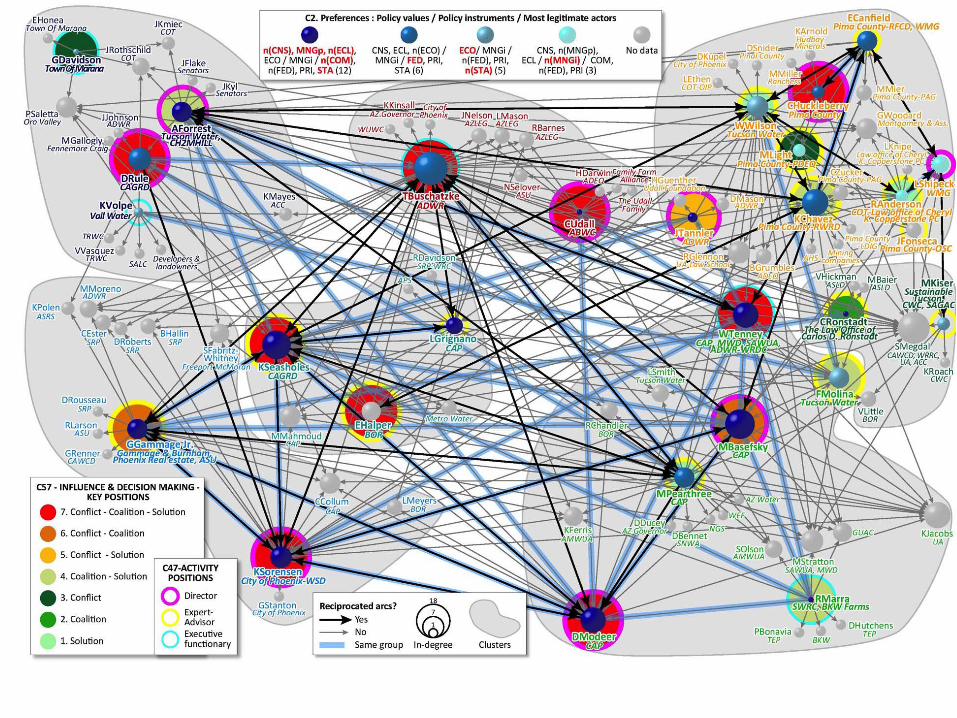
Results
Real estate industry, not only developers but a close network of private (contractors, builders) and public actors (planning and water services)
Existence of a “pro-growth” coalition composed of public and private actors Growth is embedded into the functioning of public
entities.

Results
The real estate community does not express much concern regarding the future of water supply (even when going to events on UA campus!)
The technological improvement argument (technology will solve the water problem) is used to legitimize the “no concern for the future of water” discourse.

Interview with Paul G., development community
“I see water management as a success story. As of 2015, we have the same average consumption thanin 1987. Even with CAP water, in Tucson, we canhave 140,000 acre feet a year, we use only 100,000 acre feet a year, 40,000 just back into the ground, sowe are good! We have declining water consumption, and even on a conservative trend, we still have till 2040-2050 and then we can use the water stored. Water is an important commodity, so we need to beefficient in water uses, and we are.”

Recommendation
Being able to change certain norms and practices requires understanding of how institutional and human actions come about.
Make a friend, adopt a sociologist: to understand the positions of actors and
institutions involved, and the potential elements that can lead to resistance and conflict regarding any proposed project.

Urban Effects on Regional Climate: A Case Study in the Phoenix and
Tucson ‘Sun’ Corridor.
Zhao Yang1, Francina Dominguez1, Hoshin Gupta2, Xubin Zeng1, Laura Norman3
1 Atmospheric Science, University of Arizona2 Hydrology and Water Resource, University of Arizona3 U.S. Geological Survey, Western Geographic Science Center, Tucson, Arizona

Motivation: to study the hydroclimate impact of urbanization
Phoenix metropolitan area: one of the fastest growing areas in the US for the past 30 yearsThe projected urban area in
2050 is about 7 times greater than current under most intense case scenario. 6 million more people
expected in the ‘Sun’ corridor in 2030 (US Census, 2005)

Temperature
Urban heat island is wellsimulated, suggesting that it willbe warmer during the nighttime.
Decreasing pattern is dominant in our domain but thepattern is not statisticallysignificant.
Precipitation
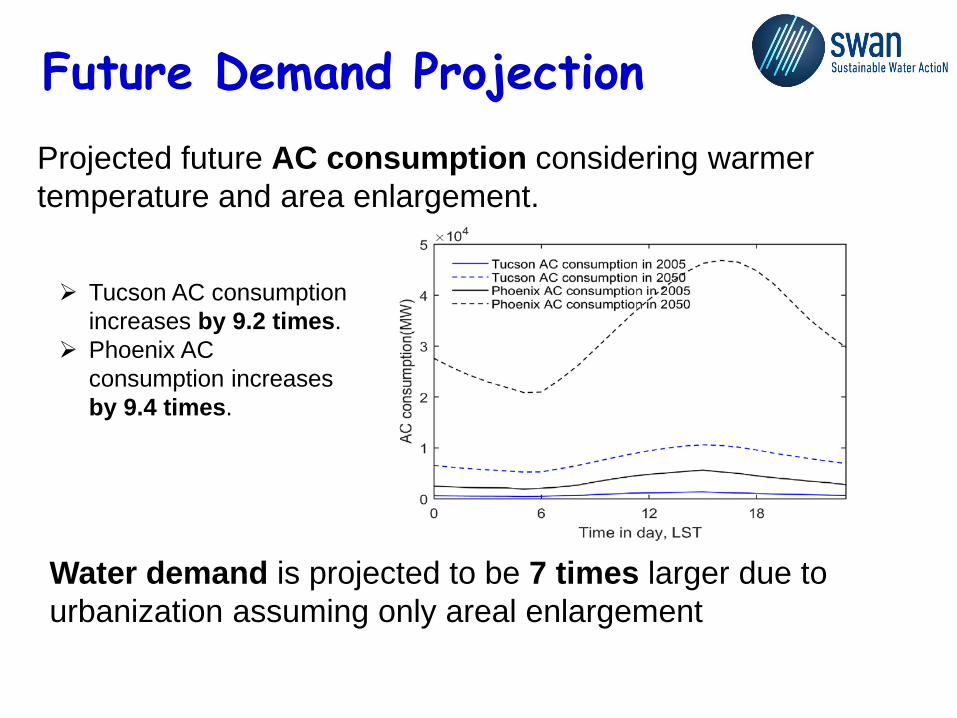
Projected future AC consumption considering warmer temperature and area enlargement.
Future Demand Projection
Tucson AC consumption increases by 9.2 times.
Phoenix AC consumption increases by 9.4 times.
Water demand is projected to be 7 times larger due to urbanization assuming only areal enlargement

Ecosystem Services in the Santa Cruz Basin:
Changes with Urban Growth
Kremena Boyanova

Changes in Ecosystem Services

Changes in Ecosystem Services
0
0.5
1
1.5
2
2.5
3
Area weighted supply index for WRES
Current 1999
Conservation 2050
Current trend 2050
Megalopolis 2050
• Evergreen forests and forested wetlands decrease significantly in all 3 LU scenarios for 2050
• Urban areas increase by 3 times in 2050 for all scenarios – increase in the demand
• Decrease in the supply - the supply of WRES is negatively influence by all 3 LU scenarios for 2050
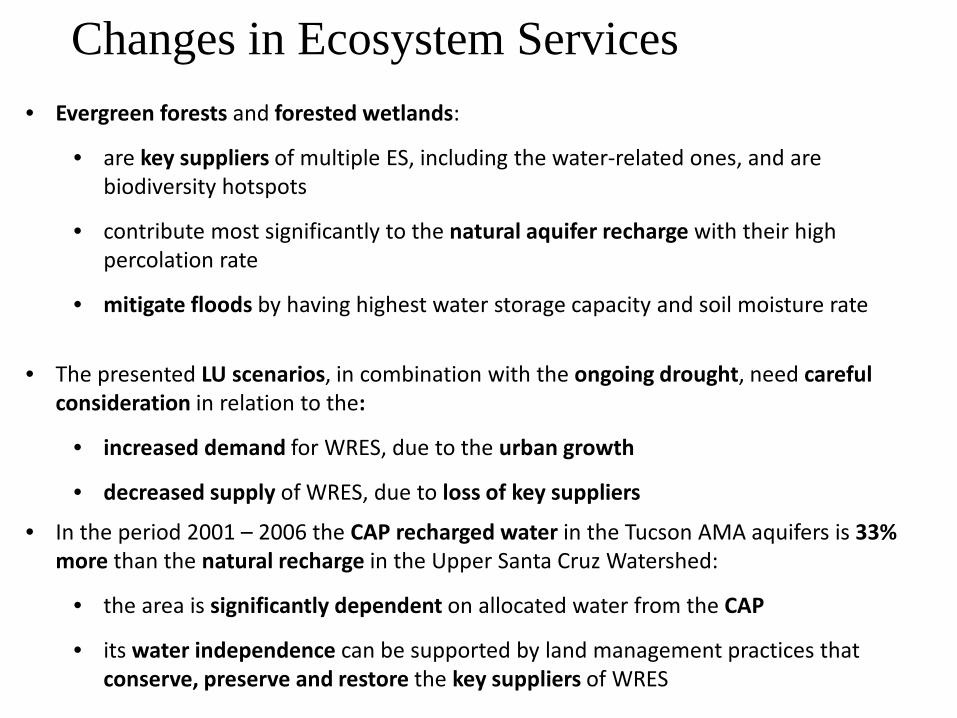
Changes in Ecosystem Services• Evergreen forests and forested wetlands:
• are key suppliers of multiple ES, including the water-related ones, and are biodiversity hotspots
• contribute most significantly to the natural aquifer recharge with their high percolation rate
• mitigate floods by having highest water storage capacity and soil moisture rate
• The presented LU scenarios, in combination with the ongoing drought, need careful consideration in relation to the:
• increased demand for WRES, due to the urban growth
• decreased supply of WRES, due to loss of key suppliers
• In the period 2001 – 2006 the CAP recharged water in the Tucson AMA aquifers is 33% more than the natural recharge in the Upper Santa Cruz Watershed:
• the area is significantly dependent on allocated water from the CAP
• its water independence can be supported by land management practices that conserve, preserve and restore the key suppliers of WRES

Assessing feasible options for sustainable water resource use to increase resilience in a semi-arid environment
Renewable Local Reliable Potable
No impact on water quality of
the aquifer
Absence of instit. conflicts
In-dependent of energy
intense system
Feasibility (cost)
Feasibility (effort)
Ease of use
Ground-water - + - ++ + - + + + ++
CAP Water + - - ++ - - - ++ - ++
Reclaimed water ++ ++ ++ + - + + - - +
Rainwater ++ ++ + ++ ++ ++ ++ - ++ +
Storm-water ++ ++ + - ++ + ++ + ++ -
Graywater ++ ++ ++ - ++ + ++ - ++ -
Kristin KuhnM.Sc. Ecohydrology
The utilization of rainwater and stormwater has the potential to cover more than 20% of municipal water demand in the TAMA. Graywaterre-use could contribute up to 2% without affecting sewer flows.

Cost-effectiveness is currently the main challenge for the utilization of rainwater, stormwater and graywater.
Green infrastructure with curb cut (Lancaster, 2015)
The integration of ecosystem services and the contribution of both riparian ecosystems and urban greenery to human well-being should be better integrated in cost-benefit analyses and water resources planning.
Water Use, Safe Yield, and Shallow Groundwater Areas
Violeta Cabello Villarejo
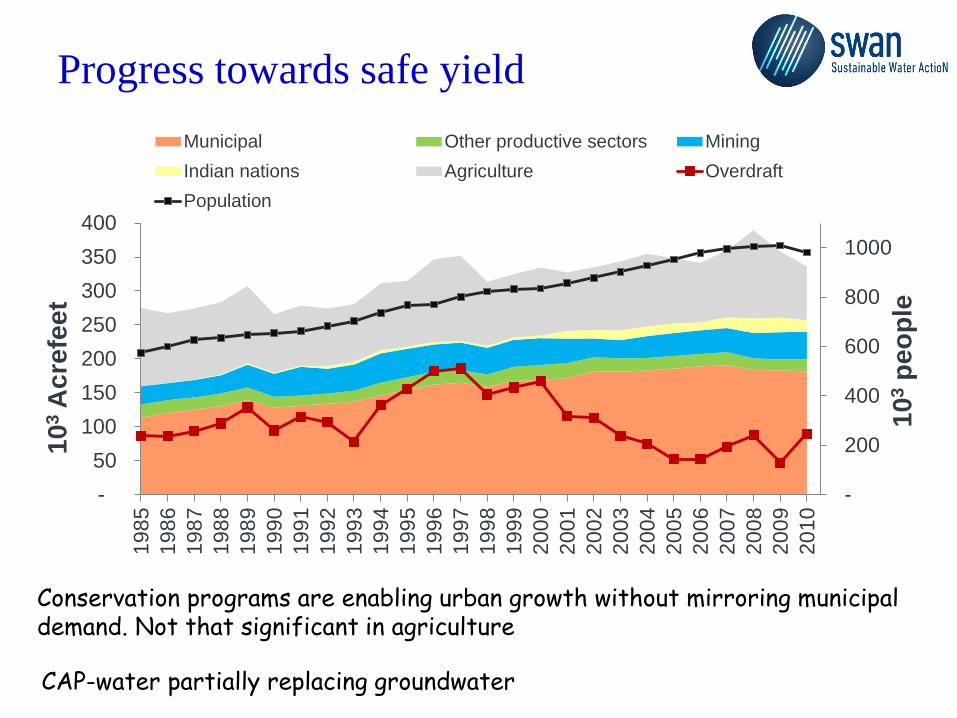
Progress towards safe yield
-
200
400
600
800
1000
- 50
100 150 200 250 300 350 400
1985
1986
1987
1988
1989
1990
1991
1992
1993
1994
1995
1996
1997
1998
1999
2000
2001
2002
2003
2004
2005
2006
2007
2008
2009
2010
103
peop
le
103
Acr
efee
t
Municipal Other productive sectors MiningIndian nations Agriculture OverdraftPopulation
Conservation programs are enabling urban growth without mirroring municipal demand. Not that significant in agriculture
CAP-water partially replacing groundwater

Spatial distribution of safe yield
• Uneven achievement of safeyield
• Partial disconection betweenrecharge and recovery
• Role of the CAGRD
• Lack of spatialiased data

Questions for debate
• Environmental implications of the spatially neutral definition of safe yield for the whole TAMA?
• Implications of the reactivation of the buildingsector for spatial inequalities in safe yield?
• Progress towards water accounting areas?

Where do we go from here ?
Current and future water issues ?
How can research help?

Breakout GroupsBreakout groups will allow the participants to review and discuss the policy and practical issues presented by Mr. Huckelberry and the researchers and to answer key questions posed by each group moderator.
• 10:40 – Participants divide into equal-sized groups and introduce themselves. Based on the key questions, participants will discuss and prepare recommendations on current water issues in the Tucson Basin.
• 11:30 – How can research assist in dealing with these challenges? Suggest two research topics!
• 12:00 – Groups present recommendations to the entire group.

Assigned Stakeholders
• Group 1: Tim Thomure, Mark Murphy, Rita Mercer, Julia Fonseca, Jackson Jenkins
• Group 2: John Kmeic, Marcelino Flores, Mark Taylor, Gary Woodard.
• Group 3: Prevatt, Placido dos Santos, Chuck Graf, Kathy Chavez.
• Group 4: Mead Mier, Jim Dubois, Ian Pepper, Evan Canfield.