water mass pathways between the subtropical and … · dynamics of atmospheres and oceans 32 2000...
TRANSCRIPT

Ž .Dynamics of Atmospheres and Oceans 32 2000 331–371www.elsevier.comrlocaterdynatmoce
Water mass pathways between the subtropical andtropical ocean in a climatological simulation of the
North Atlantic ocean circulation
Paola Malanotte-Rizzoli a,), Kate Hedstrom b, Hernan Arango b,Dale B. Haidvogel b
a ( )Department of Earth, Atmospheric and Planetary Sciences, Massachusetts Institute of Technology MIT ,Cambridge, MA 02139, USA
b Institute of Marine and Coastal Sciences, Rutgers UniÕersity, New Brunswick, NJ 08903, USA
Received 5 July 1998; received in revised form 15 July 1999; accepted 6 February 2000
Abstract
A primitive equation, hydrostatic, terrain-following coordinate ocean general circulation modelŽ .OGCM is used to investigate the mean water mass pathways from the subtropics to the tropics inthe Atlantic Ocean. The OGCM is used in a fully realistic configuration of the Atlantic, from 308Sto 658N, with realistic bathymetry. Surface forcings are provided by the COADS climatology. Anon-eddy-resolving numerical simulation is analyzed with 3r48 horizontal resolution and 20terrain-following vertical levels.
The primary objective of this study is to assess the theoretical framework extending theventilated thermocline theory to the equator in the context of the numerical calculation, and toestablish whether the predictions of a steady-state theory can be verified in a time-dependentsimulation, in which rectified seasonal effects on the time mean yearly circulation may beimportant. The Bernoulli function is evaluated on isopycnal surfaces outcropping in the subtropicsin both hemispheres and floats are injected at different northern and southern latitudes. In bothhemispheres, the interior flow velocities are parallel to the Bernoulli streamlines that aresignificantly modified by inertia only very near the equator and on the Equatorial UnderCurrentŽ .EUC .
In the Northern Atlantic, pathways from the subtropics to the tropics exist for the isopycnalsurfaces outcropping at 20–228N. The injected floats reach the EUC following a zigzag pattern
) Corresponding author. Tel.: q1-617-253-2451; fax: q1-617-253-4464.Ž .E-mail address: [email protected] P. Malanotte-Rizzoli .
0377-0265r00r$ - see front matter q2000 Elsevier Science B.V. All rights reserved.Ž .PII: S0377-0265 00 00051-8

( )P. Malanotte-Rizzoli et al.rDynamics of Atmospheres and Oceans 32 2000 331–371332
determined by the tropical current system. It is impossible to distinguish between the westernboundary and the interior exchange windows as they are merged together forming a broad
Ž .exchange pathway east of the northwestward flowing North Brazil Current NBC . This exchangewindow disappears for the floats injected north of ;308N, and corresponding outcroppingisopycnals s )25.5 kgrm3, where only the recirculating window of the subtropical gyreu
remains.In the Southern Atlantic, all the floats injected between 68 and 158S migrate to the western
boundary where they are entrained in the NBC. There is no interior exchange window. At theequator, some are directly entrained into the EUC, some overshoot and retroflect at ;88N, thenjoin the EUC.
As the numerical simulation is carried out under surface forcings that include the seasonalcycle, we can assess the impact of the seasonal cycle on the steady-state analysis. The most
Ž .important effect is due to the Atlantic Intertropical Convergence Zone ITCZ , which in summer isstrong, and produces an ‘‘island’’ of Ekman upwelling between 108 and 208N, which is reflectedin the yearly mean properties. The ICTZ-induced upwelling and interior stratification support acorresponding ‘‘island’’ of high potential vorticity that penetrates in depth to all the isopycnalsoutcropping between 208 and 258N. This high potential vorticity island creates a barrier thatconstrains the floats injected at and north of 208N to flow around it to reach the Equator and theEUC. q 2000 Elsevier Science B.V. All rights reserved.
Keywords: North Atlantic; Atlantic Intertropical Convergence Zone; Bathymetry
1. Introduction
During the last decade, numerous studies have been carried out of the subtropicalŽ .thermocline circulation see the reviews by Rhines, 1986; Pedlosky, 1990 as well as of
Žthe circulation of the upper equatorial oceans see the reviews by McCreary, 1985;.Philander, 1990 . Only recently, however, the interactions between the tropics and the
subtropics have received significant attention with specific focus on the Pacific ocean.Here, there is a well-established observational evidence of a flow of thermocline water
Ž .from the subtropics to the tropical Pacific. Wyrtki and Kilonsky 1984 show that theŽ .core of the Equatorial UnderCurrent EUC lies in the range 158–258C, implying that the
source region for this water is approximately between 208 and 408 in both hemispheres,Žwhere these isotherms outcrop. Western boundary sources Tsuchiya, 1981; Lindstrom
. Žet al., 1987; Tsuchiya et al., 1989; Butt and Lindstrom, 1994 supply ;13 Sv 16 3 y1.Svs10 m s to the EUC. By the time the EUC crosses ;1538W in the Central
Pacific it carries ;25 Sv of extratropical water eastward. Where this subtropical waterflows to the equator is still controversial, and especially controversial is the existence of
Ž .an interior pathway. Evidence for the latter one was first provided by Wyrtki 1975 whoshowed that some geostrophic streamlines from the North Pacific intersect the equator inthe basin interior after following a zigzag pattern determined by the westward North
Ž .Equatorial Current NEC and by the eastward North Equatorial Counter CurrentŽ . Ž .NECC . Even more striking is the evidence presented by Fine et al. 1981 and FineŽ .1987 . They show the presence of a tritium subsurface maximum centered on theequator between 1458 and 1358W that persists regardless of time sampling. They

( )P. Malanotte-Rizzoli et al.rDynamics of Atmospheres and Oceans 32 2000 331–371 333
conclude that high tritium subtropical source waters are transported equatorward by theinterior geostrophic flow.
The observational evidence for subtropicalrtropical exchanges in the Atlantic oceanis more ambiguous. The Atlantic ocean circulation is much more complex than the
Ž .Pacific one due to the presence of the meridional overturning cell MOC originated bythe polar convection regions in the NorwegianrLabrador seas where North Atlantic
Ž .Deep Water NADW is formed. NADW leaves the North Atlantic for the SouthernŽocean in the form of a relatively narrow deep western boundary current Speer and
.McCartney, 1991; McCartney, 1993 . The net export of NADW to the tropics isŽ .;13–15 Sv Schmitz and McCartney, 1993; McCartney, 1993 . To conserve mass in
Ž .the basin essentially closed at its northern end , warmer deep thermocline and interme-diate waters enter the tropical Atlantic and flow northward towards the high-latitude
Ž .deep water formation regions at a similar rate Schmitz, 1995 . This warm return flowinteracts directly with the upper-ocean wind-driven circulation, resulting in convoluted
Ž .mass transport pathways Fratantoni, 1996; Fratantoni et al., 2000 .The evidence provided by tracer distributions shows a pattern very different from the
one observed in the Pacific ocean. In the Atlantic, the tritium distribution on thes s26.80 isopycnal surface, near the base of the thermocline and above the Antarcticu
Ž .Intermediate Water AAIW shows a band of depressed tritium values between 108 and208N separating the Northern tritium-rich waters from the southern depleted ones. Thisband penetrates into the northern subtropical gyre through the Caribbean and the eastcoast of America, thus providing the transport and mixing of waters of southern originŽ .Broecker and Peng, 1982 . The Atlantic EUC core, on the other side, lies basically in
Ž .the same temperature range as the Pacific EUC, 148–258C Duing et al., 1980 ,¨3 Žcorresponding to a range in s of 24.5–26.8 kgrm Fratantoni, 1996; Fratantoni et al.,u
.2000 indicating that the source regions for these waters lie again in the subtropics. MostŽof the water in the EUC seems, however, to be of Southern Atlantic origin Metcalf and
. Ž .Stalcup, 1967; Wilson et al., 1994 . The evidence presented by Wilson et al. 1994 isnonetheless intriguing. They show a schematic of volume transport for the densityinterval 24.5-s-26.8 in the western tropical Atlantic, and a significant component ofthe transport flowing towards the equator west of 458W is of northern origin. It isunknown whether these northern waters actually join the EUC, while it is wellestablished that southern waters in the density range s s24.5–26.8 are entrained intou
Ž .the EUC through the retroflection of the North Brazil Current NBC .This observational evidence in both oceans stimulated theoretical studies on the
dynamical connections between the tropics and the subtropics with the first pioneeringŽ .work by Pedlosky 1987 , which constituted the equatorial extension of the ventilatedŽ .thermocline theory Luyten et al., 1983, LPS hereafter . The intriguing aspect of this
theory is that the EUC and equatorial upwelling are remotely driven by subtropicalsubduction with the equatorial upwelling adjusting to absorb all the EUC transport. Thetheory thus provides an alternative to the ‘‘classical’’ explanation of the EUC beingprimarily driven by the equatorial wind field. In the original study, and in following
Ž .ones Pedlosky, 1988, 1991, 1997; Pedlosky and Samuelson, 1989 solutions are foundby matching an inertial equatorial boundary layer to an asymptotic geostrophic interior

( )P. Malanotte-Rizzoli et al.rDynamics of Atmospheres and Oceans 32 2000 331–371334
flow, the LPS solution. The theory was subsequently extended by explicitly includingthe different dynamical regimes that connect the subtropics to the equator both in
Ž . Žanalytical studies McCreary and Lu, 1994; Liu, 1994 , and in numerical ones Mc-Creary and Lu, 1994; Liu et al., 1994; Lu and McCreary, 1995, Liu and Philander, 1995,
.Blanke and Raynaud, 1997, Rothstein et al., 1998, Lu et al., 1998 . The first example ofŽ .basin-scale pathways is the one proposed by McCreary and Lu 1994 , with the concept
Ž .of the ‘‘sub-tropical cell’’ STC . In the STC, equatorward flow within the shallowsubtropical thermocline is compensated by poleward flow in the surface layers. The STCis closed by subduction in the subtropics and upwelling at the equator. As a furtherpoint, the importance of the surface mixed layer for subduction processes was pointed
Ž . Ž .out by Marshall and Nurser 1991 , Pedlosky and Robbins 1991 and, more recently, byŽ .Rothstein et al. 1998 .
Some of the numerical studies have even provided contrasting results. The numericalŽ .investigation of Lu and McCreary 1995 shows that the intertropical convergence zone
Ž .ITCZ creates a ‘‘potential vorticity barrier’’ that inhibits the direct, interior flow of thelower layer water of the STC from the subtropical North Pacific to the equator. Thelower layer water must first flow to the western boundary north of the ITCZ and then itcan move equatorward in a western boundary current to join the EUC at the equator.Notice that the model used in this work is a reduced-gravity model consisting of twoactive surface layers overlying a third, infinitely deep motionless layer. Results from
Ž .investigations carried with fully three-dimensional General Circulation Models GCMsŽon the other side show considerable interior flow to the equator Liu et al., 1994; Liu
.and Philander, 1995; Blanke and Raynaud, 1997; Rothstein et al., 1998 . Variousreasons may account for this difference. One possibility is that vertical mixing in theGCMs is strong enough to break the potential vorticity barrier created by the ITCZ.Another, and perhaps more plausible, possibility is that the lower layer in the Lu and
Ž .McCreary 1995 study is too thick, thus causing the lower layer streamlines to beŽ .almost zonally oriented. Thus, the streamline x y delineating the shadow zone hits thee
western boundary preventing any interior pathway.By and large, all of the above investigations have focused on the Pacific ocean. The
Ž .recent study by Rothstein et al. 1998 is perhaps the most extensive investigation of thesubtropicalrtropical exchanges in the northern Pacific ocean. They use a reduced-grav-ity ocean GCM explicitly representing the dynamics and thermodynamics of the mixedlayer in a realistic geometry configuration from 508S to 508N and by forcing the modelwith climatological winds as well as surface heat fluxes. Analysis on isopycnal surfacesthat ventilate in the Northern Pacific subtropics shows the existence of three majorpathways. The first pathway, the so-called ‘‘recirculating window’’, originates in thewestern side and consists of flow particles recirculating within the subtropical gyre. Thesecond pathway originates in the central Pacific subtropics and reaches the equator afterintersecting the western boundary where it actually splits into two branches. The firstbranch approaches the equator along the western boundary and here joins the EUC; thesecond branch leaves the low-latitude western boundary current at ;108N, then turnseastward within the NECC approaching the equator in a zigzag pattern. This is the‘‘western-boundary exchange window’’. The final pathway reaching the equator origi-nates in the easternmost northern subtropical Pacific, and joins the EUC in the basin

( )P. Malanotte-Rizzoli et al.rDynamics of Atmospheres and Oceans 32 2000 331–371 335
interior far from the western boundary, thus constituting the ‘‘interior exchange win-dow’’.
Very few numerical investigations have been carried out in the Atlantic ocean, whosecirculation is much more complex due to the presence of the MOC. Transport continuityhere requires a northward return flow in the upper limb of the MOC to compensate forthe southward export of NADW. In spite of this complexity, GCMs numerical results,
Ž .such as the one by Bryan 1991 , show the presence of a STC extending from theequator to ;258N. A shallow subpolar cell is present north of 258N and overlies thedeeper MOC cell that originates through deep convection in the polar latitudes. The
Ž . Ž .recent modeling study by Frantantoni 1996 and Fratantoni et al. 2000 also presentsevidence that a major part of the MOC return northward flow occurs in the intermediatelayer below the thermocline. The second major component of the MOC return flow tothe Northern subtropics occurs in the surface layer via the NBC, while the cross-equa-torial northward transport is very weak in the thermocline layer. We point out that
Ž .Frantantoni’s 1996 study focuses on the total transport of mass from one gyre toanother and the modifications induced in this total transport by superimposing the MOCto the wind-driven circulation.
Ž .In the most recent study by Harper 2000 , the GFDL-MOM GCM is used in a globalconfiguration, with high resolution, realistic topography and surface wind forcing alone.Water mass pathways are investigated in the three oceans, by visualizing particletrajectories that subduct in mid-latitudes both in the northern and southern subtropics.For the Pacific ocean, Harper’s results show basically similar patterns in the ventilatedthermocline flow from both the Southern and Northern hemisphere. His results also
Ž .confirm the existence of the three pathways found by Rothstein et al. 1998 discussedabove.
In the Atlantic ocean, a very interesting difference is found between the Northern andSouthern Atlantic in Harper’s study. The particle trajectories indicate that the subductedwater reaching the EUC comes exclusively from the southern ocean. Particles subduct-ing at the eastern edge of the southern subtropical gyre, near 308S, reach the equatorboth through the interior exchange window and by reaching first the western boundary.Because of the more limited longitudinal extent of the Atlantic ocean, the interiorexchange is rather weak. Most of the subducted southern water reaches the SouthAmerican coast, bifurcating at ;188S with a first branch moving southward torecirculate in the Southern subtropical gyre and the second branch moving northward
Ž .beneath the Brazil current, finally joining the EUC at the equator Harper’s Fig. 11 . Onthe other side, particles subducted at the eastern edge of the Northern subtropical gyreseem to be completely entrained in the subtropical gyre-recirculating window and do notpenetrate equatorward. Harper ascribes these results to the North Atlantic geometry,specifically the African northwestern coastline that ‘‘blocks’’ the equatorward pathways.
We emphasize that the objective of the present investigation is to assess in thenumerical simulation the validity of the equatorial extension of the ventilated thermo-cline theory, which is a steady state, adiabatic, inertial theory. This assessment requires asteady-state analysis, and this is the reason why properties are diagnosed and pathwaysanalyzed in the time-mean yearly circulation. The fact that the simulation is not eddyresolving precludes the float trajectories from becoming chaotic, and meaningful com-

( )P. Malanotte-Rizzoli et al.rDynamics of Atmospheres and Oceans 32 2000 331–371336
parisons can be made between the yearly mean pathways and the predictions of thesteady-state theory. These comparisons are discussed in Section 4, isopycnal analysis,and Section 5, floats trajectories, after the model descriptions given in Section 2 and thediscussion of the properties of the average circulation given in Section 3. The fact,however, that the numerical simulation is carried out with surface forcings that includethe seasonal cycle, allows us to assess the impact of the seasonal cycle itself on thesteady state analysis, discussion which is presented in Section 6. The final Section 7presents the conclusions of the present study and pending important issues, which willbe the object of future investigations.
2. Model description
Ž .The model used belongs to a hierarchy of terrain-following or sigma modelsdeveloped by Haidvogel et al. at Rutgers University. The hierarchy originated with the
Ž .semi-spectral primitive equation model SPEM, Haidvogel et al., 1991 , which solvesthe hydrostatic primitive equations with a rigid lid at the sea surface, coupled withadvectionrdiffusion equations for potential temperature and salinity and the nonlinearUNESCO equation of state. The present model is a free sea surface version of SPEM
Ž . Ždeveloped by Song and Haidvogel 1994 , called SCRUM S-coordinate Rutgers.University model . It improves upon SPEM by allowing for a generalized nonlinear
terrain-following coordinate, which provides enhanced resolution at either the seaŽ .surface or sea floor. A detailed user’s guide for SCRUM is given by Hedstrom 1994 .
The newest free surface model in this hierarchy, the Regional Ocean ModelingŽ .System ROMS is an expanded version of SCRUM with a variety of a new features,
including alternatives for subgrid scale parameterization and for high performancecomputing on SMP-class computer architecture. For a detailed description of ROMS,
Ž .see Haidvogel et al. 2000 . Here, we describe only the design of the numericalexperiment analyzed in this study. The model domain is the North Atlantic ocean from308S to 658N, with a non-eddy-resolving horizontal resolution of 3r48 and a verticalresolution of 20 terrain-following s-coordinate surfaces. The actual grid and grid
Ž .spacings are shown in Haidvogel et al. 2000 , their Fig. 1a. Bathymetry data wasŽ . Ž .derived from the ETOPO-5 5 min gridded dataset NGDC, 1988 . Depths shallower
than 200 m were set to 200 m, and the maximum depth was set at 5500 m. Afterinterpolation and truncation, the topography was smoothed using a Shapiro filter. Theresulting bathymetry is shown in Fig. 1.
ŽSurface forcing functions were obtained from COADS climatology DaSilva et al.,.1994 , which includes monthly wind stress, heat and freshwater fluxes, including heat
´flux sensitivity to sea surface temperature. The specification of DAMEE-NAB requiresto use surface flux boundary conditions for temperature and salinity. At the northern andsouthern boundaries, 38 wide buffer zones are used in which temperature and salinity arerelaxed to observed monthly climatological values, with a nudging time scale of 5 daysat the outward edge of the buffer zone that increases to 60 days at the interior edge. Asimilar buffer zone is used in the Gulf of Cadiz to mimic interbasin exchanges. No-sliplateral boundary conditions are applied on solid sidewalls. The initial conditions for

( )P. Malanotte-Rizzoli et al.rDynamics of Atmospheres and Oceans 32 2000 331–371 337
Fig. 1. North Atlantic bathymetry used in the numerical calculation.
Ž .T,S as well as the buffer zones boundary conditions were obtained from the 1994Levitus climatology.
The calculation here analyzed corresponds to experiment E4 of Haidvogel et al.Ž . Ž2000 and was initialized with the February monthly climatology the January climatol-ogy was not used because of the presence of anomalous salinity values along the African
.coast . The difference of experiment E4 from the other five experiments discussed inŽ .Haidvogel et al. 2000, see their Table 1 is that the salt flux boundary conditions for
salinity are replaced by a simple relaxation to Levitus surface monthly climatology, witha relaxation time scale of 50 days.
With the non-eddy resolving horizontal resolution of 3r48, processes such as eddygeneration due to baroclinic instability and eddy-topography interactions are poorlyresolved and may even be absent altogether. Other processes also strongly dependent onhorizontal resolution, such as the Gulf Stream separation, may also be very poorly
Ž .represented. In Haidvogel et al. 2000 , a sensitivity study for model evaluation iscarried out by comparing six different numerical experiments, which include experiment
Ž .E4 see their Table 1 . They assess the realism of the calculations through the evaluation

( )P. Malanotte-Rizzoli et al.rDynamics of Atmospheres and Oceans 32 2000 331–371338
of some well-defined measures of the yearly average circulation and their comparisonwith the observational evidence. These include the strength of the MOC and the zonallyintegrated meridional heat transport; the depth and strength of the Deep Western
Ž .Boundary Current DWBC ; the extent of the Mediterranean Water tongue and EasternBasin circulation; the time evolution of the Florida Current transport and the GulfStream separation; the annual mean streamfunction of the North Atlantic subtropicalgyre; and the mesoscale eddy variability. The presence of a fully resolved mesoscaleeddy field would undoubtedly modify the subtropical to tropical water mass pathways,which are the object of the present study.
3. Properties of the average circulation
In the considered experiment, the model was spun-up from the rest for 7 years. Theintegration was then continued for an additional 3 years. The analysis is carried out onthe average fields of the year 10 of the simulation even though the time evolution of thetotal kinetic energy was monitored over 20 years as shown in Fig. 2. The fully spun-upstate is clearly reached very quickly, and by year 5 the kinetic energy undergoes
Fig. 2. Time evolution of the total kinetic energy over 20 years.
( )P. Malanotte-Rizzoli et al.rDynamics of Atmospheres and Oceans 32 2000 331–371 339
seasonal fluctuations around a stable mean state, both remaining invariant through year20. The spin-up of the equatorial ocean is, in fact, much faster than the spin-up ofmid-latitude gyres, due to the higher propagation speed of equatorial baroclinic Rossbywaves. Partial diagnostics carried out over the fields of year 20 showed no differencewhatsoever with the same diagnostics carried out over year 10.
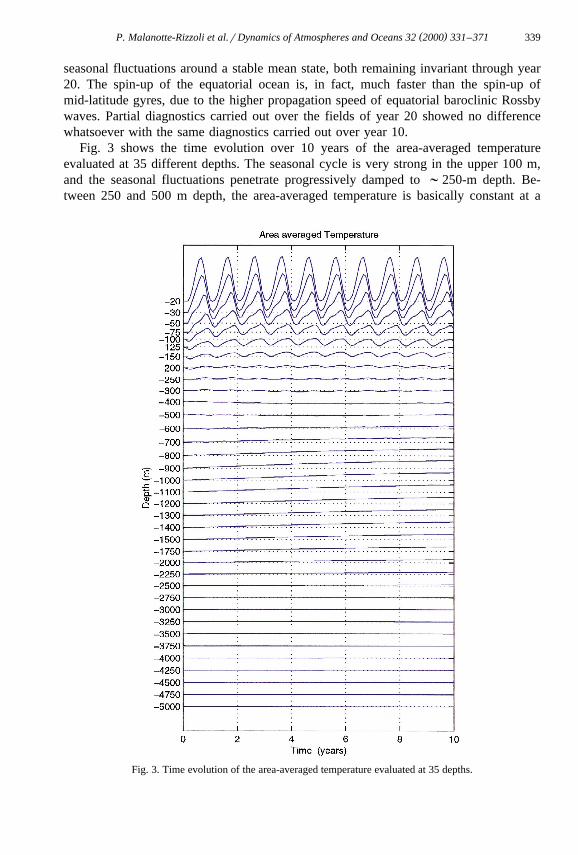
Fig. 3 shows the time evolution over 10 years of the area-averaged temperatureevaluated at 35 different depths. The seasonal cycle is very strong in the upper 100 m,and the seasonal fluctuations penetrate progressively damped to ;250-m depth. Be-tween 250 and 500 m depth, the area-averaged temperature is basically constant at a
Fig. 3. Time evolution of the area-averaged temperature evaluated at 35 depths.
( )P. Malanotte-Rizzoli et al.rDynamics of Atmospheres and Oceans 32 2000 331–371340
mean value. A slight trend appears at 600 m, which intensifies and reaches a maximumvalue at ;900 m, successively decreasing and disappearing at ;2750 m. This trendshows that the model has not yet reached a thermally equilibrated state below the upper600 m in which the circulation is wind-driven. However, as it will be shown in thefollowing, all the isopycnal surfaces relevant to the present study lie in the surface layerand upper thermocline, i.e. in the wind-driven layer defined above, where both energyand temperature reach an equilibrated state, and hence a definite climatology. Thearea-averaged temperature below 3000 m remains constant and equal to its initial value,
Ž .as expected. The area-averaged model salinity not shown has very weak seasonal
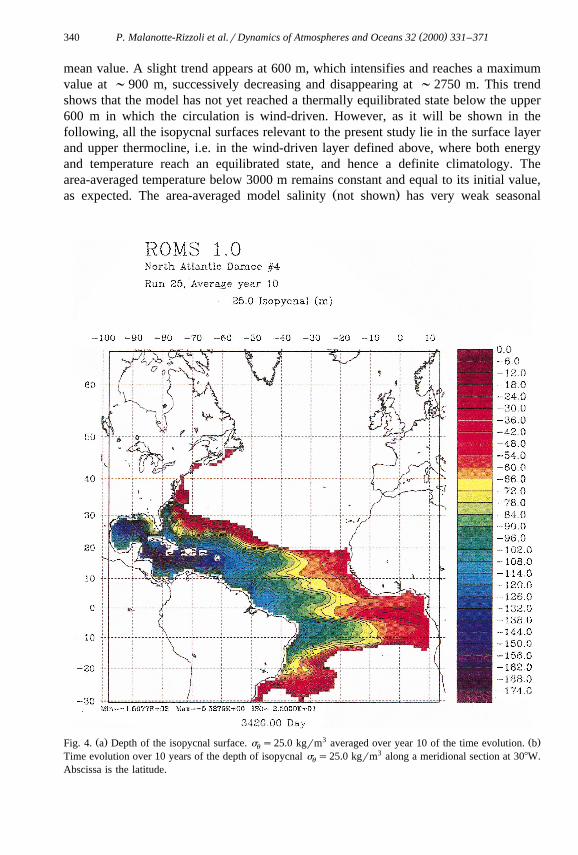
Ž . 3 Ž .Fig. 4. a Depth of the isopycnal surface. s s25.0 kgrm averaged over year 10 of the time evolution. bu
Time evolution over 10 years of the depth of isopycnal s s25.0 kgrm3 along a meridional section at 308W.u
Abscissa is the latitude.

( )P. Malanotte-Rizzoli et al.rDynamics of Atmospheres and Oceans 32 2000 331–371 341
Ž .Fig. 4 continued .
fluctuations in the upper 100 m and is practically constant with no apparent trend belowthis depth.
The temperature range of the water mass core of the Atlantic EUC is 14–258C,corresponding to a potential density range in s of 24.5 to 26.8 kgrm3, as discussed inu
Introduction. This will therefore be the range of isopycnal surfaces considered in thisstudy. In Figs. 4a,b and 5a,b, we show, respectively, the average depth and timeevolution at 308W of the isopycnals s s25.00 and 26.5 kgrm3. They are comprised inu
the upper part of the wind-driven tropical circulation and of the northern subtropicalgyre. Fig. 4a shows the average for year 10 of the depth of the isopycnal s s25.0u
kgrm3. It outcrops in the Northern Atlantic at 208N east of 408W with the outcroppingline reaching 308N near the American coast. In the Southern Atlantic, the outcroppingline is zonal at 108S east of 208W, reaching 308S on the western side. The isopycnalreaches its maximum depths of ;160 m in the Gulf of Mexico and the Caribbean. Fig.4b shows the time evolution over 10 years of the isopycnal depth along a meridionalsection at 308W, centered in the eastern Atlantic where presumably the most importantsubtropical to tropical pathways are located. The seasonal cycle reaches equilibrationrepeating itself identically by year 5, with the northern outcropping line moving between
Ž . Ž .;168N winter and a small pool located at ;358N summer . The average outcrop-

( )P. Malanotte-Rizzoli et al.rDynamics of Atmospheres and Oceans 32 2000 331–371342
ping of the major isopycnal surface is at ;208N as evident from Fig. 4a. s s25.0u
Ž . Žspreads over the equatorial gyre 108S to 108N and the Northern Tropical gyre 108 to. Ž .208N , comprising the equatorial current system. The SEC ;58S to 28N ; the NECC
Ž . Ž .;2 to ;108N and the NEC ;108N to ;158N are reflected in the isopycnaldepths, with a progressive shoaling from west to east.
3 Ž .Fig. 5a,b shows the tenth year average depth of s s26.5 kgrm 5a and theu
Ž .isopycnal depth time evolution at 308W 5b . This is the deepest isopycnal equilibratedover the 10-year evolution. The isopycnal comprises the entire northern and southernsubtropical gyres, where it reaches the maximum depth of ;400 m. It outcrops at
Ž . Ž .;428N central-eastern Atlantic and ;458N on the western side , thus reaching thesouthern border of the subpolar gyre. The isopycnal depth time evolution at 308W shows
Ž . 3 Ž . 3Fig. 5. a As in Fig. 4a, but for s s26.5 kgrm . b As in Fig. 4b, but for s s26.5 kgrm .u u

( )P. Malanotte-Rizzoli et al.rDynamics of Atmospheres and Oceans 32 2000 331–371 343
Ž .Fig. 5 continued .
again the self-repeating equilibrated seasonal cycle. Thus, all the isopycnals in the ranges F26.5 kgrm3 lie within the upper, wind-driven 600 m layer, which has reached au
Ž .thermally equilibrated state during the second half of the evolution Fig. 3 .The annual mean sea surface height is presented in Fig. 6. It shows a reasonable
large-scale pattern, even though the subpolar gyre is a little too strong and so is thecyclonic recirculation gyre north of the Gulf Stream. On the other side, the difference insea level across the Gulf Stream after separation at Cape Hatteras is of ;60 cm, whichis too small. The Gulf Stream shape is however reasonably realistic, separating nearCape Hatteras and forming a tight jet that flows northeastward into the basin interior,becoming a well-defined North Atlantic current. The equatorial–tropical region clearly
Ž .shows the alternating SEC 208S to the equator with an embedded Southern EquatorialŽ . Ž .Counter Current SECC, ;158 to 58S ; the NECC Equator to ;88N and the NEC
Ž .;88 to 158N , the latter one constituting the southern border of the Northern Subtropi-cal gyre.
Ž .The MOC not shown, but see Haidvogel et al., 2000 has a weak overturning inpolar latitudes, with the maximum strength of ;16 Sv in the subtropics at ;308N.About 14 Sv cross the equator and the 12 Sv streamline actually reaches the southernboundary at 308S. Thus, the MOC in this simulation is shifted southward, even though

( )P. Malanotte-Rizzoli et al.rDynamics of Atmospheres and Oceans 32 2000 331–371344
Fig. 6. Sea surface height averaged over year 10 of the evolution.
its overall intensity is realistic. Also realistic is the net export of deep water from theNorth Atlantic and hence the compensating upper return flow.
The most important modification in the interior density structure is not due tosignificant water mass transformations, but to wind-driven effects that sharpen thecurrent system and tighten the density fronts in the spun-up evolution with respect to theinitial Levitus climatology.
4. Isopycnal analysis
Ž .The conceptual framework presented by McCreary and Lu 1994 extends Pedlosky’sŽ .inertial theory of the EUC 1987, 1988 by explicitly analyzing the different dynamical

( )P. Malanotte-Rizzoli et al.rDynamics of Atmospheres and Oceans 32 2000 331–371 345
regions connecting the subtropics to the equator. Their analysis is based upon ananalytical, and numerical 2 1r2 layer ocean model. The lower layer, with layer
Ž .thickness h , subducts in the subtropics. After subduction, potential vorticity PV is2
conserved along the lower layer streamlines of geostrophic flow, i.e. lines of constantŽ .total thickness spressure .
fPV s G h 1Ž . Ž .2 h2
where hsh qh is the total thickness, f is the Coriolis parameter and G is a1 2
functional, which can be determined by integration along the characteristics startingfrom a boundary curve where h is specified.
After subduction, three different dynamical regions can be distinguished in layer 2and they are shown in the scheme of Fig. 7. The first one is the ‘‘recirculatingwindow’’, in which all the water transport recirculates in the subtropical gyre. Therecirculating window comprises all water columns subducting west of a longitude xFj
determined by the condition that the total meridional transport at the subduction latitudeysy is zero, i.e.d
j
Õ djs0. 2Ž .H 20
Ž .The boundary streamline x y is therefore the ‘‘bifurcation’’ streamline, because theb
total transport along this streamline ‘‘bifurcates’’ in the western boundary layer ofthickness d , i.e. half of it flows northward in the western boundary current of thew
subtropical gyre, and half southward. No pathway from the subtropics to the tropicsobviously exists within the recirculating window, which is marked as ‘‘1’’ in Fig. 7.
Fig. 7. The three different exchange windows in the subtropics and between the subtropics and the tropics thatare possible for subducted water columns.

( )P. Malanotte-Rizzoli et al.rDynamics of Atmospheres and Oceans 32 2000 331–371346
The second dynamical region is the one characterized by water mass pathways thatafter subduction actually reach the equator. PV is conserved along the geostrophicstreamlines and two possible routes exist. Along the first one, water columns movesouthwestward until reaching the western boundary where they are entrained southwardby the western boundary current, finally joining the EUC in the equatorial boundarylayer of thickness d . The second route is the interior pathway, in which the subductedE
water moves southwestward in the basin interior and reaches the EUC without hittingthe western boundary. This second dynamical region is delineated by the lower layer
Ž .streamline x y subducting at the east coast of the basin, ysy and xsL. All thee dŽ .lower layer streamlines east of x y subduct at xsL, where hsDsconstant. Hence,e
integration along the characteristics provides hsD everywhere in this region, i.e.Ž .u sÕ s0. This region of no motion, confined to xGx y , is the ‘‘shadow zone’’ of2 2 e
Ž .LPS 1983 .The existence of the interior pathway depends upon the shape of the boundary
Ž . Ž .streamline x y of the shadow zone Liu, 1994; Liu et al., 1994 , i.e. on the locationeŽ . Ž .where x y crosses the equator McCreary and Lu, 1994 :e
gX12
x 0 sLy H H q2 H 3Ž . Ž . Ž .e 2 2 1x< <2 t 0Ž .X Ž .where g is the reduced gravity of the two-layer model; L is the basin width; t 0 is12 x
the x-component of the wind stress at the equator; H , H are the depths of layers 1 and1 2
2, respectively, at xsL.Ž .If x 0 )0 then the shadow zone is confined in an eastern subregion of the basine
and the interior pathway is possible. In this case, two further ‘‘windows’’ can bedefined. The second one is the ‘‘western boundary exchange window’’ in which all thewater mass pathways reach the EUC via the western boundary current. The limiting
Ž .streamline x y is the one intersecting the equator in the southwestern corner of thew
basin. The western boundary exchange window is marked as ‘‘2’’ in Fig. 7. The thirdwindow is the ‘‘interior exchange window’’ with pathways originated in the subtropicsreaching the EUC in the interior, marked as ‘‘3’’ in Fig. 7. These three windows have
Žbeen demonstrated to exist in Pacific-type basins, both in idealized configurations Liu. Žet al., 1994; Liu and Philander, 1995 and in fully realistic configurations Rothstein et
. Ž .al., 1998; Harper, 1999 . From Eq. 3 , it is evident that the interior window is morelikely to exist in oceanic basins of large longitudinal extent L and for shallower and
Ž 1 .warmer isopycnals outcropping near the tropical band smaller g and H .12 2
In the isopycnal analysis that follows, we shall try to relate the subtropicalrtropicalpathways observed in the model ocean to the above conceptual framework. The analysisof this section and the following one on the float trajectories is carried out using theyearly mean properties. One of the objectives of this study is, in fact, to establishwhether the predictions of a steady-state theory can be verified in a time-dependentcalculation, in which the rectification of seasonal effects on the time mean circulationmay be important. However, trajectories evaluated in a seasonally varying circulationmay agree well with those evaluated in the yearly mean, as shown by the results of Inui
Ž .et al. 2000 . These results imply that pathways may be predicted using yearly meandata. They also imply that, at least in coarse resolution simulations, the seasonal

( )P. Malanotte-Rizzoli et al.rDynamics of Atmospheres and Oceans 32 2000 331–371 347
rectification does not modify significantly the yearly mean properties. We shall specifi-cally discuss two isopycnal surfaces that outcrop in the subtropics, the first one being thesurface s s25.0 kgrm3 the depth of which, averaged over year 10, was shown in Fig.u
4a. It outcrops in the Northern Atlantic at 208N east of 408W, i.e. in the region where thewestern boundary current exchange window and the interior exchange window originate.The second isopycnal surface considered is s s25.5 kgrm3, the average depth ofu
which for year 10 is shown in Fig. 8. The isopycnal outcrops only in the NorthernAtlantic within the model domain, again at 208N but now only west of ;308W, withthe outcropping line shifting to G308N in the western half. In both isopycnal depths,the pattern of the equatorial–tropical current system is quite evident.
Fig. 8. Depth of the isopycnal surface s s25.5 kgrm3 averaged over year 10 of the time evolution.u

( )P. Malanotte-Rizzoli et al.rDynamics of Atmospheres and Oceans 32 2000 331–371348
Ž.
3Ž.
3Fi
g.9.
aB
erno
ulli
isol
ines
ons
s25
.0kg
rm
.b
Ber
noul
liis
olin
eson
ss
25.5
kgr
m.
uu

( )P. Malanotte-Rizzoli et al.rDynamics of Atmospheres and Oceans 32 2000 331–371 349
The main diagnostics used is the Bernoulli function, which for a stratified fluid andfor large scale motions is defined as:
0B s sr ghqg ryr s d z 4Ž . Ž . Ž .H0
Ž .z s
where ssry1000 is the isopycnal surface of interest and h the sea surface elevationŽ .Cox and Bryan, 1984 . Thus, the Bernoulli function is the equivalent of the total layerthickness h of the layer model. B-isolines are geostrophic streamlines that measuregeostrophic flow away from the equator and from the western boundary current.According to the conceptual framework previously discussed, after subduction PV isconserved along B-streamlines and the flow is parallel to them. Fig. 9a,b shows the
3 Ž .Bernoulli isolines on the two considered isopycnal surfaces, s s25.0 kgrm Fig. 9au3 Ž . Ž .and s s25.5 kgrm Fig. 9b . The corresponding maps of PV not presented showu
that in the basin interior, away from the near-equatorial band, Bernoulli and PV isolinesare parallel. On s s25.0 kgrm3 closed B-contours exist only in a small region of theu
Northern subtropical gyre comprising the Caribbean, through which the major transportflows of the NEC entrained into the Florida current and the subtropical gyre. All theother B-contours are ‘‘blocked’’ by outcropping on this surface. In the southern basin,almost all contours reach the equator via the western boundary where the NBC flows.Both in the Northern and Southern basins, an interior pathway to the equator seems toexist, with a B-isoline reaching its westernmost extension at 458W, 108N before turningsoutheastward. Notice an ‘‘island’’ of seemingly flat B-values limited by the eastern-most isoline that subducts at 258W, 208N, turns eastwards at 358W, 168W and reachesthe African coast.
3 Ž .On the s s25.50 kgrm surface Fig. 9b , the recirculating windows are quiteu
evident both in the northern and southern subtropical gyres. In the southern basin, thebifurcating streamline reaches the western boundary at 408W, 208S. In the northernbasin, the B-streamline outcropping at ;308W, 228N closes the northern subtropicalgyre, which is quite broad on this isopycnal. Again, the major transport of the NECflows through the Caribbeans into the Florida current. On this surface, however, all thepathways to the equator are confined to the western boundary exchange windows, i.e.they reach the western boundary currents before turning equatorward in both hemi-spheres. Again, quite noticeable is the island of seemingly flat B-values in the northernbasin protruding into the interior from the African Coast.
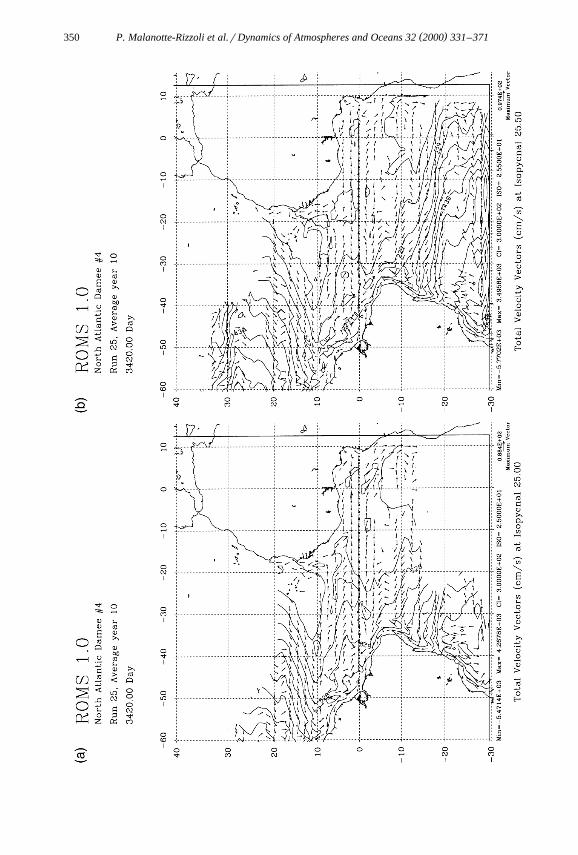
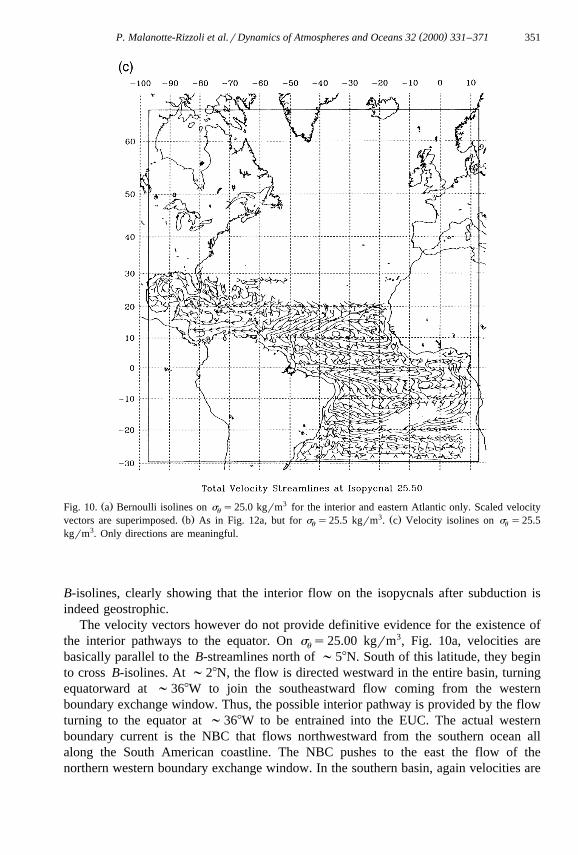
To make the subtropicalrtropical pathways more evident, we restrict the visualizationof the B-streamlines to the interior and eastern regions, excluding the recirculatingwindow of the northern subtropical gyre. Thus, in Fig. 10a,b, we show again the
3 Ž . 3 Ž .B-streamlines on s s25.0 kgrm Fig. 10a and s s25.5 kgrm Fig. 10b , respec-u u
tively, but in the subregion of the Atlantic east of 608W. Also, we superimpose to theB-isolines the actual velocity vectors on the considered isopycnal. To show clearly thevelocity directions in regions of weak flow, the vectors have been scaled linearlybetween the maximum velocity V and 1r2 V . Also, velocities smaller than 2% ofmax max
V are not shown.maxŽAway from the equatorial band where geostrophy does not hold the band comprised
.between ;48S and ;48N in Fig. 10a,b , velocity vectors are mostly parallel to
( )P. Malanotte-Rizzoli et al.rDynamics of Atmospheres and Oceans 32 2000 331–371350
( )P. Malanotte-Rizzoli et al.rDynamics of Atmospheres and Oceans 32 2000 331–371 351
Ž . 3Fig. 10. a Bernoulli isolines on s s25.0 kgrm for the interior and eastern Atlantic only. Scaled velocityu
Ž . 3 Ž .vectors are superimposed. b As in Fig. 12a, but for s s25.5 kgrm . c Velocity isolines on s s25.5u u
kgrm3. Only directions are meaningful.
B-isolines, clearly showing that the interior flow on the isopycnals after subduction isindeed geostrophic.
The velocity vectors however do not provide definitive evidence for the existence ofthe interior pathways to the equator. On s s25.00 kgrm3, Fig. 10a, velocities areu
basically parallel to the B-streamlines north of ;58N. South of this latitude, they beginto cross B-isolines. At ;28N, the flow is directed westward in the entire basin, turningequatorward at ;368W to join the southeastward flow coming from the westernboundary exchange window. Thus, the possible interior pathway is provided by the flowturning to the equator at ;368W to be entrained into the EUC. The actual westernboundary current is the NBC that flows northwestward from the southern ocean allalong the South American coastline. The NBC pushes to the east the flow of thenorthern western boundary exchange window. In the southern basin, again velocities are

( )P. Malanotte-Rizzoli et al.rDynamics of Atmospheres and Oceans 32 2000 331–371352
no longer parallel to B-streamlines in the band 08 to 48S. A possible interior pathway tothe equator is the flow that, after proceeding westward at ;48S, turns to the east at;28S, even though it is not clear whether this flow actually joins the EUC. All theremaining flow from the interior north of the bifurcation streamline at ;228S, proceedsto the western boundary and is entrained in the Brazil Current. At the equator, part of itjoins the EUC and the remainder proceeds northwestward in the NBC.
On the isopycnal s s25.5 kgrm3, Fig. 10b, it is quite evident instead that all theu
flow that at the equator is entrained into the EUC comes from the western boundaryexchange windows in both hemispheres. Again, velocity vectors in the interior, awayfrom the equatorial band, are by and large parallel to B-streamlines, showing that the
Fig. 11. Trajectories over 20 years of 30 floats deployed at 50 m depth in an array covering the entire basinŽ . Ž .longitudinally in the Northern hemisphere. a Floats deployed at ;218N. b Floats deployed at ;22.58N.
Ž .c Floats deployed at ;258N.

( )P. Malanotte-Rizzoli et al.rDynamics of Atmospheres and Oceans 32 2000 331–371 353
Ž .Fig. 11 continued .
Ž .interior flow is geostrophic. Adding the inertia terms to Eq. 4 , i.e. evaluating the fullBernoulli function, does not modify the interior streamlines where nonlinearity isnegligible. Significant changes occur in the Bernoulli contours only in a very narrow
Ž .band of "18 in latitude centered at the equator and on the EUC figures not shown .The final very interesting feature in Fig. 10a,b is the island of seemingly flat
B-values in the northern hemisphere. Actually, B-contours are closed inside the islandbut the gradients of B are so weak that they are not resolved by the contour interval. Asvelocities smaller than 2% of V are not shown, the flow inside the islands of closedmax
B-contours is extremely weak, ;1.5 cmrs on both surfaces. There is an interior closedcyclonic circulation, which can be revealed by plotting the isolines parallel at each gridpoint to the local Eulerian velocity, i.e. visualizing only the flow direction. The velocityisolines on the isopycnal s s25.5 kgrm3 are shown in Fig. 10c and the closedu

( )P. Malanotte-Rizzoli et al.rDynamics of Atmospheres and Oceans 32 2000 331–371354
Ž .Fig. 11 continued .
cyclonic circulation emerges inside the B-pool. In the language of the ventilatedthermocline, i.e. not taking into account the tropical wind system, the Bernoullistreamline limiting the closed cyclonic circulation in the subtropical band 108 to 208N,
Ž .corresponds to the boundary x y of the eastern shadow zone.e
5. Floats trajectories
The analysis of Bernoulli streamlines and velocity vectors on isopycnal surfacesshowed the possibility of interior exchange windows to the equator from both thenorthern and southern subtropics on s s25.0 kgrm3, but did not prove it unambigu-u
ously. We therefore deployed floats in the northern and southern latitudinal bands wheresubduction occurs of the isopycnals possibly feeding the EUC. The northern floats are

( )P. Malanotte-Rizzoli et al.rDynamics of Atmospheres and Oceans 32 2000 331–371 355
Ž . Ž .deployed in a 30 East–West by 10 North–South array covering the entire basinlongitudinally. They were deployed between 198N and 268N, thus at a D y,0.788
Ž . Žresolution. The southern floats were also deployed in a 30 East–West by 10 North–.South array covering the entire basin longitudinally. They were launched between 78S
and 258S, thus at a D y,0.98 resolution. All the floats were started at 508 m depth, i.e.Žbelow the surface planetary boundary layer in the considered latitudinal bands Haidvo-
.gel et al., 2000 . Diabatic processes are important in the planetary boundary layer, andthe objective of this study is to follow the trajectories where the motion is basicallyadiabatic for comparison with the theoretical predictions.
Ž .The 10-year flow climatology is evaluated by averaging over year 10 the u,Õ,wvelocities. These velocities are used to integrate the floats in time for 20 years, using a
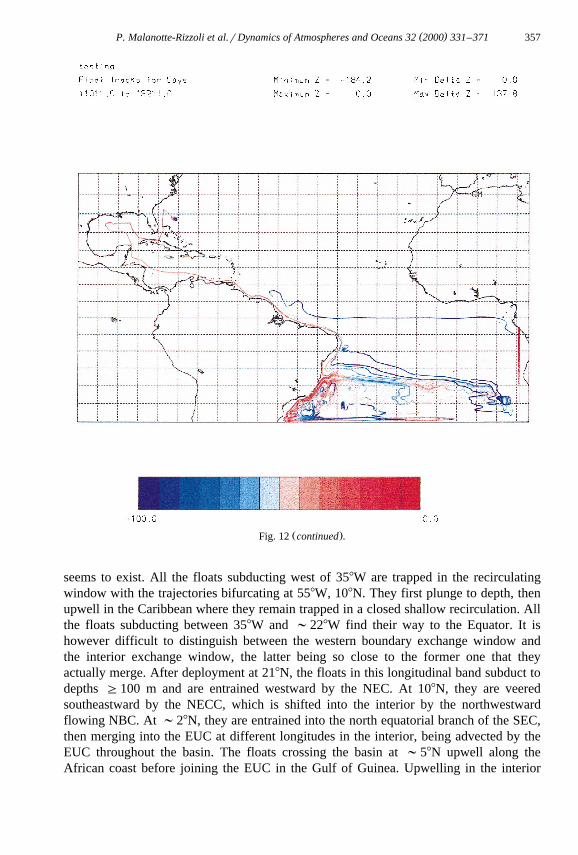
Fig. 12. Trajectories over 20 years of 30 floats deployed at 50 m depth in an array covering the entire basinŽ . Ž . Ž .longitudinally in the Southern hemisphere. a Floats deployed at ;68S. b Floats deployed at ;108S. c
Floats deployed at ;258S.

( )P. Malanotte-Rizzoli et al.rDynamics of Atmospheres and Oceans 32 2000 331–371356
Ž .Fig. 12 continued .
4th order Runge–Kutta timestepping scheme. To find the velocity at a float location, atrilinear interpolation is performed from the velocities on the model grid. The landmarkis accounted for, so floats near an island will not be contaminated by the zero velocitiesinside the island. In the float trajectories shown in the following figures, the color plateindicating the float depth varies in the range 0–100 m, thus all depths below 100 m areshown by the same color. This procedure was made necessary because in most trajectoryplots, few floats fell into sink holes south of Cuba, down to ;300 m, thus making theremainder of the trajectory to appear erroneously as a subsurface one.
In Fig. 11a–c, we show the trajectories over 20 years of floats deployed at ;218NŽ . Ž . Ž .Fig. 11a ; 22.58N Fig. 11b and 258N Fig. 11c . The float trajectories are ratherstriking and they show unambiguously that there is indeed a very important route from
Ž .the injection subduction latitude to the equator. The pattern of trajectories is the moststriking for the floats deployed at 218N, Fig. 11a, where an interior pathway to the EUC
( )P. Malanotte-Rizzoli et al.rDynamics of Atmospheres and Oceans 32 2000 331–371 357
Ž .Fig. 12 continued .
seems to exist. All the floats subducting west of 358W are trapped in the recirculatingwindow with the trajectories bifurcating at 558W, 108N. They first plunge to depth, thenupwell in the Caribbean where they remain trapped in a closed shallow recirculation. Allthe floats subducting between 358W and ;228W find their way to the Equator. It ishowever difficult to distinguish between the western boundary exchange window andthe interior exchange window, the latter being so close to the former one that theyactually merge. After deployment at 218N, the floats in this longitudinal band subduct todepths G100 m and are entrained westward by the NEC. At 108N, they are veeredsoutheastward by the NECC, which is shifted into the interior by the northwestwardflowing NBC. At ;28N, they are entrained into the north equatorial branch of the SEC,then merging into the EUC at different longitudes in the interior, being advected by theEUC throughout the basin. The floats crossing the basin at ;58N upwell along theAfrican coast before joining the EUC in the Gulf of Guinea. Upwelling in the interior

( )P. Malanotte-Rizzoli et al.rDynamics of Atmospheres and Oceans 32 2000 331–371358
Ž .EUC is on the other side not present , and the floats upwell only upon reaching theAngola Undercurrent that entrains them southward. A longitudinal section at the equator
Ž .of the zonal velocity component u not shown reveals first a strong NBC confined inthe western boundary with the NBC core reaching the speed of ;y50 cmrs in theupper 100 m. The EUC is confined between ;50 and ;150–200 m depth below thewestward flowing surface SEC. The EUC core velocities reach ;70 cmrs at ;100 mdepth, thus not unreasonable values. An unrealistic feature of the model EUC is howeverthe already noted lack of interior upwelling.
In Fig. 11b, for the floats injected at 22.58N, transport from the deployment latitudeto the equator and entrainment into the EUC still exists. The western boundary exchangewindow however shrinks considerably. The window becomes extremely narrow for thefloats injected at 258N, Fig. 11c, where only very few of them find their way to theEUC. Most of them are entrained in the closed shallow recirculation of the Caribbean.
Ž . Ž .Fig. 13. Ekman pumping velocity for a February and b August in mrday. The band 48S to 48N centered atthe equator must not be considered as the evaluation fails when f™0.

( )P. Malanotte-Rizzoli et al.rDynamics of Atmospheres and Oceans 32 2000 331–371 359
Ž .Fig. 13 continued .
Interestingly, one float escapes the Caribbean, migrates into the Gulf of Mexico and isfinally entrained into the Florida current and the subtropical gyre. For the floats
Ž .deployed north of 258N not shown , the western boundary exchange window disappearsand they all recirculate in the subtropical gyre. While the western boundary exchangewindow shrinks, the interior region where floats cannot penetrate correspondinglybroadens. This region constitutes a PV barrier to the flow as it will be discussed in thefollowing.
The following conclusions can be inferred from the float trajectories for the Northernocean. Transport to the Equator and the EUC from the Northern subtropics is quiteimportant, comprising the longitudinal band 558 to 458W at 108N for the floats injectedat and south of ;228N. The isopycnals outcropping at these latitudes are in the ranges s24.5–25.00 kgrm3. The interior routes to the equator are adjacent to the pathwaysu
reaching first the western side of the basin, merging gradually with them. Thus, it maybe appropriate to state that the exchange between the subtropical and tropical North

( )P. Malanotte-Rizzoli et al.rDynamics of Atmospheres and Oceans 32 2000 331–371360
Atlantic ocean occurs through a broad western boundary exchange window at 108N,which allows for interior pathways to the EUC south of 58N. A water mass analysiswould not be helpful in the interpretation because the internal density structure isbasically the Levitus one, which is maintained also because of the surface boundary
Ž .condition for salinity relaxation to the Levitus climatology . The major modification isnot due to water mass transformations but to wind-driven effects that sharpen the currentsystem and tighten the density fronts.
The final remarkable feature to be discussed is the elongated region between 108 and158N, east of 408W, corresponding to the island of closed B-contours observed in theBernoulli function. Floats do not penetrate into this pool. Those injected and subductingeast of 208W actually do not reach the EUC but flow cyclonically around this regionŽ .see Fig. 10c , in a closed loop. They also upwell along the African coast in thewell-known upwelling Guinea dome.
For the southern floats, we show in Fig. 12a–c the floats deployed, again over theŽ . Ž .entire longitudinal extent, respectively, at ;68S Fig. 12a , ;108S Fig. 12b and 258S
Ž .Fig. 12c .The floats deployed at ;68S, Fig. 12a, follow two distinct routes. All the floats
injected west of ;118W finally find their way to the western boundary, some directly,others after having followed more convoluted pathways. Marked in Fig. 12a is the floattrajectory separating the two regions. All the floats on the western side downwell in theinterior between 208 and 358W, migrate to the equator at depth nearby the shallower partof the NBC and are finally entrained into the EUC. Inside it they cross the entire basinupwelling only when advected southward by the Guyana current. The floats injected eastof ;118W migrate instead eastward, upwell in the Guyane current migrating southwarduntil ;188S where they turn eastward inside the SEC. Here, they cross the basinwestward and reach the western boundary, where a number of them are entrained in thesouthward western boundary current of the southern subtropical gyre. The remainder andmajority of the floats are advected northwestward inside the shallow part of the NBC,crossing the equator and reaching the southern Caribbean, touring cyclonically aroundthe Gulf of Mexico and finally entering the Florida current. None of this second groupof floats is entrained into the EUC.
Ž .Examination of a longitudinal cross-section of u-velocity at 108S not shown revealsthat, near the western strong core of the NBC there is a broad region of westwardvelocities west of ;108W confined in the upper ;300 m. East of ;108W, on theother side, a broad pool is present of weaker eastward flow below the upper 50 m. Thiszonal flow pattern clearly explains the two separate routes followed by the floats.
In Fig. 12b, the floats deployed at ;108S follow a similar pattern with a major, veryimportant difference. Part of the floats flowing northwestward along the westernboundary are entrained into the EUC directly at the Equator. Others, however, overshootcrossing the equator, but then retroflect and join the EUC in a path well knownobservationally. The NBC is still strong and vigorous all along the South Americancoast to the Gulf of Mexico.
The floats deployed at 258S presented in Fig. 12c, show on the other side a differentbehavior. The vast majority of them are entrained in the recirculating window of theSouthern Subtropical Gyre, with the bifurcating latitude at ;178S. Few floats migrate

( )P. Malanotte-Rizzoli et al.rDynamics of Atmospheres and Oceans 32 2000 331–371 361
northwestward in the NBC, rather narrow and weak, again with a partial retroflectioninto the EUC.
The conclusions that can be inferred from the float trajectories for the SouthernOcean are quite clear. No interior exchange window exists. The western boundaryexchange window is well defined and important, with net transport to the equator part ofwhich is entrained directly into the EUC while the remainder flows northwestward in astrong NBC. Some of the floats trapped inside the NBC retroflect at ;88N to join theEUC. The western boundary exchange from the subtropics to the equator is again strongfor the floats deployed and subducting in the shallower and warmer isopycnals that
y1 y1 Ž . 3Fig. 14. Potential vorticity in s m for the year 10 mean properties evaluated on: d s s24.00 kg m ;u
Ž . 3 Ž . 3b s s24.5 kgrm ; c s s25.0 kgrm .u u

( )P. Malanotte-Rizzoli et al.rDynamics of Atmospheres and Oceans 32 2000 331–371362
Ž .Fig. 14 continued .
outcrop north of ;158S. Due to the limited extent of the Southern ocean, completedisappearance of the western boundary exchange window cannot be observed.
6. The effect of the ITCZ
In this section, we address the issue of whether the impact of the ITCZ in creating aPV barrier in the surface layer is compensated at depth by the interior stratification. TheCOADS monthly climatology of the wind stress field reveals the importance of theITCZ, i.e. the convergence of the northern and southern trades. While in the Pacific

( )P. Malanotte-Rizzoli et al.rDynamics of Atmospheres and Oceans 32 2000 331–371 363
Ž .Fig. 14 continued .
Ocean the ITCZ is confined to the eastern half of the basin, the ITCZ covers a ratherbroader region of the Tropical Atlantic due to the rather smaller longitudinal extent ofthe basin in the tropics. Also, the Atlantic ITCZ has a very strong seasonal fluctuation.In Winter, it covers the band 08–108N, with the wind–stress curl reaching the maximumintensity of 1 dynrcm3. In summer, the ITCZ is shifted northward covering the band10–208N, with the wind–stress curl reaching the stronger maximum intensity of 1.5dynrcm3. The corresponding Ekman pumping velocity is evaluated as:
™1 tw s curl . 5Ž .E z ž /r f

( )P. Malanotte-Rizzoli et al.rDynamics of Atmospheres and Oceans 32 2000 331–371364
Ekman pumping velocity fields for February and August, in mrday, are shown in Fig.13a,b, respectively. The near-equatorial band from ;58S to ;58N where f™0 isexcluded from consideration. In Fig. 13a, the February pattern, the upwelling regionbetween 58 and ;208N at the eastern boundary is confined east of 258W. It reaches208N in the well-known Guinea dome when the northern floats were seen to upwell. Theremainder of the tropical band shows a diffuse downwelling region. The August pattern,Fig. 13b, is completely different. The upwelling region is shifted northward, between108 and 158N, and forms a well-defined ‘‘island’’ elongated between ;458 and;208W. This upwelling ‘‘island’’ creates a region of high PV in the surface layer andhence a PV-barrier for the water columns and the floats subducting north of ;158N. Inthe language of the ventilated thermocline, and taking the conceptual analog of atwo-layer model, subducted water columns must conserve frh . In their movement to2
the equator, f decreases and the columns cannot pass under the surface high PV pool
3 ŽFig. 15. Bernoulli function on the isopycnal s s24.5 kgrm with superimposed velocity vectors notu
. Ž . Ž . Ž .scaled . a Average fields of year 10 of the evolution. b February fields. c August fields.
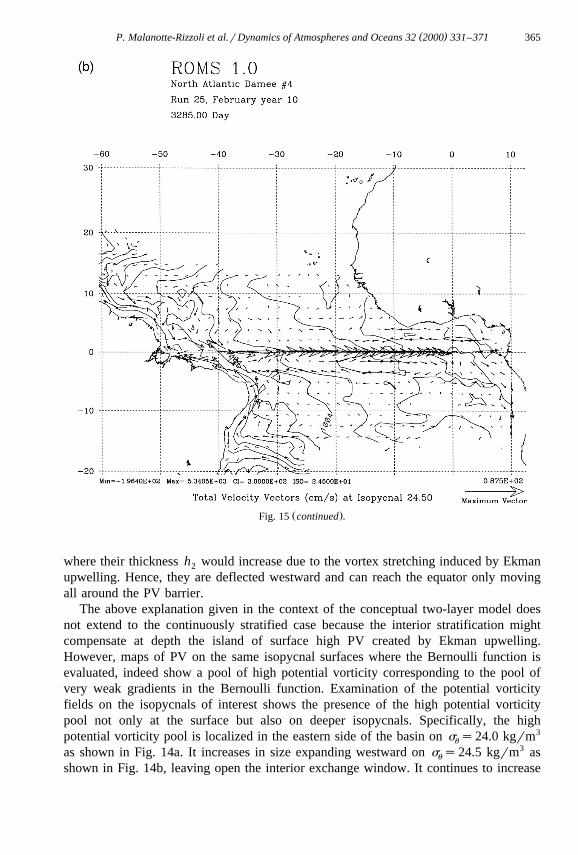
( )P. Malanotte-Rizzoli et al.rDynamics of Atmospheres and Oceans 32 2000 331–371 365
Ž .Fig. 15 continued .
where their thickness h would increase due to the vortex stretching induced by Ekman2
upwelling. Hence, they are deflected westward and can reach the equator only movingall around the PV barrier.
The above explanation given in the context of the conceptual two-layer model doesnot extend to the continuously stratified case because the interior stratification mightcompensate at depth the island of surface high PV created by Ekman upwelling.However, maps of PV on the same isopycnal surfaces where the Bernoulli function isevaluated, indeed show a pool of high potential vorticity corresponding to the pool ofvery weak gradients in the Bernoulli function. Examination of the potential vorticityfields on the isopycnals of interest shows the presence of the high potential vorticitypool not only at the surface but also on deeper isopycnals. Specifically, the highpotential vorticity pool is localized in the eastern side of the basin on s s24.0 kgrm3
u
as shown in Fig. 14a. It increases in size expanding westward on s s24.5 kgrm3 asu
shown in Fig. 14b, leaving open the interior exchange window. It continues to increase

( )P. Malanotte-Rizzoli et al.rDynamics of Atmospheres and Oceans 32 2000 331–371366
Ž .Fig. 15 continued .
in size and to expand westward on s s25.00 kgrm3, shown in Fig. 14c, leaving nowu
open only the western boundary exchange window. The latter one is cut-off ons )25.5 kgrm3 and on the deeper isopycnals.u
The alternative possibility of a change in the depth-integrated circulation induced bythe seasonal movement of the ITCZ is not verified. The seasonal variability of the depthintegrated transport is, in fact, almost nil. The seasonal changes occur basically in theupper layers, on the isopycnals with s -26.0 kgrm3, and are compensated by theu
intermediate and deep layers, much thicker and carrying a much greater transport.The combined effect of the ITCZ and of the interior stratification thus explains the
trajectories of the northern floats that do not penetrate inside the region of closedB-contours, corresponding to the high PV-pool. The yearly average properties clearlyreflect the summer situation when the ITCZ is strongest.
To further substantiate these conclusions, we consider the isopycnal s s24.5u
kgrm3, warmer and shallower, where the warmest upper waters of the EUC subduct. In

( )P. Malanotte-Rizzoli et al.rDynamics of Atmospheres and Oceans 32 2000 331–371 367
ŽFig. 15a–c, we show the Bernoulli function with superimposed velocity vectors not.scaled for the year-10 average field, Fig. 15a; the February pattern Fig. 15b, and the
August one, Fig. 15c, respectively. s s24.5 kgrm3 subducts at 168 to 178N in theu
yearly average pattern of Fig. 15a, which strongly reflects the summer pattern of Fig.Ž .15c. In February Fig. 15b , the outcropping line is shifted southward, at ;13–148N.
The Bernoulli streamlines and velocity vectors show quite clearly the interior pathwayof the northern flow to the equator, well distinguished from the western boundarypathway. In the Southern ocean, on the other side, a broad western boundary routeexists, merged with the NBC, that extends from the coast to ;308W. The easternregion, 308 to 158W, north of ;58N, shows an extremely weak, possibly closedcyclonic circulation. The flow pattern and Bernoulli isolines are dramatically different inAugust, Fig. 15c, reflecting the effect of the summer ITCZ. The summer s s24.5u
kgrm3 outcrops at 208N in the eastern basin. The high PV-pool of Fig. 14b, created bythe combined effect of the ITCZ and the interior stratification, creates the PV barrier forthe subducted thermocline waters and corresponding float trajectories. They cannotmigrate directly to the equator but must flow all around the PV barrier before beingentrained into the EUC inside the western boundary window.
In the language of the ventilated thermocline, the PV barrier makes more zonal theŽ .streamline x y delimiting the northern shadow zone. In the southern ocean, the routee
of the subtropical waters to the equator is consistently confined to the western boundaryexchange window via the NBC.
7. Conclusions
A primitive equation, hydrostatic, terrain-following coordinate OGCM is used toinvestigate the mean water mass pathways from the subtropics to the tropics in theAtlantic Ocean. The OGCM is endowed with a free surface and with the planetary
Ž .mixed layer parameterization of Large et al. 1994 . The OGCM is used in a fullyrealistic configuration of the Atlantic Ocean, from 308S to 658N and with realisticbathymetry. Surface forcing functions from the COADS climatology are used, whichinclude the monthly means of wind stress, heat, and freshwater fluxes. The model is
Ž .initialized with the Levitus climatology 1994 . At the northern and southern boundaries,temperature and salinity are relaxed to the monthly Levitus climatology in 38 widebuffer zones. A non eddy-resolving numerical simulation is analyzed, which has 3r48
horizontal resolution and 20 terrain-following vertical levels. The OGCM reaches awind-driven spun-up state in about 5 years and properties are examined for the yearlyaverage of the 10th year of simulation. Subtropicalrtropical water mass pathways arenot simply direct meridional routes; the existence of the tropical current system, quiterealistic in the model, complicates the pathways. Theoretical ideas extending theventilated thermocline theory to the equatorial band and the EUC are tested byevaluating the Bernoulli function on isopycnal surfaces outcropping in the subtropicsand by injecting floats at different northern and southern latitudes. The Bernoulli isolinesare streamlines of subducted geostrophic flow. The fact that velocity vectors are parallelto the Bernoulli streamlines in the basin interior, away from the near-equatorial band,shows that the subducted interior flow is indeed geostrophic. Bernoulli contours are
( )P. Malanotte-Rizzoli et al.rDynamics of Atmospheres and Oceans 32 2000 331–371368
significantly modified by the inertial terms only in a very narrow zonal band around theequator and on the EUC. Between 58N and 58S flow velocities cross significantly theBernoulli contours, thus showing the importance of the frictional terms, which arenegligible in the basin interior.
The theoretical framework leads to the definition of three ‘‘windows’’ for thesubtropicalrtropical northern and southern ocean. The first one is the ‘‘recirculatingwindow’’ in which all the northernrsouthern floats recirculate in the subtropical gyres.The second one is the ‘‘western boundary exchange window’’ in which subducted floatsreach the western boundary before turning equatorward to be entrained into the EUC atthe equator. The third one is the ‘‘interior exchange window’’ where floats reach theEUC directly in the ocean interior. As the main objective of the study is to assess thesteady, adiabatic theory in the numerical calculation meaningful comparisons can bemade by diagnosing properties in the time-mean year circulation.
In the Northern Atlantic, floats injected south of about 228N, and between 22 and358W, migrate southwestward to the western boundary, and they reach the EUCfollowing a zigzag pattern determined by the tropical current system. It is impossible todistinguish between the western boundary and the interior exchange windows, as theyare merged together forming a broad exchange region. The float trajectories cover in facta 108 broad longitudinal band. This implies a considerable transport from the northernsubtropics to the tropics and the EUC on the warm, shallow isopycnals that outcropsouth of ;228N. This pathway is pushed away from the western coastline by thenorthwestward flowing North Brazil Current, the proper western boundary current of thebasin. The exchange window shrinks and is confined to the western boundary for thefloats injected more northward and disappears for the floats injected north of ;308N,that recirculate in the subtropical gyre.
In the Southern Atlantic, all the floats injected between 68 and 158S migrate to thewestern boundary where they are entrained in the NBC. There is no interior exchangewindow. These floats migrate northwestward in the NBC. At the equator, some aredirectly entrained into the EUC, some overshoot but then retroflect at ;88N to join theEUC in a pattern that has been confirmed observationally.
Finally, we assess the impact of the seasonal cycle of the Atlantic ITCZ on the yearlymean float trajectories and exchange windows. The summer ITCZ, shifted northwardbetween 108 and 208N, creates an island of Ekman upwelling, which is reflected in theyearly average. The ITCZ upwelling and interior stratification combine to produce an‘‘island’’ of high PV and of closed Bernoulli contours with an extremely weak cycloniccirculation, thus creating a potential vorticity barrier that penetrates at depth. The floatssubducted at and north of 208N cannot penetrate below the PV barrier but areconstrained by PV conservation to flow all around it to reach the equator. In the yearlymean properties, an interior exchange window is present even though merged with thewestern boundary exchange window. Furthermore, trajectories evaluated in seasonallyvarying calculations may agree well with the yearly averaged ones in spite of the strongseasonal variability of the Bernoulli function due to the ITCZ variability, as shown by
Ž .the simulations of Inui et al. 2000 , implying that pathways may be predicted usingyearly mean data. This result also shows that, at least in coarse resolution simulations,the seasonal rectification does not modify significantly the yearly mean properties.

( )P. Malanotte-Rizzoli et al.rDynamics of Atmospheres and Oceans 32 2000 331–371 369
The important transport to the EUC in the Northern Atlantic seems to contradict theobservational evidence indicating that most of the EUC water is of southern origin. TheMOC of the Atlantic may be responsible for inhibiting the pathway to the equator fromthe northern subtropics through the MOC upper northward return flow. The modelMOC, even though unrealistically shifted southward, has nevertheless a somewhatrealistic upper return flow of ;12 Sv. We conjecture that the route to the equator fromthe northern subtropics may be completely blocked if a more realistic MOC weresuperimposed to the wind-driven circulation by prescribing a northward flow at thesouthern boundary.
Acknowledgements
This research has been supported by the Office of Naval Research under the´ Ž .DAMEE-NAB project under grant aNØØØ14-95-1-0226 at MIT P. Malanotte-Rizzoli
Ž .and Grant aNØØØ-14-93-1-0197 at Rutgers University D.B. Haidvogel until Decem-ber 31, 1998. The completion of the research in 1999 has been supported under NASA
Ž .Contract NAG5-7194 at MIT P. Malanotte-Rizzoli .
References
Blanke, B., Raynaud, S., 1997. Kinematics of the Pacific Equatorial Undercurrent: an Eulerian and Lagrangianapproach from GCM results. J. Phys. Oceanogr. 27, 1038–1053.
Broecker, W.S., Peng, T.H., 1982. Tracers in the Sea. Lamont-Doherty Geological Observatory, Palisades,NY, 690 pp.
Bryan, F., 1991. Poleward heat transport in the ocean. Tellus 43, 104–115.Butt, J., Lindstrom, E., 1994. Currents off east coast of New Ireland, Papua, New Guinea, and their relevance
to regional undercurrents in the western equatorial Pacific ocean. J. Geophys. Res. 99, 12503–12514.Cox, M.D., Bryan, K., 1984. A numerical model of the ventilated thermocline. J. Phys. Oceanogr. 14,
674–687.DaSilva, A.M., Young C.C., S. Levitus, 1994. Atlas of surface marine data, 1994.Duing, W., Molinari, R.L., Swallow, J.C., 1980. Somali current: Evolution of surface flow, Science 209,¨
588–590.Fine, R.A., 1987. The penetration of tritium into the tropical Pacific. J. Phys. Oceanogr. 17, 553–564.Fine, R.A., Reid, J.L., Ostlund, H.G., 1981. Circulation of tritium in the Pacific Ocean. J. Phys. Oceanogr. 11,
3–14.Fratantoni, D.M. On the pathways and mechanisms of upper-ocean mass transport in the tropical Atlantic
ocean, PhD thesis, RSMAS Technical Report 96-006, pp. 247.Fratantoni, D.M., Johns, W.E., Townsend, T.L., Hurlburt, H.E., 2000. Low latitude circulation and mass
transport pathways in a model of the tropical Atlantic Ocean, J. Phys. Oceanogr., submitted.Haidvogel, D.B., Wilkin, J.L., Young, R.E., 1991. A semi-spectral primitive equation ocean circulation model
using vertical sigma and orthogonal curvilinear horizontal coordinates. J. Comput. Phys. 94, 151–185.Haidvogel, D.B., Arango, H., Hestrom, K., Beckmann, A., Malanotte-Rizzoli, P., Shchepetkin, S., 2000.
Model evaluation experiments in the North Atlantic basin: simulations in nonlinear terrain-followingcoordinates. Dyn. Atmos. Oceans 32, 239–381.
Harper, S., 2000. Thermocline ventilation and pathways of tropical–subtropical water mass exchange, Tellus,submitted.

( )P. Malanotte-Rizzoli et al.rDynamics of Atmospheres and Oceans 32 2000 331–371370
Hedstrom, K.S., 1994. User’s manual for a semi-spectral primitive equation ocean circulation model, Version3.9, Institute of Marine and Coastal Sciences Rutgers University. 131 pp.
Inui, T., Lazar, A., Malanotte-Rizzoli, P., Busalacchi, A.J., 2000. Wind stress effect on the subtropical–tropi-cal circulation in the Atlantic, in preparation.
Large, W.G., McWilliams, J.C., Doney, S.C., 1994. Oceanic vertical mixing: a review and a model with anonlocal boundary layer parameterization, Rev. Geophys. 32, 363–403.
Lindstrom, E., Lukas, R., Fine, R., Firing, E., Godfrey, S., Meyers, G., Tsuchiya, M., 1987. The westernequatorial Pacific ocean circulation study. Nature 330, 533–537.
Liu, Z., 1994. A simple model of the mass exchange between the subtropical and tropical ocean. J. Phys.Oceanogr. 24, 1153–1165.
Liu, Z., Philander, S.G.H., Pakanowski, R.C., 1994. A GCM study of tropical–subtropical upper-ocean waterexchange. J. Phys. Oceanogr 24, 2606–2623.
Liu, Z., Philander, S.G.H., 1995. How different wind stress patterns affect the tropical–subtropical circulationsof the upper ocean. J. Phys. Oceanogr. 25, 449–462.
Lu, P., McCreary, J.P., 1995. Influence of the ICTZ on the flow of thermocline water from the subtropical tothe equatorial Pacific Ocean. J. Phys. Oceanogr. 25, 3076–3088.
Lu, P., McCreary, J.P., Klinger, B.A., 1998. Meridional circulation cells and the source waters of the PacificEquatorial Undercurrent. J. Phys. Oceanogr. 28, 62–84.
Luyten, J.R., Pedlosky, J., Stommel, H., 1983. The ventilated thermocline. J. Phys. Oceanogr. 13, 292–309.Marshall, J.C., Nurser, A.F.G., 1991. A continuously stratified thermocline model incorporating a mixed layer
of variable depth. J. Phys. Oceanogr. 21, 1780–1792.McCartney, M.S., 1993. Crossing of the equator by the Deep Western Boundary Current in the Western
Atlantic Ocean. J. Phys. Oceanogr. 23, 1953–1974.McCreary, J.P., 1985. Modeling equatorial ocean circulation. Annu. Rev. Fluid Mech. 17, 359–409.McCreary, J.P., Lu, P., 1994. On the interaction between the subtropical and equatorial ocean circulation: the
subtropical cell. J. Phys. Oceanogr. 24, 466–497.Metcalf, W.G., Stalcup, M., 1967. Origins of the Atlantic Equatorial Undercurrent. J. Geophys. Res. 72,
4959–4975.National Geophysical Data Center, 1988. Digital relief of the surface of the Earth, Data Announcement
88-MGG-02, NOAA, Boulder, CO.Pedlosky, J., 1987. An inertial theory of the equatorial undercurrent. J. Phys. Oceanogr. 17, 1978–1985.Pedlosky, J., 1988. Entrainment and the termination of the equatorial undercurrent. J. Phys. Oceanogr. 18,
880–886.Pedlosky, J., 1990. The dynamics of the oceanic subtropical gyres. Science 248, 316–322.Pedlosky, J., 1991. The link between western boundary current and equatorial undercurrent. J. Phys. Oceanogr.
21, 1553–1558.Pedlosky, J., 1997. Ocean circulation theory. Springer-Verlag, 453 pp.Pedlosky, J., Robbins, P., 1991. The role of finite mixed-layer thickness in the structure of the ventilated
thermocline. J. Phys. Oceanogr. 21, 1018–1031.Pedlosky, J., Samuelson, R.M., 1989. Wind forcing and the zonal structure of the equatorial undercurrent. J.
Phys. Oceanogr. 19, 1244–1254.Philander, S.G.H., 1990. El Nino, La Nina and the Southern Oscillation. Academic Press, 293 pp.˜ ˜Rhines, P., 1986. The vorticity dynamics of ocean circulation. Annu. Rev. Fluid Mech. 18, 433–447.Rothstein, L.M., Zhang, R.-H., Busalacchi, A.J., Chen, D., 1998. A numerical simulation of the mean water
pathways in the subtropical and tropical Pacific Ocean. J. Phys. Oceanogr. 28, 322–343.Schmitz, W.J. Jr., 1995. On the interbasin-scale thermohaline circulation. Rev. Geophys. 33, 151–173.Schmitz, W.J. Jr., McCartney, M.S., 1993. On the North Atlantic circulation. Rev. Geophys. 31, 29–49.Song, Y., Haidvogel, D.B., 1994. A semi-implicit ocean circulation model using a generalized topography-fol-
lowing coordinate. J. Comput. Phys. 115, 228–244.Speer, K.G., McCartney, M.S., 1991. Tracing lower North Atlantic Deep Water across the equator. J.
Geophys. Res. 96, 20443–20448.Tsuchiya, M., 1981. The origin of the Pacific equatorial 138C water. J. Phys. Oceanogr. 11, 794–812.Tsuchiya, M., Lukas, R., Fine, R.A., Lindstrom, E., 1989. Source waters of the Pacific equatorial undercurrent.
Prog. Oceanogr. 23, 101–147, Pergamon.

( )P. Malanotte-Rizzoli et al.rDynamics of Atmospheres and Oceans 32 2000 331–371 371
Wilson, W.D., Johns, E., Molinari, R.L., 1994. Upper layer circulation in the western tropical North Atlanticocean during August, 1989. J. Geophys. Res. 99, 22513–22523.
Wyrtki, K., 1975. Fluctuations in the dynamic topography in the Pacific Ocean. J. Phys. Oceanogr. 5,450–459.
Wyrtki, K., Kilonsky, B., 1984. Mean water mass and current structure during the Hawaii-to-Tahiti ShuttleExperiment. J. Phys. Oceanogr. 14, 242–254.