water pollution
DESCRIPTION
Water Pollution. Distribution of Water Reservoirs. Oceans 97%. Ice Caps and Glaciers 1.725%. Atmosphere 0.01%. Rivers, Lakes, and Inland Seas 0.141%. Soil Moisture 0.0012%. Ground Water 0.4 – 1.7%. World Water Supply. 97.200% salt water in the oceans - PowerPoint PPT PresentationTRANSCRIPT

Water Pollution
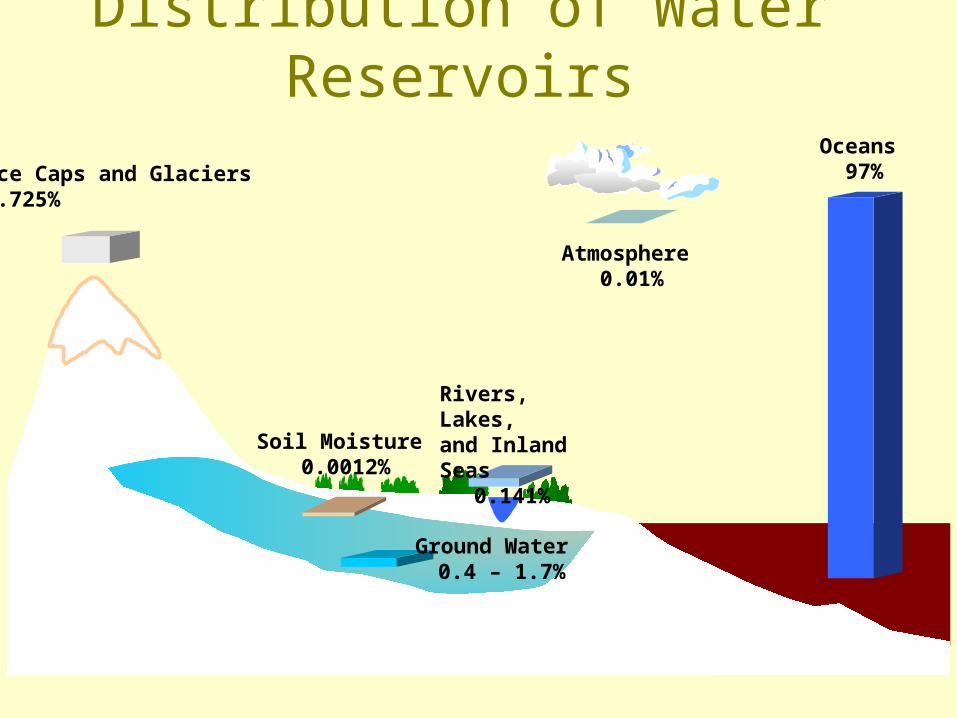
Distribution of Water ReservoirsOceans
97%
Atmosphere 0.01%
Rivers, Lakes, and Inland Seas
0.141%Soil Moisture 0.0012%
Ground Water 0.4 – 1.7%
Ice Caps and Glaciers 1.725%

World Water Supply
97.200% salt water in the oceans 02.014% ice caps and glaciers 00.600% groundwater 00.009% surface water 00.005% soil moisture 00.001% atmospheric moisture
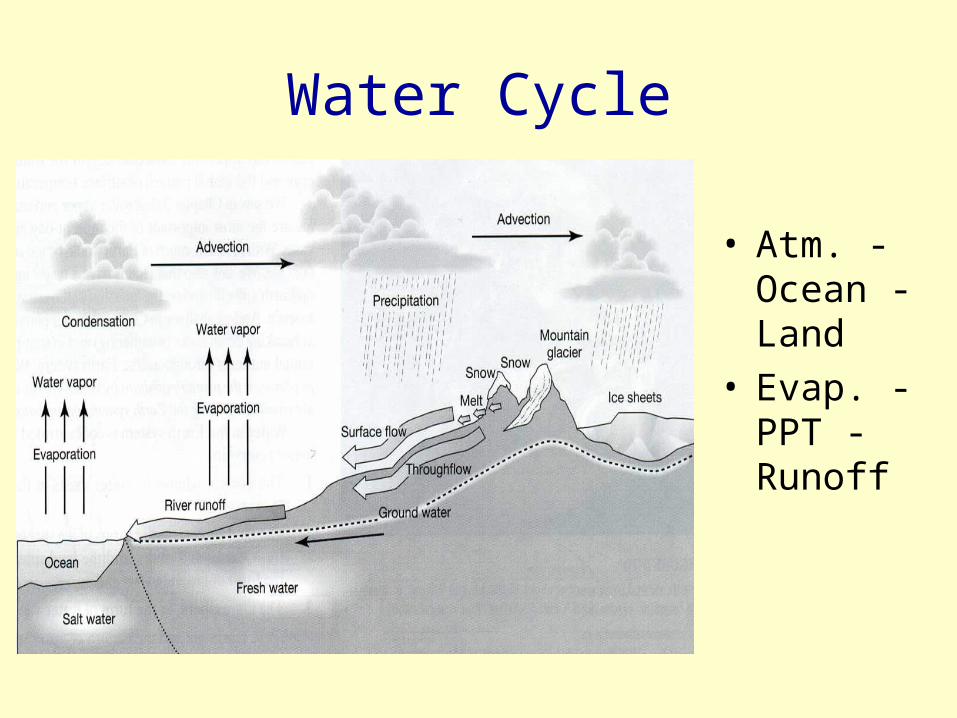
Water Cycle
• Atm. -Ocean - Land
• Evap. - PPT - Runoff
Water Pollution
Two major classifications
• Point Source • Non-point Source

Point Sources
• Single large source
• Can localize it to one spot– Industrial Plants
- Sewage pipes

Point Source - Example
• LUST - Leaky Underground Storage Tanks• 22% of the 1.2 million UST are LUST
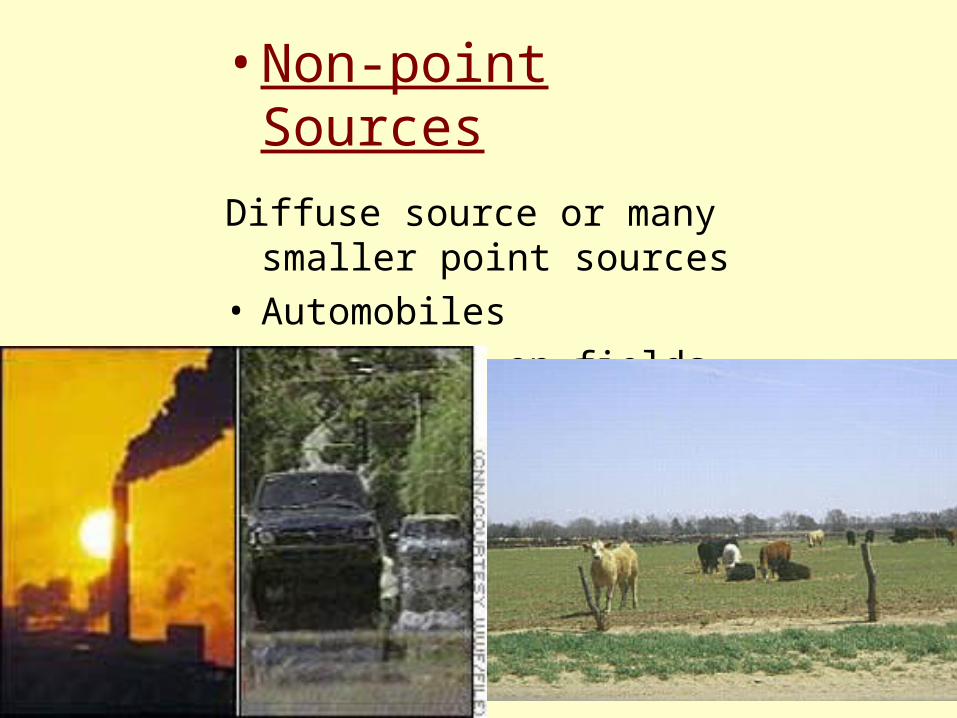
• Non-point Sources
Diffuse source or many smaller point sources
• Automobiles• Fertilizer on fields
Water Pollution: Many Forms
• Disease: In developing nations, 80% of diseases are water-related.
• Synthetic Organic Compounds• Inorganic Compounds & Mineral Substances such as
Acids, etc.• Radioactive substances• Oxygen-demanding wastes• Plant Nutrients• Sediments• Thermal Discharges

Examples of Polluted Waters


A very personal look at water
• What happens to your water before you drink it?
• What happens to your water after you dispose of it?– Approximately 99% of Swedes are served by
wastewater treatment plants, 86.5% of Germans, 74% of Americans, and 57% of Canadians.

What constitutes quality drinking water?• Free of pollutants• Tastes good
– Want Sodium Bicarbonate and Calcium Sulfate in same concentrations as found in saliva
– 10 oC– As little chlorination as possible
• Calcium & magnesium account for most water hardness, death rates (cardiovascular disease) higher in soft water areas than in hard water areas
• Copper needed to absorb & metabolism iron, but >1mg/liter makes water unpalatable
• Does taste correlate with presence of toxic compounds?
Forms of Pollution – Details
• Inorganic – acids, salts, toxic metals
• One gram of lead in 20,000 liters of water makes it unfit for drinking. Lead is often found in the pipes of older homes
• What is the safe drinking water limit for arsenic? For lead? How much does UA water supply have?

Forms of Pollution – Details
• Organic: sewage, pesticides, plastics, etc.• One drop of oil can render up to 25 liters of
water unfit for drinking• One gram of 2,4 D can contaminate 10
million liters of drinking water!• One gram of PCBs can make 1 billion liters
of water unsuitable for freshwater aquatic life!

Acid Precipitation: When Air Pollution Becomes Water Pollution

When the pH drops below 6.0 species start to die off.When one species dies, others that depend on it may as well
Acid Rain Effects – Aquatic Systems

Acid Neutralization
• How does this work?• Cation Exchange on
clay minerals• Role of chemical
weathering...
How does acid kill the fish?One way is mobilizing metals
• When all base cations are striped from soils
• Acid now reacts with metals e.g. aluminum – Normally aluminum is immobile– below pH 5 - mobile aluminum
• Fish breath in the water – Aluminum comes out of solution– Clogs gills - suffocate
More Examples: Oxygen and Water
• Biochemical Oxygen Demand – What does this mean?– Anything in the water that bacteria can break
down. – Bacteria will use up oxygen in the water– Other aerobic organisms will die

Oxygen and Water• What else can affect the amount of O2 in the
water?– Temperature– Speed of water flow– Roughness of surface
over which water flows

Stories about particular pollutant forms: Oil
• Both Point and Nonpoint Sources
• Largest source of oil pollution is pipeline leaks and runoff– 61% ocean oil pollution river & urban runoff– 30% intentional discharges from tankers– 5% accidental spills
from tankers

Stories about particular pollutant forms: Detergents
The nitrates in fertilizers promote excessive growth of algae and larger aquatic plants, causing offensive algae blooms and driving out sport fish.
Phosphates are often thought to culprit, nitrogen is the “limiting factor” in most aquatic systems.
Stories about particular pollutant forms: Sediments
• THE largest form of water pollution
• Erosion is source – we’ve sped up rate of erosion, e.g. during urban construction can lose up to 43 tons of topsoil/acre/year
• Natural rates of erosion: leads to aquatic succession
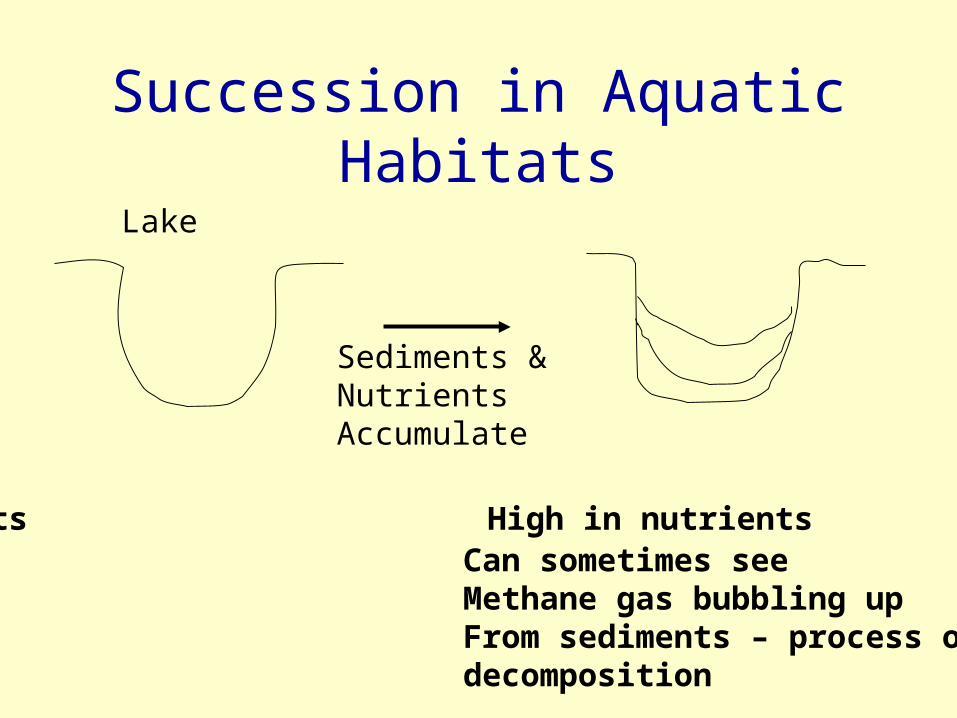
Succession in Aquatic Habitats
Lake
Sediments &Nutrients Accumulate
Oligotrophic EutrophicLow in nutrients High in nutrients
Can sometimes seeMethane gas bubbling up From sediments – process ofdecomposition
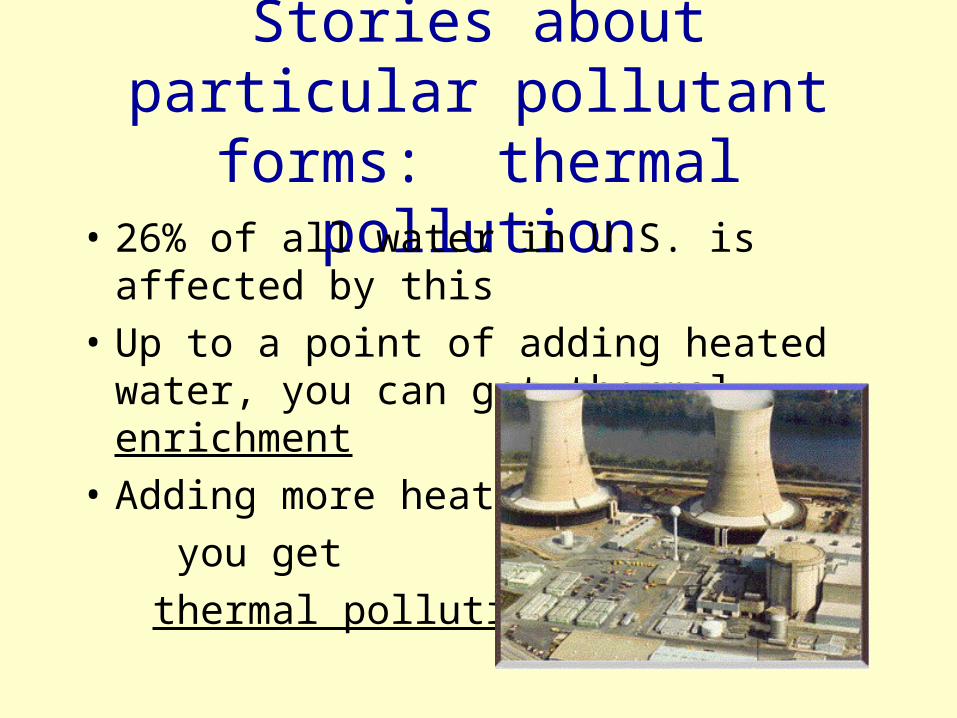
Stories about particular pollutant forms: thermal pollution
• 26% of all water in U.S. is affected by this
• Up to a point of adding heated water, you can get thermal enrichment
• Adding more heat,
you get
thermal pollution
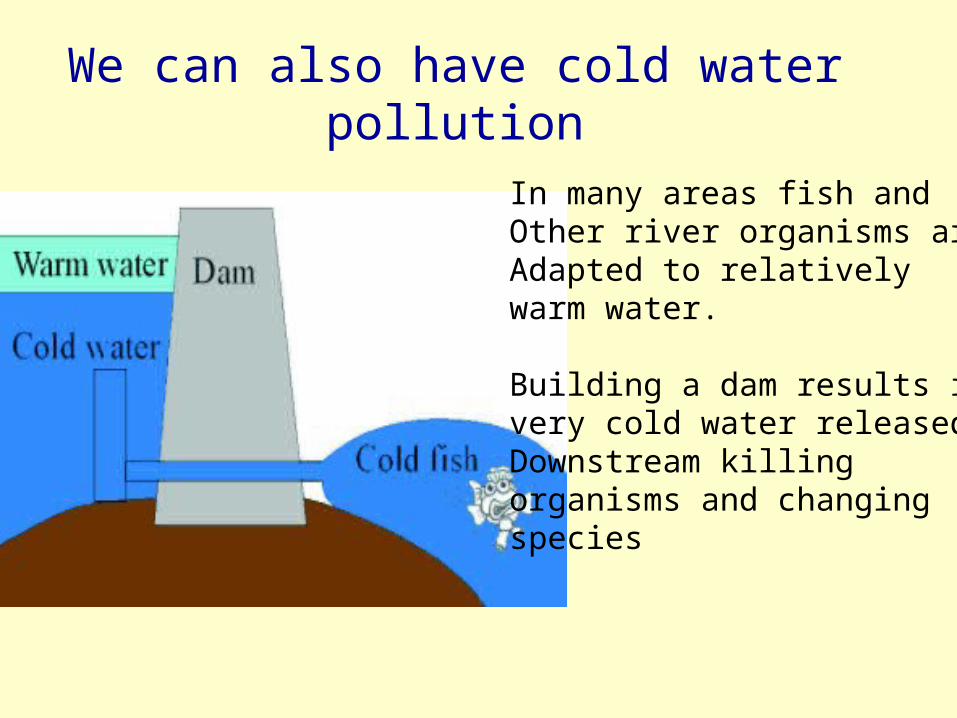
We can also have cold water pollution
In many areas fish andOther river organisms areAdapted to relatively warm water.
Building a dam results in very cold water released Downstream killing organisms and changing species
A special case: Groundwater
• What forms of pollution can affect groundwater?
• All of them except thermal pollution!
• Renewal time of groundwater is important– Rivers: 12-20 days– Soil Moisture: 280 days– Groundwater: 300 years

Groundwater doesn’t stay in one place
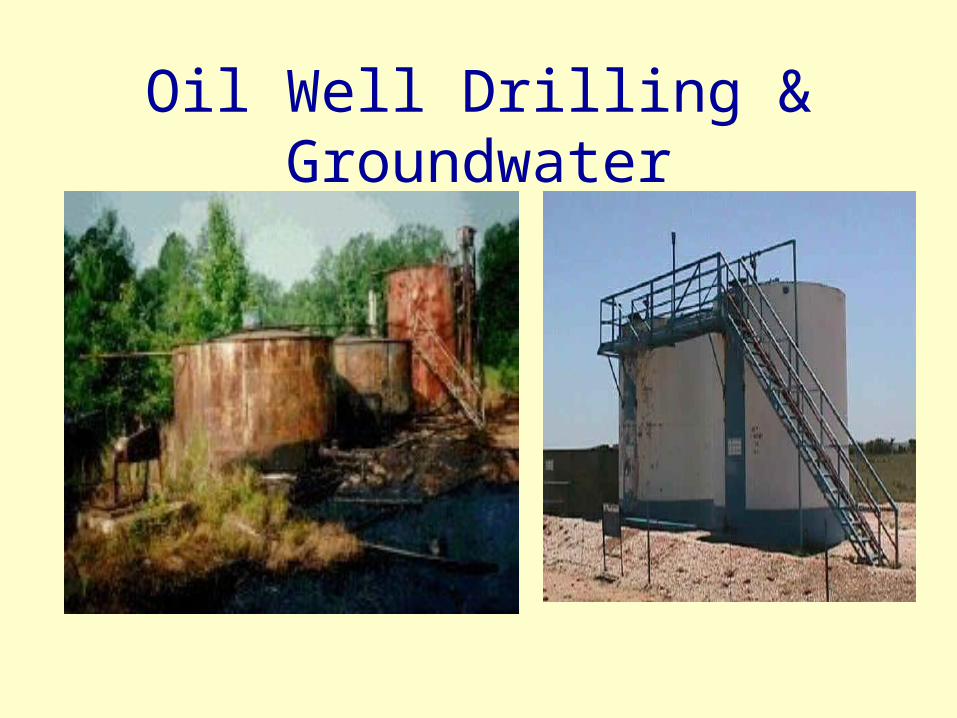
Oil Well Drilling & Groundwater
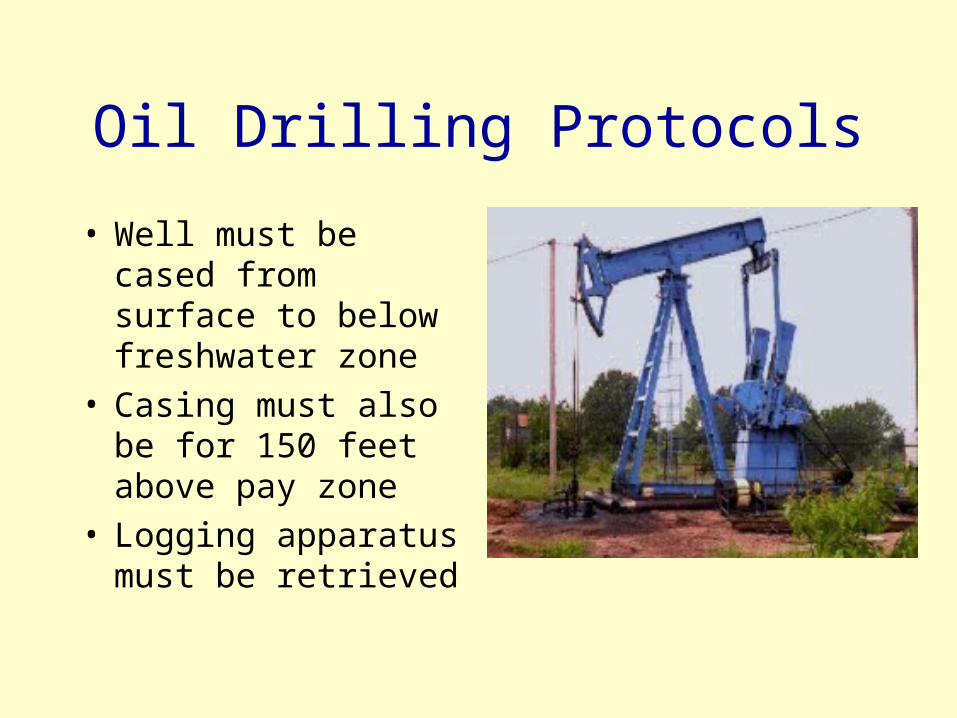
Oil Drilling Protocols
• Well must be cased from surface to below freshwater zone
• Casing must also be for 150 feet above pay zone
• Logging apparatus must be retrieved

Oil Drilling Protocols
• Drilling fluids must be disposed of properly – e.g. no Midnight Haulers
• Any spills must be reported and cleaned immediately
• Area will be subject to remediation efforts

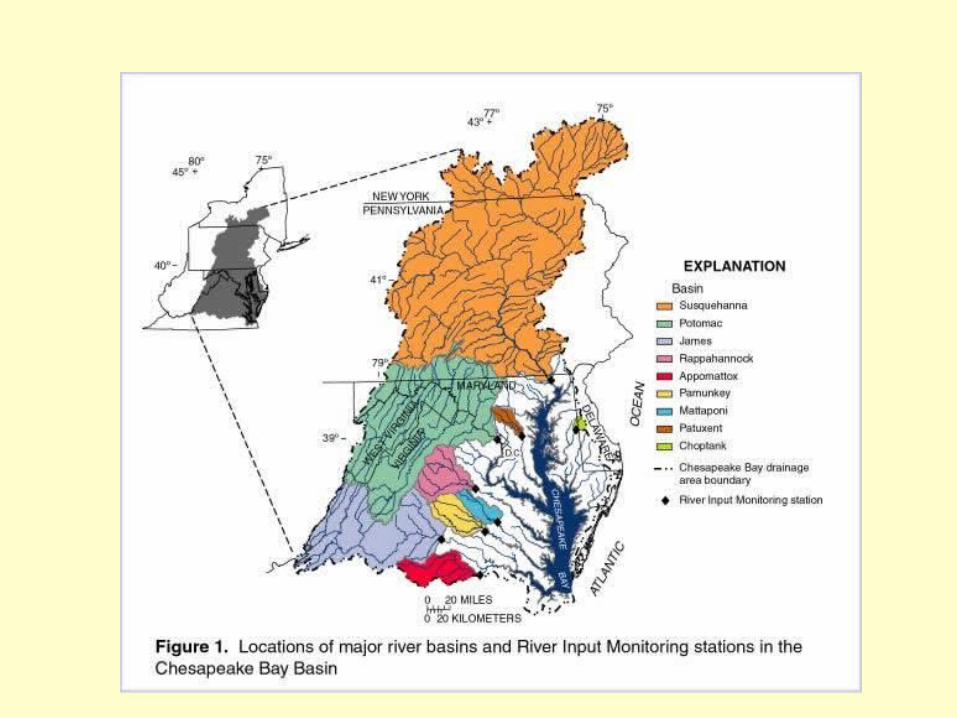
Identifying Sources of Pollutants to the Chesapeake Bay
We are going to do the same analysis that scientists did in 1998 to determine what some of the major sources of pollutants were to the Chesapeake Bay