water quality and flow monitoring in the waukegan … · the iepa lab conducted all sediment...
TRANSCRIPT

WATER QUALITY AND FLOW MONITORING IN
THE WAUKEGAN RIVER, 2008-2009
Section 319 DRAFT Final Report
IEPA FAA# 3190601
Prepared by the
LAKE COUNTY HEALTH DEPARTMENT ENVIRONMENTAL HEALTH SERVICES
3010 Grand Avenue
Waukegan, Illinois 60085
September 2009
Michael Adam LCHD Staff: Senior Biologist Leonard Dane Phone: (847) 377-8002 Kelly Deem Fax (847) 782-6280 Kathy Paap Email: [email protected]
TABLE OF CONTENTS
SUMMARY.....................................................................................................................................4 INTRODUCTION ...........................................................................................................................5 RESULTS AND DISCUSSION....................................................................................................10 TABLES IN TEXT Table 1 Locations of sediment sampling sites. .......................................................................8 Table 2. Locations of flow modules and water quality sensors...............................................9 Table 3. Flow meter data summary at five sites in the Waukegan River, 2008-2009. ..........13 Table 4. Monthly average flow data at five sites in the Waukegan River, 2008-2009. ........14
Table 5. Monthly water quality data summary for five sites in the Waukegan River, 2008-2009. ........................................................................................................................22
Table 6. Results from six rain storm events at two sites (QC-03 and QCA-01) in the Waukegan River 2008-2009....................................................................................32
FIGURES IN TEXT Figure 1. Waukegan River watershed project sampling locations, 2008-2009. ........................6 Figure 2. Average monthly water level at five sites on the Waukegan River, 2008-2009. .....10 Figure 3. Average monthly velocities at five sites on the Waukegan River, 2008-2009. .......11 Figure 4. Average monthly flow at five sites on the Waukegan River, 2008-2009. ...............12 Figure 5. Water level response to a rain event, June 2008 ......................................................15 Figure 6. Water velocity response to a rain event, June 2008. ................................................15 Figure 7. Water flow response to a rain event, June 2008. ......................................................16 Figure 8. Water level, velocity and flow during the June 19, 2009 rain event at QC-04.. ......17 Figure 9. Water level response to the June 19, 2009 rain event at four sites in the Waukegan
River..........................................................................................................................17 Figure 10. Water velocity response to the June 19, 2009 rain event at three sites in the
Waukegan River........................................................................................................18 Figure 11. Water flow response to the June 19, 2009 rain event at three sites in the Waukegan
River..........................................................................................................................18 Figure 12. Conductivity readings during the June 19, 2009 rain event at three sites in the
Waukegan River........................................................................................................19 Figure 13. Dissolved oxygen readings during the June 19, 2009 rain event at three sites in the
Waukegan River........................................................................................................20 Figure 14. Total Kjeldahl nitrogen concentrations from monthly grab samples at five sites on
the Waukegan River, 2008-2009 ..............................................................................25 Figure 15. Nitrate-nitrite nitrogen concentrations from monthly grab samples at five sites on
the Waukegan River, 2008-2009. .............................................................................26 Figure 16. Total phosphorus concentrations from monthly grab samples at five sites on the
Waukegan River, 2008-2009. ...................................................................................27
DRAFT Final Report, FFA #3190601 2

TABLE OF CONTENTS (continued) Figure 17. Chloride concentrations from monthly grab samples at five sites on the Waukegan
River, 2008-2009 (red line is the Illinois state standard of 500 mg/L).....................29 Figure 18. Correlation between conductivity and chloride concentrations from monthly grab
samples at five sites on the Waukegan River, 2008-2009 ........................................29 Figure 19. Total suspended solid concentrations from monthly grab samples at five sites on
the Waukegan River, 2008-2009. .............................................................................30 Figure 20. Fecal coliform bacteria levels from monthly grab samples at five sites on the
Waukegan River, 2008-2009 (red line is the Illinois state standard of 500 cfu/100ml).................................................................................................................31
Figure 21. Total suspended solid concentrations from monthly grab samples and six rain storm events at two sites on the Waukegan River, 2008-2009 .................................33
Figure 22. Total phosphorus concentrations from monthly grab samples and six rain storm events at two sites on the Waukegan River, 2008-2009. ..........................................34
Figure 23. Correlation between total suspended solid and total Kjeldahl nitrogen concentrations from six rain storm events at two sites on the Waukegan River, 2008-2009. ................................................................................................................34
Figure 24. Correlation between total suspended solid and total phosphorus concentrations from six rain storm events at two sites on the Waukegan River, 2008-2009. ..........35
Figure 25. Correlation between total suspended solid and total Kjeldahl nitrogen concentrations from monthly grab samples at five sites on the Waukegan River, 2008-2009. ................................................................................................................35
Figure 26. Correlation between total suspended solid and total phosphorus concentrations from monthly grab samples at five sites on the Waukegan River, 2008-2009. ........36
Figure 27. Conductivity response to a rain event at QCA-01, QC-02, and QC-03 in the Waukegan River on July 15, 2009............................................................................38
Figure 28. Conductivity response to a rain event at QC-10 and QC-04 in the Waukegan River on July 15, 2009 . ......................................................................................................38
Figure 29. Dissolved oxygen concentration response to a rain event at QC-10 and QC-04 in the Waukegan River on July 15, 2009 ......................................................................40
APPENDICES Appendix A. Additional Figures Appendix B. Methods Appendix C. Metals and Pesticides
Appendix D. Photos
DRAFT Final Report, FFA #3190601 3

SUMMARY The Lake County Health Department was contracted by the Illinois EPA to perform water quality and flow monitoring at historically monitored sites in the Waukegan River. The data collection portion of the study began in May 2008 and will conclude in November 2009. The analysis contained in this report spans May 2008 to July 2009. Further updates will be given to the IEPA as warranted. The Waukegan River continues to suffer from poor water quality and exhibits a high degree of fluctuating flow. The high percentage of urban land use within the watershed contributes to the degraded quality of the river. Results from this study indicate that the high flow and velocity rates from rain events have negative impacts on the river system. Between rain events and during periods of moderate flow, water quality was fair. However, rain resulted in both high velocities and flow and resulted in high nutrient and solid concentrations. Rain events did have some positive affects including an increase in dissolved oxygen concentrations, particularly during low flow conditions, and a decrease in conductivity and chloride concentrations. Site response to rain events was also variable probably due to intensity, duration, and rainfall patterns in the watershed. Biological activity, while not directly measured in this study, was likely degraded by a number of factors including high water temperatures, both low and high flow, low dissolved oxygen, high chloride concentrations, and high turbidity. High concentrations of nutrients such as phosphorus may contribute to the river’s degradation by providing fuel for algae blooms. High suspended sediment concentrations found during rain events negatively affect aquatic life directly by sedimentation or otherwise interfering with biologic or chemical processes in the water or sediment. Several results from this study warrant further investigation. Chloride concentrations in the river were highest during the summer months and not during winter as expected. While chloride concentrations were high during the limited winter sampling, the results obtained during the summer suggest additional sources of chloride in the watershed. Chloride concentrations continuously exceeded the USEPA chronic criteria standard for aquatic life and often exceeded the state standard. Fecal coliform bacteria, an indicator of human pathogens, were generally found at high levels, exceeding the state standard on many occasions. A more detailed study is needed of the potential impact aging urban infrastructure are having on the ecology of the river and the public health of the residents in the watershed. Finally, dissolved oxygen concentrations in the river were frequently below the state standard. At some sites nearly 1/3rd of the readings during the study were below 5 mg/L. Concentrations of metals and pesticides were also tested in both the water and sediment. However, at the time of this report only a portion of the results from the water samples and no sediment data had been finalized.
DRAFT Final Report, FFA #3190601 4

INTRODUCTION
The 7,640 acre watershed of the Waukegan River is comprised of a South Branch and a North Branch collectively about 12.5 miles long and draining directly into Lake Michigan. The watershed is largely urbanized, with over 80% of the City of Waukegan (population 90,000) lying within the watershed boundaries, resulting in flashy runoff rates and heavy stormwater pollutant loads. In addition to the physical destruction that occurs to streambanks and infrastructure like sanitary sewer lines, the urban fisheries and stream habitat were highly degraded.
The Waukegan River Section 319 National Monitoring Program project was implemented in 1994 and was designed to demonstrate the effectiveness of stream restoration techniques. Numerous instream and streamside habitat improvements were made to provide biological benefits. A conclusion of that study by the Illinois State Water Survey (ISWS) indicated that stakeholders must now look for impacts from continued peak flows and pervasive water quality/water chemistry impairments. Sondes which measure pH, turbidity, DO, temperature, etc. were installed by the ISWS in 2004 and operated up through 2006 at two locations (in Washington Park). More detailed chemical analysis at other locations in the watershed was also needed to further "pinpoint" the water chemistry problems that exist. In addition, the first Section 319 monitoring of sediment and water found some parameters at elevated concentrations.
To complement the Waukegan River watershed planning efforts and to assess the impacts of stream restoration techniques since implementation, the Lake County Health Department (LCHD) conducted an 18-month water quality monitoring program for five (5) Waukegan river monitoring sites. The five sites that were monitored within the watershed are: South Branch at Washington Park (QCA-01), North Branch at Washington Park (QC-03), Powell Park (QC-02), North Trib at Bonnie Brook (QC-10), and at Amstutz Bridge (QC-04) near the river’s mouth from April 2008 to July 2009 (Figure 1). During monitoring, monthly water quality samples were taken and analyzed for several nutrients, metals, hexachlorobenzene, and pesticides. The metals (Cr, Ni, Ag, Zn), hexachlorobenzene, and pesticides (PCBs, DDT, Aldrin) were found at elevated concentrations in water and sediment samples in the 1994 study. Six times during this project, stormwater events were sampled at two sites. Sediment samples were collected once in each year at the five water quality sites and at seven (7) additional sites that were sampled in the 1994 Waukegan River study. Sediments were analyzed for nutrients, metals, and pesticides. The LCHD lab analyzed the water samples for nutrients and the Illinois Environmental Protection Agency (IEPA) lab analyzed the samples for metals and pesticides. The IEPA lab conducted all sediment analysis. Water quality and flow were monitored continuously, at a minimum of 15-minute sampling intervals, from April through November 2008 and again March through July 2009. LCHD utilized unattended, multiparameter data sondes and area velocity sensors. Water quality sensors measured dissolved oxygen, conductivity, pH, turbidity and water temperature. These water quality parameters assessed the instream habitat conditions and the influence of land uses in the watershed. Dissolved oxygen measurements were obtained by using an optical, luminescent method. This is the most stable, repeatable and sensitive dissolved oxygen method available. Data sondes were switched out, cleaned, recalibrated and data downloaded every two weeks to avoid biofouling due to the known poor water quality of this stream and its tributaries.
DRAFT Final Report, FFA #3190601 5

The area velocity sensors measured flow velocities and depth up to a maximum of 10 feet (3 m). Illinois State Water Survey and Illinois Environmental Protection Agency Quality Assurance/Quality Control (QA/QC) procedures were followed. Figure 1. Waukegan River watershed project sampling locations, 2008-2009.
DRAFT Final Report, FFA #3190601 6

The overall objective of this project was to document water quality conditions in the Waukegan River and to assist in providing a water quality baseline and verifying the benefits of implementing watershed plan elements currently being developed. This study aimed to identify flow regime and water quality conditions that are most influential to ecosystem sustainability and biological diversity, ultimately resulting in a more comprehensive watershed plan.
To determine the continuous water quality in the river LCHD deployed, at each of five locations, a Yellow Springs Instruments (YSI) 6600 multiparameter sonde (or equivalent) with pH, dissolved oxygen, water temperature, conductivity and shuttered turbidity probes set to record data every 15 minutes. Calibration and equipment settings are outlined in the Metadata in Appendix B.
To determine the nutrient and other chemical water parameter concentrations in the river over time:
Grab Samples:
At each of five locations. water samples were collected monthly in glass or
polyethylene bottles for the duration of the specified period. See Appendix A for detailed methodology. Immediately after collection, all samples were placed in a cooler with ice until delivered to the LCHD lab, where they were refrigerated (at 6 degrees C or less) until analysis.
The LCHD lab analyzed the water samples for Total Kjeldahl Nitrogen, Nitrate-Nitrite Nitrogen, Total Phosphorus, Soluble Reactive Phosphorus, Total Suspended Solids, and Chloride. Analytical methods for the parameters are listed in Appendix B. All methods are from the 18th or 19th Edition of Standard Methods, (eds. American Public Health Association, American Water Works Association, and Water Pollution Control Federation, 1992), with the exception Nitrate-Nitrite Nitrogen, which was taken from the USEPA 353.2 rev. 2.0 EPA-600/R-93/100.
A subset of the bottles were shipped to the IEPA lab in Springfield, IL. Bottles
were packed in insulated coolers with sufficient amounts of ice to meet quality control standards (at 6 degrees C or less). Appropriate chain of custody paperwork will accompany the samples. The IEPA lab analyzed samples for metals (Cr, Ni, Ag, Zn), hexachlorobenzene, and pesticides (PCBs, DDT, and Aldrin). Analytical methods for the parameters are listed in Appendix B.
At least twice per year, field blanks and duplicate samples were taken to check sampling representativeness.
DRAFT Final Report, FFA #3190601 7

Storm Event Sampling:
At each of two locations (QCA-01 and QC-03), an ISCO 6712 water sampler was deployed and programmed to collect a flow weighted composite sample starting when flow rates exceed base flow. A total of six storm events were sampled at each site during the duration of the sampling period. Samples were collected by LCHD staff within four hours of collection and transferred into glass or polyethylene bottles, placed on ice in a cooler and transferred back to the LCHD lab, where they were refrigerated (at 6 degrees C or less) until analysis.
The LCHD lab analyzed the water samples for Total Kjeldahl Nitrogen, Nitrate-Nitrite Nitrogen, Total Phosphorus, Soluble Reactive Phosphorus, Total Suspended Solids, and Chloride. Analytical methods for the parameters are listed in Appendix B. All methods are from the 18th or 19th Edition of Standard Methods, (eds. American Public Health Association, American Water Works Association, and Water Pollution Control Federation, 1992), with the exception nitrate nitrogen, which was taken from the USEPA 353.2 rev. 2.0 EPA-600/R-93/100. A subset of the bottles were shipped to the IEPA lab in Springfield, IL in the manner described above.
Sediment-- To determine the nutrient and chemical composition of the river sediment.
To accomplish this, an annual sediment sample (in 2008 and 2009) was collected at each of the 12 sites previously analyzed in the 1994-1995 IEPA survey (See Figure 1). Collection followed IEPA protocol (Appendix B). Samples were frozen, and transported to the IEPA lab in Springfield. Analytical methods for the parameters are listed in Appendix B.
Table 1: Locations of sediment sampling sites. Site Name Latitude Longitude
North Branch/Mainstem QC-01 Mouth 42.35572 -87.82582 QC-04 Amstutz 42.35713 -87.82903 QC-05 South Martin Luther King Jr. Drive 42.35692 -87.83438 QC-03 North Branch at Washington Park 42.35704 -87.83565 QC-02 Powell Park 42.36273 -87.83764 QC-06 Yeoman Park 42.36986 -87.85077 QC-07 Glen Flora 42.37775 -87.85056 QC-08 Power line right of way 42.38533 -87.85171 QC-09 Bonnie Brook Golf Course 42.39396 -87.85557 QC-10 Bonnie Brook Lane 42.40444 -87.86147
South Branch QCA-01 South Branch at Washington Park 42.35636 -87.83718 QCA-02 Roosevelt Park 42.35122 -87.83850
Total Discharge and Flow Rate – To determine the total discharge and continuous flow rate in the three streams with emphasis on rain events.
DRAFT Final Report, FFA #3190601 8

This was accomplished by deploying, at each of the five sites, an ISCO 2150 or 2110
Area Velocity Flow Module which measures stream velocity and water level, as well as calculate flow rate. Calibration and equipment settings and water quality sonde parameter specifications are outlined in Appendix B.
Table 2: Locations of flow modules and water quality sensors:
Site Name Latitude Longitude North Branch/Mainstem
QC-04 Amstutz 42.35713 -87.82903 QC-03 North Branch at Washington Park 42.35704 -87.83565 QC-02 Powell Park 42.36273 -87.83764 QC-10 Bonnie Brook Lane 42.40444 -87.86147
South Branch QCA-01 South Branch at Washington Park 42.35636 -87.83718
Water quality and area velocity flow module equipment were installed in each of the three streams beginning in April 2008. Equipment was removed in November 2008 for the winter months and reinstalled in March 2009. During deployment sondes were replaced and flow modules cleaned every two weeks.
DRAFT Final Report, FFA #3190601 9

RESULTS & DISCUSSION Flow The monthly average water level for each site is shown in Figure 2. This is illustrated here for informational purposes, and will be useful to assess trend analysis with past or future data. A rise in the average level can be seen in both September 2008 and June 2009 as a result of the heavy rains in these two months. Figure 2. Average monthly water level at five sites on the Waukegan River, 2008-2009.
Monthly Average Level
00.5
11.5
22.5
3
May08
June08
July08
Aug08
Sept08
Oct08
Apr09
May09
June09
July09
Date
Feet
QC-02 QC-03 QC-04 QC-10 QCA-01
As expected the average monthly velocity was highest at QC-04, followed by QC-03 (Figure 3). QC-10 velocities were higher than might be expected since it is at the top of the watershed and is the site with lowest overall flow. However, the sensor at this site was located at a constriction of the stream compared to the other sites where the sensor is located in a wider section of the channel. In addition, the data from the sensor at QC-10 was often erroneous, in part due to low flow conditions for much of the year. Thus, the data that is only included in this analysis is from when flow conditions are present.
DRAFT Final Report, FFA #3190601 10

Figure 3. Average monthly velocities at five sites on the Waukegan River, 2008-2009.
Monthly Average Velocity
00.5
11.5
22.5
33.5
May08
June08
July08
Aug08
Sept08
Oct08
Apr09
May09
June09
July09
Date
ft/s
QC-02 QC-03 QC-04 QC-10 QCA-01
The monthly average flow is depicted in Figure 4. As expected, QC-10 had the lowest average flow and QC-04 the highest. Monthly fluctuations can be seen at most of the sites, particularly at QC-03 and QC-04. Several rain events in September 2008 (totaling 17.4 cm or 6.9 inches at the LCHD rain gage at Waukegan South beach; the Lake County Stormwater Management Commission (SMC) gage in Waukegan was not functioning properly this month) resulted in higher velocities and flow. Similarly, higher flows were seen in June 2009 (totaling 19.0 cm or 7.5 inches at the LCHD gage and 13.2 cm or 5.19 inches at the SMC gage). An explanation is needed for one part of this figure. In April 2009, the average monthly flow at QC-03 was higher than the downstream site at QC-04. However, equipment malfunction at QC-04 during this month caused several significant gaps in the data set; include some rain events, thus lowering the monthly average. An important caveat to note with regard to the flow values is that these numbers are based on a calculation of velocity and area. The area is calculated by using level and the site channel dimensions. The main assumption is that the river will stay within its banks, which of course does not always happen, particularly at several sites on the river. Thus, the high flow values should be viewed conservatively. Another caveat should be made about low flow conditions. During low or no flow conditions, the velocity and flow values were sometimes considered unreliable since readings were either not recorded or the numbers were erratic. These readings were deleted from the final files.
DRAFT Final Report, FFA #3190601 11
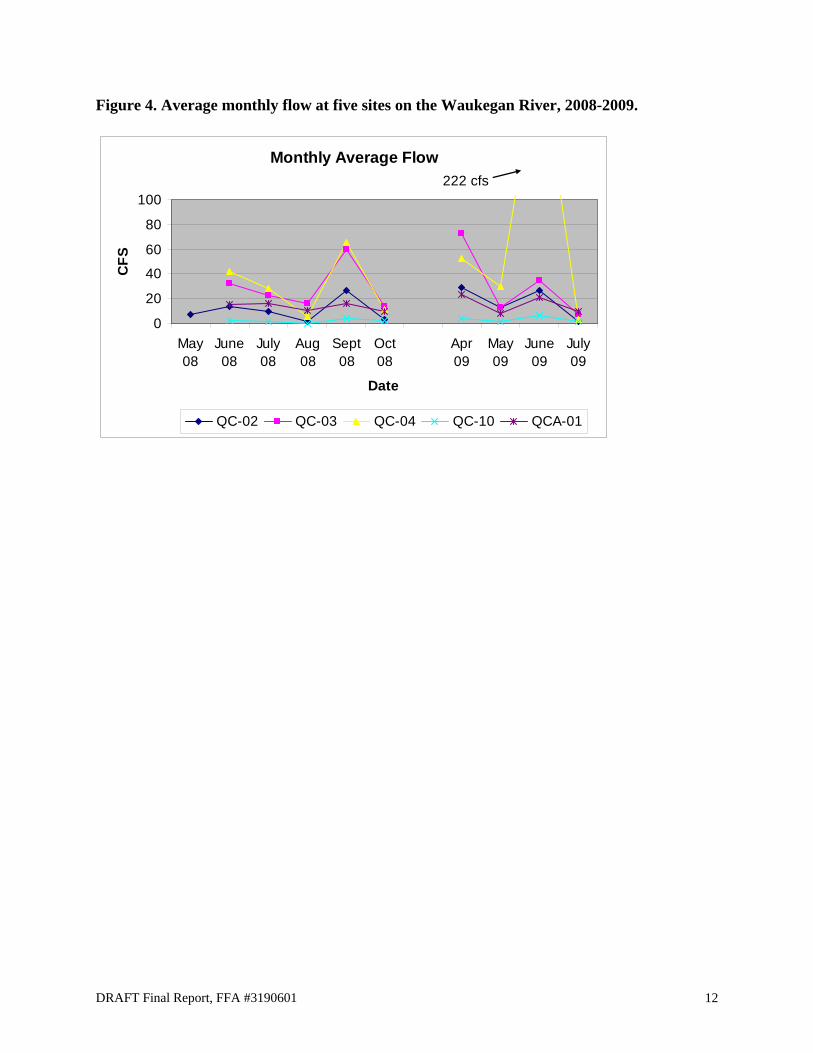
Figure 4. Average monthly flow at five sites on the Waukegan River, 2008-2009.
Monthly Average Flow
0
20
40
60
80
100
May08
June08
July08
Aug08
Sept08
Oct08
Apr09
May09
June09
July09
Date
CFS
QC-02 QC-03 QC-04 QC-10 QCA-01
222 cfs
DRAFT Final Report, FFA #3190601 12

Table 3. Flow meter data summary at five sites in the Waukegan River, 2008-2009. 2008 2009
Level
(ft) Velocity
(ft/s)
Flow Rate (cfs)
Level (ft)
Velocity (ft/s)
Flow Rate (cfs)
QC-10 Bonnie Brook Average 0.70 0.68 2.45 0.86 0.79 3.16 Median 0.66 0.49 0.69 0.74 0.52 0.98 Min 0.01 0.01 0.02 0.21 0.01 0.00 Max 2.68 3.46 27.34 4.01 3.76 44.65 QC-02 Powell Park Average 0.33 0.47 7.86 0.43 0.63 11.17 Median 0.24 0.29 1.43 0.23 0.43 1.78 Min 0.07 0.10 0.13 0.14 0.11 0.00 Max 2.86 6.15 559.23 5.66 6.83 616.96 QC-03 Washington Park North Average 1.65 0.36 13.31 1.52 0.80 32.26 Median 1.75 0.54 27.67 2.30 0.42 16.69 Min 1.47 0.00 0.00 1.69 0.03 0.00 Max 6.80 4.73 394.15 9.69 4.00 378.68 QCA-01 Washington Park South Average 1.12 0.42 13.28 1.02 0.48 16.31 Median 1.06 0.22 4.63 0.93 0.25 4.94 Min 0.67 0.01 0.11 0.30 0.01 0.00 Max 5.49 3.58 314.69 8.57 3.79 332.27 QC-04 Amstutz Average 0.51 1.47 23.42 0.77 1.25 57.74 Median 0.42 0.96 5.84 0.44 0.45 1.64 Min 0.11 0.08 0.29 0.09 0.01 0.02 Max 5.50 7.24 1027.67 10.99 7.61 3330.59
DRAFT Final Report, FFA #3190601 13

Table 4. Monthly average flow data at five sites in the Waukegan River, 2008-2009. QC-10 QC-02 QC-03 QC-04 QCA-01 Level (ft) May 08 0.474 June 08 0.695 0.491 1.869 0.645 1.306July 08 0.682 0.424 1.772 0.551 1.206Aug 08 0.503 0.170 1.628 0.290 0.941Sept 08 0.761 0.453 1.915 0.696 1.133Oct 08 0.715 0.273 1.696 0.464 1.111 Apr 09 1.252 0.669 2.369 0.977 1.465May 09 0.887 0.502 1.863 0.783 1.079June 09 1.051 0.952 2.439 1.580 1.140July 09 0.713 0.197 2.290 0.466 0.590 Velocity (ft/s) May 08 0.527 June 08 0.701 0.697 0.623 2.169 0.445July 08 0.534 0.609 0.509 1.881 0.470Aug 08 0.246 0.230 0.429 0.874 0.436Sept 08 0.955 0.804 0.907 2.046 0.483Oct 08 0.739 0.362 0.336 1.177 0.360 Apr 09 1.106 1.153 1.278 1.918 0.664May 09 0.857 0.837 0.325 1.476 0.315June 09 1.547 1.025 0.678 2.959 0.513July 09 0.893 0.341 0.146 0.416 0.427 Flow (cfs) May 08 7.289 June 08 2.235 13.848 32.407 42.074 15.584July 08 1.624 9.755 22.602 28.493 16.279Aug 08 0.117 1.532 16.232 5.831 10.844Sept 08 4.192 26.746 59.664 65.080 15.766Oct 08 2.163 3.249 13.770 11.530 9.855 Apr 09 4.409 28.728 72.470 52.497 23.192May 09 1.554 13.222 12.740 29.693 8.175June 09 6.615 26.608 34.552 222.391 20.647July 09 1.665 1.832 7.007 3.149 9.693
DRAFT Final Report, FFA #3190601 14

The effects of rain on the flow dynamics in the Waukegan River can be seen more clearly when an individual event is analyzed. From June 8-10 2008, a total of 2.72 inches (8.92 cm) of rain was recorded at the SMC rain gage in Waukegan. Figures 5-7 below illustrate the river’s response. Figure 5. Water level response to a rain event, June 2008.
Waukegan River Water Level for a Storm Event in June 2008
0
1
2
3
4
5
6
7
6/7 0:
00
6/7 12
:00
6/8 0:
00
6/8 12
:00
6/9 0:
00
6/9 12
:00
6/10 0
:00
Time
Riv
er L
evel
(ft)
0
0.1
0.2
0.3
0.4
0.5
0.6
Rai
n Fa
ll (c
m)
QC-10 QC-02 QC-03 QC-04 QCA-01 Rain
Figure 6. Water velocity response to a rain event, June 2008.
Velocity of the Waukegan River During a Storm Event in June 2008
012345678
6/7 0:
00
6/7 12
:00
6/8 0:
00
6/8 12
:00
6/9 0:
00
6/9 12
:00
6/10 0
:00
Time
Velo
city
(fee
t/sec
ond)
0
0.1
0.2
0.3
0.4
0.5
0.6R
ain
(cm
)
QC-10 QC-02 QC-03 QC-04 QCA-01 Rain
DRAFT Final Report, FFA #3190601 15

Figure 7. Water flow response to a rain event, June 2008.
Waukegan River Flow for a Storm Event in June 2008
1
10
100
1000
6/7 0:00
6/7 12:00
6/8 0:00
6/8 12:00
6/9 0:00
6/9 12:00
6/10 0:00
Time
Flow
(cfs
)
00.10.20.30.40.50.6
Rai
n Fa
ll (c
m)
QC-10 QC-02 QC-03 QC-04 QCA-01 Rain
On June 19 2009 a large rain event occurred throughout Lake County resulting in flooding in many locations. In the Waukegan River watershed, 24 hour total rain amounts ranged from 3.12 inches (7.93 cm) at the SMC gage in Waukegan to 4.64 inches (11.79 cm) as recorded at the LCHD gage at Waukegan South beach. This event resulted in project maximum high water levels, velocities, and flows at each site. The influence of this rain event at QC-04 can be seen in Figure 8. Water level peaked at 10.99 feet (the 2009 median at this site was 0.44 feet). An interesting phenomenon occurred around 17:30; water level and flow continued to rise, but velocity decreased sharply, stabilized for a short period of time, then increased again before leveling off. The most plausible reason for this is that the water level rose to a point where it went out of bank due either to the large volume of water passing the sensor or due to a restriction downstream that caused water to slow down and increase in depth and volume. Figures 9-11 illustrate responses of water level, velocity, and flows at the other sites. Unfortunately, the flow meter at QC-03 was only providing reliable information for water level during this event. A similar problem occurred with the flow meter during the later half of the event at QC-02. Similar patterns can be seen during this event as was illustrated for a smaller event in 2008 previously.
DRAFT Final Report, FFA #3190601 16

Figure 8. Water level, velocity and flow during the June 19, 2009 rain event at QC-04.
June 19, 2009 Rain Event
0
2
4
6
8
10
12
19:12 0:0
04:4
89:3
614
:2419
:12 0:00
4:48
9:36
14:24
19:12
June 19, 2009
Leve
l (ft)
, Vel
ocity
(ft/s
), R
ain
(cm
)
0
500
1000
1500
2000
2500
3000
3500
Flow
(cfs
)
Level
Velocity
Rain
Flow
Figure 9. Water level response to the June 19, 2009 rain event at four sites in the Waukegan River.
June 19, 2009 Rain Event
0
2
4
6
8
10
12
19:12 0:0
04:4
89:3
614
:2419
:12 0:00
4:48
9:36
14:24
19:12
June 19, 2009
Leve
l (ft)
0
0.5
1
1.5
2
2.5
3
3.5
4
Rai
n (c
m)
QC-02QC-03QCA-01QC-10Rain
DRAFT Final Report, FFA #3190601 17

Figure 10. Water velocity response to the June 19, 2009 rain event at three sites in the Waukegan River.
June 19, 2009 Rain Event
0
1
2
3
4
5
6
7
8
19:12 0:0
04:4
89:3
614
:2419
:12 0:00
4:48
9:36
14:24
19:12
June 19, 2009
Velo
city
(ft/s
)
0
0.5
1
1.5
2
2.5
3
3.5
4
Rai
n (c
m)
QC-02
QCA-01
QC-10
Rain
Figure 11. Water flow response to the June 19, 2009 rain event at three sites in the Waukegan River.
June 19, 2009 Rain Event
0
100
200
300
400
500
600
700
19:12 0:0
04:4
89:3
614
:2419
:12 0:00
4:48
9:36
14:24
19:12
June 19, 2009
Flow
(ft/s
)
0
0.5
1
1.5
2
2.5
3
3.5
4
Rai
n (c
m)
QC-02
QCA-01
QC-10
Rain
DRAFT Final Report, FFA #3190601 18

Figures 12 and 13 illustrate responses of conductivity and dissolved oxygen at three of the sites. Unfortunately, the sondes at QC-10 and QC-04 were not functioning... Similar to smaller events, conductivity exhibits the rapid decline during the first flush followed by an increase, then another decline as the next pulse of rain washes down. The “recovery” is rapid as in the case of QCA-01, where at 02:15 the conductivity was 0.099 mS/cm to over 0.600 mS/cm by 15:00. Conductivity at QC-02 and QC-03 had similar responses, although not as dramatic. Dissolved oxygen (DO) concentrations also responded. The initial response was an increase in DO at each site, followed by a steady decline to below pre-event levels. This may have been the result of high amounts of organic matter in the river that cause high biological or chemical oxygen demand. At QC-02 the DO significantly dropped to below 1 mg/L. At 18:15 the DO was 5.28 mg/L, then at 18:30 was 0.29 mg/L and remained there until 19:15 when DO was recorded as 3.18 mg/L and was 7.89 mg/L at 19:30. The first possible explanation for this could be that debris was lodged in the sonde tube housing. This is supported by the turbidity readings which did reach the event maximum (385.5 NTU) at the same time (18:15), however, the other parameters (conductivity, pH, and temperature) changed very little. The other possibility is the sonde malfunctioned during this time, however, this seems unlikely since the other probes appeared to be functioning properly. In addition, the probe for this sonde appeared to function well during the calibration, two week river deployment, and post deployment downloading and QA/QC. Figure 12. Conductivity readings during the June 19, 2009 rain event at three sites in the Waukegan River.
June 19, 2009 Rain Event
0
0.2
0.4
0.6
0.8
1
1.2
1.4
19:12 0:0
04:4
89:3
614
:2419
:12 0:00
4:48
9:36
14:24
19:12
June 19, 2009
Con
duct
ivity
(mS/
cm)
0
0.5
1
1.5
2
2.5
3
3.5
4
Rai
n (c
m)
QC-02
QC-03
QCA-01
Rain
DRAFT Final Report, FFA #3190601 19

Figure 13. Dissolved oxygen readings during the June 19, 2009 rain event at three sites in the Waukegan River.
June 19, 2009 Rain Event
0
1
2
3
4
5
6
7
8
9
10
19:12 0:0
04:4
89:3
614
:2419
:12 0:00
4:48
9:36
14:24
19:12
June 19, 2009
Dis
solv
ed O
xyge
n (m
g/L)
0
0.5
1
1.5
2
2.5
3
3.5
4
Rai
n (c
m)
QC-02
QC-03
QCA-01
Rain
DRAFT Final Report, FFA #3190601 20

DRAFT Final Report, FFA #3190601 21
Water Quality
Monthly Grab Samples The overall results from the monthly water quality sampling can be found in Table 5. Sampling occurred each month with the exception of August 2008 at QC-10 when the river was dry, and January and February 2009 when only QC-04 was not frozen.
In general, the Waukegan River continues to have very poor water quality, due in part to its urban watershed. All samples for the monthly analysis were taken greater than 24 hours after a rain event.

Table 5. Monthly water quality data summary for five sites in the Waukegan River, 2008-2009.
Site Date TKN NO2+NO3 TP SRP Cl TSS Cond pH Temp DO FC QC 10 27-May-08 0.870 0.142 0.073 0.006 146 5.8 0.927 8.60 7.98 13.51 410 QC 10 24-Jun-08 0.844 0.438 0.109 0.045 99 16.0 0.800 7.93 17.28 7.48 190 QC 10 22-Jul-08 0.940 0.093 0.090 0.022 48 11.0 0.487 7.93 22.50 7.38 120 QC 10 26-Aug-08 NA NA NA NA NA NA NA NA NA NA NA QC 10 23-Sep-08 0.766 0.069 0.035 <0.005 66 9.1 0.630 7.79 19.00 8.50 480 QC 10 21-Oct-08 0.979 <0.050 0.076 <0.005 86 23.0 0.749 7.95 9.84 9.28 630 QC 10 18-Nov-08 1.116 0.212 0.072 0.008 107 20.4 0.842 7.98 2.39 11.39 20 QC 10 16-Dec-08 1.460 0.588 0.052 0.015 148 9.8 0.964 7.99 0.38 12.74 730 QC 10 09-Feb-09 NA NA NA NA NA NA 0.728 7.81 3.02 11.28 NA QC 10 24-Mar-09 0.830 0.497 0.033 0.009 149 14.4 1.036 8.20 5.90 4.68 10 QC 10 14-Apr-09 0.857 0.391 0.030 0.009 141 16.3 1.021 8.27 6.76 NA 80 QC 10 18-May-09 0.932 0.142 0.058 0.008 97 14.0 0.843 8.25 17.87 10.46 50 QC-10 15-Jun-09 0.779 0.161 0.079 0.031 81.3 21.7 0.732 8.25 20.6 9.97 1200 QC-10 20-Jul-09 1.200 0.343 0.135 0.043 70 55.6 0.720 7.85 18.01 5.46 2200
Average 0.964 0.280 0.070 0.020 103 18.1 0.806 8.06 11.66 9.34 510
Site Date TKN NO2+NO3 TP SRP Cl TSS Cond pH Temp DO FC QC 02 27-May-08 0.847 0.144 0.073 0.010 266 4.3 1.293 8.00 14.65 9.45 3800 QC 02 24-Jun-08 0.876 0.570 0.114 0.047 267 14.1 1.449 7.88 16.82 7.46 290 QC 02 22-Jul-08 0.723 0.303 0.085 0.047 145 3.4 0.879 8.00 21.20 7.85 5800 QC 02 26-Aug-08 0.586 0.487 0.166 0.124 254 6.5 1.455 7.83 18.18 5.94 240 QC 02 23-Sep-08 0.673 0.657 0.073 0.045 226 8.1 1.284 7.96 18.10 8.06 240 QC 02 21-Oct-08 0.657 0.081 0.124 0.078 163 3.1 0.987 7.81 9.37 8.40 5200 QC 02 18-Nov-08 0.610 0.306 0.068 0.030 212 6.5 1.194 7.91 0.82 13.78 260 QC 02 16-Dec-08 0.931 0.617 0.042 0.009 292 9.6 1.506 8.02 0.06 15.31 870 QC 02 09-Feb-09 NA NA NA NA NA NA 1.395 8.08 2.04 14.95 NA QC 02 24-Mar-09 0.735 0.144 0.025 <0.005 275 5.3 1.507 8.17 5.29 5.81 290 QC 02 14-Apr-09 0.595 0.236 0.038 0.007 214 4.0 1.209 8.24 6.13 NA 740 QC 02 18-May-09 0.751 0.173 0.049 0.015 183 2.1 1.109 8.37 16.88 15.00 540 QC-02 15-Jun-09 0.782 0.431 0.099 0.056 178 5.7 1.161 8.1 19.13 10.71 1100 QC-02 20-Jul-09 0.527 0.509 0.064 0.034 240 3.2 1.623 8.18 17.83 12.09 50
Average 0.715 0.358 0.078 0.042 224 5.8 1.289 8.04 11.89 10.37 1494
DRAFT Final Report, FFA #3190601 22

Site Date TKN NO2+NO3 TP SRP Cl TSS Cond pH Temp DO FC
QC 03 27-May-08 0.866 0.163 0.075 0.008 267 4.2 1.297 7.97 14.32 8.70 4200 QC 03 24-Jun-08 0.772 0.608 0.096 0.040 307 4.9 1.573 7.83 16.84 7.51 650 QC 03 22-Jul-08 0.726 0.331 0.092 0.047 158 15.0 0.929 7.70 21.03 7.79 330 QC 03 26-Aug-08 0.642 0.445 0.134 0.048 304 20.9 1.559 7.85 18.35 6.47 660 QC 03 23-Sep-08 0.741 0.580 0.089 0.033 264 44.7 1.437 7.98 18.30 8.06 400 QC 03 21-Oct-08 0.652 0.147 0.154 0.098 133 2.2 0.812 7.90 9.55 8.88 5000 QC 03 18-Nov-08 0.541 0.296 0.055 0.026 232 1.7 1.262 7.88 0.94 13.82 340 QC 03 16-Dec-08 0.959 0.630 0.047 0.008 301 13 1.554 7.59 -0.03 15.08 950 QC 03 09-Feb-09 NA NA NA NA NA NA 1.139 8.06 2.44 14.98 NA QC 03 24-Mar-09 0.777 0.136 0.024 0.005 287 13.7 1.554 8.13 5.07 5.44 180 QC 03 14-Apr-09 0.583 0.201 0.031 <0.005 218 8.8 1.224 8.3 6.15 NA 780 QC 03 18-May-09 0.678 0.179 0.039 0.009 193 1.9 1.167 8.27 15.86 13.99 190 QC-03 15-Jun-09 0.969 0.438 0.097 0.052 196 18.0 1.205 8.13 18.32 9.11 290 QC-03 20-Jul-09 0.549 0.491 0.068 0.027 289 9.7 1.809 7.90 17.99 9.15 350
Average 0.727 0.357 0.077 0.033 242 12.2 1.323 7.96 11.80 9.92 1102
Site Date TKN NO2+NO3 TP SRP Cl TSS Cond pH Temp DO FC QCA 01 27-May-08 0.698 0.540 0.054 0.006 262 4.7 1.540 8.07 11.58 10.68 2200 QCA 01 24-Jun-08 0.709 0.905 0.065 0.018 206 6.9 1.181 7.78 16.92 7.26 1400 QCA 01 22-Jul-08 0.613 0.779 0.052 0.023 229 12.8 1.331 7.93 20.03 7.57 580 QCA 01 26-Aug-08 0.776 0.210 0.094 0.029 216 27.4 1.208 7.53 18.14 4.00 620 QCA 01 23-Sep-08 0.650 0.606 0.055 0.018 313 15.6 1.642 7.79 18.90 5.83 420 QCA 01 21-Oct-08 0.713 0.408 0.097 0.038 141 18.1 0.838 7.85 9.09 9.32 4400 QCA 01 18-Nov-08 0.584 0.343 0.052 0.012 287 5.1 1.517 7.84 1.22 13.09 60 QCA 01 16-Dec-08 0.807 0.903 0.071 0.011 337 30.6 1.765 8.05 0.10 15.70 2000 QCA 01 09-Feb-09 NA NA NA NA NA NA 1.754 8.12 3.44 14.87 NA QCA 01 24-Mar-09 0.506 0.973 0.02 <0.005 356 7.0 1.867 8.1 5.22 4.75 170 QCA 01 14-Apr-09 0.694 0.819 0.028 0.006 232 6.8 1.224 8.15 5.30 NA 4600 QCA-01 18-May-09 0.665 0.504 0.033 0.005 238 4.4 1.405 8.22 16.34 16.78 3200 QCA-01 15-Jun-09 0.702 0.664 0.060 0.021 227 16.2 1.391 8.14 19.88 10.23 210 QCA-01 20-Jul-09 0.770 NA 0.125 0.017 319 12.0 1.957 7.30 16.89 3.46 940 Average 0.684 0.638 0.062 0.017 259 12.9 1.473 7.92 11.65 9.50 1600
DRAFT Final Report, FFA #3190601 23

RAFT Final Report, FFA #3190601 24
Site Date TKN NO2+NO3 TP SRP Cl TSS Cond pH Temp DO FC QC 04 27-May-08 0.326 0.252 0.070 0.009 281 6.0 1.321 8.02 13.52 9.23 3000 QC 04 24-Jun-08 0.792 0.657 0.086 0.030 305 11.0 1.393 7.90 17.41 7.40 2400 QC 04 22-Jul-08 0.704 0.422 0.080 0.043 200 4.0 1.010 7.95 21.08 7.70 380 QC 04 26-Aug-08 0.752 0.519 0.096 0.051 443 28.8 1.968 7.80 18.78 7.61 1960 QC 04 23-Sep-08 0.648 0.637 0.059 0.035 358 5.4 1.737 7.95 18.77 8.93 280 QC 04 21-Oct-08 0.697 0.395 0.139 0.080 139 3.9 0.759 8.03 10.32 8.65 11000 QC 04 18-Nov-08 0.595 0.296 0.065 0.024 284 8.6 1.442 7.99 1.75 12.93 100 QC 04 16-Dec-08 0.896 0.652 0.044 0.009 320 14.0 1.609 7.99 0.01 15.90 910 QC 04 20-Jan-09 0.769 0.615 0.037 0.014 520 1.7 2.162 8.08 0.97 14.38 2000 QC 04 24-Feb-09 0.497 0.561 0.027 0.007 633 2.1 2.684 8.33 1.34 14.01 450 QC 04 24-Mar-09 0.721 0.310 0.022 0.009 355 2.9 1.698 8.13 5.16 4.76 340 QC 04 14-Apr-09 0.613 0.535 0.027 0.009 180 5.4 0.989 8.00 5.30 NA 880 QC 04 18-May-09 0.643 0.285 0.036 0.010 237 1.2 1.331 8.08 14.44 14.54 330 QC-04 15-Jun-09 0.754 0.534 0.093 0.038 252 10.0 1.315 7.98 17.47 9.11 250 QC-04 20-Jul-09 0.532 0.477 0.076 0.034 417 4.8 2.180 7.93 18.36 9.93 460
Average 0.663 0.476 0.064 0.027 328 7.3 1.573 8.01 10.98 10.36 1649
Glossary
TKN = Total Kjeldahl nitrogen, mg/L NA=Not
applicable NO2+NO3 = Nitrate + Nitrite nitrogen, mg/L TP = Total phosphorus, mg/L SRP = Soluble reactive phosphorus, mg/L Cl- = Chloride ions, mg/L TSS = Total suspended solids, mg/L COND = Conductivity, milliSiemens/cm TEMP = Water Temperature, C DO = Dissolved oxygen, mg/L FC = Fecal coliform bacteria, colonies/100 ml
D

Total Kjeldahl Nitrogen (TKN) Total Kjeldahl nitrogen (TKN) is a measure of organic nitrogen plus ammonium. TKN fluctuated slightly during the course of the study, with highest concentrations during monthly sampling occurring at each site in December 2008 (Figure 14). However, during rain events, TKN was much higher (see Storm Events section). QC-10 had the highest overall average TKN concentration, followed by QC-03 and QC-02. The most likely explanation of the higher concentrations at QC-10 during November and December 2008 is decaying organic matter, specifically leaf litter. The area immediately upstream of QC-10 is wooded with a thick understory. This may also explain the increase in TKN at all sites in December 2008 as most of the sites, with the exception of QC-04 have moderate to heavy vegetation cover, on or overhanging the streambank. Figure 14. Total Kjeldahl nitrogen concentrations from monthly grab samples at five sites on the Waukegan River, 2008-2009.
Total Kjeldahl Nitrogen
0.0000.2000.4000.6000.8001.0001.2001.4001.600
5/27/0
8
6/27/0
8
7/27/0
8
8/27/0
8
9/27/0
8
10/27
/08
11/27
/08
12/27
/08
1/27/0
9
2/27/0
9
3/27/0
9
4/27/0
9
5/27/0
9
6/27/0
9
mg/
L
QC-10 QC 02 QC 03 QCA 01 QC 04
NO2-NO3 Nitrate-nitrite nitrogen is a measure of the inorganic nitrogen in the water. Sources may include run off from fertilizers, leaching from sanitary sewer lines, or natural erosion. Some fluctuation did occur between sites with highest concentrations found at QCA-01. Leaching from sanitary sewer lines has been suspected and in many cases documented in the Waukegan River. Fecal coliform bacteria concentrations collected at the same time were often high (see Fecal Coliform section) at some or all sites. Nitrogen may also have been attached to sediment particles as total suspended solids concentrations followed a similar monthly pattern (see Total Suspended Solids section).
DRAFT Final Report, FFA #3190601 25

Figure 15. Nitrate-nitrite nitrogen concentrations from monthly grab samples at five sites on the Waukegan River, 2008-2009.
Nitrate-Nitrite Nitrogen
00.20.40.60.8
11.2
5/27/0
8
6/27/0
8
7/27/0
8
8/27/0
8
9/27/0
8
10/27
/08
11/27
/08
12/27
/08
1/27/0
9
2/27/0
9
3/27/0
9
4/27/0
9
5/27/0
9
6/27/0
9
mg/
L
QC 10 QC 02 QC 03 QCA 01 QC 04
Total and Soluble Reactive Phosphorus Average total phosphorus (TP) concentrations were similar across all sites, ranging from 0.062 mg/L (QCA-01) to 0.078 mg/L (QC-02). As expected, highest concentrations were found during the warmer summer months. Collectively, the highest readings occurred in August 2008 during very low flow conditions which likely concentrated nutrients. The other increase in TP occurred from September to October 2008 at all sites. One possible explanation is that there was an increase in ambient and water temperatures 48 hours prior to sampling causing an increase in biological activity. Water temperatures increase approximately 3oC at all five sites during October 18-20. Once cold weather set in, biological activity decreased, resulting in the lower TP concentrations, until warmer weather returned. Another possible explanation is the heavy rains in September diluted the nutrient concentrations in that monthly sample. Once lower flow conditions returned the TP concentrations increased. The final contributing factor is in October 2008 the river’s TN:TP ratio indicated nitrogen limitation (see explanation below). Soluble reactive phosphorus (SRP) followed a similar pattern with average concentrations ranging from 0.017 mg/L (QCA-01) to 0.042 mg/L (QC-02). The highest SRP concentration (0.124mg/L) was recorded in August 2008 at QC-02. Throughout the course of the study, the nutrient analysis of the nitrogen and phosphorus ratio changed. To compare the availability of these nutrients, a ratio of total nitrogen to total phosphorus was used (TN:TP). Ratios < 10:1 indicate nitrogen was limiting. Ratios of >15:1 indicate phosphorus was limiting. Ratios >10:1, <15:1 indicate that there was enough of either nutrients for excessive algal growth or other biological processes. In the Waukegan River, most
DRAFT Final Report, FFA #3190601 26
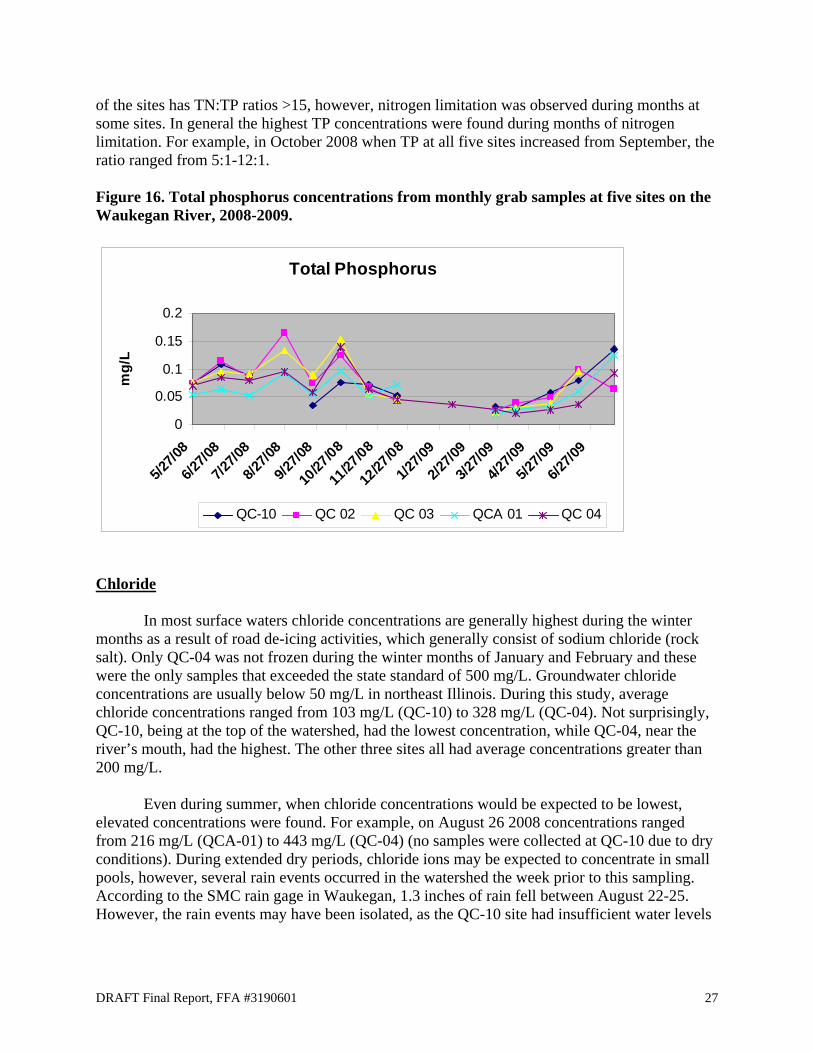
of the sites has TN:TP ratios >15, however, nitrogen limitation was observed during months at some sites. In general the highest TP concentrations were found during months of nitrogen limitation. For example, in October 2008 when TP at all five sites increased from September, the ratio ranged from 5:1-12:1. Figure 16. Total phosphorus concentrations from monthly grab samples at five sites on the Waukegan River, 2008-2009.
Total Phosphorus
0
0.05
0.1
0.15
0.2
5/27/0
8
6/27/0
8
7/27/0
8
8/27/0
8
9/27/0
8
10/27
/08
11/27
/08
12/27
/08
1/27/0
9
2/27/0
9
3/27/0
9
4/27/0
9
5/27/0
9
6/27/0
9
mg/
L
QC-10 QC 02 QC 03 QCA 01 QC 04
Chloride In most surface waters chloride concentrations are generally highest during the winter months as a result of road de-icing activities, which generally consist of sodium chloride (rock salt). Only QC-04 was not frozen during the winter months of January and February and these were the only samples that exceeded the state standard of 500 mg/L. Groundwater chloride concentrations are usually below 50 mg/L in northeast Illinois. During this study, average chloride concentrations ranged from 103 mg/L (QC-10) to 328 mg/L (QC-04). Not surprisingly, QC-10, being at the top of the watershed, had the lowest concentration, while QC-04, near the river’s mouth, had the highest. The other three sites all had average concentrations greater than 200 mg/L.
Even during summer, when chloride concentrations would be expected to be lowest, elevated concentrations were found. For example, on August 26 2008 concentrations ranged from 216 mg/L (QCA-01) to 443 mg/L (QC-04) (no samples were collected at QC-10 due to dry conditions). During extended dry periods, chloride ions may be expected to concentrate in small pools, however, several rain events occurred in the watershed the week prior to this sampling. According to the SMC rain gage in Waukegan, 1.3 inches of rain fell between August 22-25. However, the rain events may have been isolated, as the QC-10 site had insufficient water levels
DRAFT Final Report, FFA #3190601 27
to sample. It is likely that chloride ions concentrated during low flow conditions, but concentrations at all sites during the summer months suggest possible other sources. Conductivity readings have been used by LCHD and other as a surrogate for assessing chloride concentrations (based on a regression equation developed from historic data in Lake County). Figure 18 indicates that this is true for the data collected during this study. Using the regression equation and the maximum conductivity readings recorded from the multiparameter sondes, the calculated maximum chloride concentration occurred at QC-04 in September 2008 (815 mg/L) and July 2009 (801 mg/L). This equation can then be used to determine the conductivity reading that correlates with the state chloride standard (500 mg/L) to assess the degree of standard exceedances. Based on data collected in this study, a chloride concentration of 500 mg/L was equivalent to a conductivity reading of 2.374 mS/cm. Using this the QC-04 site exceeded the standard approximately 2% of the time (460 or 23,047 sonde readings). Almost all of these readings came in the months of July, August and September. QC-04 was the only site to have conductivity readings exceed this value. In the future, conductivity should be considered as part of a continued monitoring regime, with periodic chloride samples to verify this relationship. High chloride concentrations have negative impacts on aquatic life. The USEPA (1988) set chronic criteria for aquatic life at 230 mg/L. This criterion was based on a 4-day continuous concentration. Monthly chloride concentrations during this study greater than 230 mg/L were common. If the regression is used to assess the calculated chloride concentrations based on the continuous conductivity readings some unsettling results emerge. Using the equation, 230 mg/L equates to a conductivity reading of 1.282 mS/cm. At QCA-01 over the course of the study conductivity readings exceeded this number 54.5% of the time (14,665 of 26,899 readings). Similarly, QC-04 was over this value 51.9% of the time (11,976 of 23,054 readings). QC-03 and QC-02 were only slightly better (37.2% of 27,630 and 34.2% of 27,629, respectively). QC-10 had no calculated chloride samples greater than 230 mg/L or conductivity readings greater than 1.282 mS/cm. The fact that these concentrations are occurring during the warmer months when biological activity is highest is a serious concern and a threat to the long-term restoration efforts.
In the past total dissolved solid (TDS) concentrations have been elevated in the
Waukegan River. Currently the river is listed on the Illinois 303 (d) list for impaired waters for this parameter. Although not assessed during this study, TDS is also strongly correlated with conductivity and chloride concentrations, based on historic LCHD data that include surface waters of Lake County.
DRAFT Final Report, FFA #3190601 28

Figure 17. Chloride concentrations from monthly grab samples at five sites on the Waukegan River, 2008-2009 (red line is the Illinois state standard of 500 mg/L).
Chloride
0100200300400500600700
5/27/0
8
6/27/0
8
7/27/0
8
8/27/0
8
9/27/0
8
10/27
/08
11/27
/08
12/27
/08
1/27/0
9
2/27/0
9
3/27/0
9
4/27/0
9
5/27/0
9
6/27/0
9
mg/
L
QC 10 QC 02 QC 03 QCA 01 QC 04
Figure 18. Correlation between conductivity and chloride concentrations from monthly grab samples at five sites on the Waukegan River, 2008-2009.
Conductivity vs Cl - Monthly Sampling
y = 247.3x - 86.971R2 = 0.9329
0100200300400500600700
0 0.5 1 1.5 2 2.5 3
Conductivity mS/cm
Chlo
ride
mg/
L
DRAFT Final Report, FFA #3190601 29
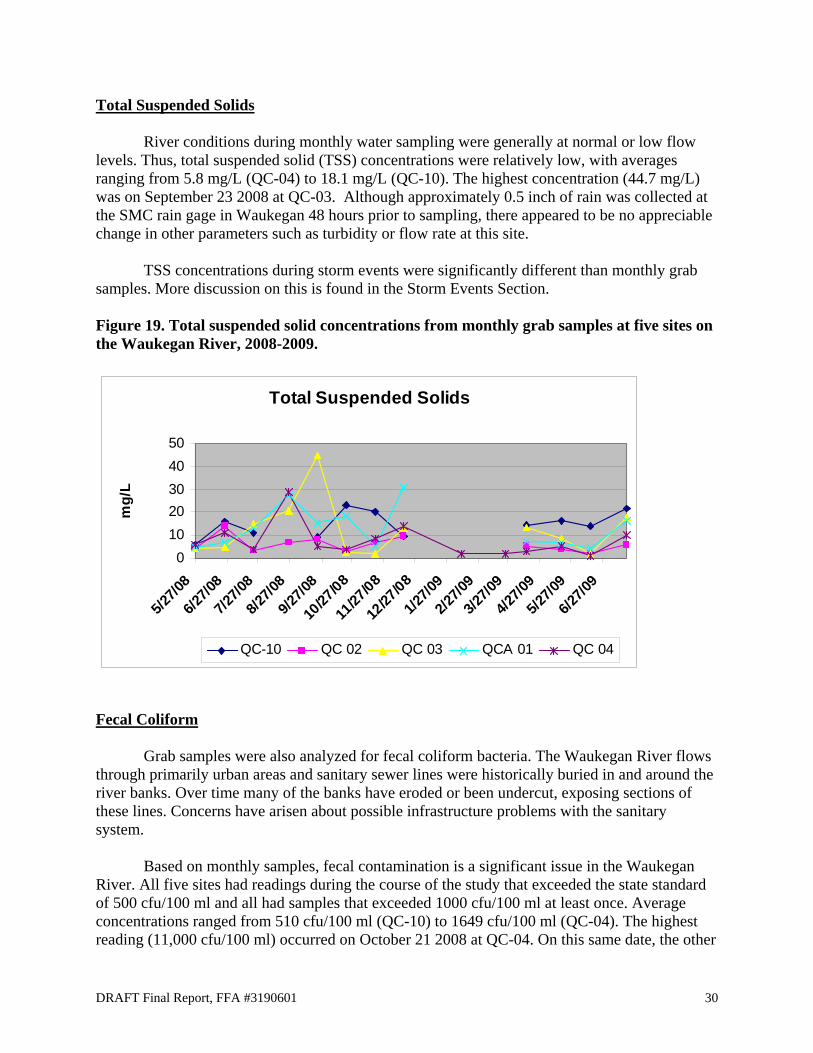
Total Suspended Solids River conditions during monthly water sampling were generally at normal or low flow levels. Thus, total suspended solid (TSS) concentrations were relatively low, with averages ranging from 5.8 mg/L (QC-04) to 18.1 mg/L (QC-10). The highest concentration (44.7 mg/L) was on September 23 2008 at QC-03. Although approximately 0.5 inch of rain was collected at the SMC rain gage in Waukegan 48 hours prior to sampling, there appeared to be no appreciable change in other parameters such as turbidity or flow rate at this site. TSS concentrations during storm events were significantly different than monthly grab samples. More discussion on this is found in the Storm Events Section. Figure 19. Total suspended solid concentrations from monthly grab samples at five sites on the Waukegan River, 2008-2009.
Total Suspended Solids
01020304050
5/27/0
8
6/27/0
8
7/27/0
8
8/27/0
8
9/27/0
8
10/27
/08
11/27
/08
12/27
/08
1/27/0
9
2/27/0
9
3/27/0
9
4/27/0
9
5/27/0
9
6/27/0
9
mg/
L
QC-10 QC 02 QC 03 QCA 01 QC 04
Fecal Coliform Grab samples were also analyzed for fecal coliform bacteria. The Waukegan River flows through primarily urban areas and sanitary sewer lines were historically buried in and around the river banks. Over time many of the banks have eroded or been undercut, exposing sections of these lines. Concerns have arisen about possible infrastructure problems with the sanitary system. Based on monthly samples, fecal contamination is a significant issue in the Waukegan River. All five sites had readings during the course of the study that exceeded the state standard of 500 cfu/100 ml and all had samples that exceeded 1000 cfu/100 ml at least once. Average concentrations ranged from 510 cfu/100 ml (QC-10) to 1649 cfu/100 ml (QC-04). The highest reading (11,000 cfu/100 ml) occurred on October 21 2008 at QC-04. On this same date, the other
DRAFT Final Report, FFA #3190601 30

samples were high as well: 630 (QC-10), 5200 (QC-02), 5000 (QC-03), and 4400 (QCA-01). Sometimes heavy rain washes fecal material from the upslope areas into the river, however, no rain was recorded 48 hours prior to sample collections. Clearly something occurred in the watershed to cause these higher numbers. Pinpointing the exact source is often difficult. However, illicit discharges or sanitary sewer infrastructure problems may be contributing to high bacteria counts. Fecal coliform can be an indicator of human pathogens, and thus, investigation and remediation of potential sources should be a priority for improve water quality in the river in addition to protecting public health. Figure 20. Fecal coliform bacteria levels from monthly grab samples at five sites on the Waukegan River, 2008-2009 (red line is the Illinois state standard of 500 cfu/100ml).
Fecal Coliform (FC)
0100020003000400050006000700080009000
5/27/0
8
6/27/0
8
7/27/0
8
8/27/0
8
9/27/0
8
10/27
/08
11/27
/08
12/27
/08
1/27/0
9
2/27/0
9
3/27/0
9
4/27/0
9
5/27/0
9
6/27/0
9
FC c
fu/1
00 m
l
QC 10 QC 02 QC 03 QCA 01 QC 04
11000
Storm Events
Monitoring included a total of six storm events, three in each year, where flow weighted composite samples were taken at QC-03 and QCA-01 (Table 8). Average TKN, TP, and TSS for storm events was significantly higher than monthly averages from grab samples at both locations. NO2-NO3 and SRP averages were similar for both storm events and monthly samples. Cl was lower in storm samples than monthly, as expected, due to dilution.
DRAFT Final Report, FFA #3190601 31

Table 6. Results from six rain storm events at two sites (QC-03 and QCA-01) in the Waukegan River 2008-2009.
Site Date TKN NO2+NO3 TP SRP Cl TSS Rain Events
QC 03 11-Jul-08 1.360 0.461 0.256 0.029 64.3 141 QC 03 05-Sep-08 0.914 0.251 0.129 0.005 28.8 95.2 QC 03 08-Oct-08 1.480 0.563 0.265 0.053 40.0 121 QC 03 20-Apr-09 1.130 0.641 0.092 0.017 75.3 52.4 QC-03 14-May-09 4.230 0.321 0.891 0.011 73.8 521 QC-03 17-Jun-09 1.330 <0.05 0.102 0.035 30.5 108
Rain Average 1.741 0.447 0.289 0.025 52.1 173.1 Monthly Grab Average 0.727 0.357 0.077 0.033 242 12.2 Rain Events
QCA 01 11-Jul-08 0.772 0.399 0.140 0.030 45.5 47.2 QCA 01 05-Sep-08 1.110 0.277 0.187 0.006 18.8 198.0 QCA 01 08-Oct-08 0.857 0.452 0.146 0.037 38.8 69.9 QCA 01 20-Apr-09 0.962 0.604 0.094 0.024 64.2 35.7 QCA 01 14-May-09 0.762 0.376 0.070 0.021 91.0 14.8 QCA 01 17-Jun-09 1.750 <0.05 0.268 0.029 104.0 224.0
Rain Average 1.036 0.422 0.151 0.025 60.4 98.3 Monthly Grab Average 0.684 0.589 0.062 0.017 258.7 12.9
Nutrient and solid concentrations were higher at QC-03 than QCA-01, as expected due to
the differences in subwatershed size (QC-03 drains a much larger area). The most significant difference between the two was the May 14, 2009 sample event. TSS and TP concentrations for QC-03 were much higher (521 mg/L and 0.891 mg/L, respectively) than at QCA-01 (14.8 mg/L and 0.376 mg/L, respectively). Maximum flow rate at QC-03 during this event was 155.98 cfs. Unfortunately the flow meter at QCA-01 was not function properly during the entire event so a maximum flow was not recorded. Turbidity readings during the event correlate to some degree the differences observed. During the event, the maximum turbidity at QCA-01 was 424 NTU 5/13 22:30), while the maximum at QC-03 was 888 NTU (5/14 0:00). Average turbidity from 5/13 21:30 to 5/14 21:30 was much higher at QC-03 (373 NTU) than QCA-01 (39.9 NTU). Clearly something upstream of QC-03 generated this large pulse of TSS and TP, possibly streambank erosion. The closest upstream monitoring site is QC-02 at Powell Park. During this event, the maximum turbidity (1100 NTU) was recorded at 5/13 22:45. The turbidity quickly declined at QC-02 by 5/14 01:30 to 29.1 NTU. During rain events, TSS and TP and TSS and TKN are correlated (Figures 23 and 24, respectively). However, these relationships had poor correlation during monthly sampling (Figures 25 and 26, respectively). Storm event data support the notion that the Waukegan River exhibits “flashy” behavior, with a rapid rise and fall of water level, velocity and flow and corresponding poor water quality during peak events. High TKN, TSS, and TP concentrations are the result of this flashiness and since NO2-NO3 and SRP did not respond similarly, indicate
DRAFT Final Report, FFA #3190601 32

that the TKN and TP were attached to sediment particles. This finding is not surprising during even a casual survey of the river’s banks. Exposed banks and undercutting of structures provide evidence of this problem. High TSS concentrations during storm events may have negative affects on river biota. Sediment may smother fish eggs or invertebrates directly or alter biological or chemical processes in the water and sediment. Information from this study will hopefully assist other entities in determining sediment loading and propose appropriate remediation measures within portions of the watershed. Figure 21. Total suspended solid concentrations from monthly grab samples and six rain storm events at two sites on the Waukegan River, 2008-2009.
TSS Monthly and Rain Events
050
100150
200250
May 08
Jun 08
Jul 0
8
Aug 08
Sep 08
Oct 08
Nov 08
Dec 08
Jan 0
9
Feb 09
Mar 09
Apr 09
May 09
Jun 09
Jul 0
9
mg/
L
Wash. Park N Wash. Park S Wash Park N - Rain Wash Park S - Rain
521
DRAFT Final Report, FFA #3190601 33

Figure 22. Total phosphorus concentrations from monthly grab samples and six rain storm events at two sites on the Waukegan River, 2008-2009.
TP Monthly and Rain Events
0
0.10.2
0.30.4
0.5
May 08
Jun 08
Jul 0
8
Aug 08
Sep 08
Oct 08
Nov 08
Dec 08
Jan 0
9
Feb 09
Mar 09
Apr 09
May 09
Jun 09
Jul 0
9
mg/
L
Wash. Park N Wash. Park S Wash Park N - Rain Wash Park S - Rain
0.891
Figure 23. Correlation between total suspended solid and total Kjeldahl nitrogen concentrations from six rain storm events at two sites on the Waukegan River, 2008-2009.
TSS vs TKN - Rain Events
y = 138.25x - 56.226R2 = 0.9093
0
100
200
300
400
500
600
0.00 1.00 2.00 3.00 4.00 5.00
TKN mg/L
TSS
mg/
L
DRAFT Final Report, FFA #3190601 34

Figure 24. Correlation between total suspended solid and total phosphorus concentrations from six rain storm events at two sites on the Waukegan River, 2008-2009.
TSS vs TP - Rain Events
y = 587.31x + 6.4762R2 = 0.9117
0
100
200
300
400
500
600
0 0.2 0.4 0.6 0.8 1
TP mg/L
TSS
mg/
L
Figure 25. Correlation between total suspended solid and total Kjeldahl nitrogen concentrations from monthly grab samples at five sites on the Waukegan River, 2008-2009.
TSS vs TKN - Monthly Sampling
y = 24.545x - 7.247R2 = 0.1892
0
10
20
30
40
50
60
0 0.2 0.4 0.6 0.8 1 1.2 1.4 1.6
TKN mg/L
TSS
mg/
L
DRAFT Final Report, FFA #3190601 35

Figure 26. Correlation between total suspended solid and total phosphorus concentrations from monthly grab samples at five sites on the Waukegan River, 2008-2009.
TSS vs TP - Monthly Sampling
y = 86.078x + 5.0137R2 = 0.0882
0
10
20
30
40
50
60
0 0.05 0.1 0.15 0.2
TP mg/L
TSS
mg/
L
Sonde Data
The Waukegan River continues to exhibit poor water quality conditions. Data collected from multiparameter sondes recorded over 20,000 nearly continuous readings at each site during sonde deployment.
Some data gaps did occur as a result of equipment malfunction or damage. Specifically, at QC-04 (Amstutz) site damage to equipment occurred several times during storm events, due to the high velocities coupled with rocks being frequently re-distributed along the channel. Upon sonde retrieval, both fine and course sediment was often noted in and around the sonde’s housing tube. Water Temperature (Figures in Appendix A) Water temperatures were similar across the five sites. Maximum temperatures ranged from 22.55 C at QC-04 (7/26/09) to 26.84 C at QC-02 (7/17/08). High water temperatures play an important role in many biological and chemical processes in the river. When stormwater contributes a large portion of the flow to the river, water temperatures are generally higher. This can affect biological organisms such as macroinvertebrates and fish. This has particular relevance to the fishery management in the river as higher water temperatures are not conducive to some fish species, particularly salmonids.
DRAFT Final Report, FFA #3190601 36

Specific Conductance (Figures in Appendix A) Specific conductance (conductivity) differed among the sites with QC-04 exhibiting the highest maximum of 3.647 mS/cm in 2008 (9/3/08) and 2009 (7/21/09; 3.590 mS/cm). Conductivity readings were expected to be highest during the winter months as a result of road maintenance practices. Most of the sites were frozen January and February 2009, however QC-04 was open and conductivity readings were 2.162 mS/cm (1/20/09) and 2.684 mS/cm (2/24/09), respectively. In March 2009, all five sites were unfrozen and conductivity ranged from 1.036 mS/cm (QC-10) and 1.867 mS/cm (QCA-01). It is noted that readings were taken only during scheduled sampling dates and not during or immediately after a snow event. Chloride concentrations, however, were highest in January and February, as expected; however, overall conductivity was surprisingly high in the summer months (see monthly water samples section). Minimum conductivity was always associated with rain events. In some cases, conductivities dropped by a factor of ten within a couple hours. A typical “check-mark” response to rain can be seen in Figures 26 and 27, where conductivity steadily increases between rain events, then sharply declines as flow increases. However, site conditions and position in the watershed influenced the data. For example, on July 15 2009 and brief storm event occurred resulting in a near simultaneous drop in conductivity at three of the sites (Figure 27). However, at QC-10 and QC-04 the results were different (Figure 28). At QC-10 conductivity changed very little, due probably to its position near the top of the watershed and dependent on the rain intensity in this part of the watershed. During this event rainfall totals at two rain gages differed significantly. At the SMC rain gage located near 17th Street and Green Bay Road, the total rainfall was 0.32 cm while at the LCHD rain gage at Waukegan South beach along Lake Michigan the total amount was 1.18 cm. At QC-04, at the bottom of the watershed, conductivity at first decreased similar to the three other sites (Figure 28), but then brief increase occurred where readings rose from 0.336 mS/cm to 1.395 mS/cm within 30 minutes, when decreased to 0.375 mS/cm within 45 minutes. This suggests a “pulse” of water containing higher levels of dissolved ions. When plotted with the flow data this suggests a potential “first flush” effect occurring.
DRAFT Final Report, FFA #3190601 37

Figure 27. Conductivity response to a rain event at QCA-01, QC-02, and QC-03 in the Waukegan River on July 15, 2009.
Conductivity - 2009Waukegan River, Washington Park South Branch
0
0.2
0.4
0.6
0.8
1
1.2
1.4
1.6
1.8
2
12:00
:00 A
M
2:24:0
0 AM
4:48:0
0 AM
7:12:0
0 AM
9:36:0
0 AM
12:00
:00 PM
2:24:0
0 PM
4:48:0
0 PM
7:12:0
0 PM
July 15, 2009
Con
duct
ivity
(mS/
cm)
0
0.05
0.1
0.15
0.2
0.25
0.3
Rai
nfal
l (cm
)
QC-03
QCA-01
QC-02
Rainfall
Figure 28. Conductivity response to a rain event at QC-10 and QC-04 in the Waukegan River on July 15, 2009.
Conductivity - 2009Waukegan River, Washington Park South Branch
0
0.5
1
1.5
2
2.5
12:00
:00 A
M
2:24:0
0 AM
4:48:0
0 AM
7:12:0
0 AM
9:36:0
0 AM
12:00
:00 PM
2:24:0
0 PM
4:48:0
0 PM
7:12:0
0 PM
July 15, 2009
Con
duct
ivity
(mS/
cm)
0
0.05
0.1
0.15
0.2
0.25
0.3
Rai
nfal
l (cm
)
QC-10
QC-04
Rainfall
DRAFT Final Report, FFA #3190601 38

pH (Figures in Appendix A) The pH readings in the Waukegan River almost exclusively ranged from 6-9, with most readings between 7-8. In a few instances pH exceeded 9. At QC-02 in October 2008 and again in April 2009, pH was above 9, with a maximum of 9.21 on 10/22/08. Other pH readings greater than 9 were found in early April 2009 at QC-03 (max. 9.10) and QC-04 (9.06). The pH readings greater than 9 represent less than 1% of the total readings at all sites. Turbidity (Figures in Appendix A) Turbidity readings at all five sites varied considerably. Minimums at all sites during some times of the year were 0.0 NTUs, while maximums often exceeded 1000 NTUs. QC-04 and QC-10 had the highest maximum and median turbidity values over the course of the study. Turbidity can be influenced by a number of factors including the debris type and coarseness during flow. High turbidity readings were associated generally with rain events, with highest values occurring during and immediately after rain. This corresponds to the monthly water sample results, particularly with TSS (see Storm Event section). Between rain events turbidity was low with median readings at QCA-01, QC-02, and QC-03 being below 10 NTUs and below 20 NTUs at QC-04 and QC-10. Dissolved Oxygen (Figures in Appendix A) Dissolved oxygen (DO) concentrations fluctuated during the study, however all sites violated state standards, sometimes for significant periods of time. QCA-01 had DO concentrations below the 5 mg/L standard 33.0% of the time (8562 of 25,949 readings), QC-10 32.5% of the time (7937 of 24,399), and QC-02 28.1% of the time (7485 of 26,663). The other sites were not nearly as bad: QC-04 (3.3%, 676 of 20,538) and QC-03 (2.8%, 769 of 27619). It is noted that site characteristics influence these results. Both QC-04 and QC-03 sites have higher flow rates than the other sites. QC-04 channel bed consists mostly of relatively new rock and QC-03 is approximately 80 feet downstream of a created riffle pool. The other sonde sites were located in deeper pools. As expected, most of the low DO conditions existed during low or no flow conditions in the summer months. However, low DO concentrations at QCA-01 were found even late into the year (November) after water temperatures declined. Rain events influenced DO concentrations (see example in Figure 29). Generally the response of DO to rain was immediate as concentrations increased with higher flow. As in the illustrated example, the response to rain was different at the various sites. Again, rain patterns in the watershed were likely not uniform so it is expected that there would be variation. For this event QC-10 and QCA-01 had the most significant response as both sites were well below the 5 mg/L standard prior to the rain. Even 12 hours after the relatively small event, both sites were above the standard. The response of the other three sites was not as significant, as less than six hours after the event the DO concentrations were at pre-event levels. Time of year influences the affects of rain on DO. The example in Figure 29 is during low flow time when DO concentrations are also low, and thus the influence of rain will be more dramatic. Rain affects
DRAFT Final Report, FFA #3190601 39

DO less during higher flow periods or when ambient and water temperatures are cooler. For example in June 18-20 2009 when heavy rains covered the watershed, the DO concentrations at the sites fluctuated minimally. For this time period the DO at QC-03 ranged from 7.18 to 9.36 mg/L. Figure 29. Dissolved oxygen concentration response to a rain event at QC-10 and QC-04 in the Waukegan River on July 15, 2009.
Rain and Dissolved Oxygen
0
2
4
6
8
10
12
12:00
:00 A
M
2:24:0
0 AM
4:48:0
0 AM
7:12:0
0 AM
9:36:0
0 AM
12:00
:00 PM
2:24:0
0 PM
4:48:0
0 PM
7:12:0
0 PM
July 15, 2009
DO
(mg/
L)
0
0.05
0.1
0.15
0.2
0.25
0.3
Rai
nfal
l (cm
)
QC-03QCA-01QC-02QC-10QC-04Rain
Metals and Pesticides
The Clean Water Act requires that state environmental protection agencies release a report detailing the current status of impaired waters in the state. Both branches of the Waukegan River are listed as impaired waters under the Illinois 2008 303 (d) Category 5 Impaired Waters list. Metals (Cr, Ni, Ag, Zn), hexachlorobenzene, and pesticides (PCBs, DDT, Aldrin) have historically been found at elevated concentrations in sediment samples. A subset of the water samples from monthly grab and stormwater event sampling was shipped to the IEPA lab in Springfield, IL to be analyzed for metals and pesticides. At the time of report compilation only a portion of the data had been received from the state lab. Of the reports that were received, some detections for each of the metals were found, however none exceeded state standards. Similarly, hexachlorobenzene and pesticides (DDT and Aldrin) were detected in some water samples, but did not exceed state standards. PCB’s were not
DRAFT Final Report, FFA #3190601 40

detected from the samples analyzed to date. Other pesticides such as atrazine and simazine were also detected in water samples although at low concentrations. Sediment Sediment samples were collected in November 2008 and August 2009 by IEPA staff. At the time of this report, no results had been received from the state lab.
DRAFT Final Report, FFA #3190601 41