water quality, eutrophication, and salinity changes
TRANSCRIPT

WATER QUALITY, EUTROPHICATION, AND SALINITY CHANGES


The Use of Diatom Remains as a Proxy of HistoricalSalinity Changes in Airplane Lake, Louisiana
MtCttAat L, PAttsoNS r QUAY DORTCH r R. EUC!Evt:. TttrtNrra'.NANCY N, RAttALAts'
'Lrruisianu Unit ersities Mari ne Consortium. 8124 Hvt y, 56,Charrvin, I> 70344; TEL: 504-85/-288!; FAX: 504-851-2874;email rnparsrrnsrisrlumcrrn,edu
-louisiana Unit ersities Marine Consortium, 8124 Hu v, 56,Chauvin, IA 70344: TEL. 504-85/-2800: FAX: 504-85/- li'74iemail: qdortch Olumcon,edu
'Coastal Ecology lnstrture and Department r~f Oceanography and Coastal Sciences.Louisiana Stare University, Baton Rouge, LA 70803TEL: 225-388-64542 FAX: 225-3Hlf-6326; email: [email protected]'wrlsu.edu
Louisiana Universt'ties hfarine Cr>nsorti um, A�4 Ha y. 56,Chauvin, I A 70344; TEL: 504-851-2800; FAX: 504-851-2874;email; nrabutaisC<lumcon.edu
aCorresponding author. Present address: Marine Science Department, Untversity of iiawtuiat Hilo, 200 W. Kawili St., Hilo, HI 96720; email: mparsonstlshawati edu
ABSTRACT: We analyzed dated sediment core samples from Airplane Lake, a small, shailowlake west of Barataria Bay to determine if diatom remains preserved a salinity signal in thishighly variable environment. We developed a diatom-based index as a proxy for salinity overthe 92 years represented by the samples. This diatom-based salinity index indicated an overallincreasing trend in salinity at Airplane Lake of approximately l ppt per decade. A significantdecreasing trend in salinity, however, was evident from l973 to i992 on the order of 5 ppt perdecade, possibly in response to the documented increased riverine discharges and precipitationin the region. This preliminary study demonstrates that diatom remains in marsh sedimentcores may provide a useful proxy for studies of salinity changes in coastal Louisiana.
lNTRODUCTlON
65
Coastal Louisiana is experiencing high ratesof land loss �.86% per year between 1955 and 1978;Baumann and Turner 1990!, Wetland loss has beenlinked hypothetically to increasing coastal salinity.Sah water can stress and kill marsh plants, especiallyfresh water plants, which in turn can result in landloss due to the reduced ability of the marsh plantsto hold organic matter in place McKee andMendelssohn 1989!. The primary evidencesupporting acoast-wide increase in salinity includes
Fram the Symposium Recent Researctr in Coastal LorrtstonrrIVartrrat System Funcrion and Response ro Human /nfluence.Roza~, L.P., ],A. Nyman, C,E. Proton, h;,tv, Rabelais. 0 J.Reed, and R,E. Turner editors!. 1999. Published hy LouisiattaSea Grant College Program
t.he movement and shifts of vegetative zones ofmarsh plants over the past several decades Chabreck and Linscombe 1982; Fuller ct al. 19951and a northward extension of oyster leases inBarataria Bay Van Sickleet al. ]976!, Conversely,studies of long-term salinity data demonstrate thatsalinit ies have increased in some areas but decreasedor remained unchanged in others Wisernan et al.1990a; Swenson and Swarzenski 1995!, There tsno strong evidence for a coast-wide incrcasc insalinity. Rather, salinity increases appear to bclocalized events probably due to the dredging ofnavigation canals Wisernan et al. 1990at. Whilereports of documented salinity changes exist, theavailable salinity data are too sparse temporally andspatially to properly test for coast-wide saiinityincreases.

M M. L. Parsons stal.
Core dating
MATERlALS AND METHODS
Core collecOon
l ie~xudc
'g- - m pofc4L'r lLo»sianashowing the locationofArrplaneLakeandimportantgeographicfeaiu s.
One approach that can provide historicalinformation on changing marsh salinity is theanalysis of diatom remains preserved in the sedimentrecord. The morphology of a diatom valve isspecies-specific and generally preserves well in thesediment, Many diatom species have specificsahnity preferences, which can result in changes ina diatom community if and when salinity changes.Thus, diatom valves are useful indicators of pastsalinity. Identification and enumeration of diatomvalves coupled with information on optimal salinityconditions for growth can be used to "reconstruct"the water conditions at the time the diatoms wereli v ing Battarbec 19$6!. This study introduces someof the concepts and formulations as applied to onesalinity reconstruction that was part of a larger studypresented in Parsons et al. �999!.
We collected two sediment cores in August,1993, from Airplane Lake, a 19 hectare water bodywest of ~a Bay Fig, 1! utilizing 3-in diameter,1.3-rn long plastic tubes. Because of the nature ofthe core collection process fusing -1-m tubes tocollect cores underwarer in a - l -m deep salt marshpond!, it was impossible to accurately measure corecompaction during core collection. Wc measuredcore compaction during core extrusion in the
laboratory. Cores were stored at 4 C, and the longestsediment core was split thc following day on acustom-made precision core extruder a threadedextruder allowing precise measurements for slicing!.Visual inspections and length measurements of thecore were recorded prior to and during core extrts-sion. We split the core into l -crri increments whichwere then hornogenizcd and subdivided forsubsequent analyses,
Selected core increments were dated by '~Cs Milan et al, 1995! and" Pb CutshaB et al. 1983!using a Princeton Gamma-Tech 60-mm diameterintrinsic gerrnaniurn "N" type coaxial detector �0%efficiency! interfaced to an EG&G Ortec 92Xspectrum master integrated gamma-spectroscopysystem. Samples for ""Pb were held for two weeksbefore analysis to allow for rxluilibrium betweenatmospheric '-~Rn and '"Pb. Samples for "'Cs werecounted for at least 4 h to yield a counting error of10% in the vicinity of the 1963/4 peak,corresponding to the peak '"Cs fallout for thesoutheastern United States Pcnnington et al, 1973!.Samples for '- 'Pb werc counted briefly with a sourceof "'Pb to measure thc sample se!f-absorptionpotential. The samples were then recounted for 24h to obtain a significant amount of net counts abovebackground. Additional counts werc conducted for"'Pb activity so that supported -""Pb could be

Salinity Trends in Coastal Louisiana: Diatoms 67
determined. Supported ""Pb was subtracted fromthe total to obtain excess '"Pb, from whichsedimentation rates werc determined. Results for' "Cs and '-"'Pb are reported as pCi g ' dry weightsediment!.
The '-"Cs-based scdin>entation rate wasdetermined by dividing the difference between thedate the core was collected and 1963/4, by thc depthwhere the peak in "'Cs activity occurred, Asedimentation rate was determined from the excess""Pb utilizing the constant rate of supply CRS!model. assuming that there is negligible migrationof "Pb in the sediment and that the supply of excess"'Pb is constant over titne, The sedimentation rate,therefore, was determined through the inverse ofthe slope of the least-squares regression line thatwas fitted to the '"Pb profile. The '"Cs and "OPbestimated sedimentation rates were averaged to givean overall sedimentation rate that would apply forthe whole length of the sediment core,
Diatom analysis
Separate portions of selected homogenizedsamples were prepared and analyzed for diatornsaccording to Parsons �998!. A 100 itl aliquotcontaining a known concentration of glassrnicrospheres �0 ltm diameter, Unisciencesa, Ltd,!was added to «n approximate 0.5 cc portion ofsediment to estimate diatom absolute abundance;Battarbee and Kneen 1982! in a 15 ml graduatedpolypropylene centrifuge tube and rinsed severaltimes with 2% sodium pyrophosphate NaPP! toremove clay particles Bates et al. 1978!. Sampleswere cleaned to remove organic matter! with 2 rnlof concentrated nitric acid which was boiled for 30min in a water bath, followed by six rinses withdistilled-deionized water DDW!. Rinses involvedcentrifuging the sample for 10 min at 2100 rpm,subsequent removal of the supernatant, and additionof fresh NaPP or DDW Microscopic slides weremade by placing one or two drops of cleaned sample now in solution in 10 ml DDW! onto a ¹1 25x25mm coverslip. The coverslip was dried and mountedon a slide with Hyrax", Slides were examined on aHiss universal microscope. At least 250 diatotnvalves were counted per slide, which provides agood estimate of the diatom species >L5% of thepopulation Parsons 1996!.
Dtatotn data analysis
A diatom-based salinity index t Sl 1 wasformulated using a multiple-variable rcgrcssiontechnique comparing diatom species salinit>groupings wi h the available salinity data Parsonset al. 1999!, A similar approach was taken by l'lower�986!, in his study of pH changes in lakes. Thesalinity groupings were detcrmincd from theliterature for as many diatotn spccics as possiblethat were >L5% of the population, Broad salinityclassifications were used to standardize the disparatesalinity groupings devised by these rel'erences, andto acknowledge the dynamic environment typicalof the Louisiana coastal marshes. The salinitygroups used in this study, based on Kolbe �927!and Round �981!, refer to salinity ranges withinwhich a particular species best thrives, or mostcommonly occurs; ol igohalobc 1 0-5 ppt!,mesohalobe �-20 ppt!, and polyhalobe �0+ ppti,The percentage of the diatom population classifiedin each group was summed for each sample.
There were several cases in which a saliniiyclassification could not be assigned to a diatomspecies because either the species could not beidentified, or no salinity information was found inthe literature. This discrepancy was corrected bydividing thc percentage ol' the diatom populationwithin each salinity group by the percemage thatcould be classified, thereby standardizing theclassifications to one and allowing directcomparisons among the samples. The SI wascomputed using two ratios, the oligohalobe iornesohalobe cotnponent OM! and the mesohalobeto polyhalobe component MP! in the followingmanner; SI = 35.72 OM! � 0.62 MP! + 9,17, Ourpreliminary studies have shown that the SI predictssalinity with an R'E!,8309 and a slope of 0,83,indicating that the Sl is a reasonable proxy forsalinity Parsons et al. 1999!.
Regression analysis
Sedimentation rate estitnates acquired throughcore dating allowed us to assign an approximate dateto each sample analyzed for diatoms. The Sl modelwas then applied to the diatom data to estimatesalinity trends through the core, and therefore overthe time frame represented by the sediment core.

08 M. L Parsrons et at.
Salinity trends were estimated using regressionanalysis of the SI versus the cote dates. Significantregression results would indicate annual trends inthe SI, and therefore, salinity. Regression analyseswere computed using the PROC REG procedure ofthe SAS statistical program SAS 198g!.
Salinity cbsta anal yshs
Salinity data were obtained for Airplane Lakefrom the Louisiana Department of Wildlife andFisheries. Salinity averaged 20,5 ppt overall with arange of 2-34 ppt over the ~ourse of the record. Thedata are typical of salinity data gathered around thestate, in that the dani were collected on a weeklybasis from 1972 to 199g. The data were collectedsporadically, however, resulting in actual rnea-surernents being collected only 42% of the time,We attempted to circumvent potential analyticalproblems due to the highly variable nature of thedata and sporadic sampling by incorporating aseasonal-correction on the data. Salinity Auctuatesseasonally in coastal Louisiana in response tovarying river Aow and precipitation Swenson andSwarzenski 1995!. Therefore., by reinoving thiscyclic variability, we could reduce some variabilityand comet for sporadic sampling. For exainple, ifsalinity were measured solely during the springfood ol' the Mississippi River at a site influcncedby river Aow!, salinity values would be lower thanif salinity were measured in the winter when riverAow is low. Thc availabic salinity data i,e., noionly the data used in, this study! contain data inwhich thi» very scenario exists; the available datafor a given year might only exist for a. few springmonths e,g�Airplane Lake!. Therefore. we used aseasonal-correction in an attempt to rectify suchproblems that can arise due to sporadic sampling,
The seasonal-correction was accomplished bycalculating monthly means for the. salinity data set,subtracting these values froin the specificmeasurements taken during the resp':tive month,then adding this difference back io the overall meanto return the data to the same range as the raw data.While this approach may be flawed i.e., the springflood of the Mississippi River does not always occuriil April!, we believed thai. little else could be doneto correct for sporadic sampling, The salinity data
were subjected to a regression analysis to determineif trends were evident.
Freshwater inputs
An index of freshwater inputs was formulatedfrom available precipitation data and discharge datafor the Mississippi and Atchafalaya Rivers.Precipitation data were obtained from the LouisianaState Climatology Office Monitoring Station inHouina LA¹4407!. The data were summed intoannual precipitation from 1930-1994 in preparationfor further analysis. River discharge data wereobtained from the United States Army Corps ofEngineers courtesy of Dr. W, Wiscman, CoastalStudies Institute, Louisiana State University, BatonRouge, Louisiana! for Tarbert Landing, Mississippi Mississippi River! and Simrnesport, Louisiana Atchafalaya River!. The river data were convertedto average annual discharge from 1900-] 994. Thethree sets of annual data precipitation and the tworiver discharge! were standardized about their meansby dividing each annual value by the overall meanvalue. This was done so that these three principalsources of freshwater would be weighed accordingto their Auctuations over time. Since it would be
impossible to quantitative!y determine the pastproportion of freshwater inputs riverine versusprecipitation, and Atchafalaya versus MississippiRiver�! at various sites, the three annual standardizedvalues only the two riverine data for pre-1930years! were averaged to formulate a relative measureof how total freshwater inputs in the region havechanged over ime. The major assumption of thisstandardized technique is that the proportion offreshwater within each source precipitation orriverine! entering Louisiana coastal waters has notchanged over time. The relative measure valuesweve plotted, and a regression line was fitted to the10-year moving average to test for changing trendsin freshwater inputs over this century.
RESULTS
Core dating and site descriptions
Table 1 presents a general site description, fieldmeasurements made during the core ce lection trip,and core dating results. Airplane Lake is a 19 hectare

Salinity Trends in Coastal Louisiana. Giatoms 89
Table l. Description aud core dating results for Airplane Lake. The area was estimated from scaledaerial maps. Salinity ranges were computed from available salinity data froin Airplane Lake. Waterdepths were recorded from field observations; major plant communities were identified in the iield,Compaction data include the core lengths prior to and after extrusion, from which % compactionvalues were computed. See text and refer to Figs. 2 and 3 for corv. dating results and discussion.
surface water area hectares! 19
salinity ppt!
water depth rn!
major plant communityconfirmed stability via maps!
date cores were collected
Spartirru atterniflora
since 1955
8/26/93
i 10.4
105.7
pre-extrusion core length cm!post-extrusion core length cm!
water body surrounded by salt marsh dominated bySparrina alterrr i flor. The post-extrusion sedimentcore length was 105.7 cm and compaction was 4.3%,
Statistical analyses
Diatom analysisRegression analysis of the salinity index
demonstrated that there was an overall significantincrease in salinity of 0.13 ppt yr ' over the length
A total of 27 samples were counted �-10, ! 3,17, 20-22, 24, 26, 28, 30, 40, 50, 60, 70, g0, 90,
% compaction
' "Cs peak cm!
"'Cs sedimentation rate crn yr '!
-'"Ph slope ln i "Pb! pCi g'!
-' Pb slope standard error
-"'Pb sedimentation rate cm yr '!
overall sedimentation rate cm yr'!
time frame represented by the core
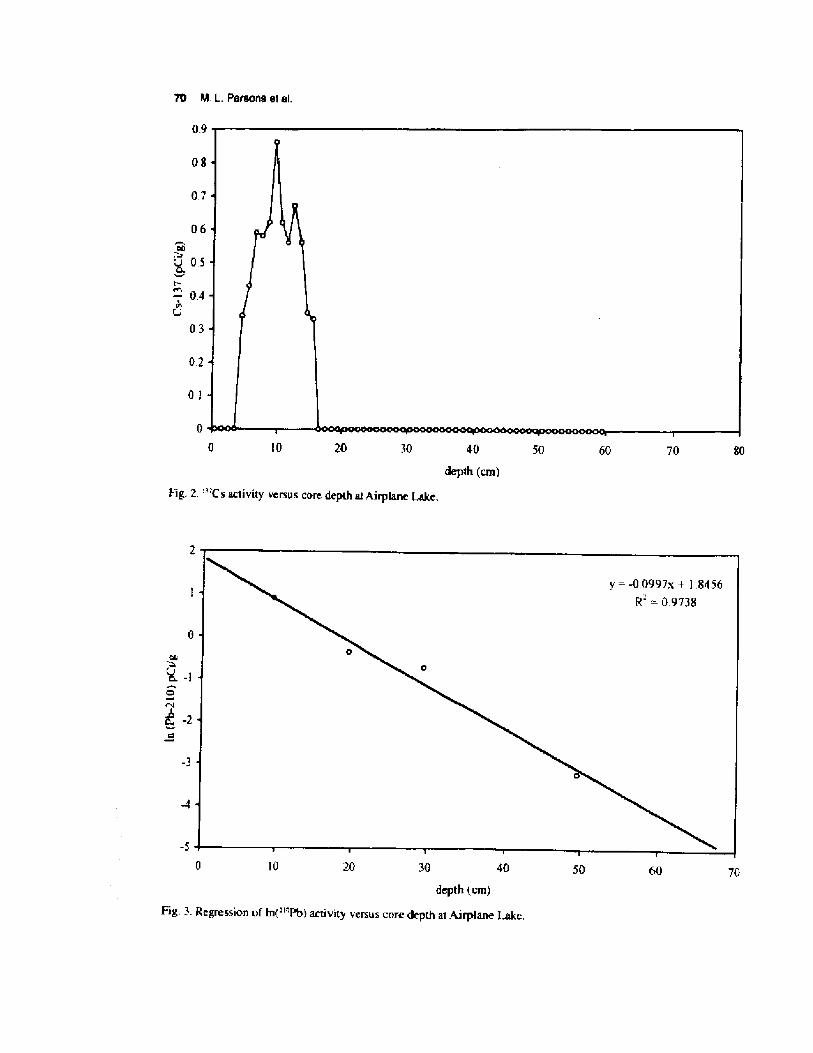
The peak in '"Cs activity represents the year s!1963/4 Milan et al. 1995!, and occurred at a coredepth of 9.5 crn Fig. 2!. The ""Pb regression line Fig. 3! indicates that both dating methods gavesimilar estimates of sedimentation rates �,31 vs.0.33 cm yr'!. We averaged the two rate estimatesto give an overall sedimentation ra.te estimate of 0.32cm yr ' on thc compacted sediment core-, The corecontained a record of 330 years according to thesedating results, although this estimate tnay be in erroras the -'"Pb results are only applicable to 150 yearsHP at best.
4.3
9.5
0.33
-0.0997
0,011564
0,31
0.32
1664-1993
100, and 106 crn! in which 7762 diatom valvesrepresenting 165 species from 55 genera wereidentified and enumerated, Diatom data from below30 cm in the APL core werc not used in furtheranalyses because of poor diatom preservation.Therefore, results are only presented for the top 30cm of the APL core, which was cstirnated torepresent from 1902 to 1992. Of the 165 specie~,7K were .5% abundant in any one sample in theupper 30 cm of the core!, and 31 of these could hcclassified in the halobien system Table 2!. Thcproportion of valves counted that could be c/assifiedin the halobien system ranged from a low value of54% � and 4 cin! to a high of 85% �0 cm!, overall,71% of' all valves counted could be classified.
VO M. L. Peraontt et el.
0.9
08
0,7
0.6
F05
�,' 0.4
02
80IO 7020 504030 60
depth cm!Fig. 2. "'C s activity versus core depth at Airplane Lake. 405020 70
10
depth ctn!
Fig, 3. Regression of tn "'Pb! activity versus core depth at Airplane IMe.

Salinity Trends in COaStal LOuiSIane Diatome 71
Table 2: A list of all diatom species counted that were >1.5'0 relative abundance in at least onesample that could be classified following the halobien system of Kolbe �927! and Round <1981! o=oligohalobe, m=mesohalobe, p=polyhalobe!. The references used to obtain these classificationsare indicated by the superscript above each classiTication, which refer to the following works:1 Foged 1980; 2-Foged 1987; 3-Marshall and Alden 1993; 4-Prasad et al, 1990; 5-Caljon 1983;6-Vos and deWolf 1993; 7-Foged 1986; 8-Hustedt 1955; 9-Hendey 1964.
Species halobien classificationauthority
Kiitzing! Cleve
Kiitzing! Grunow
Ehrenberg
Giffen
Achnunthes brevr'pes var, intermedia
Achnanthes delicarula
0' "
m'
Acti noptychus senari us
Amphora copulata
Aulacosei ra granulata
Biremis ambr'guu
Caloneis westir'
P .6i
0
0 I.n
rn'
Cocconei s disculoi des0I
01 57Cocconeis plucenrula var. euglypta
Crati cula cuspi data
Cyclotella caspia
Cvc lorella chocrawhatcheeana
0"
0'
Prn-'
P'
0 I 'I
ol I
P*m'
Navi cula abunda
Navi cula pusillalVavicula salinarum var. minima
PlVa vi cula yarrensi s
Ni tzschia compressa
Ni tzschia lane cola
rn' Bailey! Boyer
Grunow P P csNit~chia panduriformisiV'rt schia scalaris
Gregory
Ehrenberg! W, Smith
Ralfs in Pritchard! Mann Grunow! Mann
tn'Petroneis marina
Tryblioneila granulata var, granulara
Cyclotella meneghini ana
Diploneis didymoDirylum brighttvellii
Fallacia forci para
Fragrlaria brevistriata
Fragi laria pr'nnata
Gyrosigma peisonis
hfelosira moni li formis
Melosi ra numnruloides
Ehrenberg! S irnonsen
Cleve! Mann
W. Srrrith! Hendey
Hustedt
Ehren berg
Kiitzing! MannGrunow
Prasad
Kiitzing
Ehrenberg! Ehr. West! Grunow
Grevillc! Mann
Grunow
Ehrenberg
Grunow! Hustedt
O.F. Muller! Agardh
Dill wyn! AgardhHustedt
W. Smith
Grunow! Colby
Grunow

72 M. L Paiaona at al.
30
25
20
15
10
0 ] 900 1910 1 920 1930 1940 1950 1960 1970 1980 1990 2000!'C3fFig. 4, The diatom-based salinity index Si! determined salinity profile for the Airplane Lake sediment core.
Statistically-significant overall and recent trends in the S1 are illustrated.
25
7Qo
I15vi 10
1970 1975 1980 1985 1990 1995 2000Fig. 5. Salinity data from Airplane Lake: 1972-1998. A k9%ticall!-significant regression line vvas fit to the dataf~m l98l-l998.

»li>i' Trends iit Coastal Louisiana Diatoms 73
0.3
200119801960194019201900
year
Fig. 6. Annually-averaged, standardized freshwater inputs to the region from 1900-1994, Moving 10-year averages plotted every five years! are also plotted, and were used to generate the significant regression line pc0.01!.
DISCUSSION
Other salinity studiesSalinity changes at Airplane ~e
The SI results are corroborated by other studiesof coastal Louisiana salinity trends Wiscrnan ct al.1990a; Swenson and Swarzenski 1995k prov idingfurther evidence that thc Sl reconstruction v asaccurate and can be used as a proxy for past salinity.
The SI reconstruction of salinity at AirplaneLake Fig. 4! displays significant changes in salinityand can be summarized as three characteristics; thereis an overall increase in salinity between 1902 and1992; thc increase is most prevalent between 1902
1.2
e
09
0.6
of the core p&.0008; Fig. 4!. The trend has twocomponents. The increase inainly occurs between1902 and 1973 R'=0.4726; p=0.0134!. Asignificant, recent trend o< decreasing salinity isevident in the core between 1973-1992 -0.52 pptyr', p=0.0088!. A significant pc0,0001! decreasingtrend is also evident in the actual salinity data Fig,5! between 1981-1998 -0.2 ppt yr'!. Freshwaterinputs have increased this century at an average rateof 0.3% yr' Fig. 6! based on the significant trendseen in the moving average.
and 1973; salinity levels appear to decrease between1973 and 1992, possibly reflecting increasedfreshwater inputs Fig. 6!. This conclusion issupported by work presented by Wiseman et al.�990a! and Bratkovich et al. �994!, v hoacknowledged an increase in river discharge sinceat least the 1950s. Wiseman et al. �990a! alsodemonstrated that a negative relationship existsbetweeri Mississippi River discharge and salinity atstations near APL Grand Terre; Fig. I l. Wiseinanet al. �990b! indicated that this Mississippi Riverdischarge influences both lower and upper estuarinesalinities at proximal and distal locations,

74 M. L. Parsons et al.
Diatoma and saiinity
Wisernan et aL ] 990a! analyzed availablc salinityrecords utilizing a seasonal Kendall-Tau analysis,which is a non- parametric test for a monotonic trend not necessarily linear! that can handle the highdegree of variability typical of these estuarinesa]inity measurements. Swenson and Swarzenski�995! rc-assessed sa]inity trends utilizing additionaldata collected after the Wiseman et al. ] 990a! studywas completed, by conducting various linearanalyses on year groupings i,e., 1965-1969 vs.1969-1972! both of which account for and discount
nal variadon. These studies reveal that salinitydata from a different monitoring station nearAirp]ane Lake Grand Terre, S3 l 5! displayed similartrends over the same titne periods as the Sl did.Wiseman ct al. l990a! showed that there was anoverall significant monotonic decrease in salinityat station S315 over the time span analyzed �962to 1985!. S wenson and S warzenski �995! studiedthe expanded data from S315 in smaller incrementsand found that there was a significant increase insalinity from ]955-1969, followed by a significantdecrease from l969 to 1994. The APL SI showedsimilar trends Fig. 4!,
While the salinity increased overall from 1902to 1992 mainly between 1902 and 1973!, itsignificantly decreased between ]973 and 1992. VanSick]c et a]. �976! reported a northward extensionaf oyster leases between l 947 and 1975, possiblyduc to increasing sa] inities in northcm Barataria Bay,which is in agreement with the APL SI results. Itwould he interesting to see, however, if oyster leaseshave retreated southward since 1975, since ourresults and S wenson and S warzenski �995! indicatethat salinitics appear to have been decreasing in andaround Barataria Bay including APL! since the1970s.
Comparison between the SJand acttsal salinity data
The salinity data from Airplane Lake weresuccessfully utilized in the fortnulation of the S!regression model Parsons et al. 1999! itnplyiug thatthe SI was in agreement with the salinity data usedin this study. This statement is strengthened by trendanalyses of the sa]inity data in which recent <20years! decreasing, salimty trends were evident at
Airplane Lake -0.2 ppt yr ' between ]981-1998;pcs.000]; Fig. 5! just as the SI core reconstructionspredict. The trend in the salinity data, however, wasless than the SI trend -0.52 ppt yr '!, either reflectingthe sporadic nature of the salinity data, or modelerror diatom misclassification or core dating error!.
The salinity data used in this study wercdiscrete data, and the spi>radic nature of the datacollection may have resulted in a poor representationof the salinity regime. This is best exernpliflied bythe observation that data were collected less than50% of the time, and were often collected solely inthe spring e.g�March through May be! ween 1992and 1998!. Additionally, data were collected withrelatively low frequency weekly!, which does notreflec the variability of salinity in coastal Louisianawaters. The hydrology of .ouisiana's coastalmarshes is very dynamic. Cyclic salinity variabilityis influence by diurna] tides on daily scales!, riverflow, and precipitation seasonal to annua] sca]es:Swenson and Swarzenski 1995!. Sa]initymeasurements should take these cyclic variationsinto account, which is generally not the case,
The responses of diatorns to salinity can varywidely between species and within a species, Thereis evidence tha a diatom species can displaydifferent salinity optima in different water bodies,although tolerance ranges generally overlap Cumrning and Smol l993; Wilson et al. ]996!.Some diatom species may have very large toleranceranges i.e., euryhaline! and therefore wi]I not beuseful to reconstruct estuarine salinities Jugginsl992!. Wilderman �987! believed that this wasespecially true at saliruties between 8-16 ppt, inwhich no reliable indicators may exist. Manyspecies will exhibit a salinity optima. Because theseresponses are no linear, linear niodels as was usedfor this study! tnight not be the best analyticalapproach Juggins 1992!. Additional]y, a particu]ardiatom species response to salinity changes maydiffer based on thc duration, frequency, andmagnitude of change Carpe]an 1978; Admi raal andPeleticr 1980!. It is itnportant. therefore, to knowhow salinity changes frequency, etc.! and how aspecies will react to these sa]inity changes.

Core dating
Sonic of the variability in the SI model couldbe duc to core dating errors c.g., counting '"Cs!and regression -'"Pb! errors! which could cause aninaccurate date to be applied to a core depth, therebyaltering trend analysis results. The ' "Cs counts weredesigned to limit counting error to 10'% near thc1963/4 peak Milan et al. 1995!, and the '-"Cs profilefor thc Airplane Lake core was defined enough thatthis peak is Hear Fig. 2!. The "'Pb profile Fig. 3!was clear after the analysis of only four satnples,and resulted in a high R' �,9738!. Thc APL sedi-mentation rate estimates determined by '-"Cs and""Pb were nearly identical �.33 vs. 0.31 crn yr ',Table 2!, so we are confident that the core dates areaccurate for the APL core.
DeLaune et al. �978!, however, analyzedsediment cores froin Airplane Lake for '"Cs andestimated sedimentation rates at 1,1 cm yr'. Thedifferences between our estimates and DeLaunc etal. �978! are not surprising, as there weredifferences in sample analysis. DeLaune et al.�978! analyzed 3-cm sections, we analyzed I-crnsections offering better resolution, DeLaune et al.�978! used a lithium-drifted germanium detectorto count y particles, an instrument that is lessaccurate than the germaniuin "N" type coaxialdetector wc used sotne 15 years later. DeLaune etal. �978! and Milan et al. �995! both reported ahigh degree of core-to-core variability both withinand around Airplane Lake. DeLaune et al. �978!reported that one core taken in Airplane Lakedisplayed a prominent '"Cs peak while a secondcore taken 350 rn away did not. Milan et al. �995!reported that - Cs sedimentation rale estiinatesditfered over 50% at different locales, and over 30%within replicate cores at the same location. Lastly,our sedimentation rate is estimated for thecompacted sediment core, whereas the DeLaune etal. �978! value is for uncornpacted cores. We gaveour values for compacted cores because we werenot confident in our estimates of compaction duringcore collection, and we were primarily interested indating the core versus estimating actual sedi-mentation rates. Therefore, the differences insedimentation rates between our study and othersare explainable and expected.
Salinity Trends in t oastai Louisiana Oiatoms 75
Justification of the saliriitv index
Wc believe that thc dittcrcnces that exist in
the magnitude of the dccrcasc in thc salinity and gltrends for Arrplane Lake are priniarily duc to thesporadic nature of thc salinity data and ihcsimplified, linear nature ol' thc model rather thaninherent model or core dating errors, Our resultsdetnonstratc that thc SI can bc utilized successfullyas a proxy for salinity changes. This conclusion issupported by the similarities presented between theSI trends and salinity data fr«m Airplane Lake i thisstudy! and Grand Tcrrc Wiscman et al. 1990a:Swenson and Swarzenski 1995!. This studydemonstrates that salinity signals arc evident in acoastal marsh sediment record, regardless of thc highvariability typical of this environment. Furthermore,a recent decreasing trend in salinity is evident.possibly reflecting increased freshwater inputs intothe coastal waters of Louisiana. The decreasingtrend exhibitedby thc Si indicates that salinity levelsmay be dropping on the order of 5 ppt per decade atAirplane Lake. These results cast some doubt onhow freshwater diversions which will lowersalinities further! might affect marsh ecosystems ifsalinities are already decreasing at soine locations.For example, the optimum salinity range for oystergrowth and survival for Louisiana has beenestimated to be 5-15 ppt Galtsoff 1964; St. Arnant1964!, If salinities are already decreasing in someareas, and/or will be decreasing further withfreshwater diversions, oyster communities could bead verse I y impacted. H y pot bet i c al I y, otherorganisms dependent on brackish water conditionscould also be impacted by decreasing salinitiesincluding brown shriinp Barren and Gillespie1973!, sponed seatrout Bourgeois et al, 1995 !, andsalt marsh plants e.g�Spurriita ulterrriflara!. Weargue, therefore, that available salinity data areinadequate to properly assess how salinity haschanged in coastal Louisiana over periods >30years! due to human activities. and that sahnityreconstructions of dated sediment cores, utilizingihe model presented here or a future, more refinedmodel, can provide a useful tool to make accurateassessments.

70 M. L Painona et al
ACKIiilOWLEDC le ENTS
This research was funded by Louisiana Sea GrantCollege Program Grant RIM PE-59 awarded to R.E.Turner. N,N. Rabalais, and Q. Dortch, a State ofLouisiana Board of Regents Graduate FellowshipProgram to M. L. P.l, and a Louisiana Uni versitiesMarine Consortium Post-doctoral Fellowship to M.L. P.
LlTKRATURE CITED
Arruiaaat, W. Ano H. Ptrct:rII;R, 1980, Distributionof diatom species on an estuarine mud flat andexperimental analysis of the selective effectof stress. Journal of Fxpr ranental ItrfarineBirrl'ogy and F'roloogy 46:157-175.
BhRRI!IT, B. B. AND GILtj.SPIi., 1973. Primary factnrSwhich influence commercial shrimp pro-duct ion in coasta I Lou i si ana. Lou i s i an aDepartment of Wildlife and FisheriesTechnical Bulletin 9, Baton Rouge, Louisiana.28 pp.
Batt:s, C. D., P. COKON. A%I> P. L, Gra aatu!. 1978. Anew method for thc preparation of' clay-richscditncnt samples for palynologicalinvestigation. IVew Ph vrrilrigist 81:459-463.
BhtTaaar+, R. W. 1986. Diatom analysis, p. 527-570. In B, E. Bcrglund cd.!. Handbook ofHoloccnc Palaeoccology and Palaeohy-drology. John Wiley &. Stins Ltd,. Chichester,II,K..
Barraaau:.. R. W. Atvu M. J. K~t.t-.s- 1982. Thc useof electronically counted microspheres inabsolute diatom analysts. I inrnology andOceanography 27: 184- 188.
Batttuastv, R. H. avn R, 1 . Tt'Rat;R. 1990, Directimpactsofoutercontincntal shelfactivitiesonwetland loss in the central Gulf of Mexico.Fnyr'rr>nnrental Geology and Water ResaureeS15: 189-198.
BRATxovtctr.A.. S. P. Dts,S;Ig�hitr D. A. GoOLSav.1994. Variability and prediction of freshwaterand nitrate fluxes for thc Louisiana-Texasshelf: Mississippi and Atchafalaya Riversource functions, Fstuarr'es! 7:766-778,
BOI'Rot OIS, M. J., Gt:ILtuav, V.. ASO H. BLAslCHEr.1996. A biological and ftshertes profile forLouisiana spotted seatrout, Cynr>scion
riebulosus. Fishery Management Plan Series3. Louisiana Department of Wildlife andFisheries, Baton Rouge, Louisiana, 104 pp.
C~or ',A, G. 1983, Brackish-water phytopmanktonof the Flemish lowland, pp. 1-272. In H. J.Dumont ed.!, Developments in Hydrobiology18, Dr, W. Junk Publishers, The Hagttc.
CAIIPELAR, I.. H, 1978. Evolutionary euryhalinityof diatOms in Changing environmentS, IIIovaHedwi gia 29:489-526.
CHAIIRECV�R. H. attn G. LINscoMar. 1982. Changesin vegetation types in Louisiana coastalrnarshes over a ten-year period. Proceedingsof rhe Louisiana Academy of Sciences 45:98-102.
CuarMIiIO, B. F, ANn J. P. SMoL. 1993. Developmentof diatom-based salinity models for paleo-climatic research from lakes in BritishColumbia Canada!. H ydrobiologia 269/270:179-196,
CuTSHALL, N. H., I. L. LARSON, ANo C. R. OLSZ>'.1983. Direct analysis of" Pb in sedimentsamples: self-absorption, Iti'uclear Instrumentsand Methods 206;309-312.
DtLauhIR, R. D., W. H. PATRrcic, JR., AIvD R. J,Bt~aasH. 1978. Sedimentation rates deter-mined by '"Cs dating in a rapidly accretingsalt Inarsh. IIIature 275:532-533.
F~waa. R, J. 1986. The relationship betweensurface sediment diatom assemblages and pHin 33 Galloway lakes: some regression modelsfor reconstructing pH and their application tosediment cores. Hydrobi'oiogia 143:93-103.
Fooau, N. 1980. Diatoms in Oland, Sweden,Bibh'otheca Phycologia 49:1-193, 18 plates.
FooEo, N, I 986. Diatoms in Gambia. BibII'othecaDiatonrologi ca 12 a!: 1-152, 25 plates.
Fooao. N. 1987. Diatoms from Vitu Levu, FijiIslands. Bihfiotheca Diatomologica 14:1-195,33 plates.
FULLY, D, A., J. G. GossaLn'x, J, BARRas, ~D C.E. Sasstx, 1995. Status and trends in vege-tation and habitat tnodifications, pp. 25-76. InD, J. Reed ed.!, Status and Historical Trendsof Hydrologic Modification, Reduction inSediment Availability, and Habitat Loss/Modifrcation in the Barataria and TerrebonneEstuarine System, BTNEP PublicationNumber 20, Barataria-Terrebonne NationalEstuary Program, Thibodaux, Louisiana.

Salinity Trende ln Cpastal Louiaiana: DietomS 77
GAI rsot-i-, P, S, 1964. The American oyster,Crassostrea virginia Gntclin!. FisheriesBulletin 64, U.S, Department of the interior,Fish and Wildlife Services, 480 pp.
HENDI.Y, N. l. 1964, An intrnduCtOry aCCOunt ofthc sinaller algae of British coastal waters; PartV: Bac ill ariophyceae Diatoms!, Ministry ofAgriculture, Fisheries, and Food, Fisheryinvestigations Series lV. Otto Koeltz SciencePublishers, Koenigstein, West Germany, 317pp., 45 plates.
HvsTE»r, F. 1955. Marine littoral diatoms ofBeaufort, North Carolina. Duke UniversityPress, Durham, North Carolina, 67 pp.
JvoolNs, S. 1992. Diatotns in thc Thames Estuary,England: Ecology, Paleoecology, and SalinityTransfer Function. Bibliotheca Diatoniolngi ca25:1-216.
Kuv8E, R. W, 1927. Zur Okologie, Morphologicund Systematik der Brackwasser-Diatomeen.Pflanzenforschung 7: 1-146,
MARsHALL, H. G, AN» R. w. AL»EN. 1993. Acomparison of phytoplankton assemblages inthe Chesapeake and Delaware estuaries USA!, with etnphasis on diatoms Hydro-biologia 2691270:251-26L
MCKEE, K, L. ANo I, A, MENnl.t.ssotts. 1989.Response of a freshwater plant community toincreased salinity and increased water level.Aquatic Botany 34:301-316.
Mite, C, S., E. M, SwENsoN, R. F.. TvRNER, AN»J. M. LEE. 1995. Assessment of the '"Cstnethod for estimating seditnent accumulationrates: Louisiana salt marshes. Journal ofCoastal Research 11:296-307,
PARSoNs, M. L, 1996 PaleOindicators of changingwater conditions in Louisiana estuaries. Ph.D.Dissertation, Department of Oceanographyand Coastal Sciences, Louisiana State Univer-sity, Baton Rouge, 316 pp.
PARsOr S, M. L. 1998. Salt marsh Seditncntaryrecord of the landfal I of Hurricane Andrew on
the Louisiana coast: Diatorns and other paleo-indicators. Journal of Coastal Research14:939-950,
PARSONs, M.L., Q. DoRTcH, R. E, TV~R ANr N. N.RAeALAtS, 1999. Salinity history of coastaltnarshes reconstructed from diatom retnains.Estuaries 22: in press!.
PFKNINOTON, W,, R, S. AvlaRAV, ANt3 E. H. FVSIIVR.1973 Observations on lake sediments usingfallout '-»C. s as a tracer. Suture 242;324-32tI.
PRAsA», A. K, S, K., J. A. Nil Now, AN» R. J.LlviN< sToN. 1990. The genus Cvclotella Baciflariophyta> in Choctawhatchee Bay.Florida, with special reference to C. striata andC. choctawhatcheeana sp, nov. Phycologia29;418-436.
RovNIi, 1, E. 1981. The Ecology of thc Algae.Cambridge Un i versity Pre s s, Cambridge,England, 653 pp.
Sr. AMANr, L. 1964. Louisiana leads in oysterproduction. Louisiana Wild!ife and FisheriesCommission, Wildlife Education Bulletin 84,
11 pp.SASe, 1988, SAS'~/STAR" User's Guide, Release
6.03 Edition. SAS institute Inc,, Cary, North
Carolina, 1028 pp.SWENSON, F.. M. AN» C. M. SWARZrtitSvt. 1995. WatCr
levels and salinity in the Barataria-Terrcbonneestuarine system, pp. 129-201. ln D, J. Reed ed.!, Status arid Historical Trends ofHydrologic Modification, Reduction inSediment Availability, and Habitat Loss/Modification in the Barataria and TerrebonncEstuarine System. BTNEP PublicationNumber 20, Barataria-Terrebonne NationalEstuary Program, Thibodaux, Louisiana.
YAN S tcKvE, v. R., B, B. BARRErr, L, J. Gvi.lcK, ANDT. B. Foan. 1976. Barataria Basin: salinitychanges and oyster distribution, Center forWetland Resources, Louisiana State Univer-sity, Baton Rouge, Sea Grant PublicationLSU-T-76-002, 22 pp,
VOs, P. C, ANO H. »E WOI F 1993. ReCO~struCtiOnof sedimentary environments in Holocenecoastal deposits of the southwest Netherlands;the Poortvliet boring. a case study of paleo-environrnental diatom research. Hydro-biologia 270:297-306,
WIL»ERMAN,C. C, 1987. PatternSofdistributionofdiatom assemblages along environmentalgradients in thc Severn River Estuary,Chesapeake Bay. Maryland. Journal of Phy-cology 23:209-217,
wILsoN, S. E�B. F, Cv MMINc. ANn J, P. SvtoL. 1996.Assessing the reliability of salinity inferencemodels from diatom asseinblages: An

78 M, L. Parsons et at
examination of a 219-lake data set from
western North America, Canadian Jour'
of Fis!reries and Aquatic Sciences 53;1580-1594.
WtsEMm, W.J., JR., E. M. SwEnsov, ~ J. PowHt,1990a. Salinity trends in Louisiana estuaries.Esrrusri es 1 3: 265-2'7 l,
WtsEM~, W. J,, Ja., E.M. SwErrsov, ~ F.J. Kit.r.1990b. Control of estuarine salinities bycoastal ocean salinity, pp. 84-193. ]n R, T.Cbeng ed.!, Coastal and Estuarine Studies vol.38, Residual Currents and Long-term Trans-port, Springer-Verlag, inc., New York,

Annual Salinity and Nutrient Budget of LakePontchartrain and Impact of the Proposed BonnetCarre Diversion
MICHAEL G. WALDON
WPI, 20%! Rraft Drti e, Sttite /QXii, BlctcLsbttrg. VA 240rN,TEL: $40-5S7-6080; FAX .S40-.$57-608S:email: tvaldr>tt Cctirnemhc rs,a.sc c ~ .ttrtt
C. FREDERtCI' BRYANLouisiana C ctctperattre Fish & Wildlife Research Unit, /24 F<trestrt; Wildlif».and Fishc ries. Ia!ttistasta State Utti versrtn Batart Rouge. lA 708t>.~.TELt 22S-388--l/Ã0: FAX: 22.S-388-4l44email: cbrycttt Cctilstc.edcc
ABSTRACT: A nutrient mass balance identifies the total mass load of the nutrient entering awaterbody, loss across the downstream boundary, and the rate at which the material is synthesizedor Inst within the waterbody. biutrient budgets for total phosphnrus TP! and total nitrogen Tfctlwere developed, along with budgets for lake salinity and volumetric water llows. The analyses reportedhere were initiated to support the evaluadon of a proposal to divert a small fraction of MississippiRiver discharge through Lake Pontchartraln. These analyses determ/ne the sensitivity of LakePontchartrain to nutrient loading, and provkie a bash' for development of more complex hydrologicand water quality models. Discharge and nutrient loading data have been analyzed using simplifiedfor moins which predict annual average nutrient concentrations within the Lake. For other aquaticecosystems, this simpliiied analytical approach has often proven to be a valuable management toolin support of environmental decision making. Total freshwater inflow, Q, is estimated to he 13.2 km'yr', or' an annual average Inflow of 419 ms s ' �4~ cfs!. The proposed diversion would increasefreshwater inflow by 6.6 kms yr '. Average residence time is projected to drop from 102 d to 76 dfollowing implementation of the diversion. ln Lake Pontchartraln, projected annual a verage TP andT'at concentrations without the proposed river diversion project are 0 060 mg-p I' and 065 mg-ht I '.With the proposed diversion these concentrations are projected to rise to 0.071 mg-P I' and 086 mg-N I t.
Itttrxtduction
There is a need for siinple quantitativeassessment tools for evaluating the impact ofnutrient additions on lakes and estuaries. In the U.S.,the Clean Water Act requires the determination ofthe total maximum daily load TMDL! of nutrientsand other potential pollutants, and the ailocation ofthese loads among point and nonpoint sources withina watershed, To this end, EPA has developedwasteload allocation guidance for TMDL
From the Sytnpostum Recent Rc seorrtc in Coccstat Lcp«ststnct'Watttrcst System t.tcnctietn ctnd Response tn Htcmctn tnft4«<'eROZaS. L,p,, S A. Nyman, C.E. prntfitt. N,V, Rabala», D.>.Reect, anct R.E. Turner tedttorsI. I999 Published by Lott»'anSea Grant College Prograin.
determinations for control of eutrophication in lakesand impoundments Mancini et al. 1983 i. This EVAguidance reviewed and was based on thc extensiveearlier work of Vollenweider l976! and others.Here, as far as possible, wc have followed thivguidance. This study provides a case study for thcapplication of these techniques to an estuary, andillustrates which factors must be included to extendthe procedures of Mancini to coastal waters.
A proposed Mississippi River diversion a hesite of the existing Bonnet Carrc Floodway led icipublic concerns about the potential eutrophicationof Lake Pontchartrain. This river dtversion wasdesigned to reduce salinities in oyster beds near theMississippi State border, beyond the downstrcain
aO M.B, Waldon fL C.F, Bryan
boundary of this study. Although alternativediversion discharge schedules have been consideredduring project re-evaluation, only the monthlydiversions proposed in the general designmemorandum GDM! are analyzed in this paper United States Army Corps of Engineers 1990!.Monthly GDM diversion discharges from Januarythrough December are 0, 0, 306, 850, 473, 413, 91,74,57, 156,QI,and Orn's', TheGDMdischargesare higher than those proposed in other plans whichhave been considered since the publication of theGDM. Thus, the GDM provides a maximumdiversion scenario, and diversions of smaller sizeshould have proportionately smaller impacts.
Ideally, a nutrient budge analysis considerstotal nutrient concentration, incorporating allbiologically available forms of the nutrients,including nutrient which has been sequestered orincorporated into planktonic biomass. Totalphosphorus TP! analysis Atnerican Public HealthAssociation 1992! provides such an estimate, butmay in some instances also include P which isunavailable. Total nitrogen TN! is not directlymeasured. and must be calculated as the suxn ofmeasured components. Total Kjeldahl nitrogen TKN! measures the concentration of organicnitrogen and ammonia nitrogen Metcaif and Eddyinc. I 99I; American Public Health Association1992!, Therefore, TN is estimated as the sum ofTKN, and nitrate plus nitrite N, In rivers andestuaries with short displacernent time, both TP andTN may often be adequately modeled asconservative materials. In lakes and estuaries withlong displacement time, it is unlikely that such aconservative model would be adequate because bothTP and TN loss within the waterbody are significantrelative to hydraulic displacernent,
Site Description
Lake Pontchartrain is located in southeasternLouisiana. Lake Maurepas, a smaller coastal lake,lies upstream of Lake Pontchanrain. These lakesare hydrologically connected by a short waterwaynamed Pass Manchac. At its downstream boundary,Lake Pontchartrain connects to Lake Borgne and
the Mississippi Sound through Chef' Menteur Pass«nd Pass Rigolets. Circulation is driven primarilyby wind, rather than by river discharge or tidalexchange Stone et al. f972; Gael 1980!. The longretentiort time of Lake Pontchartrain compared toother Gulf Coast estuaries Soils and PoweII 1999!and limited tidal exchange Swenson f980! reducethe spatial variation of salinity and nutrients withinLake Pontchartrain. These characteristics make
Lake Pontchartrain well suited for the analyticalmethodologies developed for lake nutrient budgetanalysis. The Lake Pontchartrain watershed �4,490km'! drains a large area of southeastern Louisianaand a smaller area of Mississippi. The poteruialsources of freshwater input, including drainagebaSlns, open water areas, pumped stOrrnwater frOrnthe New Orleans area, and the proposed diversionwere numbered Figure I !. Sub-basin drainage areaswere reported by Sloss �97 I ! and Earl �992!.
Freshwater Inflows
The U.S.G.S. maintains continuous di schargerecords on the major streams in the LakePontchartrain Basin Arcernent et al. I 993!. Monthlymean gaged discharges for the period-of-record wereused as the basis for monthly discharge estimates.The period-of-record for these discharge statisticsended with water year I 992. Stream gaging station sused in this study are located on the Arnite Rivernear Denham Springs, the Tickfaw River at Holden,the Tangipahoa River at Robert, and the Pearl Rivernear Bogalusa. Drainage areas associated with thesegaging sites are respectively 3,315 km', 640 km',l,673 km' and 17,024 km'. Conventional dischargegage sites must be located where a stable andsensitive stage-discharge relationship exists, oftenwell upstream of the mouth. Additionally, smalldrainage sub-basins have no appropriate gaging site.Thus, gaged discharge from the Lake PontchartrainBasin excluding the Pearl River Basin! representsonly 39% of the total Basin «rea Runoff, streamdischarge per unit of watershed drainage area, iscommonly used to extrapolate discharge to ungagedareas, Average monthly runoff calculated for eachgaging station provides a basis for estimatingaverage monthly discharge frotn each LakePontchartrain sub-basin by multiplying the mostappropriate gaged runoff by the sub-basin drainagearea.

R>acr Lock
Figure l. Map uf Lake Pontchartrain system with loading sources indicated by numbers.
Nutrient Cotacentration and Loading
Freshwater inf!ow to Lake Pontchartrain mustinclude not only all tributaries, but also somefraction of the Pearl River flow S ikora and Kjerf ve1985!, The mouth of the Pearl River is located justoutside of Lake Pontchartrain at Pass Rigolets, andtherefore contributes a part of its flow to the Lakeduring each tidal cycle. Assuming a symmetricaltide cycle, this fraction must be less than half, andfor the purposes of this analysis one third of thePearl River flow was assumed to contribute to thefreshwater inflow and nutrient loading of LakePontchartrain.
Discharge from leakage through the existingBonnet Carre spillway structure was estimated tobe 15% of the flow and load of the proposeddiversion. Nutrient loading from the proposedstructure has been adjusted to include the anticipatedload reduction that wil! result from operation of thesedimentation basin Benndorf and Klaus 1987; Putzand Benndorf 1998!. Based on an estimate that 30%of the sediments wi!! be reinoved within thesedimentation basin, it is assumed here that this willresult in a 20% reduction in TP, and a 10% reductionin TN loading from the proposed Mississippi Riverdiversion,
An alternative method was used to estimatepumped urban stormwater inflow. The runoff
Lake Pontchartrain Selinity and Nutnent Budget St
coefficient is the ratio of runoff to rainfal!, and canprovide an estimate of runoà in ungaged watersheds Mancini et al. 1983!, Runoff coefficients typicallyvary between 0.1 and 0,6, with increasing valuesbeing associated with increased impervious groundcover in the drainage basin Bowie et al. 1985!. Totalannual runoff values indicate that considerably lessthan half of the average annua! rainfall of 156 cm Louisiana Office of State Climatology! is dis-charged as runoff from the watershed. East BankJefferson Parish storrnwatcr pumping stationsrecords for 1988 indicate an annual runoffc oefficient of 0.5 Ear! 1992, Vo!umc 2, page 5-22!.Total average monthly discharge from the YevOrleans area pump stations were therefore estimatedas 50% of the average monthly rainfall fa!!ing overthe pumped drainage areas F~! 1992, Volume 2,page A7!. Estimated drainage areas Jefferson Parish131 km'-, Orleans Parish 134 krni! and water qualityof pumped runoff were also obtained from Earl�992, Tables 5-6 and 5-7!.
The Office of Water Resources of theLouisiana Department of Environinental Quality LDEQ! maintains a statewide water qualitymonitoring network, This fixed station, !ong-termsurface water quality monitoring network currentlv

w'/zc
p+K, �!
02 M,B. Waldorr 4 C,F. 8ryan
provides data from 186 rrronitoring sites. Samplingand !aboratory procedures follow extensive qualityassurance plans available from LDEQ, Field mea-suremcnts and samples are collected at one meteror, in shallow streams, at half depth. Laboratorynutrient analysis is performed on whole watersatnples and generally follows Standard Methods American Public Health Association I 992!. Datafrtrm 28 of these sites werc used in this assessment.Most sites have more than IP years of data, andmany have been monitored for morc than 20 years.Most sites are monitored on a monthly basis,however some newer sites are monitored on abimonthly basis. The period-of-record utilized hercends in August l 993.
An environmental organization voiced aconcern during conunents on thc early plans for thcrccvaluation of the Bonnet C~ diversion project.It was suggested that pollutant levels may haveinc~ over past decades, and load calculationsin this, study should be representative of presentconditions. Bahr �983! also concludes that Ploading has increased aver past decades. Therefore,in this study. monthly mean concentrations, usedhere in load calculations, werc calculated fromobservations more recent than January, 1985, Thisshould both provide an adequate number of monthlyobservations, and also educe thc influence of anylong-term trends in concentration which may existbccausc of land use changes or other historicalfactors.
The term ioad or loading rate is the rate atwhich mass of substance is entering a waterbodythrough point sources, rtonpoint sources, or tributaryinflow. Regardless of temporal, spatial, or dynatruccomplex ity, all mode I s of nutrients andeutrophication require the development of nutrientload estimates. Thc load rrLass/time! of a substanceentering a system through water inflow is calculatedfrom conccntrauon of thc substance mass/volume!multiplied by the stream discharge volume/time!.Concentration and volumetric inflow or streamdischarge for each source of water entering thewaterbody are necessary components of a loadestimate. 1t must also bc noted that average valuesfor concentration and discharge must be used withsome care in calculating loads because, in general,
the average of the product of two variables does notequal the product of their averages. Consequently,the ptoduct of average annual discharge and averageannual concentration may provide inaccurateestimates of average annual load, In order to reducethis undesired effect, monthly average loads werehere calculated and summed to develop annualaverage load estimates.
Simplified Model Analysis
Following Mancini ct al. �983! we representLake Pontchartrain as a single well-mixedcompartment, Assuming a first order loss termcorresponding to net sedimentation:
d ciVi! = W~ � Qi+ K.Vi!cidt
where t = time and subscript t denotes timedependent variables;
c = conrentration within thc waterbody;V = volume;W = sum of all mass loads including all
internal waterbody sources;Q = total of all volumetric flows into the
watcrbody;and K = net sedimentation rate.
The long-term average value of the left hand sideof Eq. I should approach zero, This yields a resultanalogous to the steady-state solution of Eq. I:
W W/VC
Q + K.V p+K,
where p = Q/V. thc hydraulic displacernent rate;and all variables in Eq 2 are averaged over a periodwhich is long relative to I/ p +K !.
The hydraulic displacement time, t = I/p, Loadingrate comparisons among waterbodies is facilitatedby normalizing Eq. 2 for water surface area;

QeSa
Qa+ Qr�!
Results
where w' = load divided by surface area;and z = mean waterbody depth.
The occurrence of salinity within Lakepontchartrain dcrnonstratcs that in addition to thefreshwater inf!ows, there is a net sa!twater inflow,Q, entering frotn thc downstream seaward!boundaries. The method applied here to estimateQ is a variation of the "fraction of freshwatermethod" reviewed in Bowie. et al. �985, page 43-44! snd by So 1 is and Po we!! �999!, and utilized bySwenson �980! in estimating Lake Pontchartrainretention time. Average salinity, S, represents sspecia! case of Eqs. 1-3, with K W, and the salinityload W= Q�S, where S is ihc boundary watersalinity. This assumes that the salinity of thefreshwater inflow is negligible, Average total inflow,Q, equals the sum of the average total freshwaterinflow, Q, and Q,. From Eq. 2, average salinity is;
For Lake Pontchartrain, area A! is 1637 km' Sloss 1971!, incan depth z! is 3,4 rn Stone et al.1972!, resulting in volume V! of 5.56 km-'.Including inflows as described earlier, Q=19.653km' yr' under current conditions, and Q=26.252km-' yr ' after the proposed diversion. Thus. t= 0,28yr �02 d! without the proposed diversion, and t=0.21 yr �6 d! after the pmposed diversion.
Boundary salinity and nutrient concentrationscan be estimated from the highest salinity valuesobserved at the Lake Pontchartrain outlet monitoringsites, Chef Menteur Pass and Pass Rigolets, Over aperiod-of-record beginning in 1978, maximumsalinity observed at these sites was 12.9 ppt, andthe 95th percentile salinity was 9.8 ppt. It is assumedthat the characteristics of the boundary watersentering the lake are similar to those which arepresent at the outlet sites under these conditions ofelevated salinity. An estimate of the boundarysalinity and concentrations was perfortned byaveraging observations where salinity met orexceeded 9.8 ppt. Average salinity under this
Lake Pontchartrain Sa!inity and Nutrient Budget 83
constraint was 10.8 ppt, and average nutrientconcentrations were: TP&.082 mg-P ! '. nitrate plusnitrite=0.037 mg-N 1 '. and TKN=0.669 mg-N 1'.Since !985, average salinity was 3.6ppt at the LakePontchartrain monitoring stations.
Average annual seawater inf!ow, Q�, iscstimatcd using Eq. 4 to be 6.44 km' yr ', or 33% oftota! inflow. Annual average total discharge isestimated to be 19.65 knt-' yr ' Table 2!. Tributariesflowing from the watershed provide 36%, and thcPearl River is estimated to provide 20% of totalinflow. The remaining !!% of flow» dividedbetweenurban pumped stormwater discharge. directnet precipitation, and leakage from the MississippiRiver. With these results, the average salinity in LakePontchartrain after diversion can bc estimated byincluding the diversion discharge in a recalculationof Eq. 4. Under the GDM diversion scenario averageLake Pontchartrain salinity is projected to decreasefrom 3.55 to 2.66 ppt.
Annual Loading and Areal Loading
Average annual TP and TN !oads total 3,300and 35,700 metric tons yr, respective!y Tab!e 2!.Loading from the diversion is estimated to add 1.050and 17,030 metric tons yr' of TP and TN. TheTN:TP tnass ratio of total nutrient source loadingsis thus estimated to be 10.8 without the diversion,and 12.1 following the proposed diversion. Acharacteristic inflow concentration may becalcu!ated by dividing total !oad by total discharge.For TP and TN this is 0. 168 and 1.82 mg 1' withoutdiversion, and 0 �6 and 2.01 with diversion, Areal!oading is loading divided by wate*ody surfacearea. Area! loading of TP rises from 2,02 to 2 66 gm ' yr ' after diversion, and TN rises from 21,82 ro32.22 g rn ' yr '.
Annua! average LDEQ TP and TN obser-vations Table 1! in Lake Pontchartrain were 0.060and 0.65 mg 1', respectively. ATP net sedimentationrate, K, of 6.4 yr ' was deterrnincd by mode!calibration using Eq. 2 and substituting va!ues ofvo!urne, discharge, TP load, and average LakePontchartrain TP concentration, Equation - thenprojects TP concentration following diversionimplementation to be 0.07! mg 1'. Simplified

04 HI,B. Waldon 8 C.F. Bryan
Table l. Average parameters at DEQ Inonitoring sites �989-1993! by class L. PON,=LakePoatchartraia, M. RIV.=Mississippi River, OVTLET=Lake passes, TRIB.=tributaries!.
Table 2. Annual discharge and nutrient loading values.

Lake Pontchartra>n Salinity and Nutrient Budget BS
modeling approaches for TN have not been asextensively studied and tested as those for TP.!viancini et a!. �983! suggest that an approachsiinilar to that used here for TP should also beadequate for other nutricnts. Ca!ibration of Eq. 2for TN results in an estimate of K ='2.5 yr ',and aprojected average TN !ake concentration of 0,972mg 1' after diversion. However, this calibrationncg!ects an estimate of load froin N fixation as wellas precipitation load of TN to the lakes surfaces!.Calibration for TN is therefore deemed to beinappropriate here. Mancini et al. �983! notes thatboth TN and TP are removed from thc system bypermanent burial fo!lowing settling of particulateorganic materials, and conjecture that because thisinechanism of loss is the same for TN and TP, it isreasonable to assutue that the K va!ue for TN i»equal to that for TP. Assuming K = 6.4 yr ' for TNas well as TP, a N fixation term may be added to theTN !oad such that Eq 2 is calibrat&, This gives aN fixation load estimate of 14,100 metric tons yr '.This estiinated load is greater than any other sing teload source listed in Table 2, and 65% of' the totalload from all other existing sources combined.
DisctIsaioa
lsphording et al, !989!, and Flowers andlsphording �990! report freshwater discharge toLake Pontchartrain to be 6.8 km' yr ' �600 ft-' s '!and volume of Lake Pontchartrain to be 5.77 km'�.038 10" ft-'!. This compares favorably with theestimates presented here �.18 km-' yr' and 5,49km'!. Argyrou et al �997! estimate a similar totalvolume, 6.58 km-', but estimate annual averagedischarge of rivers into the Lake PontchartrainEstuary to be only 4.48 km' yr ' �2 m's'!.Swenson �980! concluded that gaged dischargemust be scaled by an average factor of 2.4 to providean appropriate freshwater discharge, This comparesclosely with the value of 2.6 used herc. Swensonalso estimated a cotnparable displacernent time inLake Pontchartrain, 105 d, using the "fraction offreshwater method" which reduces the waterbodyvolume to the equivalent freshwater volurnc. Thedisplacernent time of Lake Pontchartrain isestimated here to be 102 d. Sikora and Kjerfve�985! also recognized the need to scale gageddischarges to estimate total tributary discharge. They
applied scaling factors ranging from !.06 to 2.4 totheir tributary inflows. So!is and Powell �999lpresent displacement titnes of Gulf Coast Estuariesin graphical format., with Lake Pontcharirainresidence time near 140 d, Argyrou et a!. �997!estimate hydraulic residence time to be 537 d. Thisanomalous!y high estimate results primari!y fnm>an underestimate of freshwater inflow and also fromfailure to consider saltwater inflow or volume.
Bianchi and Argyrou �997! estimate water-shed nutrient loading of phosphate, aminonium, andnitrate plus nitrite, Bccausc those nutrients arecomponents of the TP and TN loads, wc anticipatethat their associated !oads should be less than thetotal nutrient loads estimated here. Although the totaltributary inflow estimate of 142 m's' used byBianchi and Argyrou is somewhat lower than thevalue used here, their published load estimates areanoma!ous!y high and appear to bc in error. Loadscan be calculated from nutrient concentrationspresented by Bianchi and Argyrou, and these !oadsare consistent with loads calculated here,
Areal nutrient loading rate loading per unitof !ake surface! in Lake Pontchartrain is estimatedto be 2.02 and 21.82 g m' yr ' for TP and TN. Thesevalues generally fall within the range of valueswhich have been reported for lakes, Reckhow 1979;Mane ini et al. 1983!. Bahr �983! projected a P loadof 2 g m' yr' near the year 2000.
Ryding and Rast !989! state that it is rare thatavailable nutrient sampling data will producenutrient load estitnates within M5%. In the case ofLake Pontchartrain, uncertainty invo! ving the Pear!River, N fixation, and the sa!twater loadcontributions add uncertainty to thc load estimates.However, for the purposes of this trophiccomparison and comparison of projections with andwithout the implementation of the proposeddiversion, these load estimates shou!d be adequate.
Calculations presented here illustrate theimportance of incorporating the seaward boundarycontributions in estuarine budgets, Even in the caseof Lake Pontchartrain, with a relatively limitedseaward exchange, the magnitude of net sahwaterinflow and total nutrient loading was near!y as large
40 M,B. Waldon k C.F. Bryan
as freshwater runoff and nutrient !oading Tab!e 2!.Failure to incorporate this flow and load source canresult in over estimation of estuarine displacementtime and sensitivity to loading for nutrients and othersubstances.
The Lake Pontchartrain seas ard boundary iscotnplicated by the location of the Pearl River atone seaward boundary channe!. For the purposes ofthe comparison of diversion project ahematives, itis not critical to exactly identify the fraction of thePearl discharge and load that should be incorporatedwith other tributary inf!ow. However, this is onesource of urtcertainty, and determination of theamount of the Pearl River flow and load enteringLake Pontchartrain is worthy of further study. Boththc Pear! River contribution and the morc generalseaward boundary exchange should be quantifiedin future hydrodynamic computer mode!ing studies,
In this model ~ over 39% of present N loadingresults from fixation or other unaccounted inputssuch as dry deposition or precipitation!, There isgreat uncertainty in this estimate because thisloading was estimated through an indirectcalculation. and is based on Mancini's conjecturethat the same K value is adequate to mode! netsedimentation loss af TP. TN, and other total nutrientconcentration~, such as total organic carbon TOC!.Future research in the Lake Pontchartrain Estuary,as well as other lakes and estuaries. should bedirected toward obtaining a better estimate of Kfor total nutrient concentrations, and testingMancini's conjecture. For nutrients with al!och-thonous sources and sinks, this will necessitate moredirect estimation.
Although the stormwater discharge and loadestimates are uncertain, they are small relative tothe total estuary discharge and load �.5% ofdischarge, 9% TP load, and 0.8% of TN !oad!. Thissuggests that the urban siormwater pumps have littleimpact on estuary trophic state. This conclusion islike!y true, but it does not follow that these nutrientsources are environmenta!!y benign and need notbe considered in a Lake Pontchartrain pollutantmanagement plan. The pumped storrnwater loadlikely plays an important ro!e in the reduction ofnear-shore water quality, and the pulsed nature of
the input Inay promote local algal bloomsuncharacteristic of lake-wide events. Both of these
pOtential conSequenCes illustrate ! IInitationS Of theaverage annual nutrient load and steady-statemodeling approach presented here. More study isneeded to determine the impact of these urbansources and other sources near their points ofdischarge. This should include application ofdynamic mode! ing with spatial resolution adequateto identify loca! impacts.
The annua! steady-state nutrient modelingapproach presented here has clear value in supportof environmenta! rnanagernent planning. Thisincludes plans for evaluation of overall nutrientcontrol from point and nonpoint sources and TMDLdeterminations, and comparison of some impactsof alternative designs. The approach also providesa background for comparison in studies utilizingmore temporally or spatially complex modeling. Themodeling approach requires !irnited effort andcomputer resources re!ative to more complexmethodo!ogies, and provides simple straight-forward predictions which support comparison ofa!ternatives It is essential, however, that theprojections of this simp!e approach not be appliedinappropriately. For example, thi» approach can notpredict impacts resulting from changes in seasonalnutrient patterns, or local impacts of discharges.Applied with care, the approach is a valuable toolfor environmental analysis, management, anddecision support.
ACKNOWLEDGMENTS
The New Orleans District of the U.S. ArmyCorps of Engineers, the Louisiana District of theU S. Geological Survey, the Louisiana Departmentof Environmental Quality, and the Louisiana StateOffice of Climatology provided data used in thisresearch, Their assistance is gratefully ack-nowledged. This research was funded in part by theNew Orleans District of the U.S. Army Corps ofEngineers.
LITERATURE CITED
AMERlcAN PURL!C HEALTH ASSOCIATlors, 1992.Standard Methods for the Examination of

Lake Pontchartrain Salinity and Nutnenf Budget 87
Water and Wastewater, American PublicHealth Association, in cooperation with theAmerican Water Works Association, and thcWater Fnvirontnent Fcdcration, Washington,D.C.
ARci;MI:ter, G. J., L. J. Dhhirih. c. R GARRisoh, ANnW, M. Lr >vrxhcF., 1993. Water Resources DataLou i si an a Water Year 1992. I; n i ted StatesGeological Survey Water-Data Report LA- 92-!, preparCd in cooperatiOn with the LOuiSianaDepartment of Transportation and Develop-rnent and with other State and Federa!Agencies, Baton Rouge, Louisiana.
ARci YROU, M. E., T. S. BIARDIII. Asi! C. D. LAMaRRT.1997, Transport and fate of dissolved organiccarbon in the Lake Piin tahar train estuary,Louisiana, U.S,A. B«rrir or hemistry 38;207-226.
BARR, L 1983, Ecological Characterization of theMississippi Deltaic Plain Region: A Narrativewith Management Rccotntnendations. FWS/OWS-82169, prepared I' or National CoastalEcosystetn Team, Div. of Biological Sciences,Fish and WI!dlife Service, and MineralsManagement Service, Washington, DC.
Baiv'vI>ORF, J., AIID P. KLAL'S. !987, COntrOl OfEutrophication of Lakes and Reservoirs ByMeans of Pre-Dams - I. Mode of Operationand Calculation of the Nutrient FlitninationCapacity. Water Researr h 21:829-842,
BIAhcHI, T. S., hhn M. E. ARD YRou. 1997. Temporaland Spatia! Dynamics of Particulate OrganicCarbon in the Lake Pontchartrain Estuary,Southeast Louisiana, U.S.A. Estuarine,Coastal and Shelf Science 45:557-569.
BOwu, G. L., W. B. MILtS, C. B. PORC~A, C. L,CAMPBELL, J. R. PhoahKDPF, G. L. RI.JPP, K. M,JOIINSOZ, P. W. H. CIIhh, ANn S. A. GHERih'I.1985. Rates, Constants, and KineticFormulations in Water Qua!ity Modeling Second Edition!. EPA/600/3-85/040, U.S.Environmental Protection Agency, Environ-mental Research Lab, Athens, Georgia.
EARL, C. 1992. Jefferson and Or!can~ Parishes,Louisiana Urban Flood Control and WaterQuality Management. U.S. Army Corps ofEngineers, New Orleans District, NewOrleans, Louisiana
FLow Bus, G, C., ANI! W. C. I.iPIIDRDI Mi, 1'990.Environmental Sedimentology ot thcPontchartrairi Estuary. Trartsar"tirrns Ciul f-Coast Assai'iatir>rt of Geolrrgir'al Srir.tetir'i40: 237-250.
Ghi L. B, T, 1980, Computation of Drift Patterns inLake Pontchartrain. Louisiana, 39-56. in J. H.
Stone. ed.l, Environmental Ana!ysis of LakePontchartrain, Louisiana: Its SurroundingWetlands, and Sc!ected Land Uses. Center forWetland Resources. Louisiana State Univer-
sity, Ptepared for U,S. Army Engineer NewOrleans District, Baton Rouge.
]sPHDRInho, W. C., F. D, IMshho, hao G. C. FLowI=Rs.1989. Physical Charactenstics and Aging ofGulf Coast Estuaries. Transactions Gulf-CrurstAssociation of Geological Societies 39:387-401.
Mhhahit, J. L., G. c. Kht'IMAh, P. A. MANGARRLLA,AtrD E. D, DRiscoU . 1983. Technical GuidanceManual for Performing Waste Load Al!o-cations, Book IV Lakes and Impoundment~,Chapter 2 Eutrophication Fina! Report!.Contract No, 68-01-5918, U.S. EnvironmentalProtection Agency, Ofttce of Water Regula-tions and Standards, Monitoring and DataSupport Division.
MFrcht.F hwo EDDY !hie. 1991. WaStewaterEngineering: Treatment, Disposal, and Reuse,McGraw Hi]l, New York.
PVrz, K., Ahn J. Bi=.vhiuoRF. 1998. The imponanCeof pre-reservoirs for the control ofeutrophication of reservoirs. Water Scienceand Technology 37:317-324.
RzcKHow, K. H. 1979, Quantitative Techniques forthe Assessment of Lake Quality, EPA-440/5-79-015, U.S, Environtnenta! ProtectionAgency, Office of Water Planning andStandards, Washington, DC.
Rvnthro, S, O., A<D w. Rhsr. 1989. The Control ofEutrophication of Lakes and Reservoirs,Parihenon Publishing, Paris.
SIvoRA, W. B.. AhD B. K!rRFvr, 1985. Factor~Influcncing the Salinity Regime of LakePontchartrain, Louisiana, a Shallow CoastalLagoon: Analysis of a Long-Term Data Sct.Estuaries 8:170-180.

SLoss. R. 1971, Drainage Areas of LouisianaStreams, Basic Records Report No. 6 Repr nted 199]!, United States GeologicalSurvey, published by the Louisiana Dept «Transportation and De vel opme nt, BatonRouge, Louisiana.
SoL<s, R., hNn G, Powat.c. 1999, Hydrography,Mixing Characteristics, and Residence Timesof Golf of Mexico Estuaries, pp. 29-61. I>tThomas S, Bianchi. J. R. Pennock, and R, R.Twillcy, eds.!, Biogeochetnistry of Gulf ofMexico Estuaries, John Wiley & Sons, Inc.,New York.
Ssu>o:. J. II., W, A. Su aah, ceo P, J. MtNvtaLLt. I 972.Surface Circulation of Lake Pontchartrain: AWind-Dominated System. NS-255, Gulf SouthResearch Institute. prepared for thc LouisianaState Science Foundation, New Iberia,
Louis>afla.
Swt:.~a~ w. E. M. 19N!. General hydrography of LakePontchartrain, Louisiana, p. 57-215. in J. H.Stone, ed.!, Environmental Analysis of LakePontchartrain, Louisiana: Its SurroundingWetlands, and Selected Land Uses. Center for
Wetland Resources, Louisiana State Univer-sity. Prepared for U,S. Army Corps ofEngineers, New Orleans District, BatonRc ugc.
Uxm-'o Sihri.s AttMv Cotta ot: Exon>asas, 1990.Bonnet Carre Vreshwater Diversion StructureDcs>gn Memorandum No. 1. New OrleansDistrict, New Orleans,
Vo<.<a;~w~ n»jt, R. A. 1976. Advances in DefiningCrit>cal Loading Levels for Phosphorus inI~kc Eutrophication. Me>»uric dell'isrir»ro>tuli n>a»li id>r>I>ierlngia 33:53-83,


9 t J.W. Day et al.
STVDV AaEA
Fig. l. Me of ~e Pontch~n sho wing th l~~ions of the Bonnet C~ Spillway and the s~phng st t ons.
sediments at the Caernarvon freshwater diversionsite. Research has shown that diverting nutrient-rich water through wetlands can lead to substantialnutrient removal arid to enhanced accretion Richardson k Nirho]s l9S5; Breaux and Day1994!. We therefore undertook an analysis of waterchemistry dynamics during the 1997 opening of thespill way.
w The Bonnet C~
Spillway was designed to carry flood waters fromthe Mississippi to Lake Pontchartrain when NewOrleans is threatened by high water levels, It wasconstructed in l93 l after the devastating flood of1927 Barry 1997! and has been opened eight timesduring high flow events Sikora and Kjetfve 1985!,The Bonnet C~ Spillway is located 25 km upriverfrom New Orleans, Louisiana Fig. l !. The 3,4 kmwide spillway is confined by two 8.6 krn levees andconnects the Mississippi River to LakePontchartrain. There are l 300 ha of forested
wetlands in the spillway, or approximately 50% of
the total spillway area. A water flow regulationstructure, which has 350 flood gates each consistingof twenty 20x30 cm wooden beams!, is located atthe juncture to the Mississippi River. The structureis opened and closed by reinoving or replacing thebeatns one at a time. Thus, it can take several daysto open or close the structure. The spillway islocated where onc of the many crevasses breachedthc Mississippi River levee in thc 1800s andintroduced up to 4,000 m-'s ' of water into LakePontchartrain Davis 1993!. The present spillwaywas designed to divert up to 7,000 m's ' from theriver during floods,
large l 630 km'! oligohaline take located north ofNew Orleans, Louisiana, with a mean depth of about3.7 m and a volume of l.66 x ] 0' m' Fig. l !, Tidesin the lake are diurnal with a mean range of 12 c m.Lake Pontchartrain is well mixed and is generallynot stratified. In the natural state, the lake was
surrounded by extensive wetlands, but large areashave been reclaimed or impounded on the southshore due to growth in the New Orleans rnetro-

45000
40000T'r-: 35000C!v 30000
The 1997 Opening
d 25000
Z 20000r>4 15000
rdl errr r t r ~ r
Cr d; rrl A rrIfl r CJI
a d.ga2k
rV N rd rdN rv rv cvrJ rr d
OAlrrr d
ZO«1r
.. 12
~10
8METHODS
rdl Crr dr Ql err0 vJ W id «0cu 4 rv 92I rva d a d
Z Z
r r fQr dr rrl Cfla � ri
Q Q. ~ 4 C C
politan area. Thc lake receives freshwater inputfrom several rivers as well as periodic openings ofthe Bonnet Carrc Spillway. Without the spil!way,mean freshwatci input to the lake is about 370m's ', resulting in a replacement time volume ofthe lake divided by freshwater input! of about 51days. Three large inlets connect the lake to the largerestuarine system. Two natural inlets, The Rigolctsand Chef Menteur Pass, communicate with LakeBorgne and Mississippi Sound; while a dredgedcanal, the Inner Harbor Navigation Canal IMNC!is connected to Breton Sound. The rivers supply5% of the tidal prism in the lake, whereas theremainder enters through the tidal passes Swenson1981!,
During the Spillway opening, MississippiRiver discharge was 39,400 rn's ' �.39x l y' cfs! onMarch 17, 48,600 rn's' �,72x1 0" cfs! on March25-26, and about 30,500 tn's ' �.08x I0" cfs! onApril 20, The Bonnet Carry Spillway was openedon March 17 as a precaution against flooding. Waterflow through the spillway gradually increased to amaximum of about 6800 m's' �.40x10s cfs! onMarch 25-26, or about 16.4% of the total flow ofthe Mississippi River at the time Fig. 2!. As riverstage decreased, lessening the threat of flooding,the structure was gradually closed and flow throughthe spillway declined. The structure was fully closedon April 17. Approximately 1.0 x 10" of river waterwas discharged from the Mississippi into LakePontchartrain, and the replacerncnt time of the lakewas reduced to five or six days.
Individual water samples were collected atapproximately weekly intervals from March 17 toScptetnber 22 at seven stations; the MississippiRiver, 5 stations in Lake Pontchartrain, and onestation in Lake Borgne near the outlet of ChefMenteur Pass. Water samples were collected 10-20crn from the surface in acid washed glass or plasticcontainers with teflon coated lids. The watersamples were cooled to 4'C for preservation andtransported to the Corps of Engineers laboratory inNew Orleans where both filtered and unfilteredsamples were frozen until analysis. The samples
Bonnet Carrt5 '97 Freshwater Dwersion 91
were analyzed for nitrite+nitrate NO,+NO,!,ammonium NH,-N!, total Kjeldahl nitrogen TKN!.Tota! Phosphorus TP, Wcrshaw et al. 1987!, tota!suspended solids TSS, Banse et al. 1963!. andSalinity Greenburg ct al. 1985!. At least ! 0 to 15'4of all analyzed samples were duplicates or spikesto verify analytical performance. Tot« nitrogen TN!was calculated by adding NO.+NO, and TKNvalues. Organic nitrogen ON! was calculated bysubtracting NH, from TKN. For each station, themeasured parameters werc plotted with respect totime.
Fig. 2. Top. Total flow of the Mississippi River duringthe Spillway Opening shOwing the amount ot' v aierwhich was diverted through the spillway BC, grayarea!. Bonom. Percent of total flow of the MississippiRiver diverted through the spillway.
J !N Pay et ai.
Spatial and Temporal TrendsStatistics
RESULTS
Concentrations of the different parameters inMississippi River water varied during the diversion;TKN ranged fram 0.34-0.93 {ing 1 '!, TP 0.17-0.33 mg 1'!. NH, 0.08-1.26 rng 1'!, NO,+VQ, 1.08-! .26 mg 1 '!. and TSS 34-110 ing 1'!, These valuesare somewhat low for average Mississippi Riverwater, bui perhaps the high water voluine led todilution of these constituents.
At station 4 in the mid lake Fig. 5!, YO,+NO,and TP concentration reached the levels in the riverbut a week or two later than at station 2. Saliriitydeclined more slowly and never reached completelyfresh coitditions. As with stations 2 and 3, nutrientconcentrations returned to preopening levels by rnidJune while salinity did not return to prcopening
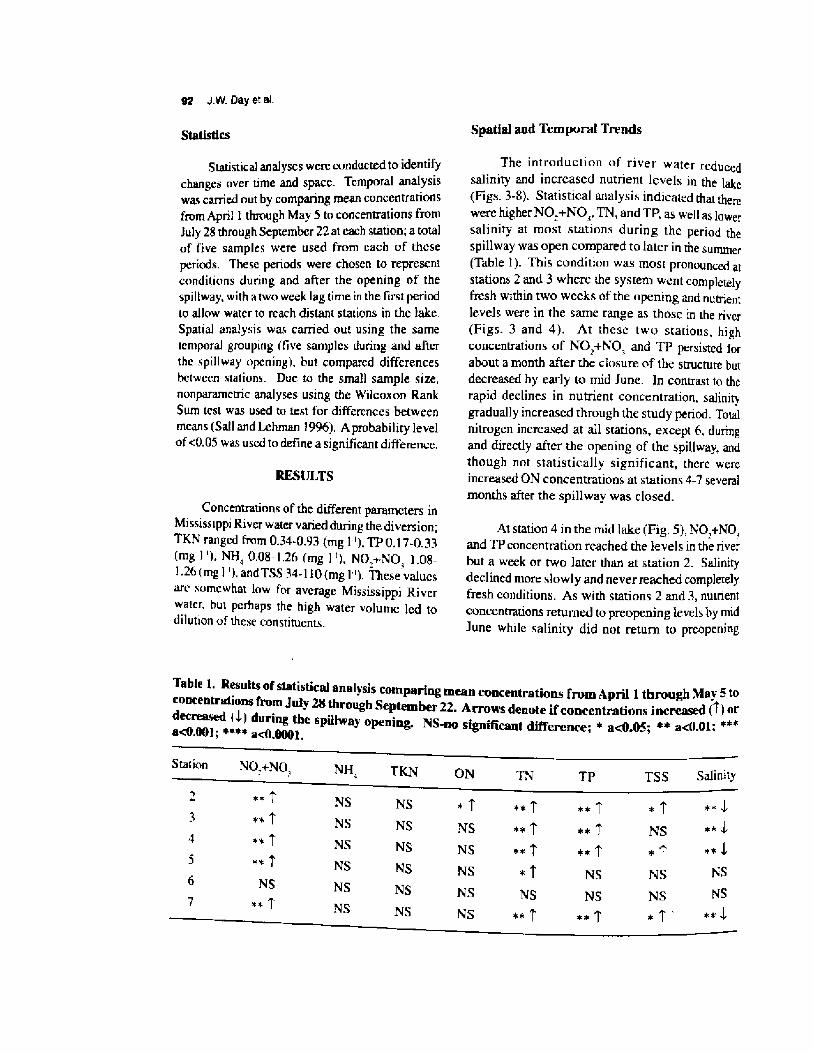
Table 1. Results of statistical analysis comparing mean concentratiotts from April 1 through May 5 toconcentrations from July 2$ through September 22. Arrows denote if concentrations increased T 1 «decreased l! during the spillway opening. NS-uo significant ~~nce; * asap.05; ++ a<0.01;a<0.001; ~~~~ acO.I}00L
Station NQ +NOTSS SaliiutyNH, TKN ON TN TP
NS
,g J,
NS NS
NS
NS
NS
+ T >+T ~+TVS
NS
NS
NS NS
Ns a~T +AT
NS
NS
NS
NS
NS
NS
NS
NS
NS NS
Statistic�«1 analyses were conducted to identifychanges over time and space. Temporal analysiswas carried out by comparing mean concentrationsfrom April 1 though May 5 to concentrations fromJuly 28 through September 22 at each station; a totalof five sainples were used from each of theseperiods. These periods were chosen to representconditions during and after the operdng of thespillway, with a two week lag time in the first periodto allow water to teach distant stations in thc lake.
Spatial analysis was carried out using the sametemporal grouping five samliles during and afterthe .spillway opening!, but compared differencesbetween stations. Due to the small sample size,nonpararnctric analyses using the Wiicoxon RankSum test was used to test for differences betweenmeans Sall and Lehman 1996!. A probability levelof <0.05 was used to define a significant difference.
The introduction of river water reducedsalinity and increased nutrient levels in the lake Figs. 3-8!. Statistical analysis indicated that therewerc higher NO.+NO,, TN, and Tp, as weH as lowersalinity at most stations during the period thespillway was open compared to later in the summer Table 1!. This condition was most pronounced atstations 2 and 3 where the system went completelyfresh within two wccks of the opening and nutrientlevels were in the same range as those in the river Figs. 3 and 4!. At these two stations, highconcentrations of NO,+NO, and TP persisted forabout a month after the closure of the structure butdecreased hy early to mid June. In contrast to therapid declines in nutrient concentratioit, salinitygradually increased through the study period. Totalnitrogen increased at all stations, except 6, duringand directly after the opening of the spillway, andthough not statistically significant, there wereinrreased ON concentrations at station~ 4-7 severalmonths after the spillway was closed.

200 200
0
l al i
50
0
l00
50
0March A pa 0 March
lo 10
eC
0 March' Aprr prri Mau !ahr !a
05
0.4E 03
il. 2 ! i
0.4E 03
0.20!
0rr!arch 0 March' App ac plpn! raay !uhc
apu.*4h 5
1.5E
I0.5
lsE
l0.5
0 March Aprri! M arch April May !uur
Nuu+Wr!VM lm!r/I, 0- OrrArrru!u <mtr'I',
4 ..- Mua s !rag/li Tura! M rat/I!
Fig. 3. Water quality data at Station 2 during and afterthe Bonnet Carre Spil!way opening.
levels until September. Station 5, near the northshore, was similar to station 4, but nutrientconcentrations were lower and salinity was notsignificantly changed due to the diversion Figs. 5-6, Table 1!. 1VO,+NO, levels were significantlyhigher during the spillway opening, but neverreached the concentrations found in the river whileTP did so only for a short period in late April andeai!y May. Sa!inity was near fresh for an extendedperiod from May to early July and had not returnedto preopening levels by late Septetnber, This is likelydue to discharge from north shore rivers.
There was less influence of river water atstation 6 in the northeastern portion of the lake Fig.7! than at station 7 in Lake Borgne Fig. 8!. Station6 appeared less affected by the spillway openingand there was no sigmficant temporal differencesbetween nutrient, TSS or salinity concentrations.
Bonnet Carre '97 Freshwater Diversion 93
rApn. Ma! !uhr !uir Aura r
h!0, hoa h Imp;Ir � cy - r!rr~ic s man
--- -r! !u!tu! V crrrp/! i 1raa! S rmp,1
Fig. 4. Water qua!ity data at Station 3 during and afterthe Bonnet Carry Spil!way opening.
NO,+NO, and TP concentrations ai station 6 weregenerally !ess than half of that in the river, whi!econcentrations at station 7 were close to river v'aterfor much of April and early May. NO.+NO, andTP concentrations returned to preopening !cvels bymid June at both stations. Salinity was near frehh atstation 7 for about two weeks in mid April whilesalinity was higher at station 6 during the haincperiod. Thc salinity and nutrient data suggest thatriver water moved preferentia!ly along thc southshore of the lake and most of the time flowed out ofthe lake through Chef Menteur Pass.
ReSu!ts of the spatial statist~ca! anal! hi»indiCate SignifiCant differenCeS between statiOnh fOrNO,+NO�OV, TN and salinity during the spillwayopening, but during late summer there werc nosignificant differences between station~, except lorsalinity fTahles 2 and 3!. During the spillwa!

Si J.W. Day et el.
DISCUSSION
Lake Circulation
2 H!
I 5 l
I H!
sn
150
1 no
5D
ul> Augu! Sc!u ul! Auyu�
ln 8
6 2I>
EV;
y Junc July Auu
!.5 ! 4E !I,I
n ~
o40.3
u.0.2
' iuu
25
EI
! 5
21.5
0.5
uy Junc JUI! Autm
opening, stations 5 and 6 had lower YO,+NO, andTN concentrations than all of the other stations Tables 2a and 2c!. Organic nitrogen was higher atstation 2 than stations 4, 5, and 6, station 3 had higherON than station 5, and station 7 had higher ON thanstation 5 Table 2b!. There were no significantdifferences in salinity between stations, exceptstation 6 had higher salinity than station 2 fTable2dl. ln thc late sutnmcr period, there were highersalinities at station 7 than any other station Table3 l.
The circulation in the lake is affected byfreshwater input, winds, Coriolis force, and the
o s mg/[, mg/!! ! 4!�-v mun yuu! u! mt I>
Fi . S. Wg - a'r quality de al SM pn 4 donng and ~erthe Bonnet Carte Spigwa5 opening,
several tidal inlets. Mean riverine input to the I akePontchartrain system is about 370 m's ' I3ianch;and Argyrou l 997! while the maximum transport atthe tidal inlets is about 6400 m's' Swenson an IChuang 1983!, Peak spillway discharge was about6800 m's ', thus making it equivalent to max mumtidal transport in the inlets, Thus, while the spillwaywas open, freshwater input to the lakedominated by Mississippi River water approximately 95%!. During the opening,freshwater flowed preferentially along the southshore of the lake and out Chef Menteur Pass a.ssuggested by the higher salini ies at stations 5 and6. Transport through the three tidal inlets is nptbalanced. The Rigolets is thc largest inlet and carriesabout 60% of the discharge of the three inletscompared to 30% for Chef Menteur Pass and I 0%for IHNC. Thc Rigolets is Good dominated with
NOJ y O!-8' my/I � 4!. � Ocgmuc S my I>
NH444 my>I! 2' >m! '5 fmm'
Fig ty- Water quality data at Station 5 during and afterthe Bonnet Ca re Spillway opening.
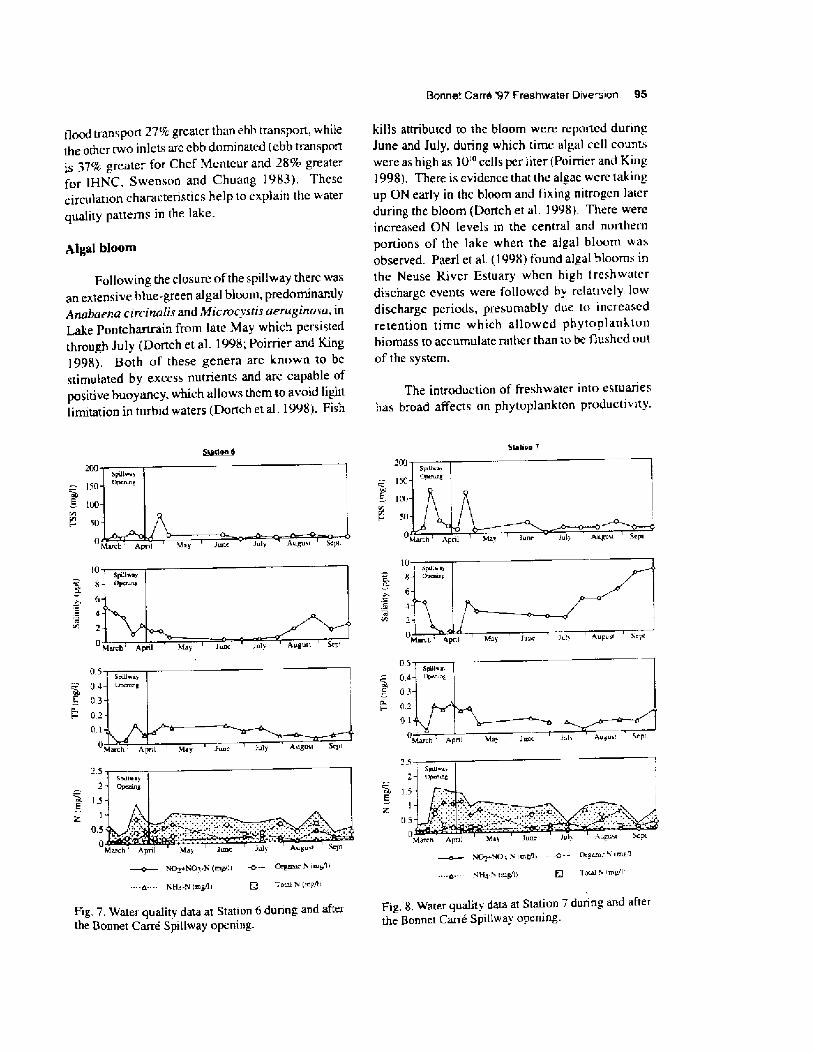
Algal bloom
200
150
I IJP
5ii
150
100
so
0 Marr.h Apnprr! hi ay
10 6m 4U;
C6
mV.'
0 March Apni Ma!0March ' Apnl May0.50.40504
050 n
0 M ' *p
25
2]5E
I0.5
EI
ti 5
0 vtarch ApnI 'May0 Mam pni May Junc
Q rural 4 img/IIH4 4!mg'I>g Tmci 4 .ng/I;SHcgg img/Il
flood transport 27% greater than ehb transport, whilethe other two inlets are ebb dominated ebb transportis 37% greater f' or Chef Menteur and 28% greaterfor lHNC, Swenson and Chuang 1983!. Thesecirculation characteristics help to explain the waterquality patterns in the lake.
Following the closure of the spillway there wasan extensive blue-green algal bloom, predominantlyAnabaena CircinaliS and MicrOCVsnaaeriggincgsa, inLake Pontchartrain from late May which persistedthrough July Dortch et al. 1998; Poirrier and King1998!. Both of these genera are known to bestimulated by excess nutrients and are capable ofpositive buoyancy, which allows them to avoid lightlimitation in turbid waters Dortch et al, 1998!. Fish
NOJ+I40vli tmg/! i -cy � Orgmuc 6 img4i
»g 7. Water quality data at Station 6 during and afterthe Bonnet Carre Spillway opening-
Bonnet Carry '97 Freshwater Diversion 95
kills attributed to the bloom were reported duringJune and July, during which time algal cell countswere as high as 10'" cells per liter 1Poimcr and King1998!. There is evidence that the algae were takingup ON early in the bloom and fixing nitrogen laterduring the bloom Dortch et al. 1998!. There wereincreased ON levels in the central and northernportions of the lake when the algal bloom wa»observed. Paerl et al. �998! found algal bkgoms inthe Neuse River Estuary when high treshwaterdischarge events were followed by relatively lowdischarge periods, presumably due to increasedretention time which allowed phytoplanktonbiomass to accumulate rather than to be flushed out
of the system,
The introduction of freshwater into estuarieshas broad affects on phytoplankton productivity.
~+40'l 4 I mg/I I - 4! � 0'.aanm I I mg
Fig. 8, Water quality data at Station 7 during and afterthe Bonnet Carre Spillway opening.
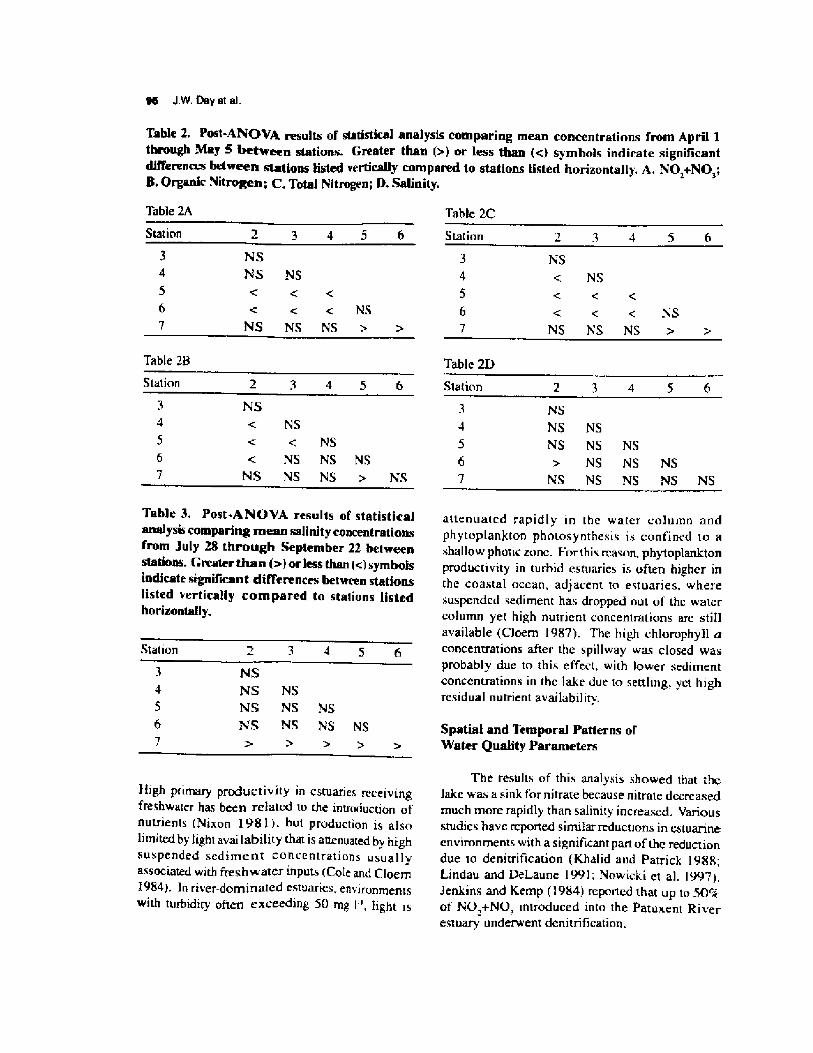
85 J.W, Oay et al.
Table 2. Post-ABC>VA resu}ts of statistical analysis comparing mean concentrations from April lthrough May 5 between stations. Greater than >! or less than <! symbols indicate signT}icantdifferences between stat}ons listed vertically compared to stat}ons listed horizontally. A. NO,+NO,;L Organic Nitrogen; C. Total Nitrogeni f}. Salinity.
Table 2CTable 2A
Station 2 3 4 5 6Station2 3 4 5 6
NS
NS
NS
NS
C
NS
NS
NS
NS NSNS
NSNS NS
Table 28
Station
Table 2D
2 3 4 5 6Station2 3 4 5 6
NS NS
NS NS
NS NS
NS
NS NS
NS
NS
NS NS
NS NS
NS
NS NS
NS NS NS
NS
NSNS
Station 3 4 5
NS
NS
NS
NS
NS
NS NS
NS NS NS Spatia} and Temporal Patterns ofWater Qua}ity Parameters
Table 3. Post-A NOVA results of statisticalanalysis comparing mean salinity concentrationsfrom July 28 through September 22 betweenstat}ons. Creater than >! or less than <! symbolsindicate significant e}}}Yerences between stationslisted vertically compared to stations listedhorizonta}ly.
High primary productivity in estuaries receivingfreshwater has been related to the introduction ofnutrients Nixon 1981!. but production is alsolimited by light avai labi}ity that is attenuated by highsuspended sedirnertt conccnttations usuallyassociated with freshwater inputs Cole and Cloern1984!. ln river-dominated estuaries. environmentswith turbidity often exceeding 50 rng I ', fight is
attenuated rapidly in the water column andphytoplankton photosynthesis is confined to ashallow photic zone. For this reason, phytoplanktonproductivity in turbid estuaries is often higher inthe coastal ocean, adjacent to estuaries, wheresuspended sediment has dropped out of the watercolumn yet high nutrient concentrations arc stillavailable Cloern 1987!. The high chlorophyll aconcentrations after the spillway was closed wasprobably due to this effect. with lower sedimentconcentrations in the lake due to settling, yet highresidual nutrient availability.
The results of this analysis showed that thelake was a sink for nitrate because nitrate decreasedtnuch more rapidly than salinity increased. Variousstudies have reported similar reductjons in estuarineenvironments with a significant part of the reduction.due to denitrification Khalid and Patrick 19}}8;Lindau and DeLaune 1991; Nowicki et al. 1997!,3enkins and Kemp �984! reported that up to 50%of NO.+NO, introduced into the Patuxent Riverestuary underwent de nitrification.

Bonnet Carr4 '97 Freshwater Diversion 97
Another traniformatio» of NO +NO ii
aisimi!ation into particu!atc organic rnatter b>phytop lank ton. Both denitrification andphytoplankton uptake werc likely significantproces ie» in thc lake. Vascular p!ant uptake can alsorcmove NO,+NO, but thii wai probably not aiignifi cant procc.is because thc vegetation:openv, ater ratio of thi.i system ii low. NO, reduction toNH, has a!io been found to occur Smith ct al. 1982!,with as much as 50"i'r of NO, applied to marinescdimenti being reduced to NH, Sorenson 1978!.
Ammonium le vcl» increased in Lake
Pontchartrain. Lane ct al, �999! reported similarresults for the Cacrnarvon freshwater diversion sitelocated further south on the Mississippi. This wasmost likely caused by the regeneration ot NH, bythe decomposition of organic rnatter Kemp andBoynton 1984!, as well as reduction of NO,+NO,to NH, Sorenson 1978!, Numerous studies haveshown thc nct mobilization of NH, by benthicseditnents Koike and Hattori 1978; Ca!lender andHammond ! 982; Tcague et al. ! 988!. The relativelyshallow water depths, rapid icttling rates and rapidbacteria! utilization result in fairly short residencetimes for organic material in estuarine waieri Moran and Hodson 1989!. Therefore, much of theregeneration of nutricnts prohably takes place onor in the sediments, which is where NH,regeneration is highest Blackburn 1979!.
Total nitrogen concentrations decreased in thclake after the spillway was closed, suggesting thatLake Pontchartrain acted a» a sink for inorganicnitrogen, TN is a combination of all the forms ofnitrogen discussed above, and its behavior isgoverned by processes controlling those con-stituents. Di!ution, however, could have beenresponsible for some TN reduction. Denitrificationplays a major role in the loss of nitrate from estuarinewaters, but another permanent loss of nitrogen iithrough burial of organic material such as detritusand senescent phytoplankton cells. ON concentra-tions increased in the lake several weeks after theclosure of the spillway, largely as a result of thealga! bloom, a portion of which undoubted!y settledto the bottom of the lake.
The results indicate that most stations in LakePontchartrain had increased levels of TP during and
rlircctly after ihc diversion. hut !eve!s decreasedduring the iummcr months, The high!y chargedphoiphatc anion PO ii rt.adi!v iorbcd onto th<surfacci of «barged clay land detrital organic.!particles at high concentrations, whi!e at lowerconccntrationi PO, is relcascd into the water, thusinaintaining inoderate «rnbient concentrationi Jitti!959!. Cyclic aerobic and anaerobic conditions inthe sediinenti also effect the sorption and release ofphoiphate Patrick and Khalid !974!. Sharp et al.�982! found these sorption-desorption procciseiprovide a buffering mechanism for phosphorus inthc Dc!aware cituary, and gladden ei al. �9881ihowed thai TP behaved similarly in Four!eagucBay, Louisiana, with little change in concentrationthroughout thc year, The sainc pmcessei, as v clia» algal uptake, most likely affects TP concentrationiin the lake.
Suipendcd sediments were rapidly trapped inthe estuary, This wai like!y due to decreasing watervelocity when entering thc estuary, allowingsuspended sediment to drop out of the water column.Lane ct al, ! 999! reported siinilar findingi I'or thcCaernarvon diversion and Villarrubia �998!reported 164 ha of new marsh has formed in BretonSound estuary since the opening of the diversion.prcsumab!y duc to sedimem accumulation,
Flint and Rabalais �981! found the periodicadditions of freihwater into Corpus Cristi Bay hada beneficial affect on ecosystem functioning. Theysuggest that higher phytoplankton productivityassociated with increased nutrient input iiassimilated into benthic biomass Increased benthicproduction represents additional food supply forimportant fisheries such as shrimp. Increasedproduction of oysters, finfishes and penaid shriniphave been attributed to previous openings of theBonnet Carre Spillway Chew and Cali 1981!Caddy !993! proposed a model for the effect ofincreasing nutrient inputs on various trophic levelsin large enclosed water bodies. Additions ofnutrients iniiiallv increases overa!! production foral! trophic lei'eli, with peak rate~ occurring whenthe water body ii slightly eutrophic. As the systembecomei morc eutrophic the benthic communitydeclinei rapidly in response to bottom water anoxia.This trend is followed by other trophic levels andleads to eventual system collapse. Vihere I.ake

J lsd, Day et al.
Pontchaitrain is on this scale is uncertain, but futurestudies should address this question so the hea]thand trophic functioning of the take can be properlymanaged.
CONCLUSIONS
The diversion of Mississippi River water intoLake Pontchartrain during the spring of l997 had aprofound effect on Lake pontchartrain water qualityduring, and several months after, thc diversionended, There were increases in nitrogen andphosphorus concentrations in the ]akc associatedwith thc diversion, which triggered a blue/greenalgal bloom that persisted for several weeks, Thelake system did, however, assimi]ate a significantportion at the nutrient load either through algaluptake, micmbial processes, or burial. Though theeffects of the diversion on fisheries and wildlife
popu I ations in Lake Pontchartrain are not yet clear,the results from this study indicate only a short-termimpact on water quality in the lake. Although the!997 Spillway opening was for flood controlpurposes, the results of this study have implicationsfor freshwater diversions. The lake rapidlyassimilated much of the introduced suspendedsediments and nutrients, but there was an intense«tga] bloom. Results by Lane et al. ]999! andVi]tarrubia !998! for the Caernaervon diversionindicate that when the river is diverted into a marshdominated estuary, there i» wetland enhancementand rapid reduction in nutrient levels without intensealgal blooms.
AC KNOW LHlGMENTS
This study was supported jointly by theLouisiana Sea Grant College Program and the U.S.Army Corps of Engineers. We thank Eric Swensonfor help with data interpretation and analysis.
LITERATURE CITKD
BA.'ssu, K., C. P. FAi.Ls, Asn L. A, Hoasov., 1963. Agravimetric method f' or determining suspendedmatter in seawater using rnillipore filters.Deep Sea Research 10;634-642.
BARRY, J. M. ]997, Rising tide. the great MisSissippiflood of 1927 and how it changed America.Simon and Schuster, New York, New York
BiAvcHi, T, ARD M, ARc'Yaov, 1997. Temporal andspatial dynamics of' particulate organic matterin the Lake Pontchartrain estuary, southeastLouisiana, U.S.A. Estuarine, Coasta andShelf Science 45: 557-569.
BLACKBURN, T. H. 1979. Method for mcaSuring rateSof NH turnover in anoxic marine sediments,using a "N-NH dilution technique. Appliedand Envi rrmmental Mi crobio og y 37: 760-765.
BREAVX, A, M., AND J. W. DAY, JR. 1994. Policyconsiderations for wetland wastewater
treatment in the coastal zone: a case study forLouisiana. Coastal Management 22:285-307.
CADDY, J. F. 1993. TOward a comparative evaluationof human impacts on fishery ecosystems ofenclosed and senu-enclosed seas. Reviews in
Fisheries Science 1: 57-95.
CALLr mnR, E. At m D. E. HAviMO~~. 1982. Nutrientexchange across the sediment-water interfacein the Potomac River Estuary. Estitarine,Coastal and Shelf Sci ence 15:395-413.
CHFw, D. L. AND F. J, CAi.i. 1981, Biological con-siderations related to freshwater introduction
in coastal Louisiana, pp, 367-386. ln R. D.Cross and D. L. Williams eds!, Proceedingsof the National Symposium on Freshwaterlnf]ow to Estuaries. Slidell, Louisiana. Vo]. 1out of 2.
Ci.OFRi', J. E. 1987. Turbidity as a control onphytoplankton biomass and productivity inestuaries. Continental Shelf Research 7: 1367-138].
COLi:. B- E. AND J. E, CLoERx. ]984. Significance ofbiomass and light availability to phytop]anktonproductivity in San Francisco Bay. IvlarineFcotogy 17; 15-24.
DAvis, D. W. ]993, Crevasses on thc lower coursef the Mississippi River, C
378.
DORRACH, Q., T. PrmRspN, AND R.E. TtntNraA]gal bloom resulting from the opening of theBonnet Carre Spillway in 1997- In Bas'thc Basin Research Symposium. May 12-]3.University of New Orleans, Louisiana
Fim', R. W, AND S. C. RAaALAis. ] 981. Estuadnebenthic community dynamics related «

Bonnet Carrrl. '97 Freshwater Diversion 99
freshwater inflow to thc Corpus Christi Bayestuary, pp. 489-508. Irr R, D. Cross and D.L, Williains eds!, Proceedings of the NationalSyrnposiurn on Freshwater Inflow to Estuaries.Slidell. Louisiana, Vol. 1 out of 2. pp.
GRI.ENBErtrj, A. E., R. R. TRUssELU, 1.. S. CLESCt+>,M, A, H, FRA~soi, eds. 1985. StandardMethods for the examination of water andwastewater. American Public Health Asso-ciation. Washi~gto~ D.C.
JEiv~'s, M. C. Atso W. M. Knstrx 1984. The couplingof nitrification and dcnitrification in twoestuarine sediments. Lrrnrrrrlrrgy and Ocean-ography 29; 6�9-619.
Jitts, H. R. 1959. The adsorption of phosphate byestuarine bottom deposits. Aasrralian Joirrnalof Marine and Freshii arer Researt.h 10:7-21.
Ki.stP, W. M. Ai'D W, R. Bo v ~ 7 ! s. 1984. Spatial andtemporal coupling of nutrient inputs toestuarine primary production: the role ofparticulate transport and decomposition.Bullerin of Marine Scient e 35: 522-535.
KHAEtD, R. A. AisD%. H. PAraicK. 1988. Removalof nitrogen and phosphorus by overland flow,pp. 219-245. In Proceedings, NationalSeminar on Overland I'low Technology forMunicipal Wastewater, U. S. EnvironmentalProtection Agency .
KOiKi:, I. AND A. HATTORE 1978, DenitrifiCatiOn andammonia formation in anaerobic coastalsediments. Applied and EnvironmentalMicrobiology 35: 278-282.
LANE, R. R., J. W, DAY, A4'li B. THiaODr~Ux, 1999.Water quality analysis of a freshwater diver-sion at Caernarvon, Louisiana. Esruaries22�a!; 327-336.
LtNDAU, C. W. ANn R. D. DELAt'tsE, 1991. Dinitrogenand nitrous oxide emission and entrapmentsin Spanina aIrerniflora saltmarsh soil~ fol-lowing addition of N-15 labelled ammoniumand nitrate. Esrtrarine, Coasral and ShelfScience 32: 161-172.
Ltss, P, S, 1976. Conservative and non-conservativebehaviour of dissolved constituents duringestuarine mixing, pp. 93-130. In J, D. Burtonand P, S. Liss eds!, Estuarine Chemistry,Acedenuc Press, New York.
LoctSlArrA DEPARTMExa oF EsvIROxMEN'TAL QU ALiTY.1991. Proposal draft number 3, September 26,
1991, FY 91, Section 104 b!�!. Water QualityManagement Division, Office of Water Re-sources.
MADDEs, C. J., J, w. DAY AND J. M, RAstiAra.. !988.Freshwater and marine coupling in estuariesot the Mississippi River deltaic plain. Lirri-nology and Oceanography 33:982-1 K�.
MottAi, M, A. Atvsa R. E. H<>usots. 1989. Formationand bacterial utilization ot dissolved organiccarbon derived from detrital lignocellul<isc.Limnology and Oceanography 34'. 1034-1047.
Nixon, S. W, 1981. Freshwater inputs and estuarineproductivity, pp, 31-57. In R. D. Cross. andD. L, Williains cdsh Proceedings of thcNational Symposium on Freshwater inflow toEstuaries. IJ.S. Fish and Wildlife Service.Office of Biological Services. FWS/OBS-81/04.
NOwtcXt, B. L., J. R, KEts.v, E. REqt:WrnsA A~D D.V. KEURE~. 1997. Nitrogen losses through sedi-ment denitrification in Boston Harbor andMassachusetts Bay, Estuaries 20: 626-639.
PAERt., H, W., J. L. Pttscvvr Y, J. M. FEAtt, As.u B, L.PFsERLS. 1998. Ecosystem responses to internaland watershed organic matter loading: Conse-quences for hypoxia in the eutrophy ing NeuseRiver Estuary, North Carolina, USA. MarineEcologv Progress Series 166: 17- 5.
PATRicrt, w. H. Aho R. A. KrtAt to. 1974. Phosphaterelease and sorption by soils and sediments:effect of aerobic and anaerobic conditions.Science 186:53-55.
PotRRrrw, M. A. Am J. M. Ktwo. 1998. Obser-vationson Lake Pontchartrain blue-green algaeblooms and fish kills. In Basics of the BasinResearch Symposium, May ] 2-13, Universityof New Orleans, Louisiana
RrcrtARDsos:, C. J, 1985. Mechanisms control'lingphosphorus retention capacity in freshv aterwetlands. Science 228:1424-1427.
RtcitARDsoN, C. J. Arso D. S. NtcrioUs. 1985.Ecological Analysis of Wastewater Manage-ment Criteria in Wetland Ecosystetrts. pp. 351-391. In P. J. Godfrey {ed!, Ecological Consid-erations In Wetlands Treatment Of MunicipalWastewaters. Van Nostrand Reinhold Com-pany, New York.
SALL, J..<iu A. Lnnvi~~. 1996. JMP start statistics,a guide to statistical and data analysis using

1M Jvy Dayetal
~ ~ JMP IN software Duxbuty press.New York.
SHh%', I ~H C H CuLaatsow AuD T M CntntcH1982. The chemistry of the Delaware estuary,General considerations. Lirrsnolvgy andOceanography 2: }015-1028,
S IxoaA, . �zv, W. B, AND B. KJERFVE. 1985. Factorsinfluencing the salinity regime of LakePontchartrain, Louisiana, a shollow coastallagoon: analysis of a long-term data sct.Estuaries 8: 170-180.
SMrrrt, C. J., R. D. ~UNE ~ J. W. H, PArtuctc.1982. Nitrate reduction in Sparrinaaltenuflora marsh soil, Soil Science Societyof Anse rica Journal 46: 748-750.
SouENson, J. 1978. Capacity for denitrification andreduction of nitrate to ammonia in a coastalmarine sediment. Applied arrd Envi mrvnerttalMicrobiology 35: 301-305,
Statn, M, K., J. w. Dxv caw K. G. TmoUE. 1986.~ity of materials transpott through acoastal freshwater marsh: through riverineversus tidal forcing, Estuaries 9: 301-308,
Swpnsov�E. M. 1981. Physical effects of the 1979opening of the Bonnet Carre spillway, Pro-ceedings of the Louisiana Academy of Sciences44: 121-131.
Swe sow, E. ~ W. S. CrtLmo. 1983. Tidal andsubtidal water volutne exchange in anestuarine system Esruarirse, Coastal and ShelfScience 16:229-240.
TEXT+�K, G�C. J, Mmna~ ~ J, W. Dxv. 1988.Sediment-water oxygen and nutrient fluxes ina river-dominated estuary. Esrgaries 11: 1-9.
TUttNEx, R, E, totn N, N Ibemms. 1991. Changesin Mississippi River water quality this century,BioScience 41: 140-147.
>~uuts, C. R. 1998. Ecosystem response to afreshwater diversion. the Caernarvon experi-ence. Abstract. Symposium on RecentResearch in ~ Louisiana: Natural SystemFunction to Human Influences. 3-5 February,layette, Louisiana.
WrnsHAw, R. L., M. J. FtstoeAt, R R. GameE, .<iDL.E. Low+. 1987. Methods for Ihe deter-mination of organic substances in water andfluvial sediment. In U.S. Geological SurveyTechniques of Water-Resource lnvestiga-tens. Book 5, Chapter A3.

Sediment-Water INateriai Fluxes in Benthic Microalgai-Dominated Sediments from Beds of Submersed Vegetation:Impacts of Light Reduction and Nutrient Enrichment
WlLL1 ~M M, R17<OUnited States Geolr>gical Survey/Hiologica] Resources DivisionCoittmbia Fnvironrnentai Research Center, 4200 l iew Haven Rd.,Columbia, MO 65201; TFL 573-884-62@it FAX 573-876-l89!5;email: ri [email protected]
RoxALD G. BGUsTANvUnited States Geological Survey/Biological Resources DivisionIVational Wetlands Research Center, 700 Caj undotne Blvd.,Lafayette, IA 70506etnaile ron houstanyC<usgs.gov
ABSTRACTBenthic microalgal communities, including those within beds of submersed vegetation, areimportant contributors to primary production, water quality, and oxygenat!on of the ~ster column,The impact of eutrophication on these communities has received little study. We investigated tbeeffects of light reduction and nutrient enrichment with ammonium VII,!, phosphate Pf!,!, andnitrate+nitrite NO ! on the exchanges of oxygen DO!, dissoived inorganic carbon DIC!, NH,, POeand NO . Cores were collected ln July, 1995 from Lake Pontchartrain, LA, from bare sedimentswithin a bed of VetNsneri««meric«n«. After acclhnation, one set of cores was used for determinationof initial ambient flux rates. The remaining cores» ere placed in i 5 cmWameter pots in greenhousetanks and grown under three light levels �00%, 60% and 40% of ambient! and two nutrient levels ainbient, and enriched at 3-6X ambient!.In pre-treatinent July samples, mean net production aad respiration were high, $9 and 71 mg 0,m'* h ', respectively. Ammoniuin was released in the light and dark but light fluxes were only 47% ofdark rates, a significant difference �8 and 146 Fmol m' b ', respectively!. Phosphate and NO werereleased from the sediments at lo» and variable rates under both light and dark conditioiLs, means <40 lsniol m' h'.In September, cores grown under nutrient enriched conditions hsd significantly higher netproduction !.7-2.8 x ambient! and chl. a concentrations x ambient! but were unaffected byshading. Respiration was also significantly higher �-3-1.4 x ambient! in enriched treatments, butwas also higher in the high light treatment. No signfflcant effects of tres ments were found for anvother material flux. Nutrient fluxes were extremely variable, with both uptake and release occurringamong replicate cores within each experhnentaI treatment. In general, sediments took up NH, in thedark and released it in the light, while PO, and DIC were taken up in the light and released in thedark. Nitrate was taken up in enriched cores, snd in the dark, hut released under ambient nutrientlevels in the light. Benthic autotrophy was dearly stimulated by nutrient enrichment. with a coupledincrease in sediment oxygen consumption. Light treatment effects may bove been obscured throughcanopy formation by V«Nsneri«at the end of this experiment. The lack of impact on nutrient fluxesindicates that exchanges of these constituents are not as closely tied to either photosvnthesis or aerobkrespiration as in other systems.
From the Symposium kecent tteiearch tn Coastai letttisiana'A'ararat System Function anti kesponse to Httntan Inhuence.ROzxs, L.P., J,A. Nymnn, C.E. PrOtfin. hl.N. Rabalnts. D->-Reed, and R.E, Turner editors!. 1999. Published by LouisianaSea Clrant C.'allege Program.

102 Rizzo and Bouatany
INTRODUCTION
Benthic microalgae are significant sources oforganic rnatter and ox,ygcn in estuarie~ Sundbacket al. 1991; Rizzo et al. !992; !. They can a!sir reducenutrient re!ease by sediments or rcmove nutrientsfrom thc water column Sundback and Ciraneli !988;Rizzo 1990; Rizzo ct al. 1992, Rcay ct al 1995!.Most estuaries have come under stress from eutro-phication within recent decades. Lutrophicat ion hashad well docurnentcd effects iin thc autotrophiccommunit.ies of phytoplankton and submersedmacrophytes { Kc.mp ct al. 19g3, Lapointc and Clark!993; Va!ic!a et al. 1993; Ikiering ct al. 1995!. hutthere have been fcw studies ot' the benthic microa! galcommunity. Infcrcnccs from thc t'cw existing fieldand microcosm studies have shown substantial andvariable impacts on. this c<immunity. !n thc NeuseRiver Estuary benthic microa!gal pnx!uction is lowerin the oligohaline zone. near thc major source ofnutrient loading, than in thc rncsohalinc zone,probab!y from greater light attenuation due to bothhigh particulate concentrations and greater phyto-plankton biomass Rizzo et al. 19921. In coastalwaters with intensive raft culture of filter-feedingbivalves, thc resultant organic and nutrient loadingincreased rnic roa lga 1 biomass, probably byiilcreasing water column transparency; however,organic loading ultimately promoted net systcrnheterotrophy and an oxygen deficit lor the sediments Barranguct et al. 1994!. I'ertilizcrs app!ied to thcsediment~ of intertidal sa!tnrarshes increased benthicmicroalgal biomass in oric study Su!!ivan andDaiber 1975!, but had no direct effect in a secondstudy Estr&a et al. 19741. Experimental nutrientenrichment of microcosrns has increased bothproductivity and biomass Nilsson and Sundback199!; Ni!sson ct al, 199! 1. and increased meiofaunabiomass and grazing on bacteria Nilsson et. al.199 ! l. In another microcosm study, light reductiondecreased rtucroa! gal product i v it y, but not biomass,while nutrient additions hadno effect Dailey 1995!,Neither light nor nutrient treat.mcnLs affected NH,fluxes Dai!ey ! 995!. In conjunction with arnesocosrtl study of' the effects of light reduction andnutrient enrichment increased loading! on thegrowth of Vallisnerr'a americana, we undertook thisstudy to evaluate tho~e effects on the productivityof the benthic rnicroalgal component of this
community. and to evaluate the etfects on sed.iment-water nutrient exchange
MATERIALS AND METHODS
Intact scdimcnt plug~. 15 cm in diameter; weretaken from t.he north shore of Lake Pontchartrain
about 5 km eas of the macrophyte co!lectiorn site,on Ju!y ! I, !995. Cores weretaken frombare sedi-ments between clumps of submersed vegetation andplaced in f!ower pots for transport to thc greenhouseat. ambient temperature. At thc grccnhouse, the potswere placed in thc same mesocosrn tanks containingpots with submersed macrophytcs, which had beenpreviously collected, The tanks were filled with amicronutrient solution Smart and Barko 1985!.Water depth was adjusted to achieve light levelstypical of the depth at the collection site ! m!.Nutrients NH,. PO,, and NO,! were added daily insufficient amounts to achieve typical arxtbientnutrient concentrations for this area of Lake
Pontchartrain. Each week one-third of the water
was replaced and thc tanks were scraped attd thewater filtered with a diatomaceous earth pool-filtcring system to limit periphyton and phyto-p!ankton growth.
After a week of acclimation 18 randomlyselected pots werc used to make estimates of pre-treatment f!ux rates. Pots were subcored using IOcm plexiglass cores �0 crn' surface area, 2.5 Lvolume!. The cores were then filled with the
micronutrient solution used in the mesocosrn tanks
and placed in aquaria maintained at ambienttemperature �5-30 C! and receiving saturatinglight �N!-goo mmo! m ' s ' l. The cores were stirredthroughoui. the experiment. Flux calculations weremade from differences in initial and finalconcentrations of DO, DIC, NH�PO,, and NOx forsequential 3 h light and 2 h dark incubations.
Dissolved oxygen was measured poiaro-graphically Ye!!ow Springs Instruments Model 55!and DIC was measured by infra-red gas analysis Capni Con 4 Total Carbon Dioxide Analyzer!.Automated analysis Alpkein F!ow Solution IIIautoana!yzer! was used for nutrient analyses.Sediment chlorophy!l a was determined using aTurner IOAU f!uorometer using thc method of

Incubation C.onditionLtg h t Dark
Variable
Oxygen
DIC
Ammonium
PhosphateLightNutrtents
Interaction
0.2823 0.52530.8801 0.3773
0.2985 0.3780
Nitrate+nitriteLightNutrients
Interact ton
0. 1099 0.7666
0. ! 900 0.0655
0.4426 O. 896
Chl. aRESULTS Light
NutrientsInteraction
0 2953
0.0102
O.6848
Wclschmcyer �994! and the calibration proceduresof%ctzc! and Likens �9911.
On july 25, we began thc experimentaltrcattnents and continued them for 2 months. Anincrease in nutrient loading was achieved by making3-fold additions of NH,and PO, and a 6-foldaddition of NO, above ambient concentrations. !nthc absence ofhistorical data for Lake pontchartrain,we based the nutrient additions on thc documentedlevel of nutrient enrichment which occurred inGa!veston Bay, where there have been extensivelosses of SAV Stan!ey 19921. Nutrient concen-trations were determined prior to making nutrientadditions, and within 20 min fol!owing additions.Added inorganic nitrogen was removed betweenadditions except in the lowest light treatment, whereNO concentrations increased during the experi-rncnt, reaching concentrations near 40 p.M. Meanamhient concentrations + standard deviation ofNH,, PO,, and NOx were 0.92 + 0.14 !tM, 0,41 i0.05 pM, and 1.4! + 0,45 !tM, respectively. Meantreatment concentrations were 3.97 4 1.52 pM, !.50k 0.61 !tM, and 11.60 4 12,� ItM, respectively.Therefore enrichtnents averaged 4.3X for NH,,3.7X for PO, and 8,2X for NOx,
The light reduction treatments were based onSecchi disk monitoring data Cormier et al. 1994!,which we used to calculate the degree of lightreduction in areas where SAV was formerly presentin Ldce Pontchartrain. These cakulations suggestedthat impacts would occur at reductions of 40-60%of ambient.
Final flux rate and chl. !t determinations weredone from September 19-22, 1995. Incubationprocedures were the same as for the intial fluxmeasurements except that dark incubations werecarried out overnight, i.c, 16 h. Final sarnplc sizeswere 9 cores for each treatment block. Two-wayanalyses of variance were carried out on the fluxand chl, a data, Effects were considered significantat F, < 0.05.
Flux rates as a function of the experitnentaltreatments are shown in Figs. 1-5 for oxygen, DIC,
Sediment-Water Material Fluxes 103
NH,, PO,. and NO, respectively, in addition to prc-'Itreatment f!ux values. Results of the chl. adetemtinations are shown io !=i@. 6. The results olthe analyses of variance are presented in Table l.Oxygen metabolism increased significantlv asresult of nutrient addition, while light reduction hadno effect. Net productivity in ambient nutrienttreat rrtents declined 1'rom prc-treatment values underall light levels, while nutrient-enriched treatmentsincreased at afl light levels, Oxygen uptake underenriched conditions was similar to pre-treatmentuptake rates, while rates under atrthient nutrient
Table L Restt!ts F,> of two-way analysis ofvariance on Aux rates attd chlorophyll a.
Light 0.1692 0.0202Nutrient s 0.0002 0.0001Interaction 0.2338 0,5430
Light 0.4152 0.5319Nutrients 0.0529 0.14081 nteraction 0,3315 0.4338
Light 0 1222 0 7967Nutricnts 0.8994 0. 15661 nteraction O. 385 3 0.5889

10i Rizzo and Boun any
Oxygen Fluxutt tt Treaonent t Arnb eivt pAR!
i xi> 4M i�% say 4o'4
200
100
0 F
I i
-1000 0 0 0 0 JULY
+ + + + +0
+
Nutrient Treatment
Fig. ! . Mean oxygen fluxcs mg 0, in ' h ' ! " standard error of sediments for light and dark incubations, Labels onthe x-axis designate tank trcatmcnts for not!-enriched �! and enriched +! conditions, and for PAR � = 100%,2 = 60'i , 3 = 40% of ambien ligh !. Fluxes into sediments are negative and fluxes out of sediments are posi ivc.July dcnotcs initial prc-treatment rneasuremcn a.
DIG FluxUt bt Tra binant �s Ambleii PA !
i i xi v 60" i 60% 40'I'e4c+
ii,
-15
0 0+ +
G 0+ 4
0 JULY+ +
Nut nant Treatment
Ftg. 2. Mean DIC f!uxcs mmol m ' h ' } " standard error of sediments for light and dark incubation s. !abc! s on thcx-axis designate ank treatments for non-enriched �! and enriched + i conditions, and for PAR � = ! 00%, 2 = fi0%,3 = 40% o ambient light!. Fluxes into sedtments arc negative and fluxes out of sediments are positive. Julydenotes tni ial pre-treatment measuremen s.
0
E
O
~ -10 i,E
Q L GHT8
I DARKII8g JULY-LII JULY-D
~ LlGHT
Rg DARK58Q JULY4g JULY'

Sediment-Water Material Fluxes t05
Ammonium FIux
Light Trsatrttartt %, Amtttsttt PAR!
t ari",. fi0' MN ail� "~
150
100rsrE
50 i
-50
0 JULY+ +
0 0 0+
Nutrient Treatment
Fig. 3. Mean ammonium fluxes ltmol m - h '! " standard error ol sediments for light and dark incubations l.abel»on the x-axis designate tank treatments for non-enriched �! and enriched +! conditions, and for PAR l I = l N'»,2 =60%, 3 = 40% of ambient !ight!. Fluxes into sediments are negative and fluxes nut of sediments are positive.July denotes initial pre-treatment measurements.
Phosphate FiuxLtttttt TreatWWnt SS Amtusnt PAR!
so".t QQ's 40s,
20
-$0
-20 0 JULY+
0 0 0+
Nutrient Treatment
0 0+ +
"ig. 4. Mean phosphate fluxes lsmol m - h '>" standard error of sediments for light and dark incubations. Labelson the x-axis designate tank treatments for non-ennched Ol and enriched +! conditions, and for PAR l i = 1 t l%,2 = 60%, 3 = 40% of ambient light!. Fluxes into sedimenLs are negative and fiuxes out of sediments arc positis c.July denotes initial pre-treatment measurements.
c10
E
0 0
Q LlGHTR8II DARK
8g JULY-LQ JULY-D
~ UGHTS8+ DARKRR~ JUL Y4.I JULY-D
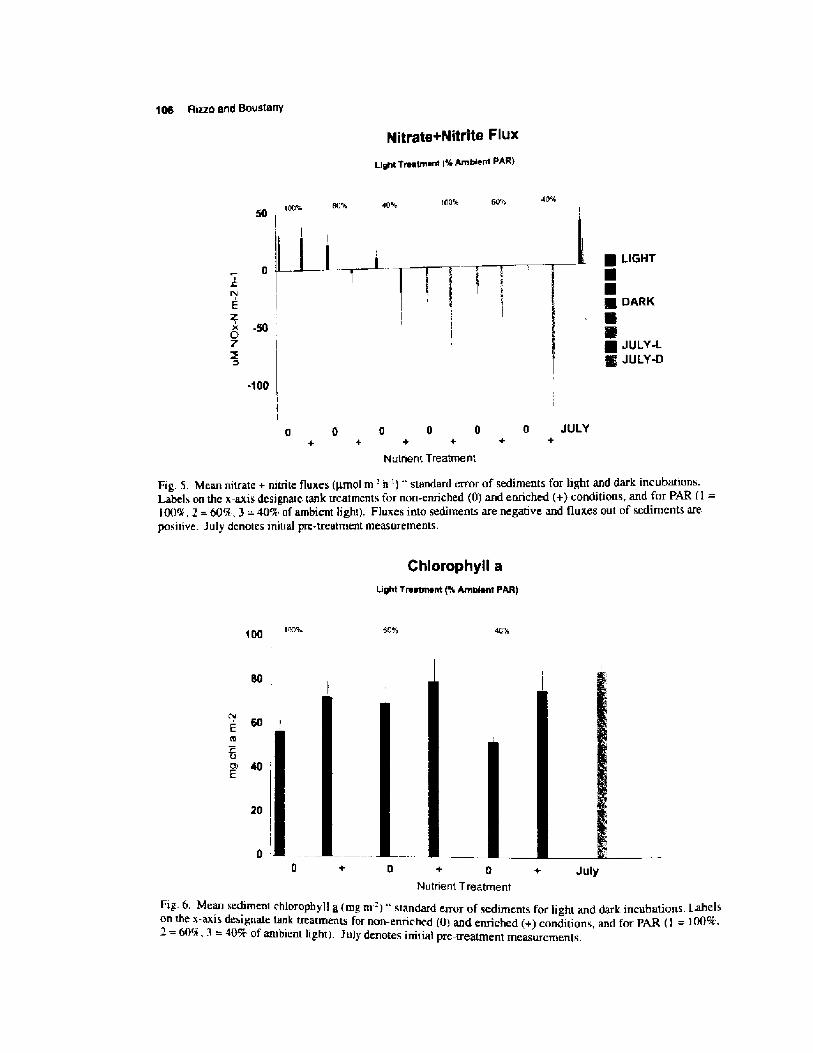
108 Rizzo and Boustnny
Nitrate+Nitrite Flux
Light Treatment �0 ambient patt!
100% sp!'o 40'000 1 00'5
II JULY-D
-100
0 JULY+
0 0 0+ + +
Nutnent Treatinent
0+ +
Fig. 5. Mean nitrate + nitrite fluxes ltmol m ' -h'! standard error of sediments for light and dark incubations.Lahels on the x-axis designate tank treatments for non-entiched �! and enriched +! conditions, and for PAR � =I00%, 2 = 60%, 3 = 40% of ambient light!. Fluxes into sediments are negative and fluxes out of sediments arepositive. july denotes iniual pre-treatment measurements.
Chlorophyll aLight Treatment Q Ambient PAR!
100 sGwc 40'X
+ 0 + JulyNutrient Treatntent
Fig.6. Mean sediment chloro h ll a m me "son the x-axis desi ate tank treatm
p y g tn0!" standard error of sediments for light «nd dark incubations Labels. gn treatments for non-enriched �! and enriched +! condirions, and for PAR � = 100%
= 60%, 3 = 40% of ambient lig.ht!. Ju!y denotes initial pre-neatment measurements.
0
rvE
Z x $0ZZ
00
0a 40 i
20
~ L.IGHT55Q DARKSh
Q JULY<
Sediment-Water Matenal Fiuxes t07
additions declined. Similarly, nutrient additionincreased uptake of DIC in the light, but dark DICrelease was not significantly affected even thoughreleases were almost two-fold higher in the high andlow light nutrient addition vcatments. Pre-treatmentuptake in t.he light was nearly 3-fold higher thanany post-treatment value, while dark DIC releasewas less than half the value of any post-treatmentflux.
There were no significant differences in anynutrient fluxes due to experimental treatments foreither incubation condition. After treatments NH,was generally released in the light and taken up inthe dark at fairly low rates. In contrast, pre-treatmentfluxes showed highrates of NH, release in the dark,while release in the light was about half that in thedark. Fluxes of PO, and NO were low and erraticexcept for a high rate of NO uptake in the dark forthe enriched low light treatment. Pre-treattnentfluxes showed release of PO, in both the light anddark, but flux rates were still low. Under lightincubation, NO was released at higher rates beforetreatments began, while dark incubations alsoshowed release of NO in contrast to uptake underall post-treatment conditions.
Agreeing with the net production data, nutrientadditions significantly increased chl. aconcentrations but were unaffected by lightreduction. Control concentrations ranged from 55- 70 tng m ', while enriched treattnent concentrationsranged from 72 - 80 mg m '-, about 30% higher thanmean control group concentrations, and similar topre-treatment. values,
DISCUSSION
Community Productivity
Our results clearly detnonstratc an increase inbenthic microalgal nct production, chl. a biomass,and sediment oxygen uptake, the latter probablycoupled to the increase in system autotrophy. Thenutrient effigy:t was not surprising considering thelow ambient nutrient concentrations at this site typically 2 pM for all nutrients!, and agree withNilrson and Sundback �991! and Nilsson ct al.�991!. Dail ey �995! found a significant decrease
in productivity with light reduction but no effect ofnutrient enrichment. However, Dailey l 995! pointsout that ambient nutrient concentrations wercprobably sufficiently high in her study to alleviatenutrient limitation without enrichment. Our lightreduction treatment for thc benthic microalgal pot»may have been negated by the extensive canopyformation achieved by the Vallisneria which wasreaching peak biomass in all the mcsocosm tanks.Since benthic microalgae respond rapidly to lightreduction Dailey J995!, even a week under fullplant canopy may have nullified the effects of ourlight treatments. Unfortunately light levels werconly determined for the water surface, so we cannotdetermine what actual light levels were reached atthe sediment surface.
Nutrient enrichment significantly increasedDIC uptake in the light, similar to the results of theoxygen fluxes, but the results for the dark incu-bations were not significant though the same trendswerc present as in the oxygen data. Stitnulation of'nitrification in dark-incubated cores could haveacted antagonistically in nxiucing the increase indark DIC efflux expected based on stimulation ofoxygen uptake. Nitrifical.ion could have beenincreased by thc direct addition of NH, subsvatcand by increased sediment oxygenation fron! theincrease in benthic microalgal productivity.
Nntrieat Iluxes
Pre-treatment NH, fluxes were similar toothers reported for the literature, especially forheterotrophic dark! conditions Rizzo ct al. 1996kBenthic microalgal production in the pre-treatmentcores reduced release of NH, substantially �09c!over dark-incubated cores, but rates of re!ease werestill high compared to other studies which showedmuch greater reduction of NH, release, or reversalof flux direction Nowicki and Nixon 1985;Sundback and Graneli 1988; Rizzo l 990; Rizzo etal. l 992; Reay et al. 1995!. The high NH. releasein the light also differs from the results of an on-going study of spatial flux patterns on both the northand south shores of Lake pontchartrain which haveconsistently shown removal of' NH, with positivenet production Rizzo, unpublished daiak Microbialresponse to an organic loading event inay have

10B Rizzo and Bou stan y
stimulated a heterotrophic response in excess of thatsupported by autotrophic metaholisrn, s i milar to theeffecls of bivalve culture Barranguet et al, 1994!.Such an event may have been caused by loadingfrom houseboats and septic tanks within a fewhundred meters of the collection site; or possibly asa response to senescence of a recent cyanobacterialbloom John Burns, pers. comm.!.
The post-treatment fluxes of NH, are muchlower than those reported from other systems,especially for the prevailing temperature ca. 30 C!and also differ from most flux studies in showingconsistent NH, uptake in thc dark 'Kamp-Nieisen1992; Vidal et al, 1992; Yoon and Benner 1992;Rizzo and Christian 1996!. Since sediment oxygenconsumption, and hence NH�regeneration was ashigh as in other studies showing NH, release Kamp-Nielsen t992; Vidal et al. 1992; Yoon and Benner1992!, uptake must have been due to an NH,demanding process which bccarne dotninant duringthe study. Nitrification is the most likely process toexplain the dark uptake, since it has been shown tobe very important in nitrogen fluxes in otherestuaries Risgaard-Petersen et al. 1994!. Theobserved releases in the light coutd have beeninduced by sudden inhibition of nitrification by thehigh incubation light levels.
Ruxcs of PO, were low 20 Jtrnol rnih '!and erratic under all treatments and incubation
conditions, Such findings are typical of bothautotrophicat1 y- and heterotrophically-dominatedsediments under oxic conditions Rizzo and
Christian 1996, and discussion therein!. Ratios of
N:P based on NH,, are typically 5 Rizzo,unpublished data!. indicating little liklihood ofphosphate limitation, and little reason to suspect anautotrophic impact on PO, f1uxes.
Similarly, NO fluxes werc also generally low < 20 Jtmol m ' -h '! and enatic as reported in otherstudies Rizzo and Christian 1996, and discussion
therein/, but there were consistent incubationdifference in flux direction. In the dark NO was
taken up under al I treatment conditions, vs hite it wasgenerally re!eased in the light. Thc NO fluxes couldbe explained by coupling of denitrification tonitrification. An active denitrifying community
would also be poised to rernovc NO from the over-lying water-column. Light-inhibition of nitrifi-calion, discussed above, may have limiteddcnitrification and resulted in release of NO in the
light as we! l as NH,. Thc high dark uptake and lightuptake in the enriched low light treatment may haveresulted from build-up of added NO in the watercolumn. Concentrations were l7 pM in this treat-ment, compared lo 1-4 ItM in lhc other treatments,and may have afforded additional subslralc fordenitrification, Removal of NO by sediments iswidely reported when water column concentrationsare high Boynton and Kemp 1985; Van Raaphorstet al. 1992; Rizzo and Christian 1996!.
ln summary, both rnicroalgal net productivityand biomass, and coupled aerobic respiration wereincreased by nutrient enrichment in LakePontchartrain sediments. Further research would
bc desirablc to determine if such a response wouldoccur in the presence of competition from phyto-plankton blooms. It is also interesting to note thatdespite substantial microalgal productivity and anapparently nitrogen-limited system, there was nosignificant effect on DIN fluxes for these srxiiments,or those supporting submersed macrophytes Roustany and Rizzo, this volume!. This points outthe substantial contribution of other microbial
processes to nutrient cycling in this system andunderscores the need for studies of eutrophicationeffects on other microbial processes.
ACKNOWLEDGMENTS
We thank Dr, Hilary Neckles for contributionsto the experimental design, and review of themanuscript. We thank Mr. Darren Johnson, Dr.Rebecca Howard, and 3 anonymous reviewers forcomments on the manuscript. We also thank Mr.David Meaux and Ms. Martha GriAis f' or assistance
with the experiment.
LITERATURE CITED
BaiutAisoun, C., E. ALLror, avo M.-R, PLAsm-Ct>~.
1994. Benthic microphytic activity at twoMediterranean shellfish cultivation sites withreference to benthic fluxes. OcearroIogicaActa 17: 2t 1-221.

Sediment-Water Matenal Fluxes 109
BDYNToN, w. R. Ain w. M. KI:sIR 1985. Nutrientregeneration and oxygen consumption bysediments along an estuarine salinity gradient.Marine EI alogy Progress Seri es 23;45-5, i.
CORMu;R, L, s., J. Sill.l:IIAi', M. B. I LI.MINiL ANt> A,HINI!RI IIS. 1994. Ixlulslana Water quality datasummary 199 -1993. Louisiana Departmentof Fnvironmental Quality. Office of WaterResources, Baton Rouge, LA.
DAILEY, S. K. 1995, lntcractions of benthiccommunities and material fluxes across thcsediment-water interface in North Carolinaand Virginia estuaries. M.S. Thesis. EastCarolina University, Greenvillc, NC.
DoEruNo, P. H., C. A, OvrATr, B. L. Nowlcxt, E. G.KLos, Ain L. W, RIIEI>. 1995. Phosphorus andnitrogen llrnitation of primary production in asimulated estuarine gradient, Marine Ei olog vProgress Sert'es 124: 271-287.
EsTRADA, M., 1. VALIELA, AND J, M. TEAt�1974.Concentration and distribution of chlorophyllin fertilized plots in a Massachusetts saltmarsh. Jourrral vf Experimental MarineBiology and Ecology 14:47-56,
KAMP-NIELsFN, L. 1992, Benthic-pelagic couplingof nutrient metabolism along an estuarineeutrophication gradient. Hydrobiologi a 235/236: 457-470.
KEvIP, W. M., R. R. TwlLLE Y, J, c. STEvr:.i sox. w. R.BOYNTON, AND J. Mt:ANs. 1983. The declineof submerged vascular plants in upperChesapeake Bay; Summary of results con-cerning possible causes. Marine TechnologySociety Jo«mal 17:78-89.
LAPOINTE, B. E, AND M. W. CLARK. 1993. NutriCntinputs from the watershed and coastal eutro-phication in the Florida Keys. Estuaries1 5:465-476,
NILssoN, C. AND K, SIJNDBAcx. 1991. Growth andnutrient uptake studied in sand-agarrnicrophytobenthic communities. Journal ofExperimental Marine Biology and Ecology153:207-226.
¹ssoN, P.. B. JoNsspN, l. I . SwANBERD, AND K.SUI'DB*cx. 1991. Response of a marineshallow-water sediment system to an increasedload of inorganic nutrients. Marirre EcologyProgress Series 71:275-290.
Nowlcxr, 8, L, Ai'n S. W. Nllxoi. 1985. Benthicnutrient rernineralization in a coastal lagoonecoiy stem. Estuaries 8;182-190.
Rt:AY, W. G�D. L. GALLAolu'Jt, AND G M. SIMstoxs,JR 1995. Sediment-water column oxygen andnutrient fluxes in nearshorc environments ofthe lower Dclrnarva Peninsula, USA. MarineFco ogy Progn ss Series 118:215-227.
RIsOAARD PETEXSEN N. S. RYSOAARI! L. P. Nr'.SS[:,,AND N. P. REvSIIi.cat. 1994. Diurnal VariatiOnof denitrification and nitriticiation insediments colonized by benthic rnicrophytes.Limnotogy and Oceanographv 39:573-579.
RIzzo, W. M, 1990. Nutrient exchanges betweenthe water column and a subtidal benthic Inicro-algal community. Estuaries 13;219-226.
Rrzzo, W M.. G. l. LAcxEY, AND R. R. CHRIs>IAN.1992. Significance of euphotic, subtidalsediments to oxygen and nutrient cycling in atemperate estuary. Marirte Ecology PmgressSeries 86'51-61
RIZZO, W. M, Win R. R. CIIRlsnIAN. 1996.Significance of subtidal sediments toheterotrophically-mediated oxygen andnutrient dynamics in a temperate estuary.Estuaries 19:475-487.
SMARr, R, M. AND J. W. BARKO. 1985. LabOratOryculture of submersed freshwater rnacrophytcsin natural sediments, Aquatic Botany 21:251-263.
STANLI Y, D. W. 1992. HiStOriCal trendS; waterquality and fisheries, Galveston Bay.University of North Carolina Sea GrantCollege Program Publication UNC-SG-92-03,Institute for Coastal and Marine Resources,
East Carolina University, Greenville, NC.SI:LLIvAN, M. J. Alia F. C. DAIBER. 1975. Light,
nitrogen. and phosphorus Brnitation of edaphicalgae in a Delaware salt marsh. Journal ofExperimental Marirte Biology and Ecology18:79-88.
SL'iDBActC, K., V. ENOxssoN, W. GRANI. AND K.PETrERssox, 1991. Influence of sublittoralmicrophytobenthos on the oxygen and nutrientflux between sediment and water: a laboratorycontinuous-flov' study. Marine EcologyProgress Series 74:263- 79.
SI:NDBACV,, K. Ain W, GRA.iELI. 1988. InfluenCe Ofmicrophytobenthos on the nutrient flux

1$O Rizzo and Boostany
between sediment and water: a laboratorystudy. hfarirIe Ecology Progress Seri es 43:63-69.
VALIELA, l., K. FDRExIAH, M. LAMONTAGNE, D.HFRSH, J COSTA, P. PFcxOL, B. DrMEo-ARDERSOS', C. D-AvANzO, M. BARIOvE, C.-H,SIIAvl, J. BRAwcEY, A'vD K. LAJTHA. 1993,Couplings of watersheds and coastal waters:Sources and consequences of nutrientenrichment in Waquoit Bay, Massachusetts.Fstaari es 1 5;443-457,
VAR RAAFHORST, W, H. T. KLOOSTERIIUIs, E. M.BI »GHG Is, A. J. M. GIELZS, J. F, P. MAtSCIIAERT,Ar'n G. J. VAv NOORr. 1992. Nitrogen cyclingin two types of sediments of the southenI NorthSea Frisian Front, Broad l.ourteens!: Fielddata and rnesocosm results, lIletherlandsJoarnId of Sea Research 28:293-316,
Vu!AE. M.. J. A. MDRGI'I, M. LAtAsA, J. RoxIERO,Av» J. CAMt, 1992. Factors controlling spatialvariabIlity in ammonium release within anestuarine bay Alfacs Bay, Ebro Delta, NWMediterranean}, Hydrobiologia 235/236;519-525,
Wiu sCHMEYI», N. A. 1994. Rourornetric analysisof chlorophyll a in the presence of chlorophyllb and pheopigrnents. Limnologv and Ocean-ograplIY 39:1985-1992.
WIIvri:I., R, G. Ax i> G. E. LIRI-.vs, 1991.Limnological Analyses. Springer-Vcr}ag.xlcw York.
Yotxv, W. 8, Atv» R BEHNER. 1992. DenitriJIcationand oxygen consumption in sediments of twosouth Texas cstuarics. kfarine EcologyProgress Series 90:157-167,
Unpublished M xtterialS
RIzzo, W. M., U.S.G.S�National WetlandsResearch Center, 700 Cajundotne Blvd�lafayette, LA 70506.
BI.'Rvs, J. W., St. Johns River Water ManagementDIstrict, PO. Box 1429, Palatka, FL 32178-14'9
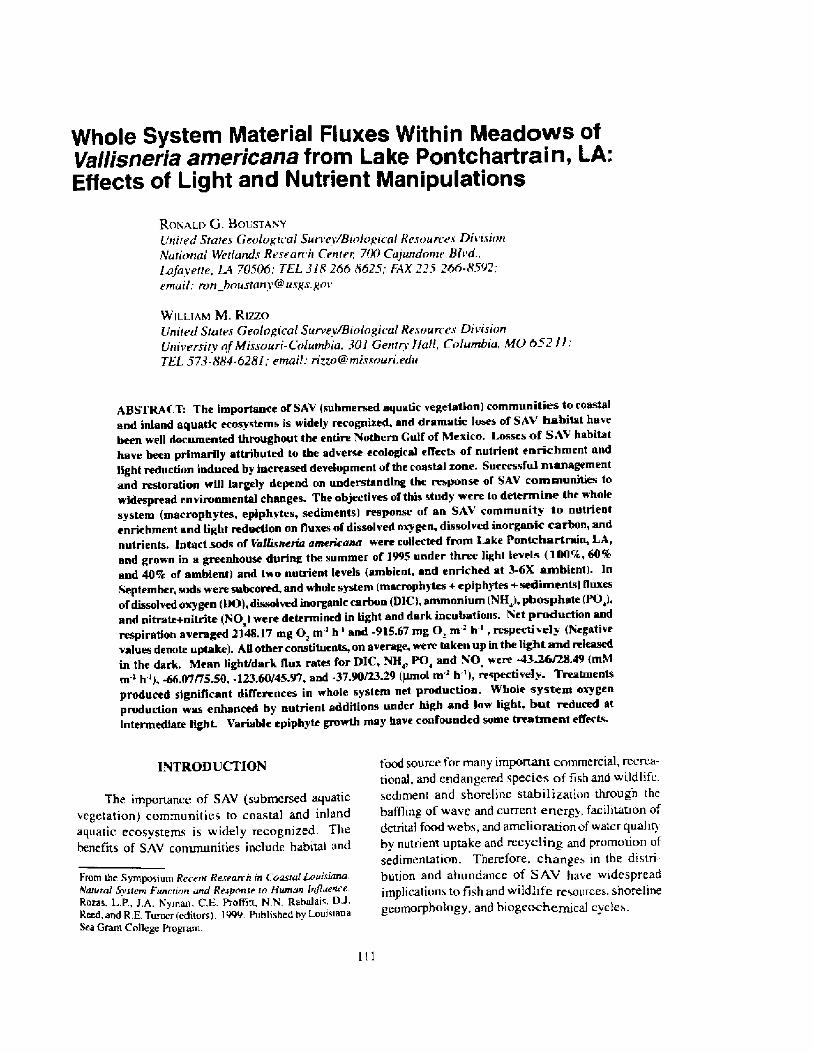
Whole System Material Fluxes Itithin Meadows ofVaflisneria americana from Lake Pontchartrairm, LA:Effects of Light and Nutrient Manipulations
Ror ALrs G. Bot;sTA>yUnited States Creologtcal Suet eylBi<rlogtc al Restturr t s Dirt'sit!rtlVatirrnal Wet ands Researt h Center, 700 Caj undonre Bli d.,lafayette, LA 70506; TFL 3l8-266-8625; FAX 225-266-8592;email: rrrn [email protected]
WILLIAM M, RtzzoUnited States Cseologica Suri ev/B«rlogi ca Resrtun es Di vtsiorrUniversity rt f itrI'issouri-Crrlurnbia, 30l Gentry Ha l, Cr>lurrtbirt, MO 652 /f;TFL 573-884-628lt email: ri oC<'misstruri.edu
ABSTRACT: The importance of SAV submersed aquatic vegetation! communities to coastaland inland aquatic ecosystems is widely recognized, and dramatic loses of SAY habitat havebeen wefl documented throughout the entire lvlothern Gulf of Mexico, lmsses of SAV habitathave been primarily attributed to the adverse ecological effects of nutrient enrichment andlight reduction induced by increased deveiopment of the coastal zone. Successful managementand restoration wfll largely depend on understanding the response of SA'V communities towidespread environmental changes. The objectives of this study were to determirsc the wholesystem macrophytes, epiphytes, sediments! response of an SAV community to nutrientenrichment and light reduction on fluxes of dissolved oxygen, dissolved inorganic carbon, andnutrients. Intact sock of Vallisrrerttt trtnerscatur were collected from Lake Pontchartrain, LA,and grown in a greenhouse during the summer of 1995 under three light leveLs �IN%, 60%and 40% of ambient! and two nutrient levels ambient, and enriched at 3-6X ambient!. lnSeptember, sods were subcored, and whole system rnacrop by tes + epip bytes + sediarsents! Boxesof dissolved oxygen DO!, dissolved inorganic carbon IDIC!, ammonium NH,!, phosphate PO,hand nitrate+nitrite NO ! were determined in tight and dark incubations. Net production andrespiration averaged 2148.17 mg O, m' b' and -915.67 mg 0, ma h', respectively lviegativevalues denote uptake!. Ail other constituents, on average, were taken up in the light and releasedin the dark. lVIean !ight/dark flux rates for DIC, NH,, PO, and VO were A3~.49 mMm-s h tl ~ Ii7t75$p -I23.60tt45.97, and -37.9Q/2329 lpmol m-t h t! respectively. Treatmentsproduced signiTicant differences in whole systetn net production. Wbo!e system oxygenproduction was enhanced by nutrient additions under high and low light, bnt reduced atintermediate light. Variable epiphvte growth msy have confounded some treatment effects.
INT ROD UCTION
The importance of SAV submersed aquaticvegetation! communities to coastal and inlandaquatic ecosysteins is widely recognized. Thebenefits of SAY conununities include habitat and
From the Symposium Reeerit Research in Coastal CauisurnaSaturate System Funriion and Restronse to Human tnlt uertreRoZaS, L.P., J.A. Nyrnan, L,E. PrnffirC bl.N Rahalttis, D.J.Reed, and R.E. Turner editors!, 1999. published by LotustauaSett Grani CoBege Proprntn.
food source for many itnportant commercial, recrea-tional, and endangered species. of fish and wildlife.sediment and shoreline stabilization through thebaffling of wave and current energy. facilitation ofdetrital food webs, and amelioration of water qualityby nutrient uptake and recycling and promotion ofsedimentation. Therefore, cltanges in the distribution and abu.ndance of SAV have widespreadimlilications to fish and wildlife resources, shorelinegeomorphology, and biogcochernical cycles.
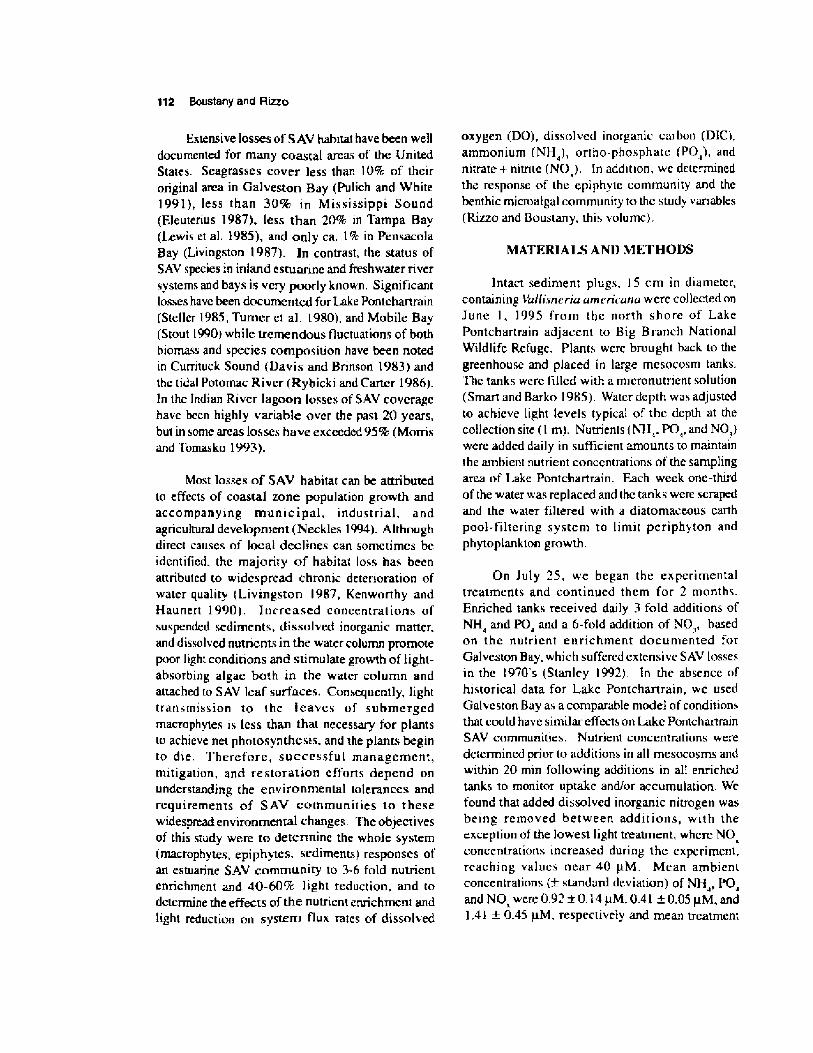
Boustany and Rizzo
Extensive losses of SAV habitat have been well
documented for many coasta! areas of the UnitedStates. Seagrasses cover less than ! 0% of theiroriginal area in Galveston Bay Pulich and White1991!, less than 30% in Mississippi Sound Eleuterius I987!, less than 20% in Tampa Bay Lewis et al, !985!, and only ca. 1% in PensacolaBay Livingston 1987!. In contrast, the status ofSAY species in inland estuarine and freshwater riversystems and bays is very poorly known. Significantlosses have been documented for Lake Pontchartrain
Steller !985; Turner ei. al. 1980!, and Mobile Bay Stout 1990! while tremendous f!uctuations of bothbiomass and species composition have been notedin Currituck Sound Davis and Brinson ! 983! andthe tidal Potomac Ri ver Rybicki and Carter 1986!.ln thc Indian River lagoon losses of SAY coveragehave been highly variable over the past 20 years,but in some areas losses have exceeded 95% Morrisand Toinasko 1993!.
Most losses of SAV habitat can be attributed
to effects of coastal zone population growth andaccompanying municipal, industrial, andagricultural development Neckles 1994!. Althoughdirect causes of local declines can sometirncs be
identified, the majority of habitat loss has beenattributed to widespread chronic deterioration ofwater quality Livingstott 1987, Kenworthy andHaunert 1990!. Increased concentrations ofsuspended sediments, dissolved inorganic rnatter,and dissolved nutrients in the water column promotepoor light conditions and stirnu!ate growth of light-absorbing algae both in the water column andattached to SAV leaf surfaces. Consequently, lighttransmission to the leaves of submergedmacrophytes is less than that necessary for plantsto achieve net photosynthesis. and the plants beginto die. Therefore, successfu! managcrncnt,mitigation, and restoration efforts depend onunderstanding the environmental tolerances andrequirements of SAV cotninunities to thesewidespread environmental changes. The object i vesof this study were to determine the whole system macrophytes, epiphytes, sediments! responses ofan estuarine SAV community to 3-6 fold nutrientenrichment and 40-60% light reduction, and todetermine the effects of the nutrient enrichment and
light reduction on systerri f!ux rates of dissolved
oxygen DO!, dissolved inorganic carbon DICkammonium NH,!, ortho-phosphate PO,'!, andnitrate+ nitrite NO !. In addition, wc determinedthe response of the epiphyie community and thebenthic micron!gal community to thc study variab!es Rizzo and Bousiany, ibis volume!.
MATERIALS AND METHODS
Intact sediment plug», ! 5 cm in diameter,containing Vatli me ria ameri i ana were col!ected onJune I, 1995 from the north shore of LakePontchartrain adjacent to Big Branch NationalWildlif'e Refuge, Plants werc brought back to thegreenhouse and p!aced in large mesocosin tanks.The tanks werc filled with a micronutrient solution
Smart and Barko 1985!. Water depth was adjustedto achieve light levels typical of the depth at thecol!ection site � m!. Nutrients NH�. PO,. and NO,!were added daily in sufficient amounts to maintainthe ambient nutrient concentrations of the samplingarea of Lake Pontchartrain. Each week one-third
of the water was replaced and the tanks were scrapedand the water filtered with a diatomaceous earth
pool-filtering system to limit periphyton andphytoplankion growth.
On July 25, we began the experimentaltreatments and continued them for 2 months.
Enriched tanks received daily 3-fold additions ofNH, and PO, and a 6-fold addition of NO,, basedon the nutrient enrichment documented for
Galveston Bay, which suffered extensive SAV lossesin the 1970's Stanley 1992!. In the absence ofhistorical data for Lake Pontchartrain, wc usedGalveston Bay as a comparable model of conditionsthat could have similar effects on Lake PontchartrainSAV communities. Nutrient concentrations were
determined prior to additions in all mesocosms andwithin 20 min following, additions in all enrichedtanks to monitor uptake and/or accumu!ation, Wefound that added dissolved inorganic nitrogen wasbeing removed between additions, with theexception of the lowest light treaunent, where NOconcentrations increased during the experiinent,reaching values near 40 pM. Mean ambientconcentrations + standard deviation! of NH�PQ,and NO were 0.92*0.! 4!iM, 041 + 0.05 AM, and1,41 + 0.45 !xM. respectively and mean treatment
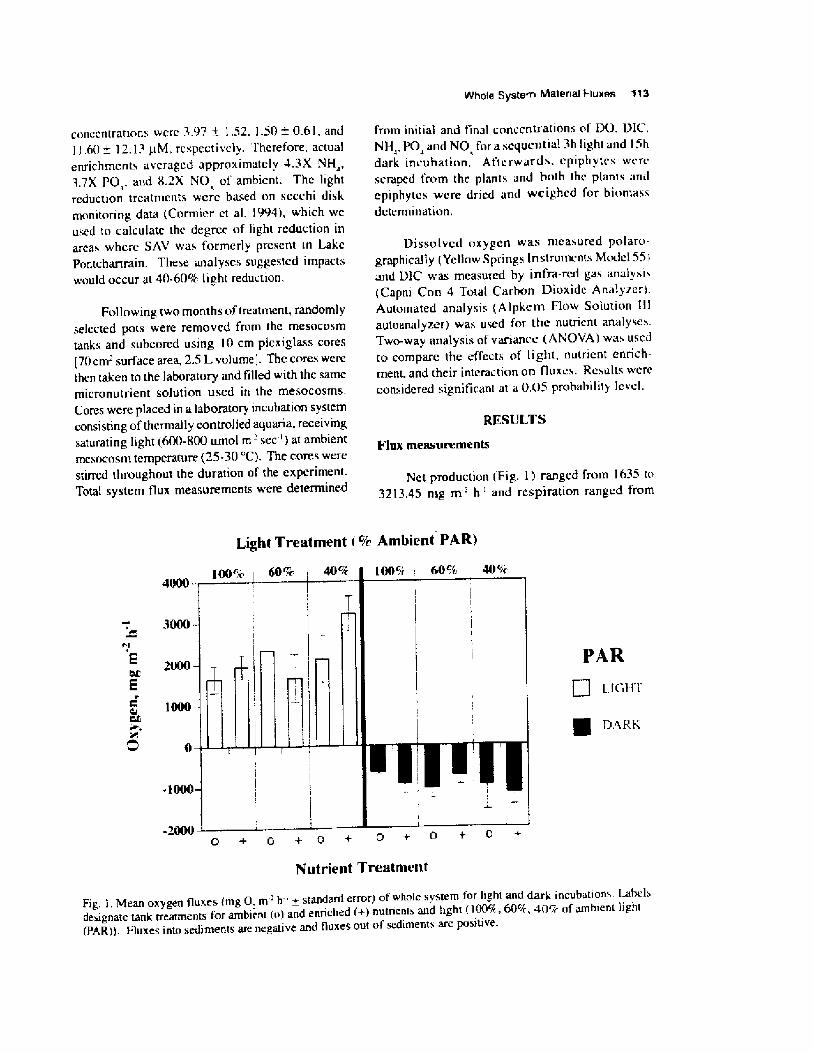
Whole System Matenai Fluxes 1t3
from initial and finalconccntration» of DO, DlC,NH,, PO, and NO for a»cquent i«i 3h light and 1Shdark incubation, Afterward». cpiphytc» werc»crapcd trom the plants and both thc plant» «ndepiphytcs were dried and weighed for biont«»»determination.
RESULTS
<rx trteasttrernents
Net production Fig. 1! ranged from 1635 to3213,45 mg mr h ' and respiration ranged from
Light Treatment /c Antbient PAR!
PAR
Ll 1 fl
g DARK
0 + 0 + 0 + D +
nutrient Treatntent
Fig. 1. Mean oxygen fluxes tmg O. m -' h ' + standard error! of whole system for hghl and dark incubation». Label»designate tank treatments for ambient to! and enriched +! nutnerns and light ! 00%, 60 k, 4 !~~ of ambient light PAR!!. Huxes into sediments are negative and fluxes out of sediments are positive.
concentrations werc 3.97 + 1.52, 1,50+ 0.61. and1!.60+ 12.13 !rM, rc»pectively, Therefore, actualenrichment» «vcragcd approximately 4.3X NH,,3,7X PO,, and 8.2X NO ol ambient. The lightreduction trcatrncnts werc based on secchi diskmonitoring data Corrnicr ct al. 1994!, which wcused to calculate thc degree of light reduction inarea» where SAV was f'orrnerly present in LakePontchartrain. These analy»e» suggested impactswould occur «t 40-609c light reduction,
Following two months of treatntent, randomlyselected pots were removed from the mesocosrntank» and»ubcorcd using 10 cm plexiglass cores[70crn-' surface area, 2.5 L volume I. The cores werethen taken to the laboratory and filled with thc samemicronutrient solution used in the mesocosrns,Cores were placed in a laboratory incubation systemconsi sting of thermal ly control led aquaria, receivingsaturating light �00-800 umol m - sec '! at ambientmesocosm temperature �5-30 'C!, The cores werestirred throughout the duration of the experiment.Total system flux measurements were determined
3000
2ppp
E
1PPP
p
Dissolved oxygen wa.s mea»ured polaro.graphically Ye! low Springs ln»trumcnt» Model SS!and DIC was mcasurcd by infra-red gas analy»i» Capni Con 4 Total Carbon Dioxide Analyzer!.Automated analysis A 1 pkc m Flow Solution 1 flautoanalyzcr! wa» used for thc nutrient analy»e».Two-way analysis of variance ANOVA! w«» usedto compare the effects of light, nutrient enrich-ment, and their interaction on fluxc». Results v:ereconsidered significant at «0. probability level.

414 Boustany and Rizzo
VARIABLE WHOLE SYSTEM
Light Dsrk
Oxygen{mg m'h '!
Light
Nutrients
0.0014
0.27]7
0.3580
0.7259
0.2819Interaction 0.0]50
0,1426Light
Nutrient s
0. 1390
0.7403
0.3875
mmo I rn 'h ' I 0.9693
0.0942Interaction
NH, urnol m-'h !
Ligh Nutrient s
0.5858
0.6920
0 933 I
0.9489
0 8713
k6139Interaction
PO, umol rn-'h '!
LightNutrients
0 5223
0.6299
0.5673
0.8467
0.6838
0.4780Interaction
NH
{umol rn 'h'!
Light
Nutrient s.
0.5223
0,6299
0.5673
0.8467
0.6838
0.4780Intei dctlorl
-650 to -1162.88 mg m' h '. Surprisingly, thehighest rates of primary production and respirationwere recorded under the lowest light and highestnutrient treatment, while the lowest rates occurred
under ambient {high} light and nutrient treatments.There was a significant interaction between ]ightand nutrient treatments on disso] ved oxygen fluxesin the light. but no significant effects under darkconditions {Table I }, In thc light, nutrient additionincreased photosynthesis under both high and lowlight, but not at the intermediate level of lightreduction.
f}isso] ved inorganic carbon DIC! fluxcs I'ig.2! ranged from -0.14 to -73.9I mM m ' h' in lightand !. I 2 to 50.23 mlv] m ' h ' in dark. Consistent
Table I. Results {F prob} of two-way analysisof variance {ANOVA!.
with the oxygen data, the highest fluxcs for bothlight and dark experiments were observed under60% light reduction and nutrient-rich conditions,and the lowest f]ux rates occurred under low light/ambient nutrients treatments in both light and darkexperimems. However, thc treatment effects didnot produce significant differences.
Similarly, there were no significant effects oftreatments on any nutrient fluxes, Generally nutrientfluxes were highest in hc low light treatments.Ammonium and phosphate fluxes tended to behigher in enriched treatments, but NO fluxes werehigher in ambient treatments, In the light, NH, {Fig.3! was taken up at rates ranging from -2].92 to-138.83 p.mol m ' h ', In the dark, NH, was generallyrc]eased from sediments, except for slight uptakein treatments receiving moderate �0%! lightrcxluction and nutrient enrichment.. F]uxes rangedfrom -9.13 to 137,91 ltmo] m-' h '. The who]esystem removed PO, Fig. 4! in the light at ratesranging from -44.75 to -233,81 Itmol m' h ', andreleased it in the dark at rates of 11.87 to 126.04
lt.mo]m- h'. The whole systemrernovedNO Fig.5! in the ] ight, at rates ranging from -15.52 to -62.11Itmol m-' h', Dark flux rates were more variableshowing from slight uptake {-7.31 pmo] m ' -h '! tofairly large re]cases {121,47 Itrnol m -' h'!.
Lpiphytc biomass was not significantlydifferent among treatmenLs. Nevertheless, epiphytebiomass {Fig. 6! comprised a substantial percentageof total system aboveground biomass, 26-31% underhigh light, Under moderate light reduction andenriched conditions, epiphyte biomass contributedmore {52% ! to total system biomass than didVallisneria. This may have heen responsible forthe inconsistent results of nutrient enrichment at the
intermediate hght level versus the significantenhancement of total system production at the othertwo light levels. Under ambient nutrient con-centrations and moderate light, and under both highshading treatments, epiphytes contributed onlyabout 10% to total system biomass. Includingepiphyte biomass as a covariate did not change thcresults of the I]ux rate ANOVA's,
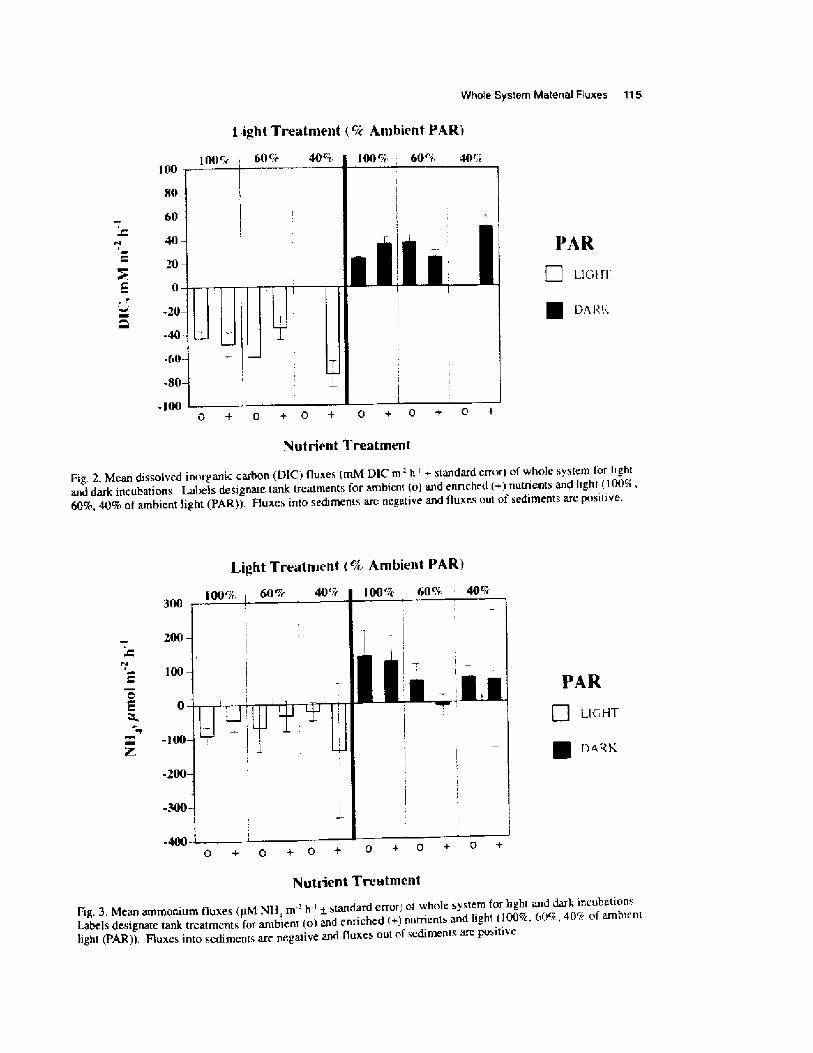
Whole System Material Fluxes 115
1.ight Treatment cia Ambient PAR!
60
%0
-10
-60
-80
Fig. 2. Mean dissolved inorganic carbon DIC! fluxes rnM DIC m ' -h ' + standard error! of whole system for lightand dark incuhations, Labels designate tank treatments for ambient o! and enriched +! nutrients and light ! 0 ! A,60%, 40% of ambient light PAR!!. Fluxes into sediments are negative and fluxes out of sediments are positive.
Light Treatment % Ambient PAR!
Ll CiHT
g D.a.a!
0 + 0 + 0 +
Nutrient Treatment
I ig. 3. Mean ammonium fluxes !tM ."41 $, m -' h' + standard error! of whole system for hghi and darl; incuhationsLabels designate tank treatments for ambiern o! and enriched +! norrients and light �0%, 60%, 40% of ambienthght PAR!!, Boxes into sediments are negative and fluxes out of sediments are positive.
200
t100
00
Z -100
0 + 0 + 0 + 0 + 0 + 0 +
hlutrient Treatment

115 Boustany and Rizzo
Light Treatlnetlt % Ambient PARI
PAR
Ll il I I'
DARY
Fig. 4. Mean phosphate fluxes ItM PO, m ' -h ' + standard error! of whole system for hght and dark incuhadons.Labels designate tank treatmems for ambient o I and enriched +! nutrtents and light �0%, 60%, 40% of ambientlight PAR!!. Flu xes into sediments are negative and Iuxes out of sediments are positive.
Light Treatment % Ambient PAR!
150
PAR
I .I ! O'I'
IMRk
- l 00
-la00 + i» s C +
Nutrient Treatment
Fig. 5 Mean nitrate+nitrite fluxes !tf»»»I h»0 m -' h ' + standard error! of whole system for light and dark incuhations.Labels designate tank treatments for ambient p! and enriched +! nutrients and light ! 00%. 60%, 40% of ant bi cothght PAR!!. Fluxes into sedimems are negative and fluxes out of sediments are positive.
140
40E C-60
- I 60
l00
C00t
0
0-%0
0 + Q + 0 + 0 + 0 + 0 +
Nutrient Treatment

Whale System Materrel Fluxes 117
Light Treatment % Amhient Pkk!
70
cpC
40
3p
ppjv
Ambient t;ttriched Ambient Kttrtt;hqd Attthtunt I tttScttv
lV tttrient Treatment
Fig. 6. Pcccnr of total system aboveground biomass + standard error! consisting af cpi phyres for nutrient and lighttreatmcnls.
DISCUSSION
Fffeets of Experimerttal hatjrtents
In such a strongly autotrophic system, the lackof treatment effects On nutrient fluxes wassurprising. We expected to sec some autotrophicimpacts on nutrient fluxes as a result of both foliaruptake and forcing nutrients into the sediments by
We expected increased productivity as a resultof nutrient enrichment, as in the high and low lighttreatments, given the low ambient nutrientconcentrations in this system. The depression ofnct production at the intermediate light level isprobably due in part to the heavy epiphytc load.Macrophyte photosynthesis is frequently limited byDIC diffusion through the leat'-water boundary, and/or by competition with phytoplankton f Sand-3ensenand Borum 1991!, effects which would beexacerbated by a thick epiphyte layer. Heavyfouling can also severely limit light penetration tothe leaf surface Twiliey et al. 19g5!, an effectprobably overridden in this experiment at the highlight le vel. Jt is possible that actua.! light penetrationto the leaf tissue in our enriched intermediate lighttreatment could have actually been lower than inthe 60% reduction treatment, though we could notmake that determination. Shading effects wouldhave to be severe to induce light limitation in
1'atlisrteria, which acclimates well to low lightconditions Twilley and Barko 199 !h A number ofearlier studies have shown significanl increases inepiphytc biomass at high nutrient concentrations,to the detrirncnt of the macrophytc hosts Phi lips etal. 1978; Borum and Wium-Anderscn 1980: Tw illeyet al. 1985; Jensen and Gibson 1986; Viaroli et al.1996'I. If our Valtisrreria plants were adapted to lowlight there rrray have been photoinhibition withinthe higher light rnesocosrn treatments as evidencedby the highest rate of production at the lowest lightlevel under nutrient enrichment, The impairmenttrf photosynthesi ~ hy super-saturating lighlintensities photoinhibition! is well documented Lurid 92965; Tailing 1971; Vymaza! 1995!. Giventhe high ambient light in the greenhouse, the shadinglevels may have acted to facilitate pr otcclion to plantphotosysterns rather than impose light limitation.

116 Boustany and Aizzo
Consparison of Material Fluxes withOther Studies
Thc rclativc contributions of primaryproducers to the metabolism of SAV communitiesare shown in Table 2. These studies encotnpass hugediffcrcnccs in»cale, species and environment, an�con»cqucntly show great variability atnongcomrnunitie» of SAV. Generally, sediments andepiphytcs make a greater contribution to total system
Table 2. Relative coutributiou of autotrephic components to total system primary production %!.
Scale Plants I:.pip hytcs Sediments Phytoplankton
Mississtppi Sound'
indian R iver'
Annual 24
21Sp<Su
Quar cr
Quarter
Fall
Tampa Bay'
indian Rtvcr'
17 1015
72
Dravuni 1»land. Figi'.
Tcrmmo» Lagoon'
Marion Lake'
25
30Annual
Annual
Anno«1
Annual
Annual
Annual
65
53o4«
Chc». Bay - /~istcr«'
Ches. Bay - Ruppta'
Grevel ingen � i~ster«'
15
26
24 38
55Veer»e Mecr � L' I va"
Present Study
«Plan » + Fpiphyte»
17«
Su 87
'Daehnick et al. 1992
-Heffernan k Gib»on 1983
'Jensen k Gibson l986
'Pollard k Kogure 1 993
»D«y et al. 1982"Hargrave 1969'Murray k. Wetzel 1987"Nienhuis 1993
creating a favorable conccntrat!on gradient by plantuptake in thc root anne Wigand et al. 1997!.Although these pr mcs»cs arc probably occurring,other microbial and physical pmccsscs apparentlydominated material exch«nges in this.system underall experimental condition», Secondarily, there mayhave been an epiphytc in eraction, since nutricn fluxcs, particu larly in D1C, NH,. and PO,, were alsoconsistently low in thc intcrmcdiatc ligh trcatments second only to thc low ligh and low nutrienttrcatmcnt!, in both light and dark incuhations.Finally, even in cnr chcd treatmcn s, nutrientconcentration» werc usually very low because ofrapid up akc of thc nutricn addi ion» and werc veryoften reduced to near detection lim>ts by thc timeeach»uh»cqucnt addi ion was made. Const uently,replica c variability increases, «nd that fact coupledwith vanabihty induced by proccsse.s wt'thin thecores, probahly contributed to such high variabilityin the calculated flux rates that significantdifferences could not bc shown.
One obvious result of the impact of SAVautotrophy vn material fluxcs was evident in themagnitude of the fluxes. Fluxes of all constituentswere an ordct of magnitude greater than fluxes fromunvegctatcd sediments Rizzo and Boustany, thisvolume!. Presumably these higher flux valuesreflect thc high metabolic capacity of the sy.stern, acomb>natton of rnacrophyttc product>vtty andcoupled heterotrophic response, and possiblyenhanced exch«nges frotn the presence of asubstantial rhir os pherc.

Whole System h/latenal =luxes 119
The cotnparisons of nutrient fluxes Table 3!are even more variab!e than oxygen fluxes and thereare fewer studies. The variability of nutrient fluxcsand relative contributions of autotrophic corn-
Table 3. Comparison of literature on relative contribution of autotrophic components to nutrientfluxes.
NutrientSediments*Whole System*
PO,Indian River' � Spring
Ria Forrnosa' - Annua!
0.04 to 0.09
522 to 761
47 to 96
-44 to 96
906 to 911
SiO,
NO,
New Caledonia-'- Summer
This Study - Surnnter
-�
-22 to 138 light!
-9 to 138 dark!
-45 to -234 light!
12 to 126 dark!
-62 to -17 !ight!
-7 to 121 dark!
po,
NO
"All va! ues p,mo! m-2 h-1'7immetman et al. 1985. Theoretical diffusive flux. Halodule vvrighrii. Range O' 1 site.'I'a!cao 2 Vale. 1990, Zosrera sp. Range multiple sites.'Boucher et al. 1994. S pecies not given. Mud sediments.
productivity, up to 50Vr, than wc found ! O'er!,Since rates of benthic rnicroa!ga! net productionwere as high as many other sediment rnicroaigalsystems Rizzo et. al. 1996!, our low va!uc may haveresulted from lack of inc!usion of seasonality in ourassessrncnt. In our study, benthic production wa»cotnparcd to total system productivity only at theseasonal peak biomass of Vallisneria, and thereforerepresents a minimum contribution rather than atypical one. Thc particular growth and decompo-sition patterns of inacrophyte species result intremendous seasonal changes in the magnitude anddirection of oxygen and nutrient fluxes Viaro!i etal. 1996!.
ponents are probably a result of differences bet w ccrisystems, especially regarding species ol dominantinacrophyte, and of the rc!ativc importance o othermicrobial processes withi~ those systems. lnparticular, flux.es of NH, and NO are affected bynitrification and denitrification, which cari 1 cexpected to vary strollg!y aIHong systems 111response to environincntal differences such asoxygen concentration, salinity. light pcnctrat ion intosediments, sulfide concentrations, and othervariables Risgaard-Pctersen ct al. 1994!. Q'hi!cmost studies show much greater whole systemnutrient fluxes compared to unvcgctatcd sediments Table 2k there is often very little difference in NOfluxes between who lc system and sedirncnts Fa! caoand Vale 1990, this study!. This differcricc riiightbe exp!ained by a preference for ammonium as anitrogen source for scagrasses Mori arity and Boon1989!.
0.004 to 0.03 ! 0-33~ii !
-58 to 121 ntax. �-23~<!
-5 to 25 inax. 26-398%!
-25 to -175 �6-398%!
0 to 566 �-62%!
-34 to 29 max, 200%!
-4 to 66 �-189<!
-28 to 18 �'3-3! iis!
-18 to 8 8-40'k !
-8 to 10 tnax, 8 83% !
-3 to 29 �-19~4!
-80 to -1 �4-1143'ir !

120 Boustany and Rizzo
Although macrophytes may be the dominantsnuctural feature in an SAV cominunity, the relativecontribution of macrophytes to total systemproduction is highly variable. Suntmer primaryproduction by Vallisneria aniericana from LakePontchartrain is dominated by the macrophytecomponent and is equivalent to we11-developedseagrass systems Dunton and Tomasko 1994!. Thissystem responded to nutrient enrichment but not tolight reduction. The lack of significant treatmenteflects on nutrient fluxes suggests that nutrientfluxes in this system are not as strongly coupled tooxygen dynamics as in other systems i.e., tooxygenic photosynthesis and aerobic respiration!and underscores the need to assess tnicrobially-mediated processes in these systems as well.However, part of the observed responses may havebeen due to cpiphyte/rnacrophyte interactions,underscoring the need to account for changes in allautotrophic co mp o nent s w hen evaluating theultimate effecLs of eutrophication on these systems.For example, Jcnson and Gibson �986! comparedthree different SAV cornrnunities representing arange of nutrient regimes and varying degrees ofhuman aCtiVity and impactS. By COtnpariSOn tn astudy by P<Imeroy �960! two decades earlier, theyfound that in high nutrient environments there wasa shit in the production base from seagrassdominance to phytoplankton. They also found thaiin two of thc three species studied, the percentageof standing stock biomass consisting of epiphytesranged frotn 1.9 to 2,5 tiines greater under highnutrient condition~ than at the low nutrient site.Also, the relative contribution of seagrasses to totalsystem production was diminished at the highnutrient sites. In our study, the occurrence of ahigher percentage of epiphyte biomass as a resultof' nutrient enrichment may be indicative of a shiftin the relative importance of the macrophytecomponent in the SAV community towards the algalcomponent. Moreover, this tnay be symptomaticof changes in community strucrure as well as localnutrient dynamics. Early detection of such shiftsalong with prudent v'ater quality information couldserve as an effective tool for predicting impendingSAV stress and decline, Therefore, a betterunderstanding of the relative contribution of thedifferent autotrophic components of this SAVcommunity to material f1uxes appears necessary to
effectively predict the response ol the communityto c hanges in the light and nutrient environment.
ACKNOWLEDGMENTS
The authors would like to thank Dr. Hilary Neckles,for her assistance throughout all aspects of this study.We also thank Martha Griffis and David Meaux for
coordinating and maintaining all fi e1d andgreenhouse operat.ions for this project, DarrenJohnson ptovided statistical assistance and review-
LITERATURE CITED
BoRI~M, J. ARn S, Wiulvl-A~»r;RSOR. 1980. BiOmaSS
and production of epiphytes on eelgrass Zosrera marina L.! in the Oresund, Denmark,Ophelia. Suppl, I:57-64.
BoucHt-;R, G., J, CLAYIER, A'ND C. GARRIGI;i.. 1994.Estimation of bottom ammonium in the New
Caledonia lagoon. Coral Reefs 13;13-19.COILMIER, E. S., J. SBEEHAR, M. B. FLEMiNG, Avu A,
HtsiwIGIIs. 1994, Louisiana water qualitydata summary 1992-1993. Louisiana Dept, ofEnvironinental Quality, Office of WaterResources. Baton Rouge, LA,
DAI-IIRI K, A. E., M. J. Si;LI.IVAts AsIo, C. A.M<»c RI:n:I . 1992. Primary prOduCtion Of thesand microflora in seagrass beds of MississippiSound. Botariica Irfari na 35; 131-139.
DAVIs, G.J. ANI> M.M. BRIs:son, 1983. TrendS insubmersed macrophyte communities of theCurrituck Sound: 1909-1979. Journal ofAquatic Plant hfanagemenn 21:83-87,
DAY, !. W.. R. H. DAv, M, T. BARRt-:IRo, F, Lnv-Lou,Aiu C. J. MAooER. 1982. Primary productionin the Laguna dc Terrninos, a tropical estuaryin the South Gulf of Mexico. p. 269-276. InOceanologica. Acta. Proceedings Interna-tional Syinposium on Coastal Lagoons,Bordeaux, France, 8-14 September, 1981.
DL ~Os, K, H. ASO D, A. TOMAsxu. 1994. In Situphotosynthesis in the seagrass Haloduleivrightii in a hypersaline subtropical lagoon.Marine Fcr>logy Progress Series 107:281-293.
Ei i:-I tLRILs, L. N. 1987. Seagras» ecology alongthe coasts of Alabatna. Louisiana. andlvlississippi, p. 11-24. In M. J. Durako, R, C.Fhillips, and R. R. Lewis III eds.!,

Whole System Matenal Fluxes 12t
Proceedings of thc symposium on subtropical-tropical scagrasses of thc southeastern 1.JnitedStates. Florida Marine Research Publication.lsio. 42,
FALcAo, M. Axri C. vALt:. 1990 Study of the Ria1-ormosa ecosystem: Benthic nut.ricnt re-mincralizion and tidal variability ot nutrientsin he water. Hyrlrobiofogia 207: 137-146.
HARoRAv E, B.T. 1969. Epi benthic algal productionand community respiration in the sedimentsof Marion Lake. Journo of the FisheriesResearr h Board of' Canada 26;2003-2026,
HEPPERvAv, J. J. Avn R. A. GtttSOV. 1983. A COm-parison of primary prtxluction rates in indianRiver, Florida seagrass systems. FloridaScientist 46;286-295.
Jt:.vsEK, P. R. Avu R, A. GtttSOi. 1986. Primaryproduction in three subtropical seagrass com-inunities: a cotnparison of four autotrophiccomponents. Florida Scientist 49:129-141.
KexwoarttY, W. J. AVO D. E, HAt.'vERT edS!, 1990.The light requirements of seagrasses; Pro-ceedings of a workshop to examine thecapability of water quality criteria, standardsand monitoring progratns to protect seagrasses.NOAA Technical Metnorandum NMFS-SEFC-287.
Lrv iS, R. R., M. J. DuRAKO, M. D. MoHaER, AvnR.C. Piiii t.tr s, 1985. Seagrass tneadows ofTampa Bay - a review, p, 210-246, In S. F.Treat, J. L. Simon, R, R. Lewis 111. R. L,Whitman, Jr. eds,!, Proceedings, Tampa BayArea Scientific Information Symposium,Florida Marine Research Publication. No, 6S.
Ltvr.'OSTois, R. J. 1987. Historic trendS of humanimpacts on seagrass meadow» in Horida. p.139-15 L In M. J. Durako, R, C. Philips, andR. R, Lewis 111 eds.!, Proceedings of thesymposium on subtropical-tropical seagrassesof the southeastern United States. FloridaMarine Research Publication. No. 42,
Luau, J.W. 1965. The ecology of the freshwaterphytoplankton. Biological Reui eiv. 40:231,
MORtARITY. D. J. W. Avo R. J. Boov. 1989.interactions of seagrasses with sediment andwater. In A. W. D. Larkum, A. J. McComb,S.A. Shepherd eds.!. Biology of Seagrasses.Aquatic plant studies 2. Elsevier, Amsterdam,New York.
MORRts, L.J, Av» D A.TostAsxo eds.!. 1993Proceedings and Conclusions ot Workshopson: Submerged Aquatic Vegetation andPhotosynthetically Active Radiation. SpecialPublication SJ93-SP13. Palatka, FL: St. JohnsRiver Water Management District.
MtiRRAY, L. Awt> R. L. Wt rxat.. 1987. OXygcnproduction and consumption associated withthe major autotrophic components in tv iitemperate seagrass coinmunities. MarineEcology Progress Seri es 3b:231-239.
NEcxt.Es, H,A. Ed.!. 1994. indicator development;seagrass monitoring and research in the Gultof Mexico. USFPA Office of Research andDevelopment, Environmental ResearchLaboratory. Gulf Breeze, FL. EPA/620/R-94/029,
NtENttt.ts, P. H. 1993. Nutrient cycling andfoodwcbs in Dutch estuaries. Hydrohiologta.265: 1544.
PHtLtPS, G, L, D, EMINsov, Avn B. Moss. 1978. Amechanism to account for rnacrophyte declinein progressively eutrophicated freshwaters,ArIuatic Botany 4:103-126.
PoLLARn, C. P. AND K. Koot RE. 1993. The role ofepiphytic and epibenthic algal productivity ina tropical seagrass, Syringodium isoerifoliunr Aschers.! Dandy, cornrnunity. AustralianJournal of hfarine and Freshivater Research44: 141-154.
PoMERoY, L. R. 1960. Primary production of BocaCiega Bay. Florida. Bulletin ofMarine Scienceof the Gulf and Caribbean ]0:1-10.
PuLtctt, W. M. Axo W, A. WttrtE, 1991. Decline ofsubmerged vegetatio~ in the Galveston Baysystem: Chronolog y and relationships to phy s-ical processes, Hourrtal of Coastal A'esear<-h7: 1125-1138.
RYBicxi, N.B, AND V. CARTER. 1986. Resurgence ofsubmersed aquatic rnacroph>zes in the tidalPotoinac River. Maryland, Virginia, and theDistrict of Columbia. Estuaries 9:368-39S.
RtsOAARD-PETFRSttv. X.. S. RYSGAARD. L. P, NID-SE-Avn N. P. REvsaacn. 1994. Diurnal variationof denitrification and nitrificiation in se"i-ments colonized hy benthic inicrophytes-Limnology and Oceanography 39' S73- S79.
122 Boustany and Rizzo
RtzzO, W. M�S. K, DAII.EY, Ci, J. LAcrtav, R, R.CHRIsTIAN. B. E. BERRY, ANI3 R, L. Wt-:rZEL.
Metabolistn-based trophic index forcomparing the ecological values of shallow-water sediment habitats. EsrrrarI'es 19:247-
256.
SAND-JEr SFss, K. AND J, BoatIst. 1991, interactions
among phytoplankton, periphyton, and Inacro-phytes in temperate freshwaters and estuaries.Aquatic Boranv 41: 137-175,
sMART, R. M AND 3. W. BARxo. ]985 Laboratoryculture of submersed freshwater rnacrophytesin natural sediments. AqrraricBIrtarI> 21:251-263.
STANDI:v, D. W. 1992. Historical Trends: Water
Quality and Fisherics, Galveston Bay. Univer-si y of North Carolina Sea Grant CollegeProgram Publication UNC'-SG-92-03. Insti-tute for Coastal and Marine Resources, EastCarolina University, Greenville, NC,
STEI LER, D.L, 1985, Production and nitrogendynamics of a Valli.cneria americana grass bedin Lake Pontchartrain, LA. Ph.D. Dissertation.Louisiana State University, Baton Rouge,Lou i sian a.
STDI.T, J.P. ! 990. Estuarine habitats. Pp. 63-88. InlVlobi!c Bay: Issues. resources, status, andmanagement. NOAA Estuary-of-thc-monthSeminar Scric» No, 15, Alabama Marine
I'.nvironrncntal Science Consortium. Tech-
nology Rcport No. 894X! l.TAEIux i, J.F. 1 97 1. The underwater hght clitnate as
a controlling factor in thc production ecologyof freshwater phytoplankton. Mire Internat.Vi'rein. I.imnaI. 19:214.
TI'RNI:R, R. E., R, M. DARut-t.i., AND J, Boyn. 198O,
Changes in thc submerged macrophytes ofLake Pontchartrain Louisiana!: 1954-1973,%or!beast GuIf Science 4:44-49,
Two EEY, R. R. AND J,w. BARxII. 1990. The growthof submersed rnuvophytcs under experitnentalsalinity and light conditions. F sruaries l 3:311-321.
TwILLEY, R, R�IVv M- KI-ssF, K W. STAvER, J, C,STEvENSON. ANO W. R BOYRTON, 1985,Nutrient enriChtnent Of eStuarine subtnersed
vascular plant communitics. 1. Algal growtheffect~ on production of' plants and associatedcommun ities. Afarine Ecology ProgressSeri es 23: 1 79-19 1-
VIARDEI, P�M. BARTDI I, C. BDNDAvALI.I, R. R,CHRISTIAN, G. GIDRl!AsII, AND M. N ADDI. 1996.Macrophytc communities and their impact onbenthic fluxes of oxygen, sulphide and nutri-ents in shallow eutophic environrncnts.II vdrvrbi ologi a 329: 105-119,
Vvst A7wL, J. 1995. Algae and clcrnental cycling inwetlands. Lewis Publishers, Boca Raton, FL.
WIOAND, C., J. C. STrvENSDN, AN» J. C. CORNwELL.
1997. Effects of diocrcnt subrnerscd Inaczo-
phytes on sediment biogeochemistry. Aquatic8 >tanv 56:233-244.
ZIEMAN, J. C. AND R. T, 7H:MAN. 1989. The ecologyof seagrass meadows of the west coast ofFlorida: A community profile. U.S. Fish andWildl. Serv. Biol. Rep. 85�.25!.
ZIMM1..RsIAN, C. R., J. R, MONTOoMFRY, ANn F. R.
CARI SIIN. 1985. Variability Of diSSOlved re-active phosphate flux rates in nearshoreestuarine sediment~: Effects of groundWaterflow. Fsrrrari es 8:228-236.