water quality in kvernabekken and grimstadpollen, · pdf filewater quality in kvernabekken and...
TRANSCRIPT

Water Quality in Kvernabekken and
Grimstadpollen, Bergen
Group 7
Åshild Idsø, Bård Aarbakke, Yong Lao, Veronica Madsen
University of Bergen
Department of Biology
BIO300
12 January 2015

Grimstadpollen 2014
1
BIO300 UiB Group 7: Åshild Idsø, Bård Aarbakke, Yong Lao, Veronica Madsen
CONTENTS
1 INTRODUCTION ................................................................................................................................ 2
1.1 AIMS OF THIS STUDY ............................................................................................................... 5
2 MATERIALS AND METHODS .......................................................................................................... 6
2.1 SAMPLING SITES ....................................................................................................................... 6
2.1.1 SITE DISCRIPTION ................................................................................................................. 7
2.2 SAMPLES AND MEASUREMENTS ........................................................................................... 8
2.2.1 GENERAL OVERVIEW ........................................................................................................ 8
2.2.2 TEMPERATURE, OXYGEN, CONDUCTIVITY AND PH ................................................... 9
2.2.3 THERMOTOLERANT COLIFORM BACTERIA ................................................................. 10
2.2.4 PHOSPHORUS ................................................................................................................... 10
2.2.5 BIODIVERSITY ................................................................................................................... 11
2.3 STATISTICAL METHODS ......................................................................................................... 12
3 RESULTS ........................................................................................................................................... 13
3.1 TEMPERATURE, OXYGEN, CONDUCTIVITY AND PH ......................................................... 13
3.2 COLIFORM BACTERIA ............................................................................................................. 14
3.4 PHOSPHORUS .......................................................................................................................... 17
3.5 BIODIVERSITY .......................................................................................................................... 19
4 DISCUSSION .................................................................................................................................... 21
4.1 CONCLUSION ........................................................................................................................... 24
4.2 RECOMMENDATIONS ............................................................................................................. 25
4.3 ACKNOWLEDGEMENTS ............................................................................................................... 25
REFERENCES ....................................................................................................................................... 26
APPENDIX A ........................................................................................................................................ 30
APPENDIX B ........................................................................................................................................ 32

Grimstadpollen 2014
2
BIO300 UiB Group 7: Åshild Idsø, Bård Aarbakke, Yong Lao, Veronica Madsen
1 INTRODUCTION
The coastline is an interface between water and land, and developed seacoasts represent key regions
where the sustainability of natural ecosystems may be compromised (Mallin et al., 2000). We come
in contact with the seawater through different means, including recreational purposes like
swimming, boat traffic and fishing. In developed areas along the coast of Norway the water we come
in contact with will be affected by the increasing coastal population. Long-term observations of such
areas have shown that the cumulative impact of land use change result in an increase of direct runoff
(Davies et al., 2008, Haase, 2009) which causes floral and faunal changes and physical alternation of
the environment. Runoff can come from point sources of pollution, including outlet points from
wastewater treatment plants (WWTP) (Lovdata, 2012), as well as non-point runoff from the
environment (Vinten et al., 2004). Wastewater from urban and suburban areas contains pathogenic
organisms of human and animal origin, and if wastewater remains untreated or receives poor
treatment, people may ingest pathogens directly or the pathogens may infect marine and aquatic
species utilized for human consumption (Liberti & Notarnicola, 2003). Development can therefore
pose as a human health risk through the contact we have with these water bodies. To protect the
marine and aquatic ecosystems as well as human health, water quality standards are established to
regulate the quality of the water. Water quality of different water bodies is classified depending on
the intended use, ecosystem like recreational use or drinking water, in addition to be an indicator of
the state of the ecosystem (EPA, 2011). Local authorities in Norway have the responsibility to
monitor the water quality for recreational use (Folkehelseintituttet, 2000). How sensitive an area is
to pollution and eutrophication for instance is categorized by Norwegian law as sensitive, less
sensitive and normal. In Norway, the coastline between the southern Swedish border and Lindesnes,
and Grimstadfjorden are areas considered sensitive (Lovdata, 2012).
Grimstadfjorden is located in Bergen Municipality, where the Agency of Water and Sewage Works (a
sub-division of Bergen Municipality) is responsible for monitoring and regulation of the water quality
in the region (Bergen Kommune, n.d; Sørfonn, 2014). BIO300-students from the University of Bergen
take part in an on-going project to gather data and perform analysis for the Municipality, regarding
the quality of local water bodies. Grimstadpollen is a coastal watershed connected to
Grimstadfjorden, located in an area surrounded by settlement.
Wastewater in Norway is usually connected to public sewage pipes, which leads to larger treatment
plants. In rural or geologically demanding areas without a public sewage system, households have to

Grimstadpollen 2014
3
BIO300 UiB Group 7: Åshild Idsø, Bård Aarbakke, Yong Lao, Veronica Madsen
use alternative methods for disposal. In this case the households are connected to private mini
WWTPs to clean effluent water before it is directly released into the environment through an outlet
point. The company Goodtech delivers around 90 % of the mini WWTPs in Norway, and their most
common product is called Biovac® mini WWTP, which is used to clean wastewater for up to a
maximum of 7 households (35 pe) (Goodtech, 2011). This WWTP utilize a biological and chemical
procedure which Goodtech (2011) call the “active sludge method” steps in the refinement of the
wastewater to remove phosphorus and biological material before it is released (Avløpsgruppen,
2011). These plants are on SINTEF’s (Stiftelsen for Industriell og Teknisk Forskning ved NTH) list of
approved mini WWTPs, and the efficiency of the plants is well within the government regulation
stating that the level of phosphorus and biological material should be reduced by minimum 90
percent. There are no regulations on the amount of bacteria released, but mini treatment plants are
reducing bacteria levels with around 50% (A. Totland at Bergen Municipality, Pers. Comm. 26.09.14).
The households of Grimstad utilize the Biovac® mini WWTP to clean wastewater before it is released
into local streams, such as Høgstølbekken and Kvernabekken, and the bay of Grimstadpollen (see
Figure A.1, Appendix A). These locations have been monitored previously (2007, 2008, 2010, 2012) to
determine the water quality of both the stream (Liland et al., 2010; Hitchcock et al., 2012) and the
bay (Austad et al., 2007; Bernardes et al., 2008; Aryal et al., 2010) to see if the water in this area is
safe for recreational use. All previous studies have focused on phosphorus and coliform bacteria
levels in estimating the water quality, as well as the faunal composition visible through biodiversity
indices. Other abiotic factors are also included, like pH, temperature and salinity.
Changes in pH and temperature due to anthropogenic activities, could negatively influence survival
growth of plants and animals (Bronmark & Hansson, 2005), and should therefore be monitored. With
lower temperatures, more O2 will be dissolved in the water and the density of the water increase.
The pH levels are affected by temperature, due to more H2O-molecules being formed instead of
existing as free H+ and OH- ions with rising temperature (Kemker, 2014). High pH levels are also an
indication of high photosynthetic activities, which may occur due to algae blooms which are usually a
consequence of runoff of nutrients such as phosphorus (Andersen et al., 1997). Phosphorus is the
building block of cell membranes and nucleotides, and is incredibly important for the formation of
plankton. It is a macro nutrient, and is very important for the maintenance of aquatic ecosystems
(Thingstad, 2013). Increased phosphorus concentration increases the biological activity, which in turn
increases the O2 consumption. Higher concentration of phosphorus in the water causes an increase
in algae production – especially diatoms (Thingstad, 2013). Phosphorus is used as a parameter for

Grimstadpollen 2014
4
BIO300 UiB Group 7: Åshild Idsø, Bård Aarbakke, Yong Lao, Veronica Madsen
water quality mainly because it may reflect risk of increased production of problem algae that can
cause odour/taste problems and possible toxic production in lakes (Andersen et al., 2007). Effluent
water from households leads to this increased phosphorus concentration, and when these species
increase in numbers, the availability of oxygen needed for formation of cell material decreases. This
will lead to an increased competition between organisms, and could reduce biodiversity.
In suburban areas such as Grimstad, agriculture and urban activities are major sources of phosphorus
contamination in aquatic ecosystems, as well as microorganisms (Carpenter et al., 1998). Runoff from
e.g. chemical and biological (manure) fertilizers can become nonpoint sources of pollution during
rainfall events (Vinten et al., 2004). Nonpoint inputs, compared to discharges from point sources, are
difficult to monitor because the sources are often dispersed over large areas, as well as being more
prone to irregular events such as change in agricultural activities and heavy precipitation (Carpenter
et al., 1998). High turbidity, due to both rainfall and/or tidal influx and outflux, can cause
resuspension of bottom sediments which may contribute to increased levels of microorganisms
(Kistemann et al., 2002; Francy et al., 2003) and most likely phosphorus concentrations. Water
polluted by microorganisms from animal wastes has a high impact on marine ecosystems especially
in coastal areas close to urban settlements (Kärnä, 2010). This affects the public health through e.g.
recreational activities and indirect ingestions of contaminated food (Okeke et al., 2011; Liu and
Huang, 2012; Kärnä et al., 2010). Typically the microorganisms are of faecal origin (living in the
intestines of warm blooded animals), which contaminates the water through different routes like e.g.
untreated- or partly treated wastewater from domestic, agricultural and industrial runoff (Okeke et
al., 2011). Since microorganisms are relatively difficult to identify, faecal thermotolerant coliform
bacteria (TCB), which is a Gram-negative rod-shaped bacteria (Haller et al., 2009), are often used as
an indicator organisms to monitor water quality (Okeke et al., 2011; Liu & Huang, 2012). This is
consistent with the parameter selection in the EU directive for the quality of bathing water
(Folkehelseinstituttet, 2000).
Biodiversity is another good indicator of the health and functioning of ecosystems. Low biodiversity
in aquatic environments often correlates with bad water quality (Houlahan and Findlay, 2003). A
bottom sediment sample in an aquatic ecosystem provides information about water quality, simply
by looking at species composition and their taxonomic levels. Different taxa have different
tolerances of water quality. Some species are highly tolerant of bad water quality (worms and snails),
while others are sensitive (stoneflies and dragonflies), and their presence could therefore indicate
good water quality. Three different indices will be used in this study: BMWP (biological quality), ASPT

Grimstadpollen 2014
5
BIO300 UiB Group 7: Åshild Idsø, Bård Aarbakke, Yong Lao, Veronica Madsen
(water quality) and the Shannon index (biodiversity), as described in biodiversity lab notes. They will
be used to give an overview over the general biodiversity, biological pollutant tolerance and the
water quality in term of the taxa. It is important to note that Grimstadpollen is part of the critical
transition zone (CTZ) between landmasses and full strength seawater, and should therefore be
associated with low biodiversity (Levin et al. 2001). The increase in salinity from the stream to the
sea contributes to lowering the biodiversity (Miller, 2013). Runoff of toxins from urban activities,
including airports such as Flesland which is located close to the area in question, might also have an
effect on biodiversity (Corsi et al., 2008). These factors were not taken into account in this study.
1.1 AIMS OF THIS STUDY
Both point and nonpoint sources of pollution can cause problems in aquatic ecosystems. This can be
eutrophication due to increased levels of phosphorus, loss of oxygen, increased levels of fecal
microorganisms and loss of biodiversity (Carpenter et al., 1998). Consequently, there is a need to
monitor and protect natural resources of water to prevent the spread of pathogenic agents that may
form, to maintain public health and protect the marine ecosystems (Sidhu & Toze, 2009).
The purpose of this study is to determine the effect of Wastewater treatment plants (WWTP) on the
water quality in Grimstadpollen and Kvernabekken. Concentrations of E. coli and phosphorus were
measured, as well as temperature, oxygen and pH. Finally, sediment samples were taken in order to
determine biological quality and biodiversity. All of these factors, as well as results from previous
studies, are needed to answer the questions “Is the water quality in Grimstadpollen and the adjacent
stream impacted by effluent water from mini-WWTPs?”, “Has the quality changed over time?” and
“Is the water quality good enough for bathing and recreation?”

Grimstadpollen 2014
6
BIO300 UiB Group 7: Åshild Idsø, Bård Aarbakke, Yong Lao, Veronica Madsen
2 MATERIALS AND METHODS
2.1 SAMPLING SITES
Grimstadpollen is a small brackish bay just north of Flesland Airport in Bergen. This is part of an area
that is classified as sensitive in “forurensningsforskiften” (Lovdata, 2012) which in short is due to the
level of eutrophication (see Figure 2.1). The location is surrounded by buildings and woodland on all
sides, and there are motor boats moored in the deeper end of the bay. A small stream with two
sewage outlets drain into the bay. From personal communication with Bergen Municipality (Bergen
Municipality, Pers. Comm. 26.09.14) it was clarified that there are in total 36 households connected
to seven outlet points most relevant to the total output of sewage in Grimstadpollen (figure 2.2,
Appendix A). These outlets are connected to biological/chemical mini wastewater treatment plants
(WWTPs) made by Biovac® (Biovac®, year unknown). The exact number of WWTPs in the area is not
surveyed, but in Figure 2.2, Appendix A the municipality account for 9 WWTPs. A horse paddock and
some greenhouses are also in the area, which could possibly influence the stream. The inner part of
Grimstadpollen drains almost completely at low tide, with only the stream feeding into it.
Figure 2.1 – Map over the geographic distributions of the different classification of environments in
the south of Norway. Red is the sensitive areas, while pale yellow colour represents normal areas
(Lovdata, 2012).

Grimstadpollen 2014
7
BIO300 UiB Group 7: Åshild Idsø, Bård Aarbakke, Yong Lao, Veronica Madsen
2.1.1 SITE DISCRIPTION
Figure 2.2 - Map of Grimstadpollen and the surrounding area. Red arrows mark sampling sites,
labelled 1-4, and purple diamonds mark the wastewater treatment plants draining into the stream.
The map is a print screen from Google maps, and the markers were added manually using Paint.
SITE 1
The first sample site was located upstream from the WWTP (see Figure 2.2). This was a slow flowing
part of the stream, nestled in the middle of a wooded area next to a gravelled road with construction
traffic on a semi-regular basis. The sediment was muddy, and the banks were slightly rocky over the
about 1 meter wide stream.
SITE 2
The second site sampled was near the mouth of the creek, downstream from both WWTPs. The
streambed was rocky, but there were small areas with softer sediment. The banks were slightly rocky
and surrounded by trees. A paved road lay adjacent to the stream, leading to a small cluster of
houses. A horse paddock as well as some greenhouses was located upstream of Site 2 and might also
have influenced the water quality.
N
Grimstadpollen 2014
8
BIO300 UiB Group 7: Åshild Idsø, Bård Aarbakke, Yong Lao, Veronica Madsen
SITE 3
The third site sampled was in the inner part of Grimstadpollen. The seabed was sloping very
gradually, and there was a high level of muddy sediments. The east bank was steep, with trees and a
few houses. The paved road from Site 2 continued past Site 3.
SITE 4
The fourth site sampled was in the outer part of Grimstadpollen. The border between the two last
areas (site 3 and 4) was made up of two small islands, and we sampled north of the largest one. The
seabed at this site was also muddy, and the banks were bare rock followed by woods. There were
houses on all three remaining sides of the islands, and motorized boats were moored about 20m
from the sample site.
2.2 SAMPLES AND MEASUREMENTS
2.2.1 GENERAL OVERVIEW
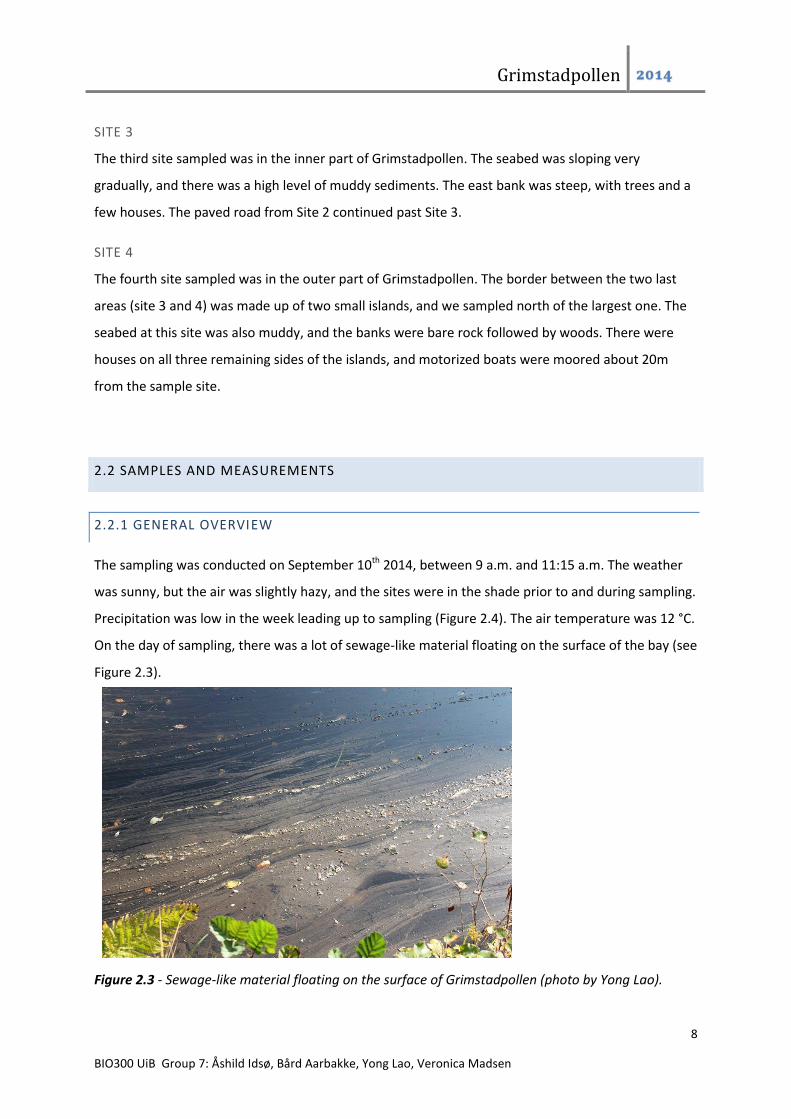
The sampling was conducted on September 10th 2014, between 9 a.m. and 11:15 a.m. The weather
was sunny, but the air was slightly hazy, and the sites were in the shade prior to and during sampling.
Precipitation was low in the week leading up to sampling (Figure 2.4). The air temperature was 12 °C.
On the day of sampling, there was a lot of sewage-like material floating on the surface of the bay (see
Figure 2.3).
Figure 2.3 - Sewage-like material floating on the surface of Grimstadpollen (photo by Yong Lao).

Grimstadpollen 2014
9
BIO300 UiB Group 7: Åshild Idsø, Bård Aarbakke, Yong Lao, Veronica Madsen
Figure 2.4 – Precipitation (mm/day) in the Grimstadpollen area in the week of sampling. Day 0 represents the
day of sampling, while days 1-5 are the days leading up to it. Precipitation in previous studies is compared with
this year’s study. The blue bars show precipitation in 2008, the red in 2010, the green in 2012 and the black in
2014. Data was collected from http://m.yr.no/sted/Norge/Hordaland/Bergen/Bergen/almanakk.html, with
measurements from Florida measuring station in the centre of Bergen. This is the measuring station located
closest to Grimstadpollen.
Physical and chemical factors as well as biodiversity and TCB, were measured at each site. At Site 1
and 2 stream depth, width and water velocity was measured to calculate stream flow. At Site 3 and 4
water samples were collected at two different depths (upper part and middle part of the water
column).
2.2.2 TEMPERATURE, OXYGEN, CONDUCTIVITY AND PH
Temperature and pH was measured in the field using a portable pH-meter (WTW pH 3110 SET 2, 2AA
112), while oxygen saturation levels (%) were measured with a portable oxygen meter. Conductivity
was not measured in the field, due to a malfunction conductivity meter. A water sample from Site 4
was instead brought back to the lab in a 50mL Falcon tube, and analysed there. Salinity levels from
previous studies will be used to present in the result for explanatory reasons.
At each site the instrument was held at a 10-20cm depth until the instrument was stabilized. The
instruments were then rinsed with tap water before it was put to use again.

Grimstadpollen 2014
10
BIO300 UiB Group 7: Åshild Idsø, Bård Aarbakke, Yong Lao, Veronica Madsen
2.2.3 THERMOTOLERANT COLIFORM BACTERIA
Water samples were collected for total coliform bacteria (TCB) analysis from all four sites in 250mL
sterile bottles, with five replicates at each site. At Site 1 and 2, five samples were taken 0.1m below
the water surface. They were collected where the velocity of the water was slowest. At Site 4, two
samples were taken at 0.1m depth, while three were taken at 0.5m depth. Five samples were also
collected from Site 3, but here three of them were from 0.1m depth and two from approximately
0.5m depth. The samples taken at 0.5m were collected using an extension rod. After sampling the
bottles were immediately placed in a cooler and delivered to Bergen Vann KF(komunalt foretak).
The samples were analysed by the membrane filter method (NS ISO 8199, January 2002), and the
value of TCB is counts of colony forming units (CFU). The water quality based on density of coliform
bacteria is classified according to Table 2.1.
Table 2.1 – Classification of condition for coliform bacteria (Andersen et al., 1997;
Folkehelseinstituttet, 2000).
Classification for Coliform
bacteria
Interval (col/100ml) Description for recreational
use
I(/II) <100 Suited
III 100-300 Less suited
IV >1000 Not suited
2.2.4 PHOSPHORUS
Water samples for phosphorus concentration were sampled in 50mL sterile Falcon tubes. Two
replicates were taken at Site 1 and 2, while three samples were taken at Site 3 and 4. At Site 3 two
replicates were taken at 0.10m depth, while one sample was taken at 0.5m depth. At Site 4 two were
collected at about 0.5m depth, while one was collected at 0.1m depth. The samples were collected in
the same manner as the coliform bacteria samples, and kept cold until delivered to Eurofins
Laboratory. The water quality based on phosphorus levels are classified according to Table 2.2.

Grimstadpollen 2014
11
BIO300 UiB Group 7: Åshild Idsø, Bård Aarbakke, Yong Lao, Veronica Madsen
Eurofins processes the samples by the Ammonium molybdate spectrometric Method (ISO
6878:2004), and orthophosphate and total phosphorus contents are determined by flow analysis (FIA
and CFA) (ISO 15681-2:2003) (Eurofins, Pers. Comm. 17.09.14).
Table 2.2 – Classification of condition for phosphate (Andersen et al., 1997; Folkehelseinstituttet,
2000).
Classification for phosphate Interval (µg P/l) Description for recreational
use
I <7 Well suited
II 7-11 Suited
III 11-20 Less suited
IV >20 Not suited
2.2.5 BIODIVERSITY
To determine the fauna in Grimstadpollen, sediment samples were taken by a grab sampler on Site 1,
3 and 4 with one to tree grabs within a 1 Square meter area, in addition to a combination of a shovel
sample and a kick sample at Site 2. The grab samples were sieved in a fine meshed net (200 µm) to
remove most of the water and some fine particles. The samples of the sediments were kept in 250ml
bottles, and later identified in the lab. The grab sampler which was used had the potential to reach
11 cm into the sediments, and had a surface area of 56 cm2. It was dropped from approximately 10
cm above the sediments before the grabbing mechanism was activated by dropping a metal
soldering on the top of the grab sampler.
Site 1: One grab sample was taken from the soft bottom sediments.
Site 2: One kick sample and one shovel sample was taken due to the hard and rocky bottom. The kick
sample was taken in the middle of the stream, where five kicks were used to stir up the sediments
within a period of about 40 seconds. A bucket with a 1mm mesh was placed 0,4m downstream from
the kicking, and was held in the stream for 30 seconds to collect sediments. The shovel sample were
taken by sticking a small garden shovel into the sediments and bend it up, so the whole shovel was

Grimstadpollen 2014
12
BIO300 UiB Group 7: Åshild Idsø, Bård Aarbakke, Yong Lao, Veronica Madsen
full of sediments. For comparative purposes, four shovels were estimated to equal two grabs
(11.2dm3).
Site 3-4: Three grab samples were taken at Site 3, and two in Site 4. All samples were taken within a
1m2 area, and then put in a bucket before the samples were then sieved and kept in 250ml bottles.
In the laboratory the samples were washed in the sink through a sieve, to get rid of the finer
sediments. The remaining animals and sediments were then put in a tray, and a staining powder
(Rose Bengal) was added. Subsequently, stereo microscopes (Wild Heerbrugg, mag 6.4-40×) were
used to find organisms in the samples, which were determined to the lowest possible taxonomical
level. All of the sediments in the samples were examined, except for Site 3. There, a subsample was
used and divided the sediments into eight squares, of which two were examined.
After the organisms were determined to the lowest taxonomical level, the taxonomical values which
were found in a table were used to calculate a numeric diversity value with the Shannon index
(Equation 1). A high H in the Shannon index is a sign of high species diversity.
𝐻′ = − ∑ 𝑝𝑖𝑅𝑖=1 ln 𝑝𝑖 (Equation 1)
Pi = relative abundance in each species (n/N).
In addition, BMWP score (Biological monitoring working party score) and ASPT (average score per
taxon) was used to determine the water quality. BMWP score use the macro invertebrates in the
water as a biological indicator of water quality. Each family of macro invertebrates has a tolerance
score. (Appendix Table A.6) The combined scores of the present family groups is the BWMP score. A
high BWMP score is a sign of high diversity which indicates good water quality. A low score is a sign
of bad water quality. A disadvantage with the BMWP score is that a small sample size is likely to miss
species and give a different score. (Lab handout) The ASPT is a biological indicator which takes the
number of present species into account. (Lab handout) It is calculated with the BMWP score divided
with the number of present species. (Lab handout)
2.3 STATISTICAL METHODS
In this study we are looking at what effect site and depth (categorical explanatory variables) have on
TCB and phosphorus levels; this is an example of a casual relationship. For both the phosphorus and
TCB the samples are assumed to be independent. Since phosphorus concentration (µg P/l) is a
continuous response variable a normal distribution is assumed. A one-Way ANOVA was utilised to

Grimstadpollen 2014
13
BIO300 UiB Group 7: Åshild Idsø, Bård Aarbakke, Yong Lao, Veronica Madsen
analyse the variance in the effect of the two parameters. The distribution of the response variable
TCB is assumed to be Poisson since TCB levels are counts of CFU, therefore general linear model was
used. A Tukey test was further run to see where the largest difference between the sites was for
both phosphorus and TCB. The significant level was set to a p-value > 0.05.
All the results compared with previous results are compared by quantitative methods. Quantitative
description was also used to analyse the difference in phosphorus concentrations at the different
depths, due to the lack of replicates.
3 RESULTS
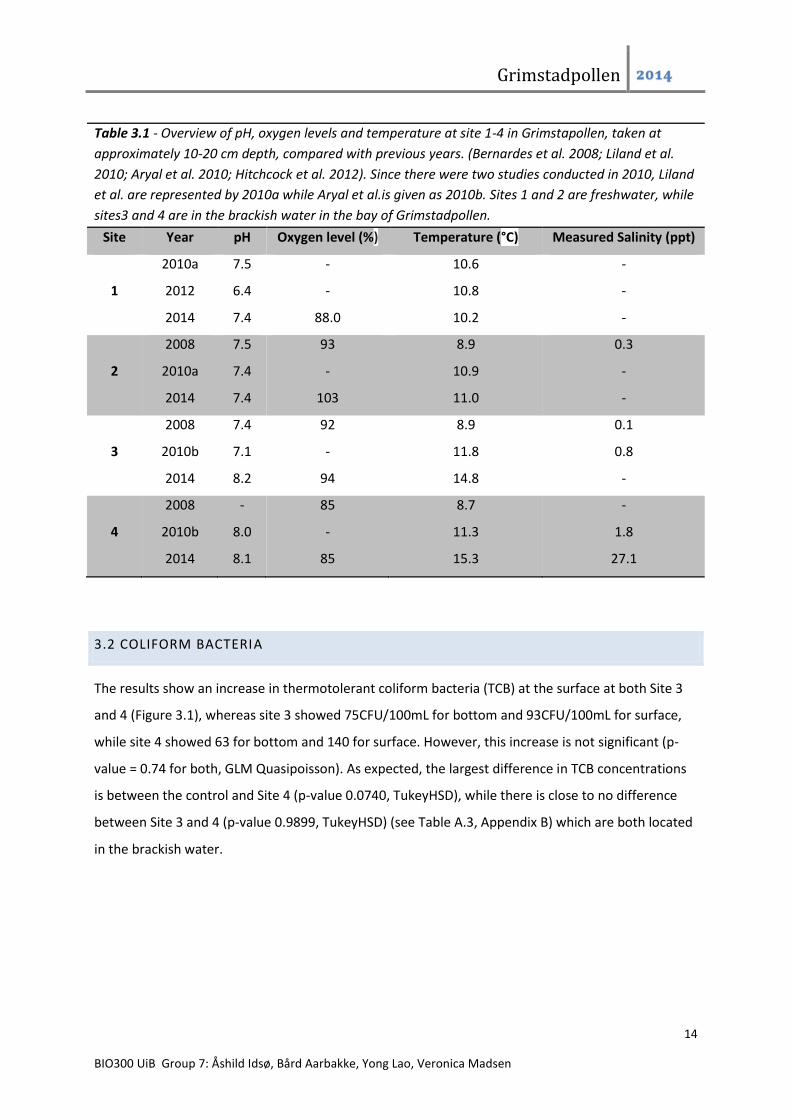
3.1 TEMPERATURE, OXYGEN, CONDUCTIVITY AND PH
Temperature and pH levels were constant within both the stream and bay areas (Table 3.1). There is
however slightly higher values of temperature and pH in the bay area sites compared to the stream
sites. Oxygen levels were highest in the fast-flowing part of the stream, and decreased towards the
bay. Temperatures in the bay areas were 14.8°C and 15.3°C in sites 3 and 4, respectively, and 10.2 °C
and 11.0 °C in sites 1 and 2, respectively. In sites 3 and 4 the pH was 8.2 and 8.1 respectively, while
both site 1 and 2 had a pH of 7.4. Oxygen saturation levels were 88.0 %, 103.0 %, 94.0 % and 85.0 %
for sites 1, 2, 3 and 4, respectively.. Due to a malfunctioning conductivity meter, salinity was only
measured in site 4. The conductivity was 42.6 mS/cm and salinity 27.1 ppt.
Grimstadpollen 2014
14
BIO300 UiB Group 7: Åshild Idsø, Bård Aarbakke, Yong Lao, Veronica Madsen
Table 3.1 - Overview of pH, oxygen levels and temperature at site 1-4 in Grimstapollen, taken at
approximately 10-20 cm depth, compared with previous years. (Bernardes et al. 2008; Liland et al.
2010; Aryal et al. 2010; Hitchcock et al. 2012). Since there were two studies conducted in 2010, Liland
et al. are represented by 2010a while Aryal et al.is given as 2010b. Sites 1 and 2 are freshwater, while
sites3 and 4 are in the brackish water in the bay of Grimstadpollen.
Site Year pH Oxygen level (%) Temperature (°C) Measured Salinity (ppt)
1
2010a
2012
2014
7.5
6.4
7.4
-
-
88.0
10.6
10.8
10.2
-
-
-
2
2008
2010a
2014
7.5
7.4
7.4
93
-
103
8.9
10.9
11.0
0.3
-
-
3
2008
2010b
2014
7.4
7.1
8.2
92
-
94
8.9
11.8
14.8
0.1
0.8
-
4
2008
2010b
2014
-
8.0
8.1
85
-
85
8.7
11.3
15.3
-
1.8
27.1
3.2 COLIFORM BACTERIA
The results show an increase in thermotolerant coliform bacteria (TCB) at the surface at both Site 3
and 4 (Figure 3.1), whereas site 3 showed 75CFU/100mL for bottom and 93CFU/100mL for surface,
while site 4 showed 63 for bottom and 140 for surface. However, this increase is not significant (p-
value = 0.74 for both, GLM Quasipoisson). As expected, the largest difference in TCB concentrations
is between the control and Site 4 (p-value 0.0740, TukeyHSD), while there is close to no difference
between Site 3 and 4 (p-value 0.9899, TukeyHSD) (see Table A.3, Appendix B) which are both located
in the brackish water.

Grimstadpollen 2014
15
BIO300 UiB Group 7: Åshild Idsø, Bård Aarbakke, Yong Lao, Veronica Madsen
Figure 3.1 – Boxplot displaying the variance in the TCB values between the two depths; Bottom
(0.5m) and Surface (0.1m) at Site 3 and 4 in Grimstadpollen. Each box represents the distribution of
TCB counts at each site and depth (n = 2 for Bottom.3, n = 3 for Bottom.4, n = 3 for Surface.3, n = 2 for
Surface.4). The digit 3 and 4 on the x-axis labels indicates what site the box represents. The median
for each site is illustrated by the thick horizontal lines, and the variability of the values is presented by
the whiskers extending from the boxes, whereas it can be seen that the mean and standard deviation
for Bottom is 75 CFU/100mL and 49.5 respectfully, and the mean and standard deviation for Surface
is 93 CFU/100mL and 60.3 respectfully. The black dotted line represents the upper limit of 100 TCB
counts 100 mL-1 at surface for bathing and recreation, utilized by Bergen Municipality
(Folkehelseinstituttet, 2000; Andersen et al., 1997; Jacobsen et al., 2007). The mean and standard
deviation for Bottom is 75 CFU/100mL and 49.5 respectfully. Mean and standard deviation for
Surface is 93 CFU/100mL and 60.3 respectfully.

Grimstadpollen 2014
16
BIO300 UiB Group 7: Åshild Idsø, Bård Aarbakke, Yong Lao, Veronica Madsen
Figure 3.2 – Variance in the TCB counts between each site in the freshwater stream – sites 1 and 2 -
and in Grimstadpollen (n = 20), in the lake saltwater – sites 3 and 4. The median for each site is
illustrated by the thick horizontal lines, and the variability of the values is presented by the whiskers
extending from the boxes. The black dotted line represents the upper limit of 100 col/100 mL at
surface for bathing and recreation, utilized by Bergen Municipality (Folkehelseinstituttet, 2000;
Andersen et al., 1997; Jacobsen et al., 2007). Mean and standard deviation for the different sites is
presented in Table A.7, Appendix B. P-value < 0.05.

Grimstadpollen 2014
17
BIO300 UiB Group 7: Åshild Idsø, Bård Aarbakke, Yong Lao, Veronica Madsen
Figure 3.3 – Coliform bacteria counts from previous studies done at Grimstadpollen to this year’s
study. Sites from previous years are labelled as the relevant site from this year study. Blue bar is
counts from 2008, red from study done in the stream in Grimstadpollen bay in 2010, green 2012 and
purple 2014 (Bernardes et al., 2008; Liland et al., 2010; Hitchcock et al, 2012. See Table A.2, Appendix
B for relationship between sites. The black dotted line represents the upper limit of 100 col/100 mL at
surface for bathing and recreation, utilized by Bergen Municipality (Folkehelseinstituttet, 2000;
Andersen et al., 1997; Jacobsen et al., 2007).
3.4 PHOSPHORUS
Phosphorus concentrations measured – as can be seen by Table A.4, Appendix B – were given by 5.00
µg/L, 11.8 µg/L, 12 µg/L and 11 µg/L for sites 1, 2, 3 and 4, respectively. The descriptive analysis of
phosphorus concentration from the two depths at site 3 and 4 shows no significant difference
between depth (Table A.4, Appendix B). The two depths are therefor considered the same in the
further analysis. There are also no significant (p-value=0.06019) difference in the variation in
phosphorus concentration (Figure 3.4). The largest difference in phosphorus concentration is
between Site 1 and Site 3 (p-value = 0.05, TukeyHSD), and the difference is smallest between the
sites in the brackish water (Site 3 and 4) (see Table A.3, Appendix B for p-values extracted from the
Tukey test).

Grimstadpollen 2014
18
BIO300 UiB Group 7: Åshild Idsø, Bård Aarbakke, Yong Lao, Veronica Madsen
Figure 3.4 – Phosphorus concentration in µg/L in 2014 for site 1-4 in Grimstadpollen. The median for
each site is illustrated by the thick horizontal lines, and the standard deviation of the values is
presented by lines extending from the boxes. The black dotted line represents the maximum
Norwegian standard phosphorus levels of public use of water (e.g. bathing), 11 µg/L, given by Bergen
Municipality (Jacobsen et al., 2014). Mean and standard deviation is presented in Table A.7, Appendix
B.

Grimstadpollen 2014
19
BIO300 UiB Group 7: Åshild Idsø, Bård Aarbakke, Yong Lao, Veronica Madsen
Figure 3.5 – Average phosphorus concentration in µg/L at site 1-4 in Grimstadpollen, independent of
depth, compared with previous studies. Green=2008, blue=2010a and b, purple=2012, and red=2014
(Table A.5, Appendix B). The black dotted line represents the Norwegian standard phosphorus levels
of public use of water (e.g. bathing) at 11 µg/L given by Bergen Municipality (Jacobsen et al., 2014)
(Bernardes et al., 2008; Aryal t al., 2010; Liland et al.,2010; Hitchcock et al., 2012).
3.5 BIODIVERSITY
A total of 13 different species and 75 individuals were found. Site 2 had the highest diversity with the
mean value of 16 species mainly concentrated in Dysticidae and Oligocheata. The Shannon-index in
the stream was 1.08 ± 0.28, and in the bay it was 0.52 ± 0.16. Both biological- and water quality
seems to be low in the entire Grimstadpollen area (Table 3.2, see requirements for each quality level
in Table 2.3). A complete species list with BMWP-scores is listed in Table A.6,. Figure 3.6 shows the
species composition within each site.

Grimstadpollen 2014
20
BIO300 UiB Group 7: Åshild Idsø, Bård Aarbakke, Yong Lao, Veronica Madsen
Table 3.2 - Biological quality (BMWP) and water quality (ASPT) in
Grimstadpollen. Quality evaluations are taken from BIO300 Biodiversity
Lab Notes, 2014.
Site BWMP score Quality ASPT score Quality
1 13.8 Poor 4.6 Poor
2 39.2 poor 5.6 Fair
3 3.5 Very poor 3.5 Poor
4 0 Insufficient data 0 Insufficient data
Figure 3.6 – Composition of individuals from Grimstadpollen within each site, given in number of
animals found of each individuals within an 11,2dm2 area (except site 2A which is a kick sample). Site
2B is the shovel sample which corresponds to around 2 grab samples and means 11,2dm2.

Grimstadpollen 2014
21
BIO300 UiB Group 7: Åshild Idsø, Bård Aarbakke, Yong Lao, Veronica Madsen
Figure 3.7 – Comparison of Shannon-indexes in fresh water – sites 1 and 2 – in the Grimstadpollen
area for different years. Reports from previous studies do not include brackish water. For comparative
purposes, samples from the saltier water were not included in the 2014 calculation. A higher
Shannon-index represents increased biodiversity.
4 DISCUSSION
TCB and phosphorus levels obtained at each site are all lower than the upper limits at surface for
bathing and recreation (Folkehelseinstituttet, 2000; Andersen et al., 1997, Jacobsen et al., 2007),
indicating good water quality. Biodiversity, however, shows poor water quality in the entire survey
area. The taxa composition varied between sites and sampling method.
The sampling methodology at each site was not consistent. Three different biodiversity sampling
methods were used in this study: grab sampling, shovel sampling and kick sampling. The number of
grab samples varied between all sites. However, both grab- and shovel samples can be standardised
to a certain sampled area (in our case two grabs equal four shovels). Standardising the kick-sample to
the same sampled area is nearly impossible (Hines & Comptois, 1985), causing this sample to be
excluded when comparing between sites. It is worth noting that the kick sample, while not used in
the index calculations, contained higher diversity, as well as a higher number of individuals than both
the grab samples and the shovel sample. This indicates that sampling method influences the
apparent quality of the water. Another potentially important factor is the use of subsampling, which
could cause an erroneous observation of species when averaging for the entire sample (Ramsey and
Suggs, 2001). Since subsampling was only used for one of the biodiversity samples, it is not fully

Grimstadpollen 2014
22
BIO300 UiB Group 7: Åshild Idsø, Bård Aarbakke, Yong Lao, Veronica Madsen
comparable to the rest. The differences in number of species and individuals found at each site
shows that choice of sampling method is important. Species composition between grab- and shovel
samples also deviate from one another. Only one type of animal (Oligochaeta) was found at both
stream sites. Potential reasons for this could be sediment type (Rees et al. 1999) and sediment depth
(Hines & Comptois, 1985), as well as oxygen availability (Levin et al. 2001). The biodiversity indices
were used across all sites, even though they are only supposed to be used for limnic (freshwater)
environments (BIO300, 2014). This might lead to inaccurate estimations in the brackish water.
Inconsistent methods also occurred in the phosphorous and TCB sampling. An uneven number of
replicates were taken at each site, as well as at the different depths. This was in part due to the
limited sample containers available, and in part because the group wanted to get the most out of the
depth measurements. All samples were taken at a maximum of 0.5m. According to
Folkehelseinstituttet (2000), all such samples must be taken in water that is at least 1m deep, or the
bottom sediments might influence them.
This study can be separated into two categories; a freshwater survey and a brackish water survey.
Each category contains two sites. Sites 1 and 2 are freshwater, and sites 3 and 4 are brackish water.
Comparable sites from previous studies were used to determine changes (Table A.1, Appendix A).
The water quality at Site 1 was good in terms of TCB and phosphorous, while biodiversity indicates
poor water quality. This site was above the WWTPs, so there was no point-source pollution
influencing the results at this site. Site 1 is therefore considered a control. Previous studies indicated
less good water quality in terms of both TCB and phosphorous. Biodiversity in previous studies was
higher than in this year’s study, although it was not great (Liland et al., 2010; Hitchcock et al., 2012).
The lower biodiversity in the current study could be due to the fact that only one grab sample was
taken at this site.
Site 2 was different from all the other sites, in the sense that the sediment particles were larger, and
the water was faster flowing. This was the only site where grab samples were not used. Instead, both
kick- and shovel sampling were used here. TCB and phosphorous levels were within the
recommended limit. Biodiversity indices were the best out of all the sites. While biological quality
was poor, the water quality was fair.
TCB and phosphorus results indicate a good and less good quality respectively in the water at Site 3.
TCB was in the higher region of what is deemed acceptable, while phosphorous levels were classified
as grade 3 concentrations, in accordance with Folkehelseinstituttet (2000). Biodiversity scores

Grimstadpollen 2014
23
BIO300 UiB Group 7: Åshild Idsø, Bård Aarbakke, Yong Lao, Veronica Madsen
revealed very poor biological quality and poor water quality (Table 3.2). Only two taxa were found in
the sediments. Upon arrival in Grimstadpollen, the tide was low. Site 3 was completely drained of
water, with the exception of the small amount of freshwater being supplied from the stream.
Because of this, sampling was carried out during rising tide. Increased turbidity due to re-suspension
of bottom sediments has been stated to increase the concentration of parameters such as TCB since
increased turbidity of water can stimulate bacterial growth by e.g. increasing the nutrients available
for growth (Rincòn & Pulgarin, 2003; Francy et al., 2003). Biodiversity might also be affected by the
long periods during low tide where the sediments are exposed to air rather than water (Levin et al.,
2001). At this site there was an increase in pH from 2010 (Aryal et al., 2010). This rise in pH could be
explained by the higher temperature observed at this site. Since more H2O-molecules are being
formed instead of existing as H+ and OH- ions when the temperature rises, water will become more
alkaline with increased temperatures (Kemker, 2014). The higher temperature witnessed is most
likely correlated with the low precipitation levels and warm weather experienced this year, which is
markedly different from the previous years this study was conducted.
Water quality at Site 4 was borderline good in regards to both phosphorous and TCB. Both levels
were in the higher region of what constitutes healthy water (Folkehelseinstituttet, 2000). This, in
combination with the high levels in Site 3, indicate that Grimstadpollen might be at risk of
eutrophication. Eutrophication may cause algal blooms, and phosphorus concentrations are
therefore often used as a parameter for the possible presence of algal toxins (Dolah, 2000). There is,
however, a visible decrease in phosphorous concentration in this year’s result compared to the
results obtained in 2010. Current phosphorous levels have dropped to only one fifth of the
concentration present in 2010 (Aryal et al., 2010) (Figure 3.5). This could be due to the low
precipitation in the day leading up to the sampling (Bjørklund 1998a; Bjørklund 1998b). The
biodiversity data were inconclusive at this site, due to only three animals being found. It is hard to
say of this result was to be expected based on previous studies, due to the units being different.
Bernardes et al. (2008) used volume sampled while we used area, and Aryal et al. (2010) did not
standardise their samples. However, Levin et al. (2001) states that low biodiversity is associated with
the extreme fluctuations in living conditions found it CTZs such as Grimstadpollen. Another factor
potentially lowering the biodiversity is the runoff from the nearby airport. Studies show that areas
close to airports might have elevated levels of metals, herbicides, hydrocarbons and de-icing agents
(used to remove ice) due to runoff from the airport (Ellis & Lleweilyn, 2007; Corsi et al., 2008).
Airfield-pavement de-icer materials (PDM) can be a source of toxic runoff, which can be detected by
measuring ammonium levels in the water. Chlorine is also a possible parameter, which can be the

Grimstadpollen 2014
24
BIO300 UiB Group 7: Åshild Idsø, Bård Aarbakke, Yong Lao, Veronica Madsen
result of road-salt from the airport as well as the surrounding urban influence. Such runoff will have
consequence on marine life, through lethal and sub-lethal toxic effects that affects fitness (Corsi et
al., 2008; Levin et al. 2001).
There was a significant increase in TCB levels as we moved downstream from the control site (Site 1).
This is consistent with previous years (Hitchcock et al., 2012). TCB levels at all sites in 2008 were
similar to this year’s levels (Bernardes et al., 2008), while levels from 2010 and 2012 were much
higher (Liland et al., 2010; Aryal et al., 2010; Hitchcock et al., 2012). This is most likely due to
agricultural runoff, such as horse faeces and fertiliser from the greenhouses. Studies show that
agriculture can serve as a major source of pollution (Carpenter et al., 1998) of e.g. animal faces, in
addition to runoff from fertilizers (Vinten et al., 2004). According to Bjørklund (1998a and 1998b)
runoff from nonpoint sources increase during periods of high precipitation. In 2008, precipitation
was low in the days prior to sampling (Bernardes et al., 2008), while in 2010 and 2012 the sampling
days followed a period of high precipitation (Liland et al., 2010; Aryal et al., 2010; Hitchcock et al.,
2012) (Figure 2.4). The mentioned increase in TCB and phosphorous downstream from Site 1
indicates that the output from the WWTPs do have an effect on the microorganisms living in the
water, but since the values from all sites are mostly within the limits, the WWTPS seem to be
functioning properly. Given the higher levels in previous years, (Liland et al., 2010; Aryal et al., 2010;
Hitchcock et al., 2012), it is clear that some of the pollution comes from nonpoint sources. In
addition, Bergen Municipality do not have complete control of all the WWTPs in the area (Bergen
Municipality, Pers. Comm. 26.09.14). In case of higher levels of pollution, it is difficult to know
whether this originates from nonpoint sources, or if some of the WWTPs are malfunctioning.
4.1 CONCLUSION
Effluent water from the wastewater treatment plants in the Grimstadpollen area seem to be
affecting the concentration of both TCB and phosphorous to some degree, though the levels are still
acceptable (Bergen Municipality, Pers. Comm. 26.09.14; Lovdata, 2012).
There is reason to believe that non-point sources of pollution leaking into Grimstadpollen has an
amplifying effect on the TCB and phosphorus concentrations, due to the higher levels observed at
site 3 and 4, as well as results from previous years (Liland et al., 2010; Aryal et al., 2010; Hitchcock et
al., 2012). Current levels are still within the levels classifying Grimstadpollen as suited for bathing and
recreation (see Table 2.1 and 2.2 for classification), which should mean that Grimstadpollen would be
e.g. safe to swim in. The biodiversity scores do, however, indicate poor water quality. This raises the

Grimstadpollen 2014
25
BIO300 UiB Group 7: Åshild Idsø, Bård Aarbakke, Yong Lao, Veronica Madsen
concern that there might be other parameters having a negative effect on the water quality than the
ones tested for in this study.
4.2 RECOMMENDATIONS
For future studies, we would recommend that additional parameters, such as ammonium and
chorine level should be included in the study, because it would be interesting to see if these factors
might be a plausible cause for the poor biodiversity results. The study should also focus on either the
stream or the bay, in order to avoid the erroneous values obtained for the biodiversity indices in
brackish water. We also recommend using kick sampling as standard sampling method in the river.
Standardization of number of samples conducted at different sites is also recommended. The
phosphorus and TCB samples should be taken further from the bottom substrate in order to avoid
contamination, and preferably at sites with greater depths. This could be accounted for by obtaining
better knowledge on time of high and low tide prior to the field excursion.
We would also recommend Bergen Municipality to obtain better control of how many WWTP there
are in the area. This would enhance the knowledge on how many households are connected to
WWTP, whether or not every household is connected and if they all function to set standards.
4.3 ACKNOWLEDGEMENTS
We would like to thank Matthias Stølen for driving us around in the field and for his assistance with
the report, Barbro Haugland and Sylvelin Tellnes for their help in the lab, Jennifer Devine for her help
with statistics, and Karin Pittman for guiding us throughout the semester and teaching us valuable
techniques. We would also like to thank Kjell Håland from Bergen Municipality for meeting us at
Grimstadpollen and explaining the area to us.

Grimstadpollen 2014
26
BIO300 UiB Group 7: Åshild Idsø, Bård Aarbakke, Yong Lao, Veronica Madsen
REFERENCES
Andersen, J. R., Bratli, J. L., Fjeld, E. F., Faafeng, B., Grande, M., Hem, L., Holtan, H., Krogh, T, Lund, V.,
Rosland, D., Rosseland, B. O. og Aanes, K. J. (1997) Klassifisering av miljøkvalitet i ferskvann. Oslo:
Statens forurensningstilsyn.
Aryal, D., Blom, K., Eidsheim, S., Torvik, M. and Ådnanes, A. (2010). Water quality in Grimstadpollen.
BIO300 report, the University of Bergen.
Austad, T. M., Kleppe, L., Saed, H. S. and Schrøder-Nielsen, A. (2007). Water quality in
Grimstadfjorden. BIO300 report, the University of Bergen.
Avløpsgruppen, (2011), Hva bør du vite om ditt avløpsrenseanlegg? [pdf] Jæren: Vannregion
Rogaland. Available at http://www.vannportalen.no/hovedEnkel.aspx?m=66412&amid=3444645
[Accessed 29 October 2014] .
Bernardes, I., Kronstad, T., Liakonis, K., Shresta, B., Stokkan, M. and Vindas, M. (2008). Water wuality
in connection with wastewater treatments and other recipient systems in Grimstadpollen. BIO300
report, the University of Bergen.
BIO300 (2014) Lab handouts 20.08.14 - Lab Assignment (BMWP + Shannon explanation)
Biovac® (year unknown). Biovac® minirenseanlegg. Retrieved from
http://www.biovac.no/no/produkter/biovac_minirenseanlegg/biovac_for_1_boenhet?openDocume
nt.
Bjørklund, A.E. (1998a), Bakteriologisk undersøkelse av vassdrag i Fjell med hensyn på forurensning
fra kloakk, Rådgivende Biologer AS, Rapport nr 367, 34 sider. ISBN 82-7658-226-5
Bjørklund, A.E. (1998b), Bakteriologisk undersøkelse av vassdrag i Bergen med hensyn på
forurensning fra kloakk, Rådgivende Biologer AS, Rapport nr 366, 28 sider. ISBN 82-7658-225-7
Bronmark, C. and Hansson, L.A. (2005), The biology of lakes and ponds (2nd edition.), Oxford : Oxford
University Press.
Carpenter, S. R., Caraco, N. F., Correll, D. L., Howarth, R. W., Sharpley, A. N., & Smith, V. H. (1998).
Nonpoint pollution of surface waters with phosphorus and nitrogen. Ecological applications, 8(3),
559-568.
Corsi, S. R., Geis, S. W., Bowman, G., Failey, G. G., & Rutter, T. D. (2008). Aquatic toxicity of airfield-pavement deicer materials and implications for airport runoff. Environmental science & technology, 43(1), 40-46.
Ellis, J. B., Lleweilyn, N. (2007). Transport and the Environment: Effects of Organic Pollutants on
Water Quality, Water and Environment Journal, 11(3) 170 -177

Grimstadpollen 2014
27
BIO300 UiB Group 7: Åshild Idsø, Bård Aarbakke, Yong Lao, Veronica Madsen
Davies, A.S., Hernebring, C., Svensson, G. and Gustafsson, L.G. (2008). The impacts of climate change
and urbanisation on drainage in Helsingborg, Sweden: Combined sewer system. Journal of Hydrology
350(1-2) 100-113.
EPA (United States Environmental Protection Agency) (2011), Water Quality Standards: Protecting
Human Health and Aquatic Life [online]. Available at
http://water.epa.gov/scitech/swguidance/standards/upload/WQS_basic_factsheet.pdf [Accessed 30
October 2014].
Folkehelseinstituttet. (2000). Friluftsbad – Badevann: Vedlegg til Rundskriv IK-21/94. Retrieved from
http://www.fhi.no/eway/default.aspx?pid=239&trg=Content_6464&Main_6157=6263:0:25,5901:1:0
:0:::0:0&MainContent_6263=6464:0:25,5923:1:0:0:::0:0&List_6212=6218:0:25,5924:1:0:0:::0:0&Cont
ent_6464=6430:98414::1:6182:2:::0:0
Francy, D.S., A.M. Gifford and R.A Darner. (2003). Escherichia coli at Ohio Bathing Beaches—
Distribution, Sources, Wastewater Indicators and Predictive Modeling. Water- Resources
Investigations Report 02-4285.
Goodtech. (2011). Environment: Biovac Renseanlegg. [online] (updated 2011) Available at:
http://goodtech.no/environment/private-renseanlegg/biovac-r-renseanlegg/renseanlegg/1-boenhet-
5-pe/fd-5-n-for-nedgraving [Accessed 19 September 2011].
Haase, D. (2009). Effects of urbanisation on the water balance – A long-term trajectory.
Environmental Impact Assessment Review 29(4) 211-219.
Haller, L., Poté, J., Loizeau, J. L., & Wildi, W. (2009). Distribution and survival of faecal indicator
bacteria in the sediments of the Bay of Vidy, Lake Geneva, Switzerland. Ecological Indicators, 9(3),
540-547.
Hitchcock, D., Jeyakanth, G., Nerheim, M. S., Nordvik, K. and Pyakurel, B. (2012). The water quality of
a freshwater stream in Grimstad, Bergen. BIO300 report, the University of Bergen.
Hines & Comptois, 1985: Vertical Distribution of Infauna in Sediments of a Subestuary of Central
Chesapeake Bay, Estuaries, 9 (3): 296-304
Houlahan, J.E. and Findlay, C.S. 2003. The effects of adjacent land se on wetland amphibian species
richness and community composition. Canadian Journal of Fisheries and Aquatic Sciences 60: 1078–
1094.
Jacobsen, Å.C., Monsen, R.M., Hestetun, A.G., Bakke, G., Birkeland, R., Dahle, T. and Toppe, K. (2007).
Hovedplan avløp og vannmiljø 2005-2015. Bergen Municipality, pp 21.
Kemker, C. (2014), Water Temperature, FUNDAMENTALS OF ENVIRONMENTAL MEASUREMENTS
[online], Fondriest Environmental, Inc. Available at http://www.fondriest.com/environmental-
measurements/parameters/water-quality/water-temperature/ [Accessed 29 October 2014].

Grimstadpollen 2014
28
BIO300 UiB Group 7: Åshild Idsø, Bård Aarbakke, Yong Lao, Veronica Madsen
Kistemann, T., Claßen, T., Koch, C., Dangendorf, F., Fischeder, R., Gebel, J., ... & Exner, M. (2002).
Microbial load of drinking water reservoir tributaries during extreme rainfall and runoff. Applied and
environmental microbiology, 68 (5): 2188-2197.
Kärnä, T., Deleersnijder, E., & De Brauwere, A. (2010). Simple test cases for validating a finite element
unstructured grid fecal bacteria transport model. Applied Mathematical Modelling, 34(10), 3055-
3070.
Levin, L.A., Boesch, D.F., Covich, A., Dahm, C., Erséus, C., Ewel, K.C., Kneib, R.T., Moldenke, A.,
Palmer, M.A., Snelgrove, P., Strayer, D. and Weslawski, J.M. (2001) The Function of Marine Critical
ransition Zones and the Importance of Sediment Biodiversity, Ecosystems 4 (5): 430-451.
Liland, D., Blom, K., Eidsheim, S., Torvik, M. and Ådnanes, A. (2010). Kvernabekken; A study of the
water quality in connection to wastewater treatment plants in the Grimstad area. BIO300 report, the
University of Bergen.
Liberti, L. Notarnicola, M. Petruzzelli, D. 2003. Advanced treatment for municipal wastewater reuse
in agriculture. UV disinfection: parasite removal and by-product formation. Desalination 152(1-3)
315-324.
Liu, W. C., & Huang, W. C. (2012), Modelling the transport and distribution of fecal coliform in a tidal
estuary. Science of the Total Environment, 431, 1-8.
Lovdata (2012), Forskrift om begrensning av forurensing (Forurensningsforskriften) [online]
Norway:Lovdata. Available at: http://lovdata.no/dokument/SF/forskrift/2004-06-01-
931/*#KAPITTEL_4 [Accessed 30 October 2014].
Mallin, M. A., Williams, K. E., Esham, E. C. and Lowe, R. P. (2000). Effect of human development on
bacteriological water quality in coastal watersheds. Ecological Apllications 10:1047-1056. DOI:
ttp://dx.doi.org/10.1890/1051-0761(2000)010[1047:EOHDOB]2.0.CO;2
Miller, S. (2013), Salt Level Rise in Freshwater Rivers Causing Biodiversity Loss, Says Study [Online]
Available at: http://www.natureworldnews.com/articles/598/20130201/salinity-freshwater-rivers-
biodiversity-global-warming.htm [Accessed 14 November 2014].
Okeke, B. C., Thomson, M. S., & Moss, E. M. (2011). Occurrence, molecular characterization and
antibiogram of water quality indicator bacteria in river water serving a water treatment plant.
Science of the Total Environment,409(23), 4979-4985.
Ramsey, C.A. and Suggs, J. (2001), Improving Laboratory Performance Through Scientific Subsampling
Techniques [Online] Available at:
http://www.triadcentral.org/tech/documents/etasubsamplingarticle.pdf [Accessed 11 January 2015]
Rees, H.L., Pendle, M.A., Waldock, R. Limpenny, D.S. and Boyd, E. (1999), A Comparison of Benthic
Biodiversity in the North Sea, English Channel, and Celtic Seas, ICES Journal of Marine Science, 56:
228-246.

Grimstadpollen 2014
29
BIO300 UiB Group 7: Åshild Idsø, Bård Aarbakke, Yong Lao, Veronica Madsen
Sidhu, J. P., & Toze, S. G. (2009). Human pathogens and their indicators in biosolids: a literature
review. Environment International, 35(1), 187-201.
Sørfonn, L.J. (2014) Bergen Kommune Site descriptions and questions, BIO300 Biological Data
Analysis and Research Design, University of Bergen, unpublished.
Thingstad, F. (2013), Course compendium-2007 Mik202 Mikrobielle næringsnett og biogeokjemiske
sykler, page 6-8 and 52-67. University of Bergen: Frede Thingstad.
Totland, A. (2014), Information on WWTPs in Bergen [e-mail] (Personal communication, 19
September 2014).
Van Dolah, F. M. (2000). Marine algal toxins: origins, health effects, and their increased
occurrence. Environmental health perspectives, 108(Suppl 1), 133.
Vinten, A.J.A., Douglas, J.T., Lewis, D.R., Aitken, M.N. and Fenlon, D.R. (2004). Relative risk of surface
water pollution by E-coli derived from faeces of grazing animals compared to slurry application. Soil
use and Management 20:13–22.

Grimstadpollen 2014
30
BIO300 UiB Group 7: Åshild Idsø, Bård Aarbakke, Yong Lao, Veronica Madsen
APPENDIX A
Figure A.1 - A geographical map of Grimstad supplied by Bergen Municipality. The blue line
represents Høgestølsbekken and Kvernabekken, and the red triangles show output points from
WWTPs. The most relevant output points are circled.

Grimstadpollen 2014
31
BIO300 UiB Group 7: Åshild Idsø, Bård Aarbakke, Yong Lao, Veronica Madsen
Table A.1 - Overview of this year’s sites from Grimstadpollen, with comparable sites from
previous studies (Bernardes et al. 2008; Liland et al. 2010; Aryal et al. 2010; Hitchcock et al.
2012). Since there were two studies conducted in 2010, Liland et al. are represented by
2010a while Aryal et al.is given as 2010b
Site (2014) 2008 2010a 2010b 2012
1 - 1 - 1
2 2 7 - -
3 3 - 4 -
4 7 - 6 -

Grimstadpollen 2014
32
BIO300 UiB Group 7: Åshild Idsø, Bård Aarbakke, Yong Lao, Veronica Madsen
APPENDIX B
Table A.2 - TCB levels at relevant sites from previous studies done at Grimstadpollen, compared to
TCB levels from relevant sites from this year’s study. (Bernardes et al. 2008; Liland et al. 2010;
Aryal et al. 2010; Hitchcock et al. 2012). Since there were two studies conducted in 2010, Liland et
al. are represented by 2010a while Aryal et al.is given as 2010b
Year Relevan
t sites
This years
sites
Mean TCB levels
(CFU/100mL)
Our mean TCB levels
(CFU/100mL)
2008 2
3
7
2
3
4
20
70
50
52
86
94
2010a 1
7
1
2
25
35
24
52
2010b 6 4 625 94
2012 1 1 395 52
Table A.3 - Presentation of p-values for variation in TCB counts (col/100mL) and phosphorus
concentration (µ/L) between each site in Grimstadpollen (TukeyHSD). The p-value shows no
significance for the difference in TCB counts, but a larger difference in values between Site 1 and
Site 4. The only p-value close to significant for phosphorus is between sites 1 and 3.
Compared sites P-value TCB P-value phosphorus
2-1 0.7169 0.185
3-1 0.1279 0.05
4-1 0.0740 0.1023
3-2 0.5826 0.8197
4-2 0.4104 0.9928
4-3 0.9899 0.902

Grimstadpollen 2014
33
BIO300 UiB Group 7: Åshild Idsø, Bård Aarbakke, Yong Lao, Veronica Madsen
Table A.4 – Phosphorus concentrations (µg/L ) at site 1-4 in Grimstadpollen. Both depths and
average is also presented.
Site Depth (m) Phosphorus (µg/L) Average (µ/L)
1 0.1
0.1
5.4
4.6
5.00
2 0.1
0.1
9.5
12.0
10.8
3
0.5
0.1
0.1
10.0
14.0
14.0
10.0
14.00
4
0.1
0.5
0.5
10.0
15.0
9.0
10.0
12.00
Table A.5 - A comparison between years of phosphorus concentrations at site 1-4 in Grimstadpollen.
Not all sites in the current study were sampled in previous years. (Bernardes et al. 2008; Liland et al.
2010; Aryal et al. 2010; Hitchcock et al. 2012). Since there were two studies conducted in 2010,
Liland et al. are represented by 2010a while Aryal et al.is given as 2010b
Site Number 2008 2010 2012 2014
1 17 11.5 5
2 18 14 10.8
3 20 42 14
4 50 10

Grimstadpollen 2014
34
BIO300 UiB Group 7: Åshild Idsø, Bård Aarbakke, Yong Lao, Veronica Madsen
Table A.6 - Taxonomic composition at each site in Grimstadpollen, given as number of individuals
found/11dm3.
Animal Site 1 Site 2 A Site 2 B Site 3 Site 4 BMWP-
score
Amphipoda 4
Cardiidae 2
Chironomidae 7 3.7
Dysticidae 7 3.5
Elmidae 2 3 6.4
Hirudididae 2 0
Hydracarina 5
Hydrophilidae 1 5.1
Leuctridae 2 9.9
Oligochaeta 4 5 4 24 3.5
Portunidae 1
Psychomyiidae 1 6.6
Undetermined
stonefly 1 10.8
Table A.7 - Table presenting the mean for each site in Grimstadpollen and the standard deviation of the difference in TCB counts (CFU/100mL) and phosphorus concentrations (µg/L) between Site1-4.
Site Mean TCB ±SD Mean phosphorus ± SD
1 24 ± 13.42 5 ± 0.49
2 52 ± 28.64 10.75 ± 1.02
3 84 ± 50.30 12.68 ± 1.89
4 102 ± 58.57 11.3 ± 2.62