water quality in the lake erie-lake saint clair drainages · the lake erie-lake saint clair...
TRANSCRIPT

Water Quality in theLake Erie-Lake Saint Clair DrainagesMichigan, Ohio, Indiana, New York, and Pennsylvania, 1996–98
U.S. Department of the InteriorU.S. Geological Survey
Circular 1203
POINTS OF CONTACT AND ADDITIONAL INFORMATION
The companion Web site for NAWQA summary reports:
http://water.usgs.gov/nawqa/summaryreports/
Lake Erie-Lake Saint Clair Drainages:
USGS State RepresentativeU.S. Geological Survey-Water Resources Division6480 Doubletree AvenueColumbus, Ohio 43229–1111e-mail: [email protected]://oh.water.usgs.gov/nawqa/
National NAWQA Program:
Chief, NAWQA ProgramU.S. Geological Survey-Water Resources Division12201 Sunrise Valley Drive, M.S. 413Reston, VA 20192http://water.usgs.gov/nawqa/
River Basin AssessmentsAlbemarle–Pamlico Drainage Basin (Circular 1157)Allegheny and Monongahela River Basins (Circular 1202)Apalachicola–Chattahoochee–Flint River Basin (Circular 1164)Central Arizona Basins (Circular 1213)Central Columbia Plateau (Circular 1144)Central Nebraska Basins (Circular 1163)Connecticut, Housatonic and Thames River Basins (Circular 1155)Eastern Iowa Basins (Circular 1210)Georgia–Florida Coastal Plain (Circular 1151)Hudson River Basin (Circular 1165)Kanawha–New River Basins (Circular 1204)Las Vegas Valley Area and the Carson and Truckee River Basins (Circular 1170)Lower Illinois River Basin (Circular 1209)Long Island–New Jersey Coastal Drainages (Circular 1201)Lower Susquehanna River Basin (Circular 1168)Mississippi Embayment (Circular 1208)Ozark Plateaus (Circular 1158)Potomac River Basin (Circular 1166)Puget Sound Basin (Circular 1216)Red River of the North Basin (Circular 1169)
Other NAWQA summary reports
Rio Grande Valley (Circular 1162)Sacramento River Basin (Circular 1215)San Joaquin–Tulare Basins (Circular 1159)Santee River Basin and Coastal Drainages (Circular 1206)South–Central Texas (Circular 1212) South Platte River Basin (Circular 1167)Southern Florida (Circular 1207)Trinity River Basin (Circular 1171)Upper Colorado River Basin (Circular 1214) Upper Mississippi River Basin (Circular 1211)Upper Snake River Basin (Circular 1160)Upper Tennessee River Basin (Circular 1205)Western Lake Michigan Drainages (Circular 1156)White River Basin (Circular 1150)Willamette Basin (Circular 1161)
National AssessmentsThe Quality of Our Nation’s Waters—Nutrients and Pesticides (Circular 1225)
Front cover: Marblehead Lighthouse, a symbol of Lake Erie, located on the Marblehead Peninsula, near Sandusky, Ohio. (Photograph from Ohio Lake Erie Commission, Toledo, Ohio).
Back cover: left, waterways such as the harbor of the Ashtabula River, Ohio, are used for industry, commerce, and recreation; right, country roads and small farms are still common in some areas.

U.S. GEOLOGICAL SURVEY CIRCULAR 1203
Water Quality in theLake Erie-Lake Saint Clair DrainagesMichigan, Ohio, Indiana, New York, and Pennsylvania, 1996–98
By Donna N. Myers, Mary Ann Thomas, Jeffrey W. Frey, Stephen J. Rheaume, and Daniel T. Button

Library of Congress Cataloging-in-Publications Data
The use of firm, trade, and brand names in this report is for identification purposes only anddoes not constitute endorsement by the U.S. Government.
Free on application to theU.S. Geological SurveyInformation ServicesBox 25286 Federal CenterDenver, CO 80225
Or call: 1-888-ASK-USGS
U.S. DEPARTMENT OF THE INTERIORBRUCE BABBITT, Secretary
U.S. GEOLOGICAL SURVEY
Charles G. Groat, Director
2000
Water quality in the Lake Erie-Lake St. Clair Drainages, Michigan, Ohio, Indiana, New York, and Pennsylvania, 1996–98 / by D.N. Myers…[et al.].
p. cm. -- (U.S. Geological Survey Circular ; 1203)Includes bibliographical references.ISBN 0-607-95421-3 (alk. paper)1. Water quality--Erie, Lake, Watershed. 2. Water quality--Saint Clair, Lake, Watershed (Mich. and Ont.) I.
Myers, Donna N. II. Geological Survey (U.S.) III. Series.
TD222.3 .W374 2000363.739’42’097712--dc21
00-049458

CONTENTS
Contents III
NATIONAL WATER-QUALITY ASSESSMENT PROGRAM.....................................................................IVSUMMARY OF MAJOR FINDINGS..............................................................................................................1
Stream and River Highlights ........................................................................................................... 1
Ground Water Highlights................................................................................................................. 2
INTRODUCTION TO THE LAKE ERIE-LAKE SAINT CLAIR DRAINAGES.................................................3Major water-quality issues ......................................................................................................................3
Environmental setting and hydrologic conditions....................................................................................3
MAJOR FINDINGS .......................................................................................................................................6Pesticides were detected in every stream sample..................................................................................6
The pesticides most frequently detected in streams were generally those most heavily applied ................................................................................................................................................ 7
Pesticide metabolites were frequently detected......................................................................................7
Pesticide concentrations in streams are related to land use, rainfall, runoff, and season ......................8
Pesticide concentrations in streams have public-health and economic consequences .........................8
Another consequence of heavy pesticide use is the potential effect on aquatic life ...............................9
NATIONAL PERSPECTIVE—Concentrations of nutrients and herbicides in certain streams are among the highest in the Nation ....................................................................................................... 10
Runoff from agricultural land to streams is an important pathway of phosphorus to Lake Erie ........... 10
Decreases in the amounts of suspended sediment carried by rivers correspond to increases in farmers’ use of conservation tillage ....................................................................... 12
Contamination of bed sediments may be causing adverse effects on aquatic life........................ 13
Land use and chemical use contribute to the contamination of sediments and fish ............................ 14
Bioaccumulative contaminants in fish may pose a risk to fish-eating wildlife ...................................... 15
Land use appears to affect fish-community composition .............................................................. 16
Recent residential development has had a widespread effect on ground-water quality ...................... 18
Ground water is vulnerable to contamination in agricultural areas underlain by till ............................. 20
NATIONAL PERSPECTIVE—Nitrate and herbicides in ground water in agricultural areas ................ 22
STUDY-UNIT DESIGN............................................................................................................................... 23
GLOSSARY............................................................................................................................................... 25
REFERENCES .......................................................................................................................................... 27
APPENDIX–WATER-QUALITY DATA FROM THE LAKE ERIE-LAKE SAINT CLAIR DRAINAGES IN A NATIONAL CONTEXT...................................................................................................................... 29

NATIONAL WATER-QUALITY ASSESSMENT PROGRAM
THIS REPORT summarizes major findings about water quality in the Lake Erie-Lake Saint Clair Drainages that emerged from an assessment conducted between 1996 and 1998 by the U.S. Geological Survey (USGS) National Water-Quality Assessment (NAWQA) Program. Water quality is discussed in terms of local and regional issues and compared to conditions found in all 36 NAWQA study areas, called Study Units, assessed to date. Findings are also explained in the context of selected national benchmarks, such as those for drinking-water quality and the protection of aquatic organisms. The NAWQA Program was not intended to assess the quality of the Nation’s drinking water, such as by monitoring water from household taps. Rather, the assessments focus on the quality of the resource itself, thereby complementing many ongoing Federal, State, and local drinking-water monitoring programs. The compar-isons made in this report to drinking-water standards and guidelines are only in the context of the available untreated resource. Finally, this report includes information about the status of aquatic communities and the condition of in-stream habitats as elements of a complete water-quality assessment. Many topics covered in this report reflect the concerns of officials of State and Federal agencies, water-resource managers, and members of stakeholder groups who provided advice and input during the Lake Erie-Lake Saint Clair Drainages assessment. Residents who wish to know more about water quality where they live will find this report informative as well.
1991-95
1994-98
1997-2001
Not yet scheduled
High Plains RegionalGround Water Study, 1999-2004
NAWQA Study Units Assessment schedule
Lake Erie-Lake Saint Clair Drainages
THE NAWQA PROGRAM seeks to improve scientific and public understanding of water quality in the Nation’s major river basins and ground-water systems. Better understanding facilitates effective resource management, ac-curate identification of water-quality priorities, and successful development of strategies that protect and restore wa-ter quality. Guided by a nationally consistent study design and shaped by ongoing communication with local, State, and Federal agencies, NAWQA assessments support the investigation of local issues and trends while providing a firm foundation for understanding water quality at regional and national scales. The ability to integrate local and national scales of data collection and analysis is a unique feature of the USGS NAWQA Program. The Lake Erie-Lake Saint Clair Drainages is one of 51 water-quality assessments initiated since 1991, when the U.S. Congress appropriated funds for the USGS to begin the NAWQA Program. As indicated on the map, 36 assess-ments have been completed, and 15 more assessments will conclude in 2001. Collectively, these assessments cover about one-half of the land area of the United States and include water resources that are available to more than 60 percent of the U.S. population.
IV National Water-Quality Assessment Program

SUMMARY OF MAJOR FINDINGS
Land use in the Lake Erie-Lake Saint Clair Drainages was predominantly agricul- and urban. This level of human activity has had substantial effects on water
in the region.turalquality
OHIO
IND
IAN
A
OH
IO PA.
N.Y
.
OH
IO
MICHIGAN UNITED STATES
CANADA
LAKE ERIELAKE
ST. CLAIR
MONROE
FINDLAY
ANNARBOR
LIMA
TOLEDO
DETROIT
WINDSOR
AKRON
CLEVELAND
ERIE
BUFFALO
SANDUSKY
41˚
42˚
43˚80˚
85˚
84˚
83˚
82˚
81˚
79˚
EXPLANATION1970'S LAND USE UPDATEDWITH 1990 POPULATION DATA
AgricultureUrbanRecent residentialForestOpen waterWetlands
20 40 60 MILES
20 40 60 KILOMETERS0
0
OhioPa.
N.Y.
Ind.
Mich.
Canada
Studyarea
PA.
FORTWAYNE
Stream and River HighlightsWater quality in the Lake Erie-
Lake Saint Clair Drainages is greatly influenced by land use and human activities. A major pathway for con-taminant transfer from the land sur-face to streams is storm runoff from urban and agricultural areas.
As a result of herbicides in runoff, concentrations in streams were in the top 25 percent of streams nationwide and many public-water supplies must treat stream water to reduce herbicide concentrations. As a result of nutri-ents in runoff, concentrations of total phosphorus and nitrate in some small streams in agricultural areas and in
Small streams Major rivers
Row cropUrban Pasture/forest
Pesticides1
Nitrate3
Indicators of Stream Quality
Arsenic4
Polycyclicaromatichydrocarbons5
Polychlorinatedbiphenyls5
Other traceelements4
Total phosphorus 2
Mixed
Percentage of samples with concentrations equal to or greater than a health-related national guideline for drinking water, aquatic life, or above a national goal for preventing excess algal growth (a Percentage is 1 or less and may not be clearly visible.)
Percentage of samples with concentrations less than a health-related national guideline for drinking water, aquatic life, or below a national goal for preventing excess algal growth (b Percentage is 1 or less and may not be clearly visible.)
1
2 Total phosphorus, sampled in water.3 Nitrate (as nitrogen), sampled in water. 4 Arsenic, cadmium, copper, lead, mercury, and zinc, sampled in sediment.
Insecticides, herbicides, and pesticide metabolites, sampled in water.
5 Industrial chemicals, combustion byproducts, and polychlorinated biphenyls sampled in sediment.
c
ac c
Percentage of samples with no detection (c Percentage is 1 or less and may not be clearly visible.)
major rivers were in the top 25 percent of streams nationwide. Concentrations of nitrate, although ele-vated relative to many other streams in the Nation, were infrequently greater than the drinking-water stan-dard of 10 milligrams per liter.
Contamination of the bed sediments of small streams and major rivers by persistent and bioaccumu-lative contaminants was prevalent. The highest con-centrations of PCBs (polychlorinated biphenyls) and mercury were detected in streams draining highly pop-ulated urban and mixed land-use areas. Detections of contaminants in fish tissues indicate bioaccumulation; in fact, bioaccumulation of PCBs and DDT in some fish species presents a health risk to fish-eating wild-life.
• The pesticides detected most frequently were among thoseapplied in the greatest quantities to agricultural and mixedland-use areas. The herbicides atrazine, acetochlor, cyana-zine, metolachlor, and simazine were detected in 50 to 100percent of samples. (p. 6)
• Several heavily used herbicides and insecticides were de-tected in spring and summer at or above a standard for drink-ing water or a guideline for aquatic life. Elevated pesticideconcentrations in streams persisted for 4 to 6 weeks after ap-plications in agricultural and mixed-land-use areas. (p. 8)
• Annual average concentrations of total phosphorus weregreater than the U.S. Environmental Protection Agency rec-ommended level for control of nutrient enrichment at 8 of 10sites sampled in small streams and major rivers draining ag-ricultural and mixed-use land. Streams draining row-cropsand mixed-use land are major pathways of phosphorus toLake Erie. (p. 10)
Summary of Major Findings 1

Indicators of Ground-Water Quality
• Contaminants detected most often in the bed sediments ofsmall streams and major rivers were arsenic, cadmium, cop-per, lead, mercury, zinc, PCBs, and PAHs (polycyclic aromat-ic hydrocarbons). The concentrations of arsenic, mercury,PCBs, and PAHs were equal to or greater than sedimentguidelines, indicating probable adverse effects on aquaticlife, in about 11 to 30 percent of samples. (p. 13)
• The most frequently detected contaminants in fish werehighly persistent contaminants—DDT, chlordane, dieldrin,PCBs, and mercury. Except for mercury, use of these com-pounds in industry and agriculture in the United States wasdiscontinued 15 to 25 years ago. (p. 14)
• Agricultural land use appears to be affecting fish communi-ties in streams draining areas of row-crops. As the amount ofrow-crops increased relative to forested land, the number ofpollution-intolerant fish species decreased. It appears thatpollution-intolerant fish can live where agriculture is the pri-mary land use when streams are protected by natural cover.(p. 17)
Major Influences on Surface-Water Quality and Aquatic Biota• Storm runoff• Land use and chemical releases• Bioaccumulative and persistent contaminants
Trends in Surface-Water Quality Suspended-sediment discharges from the Maumee
River Basin decreased by 11.2 percent over the period 1970–98 and corresponded to increased use of conser-vation tillage to control soil erosion.
Percentage of samples with concentrations equal to or greater than a health-related national guideline for drinking water.
Percentage of samples with concentrations less than health-related national guideline for drinking water.
Percentage of samples with no detection.
AgriculturalUrban
—
Domestic-supply wells
1 Insecticides, herbicides, and herbicide metabolites, sampled in water.2 Nitrate (as nitrogen), sampled in water.3 Solvents, refrigerants, fumigants, and gasoline compounds,
sampled in water.
Volatileorganics3
Pesticides1
Nitrate2
—
Shallow ground water
Not assessed.
Ground Water HighlightsThe glacial aquifer is the major source of drinking
water in the northwestern part of the study area. In this area, ground-water quality is affected by a combina-tion of human and natural factors. Land use deter-mines which chemicals are used; how readily these chemicals are transported to the ground water is affected by geology.
• In residential areas underlain by sand and gravel, more than 75 percent of ground water recharged since 1953 shows evidence of human activities in the form of nitrate, chloride, or volatile organic compounds (VOCs). Probable sources are (1) septic systems containing human waste and household chemicals, (2) road salt and gasoline residue from paved surfaces, (3) waste from water softeners, or (4) lawn fertilizer. Pesticides were rarely detected. (p. 18)
• In the agricultural study area, which is underlain by till, ni-trate and herbicides were detected less frequently than in
2 Water Quality in the Lake Erie-Lake Saint Clair Drai
most other agricultural areas of the Nation. This observationpartially supports the belief that till or tile drains protect theaquifer from contamination. Nevertheless, the ground wateris still vulnerable to contamination; almost 60 percent of shal-low ground water contained herbicides or elevated concen-trations of nitrate. Herbicides were predominantly detected asbreakdown products. (p. 20)
• In residential and agricultural areas, samples from domesticwells met health-related drinking-water standards. However,ground water affected by human activities was detected atdepths below 25 feet, the minimum required depth for wellsin Ohio and Michigan. (p. 19)
Major Influences on Ground-Water Quality• Septic systems, roads, and lawns in residential areas• Herbicides and fertilizer in agricultural areas• Geology, especially deposits at land surface • Well depth and ground-water age
Trends in Ground-Water QualityA significant change in ground-water quality is
linked to recent residential development near Detroit. Ground water recharged before 1953 (which predates suburbanization) has concentrations of chemical con-stituents typical of natural water. In contrast, ground water recharged after 1953 has significantly higher concentrations of constituents derived from human activities.
nages

INTRODUCTION TO THE LAKE ERIE-LAKE SAINT CLAIR DRAINAGES
Figure 1. Agriculture is a major in-dustry in the western part of the ba-sin, where corn and soybeans are
Major water-quality issuesStreams and aquifers in the Lake
Erie-Lake Saint Clair Drainages study area provide water for 10.6 million people. The major water-quality issues in the study area are similar to those facing the rest of the Nation. Natural-resource man-agers are interested in the effects of urban and agricultural land use on the quality of surface water and ground water, specifically:
• pesticide and nutrient contaminationof stream water used for public sup-ply
• nutrient enrichment and sedimentationin streams and subsequent effects onaquatic biota
• impairment of aquatic life from bioac-cumulation of organochlorine com-pounds and mercury
• consumption advisories for certain fishdue to bioaccumulation of PCBs andmercury
• degradation of ground water used fordomestic supply in areas of new resi-dential development and areas ofrow-crops
grown. (Photograph from NaturalResources Conservation Service.)
Figure 3. The port of Toledo, Ohio,on the Maumee River exports largeamounts of grain from Midwesternfarms. Toledo is an industrial centerfor automobile manufacturing. (Pho-tograph from Ohio Lake Erie Com-mission.)
Figure 2. Pasture and forage cropsare found in the eastern part of thebasin.
Environmental setting and hydrologic conditions
Lake Erie is the 11th-largest freshwater lake in the world. About two-thirds of the Lake Erie water-shed is in the United States, and is referred to as the Lake Erie-Lake Saint Clair Drainages. (For sim-plicity, this area will be referred to as the “basin.”) This 22,300-square-mile area includes sections of Michigan, Indiana, Ohio, Penn-sylvania, and New York. The land surface is gently rolling to nearly flat lying. Eight major rivers, all with drainage areas greater than 500 square miles, flow into the sys-tem.
Land use
In the Lake Erie-Lake Saint Clair Drainages, about 75 percent of the
land area is in agriculture, 11 per-cent is urban land, 11 percent is forest, and 3 percent is open water or wetlands. (See land-use map in summary section.)
Corn, soybeans, and wheat are grown predominantly in the west-ern part of the basin (fig. 1). Other agricultural land uses include pas-ture and forage crops, grown pre-dominantly in the eastern part of the basin (fig. 2). Orchards and vineyards, located mainly along the shores of Lake Erie and in parts of Michigan, is the least widespread type of agricultural land use.
Urban land is an important com-ponent of land use in the basin (fig. 3). Detroit and Pontiac, Mich.; Akron, Cleveland, Lima, and Toledo, Ohio; Fort Wayne, Ind.;
Introduction to the Lake Er
Erie, Pa.; and Buffalo, N.Y., were historically significant contribu-tors to industrial America through the production of automobiles, rub-ber, steel, petroleum, and chemi-cals. These cities remain important industrial and manufacturing cen-ters. Major urban centers rely on abundant supplies of water for shipping, electric power genera-tion, industry, domestic consump-tion, and waste assimilation.
Forest and wetlands, once com-mon throughout the basin, have been greatly reduced since the mid- 1800s. The greatest percentage of forested land today is in Pennsylva-nia and New York. Metropolitan parks also support substantial urban forests. Wetlands lie prima-rily along Lake Erie and Lake Saint
ie-Lake Saint Clair Drainages 3

Figure 4. Glacial deposits throughout the basin influence the quality and flow ofsurface water and ground water.
UNITED STATES
CANADA
EXPLANATIONPOPULATION SERVED
Less than 3,0003,001 - 10,00010,001 - 50,00050,001 - 100,000Greater than 100,000
Surface Water
BelleRiver
Rouge
River
Raisin
Riv
er
Maumee
River
Blanchard
River
St. MarysRiver A
ugla
ize R
iver
San
dusk
yR
iver
Black
River
Cuyahoga Rive
r
BuffaloRiver
Tonawanda
Creek
Black
River
River
Clinton
River
H
uron
River
Riv
erTiffi
n
St. Jo
seph
GrandRiver
CattaraugusCreek
OHIO
IND
IAN
AO
HIO
MICHIGAN UNITED STATES
CANADA
LAKE ERIELAKE
ST. CLAIR
MONROE
FINDLAY
ANNARBOR
LIMA
TOLEDO
DETROIT
FORTWAYNE
AKRON
CLEVELAND
ERIE
BUFFALO
SANDUSKY
41˚
42˚
43˚80˚
85˚
84˚
83˚
82˚
81˚
79˚
EXPLANATION
SURFICIAL GEOLOGYSand and gravelClay and siltTillWater, exposed bedrock, other
20 40 60 MILES
20 40 60 KILOMETERS0
0
OH
IOPA
.
N.Y
.PA
.
Clair from Detroit, Mich., to Sandusky, Ohio.
Geology
A layer of glacial deposits from 20 to 200 feet thick mantles the entire basin and overlies limestone, sandstone, or shale bedrock. The glacial sediments consist of sand and gravel, till, and fine-grained sediments composed of fine sands, silts, and clay (fig. 4). Sand and gravel are present as discontinuous deposits in river valleys and in the western part of the basin.The most widespread deposit is till, a mixture
4 Water Quality in the Lake Erie-
0
2,000
4,000
6,000
8,000
10,000
12,000GrounSurfa
% of tota
WA
TE
R W
ITH
DR
AW
ALS
,IN
MIL
LIO
NS
OF
GA
LLO
NS
PE
R D
AY
17%
71%
10%
100%
TOTA
L
THERMOELE
CTRIC
PUBLIC A
ND
DOMESTIC
SUPPLY
INDUSTRIA
L
AND MIN
ING
COMM
ERC
Figure 5. Water withdrawals in the basin adominated by thermoelectric power produ
of grain sizes. Tills in the Lake Erie-Lake Saint Clair Drainages contain a high content of clay, which slows infil-tration of rainfall into the ground.
Water use
More than 10.6 billion gallons of water is used each day in the basin (fig. 5). Cooling during power gen-eration accounts
Lake Saint Clair Drainages
d waterce waterl withdrawals
Less than1 %
IAL
AGRIC
ULTURAL
re ction.
Figure 6. Many pubsources are near Lawater supplies with gdistance from the lak
for 71 percent of the water use. Public and domestic supply account for 17 percent, and indus-try and mining account for 10 per-cent of the total use. Normal precipitation is generally adequate for agriculture, so irrigation accounts for less than 1 percent of water use.
Of the more than 1.8 billion gal-lons per day used for public and domestic supply, about 88 percent is from surface-water sources. Most of the major cities are near Lake Erie and Lake Saint Clair and therefore derive their water from the lakes or their connecting chan-nels (fig. 6). Major rivers are an important source of drinking water for inland cities such as Fort
lic-water supplies with surface-water ke Erie or major rivers, whereas public- round-water sources generally are somee and major rivers.
UNITED STATES
CANADA
EXPLANATIONPOPULATION SERVED
Less than 3,0003,001 - 10,00010,001 - 50,000Greater than 50,000
Ground Water

OHIO
IND
IAN
AO
HIO
MICHIGAN UNITED STATES
CANADA
EXPLANATION
+13
-1
DEPARTURES FROM30-YEAR MEANANNUAL, IN INCHES
81˚
82˚
80˚
79˚83˚
84˚
85˚
43˚
42˚
41˚
OH
IO
PA.
PA.
N.Y
.
Figure 7. Departures from 30-year mean annual precipitation patterns for water years 1996–98, based on data from 133 weather stations.
Figure 8. Mean monthly streamflows during water years 1996–98 greatly
18,000
O N D J F M A M J J A S O N D J F M A M J J A S O N D J F M A M J J A S
15,000
12,000
900
600
300
0
600
2,400
1,800
1,200
0ST
RE
AM
FLO
W, I
N C
UB
IC F
EE
T P
ER
SE
CO
ND
Cattaraugus Creek at Gowanda, N.Y.
Maumee River at Waterville, Ohio
Mean monthly streamflow, water years 1996-98
Long–term mean monthly streamflow, 50+ years
19961995 1997 1998
Wayne, Ind., and Akron and Lima, Ohio.
About 12 percent of water for human consumption comes from ground water. The cities that use ground water as their major source of drinking water are generally inland (fig. 6). The most productive aquifers are in glacial deposits and limestone and sandstone bedrock.
Hydrologic conditions
Average annual precipitation across the basin ranges from 28 to 47 inches. Precipitation is highest in the northeast because of lake effect, whereby cool, dry air picks up moisture as it travels over warmer lake water and then pro-duces rain or snow as it reaches land. The lowest amounts of pre-cipitation are in the northwestern part of the basin in Michigan. Dur-ing the study, annual precipitation was 4 to 5 inches above the 30-year mean annual. Some areas received 13 inches of precipitation above the mean, and a few isolated areas
received slightly less than the mean (fig. 7).
The highest streamflows are typ-ically in February, March, and April, as a result of increased pre-cipitation, cold temperatures and little vegetative growth. The lowest streamflows are in August, Sep-tember, and October (Casey and
Introduction to the Lake Er
exceeded long-term averages in some
others, 1997). During low stream-flow, ground water typically con-tributes most of the flow.
Mean monthly streamflows for the Maumee River at Waterville, Ohio, at the west end of the basin, exceeded the long-term averages by a factor of 2 or more for some months in 1997–98 (fig. 8). Over-all, the mean annual streamflow in the Maumee River was 25 percent above average during the sampling period. For Cattaraugus Creek at Gowanda, N.Y., at the east end of the basin, mean monthly stream-flow during 1996–98 closely fol-lowed the long-term average (fig. 8). In most areas of the basin, higher than average streamflows were observed in water years 1996–98.
Increased streamflow tends to carry higher concentrations of materials associated with land- surface runoff. Low streamflow conditions tend to increase concen-trations of materials associated with industrial and municipal dis-charges or ground water.
ie-Lake Saint Clair Drainages 5
months.

MAJOR FINDINGS
Met
olach
lor
Atrazin
e
Cyana
zine
Aceto
chlor
yana
zine
Aceto
chl
Alachlo
r
Glypho
sate
Pendim
etha
lin
Glypho
sate
Pendim
etha
l2,
4-D
Benta
zon
Dicam
ba
Met
ribuz
in
Dimet
hena
mid
Linur
on
Acifluo
rfen
Imaz
aquin
0
2,500,000
500,000
1,000,000
1,500,000
2,000,000
s yl p n e yl s e d n0
8,000
2,000
4,000
6,000
HERBICIDES
INSECTICIDESPE
ST
ICID
E U
SE
,IN
PO
UN
DS
OF
AC
TIV
E IN
GR
ED
IEN
T
The quality of streams and ground water in the Lake Erie-Lake Saint Clair Drainages is affected by a complex combination of natural factors (precipitation, streamflow, geology) and human factors (land use, chemical use, population den-sity). Specific parts of the basin were targeted for investigation because they have particular com-binations of natural and human fac-tors. (See Appendix for details.) A primary factor that was found to influence water quality was land use, and this factor is emphasized throughout the report.
Chlorp
yrifo
Carba
r
Ethop
ro
Endos
ulfa
Phora
t
Azinph
os-m
eth
Met
ham
idoph
o
Cryoli
t
Imida
clopr
i
Met
hyl P
arat
hio
Figure 9. A total of nearly 8.3 million pounds of pesticides was applied in the agricultural areas of the Lake Erie-Lake Saint Clair Drainages during 1994–95. (Data from Brody and others, 1997.)
Pesticides were detected in every stream sample
Between March 1996 and Febru-ary 1998, 305 samples were col-lected from 10 streams in the basin. Every sample contained at least one pesticide, and most contained mixtures of several pesticides. Some samples contained a mixture of 18 pesticide compounds, which is among the highest number of pesticides detected in a sample nationally.
6 Water Quality in the Lake Erie-L
0
RowCrop
Metolachlor
Atrazine
Deethylatrazine
Cyanazine
Acetochlor
Alachlor
Metribuzin
Linuron
Simazine
DCPA
Prometon
2,4-D
Tebuthiuron
Diazinon
Chlorpyrifos
Carbaryl
20 40 60 80 2100 0
Figure 10. Metolachlor, atrazine, deethyherbicides. Diazinon, chlorpyrifos, and c
More pesticides were detected in large streams than small streams. Overall, 30 different pes-ticides were detected within the basin. The number of pesticides detected was greater in large
ake Saint Clair Drainages
Pasture/forest
PERCENTAGE OF DETECTIONS
10040 60 80 0
Urban
0 40 60 80 100 0 20
latrazine, cyanazine, and simazine were tharbaryl were the most frequently detected
streams and rivers that drain areas of mixed land use (urban and agri-cultural) than in smaller streams that drain basins dominated by a single land use.
Urban andagriculturalherbicides
Insecticides
Mixed
Row-cropherbicides
EXPLANATION
10020 40 60 80
e most frequently detected insecticides.

1996 1997 1998
0
50
10
20
30
40
0
0.4
0.1
0.2
0.3
PE
ST
ICID
E C
ON
CE
NT
RAT
ION
,IN
MIC
RO
GR
AM
S P
ER
LIT
ER
Auglaize River (row-crop basin)
Clinton River (urban basin)
ATRAZINE
DIAZINON
Maximum 85 µg/l
A M J J A SSS OOO NNN DDD JJJ F MMM A MMMMMMM J JJ AAA SSS OO N DDD JJJ FM
Figure 11. The concentration of atrazine was higher in streams draining row-crops, whereas the concentration of diazinon was higher in streams draining urban-land use.
M J J A S O N D J F M A1997 1998
0
3
1
2
ST
RE
AM
FLO
W,
IN C
UB
IC F
EE
T P
ER
SE
CO
ND
0
6,000
1,000
2,000
3,000
4,000
5,000
PE
ST
ICID
E C
ON
CE
NT
RAT
ION
,IN
MIC
RO
GR
AM
S P
ER
LIT
ER
STREAMFLOW
ALACHLOR
ALACHLOR ESA
ALACHLOR OA
St. Joseph River near Newville, Indiana
A
Figure 12. Metabolite concentrations for alachlor, as well as acetochlor and metolachlor (not shown), were greater than parent compounds for much of the year.
The pesticides most frequently detected in streams were generally those most heavily applied
Pesticide applications to crops in the Lake Erie-Lake Saint Clair Drainages are among the highest nationwide. The five most heavily applied agricultural pesti-cides—metolachlor, atrazine, cyanazine, acetochlor, and alachlor—were also among the most frequently detected (figs. 9 and 10). Atrazine was detected in every stream-water sample col-lected during 1996–98 (fig. 10). Metolachlor was detected in 99 percent of samples, and simazine was detected in greater than 80 per-cent of samples, regardless of land use (fig. 10). Two pesticides that are heavily used in the basin were not analyzed for in this study: (1) glyphosate, an herbicide used in agricultural and urban areas, and (2) endosulfan, an organochlorine insecticide, which was analyzed for in streambed sediment but not in water.
Pesticides detected more fre-quently in urban than in agricul-tural areas include the herbicide prometon and the insecticides diaz-inon and chlorpyrifos (figs. 10 and 11). Chlorpyrifos (Dursban), which was detected in 22 percent of the samples, was recently restricted for residential and commercial use by the U.S. Environmental Protection Agency (USEPA).
Historical-use pesticides are seldom detected in water. Aldrin and DDT are organochlorine insec-ticides banned in the mid-1970s. Their metabolites (dieldrin and DDE) were each detected in about 1 percent of stream samples. In contrast, total DDT was detected in
nearly 35 percent of all streambed sediment samples (fig. 19, p. 13).
Pesticide metabolites were frequently detected
Little is known about pesticide metabolites (breakdown products) on a watershed level. After applica-tion, most pesticides adsorb to soil, infiltrate to ground water, volatil-ize, or break down to a metabolite (Larson and others, 1999). Deethy-latrazine, a metabolite of atrazine, was detected in every sample col-lected during 1996–98. Additional
triazine and acetanilide herbicides and their metabolites were inten-sively sampled for at one site, the St. Joseph River near Newville, Ind. Here, the metabolites of triaz-ine compounds, like atrazine, showed the same seasonal pattern and relative concentrations as par-ent compounds. In contrast, con-centrations of the acetanilide parent compounds—alachlor, acetochlor, and metolachlor—were lower than those of their metabolites for most of the year (fig. 12).
Major Findings 7

25
5
10
15
20
ST
RE
AM
FLO
W,
UB
IC F
EE
T P
ER
SE
CO
ND
10,000
2,000
4,000
6,000
8,000
RA
ZIN
E C
ON
CE
NT
RAT
ION
,M
ICR
OG
RA
MS
PE
R L
ITE
R STREAMFLOW
ATRAZINE
MaximumContaminant
Level
No benchmarks for metabolites have been set to protect human health or aquatic life, but some metabolites are believed to be as toxic as parent compounds (Day, 1991). Because metabolites may account for a significant amount of the total pesticides in the environ-ment, they are considered a water-quality concern.
M A M J J A S O N D J F M A M J J A S O N D J F M A M J J A S1996 1997 1998
0
IN C
0
AT IN
Figure 13. Pesticides such as atrazine show a seasonal trend with streamflow, asshown for the St. Joseph River near Newville, Ind. Differences in the amount andtiming of precipitation affect the concentrations, as illustrated by the differences between the wet years of 1996–97 and the dry year of 1998.
Site and primaryland use
Auglaize River, Ohio 2.4 8.9
3.0
1.6 5.5
PASTURE/FOREST LAND USE
0.04
0.53 1.3
0.10
2.8
2.6 9.3
1 Stream is used as a source of drinking water1
River Raisin, Mich.
Black River, Mich.
St. Joseph River, Ind.
URBAN LAND USE
MIXED LAND USE
ROW-CROP LAND USE
Cattaraugus Creek, N.Y.
Maumee River, Ohio
Maumee River, Ind.
Cuyahoga River, Ohio
Clinton River, Mich.
Grand River, Ohio
Bold indicates concentration is greater than the
USEPA's aquatic-life guideline for atrazine of 1.8
micrograms per liter.
Concentrations ofatrazine
Annualaverage(µg/L)
May - Julyaverage(µg/L)
1
11
11
1
0.090.04
0.91
0.11
0.080.04
0.24
10.1
Table 1. Annual and seasonal time-weighted average concentrations of atrazine at 10 stream sites in the Lake Erie-Lake Saint Clair Drainages, 1996–98
Pesticide concentrations in streams are related to land use, rainfall, runoff, and season
Herbicide concentrations were highest in streams draining row-crops followed by streams draining mixed-use and urban land, and were lowest in streams draining pasture/forested land. Atrazine was detected at the highest concentra-tions, as high as 85 µg/L (micro-grams per liter), in streams draining row crops and at much lower concentrations in streams draining urban land (fig. 11).
Rainfall and runoff affected the concentrations of atrazine in the wet years of 1996–97 compared to the dry year of 1998 in the St. Joseph River near Newville, Ind. (fig. 13). In 1996, streamflow was 330 to 340 percent above average in May and June; in 1997, stream-flow was 103 to 129 percent above average in May and June; and in 1998, streamflow was only 36 to 78 percent of the average. The median atrazine concentration detected in the stream was 0.40 µg/L in 1996, 0.45 µg/L in 1997, and 0.14 µg/L in 1998.
Herbicide concentrations in streams are typically highest after application and steadily decrease thereafter. Elevated con-centrations of the most heavily used herbicides—metolachlor, atrazine, cyanazine, and ace-
8 Water Quality in the Lake Erie-
tochlor—were detected for 4 to 6 weeks after rainfall and runoff in the spring and early summer (fig. 13, table 1). Pesticides used mostly in urban areas, such as prometon and diazinon, are typically applied in late summer, and this is when the highest concentrations were detected in streams (fig. 11).
Pesticide concentrations in streams have public- health and economic consequences
When concentrations of a contaminant in stream water are greater than a Maximum Contaminant Level (MCL), treatment might be needed to reduce the concentration (Box 1).
The time-weighted aver-age annual concentrations of atrazine were not greater than the drinking-water standard, or MCL, of 3 µg/L at any of the 10
Lake Saint Clair Drainages

Cre
ek
Cat
tara
ugus
Gra
nd R
iver
Clin
ton
Rive
r
Rive
r Rai
sin
Blac
k R
iver
St. J
osep
h R
iver
Augl
aize
Rive
r
Cuy
ahog
a R
iver
Mau
mee
Rive
r,
Ind.
O
hio
Mau
mee
Rive
r,
0
30
10
20
NU
MB
ER
OF
EX
CE
ED
AN
CE
S
PRIMARY LAND USE
Pasture/forest
Urban
Row crop
Mixed
Figure 14. The greatest number of concentrations ofpesticides affecting aquatic life were detected in streamsdraining row crops and mixed-use land.
stream sites sampled during 1996–98 (table 1). The values from May–July, however, were greater than the MCL at five stream sites (table 1), indicating a need for source-water treatment during that period to remove the pesticides.
Many large water-treatment facilities that withdraw surface water (other than Lake Erie) use activated-carbon filtration during the spring to meet drinking-water standards. In areas of heavy pesti-cide use, specialized treatment may be necessary year round. For exam-ple, the Fort Wayne Water-Filtra-tion Plant uses activated carbon all year. The annual cost of the treat-ment chemicals at Fort Wayne is approximately $210,000, about 40 percent of this amount being spent from April to July (Doug Pooler, Fort Wayne Water Filtration Plant, oral commun., 1999). Even with carbon treatment, some treated drinking-water samples tested for atrazine were in excess of the MCL
during 1996–98 (Kelleher, 1999).
Another consequence of heavy pesticide use is the potential effect on aquatic life
Of the 10 streams sampled, 8 had pes-ticide concentra-tions, in single samples, in excess of one or more aquatic-life guide-lines (fig. 14) (Frey, in press). Concen-
trations in excess of aquatic-life guidelines were detected for the herbicides atrazine, metolachlor, cyanazine, and metribuzin, and for the insecti-cides chlorpyrifos, carbaryl, and diazinon. Heavily used com-pounds—metolachlor, atrazine, cyanazine, and metribuzin—were the compounds with concentrationsmost frequently greater than guide-lines. The time-weighted average concentration of atrazine, for example, was in excess of the 1.8-µg/L guideline at 3 of 10 sites annually and at 5 of 10 sites during May–July (table 1).
Box 1—What concentrations of pesticides are considered safe in drinking water? The USEPA sets drinking-water standards, or Maximum Contaminant Levels (MCLs), and health advisory–lifetime quide-lines (HALs) for drinking water, to protect human health. The MCL is the maximum permissible concentration of a con-taminant in water delivered to any user of public water systems. MCLs are enforceable standards and are based on an average annual concentration taken from quarterly samples of finished drinking water. HA (Health Advisories) are nonen-forceable, risk-based guidelines. Health advisories indicate contaminant exposures below which no short- or long-term adverse human-health effects are expected, based on drinking a specific amount of water for a specific period of time. Risk of illness increases with exposure time and concentration. This report lists only HALs, which are based on a lifetime of 70 years. Standards and guidelines to evaluate the potential adverse effects of pesticides have limitations: (1) Few standards and guidelines have been set for pesticides; of the 88 pesticides analyzed in this study, only 14 MCLs and 38 HALs have been established. (2) Drinking-water standards are based on toxicity tests on a single pesticide and do not evaluate the addi-tive or synergistic effects of multiple pesticides. (3) The standards and guidelines do not address possible effects of pesti-cides on endocrine systems of humans (Nowell and Resek, 1994; Larson and others, 1999).
Box 2—What concentrations of pesticides are considered safe for aquatic life? Several agencies, including the USEPA, Environment Canada, and the IJC (International Joint Commission), have set guide-lines to protect aquatic life. These guidelines are designed to prevent adverse short-term (acute) and long-term (chronic) ef-fects on aquatic life. The aquatic-life guidelines or benchmarks developed by USEPA are based on 4-day average concentrations, are intended to protect 95 percent of the aquatic species, and should not be exceeded more than once in 3 years. The Canadian and IJC aquatic-life guidelines, which are more stringent than those of the USEPA, indicate a single maximum concentration that should never be exceeded. Aquatic-life guidelines have been developed for only 18 pesticides.
Major Findings 9

10 Water Quality in the
Black
River
BelleRiver
ClintonRiver
RiverHuron Rouge
RaisinRiver
Rive
r River
Tiffi
n
River
St. J
osep
h
Maumee
Blanchard
Rive
r
St. Marys
River Sand
usky
Augl
aize
Riv
er
River
Rive r
OHIO
IND
IAN
AO
HIO
MICHIGAN
LAKEST. CLA
MONROE
FINDLAY
ANNARBOR
LIMA
TOLEDO
DETROIT
WINDSOR
FORTWAYNE
SANDUSKY
Agricultural land useUrban land useMixed land use
STREAM TYPE
EXPLANATION
Figure 15. Median concentratErie–Lake Saint Clair Drainageguideline to control eutrophica
Concentrations of nutrients and herbicides in certain streamsare among the highest in the Nation
Because the amounts of fertilizers and herbicides applied to agricultural areas are among the highest in the Na-tion, concentrations of nutrients and herbicides in stream water also are comparatively high at 8 of 10 streams sampled during 1996–98. In eight streams draining agricultural and mixed-use land, average annual concen-trations of total phosphorus were in excess of the 0.1-mg/L (milligram per liter) guideline recommended by USEPA to reduce stream eutrophication (fig. 15). In four streams, phosphorus concentrations were in the upper 25 percent of all streams sampled nationwide by NAWQA, as were nitrate concentrations in six streams. In two streams that serve as source waters for public supply, nitrate concentrations in a few samples were detected in excess of the drinking-water standard. Although total phosphorus concentrations appear to be relatively high, the work of other investigators has shown that concentrations of total phosphorus were 40 percent lower in 1995 than in 1976 (Baker and others, 1998). In two of the streams where nutrient concentrations were in the upper 25 percent range on a national basis, average annual concentrations of herbicides were in the upper 25 percent as well. Mixtures of pesticide compounds were found in every stream sample and a total of 30 different pesticides were detected. In one sample, 18 different pesticides were detected. This sample contained more pes-ticide compounds than 98.5 percent of all the samples collected at 343 sites across the Nation during 1993–98.
Runoff from agricultural land to streams is an important pathway of phosphorus to Lake Erie
In the 1960s, Lake Erie was con-sidered “dead” from the excessive growth and decay of algae and the oxygen-depleting effects of this
Lake Erie
Cuyahoga
Black
River
UNITED STATE
CANADA
LAKIR
AKRON
CLEVELAND
ions of totas were in extion in strea
decay on the bottom water of the lake (Herdendorf, 1986). By 1971, it was well known that the major sources of phosphorus to the lake were sewage, laundry detergents, and fertilizers. The Great Lakes Water-Quality Agreement (Interna-tional Joint Commission, 1994) set goals for United States and Canada
-Lake Saint Clair Drainages
Tonawanda
Creek
River
River
Cattaraugus
Creek
BuffaloRiver
OH
IOPA
.
N.Y
.
S
E ERIE
ERIE
BUFFALO
AVERAGE ANNUAL CONCENTRATIONOF TOTAL PHOSPHORUS in milligrams per liter
Upper 25 percent (greater than 0.27)Middle 50 percent (0.05 to 0.27)Lower 25 percent (less than 0.05)
Bold outline indicates median value greater than USEPA desired goal of 0.1 milligram per liter for prevention of nuisance plant growth in flowing watersnot discharging directly to lakes and impoundments
BACKGROUND CONCENTRATION
EXPLANATION
Grand
PA.
l phosphorus at 8 of 10 sites in the Lakecess of 0.1 milligram per liter, the USEPA
ms.
to reduce phosphorus inputs to the lake. Actions taken to reduce phos-phorus included a limit on the phosphorus content of detergents, a limit of 1.0 mg/L in discharges from sewage-treatment plants, and a total load limit for Lake Erie of 11,000 metric tons per year (Inter-national Joint Commission, 1994). Having achieved the point-source reductions over the period 1968–92 (Litke, 1999), the focus shifted to reducing nonpoint sources of phos-phorus.
A sustained focus on reducing nonpoint sources of phosphorus to Lake Erie has continued because oxygen depletion in the bottom water in some areas occurs inter-mittently (Bertram, 1993; Litke, 1999). One reason may be that in years with above-average runoff, annual phosphorus loads to the lake exceed 11,000 metric tons (Dolan, 1993). The excess phosphorus in wet years is thought to come from nonpoint sources (Dolan, 1993).

0
200
400
600
800
1,000
1,200
1,400
1,600
1,800Phosphorus inputs/outputs
UrbanMixedRow cropPasture/forest
Clinto
n Rive
r
River R
aisin
Gra
nd R
iver
Catta
raug
us C
reek
Black
Rive
rSt.
Jose
ph R
iver
Augla
ize R
iver
Cuyah
oga
River
Mau
mee
Rive
r-New
Hav
en
Mau
mee
Rive
r-Wat
ervil
le
TO
TA
L P
HO
SP
HO
RU
S,
IN K
ILO
GR
AM
S P
ER
SQ
UA
RE
KIL
OM
ET
ER
LAND USE
Figure 16. Unit-area phosphorus inputs to the land surfacefrom fertilizer and manure and unit-area phosphorus out-puts from 10 streams in the Lake Erie-Lake Saint ClairDrainages, 1996–98.
Fertilizers appear to be the major nonpoint sources of phos-phorus to Lake Erie. Greater amounts of phosphorus were applied as fertilizers to each square kilometer of agricultural and mixed-use land than to urban-resi-dential land in 1996–98 (fig. 16). Phosphorus yields, or the amount of phosphorus discharged from a stream per unit area of its basin, ranged from 8.2 to 293 kg/km2 (kilograms per square kilometer). The phosphorus yield from only 1 of 10 streams sampled during 1996–98 was in the lower range of yields typical of streams flowing through undeveloped land (Clark and others, 2000). Phosphorus yields in eight streams were similar to or slightly higher than the yields typical of streams flowing through agricultural and mixed-use lands (Gibson and others, 2000).
Phosphorus concentrations were highest in the same streams where yields were highest. Therefore, streams receiving runoff from agri-cultural and mixed-use lands con-tributed greater concentrations and amounts of phosphorus to Lake Erie than did streams receiving runoff from urban-residential land
(fig. 16). A conclu-sion is that agricul-tural runoff is an important non-point source of phosphorus to small streams and major rivers and that major rivers, like the Maumee River, provide a direct pathway to Lake Erie. During 1996–98, the Maumee River contributed an average of 24 per-cent per year to the 11,000-metric-ton limit.
In the last few years, phosphorus concentrations in Lake Erie appear to be increasing above levels rec-ommended in the Great Lakes Water-
Quality Agree-ment (Scott Painter, Environment Canada, written commun., Oct. 2000). Continued emphasis on managing levels of phosphorus inLake Erie appears to be warranted (Box 3).
Box 3—Recent changes in the food web of Lake Erie-the role of phosphorus and zebra musselsConcerns about recent declines in some important fish species and the proliferation of zebra mussels, an exotic species, have prompted a renewed interest in the role of phosphorus in Lake Erie. Zebra mussels (shown in the photograph) were introduced into Lake Saint Clair in the mid-1980s and quickly became established in Lake Erie. Because of their filter-feeding behavior, zebra mussels may be affecting fish production in Lake Erie by consuming large amounts of small invertebrates and algae, or plankton, that are the food for small fish, which in turn are the food of larger game fish like yellow perch and walleye. Recent decreases in sport- and commercial-fish harvests, proliferation of zebra mussels, and
Photograph from Ohio Lake Erie Commission.
reductions in phosphorus concentrations in Lake Erie have prompted a renewed inter-est in how factors such as phosphorus and zebra mussels may be affecting sustainable fish harvests. Adding more phosphorus to the lake to stimulate algal productivity has been suggested, but this could result in increased eutrophication of tributary streams and a return to excessive oxygen depletion in the bottom water of the lake. Further-more, uncertainties about the response of the lake to phosphorus additions in light of its changing food web have held back plans to apply such a solution. One thing about which everyone can agree is the remarkable ability of exotic species to cause unexpect-ed consequences in ecosystems (U.S. Environmental Protection Agency and Environ-ment Canada, 2000).
Major Findings 11

Conservation tillage
Suspended-sedimenttrend line
0.10
0.05
0.00
-0.05
-0.101970 1975 1980 1985 19909 1995
50
40
30
20
10
0
PE
RC
EN
TAG
E O
F F
IELD
S IN
CO
NS
ER
VAT
ION
TIL
LAG
E IN
NO
RT
HW
ES
TE
RN
OH
IO, 1
982–
98
ST
RE
AM
FLO
W-C
OR
RE
CT
ED
DA
ILY
SU
SP
EN
DE
D-
SE
DIM
EN
T, IN
NAT
UR
AL
LOG
UN
ITS
Figure 18. Increases in conservation tillage in the Maumee River Basin and elsewhere in northwestern Ohio correspond to decreases in the amount of suspended-sediment carried by the Maumee River at Waterville, Ohio.
Decreases in the amounts of suspended sediment carried by rivers correspond to increases in farmers’ use of conservation tillage
Cropland in the Maumee River Basin is the largest contributor to soil erosion and sediment in the Maumee River (U.S. Department of Agriculture, 1998), and the river is the largest tributary source of suspended sediments to Lake Erie (Myers and others, 2000). Exces-sive amounts of sediment dis-charged from the Maumee River to Lake Erie diminishes the aquatic habitats of fish and other organ-isms. Maintenance of navigation requires the dredging of approxi-mately 800,000 tons of sediment each year from the Maumee River and Lake Erie at an average annual cost of about $2.2 million. In response to these problems, the Ohio Lake Erie Commission has set a goal of reducing suspended sediment in Lake Erie tributaries by 67 percent (Ohio Lake Erie Commission, 1998), and the U.S. Army Corps of Engineers has set a
12 Water Quality in the Lake Erie-
Figure 17. Conservation tillage protectsthe soil. (Photograph by Steven Davis,Natural Resources Conservation Ser-vice).
goal of reducing the amount of sed-iment dredged from the lower river and its harbor by 15 percent.
Conservation tillage (fig. 17) is a reduced-cultivation method that is being used to decrease soil erosion and thereby the amount of sus-pended sediment carried by the Maumee River and its tributaries. By maintaining a layer of crop resi-due from the past year’s crop on 30 percent or more of the soil surface, conservation tillage protects the soil from the forces of water ero-sion. During 1993–98, about 53 percent of all crop fields in the Maumee River Basin and about 50 percent of the crop fields in north-western Ohio were planted using conservation tillage methods (fig. 18).
Significant decreases in the amounts of suspended sediment carried by the Maumee and Auglaize Rivers over time corre-spond to increases in conserva-tion tillage. Data from previous studies and new data collected at two sites in the Maumee River Basin during 1996–98 support this conclusion (Myers and others, 2000). An 11.2-percent decrease in
Lake Saint Clair Drainages
the amount of suspended sediment carried by the Maumee River was detected at Waterville, Ohio, near the mouth (fig. 18), and a 49.8-per-cent decrease was detected in the amount carried by the Auglaize River near Fort Jennings, Ohio, a tributary stream (Myers and others, 2000). During 1970–98, no trends in streamflow at these two sites were detected. If conditions lead-ing to the downward trends remain the same, then the estimated time necessary to achieve the 15 and 67 percent reduction goals are 30.1 and 205 years, respectively, from the reference condition in 1992.
One reason for the smaller downward trend in the Maumee River compared to that found in its tributary may be related to drain-age-basin size. In the large drain-age basin of the Maumee River, sediment is deposited in small drainage ditches and streams. These stored sediments are avail-able for resuspension and transport in subsequent storms.This process, as described by Trimble (1975, 1999), creates a lag in the response of rivers to conservation tillage on the land.

0
10
20
30
40
50
60
70
80
90
100
CONTAMINANT
Zinc
Anthra
cene
Total P
CB
Total D
DT
Benzo
[a]py
rene
a]p
Benz[a
]anthr
acen
e
a]aPhena
nthre
ne
Chrys
ene
Total P
AH
Mercu
ry
Cadmium
Arsenic
Coppe
rLe
ad
Mirex +
Pho
tomire
x
Hexac
hloro
benz
ene
Linda
ne
Chlord
ane
Hexac
hloro
cyclo
hexa
ne
Dieldr
in + A
ldrin
PE
RC
EN
TA
GE
aminantPercentage of samples in which contawas detected
Percentage probability of beinggreater than a Probable Effect Levelt th P b bl Eff t L l
Figure 19. Percentage detection and percentage probability of sample concentra-tions being greater than a Probable Effect Level in bed sediments of small streams,major rivers, and lakes, Lake Erie-Lake Saint Clair Drainages, 1990–97.
Contamination of bed sediments may be causing adverse effects on aquatic life
Bed sediments of small streams and major rivers provide habitat for many aquatic organisms but also serve as a repository for per-sistent and toxic chemical contami-nants that have been released into the environment or that occur natu-rally. Sediments, once contami-nated, can provide a pathway for bioaccumulation. Activities such as dredging of sediments can release contaminants to the sur-rounding water.
Evidence from laboratory tests shows that contaminated bed sedi-ments can be toxic to aquatic invertebrates (worms, clams, and insect larvae) that are of recre-ational, commercial, or ecological importance. Contaminated sedi-ments also can affect the food supply required to sustain fish pop-ulations (U.S. Environmental Pro-tection Agency, 1997).
Data collected by the U.S. Geo-logical Survey (USGS) and other public-sector agencies at more than 800 locations from 1990 to 1997 were aggregated and analyzed to assess bed-sediment contamina-tion. These data show that zinc, lead, copper, arsenic, cadmium, mercury, PAHs (polycyclic aro-matic hydrocarbons), PCBs (total polychlorinated biphe-nyls), DDT, and its breakdown products are prevalent in bed sediments, being detected in 30 to 100 percent of samples (Rheaume and others, in press) (fig. 19).
Concentrations of mercury and PCBs (figs. 20 and 21) exceeded Probable Effect Levels (PELs) in 11.8 and 22.4 percent of samples, respectively. PELs are the guide-
lines established for the protection of aquatic life (Box 4). Contamina-tion of bed sediments with mercury and PCBs was greatest in nearshore areas of Lake Erie, in Lake Saint Clair, and in major rivers that flow through urban areas with industry and populations over 100,000.
Concentrations of arsenic, DDT, and chlordane also exceeded PELs
in the bed sediments of some smaller streams. Samples with detection limits higher than Threshold Effect Levels (TELs) (open circles, figs. 20 and 21) were not useful for assessment purposes. Lower detection limits would have made these data more useful.
Box 4—How are contaminated sediments evaluated?Effect levels are screening values used to indicate when contaminant concentra-tions in the bed sediments are likely to be associated with adverse effects on aquatic life. The Threshold Effect Level (TEL) is an estimate of the concentra-tion of a contaminant in bed sediment below which adverse biological effects rarely occur and, if so, only in very sensitive species. The Probable Effect Level (PEL) is an estimate of the concentration of a contaminant in bed sediment above which adverse biological effects frequently occur. These guidelines were developed for the Great Lakes sediments and are used for national assessment in this report. For anthracene and total PAHs, no guideline was available from Smith and others (1996), so guidelines developed by Ingersoll and others (1996) for the Great Lakes were used.
Major Findings 13

UNITED STATES
CANADA
LAKE ERIELAKE
ST. CLAIR
Aquatic effects (Smith and others, 1996)TEL - Threshold Effect Level (0.174 mg/kg)PEL - Probable Effect Level (0.486 mg/kg)
Total Mercury
EXPLANATION
Not detected; detection limit equal toor greater than TELLess than TELEqual to or greater than TEL andless than PELEqual to or greater than PEL andless than 10 times PELEqual to or greater than 10 times PELand less than 100 times the PELEqual to or greater than 100 times PEL
CONCENTRATIONS, IN MILLIGRAMS PER KILOGRAM
Figure 20. Concentrations of total mercury in recently deposited lakebed andstreambed sediments (Data from 1990–97).
UNITED STATES
CANADA
LAKE ERIELAKE
ST. CLAIR
Aquatic effects (Smith and others, 1996)TEL - Threshold Effect Level (0.0341 mg/kg)PEL - Probable Effect Level (0.277 mg/kg)
Total PCB
Figure 21. Concentrations of total PCB in recently deposited lakebed andstreambed sediments (Data from 1990–97).
Figure 22. Total chlordane, total DDT,dieldrin, heptachlor epoxide, mercury,and total PCBs were detected in thetissues of carp, rock bass, and north-ern hog suckers collected in 1996–97.
Land use and chemical use contribute to contamination of sediments and fish
Most organochlorine pesticides and PCBs have not been manufac-tured or used in the United States for at least 10–25 years; however, because of their chemical stability (persistence), they were detected in bed sediments and fish collected in 1996–98. Aldrin, DDT, and chlor-dane were the organochlorine insecticides used in the greatest quantities in the Corn Belt and Great Lakes States in the 1970s. Similarly, historical use of PCBs in industry contributed to their occur-
14 Water Quality in the Lake Erie
rence in urban and mixed-use areas.
The highest concentrations of DDT, chlordane, dieldrin, and their breakdown products were detected in bed sediments and fish collected from small streams and major riv-ers flowing through row-crop, urban, and mixed-use lands. The highest concentrations of PCBs, DDT, and chlordane were detected in bed sediments and fish from streams flowing through urban and mixed-use lands where historical use was greatest. Organochlorine contamination was the lowest in fish and sediments collected from streams in pasture/forest settings.
-Lake Saint Clair Drainages
Unlike organochlorine com-pounds, mercury has more than 2,000 uses in industry, medicine, agriculture, and commerce. Mer-cury also is released to the atmo-sphere as a by-product of coal combustion and waste incineration (Irwin and others, 1997). In 1996–97, mercury was detected in all 15 bed-sediment samples and in all 11 fish-liver samples collected from streams, independent of land-use type. The highest concentrations of mercury, however, were detected in bed sediments and fish collected from small streams and major riv-ers that flow through urban and mixed-use lands. The magnitude of mercury contamination in bed sedi-ments and fish appears to follow patterns of use in commerce and industry. Mercury was detected in several different fish species that have different feeding habits and that occupy different positions in the food web. Mercury was detected in carp, which are bottom-feeders, in northern hog suckers, which eat insects, and in rock bass, which eat smaller fish (fig. 22).

widespread human consumption advisories for fish in the Lake Erie Basin, mercury and PCBs have been identified as critical pollutants and targeted by the USEPA and
Environment Canada for cleanup and elimination (Daher, 1999).
Compound foundin fish tissue
Number ofsites withdetections(11 sitessampled)
Maximiumdetected
concentra-tion (µg/kg)
NYSDEC whole-fishquideline for the
protection of fish-eating wildlife
(µg/kg)
Number ofsites withcontamin-
ation inexcess ofNYSDECcriteria
Chlordane, total 6 157 500 0
DDT, total 10 450 200 2
Dieldrin 5 32.0 120 0
Heptachlor epoxide 2 10.0 100 0
PCBs, total 8 3,200 130 6
Table 2. Summary of contaminant concentrations in fish tissue in relation to guide-lines for the protection of fish-eating wildlife [µg/kg, micrograms per kilogram;NYSDEC, New York State Department of Environmental Conservation]
1. Contamimants are washed into water and build up in the sediment
2. Bottom-dwelling organisms such as zebra mussels concentrate contaminants and are then eaten by goby and other small fish
3. Predator species like small mouth bass continue to concentrate toxins by eating the goby. Bass are then consumed by humans
Figure 23. Contaminants can bioaccumulate upward through the food web and mayaffect the health of human and animal consumers of fish.
Bioaccumulative contaminants in fish may pose a risk to fish-eating wildlife
Where PCBs were detected in fish, they frequently posed a threat to fish-eating wildlife because of their high concentrations. PCBs were found in fish at 8 of 11 sites, and concentrations in fish from 6 sites exceeded the New York State guideline for the protection of fish-eating wildlife (table 2). The maxi-mum concentration of PCBs found in fish was 25 times higher than the guideline set by the New York State Department of Environmental Conservation (NYSDEC) for the protection of fish-eating wildlife (Newell and others, 1987). These fish were collected from the Cuya-hoga River at Cleveland, Ohio, a major river that flows through mixed-use land.
DDT was present in fish at 10 of 11 sites but concentrations in fish from only 2 sites exceeded the NYSDEC guideline. The highest concentrations of DDT were in whole fish in streams flowing through urban and mixed-use land—the Clinton River at Sterling Heights, Mich., and the Cuyahoga River at Cleveland, Ohio. Although mercury is a concern, no wildlife consumption guidelines have been established.
Fish-consumption restrictions for humans are based on contami-nant concentrations in edible fish fillets, which are typically lower than those in whole fish. The con-taminants of most concern in the Lake Erie Basin for human con-sumption of fish are mercury, PCBs, DDT, chlordane, and dield-rin. These are the same contami-nants that are a concern for wildlife consumption (fig. 23). Because of
Major Findings 15

Clinton River
Fish Creek
W.Br. St. J
oseph Rive
r
E.Br. St. J
oseph Rive
r
Br. St. J
oseph Rive
r
E.Br. St. J
oseph Riv
River R
aisin
eph River
River R
ais
Auglaize Rive
r
Black Rive
r
ze Rive
Black Ri
St. Jose
ph River
Grand River
Cattaraugus C
reek
Cuyahoga Rive
r
raugus Creek
Cuyahoga Ri
Maumee River, I
nd.
Maumee River, O
hio0
160
20
40
60
80
100
120
140
PE
RC
EN
TA
GE
OF
AT
TA
INM
EN
T
OF
TH
E IN
DE
X O
F B
IOT
IC
INT
EG
RIT
Y (
IBI)
0
100
20
40
60
80
QU
ALI
TA
TIV
E H
AB
ITA
T
EV
ALU
AT
ION
IND
EX
(Q
HE
I)
PRIMARY LAND USE
URBAN
ROW CROP
PASTURE/FOREST
MIXED
No
QH
EI
EXPLANATION
A
B
Scores at or above theline indicate the stream-channel habitat is ratedgood to excellant
Scores at or above theline indicate the fishcommunity is ratedgood to excellant
Figure 24. Although most stream sites were rated good to excellent for habitatas measured by the Qualitative Habitat Evaluation Index (A), only five siteswere rated good to excellent for fish community composition as measured bythe Index of Biotic Integrity (B).
Land use appears to affect fish-community composition
Contaminants and nutrients in water and bed sediments appear to affect aquatic life, but human dis-turbance of physical stream habitat also is thought to be one of the most important causes of declines in certain fish species (Ohio Envi-ronmental Protection Agency, 1995). To differentiate the effects on fish of human disturbance from those of contaminants, sites consid-ered to represent good to excellent stream habitat, as rated by the Qualitative Habitat Evaluation Index (QHEI) (Box 5) were selected for assessment of fish. Fish communities were assessed by means of the Index of Biotic Integ-rity (Box 5). In 1996–98, stream habitats wererated good to excellent at 11 of 13sites (fig. 24A), but fish communi-ties were rated good to excellent atonly 5 sites (fig. 24B). This may bean indication that the contaminantsdetected in water and bed sediments
1
Box 5—Index of Biotic Integrity and Qualitative Habitat Evaluation IndexAquatic biological communities are sensitive indicators of stream quality. The biological condition of streams is evaluated within water-quality assessment programs by comparing the type, number, and abundance of fish species to those of streams known to be “least impacted” by human activities. The Index of Biotic Integrity (IBI), used by the Ohio Environmental Protection Agency (Ohio Environmental Protection Agency, 1989), also was used in this study to assess fish-community composition. IBI scores are derived by summing 12 individual metric scores from separate factors that describe fish communities. Examples of such metrics are the number of taxa, the number of insect-eating or omnivorous species, the number of pollution-tolerant and pollution-intolerant species, and the rela-tive abundance of fish in each of these categories. Scores for the IBI range from 12 to 60; with ratings of poor, fair, good, and excellent quality assigned to numerical ranges. Higher scores indicate better overall fish-community diversity and abundance. Because the minimum IBI score required for a “good” rating differs somewhat from one ecological region to another, and there are five such regions in this study, each IBI score was reported as a percent-age attainment of a “good” rating. A comparison of IBI scores computed independently for the same sites in the same years by the Ohio Environmental Protection Agency and USGS show that results are comparable between the two agencies as long as fish-collection methods are appropriate for the stream size (Covert, in press). A Qualitative Habitat Evaluation Index (QHEI), also developed by the Ohio Environmental Protection Agency (1989), was applied to data collected by USGS at the same stream sites where fish were assessed. The QHEI is composed of seven metrics that describe the physical habitat of streams: width, depth, pools, riffles, grain size of streambed sub-strates, and vegetation type and width along stream banks. Scores for the QHEI range from 0 to 100, with scores of 60 or better indicating excellent stream-channel habitat.
6 Water Quality in the Lake Erie-Lake Saint Clair Drainages

0
60
10
20
30
40
50
IND
EX
OF
BIO
TIC
IN
TE
GR
ITY
(IB
I)
Fish Creek
West Branch St. Joseph River
East Branch St. Joseph River
St. Joseph River
Black RiverAuglaize River
River Raisin
0 102 4 6 8
RATIO OF PERCENTAGE OF BASIN IN ROW CROPS TO PERCENTAGEIN FOREST
0
10
5
INT
OL
ER
AN
T S
PE
CIE
S (
NU
MB
ER
)
Sites with percentages at or above the line arecomparable to "least impacted" sites
Auglaize River
Black River
Fish Creek
River Raisin
West Branch St. Joseph River
St. Joseph Riverp
East BranchSt. Joseph Riverrr
A
B
Figure 25. As the percentage of row-crop land use in-creased in a stream basin (A) scores for the Index of Bi-otic Integrity decreased and (B) the number of pollution-intolerant fish decreased.
are affecting fish-community com-position.
For example, agricultural run-off appears to be affecting fish communities in streams drain-ing row crops. Agricultural prac-tices can heavily stress fish
Figure 26. High-quality stream habitat supports a varieintolerant fish species along the West Branch of the St.
communities because of runoff of pesti-cides, nutrients, and sediments (figs.14–16, 18–19). As the amount of row-crop agriculture increased, IBI scores at stream sites tended to decrease, although not proportionately (fig. 25A). In con-trast, as the amount of forested land in a basin increased, IBI scores tended to increase. Forested lands, especially along the banks of streams, have been shown to be effective in removing sedi-
ment, pesticides, and nutrients that otherwise drain into streams with runoff from the land surface (Sweeney, 1992; Lowrance and others, 1997).
Clear differences can be seen in fish-community composition
ty of pollution-Joseph River.
Figure 2ports poBranch o
among streams draining row-crops that may be related to the relative amount of row crops compared to woodlands and forests. As the amount of row-crops increased, the number of pollution-tolerant fish species in streams also increased (fig. 25B). In contrast, more pollu-tion-intolerant fish species were found in streams draining areas with lower percentages of row crops and higher percentages of forested land in their basins, especially when the forests were along streams. Although only a few sites wereexamined, it appears that pollu-tion-intolerant fish can live instreams where agriculture is theprimary land use under certainconditions. This information cor-roborates the findings of others onthe water-quality benefits providedby undisturbed natural stream habi-tats and wooded riparian areas (figs.26 and 27).
Major Findings 17
7. Poor-quality stream habitat sup-llution-tolerant fish along the Eastf the St. Joseph River.

Figure 28. Much of the recent development west of Detroit in the residential studyarea consists of low- to medium-density subdivisions. Most homes have privatewells, septic systems, and water softeners.
Recent residential development has had a widespread effect on ground-water quality
Two studies were done to assess ground-water quality in areas west of Detroit, where recent suburban development overlies sand-and- gravel deposits (Thomas, 2000a). Recent suburban development typi-cally consists of homes on large residential/rural lots or in upper-middle-class subdivisions (fig. 28). Most homes have private wells, septic systems, and water softeners.
Samples of shallow and deep ground water were collected from co-located wells (fig. 29). Shallow ground water was sampled from 30 monitor wells (median depth of 25 feet). Deeper ground water was sampled from 28 domestic wells (median depth of 93 feet). In most places, clay till of varied thickness separates the shallow and deep sand-and-gravel deposits (fig. 29).
Tritium concentrations were used to distinguish ground waters recharged before 1953 (“old waters”) from those recharged after
18 Water Quality in the Lake Erie-
0
200
100
50
150
250
WE
LL D
EP
TH
, IN
FE
ET
Figure 29. Ground-water samples were cowells and deeper domestic wells. Sand-anand at varied depths in the subsurface.
1953 (“young waters”) (Plummer and others, 1993). Water in about one-third of domestic-wells was recharged before 1953, which is prior to widespread residential development in the study area. Old waters show no evidence of human activities. All nitrate concentra-tions were less than the estimated background value of 2 mg/L (U.S. Geological Survey, 1999), and all
Lake Saint Clair Drainages
EXPLANATION
Sand and gravel
Till
Water table
30 monitor wells (median depth 25 feet)
28 domestic wells (median depth 93 feet)
llected from pairs of shallow monitord-gravel deposits are at land surface
chloride concentrations were less than 25 mg/L, the estimated back-ground concentration based on a historical data set from the same area (Mozola, 1953).
In contrast, more than 75 percent of young waters show evidence of human influence:• Seventy-six percent of young waters had chloride concentrations greater than background (fig. 30). Probable sources of elevated chlo-ride concentrations are road salt, septic systems, and backwash from water softeners. • Twenty-six percent of young waters contained nitrate concentra-tions greater than background (fig. 30). Probable sources of elevated nitrate concentrations in residen-tial areas are septic systems, lawn fertilizer, and pet waste.• Trace concentrations of VOCs were detected in 29 of the 30 sam-ples from monitor wells. The most frequently detected VOCs were BTEX compounds, which are com-ponents of fuels and solvents.
Samples that contained nitrate or VOCs also contained elevated
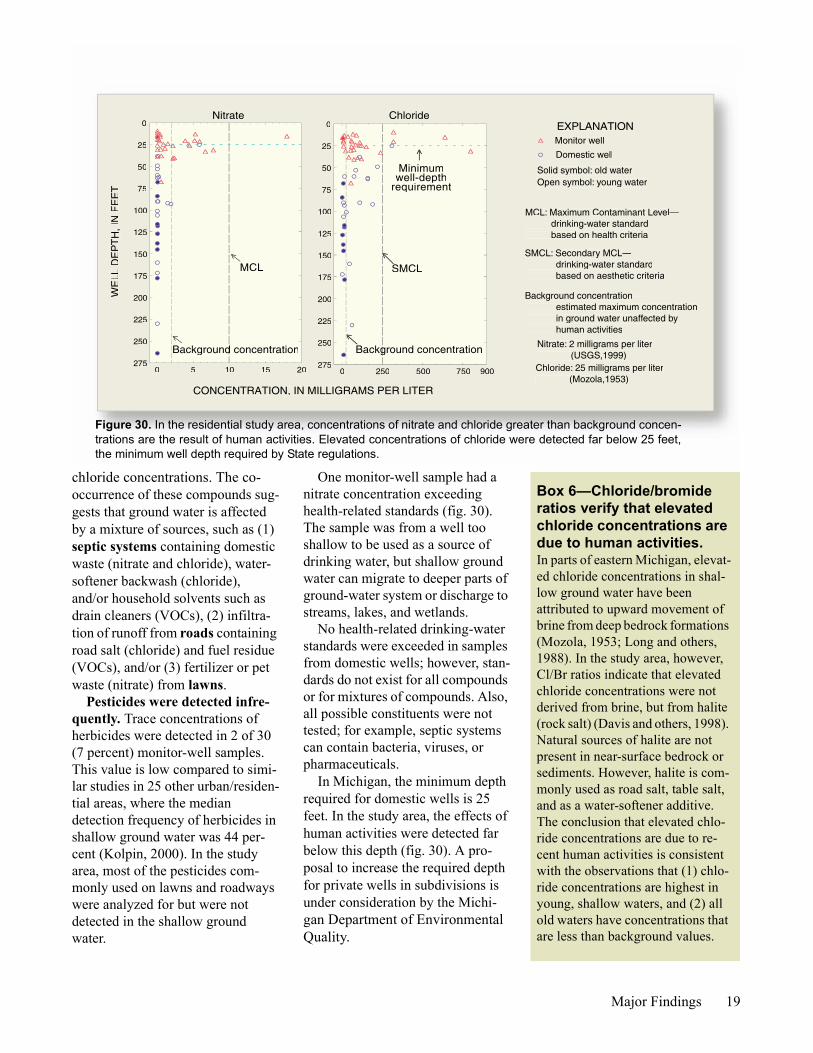
200 5 10 15
0
275
25
50
75
100
125
150
175
200
225
250
WE
LLD
EP
TH
,IN
FE
ET
9000 250 500 750
CONCENTRATION, IN MILLIGRAMS PER LITER
0
275
25
50
75
100
125
150
175
200
225
250Background concentrationg
Minimumwell-depth
requirementp
i
EXPLANATIONChlorideNitrate
MCL SMCL
Monitor well
Domestic well
Solid symbol: old waterOpen symbol: young water
MCL: Maximum Contaminant Level— drinking-water standard based on health criteria
SMCL: Secondary MCL— drinking-water standard based on aesthetic criteria
Background concentration— estimated maximum concentration in ground water unaffected by human activities
Nitrate: 2 milligrams per liter (USGS,1999)Chloride: 25 milligrams per liter (Mozola,1953)
Background concentrationd
Figure 30. In the residential study area, concentrations of nitrate and chloride greater than background concen-trations are the result of human activities. Elevated concentrations of chloride were detected far below 25 feet,the minimum well depth required by State regulations.
chloride concentrations. The co-occurrence of these compounds sug-gests that ground water is affected by a mixture of sources, such as (1) septic systems containing domestic waste (nitrate and chloride), water-softener backwash (chloride), and/or household solvents such as drain cleaners (VOCs), (2) infiltra-tion of runoff from roads containing road salt (chloride) and fuel residue (VOCs), and/or (3) fertilizer or pet waste (nitrate) from lawns.
Pesticides were detected infre-quently. Trace concentrations of herbicides were detected in 2 of 30 (7 percent) monitor-well samples. This value is low compared to simi-lar studies in 25 other urban/residen-tial areas, where the median detection frequency of herbicides in shallow ground water was 44 per-cent (Kolpin, 2000). In the study area, most of the pesticides com-monly used on lawns and roadways were analyzed for but were not detected in the shallow ground water.
One monitor-well sample had a nitrate concentration exceeding health-related standards (fig. 30). The sample was from a well too shallow to be used as a source of drinking water, but shallow ground water can migrate to deeper parts of ground-water system or discharge to streams, lakes, and wetlands.
No health-related drinking-water standards were exceeded in samples from domestic wells; however, stan-dards do not exist for all compounds or for mixtures of compounds. Also, all possible constituents were not tested; for example, septic systems can contain bacteria, viruses, or pharmaceuticals.
In Michigan, the minimum depth required for domestic wells is 25 feet. In the study area, the effects of human activities were detected far below this depth (fig. 30). A pro-posal to increase the required depth for private wells in subdivisions is under consideration by the Michi-gan Department of Environmental Quality.
Box 6—Chloride/bromide ratios verify that elevated chloride concentrations are due to human activities. In parts of eastern Michigan, elevat-ed chloride concentrations in shal-low ground water have been attributed to upward movement of brine from deep bedrock formations (Mozola, 1953; Long and others, 1988). In the study area, however, Cl/Br ratios indicate that elevated chloride concentrations were not derived from brine, but from halite (rock salt) (Davis and others, 1998). Natural sources of halite are not present in near-surface bedrock or sediments. However, halite is com-monly used as road salt, table salt, and as a water-softener additive. The conclusion that elevated chlo-ride concentrations are due to re-cent human activities is consistent with the observations that (1) chlo-ride concentrations are highest in young, shallow waters, and (2) all old waters have concentrations that are less than background values.
Major Findings 19

Figure 31. In the agricultural studyarea, the predominant crops are corn,soybeans, and small grains. (Photo-graph from Ohio Department of NaturalResources.)
Sand and gravel
Till
Tile drainsapprox. depth 3 feet
Water table
18 domestic wells (median depth 90 feet)
30 monitor wells (median depth 18 feet)
50
100
150
0 EXPLANATION
WE
LL D
EP
TH
, IN
FE
ET
Figure 32. In the agricultural study area, clay-rich till occurs at land surface. Shallow tile drains are installed in low spots of farm fields to improve drainage.
Ground water is vulnerable to contamination in agricultural areas underlain by till
Ground-water quality was assessed in agricultural areas in the northwestern part of the Lake Erie-Lake Saint Clair Drainages (Tho-mas, 2000b) (fig. 31). In this
20 Water Quality in the Lake Erie
MMMM
30 10 20
METOLACHLOR
ATRAZINE
CYANAZINE
ACETOCHLOR
ALACHLOR
OTHER
PERCENT TOTAL PESTICIDE
PESTICIDES APPLIED
Figure 33. Pesticides detected in the Lake Erie–Lake Saint Clair Draand soybeans. Metabolites were de
region, clay-rich till is at the land surface, and the rate of water infil-tration is generally less than in the residential study area, where sand and gravel are at the surface (com-pare figs. 29 and 32).
Samples of shallow ground water were collected from 30 mon-itor wells installed in the till at a
-Lake Saint Clair Drainages
0 4010 20 30
METOLACHLOR
Metolachlor ESA
Metolachlor OA
ATRAZINE
Deethylatrazine
Cyanazine amide
Acetochlor ESA
Acetochlor OA
Alachlor ESA
Alachlor OA
BROMOXYNIL
0
0.010
6.020
3.273
0.111
0.05
3.5353
1.041
USEPERCENTAGE OF SAMPLES IN WHIC
COMPOUND WAS DETECTED
0 10 20
0.0090
0.020
1.52
0.977
0.120
27 monitor wells 18 domestic
PESTICIDES DETECTED
the shallow ground water closely correspond inages (data from Brody and others, 1997). tected more frequently, and at higher concentr
median depth of 18 feet. Deeper ground water, from the glacial sand-and-gravel aquifer, was col-lected from 18 domestic wells with a median depth of 90 feet (fig. 32).
Samples were analyzed for pesti-cides in the form of parent com-pounds (the original active ingredient) and metabolites (break-
EXPLANATION
Analysis from the USGSOrganic Chemistry Lab
Analysis from the USGSNational Water-Quality Lab
H
4030
Black letters: parentcompounds
ESA: ethanesulfonic acidOA: oxalic acid
wells
Blue letters: metabolites
Number to right of each barrepresents the maximumconcentration detected.Detection frequencies arebased on varied reporting limits
to those most heavily applied inAll are herbicides used on cornations, than parent compounds.

down products). Pesticides were detected in 41 percent of moni-tor-well samples. The six com-pounds detected closely correspond to those most heavily applied in the basin—herbicides used on corn and soybeans (fig. 33). Metabolites were detected three times more fre-quently, and at higher concentra-tions, than were parent compounds. Concentrations did not exceed drinking-water standards, but stan-dards do not exist for 9 of the 11 compounds detected. In addition, many samples contained more than one herbicide, and the health effect of mixtures is unknown.
Nitrate concentrations indica-tive of human influence were detected in 37 percent of moni-tor-well samples. Probable sources
0 2 4 6 8 10 12 14
0
175
25
50
75
100
125
150
WE
LL D
EP
TH
, IN
FE
ET
Backgroundconcentration
Domestic well
Monitor well
MCL
Nitrate
NITRATE CONCENTRATIONIN MILLIGRAMS PER LITER
Figure 34. Detections of nitrate ordeeper ground water is not comptween depths of 35 and 100 feet w
are nitrogen fertilizers (which are heavily used in the study area), manure, or septic systems. Nitrate concentrations exceeded health-related drinking-water standards in two shallow monitor wells (fig. 34).
Pesticides and nitrate were detected much less frequently in domestic wells than in monitor wells (fig. 34). About 6 percent (1 of 18) of samples from domestic wells contained a trace concentra-tion of a pesticide metabolite, and 6 percent contained a nitrate concen-tration approximately equal to the background concentration of 2 mg/L.
A common belief is that till protects the ground water from contamination. There appears to
16
Solid symbol: old water
0 61 2 3 4 5
EXPLANATION
MCL: Max drink base
Pesticides
Minimumwell-depth
requirement
Open symbol: young water
NUMBER OF PESTICIDESDETECTED
,
0
175
25
50
75
100
125
150
1
2
5
7
10
12
15
pesticides are relatively infrequent at depthletely isolated from the land surface becauere recharged after 1953.
be some truth to this idea because detections of nitrate and herbicides are low relative to other agricul-tural areas with similarly high application rates. At the same time, this belief is a simplification that may be misleading because ground water is still vulnerable to contami-nation, especially at shallow depths.
Fifty-nine percent of monitor-well samples showed evidence of human activity—either an herbi-cide or an elevated nitrate concen-tration. Moreover, 83 percent of waters from monitor wells were recharged after 1953. These obser-vations indicate that till does not prevent water at the land surface from moving to the shallow ground water. In the study area,
Major Findings 21
0.1 5001 10 100
TRITIUM CONCENTRATION,IN PICOCURIES PER LITER
Rechargedafter 1953
imum Contaminant Level—ing-water standardd on health criteria
Estimatedground-water age
Rechargedbefore 1953
0
75
5
0
5
0
5
0
s greater than 35 feet; however,se almost half of the waters be-
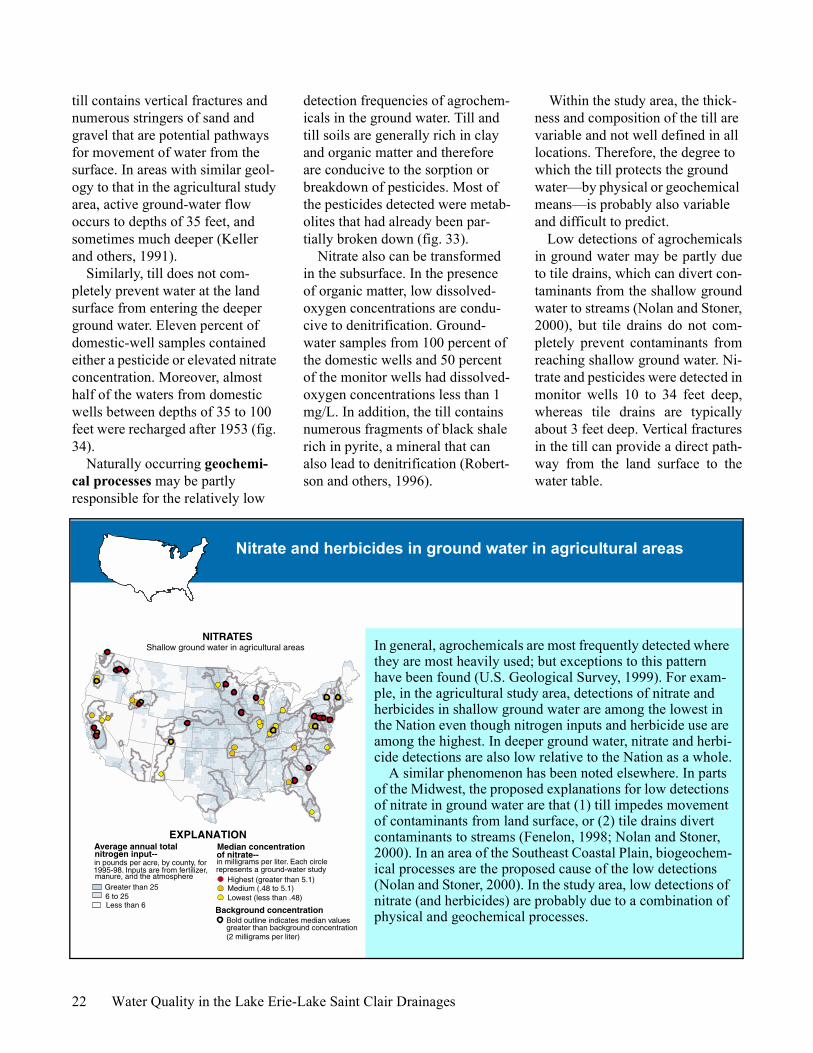
till contains vertical fractures and numerous stringers of sand and gravel that are potential pathways for movement of water from the surface. In areas with similar geol-ogy to that in the agricultural study area, active ground-water flow occurs to depths of 35 feet, and sometimes much deeper (Keller and others, 1991).
Similarly, till does not com-pletely prevent water at the land surface from entering the deeper ground water. Eleven percent of domestic-well samples contained either a pesticide or elevated nitrate concentration. Moreover, almost half of the waters from domestic wells between depths of 35 to 100 feet were recharged after 1953 (fig. 34).
Naturally occurring geochemi-cal processes may be partly responsible for the relatively low
22 Water Quality in the Lake Erie
Median concentra
in milligrams per liter.represents a ground-
Highest (greater thMedium (.48 to 5.Lowest (less than
Background concBold outline indicagreater than backg(2 milligrams per li
Average annual total
in pounds per acre, by county, for1995-98. Inputs are from fertilizer,
Greater than 256 to 25Less than 6
Shallow ground water in agricultural aNITRATES
manure, and the atmosphere
of nitrate--nitrogen input--
EXPLANATION
detection frequencies of agrochem-icals in the ground water. Till and till soils are generally rich in clay and organic matter and therefore are conducive to the sorption or breakdown of pesticides. Most of the pesticides detected were metab-olites that had already been par-tially broken down (fig. 33).
Nitrate also can be transformed in the subsurface. In the presence of organic matter, low dissolved-oxygen concentrations are condu-cive to denitrification. Ground-water samples from 100 percent of the domestic wells and 50 percent of the monitor wells had dissolved-oxygen concentrations less than 1 mg/L. In addition, the till contains numerous fragments of black shale rich in pyrite, a mineral that can also lead to denitrification (Robert-son and others, 1996).
-Lake Saint Clair Drainages
tion
Each circlewater studyan 5.1)
1) .48)
entrationtes median valuesround concentrationter)
reas
Within the study area, the thick-ness and composition of the till are variable and not well defined in all locations. Therefore, the degree to which the till protects the ground water—by physical or geochemical means—is probably also variable and difficult to predict. Low detections of agrochemicalsin ground water may be partly dueto tile drains, which can divert con-taminants from the shallow groundwater to streams (Nolan and Stoner,2000), but tile drains do not com-pletely prevent contaminants fromreaching shallow ground water. Ni-trate and pesticides were detected inmonitor wells 10 to 34 feet deep,whereas tile drains are typicallyabout 3 feet deep. Vertical fracturesin the till can provide a direct path-way from the land surface to thewater table.
Nitrate and herbicides in ground water in agricultural areas
In general, agrochemicals are most frequently detected where they are most heavily used; but exceptions to this pattern have been found (U.S. Geological Survey, 1999). For exam-ple, in the agricultural study area, detections of nitrate and herbicides in shallow ground water are among the lowest in the Nation even though nitrogen inputs and herbicide use are among the highest. In deeper ground water, nitrate and herbi-cide detections are also low relative to the Nation as a whole. A similar phenomenon has been noted elsewhere. In parts of the Midwest, the proposed explanations for low detections of nitrate in ground water are that (1) till impedes movement of contaminants from land surface, or (2) tile drains divert contaminants to streams (Fenelon, 1998; Nolan and Stoner, 2000). In an area of the Southeast Coastal Plain, biogeochem-ical processes are the proposed cause of the low detections (Nolan and Stoner, 2000). In the study area, low detections of nitrate (and herbicides) are probably due to a combination of physical and geochemical processes.

STUDY UNIT DESIGN
Stream ChemistryA network of 10 stream sites was
sampled for various chemical con-stituents and physical properties from March 1996 through February 1998 (fig. 35, table 3). Sampling was done over a range of stream-flows. Sites were sampled 18–32 times per year; intensive sites were sampled more frequently than basic sites (table 3).
Assessments of contaminants in streambed sediments and fish tis-sue were made at the 10 fixed streams sites and at one to five
St. J
osep
h
M
St. Marys Ri
IND
IAN
AO
HIO
FORTWAYNE
4
5
11
15
ANN AR
EXPLANATIONGROUND-WATER STUDIES
Urban Land-Use Study
Agricultural Land-Use StudySubunit Survey
Co-located wells in residential areas
Urban Drinking-Water Study
17
Figure 35. Stream and ground-water sam
additional sites. Sediment samples were collected and sieved in the field. Whole fish were collected and analyzed for concentrations of organochlorine compounds. Fish livers were analyzed for trace- element concentrations.
Stream EcologySampling was done at least once
at 10 sites where water samples were collected. Multiple-year and multiple-reach sampling was done at three sites (table 3). Stream
Black R
iver
BelleRiver
Clinton
River
RiverHuronRouge
RaisinRiver
Rive
r
River
Tiffi
n C uyaho ga
BlackRive
r
RRiver
aumee
Blanchard
Rive
r
Rive
r
ver
Sand
usky
Augl
aize
River
River
OHIOMICHIGAN UNITED STATE
CANADA
LAKLAKE
ST. CLAIR
MONROE
FINDLAY
ANNARBOR
LIMA
TOLEDO
DETROIT
WINDSOR
AKRON
CLEVELAND
SANDUSKY
6
78
2
1
3
1213
14
STREAM SAMP 1 Black River n 2 Clinton River 3 River Raisin 4 St. Joseph R 5 Maumee Riv 6 Auglaize Rive 7 Maumee Riv 8 Cuyahoga Ri 9 Grand River 10 Cattaraugus 11 Cedar Creek12 Huron River 13 Clinton River14 Paint Creek a15 Fish Creek n16 East Branch 17 West Branch
DETROIT
BOR
16
pling sites in the Lake Erie-Lake Saint Clair
reaches ranged from 200 to 500 meters in length.
Fish surveys involved electro-fishing and seining. Macroinverte-brates and algae were sampled from natural substrates. Habitats were assessed by identifying and mapping riparian vegetation and measuring geomorphic features of stream channels. Samples of bed and bank materials were collected and analyzed for grain size.
Study Unit Design 23
Tonawanda
Creek
GrandRiver
iver
CattaraugusCr.
BuffaloRiver
OH
IO
PA.
S
E ERIE
ERIE
BUFFALO
10
9
EXPLANATION
Basin indicator of agricultural land use
Basin indicator of mixed land use
LING SITESear Jeddo, Mich. at Sterling Heights, Mich.near Manchester, Mich.iver near Newville, Ind.er at New Haven, Ind.r near Ft. Jennings, Ohio
er at Waterville, Ohiover at LTV Steel, Cleveland, Ohioat Harpersfield, OhioCreek at Gowanda, N.Y. near Cedarville, Ind.near Hamburg, Mich. near Drayton Plains, Mich.t Rochester, Mich.
ear Artic, Ind.St. Joseph River, Ohio St. Joseph River, Ohio
Basin indicator of urban land use
-stream water and ecology -bed sediment and fish tissue
-bed sediment and fish tissue or fish communities
Fixed Site
Additional Sites
Niag
ara
Rive
r
STREAM WATER ANDBIOLOGICAL STUDIES
PA.
N.Y
.
Drainages, 1996–98.
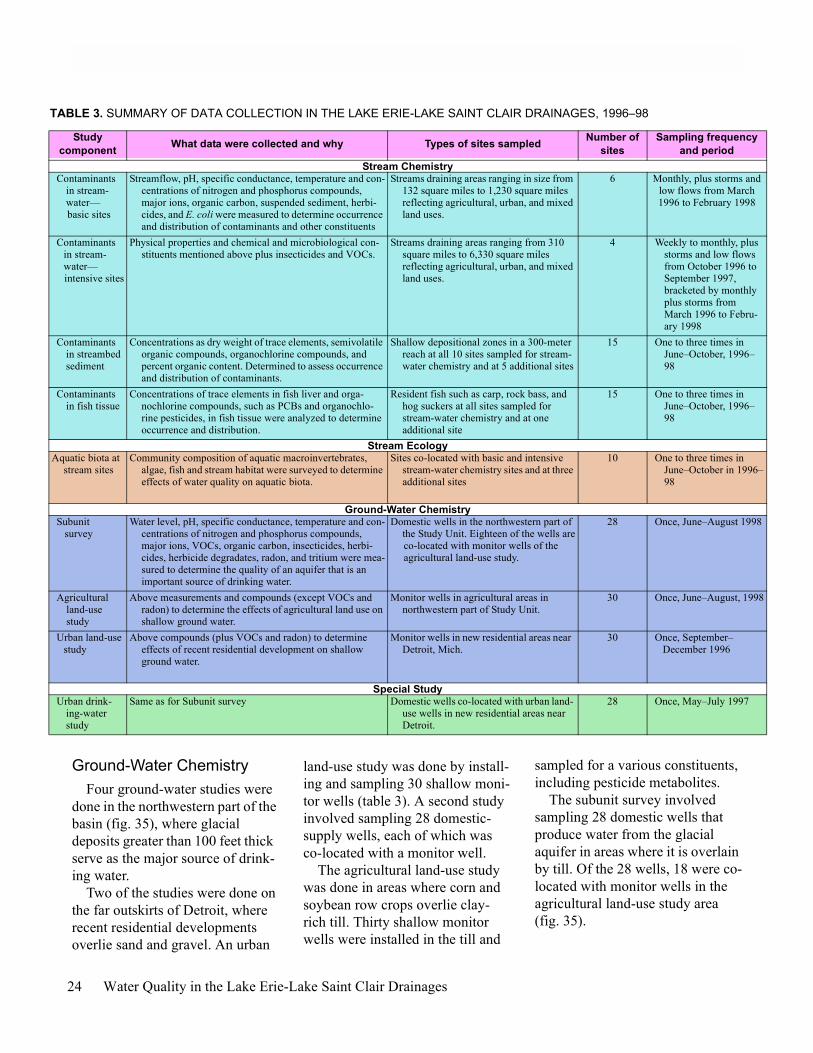
Studycomponent What data were collected and why Types of sites sampled Number of
sitesSampling frequency
and periodStream Chemistry
Contaminants in stream- water—
basic sites
Streamflow, pH, specific conductance, temperature and con-centrations of nitrogen and phosphorus compounds, major ions, organic carbon, suspended sediment, herbi-cides, and E. coli were measured to determine occurrence and distribution of contaminants and other constituents
Streams draining areas ranging in size from 132 square miles to 1,230 square miles reflecting agricultural, urban, and mixed land uses.
6 Monthly, plus storms and low flows from March 1996 to February 1998
Contaminants in stream- water—
intensive sites
Physical properties and chemical and microbiological con-stituents mentioned above plus insecticides and VOCs.
Streams draining areas ranging from 310 square miles to 6,330 square miles reflecting agricultural, urban, and mixed land uses.
4 Weekly to monthly, plus storms and low flows from October 1996 to September 1997, bracketed by monthly plus storms from March 1996 to Febru-ary 1998
Contaminants in streambed sediment
Concentrations as dry weight of trace elements, semivolatile organic compounds, organochlorine compounds, and percent organic content. Determined to assess occurrence and distribution of contaminants.
Shallow depositional zones in a 300-meter reach at all 10 sites sampled for stream- water chemistry and at 5 additional sites
15 One to three times in June–October, 1996–98
Contaminants in fish tissue
Concentrations of trace elements in fish liver and orga-nochlorine compounds, such as PCBs and organochlo-rine pesticides, in fish tissue were analyzed to determine occurrence and distribution.
Resident fish such as carp, rock bass, and hog suckers at all sites sampled for stream-water chemistry and at one additional site
15 One to three times in June–October, 1996–98
Stream EcologyAquatic biota at
stream sitesCommunity composition of aquatic macroinvertebrates,
algae, fish and stream habitat were surveyed to determine effects of water quality on aquatic biota.
Sites co-located with basic and intensive stream-water chemistry sites and at three additional sites
10 One to three times in June–October in 1996–98
Ground-Water ChemistrySubunit survey
Water level, pH, specific conductance, temperature and con-centrations of nitrogen and phosphorus compounds, major ions, VOCs, organic carbon, insecticides, herbi-cides, herbicide degradates, radon, and tritium were mea-sured to determine the quality of an aquifer that is an important source of drinking water.
Domestic wells in the northwestern part of the Study Unit. Eighteen of the wells are
co-located with monitor wells of the agricultural land-use study.
28 Once, June–August 1998
Agricultural land-use study
Above measurements and compounds (except VOCs and radon) to determine the effects of agricultural land use on shallow ground water.
Monitor wells in agricultural areas in northwestern part of Study Unit.
30 Once, June–August, 1998
Urban land-use study
Above compounds (plus VOCs and radon) to determine effects of recent residential development on shallow ground water.
Monitor wells in new residential areas near Detroit, Mich.
30 Once, September– December 1996
Special StudyUrban drink-
ing-water study
Same as for Subunit survey Domestic wells co-located with urban land- use wells in new residential areas near Detroit.
28 Once, May–July 1997
TABLE 3. SUMMARY OF DATA COLLECTION IN THE LAKE ERIE-LAKE SAINT CLAIR DRAINAGES, 1996–98
Ground-Water ChemistryFour ground-water studies were
done in the northwestern part of the basin (fig. 35), where glacial deposits greater than 100 feet thick serve as the major source of drink-ing water.
Two of the studies were done on the far outskirts of Detroit, where recent residential developments overlie sand and gravel. An urban
24 Water Quality in the Lake Erie-
land-use study was done by install-ing and sampling 30 shallow moni-tor wells (table 3). A second study involved sampling 28 domestic-supply wells, each of which was co-located with a monitor well.
The agricultural land-use study was done in areas where corn and soybean row crops overlie clay-rich till. Thirty shallow monitor wells were installed in the till and
Lake Saint Clair Drainages
sampled for a various constituents, including pesticide metabolites.
The subunit survey involved sampling 28 domestic wells that produce water from the glacial aquifer in areas where it is overlain by till. Of the 28 wells, 18 were co-located with monitor wells in the agricultural land-use study area (fig. 35).

GLOSSARY
Anthropogenic - A condition or occurrence that is the result of, or is influenced by, human activity.
Aquifer - A water-bearing layer of soil, sand, gravel, or rock that will yield usable quantities of water to a well.
Background concentration - A concentration of a sub-stance in a particular environment that is indicative of minimal influence by human (anthropogenic) sources.
Base flow - Sustained, low flow in a stream; ground-water discharge is the source of base flow in most places.
Bed sediment - The material that temporarily is stationary in the bottom of a stream or other watercourse.
Benthic - Refers to plants or animals that live on the bottom of lakes, streams, or oceans.
Bioaccumulation - The biological sequestering of a sub-stance at a higher concentration than that at which it occurs in the surrounding environment or medium. Also, the process whereby a substance enters organisms through the gills, epithelial tissues, dietary, or other sources.
Biota - Living organisms. Breakdown product - A compound derived by chemical,
biological, or physical action upon a pesticide. The breakdown is a natural process which may result in a more toxic or a less toxic compound and a more persis-tent or less persistent compound.
BTEX - Benzene, toluene, ethylbenzene, and xylene; vola-tile organic compounds found in gasoline and solvents.
Chlordane - Octachloro-4,7-methanotetrahydroindane. An organochlorine insecticide no longer registered for use in the U.S. Technical chlordane is a mixture in which the primary components are cis- and trans-chlordane, cis- and trans-nonachlor, and heptachlor.
Community - In ecology, the species that interact in a com-mon area.
Concentration - The amount or mass of a substance present in a given volume or mass of sample. Usually expressed as microgram per liter (water sample) or micrograms per kilogram (sediment or tissue sample).
Denitrification - A process by which oxidized forms of nitrogen such as nitrate (NO3
-) are reduced to form nitrites, nitrogen oxides, ammonia, or free nitrogen: commonly brought about by the action of denitrifying bacteria and usually resulting in the escape of nitrogen to the air.
Detect - To determine the presence of a compound. DDT - Dichloro-diphenyl-trichloroethane. An organochlo-
rine insecticide no longer registered for use in the United States.
Dieldrin - An organochlorine insecticide no longer regis-tered for use in the United States. Also a degradation product of the insecticide aldrin.
Discharge - Rate of fluid flow passing a given point at a given moment in time, expressed as volume per unit of time.
Domestic well - A private home well, or a well that serves less than 15 households or 25 individuals.
Endocrine system - The collection of glands in animals that secrete hormones, which influence growth, gender and sexual maturity.
Eutrophication - The process by which water becomes enriched with plant nutrients, most commonly phospho-rus and nitrogen.
Ground water - In general, any water that exists beneath the land surface, but more commonly applied to water in fully saturated soils and geologic formations.
Herbicide - A chemical or other agent applied for the pur-pose of killing undesirable plants. See also Pesticide.
Insecticide - A substance or mixture of substances intended to destroy or repel insects.
Intolerant organisms - Organisms that are not adaptable to human alterations to the environment and thus decline in numbers where human alterations occur. See also Tolerant species.
Invertebrate - An animal having no backbone or spinal col-umn.
MCL (Maximum Contaminant Level) - Maximum per-missible level of a contaminant in water that is deliv-ered to any user of a public water system. MCLs are enforceable standards established by the U.S. Environ-mental Protection Agency.
Median - The middle or central value in a distribution of data ranked in order of magnitude. The median is also known as the 50th percentile.
Metabolite - See breakdown product. Monitor well - A well designed for measuring water levels
and testing ground-water quality. Nitrate - An ion consisting of nitrogen and oxygen (NO3
-). Nitrate is a plant nutrient and is very mobile in soils. In this report, the term “nitrate” is used as shorthand for “nitrate plus nitrite, reported as nitrogen.”
Nutrient - Element or compound essential for animal and plant growth. Common nutrients in fertilizer include nitrogen, phosphorus, and potassium.
Organochlorine compound - Synthetic organic compound containing chlorine. As generally used, term refers to compounds containing mostly or exclusively carbon, hydrogen, and chlorine. Examples include organochlo-rine insecticides, polychlorinated biphenyls, and some solvents containing chlorine.
Pesticide - A chemical applied to crops, rights of way, lawns, or residences to control weeds, insects, fungi, nematodes, rodents or other “pests.”
Phosphorus - A nutrient essential for growth that can play a key role in stimulating aquatic growth in lakes and streams.
Polychlorinated biphenyls (PCBs) - A mixture of chlori-nated derivatives of biphenyl, marketed under the trade name Aroclor with a number designating the chlorine
Glossary 25

content (such as Aroclor 1260). PCBs were used in transformers and capacitors for insulating purposes and in gas pipeline systems as a lubricant. Further sale for new use was banned by law in 1979.
Polycyclic aromatic hydrocarbon (PAH) - A class of organic compounds with a fused-ring aromatic struc-ture. PAHs result from incomplete combustion of organic carbon (including wood), municipal solid waste, and fossil fuels, as well as from natural or anthropogenic introduction of uncombusted coal and oil. PAHs include benzo[a]pyrene, fluoranthene, and pyrene.
Recharge - Water that infiltrates the ground and reaches the saturated zone.
Runoff - Excess rainwater or snowmelt that is transported to streams by overland flow, tile drains, or ground water.
SMCL (Secondary maximum contaminant level) - Non-enforceable drinking-water standards established by the U.S. Environmental Protection Agency for contami-nants that may adversely affect the odor or appearance of drinking water.
Sediment - Particles, derived from rocks or biological mate-rials, that have been transported by a fluid or other natu-ral process, suspended or settled in water.
Semivolatile organic compound (SVOC) - Operationally defined as a group of synthetic organic compounds that are solvent-extractable and can be determined by gas chromatography/mass spectrometry. SVOCs include phenols, phthalates, and polycyclic aromatic hydrocar-bons (PAHs).
Streamflow - A type of channel flow, applied to that part of surface runoff in a stream whether or not it is affected by diversion or regulation.
Suspended sediment - Particles of rock, sand, soil, and organic detritus carried in suspension in the water col-umn, in contrast to sediment that moves on or near the streambed.
Taxon (plural taxa) - Any identifiable group of taxonomi-cally related organisms.
Tile drain - A buried perforated pipe designed to remove excess water from soils.
Till - An unsorted glacial deposit characterized by low per-meability.
Triazine herbicide - A class of herbicides containing a sym-metrical triazine ring (a nitrogen-heterocyclic ring com-posed of three nitrogens and three carbons in an alternating sequence). Examples include atrazine, pro-pazine, and simazine.
Volatile organic compounds (VOCs) - Organic chemicals that have a high vapor pressure relative to their water solubility. VOCs include components of gasoline, fuel oils, and lubricants, as well as organic solvents, fumi-gants, some inert ingredients in pesticides, and some by-products of chlorine disinfection.
26 Water Quality in the Lake Erie–Lake Saint Clair D
Water table - The point below the land surface where ground water is first encountered and below which the earth is saturated. Depth to the water table varies widely across the country.
Water year - The continuous 12-month period, October 1 through September 30, in U.S. Geological Survey reports dealing with the surface-water supply. The water year is designated by the calendar year in which it ends and which includes 9 of the 12 months. Thus, the year ending September 30, 1980, is referred to as water year 1980.
rainages
REFERENCES
Baker, D.B., Calhoun, F.G., and Matisoff, Gerald, 1998, LEASEQ— the Lake Erie agricultural systems for envi-ronmental quality project: Heidelberg College Water-Quality Lab, Tiffin, Ohio, 2 p.
Bertram, P.E., 1993, Total phosphorus and dissolved oxygen trends in the Central Basin of Lake Erie: Journal of Great Lakes Research, v. 19, p. 224–236.
Brody, T.M., Furio, B.A., and Macarus, D.P., 1997, Agricul-tural pesticide use in the Great Lakes Basin—Estimates of major active ingredients applied during 1994–95 for the Lake Erie, Michigan, and Superior Basins: U.S. Environmental Protection Agency, Region 5, 15 p.
Casey, G.D., Myers, D.N., Finnegan, D.P., and Wieczorek, M.E., 1997, National Water-Quality Assessment Pro-gram in the Lake Erie-Lake St. Clair Basin, Michigan, Indiana, Ohio, Pennsylvania, and New York—Environ-mental and hydrologic setting: U.S. Geological Survey Water-Resources Investigations Report 97–4256, 93 p.
Clark, G.M., Mueller, D.K., and Mast, M.A., 2000, Nutrient concentrations and yields in undeveloped stream basins of the United States: Journal of the American Water-Resources Association., v. 36, no. 4, p. 849–860.
Covert, S.A., in press, Comparison of U.S. Geological Sur-vey and Ohio Environmental Protection Agency fish-collection methods using the Index of Biotic Integrity and Modified Index of Well Being: U.S. Geological Survey Water-Resources Investigations Report 00-4255.
Daher, Shannon, 1999, Lake Erie Lakewide Management Plan (LaMP) status report, 1999: Burlington, Ont., Environment Canada and U.S. Environmental Protec-tion Agency, 32 p.
Davis, S.N., Whittemore, D.O., and Fabryka-Martin, J., 1998, Uses of chloride/bromide ratios in studies of potable water: Ground Water, v. 36, no. 2, p. 338–350.
Day, K.E., 1991, Pesticide transformation products in sur-face waters, effects on biota, in Somasunderam, L., and Coats, J.R., eds., Pesticide transformation products, fate, and significance in the environment: Washington, D.C., American Chemical Society, ASC Symposium Series 459, p. 217–241.
Dolan, D.M., 1993, Point source loadings of phosphorus to Lake Erie, 1986–1990: Journal of Great Lakes Research, v. 19, p. 212–223.
Fenelon, J.M., 1998, Water quality in the White River Basin, Indiana, 1992–96: U.S. Geological Survey Circular 1150, 34 p.
Frey, J.W., in press, Occurrence, distribution, and loading of selected pesticides in tributaries in the Lake Erie-Lake St. Clair Basin, 1996-98: U.S. Geological Survey Water-Resources Investigations Report 00–4169.
Gibson, George, Carlson, Robert, Simpson, Jonathan, Smelt-zer, Eric, Gerritson, Jeroen, Chapra, Steven, Heisarsky, Steven, Jones, Jack, and Kennedy, Robert, 2000, Nutri-
ent criteria technical guidance manual, lakes and reser-voirs: U.S. Environmental Protection Agency, Washington, D.C., EPA–822—B00–001, p. 5–14.
Herdendorf, C.E., 1986, Rebirth of Lake Erie: Columbus, Ohio, Ohio Sea Grant Reprint Series OHSU–RS0051, 8 p.
Ingersoll, C.G., Haverland, P.S., Brunson, E.L., Canfield, T.J., Dwyer, F.J., Henke, C.E., Kemble, N.E., Mount, D.R., and Fox, R.G., 1996, Calculation and evaluation of sediment effect concentrations for the amphipod Hyalella azteca and the midge Chironomus riparius: Journal of Great Lakes Research, v. 22, no. 3, p. 602–623.
International Joint Commission, 1994, Revised Great Lakes Water Quality Agreement of 1978: Windsor, Ont., International Joint Commission, p. 31.
Irwin, R.J., Van Mouwerik, M., Stevens, L., Seese, M.D., and Basham, W., 1997, Environmental contaminants encyclopedia: Fort Collins, Colo., National Park Ser-vice, Water-Resources Division, accessed February, 1998, at URL http://www1.nature.nps.gov/toxic.
Kelleher, Todd, 1999, Ohio EPA Pesticide Special Study— May 1995 through March 1999: Ohio Environmental Protection Agency, Division of Drinking and Ground Waters, accessed November 2, 1999, at URLhttp://www.epa.ohio.gov/ddagw/pestspst.html.
Keller, C.K., van der Kamp, G., and Cherry, J.A., 1991, Hydrogeochemistry of a clayey till, 1. Spatial variabil-ity: Water Resources Research, v. 27, no. 10, p. 2543–2554.
Kolpin, D.W., 2000, Ground water network statistics, National Water-Quality Assessment Program Pesticide National Synthesis Project: U.S. Geological Survey, accessed June 13, 2000, at URL http://wwwd-cascr.wr.usgs.gov/pnsp.
Larson, S.J., Gilliom, R.J., and Capel, P.D., 1999, Pesticides in streams of the United States—Initial results from the National Water-Quality Assessment Program: U.S. Geological Survey Water-Resources Investigations Report 98–4222, 92 p.
Litke, D.W., 1999, Review of phosphorus control measures in the United States and their effects on water quality: U.S. Geological Survey Water-Resources Investigations Report 99–4007, 38 p.
Long, D.T., Wilson, T.P., Takacs, M.J., and Rezabek, D.H., 1988, Stable-isotope geochemistry of saline near-sur-face ground water—East-central Michigan basin: Geo-logical Society of America Bulletin, v. 100, p. 1568–1577.
Lowrance, Richard, Altier, L.S., Newbold, J.D., Schnabel, R.R., Groffman, P.M., Denver, J.M., Correll, D.L., Gil-liam, J.W., Robinson, J.L., Brinsfield, R.B., Staver, K.W., Lucas, William, and Todd, A.H., 1997, Water- quality functions in riparian forest buffers in Chesa-
References 27

peake Bay watersheds: Environmental Management, v. 21, no. 5., p. 687-712.
Mozola, A.J., 1953, A survey of the groundwater resources in Oakland County, Michigan: Michigan Department of Conservation, Geological Survey Division, Publication 48, pt. 2, p. 101–348.
Myers, D.N., Metzker, K.D., and Davis, Steven, 2000, Status and trends in suspended-sediment discharges, soil ero-sion, and conservation tillage in the Maumee River Basin—Ohio, Michigan, and Indiana: U.S. Geological Survey Water-Resources Investigations Report 00–4091, 38 p.
Newell, A.J., Johnson, D.W., and Allen, L.K., 1987, Niagara River biota contamination project—Fish flesh criteria for piscivorous wildlife: New York State Department of Environmental Conservation, Division of Fish and Wildlife, Bureau of Environmental Protection, Techni-cal Report 87–3, 180 p.
Nolan, B.T. and Stoner, J.D., 2000, Nutrients in ground waters of the conterminous United States, 1992–95: Environmental Science & Technology, v. 34, no. 7, p. 1156–1165.
Nowell, L.H., and Resek, E.A., 1994, Summary of national standards and guidelines for pesticides in water, bed sediment, and aquatic organisms and their application to water-quality assessments: U.S. Geological Survey Open-File Report 94–44, 115 p.
Ohio Lake Erie Commission, 1998, State of the lake report, Lake Erie quality index: Toledo, Ohio, Ohio Lake Erie Commission, 88 p.
Ohio Environmental Protection Agency, 1989, Biological criteria for the protection of aquatic life—Ecological Assessment Section Division of Water Quality Planning and Assessment, volume III, standardized biological field sampling and laboratory methods for assessing fish and macroinvertebrate communities: September 1989, [variously paginated].
_____1995, Ohio water-resource inventory, 1994—Sum-mary, conclusions, and recommendations: Technical Bulletin MAS/1995–7–2, 69 p.
Plummer, L.N., Michael, R.L., Thurman, E.M., and Glynee, P.D., 1993, Environmental tracers for age dating young ground water, in Alley, W.M., ed., 1993, Regional ground-water quality: New York, Van Nostrand Rein-hold, p. 255-294.
Rheaume, S.J., Button, D.T., Myers, D.N., and Hubbell, D.L., in press, Occurrence and distribution of contami-nants of concern in surficial bed sediments of rivers and streams in the Lake Erie-Lake St. Clair Basin: U.S. Geological Survey Water-Resources Investigations Report 00-4200.
Robertson, W.D., Russell, B.M., and Cherry, J.A., 1996, Attenuation of nitrate in aquitard sediments of southern Ontario: Journal of Hydrology, v. 180, p. 267–281.
28 Water Quality in the Lake Erie-Lake Saint Clair D
Smith, S.L., MacDonald, D.D., Keenleyside, K.A., Ingersoll, C.G., and Field, L.J., 1996, A preliminary evaluation of sediment quality assessment values for freshwater eco-systems: Journal of Great Lakes Research, v. 22, no. 3, p. 624–638.
Sweeney, B.W., 1992, Streamside forests and the physical, chemical, and trophic characteristics of piedmont streams in eastern North America: Water Science Tech-nology, v. 26, no. 12, p. 2653–2673.
Thomas, M.A., 2000a, The effect of residential development on ground-water quality near Detroit, Michigan: Jour-nal of the American Water Resources Association, v. 36, no. 5, p. 1023–1038.
Thomas, M.A., 2000b, Ground-water quality and vulnerabil-ity to contamination in selected agricultural areas of northwestern Ohio, southeastern Michigan, and north-eastern Indiana: U.S. Geological Survey Water- Resources Investigations Report 00-4146, 22 p.
Trimble, S.W., 1975, Denudation studies—Can we assume stream steady state? Science, v. 188, p. 1207–1208.
_____1999, Decreased rates of alluvial sediment storage in the Coon Creek Basin, Wisconsin, 1973–93: Science, v. 285, p. 1244–1246.
U.S. Department of Agriculture, 1998, Toledo Harbor pilot project, final report: Columbus, Ohio, Natural Resources Conservation Service, 65 p.
U.S. Environmental Protection Agency, 1997, The incidence and severity of sediment contamination in surface waters of the United States: The national sediment qual-ity survey, v. 1, chap.1, p. 1–5.
U.S. Environmental Protection Agency and Environment Canada, 2000, Lake Erie Lakewide Management Plan 2000, Appendixes E and F: Environment Canada, Ontario Region, Burlington, Ontario, Canada, variously paginated.
U.S. Geological Survey, 1999, The quality of our Nation’s waters—Nutrients and pesticides. U.S. Geological Sur-vey Circular 1225, 82 p.
rainages

APPENDIX—WATER-QUALITY DATA FROM THE LAKE ERIE-LAKE SAINT CLAIR DRAINAGES IN A NATIONAL CONTEXT
For a complete view of Lake Erie-Lake Saint Clair Drainages data and for additional information about specific benchmarks used, visit our Web site at http://water.usgs.gov/nawqa/. Also visit the NAWQA Data Warehouse for access to NAWQA data sets at http://water.usgs.gov/nawqa/data.Study-unit frequency of detection, in percentNational frequency of detection, in percent
Pesticides in water—Herbicides
Study-unit sample size
Acetochlor (Harness Plus, Surpass) * **61 33 18930 9 3770 38 990 <1 300 <1 300 <1 28
Alachlor (Lasso, Bronco, Lariat, Bullet) **|67 44 189|30 20 37|76 45 99
|0 3 30|0 <1 30|0 1 28
Atrazine (AAtrex, Atrex, Atred, Gesaprim) ||100 88 189||100 86 37||100 87 99
|3 40 30|0 30 30|0 18 28
Cyanazine (Bladex, Fortrol) | |76 44 189| |30 14 37| |82 54 99
|0 1 30
This appendix is a summary of chemical concentrations and biological indicators assessed in the Lake Erie-Lake Saint Clair Drainages. Selected results for this Study Unit are graphically compared to results from as many as 36 NAWQA Study Units investigated from 1991 to 1998 and to national water-quality benchmarks for human health, aquatic life, or fish-eating wildlife. The chemical and biological indicators shown were selected on the basis of frequent detection, detection at concentrations above a national benchmark, or regulatory or scientific importance. The graphs illustrate how conditions associated with each land use sampled in the Lake Erie-Lake Saint Clair Drainages compare to results from across the Nation, and how conditions compare among the several land uses. Graphs for chemicals show only detected concentrations and, thus, care must be taken to evaluate detection frequencies in addition to concentrations when comparing study-unit and national results. For example, in the Lake Erie-Lake Saint Clair Drainages acetochlor concentrations in agricultural streams were similar to the national distribution, but the detection frequency was much higher (61 percent compared to 33 percent).
Water-Quality Data in a National Context 29
Streams in agricultural areas Streams in urban areasStreams and rivers draining mixed land uses
Shallow ground water in agricultural areasShallow ground water in urban areas Major aquifers
Detected concentration in Study Unit
Frequencies of detection, in percent. Detection frequencies were not censored at any common reporting limit. The left-hand column is the study-unit frequency and the right-hand column is the national frequency
Not measured or sample size less than two
Study-unit sample size. For ground water, the number of samples is equal to the number of wells sampled
National ranges of detected concentrations, by land use, in 36 NAWQA Study Units, 1991–98—Ranges include only samplesin which a chemical was detected
Drinking-water quality (applies to ground water and surface water)
Protection of aquatic life (applies to surface water only)
Prevention of eutrophication in streams not flowing directly into lakes or impoundments
No benchmark for drinking-water quality
No benchmark for protection of aquatic life*
**
66 38
CHEMICALS IN WATERConcentrations and detection frequencies, Lake Erie-Lake Saint Clair Drainages, 1996–98—Detection sensitivity varies among chemicals and, thus, frequencies are not directly comparable among chemicals
Lowest25
percent
Middle50
percent
Highest25
percent
National water-quality benchmarks
National benchmarks include standards and guidelines related to drinking-water quality, criteria for protecting the health of aquatic life, and a goal for preventing stream eutrophication due to phosphorus. Sources include the U.S. Environmental Protection Agency and the Canadian Council of Ministers of the Environment
|
|
|
--
CONCENTRATION, IN MICROGRAMS PER LITER
0.0001 0.001 0.01 0.1 1 10 100 1,000
12
|0 1 30|0 <1 28
2,4-D (Aqua-Kleen, Lawn-Keep, Weed-B-Gone) ||37 15 52||31 18 29||27 11 33
|0 <1 30|0 1 29|-- <1 0
Deethylatrazine (Atrazine breakdown product) * **100 75 18997 62 3799 75 993 39 303 28 304 19 28
MCPA (Rhomene, Rhonox, Chiptox) ||0 1 52||10 4 29||0 1 33
Metolachlor (Dual, Pennant) ||99 81 189||100 64 37||100 83 99
|3 18 30|0 9 30|0 5 28
Metribuzin (Lexone, Sencor) ||55 19 189||14 8 37||59 20 99
|0 3 30|0 2 30|0 1 28
Prometon (Pramitol, Princep) **|66 44 189|95 86 37|92 60 99
|0 12 30|0 21 30|0 5 28

30 Water Quality in the Lake Erie-Lake Saint Clair Drainages
CONCENTRATION, IN MICROGRAMS PER LITER
0.0001 0.001 0.01 0.1 1 10 100 1,000
Other herbicides detectedAcifluorfen (Blazer, Tackle 2S) **Benfluralin (Balan, Benefin, Bonalan) * **Bentazon (Basagran, Bentazone) **Bromoxynil (Buctril, Brominal) * Butylate (Sutan +, Genate Plus, Butilate) **DCPA (Dacthal, chlorthal-dimethyl) * **Dicamba (Banvel, Dianat, Scotts Proturf) 2,6-Diethylaniline (Alachlor breakdown product) * **Diuron (Crisuron, Karmex, Diurex) **EPTC (Eptam, Farmarox, Alirox) * **Fenuron (Fenulon, Fenidim) * **Linuron (Lorox, Linex, Sarclex, Linurex, Afalon) * MCPB (Thistrol) * **Pendimethalin (Pre-M, Prowl, Stomp) * **Picloram (Grazon, Tordon) Propachlor (Ramrod, Satecid) **Terbacil (Sinbar) **Triclopyr (Garlon, Grandstand, Redeem, Remedy) * **Trifluralin (Treflan, Gowan, Tri-4, Trific)
Herbicides not detectedBromacil (Hyvar X, Urox B, Bromax) Chloramben (Amiben, Amilon-WP, Vegiben) **Clopyralid (Stinger, Lontrel, Transline) * **2,4-DB (Butyrac, Butoxone, Embutox Plus, Embutone) * **Dacthal mono-acid (Dacthal breakdown product) * **Dichlorprop (2,4-DP, Seritox 50, Lentemul) * **Dinoseb (Dinosebe) Ethalfluralin (Sonalan, Curbit) * **Fluometuron (Flo-Met, Cotoran) **Molinate (Ordram) * **Napropamide (Devrinol) * **Neburon (Neburea, Neburyl, Noruben) * **Norflurazon (Evital, Predict, Solicam, Zorial) * **Oryzalin (Surflan, Dirimal) * **Pebulate (Tillam, PEBC) * **Pronamide (Kerb, Propyzamid) **Propanil (Stam, Stampede, Wham) * **Propham (Tuberite) **2,4,5-T **2,4,5-TP (Silvex, Fenoprop) **Thiobencarb (Bolero, Saturn, Benthiocarb) * **
Study-unit frequency of detection, in percentNational frequency of detection, in percent
Pesticides in water—Insecticides
Study-unit sample size
CONCENTRATION, IN MICROGRAMS PER LITER
0.0001 0.001 0.01 0.1 1 10 100 1,000
Study-unit frequency of detection, in percentNational frequency of detection, in percent Study-unit sample size
Volatile organic compounds (VOCs) in ground waterThese graphs represent data from 16 Study Units, sampled from 1996 to 1998
Study-unit frequency of detection, in percentNational frequency of detection in percent Study-unit sample size
CONCENTRATION, IN MICROGRAMS PER LITER
0.001 0.01 0.1 1 10 100 1,000 10,000
Other insecticides detected Carbofuran (Furadan, Curaterr, Yaltox) Dieldrin (Panoram D-31, Octalox, Compound 497) Fonofos (Dyfonate, Capfos, Cudgel, Tycap) **alpha-HCH (alpha-BHC, alpha-lindane) **Malathion (Malathion) Methyl parathion (Penncap-M, Folidol-M) **
Insecticides not detectedAldicarb (Temik, Ambush, Pounce) Aldicarb sulfone (Standak, aldoxycarb) Aldicarb sulfoxide (Aldicarb breakdown product) Azinphos-methyl (Guthion, Gusathion M) * Disulfoton (Disyston, Di-Syston) **Ethoprop (Mocap, Ethoprophos) * **gamma-HCH (Lindane, gamma-BHC) 3-Hydroxycarbofuran (Carbofuran breakdown product) * **Methiocarb (Slug-Geta, Grandslam, Mesurol) * **Methomyl (Lanox, Lannate, Acinate) **Oxamyl (Vydate L, Pratt) **Parathion (Roethyl-P, Alkron, Panthion, Phoskil) * cis-Permethrin (Ambush, Astro, Pounce) * **Phorate (Thimet, Granutox, Geomet, Rampart) * **Propargite (Comite, Omite, Ornamite) * **Propoxur (Baygon, Blattanex, Unden, Proprotox) * **Terbufos (Contraven, Counter, Pilarfox) **
Simazine (Princep, Caliber 90) | |95 61 189| |97 77 37| |91 74 99
|0 21 30|3 18 30|0 5 28
Tebuthiuron (Spike, Tebusan) ||16 22 189||8 39 37||52 32 99
|0 3 30|0 7 30|0 3 28
CONCENTRATION, IN MICROGRAMS PER LITER
0.0001 0.001 0.01 0.1 1 10 100 1,000
Study-unit frequency of detection, in percentNational frequency of detection, in percent Study-unit sample size
Carbaryl (Carbamine, Denapon, Sevin) ||7 9 189||35 46 37||27 16 99
|0 <1 30|0 2 30|0 1 28
Chlorpyrifos (Brodan, Dursban, Lorsban) ||13 18 186||19 37 37||36 20 97
|0 1 30|0 1 30|0 <1 28
p,p'-DDE ||2 8 189||0 2 37||0 4 99
|0 4 30|0 2 30|0 2 28
Diazinon (Basudin, Diazatol, Neocidol, Knox Out) ||23 16 189||68 70 37||70 39 99
|0 <1 30|0 2 30|4 2 28
Carbon disulfide *
-- 30 053 42 3025 24 28
1,3 & 1,4-Dimethylbenzene (m-&p-Xylene)
|-- 7 0|53 18 30|18 3 28

Water-Quality Data in a National Context 31
CONCENTRATION, IN MILLIGRAMS PER LITER
0.001 0.01 0.1 1 10 100 1,000 10,000 100,000
CONCENTRATION, IN MILLIGRAMS PER LITER
0.001 0.01 0.1 1 10 100 1,000 10,000 100,000
Nutrients in waterStudy-unit frequency of detection, in percent
National frequency of detection, in percent Study-unit sample size
Dissolved solids in waterStudy-unit frequency of detection, in percent
National frequency of detection, in percent Study-unit sample size
Study-unit frequency of detection, in percentNational frequency of detection in percent Study-unit sample size
CONCENTRATION, IN MICROGRAMS PER LITER
0.001 0.01 0.1 1 10 100 1,000 10,000
Methylbenzene (Toluene)
|-- 36 0|77 30 30|4 11 28
Other VOCs detectedBenzene Bromodichloromethane (Dichlorobromomethane) 2-Butanone (Methyl ethyl ketone (MEK)) * Chlorodibromomethane (Dibromochloromethane) 1,4-Dichlorobenzene (p-Dichlorobenzene) Dichlorodifluoromethane (CFC 12, Freon 12) Dichloromethane (Methylene chloride) 1,2-Dimethylbenzene (o-Xylene) 1-4-Epoxy butane (Tetrahydrofuran, Diethylene oxide) * Ethenylbenzene (Styrene) Ethylbenzene (Phenylethane) Iodomethane (Methyl iodide) * 2-Propanone (Acetone) * Tetrachloroethene (Perchloroethene) 1,1,1-Trichloroethane (Methylchloroform) Trichloromethane (Chloroform) 1,2,4-Trimethylbenzene (Pseudocumene) *
VOCs not detectedtert-Amylmethylether (tert-amyl methyl ether (TAME)) * Bromobenzene (Phenyl bromide) * Bromochloromethane (Methylene chlorobromide) Bromoethene (Vinyl bromide) * Bromomethane (Methyl bromide) n-Butylbenzene (1-Phenylbutane) * sec-Butylbenzene * tert-Butylbenzene * 3-Chloro-1-propene (3-Chloropropene) * 1-Chloro-2-methylbenzene (o-Chlorotoluene) 1-Chloro-4-methylbenzene (p-Chlorotoluene) Chlorobenzene (Monochlorobenzene) Chloroethane (Ethyl chloride) * Chloroethene (Vinyl chloride) Chloromethane (Methyl chloride) 1,2-Dibromo-3-chloropropane (DBCP, Nemagon) 1,2-Dibromoethane (Ethylene dibromide, EDB) Dibromomethane (Methylene dibromide) * trans-1,4-Dichloro-2-butene ((Z)-1,4-Dichloro-2-butene) * 1,2-Dichlorobenzene (o-Dichlorobenzene) 1,3-Dichlorobenzene (m-Dichlorobenzene) 1,2-Dichloroethane (Ethylene dichloride) 1,1-Dichloroethane (Ethylidene dichloride) * 1,1-Dichloroethene (Vinylidene chloride) trans-1,2-Dichloroethene ((E)-1,2-Dichlorothene) cis-1,2-Dichloroethene ((Z)-1,2-Dichloroethene) 1,2-Dichloropropane (Propylene dichloride) 2,2-Dichloropropane * 1,3-Dichloropropane (Trimethylene dichloride) * trans-1,3-Dichloropropene ((E)-1,3-Dichloropropene) cis-1,3-Dichloropropene ((Z)-1,3-Dichloropropene) 1,1-Dichloropropene * Diethyl ether (Ethyl ether) * Diisopropyl ether (Diisopropylether (DIPE)) * Ethyl methacrylate * Ethyl tert-butyl ether (Ethyl-t-butyl ether (ETBE)) * 1-Ethyl-2-methylbenzene (2-Ethyltoluene) * Hexachlorobutadiene 1,1,1,2,2,2-Hexachloroethane (Hexachloroethane) 2-Hexanone (Methyl butyl ketone (MBK)) * Isopropylbenzene (Cumene) * p-Isopropyltoluene (p-Cymene) * Methyl acrylonitrile * Methyl tert-butyl ether (MTBE) Methyl-2-methacrylate (Methyl methacrylate) * 4-Methyl-2-pentanone (Methyl isobutyl ketone (MIBK)) *
Methyl-2-propenoate (Methyl acrylate) * Naphthalene 2-Propenenitrile (Acrylonitrile) n-Propylbenzene (Isocumene) * 1,1,2,2-Tetrachloroethane * 1,1,1,2-Tetrachloroethane Tetrachloromethane (Carbon tetrachloride) 1,2,3,4-Tetramethylbenzene (Prehnitene) * 1,2,3,5-Tetramethylbenzene (Isodurene) * Tribromomethane (Bromoform) 1,1,2-Trichloro-1,2,2-trifluoroethane (Freon 113) * 1,2,4-Trichlorobenzene 1,2,3-Trichlorobenzene * 1,1,2-Trichloroethane (Vinyl trichloride) Trichloroethene (TCE) Trichlorofluoromethane (CFC 11, Freon 11) 1,2,3-Trichloropropane (Allyl trichloride) 1,2,3-Trimethylbenzene (Hemimellitene) * 1,3,5-Trimethylbenzene (Mesitylene) *
Ammonia, as N * **71 84 21993 86 4383 75 11597 78 3080 71 30
100 70 28
Dissolved ammonia plus organic nitrogen, as N * **90 78 219
100 74 43100 62 11577 28 3013 30 3082 24 28
Dissolved nitrite plus nitrate, as N **|99 95 219|100 97 43|100 91 115
|67 81 30|73 74 30|11 71 28
Orthophosphate, as P * **69 79 21965 72 4390 74 11557 59 3017 52 3068 61 28
Total phosphorus, as P * **|87 92 217|93 90 43|100 88 115
Dissolved solids * **100 100 215100 100 43100 100 115
100 100 30100 100 30100 100 28

32 Water Quality in the Lake Erie-Lake Saint Clair Drainages
Fish tissue from streams in agricultural areasFish tissue from streams in urban areasFish tissue from streams draining mixed land uses
Sediment from streams in agricultural areas Sediment from streams in urban areas Sediment from streams draining mixed land uses
Protection of fish-eating wildlife (applies to fish tissue)
Protection of aquatic life (applies to bed sediment)
No benchmark for protection of fish-eating wildlife
No benchmark for protection of aquatic life
|
|
**
CHEMICALS IN FISH TISSUEAND BED SEDIMENTConcentrations and detection frequencies, Lake Erie-Lake Saint Clair Drainages, 1996–98—Detection sensitivity varies among chemicals and, thus, frequencies are not directly comparable among chemicals. Study-unit frequencies of detection are based on small sample sizes; the applicable sample size is specified in each graph
Lowest25
percent
Middle50
percent
Highest25
percent
National benchmarks for fish tissue and bed sediment
National benchmarks include standards and guidelines related to criteria for protection of the health of fish-eating wildlife and aquatic organisms. Sources include the U.S. Environmental Protection Agency, other Federal and State agencies, and the Canadian Council of Ministers of the Environment
*
CONCENTRATION, IN MICROGRAMS PER KILOGRAM(Fish tissue is wet weight; bed sediment is dry weight)
0.1 1 10 100 1,000 10,000 100,000
CONCENTRATION, IN MICROGRAMS PER KILOGRAM(Fish tissue is wet weight; bed sediment is dry weight)
0.1 1 10 100 1,000 10,000 100,000
National ranges of concentrations detected, by land use, in 36 NAWQA Study Units, 1991–98—Ranges include only samplesin which a chemical was detected
Detected concentration in Study Unit
Frequencies of detection, in percent. Detection frequencies were not censored at any common reporting limit. The left-hand column is the study-unit frequency and the right-hand column is the national frequency
Not measured or sample size less than two
Study-unit sample size
66 38
--
12
Organochlorines in fish tissue (whole body)and bed sediment
Study-unit frequency of detection, in percentNational frequency of detection, in percent Study-unit sample size
Study-unit frequency of detection, in percentNational frequency of detection, in percent Study-unit sample size
Other trace elements detectedLead Selenium Uranium Zinc
Trace elements not detected
Cadmium
CONCENTRATION, IN PICOCURIES PER LITER
Trace elements in ground waterStudy-unit frequency of detection, in percent
National frequency of detection, in percent Study-unit sample size
Arsenic
|-- 58 0|23 36 30|-- 37 0
Chromium
|-- 85 0|100 79 29|-- 73 0
Radon-222
|-- 99 0|100 100 21|100 97 28
CONCENTRATION, IN MICROGRAMS PER LITER
0.01 0.1 1 10 100 1,000 10,000 100,000
0.01 0.1 1 10 100 1,000 10,000 100,000
Total Chlordane (sum of 5 chlordanes) |38 38 8|100 75 2|80 56 5
|0 9 7|40 57 5|33 11 3
o,p'+p,p'-DDD (sum of o,p'-DDD and p,p'-DDD) * 38 49 8
100 69 280 50 5
|29 27 7|80 50 5|100 20 3
p,p'-DDE * **88 90 8
100 94 2100 92 543 48 780 62 567 39 3
o,p'+p,p'-DDE (sum of o,p'-DDE and p,p'-DDE) * 88 90 8
100 94 2100 92 5
|43 48 7|80 62 5|67 39 3
o,p'+p,p'-DDT (sum of o,p'-DDT and p,p'-DDT) * 0 31 8
100 53 20 29 5
|0 19 7|40 38 5|33 11 3
Total DDT (sum of 6 DDTs) **|88 90 8|100 94 2|100 93 5
43 49 780 66 5100 41 3
Dieldrin (Panoram D-31, Octalox) * 43 53 70 42 2
80 38 5
|29 13 7|0 30 5|67 9 3
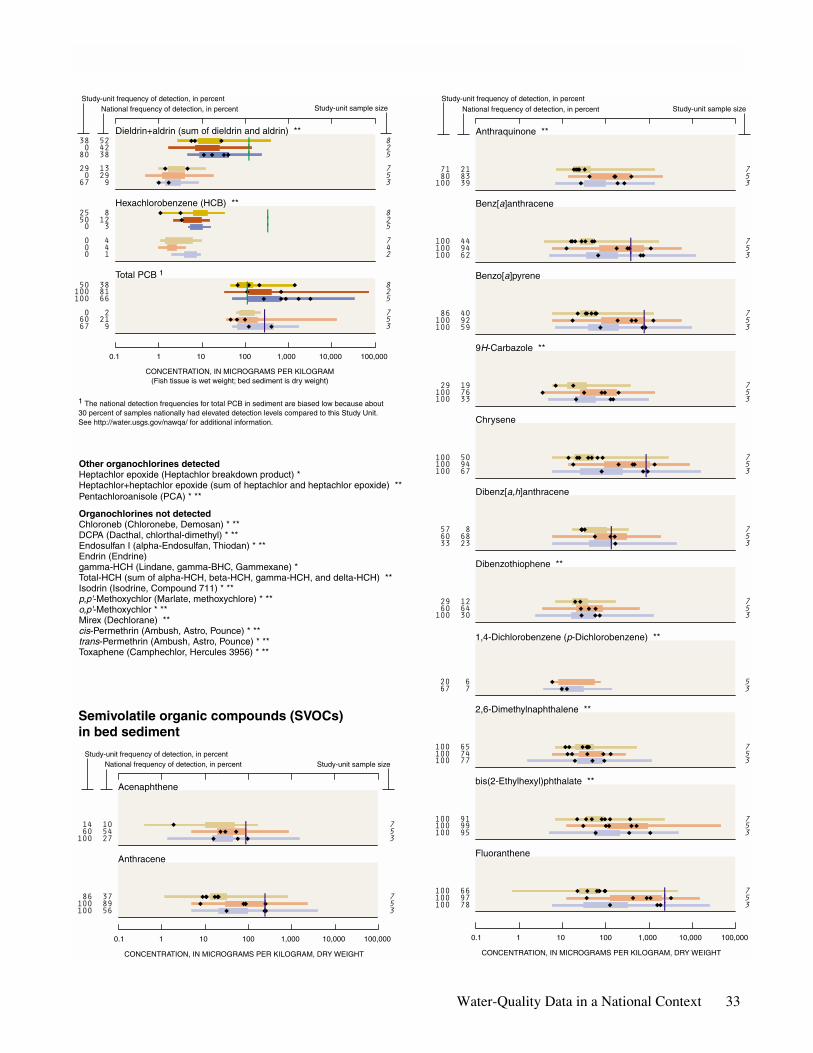
Water-Quality Data in a National Context 33
CONCENTRATION, IN MICROGRAMS PER KILOGRAM, DRY WEIGHT
0.1 1 10 100 1,000 10,000 100,000
CONCENTRATION, IN MICROGRAMS PER KILOGRAM, DRY WEIGHT
0.1 1 10 100 1,000 10,000 100,000
Study-unit frequency of detection, in percentNational frequency of detection, in percent
Study-unit frequency of detection, in percentNational frequency of detection, in percent
Semivolatile organic compounds (SVOCs)in bed sediment
Study-unit sample size
Study-unit sample size
Other organochlorines detectedHeptachlor epoxide (Heptachlor breakdown product) * Heptachlor+heptachlor epoxide (sum of heptachlor and heptachlor epoxide) **Pentachloroanisole (PCA) * **
Organochlorines not detectedChloroneb (Chloronebe, Demosan) * **DCPA (Dacthal, chlorthal-dimethyl) * **Endosulfan I (alpha-Endosulfan, Thiodan) * **Endrin (Endrine) gamma-HCH (Lindane, gamma-BHC, Gammexane) * Total-HCH (sum of alpha-HCH, beta-HCH, gamma-HCH, and delta-HCH) **Isodrin (Isodrine, Compound 711) * **p,p'-Methoxychlor (Marlate, methoxychlore) * **o,p'-Methoxychlor * **Mirex (Dechlorane) **cis-Permethrin (Ambush, Astro, Pounce) * **trans-Permethrin (Ambush, Astro, Pounce) * **Toxaphene (Camphechlor, Hercules 3956) * **
1 The national detection frequencies for total PCB in sediment are biased low because about 30 percent of samples nationally had elevated detection levels compared to this Study Unit. See http://water.usgs.gov/nawqa/ for additional information.
CONCENTRATION, IN MICROGRAMS PER KILOGRAM(Fish tissue is wet weight; bed sediment is dry weight)
0.1 1 10 100 1,000 10,000 100,000
Study-unit frequency of detection, in percentNational frequency of detection, in percent Study-unit sample size
Dieldrin+aldrin (sum of dieldrin and aldrin) **|38 52 8|0 42 2|80 38 5
29 13 70 29 5
67 9 3
Hexachlorobenzene (HCB) **|25 8 8|50 12 2|0 3 5
0 4 70 4 40 1 2
Total PCB 1|50 38 8|100 81 2|100 66 5
|0 2 7|60 21 5|67 9 3
Acenaphthene
|14 10 7|60 54 5|100 27 3
Anthracene
|86 37 7|100 89 5|100 56 3
Anthraquinone **
71 21 780 83 5
100 39 3
Benz[a]anthracene
|100 44 7|100 94 5|100 62 3
Benzo[a]pyrene
|86 40 7|100 92 5|100 59 3
9H-Carbazole **
29 19 7100 76 5100 33 3
Chrysene
|100 50 7|100 94 5|100 67 3
Dibenz[a,h]anthracene
|57 8 7|60 68 5|33 23 3
Dibenzothiophene **
29 12 760 64 5
100 30 3
1,4-Dichlorobenzene (p-Dichlorobenzene) **
20 6 567 7 3
2,6-Dimethylnaphthalene **
100 65 7100 74 5100 77 3
bis(2-Ethylhexyl)phthalate **
100 91 7100 99 5100 95 3
Fluoranthene
|100 66 7|100 97 5|100 78 3

34 Water Quality in the Lake Erie-Lake Saint Clair Drainages
CONCENTRATION, IN MICROGRAMS PER GRAM(Fish tissue is wet weight, bed sediment is dry weight)
0.01 0.1 1 10 100 10,000 1,000
Study-unit frequency of detection, in percent
National frequency of detection, in percent
Trace elements in fish tissue (livers) and bed sediment
Study-unit sample size
CONCENTRATION, IN MICROGRAMS PER KILOGRAM, DRY WEIGHT
0.1 1 10 100 1,000 10,000 100,000
Study-unit frequency of detection, in percentNational frequency of detection, in percent
Other SVOCs detectedAcenaphthylene Acridine **Benzo[b]fluoranthene **Benzo[c]cinnoline **Benzo[ghi]perylene **Benzo[k]fluoranthene **2,2-Biquinoline **Butylbenzylphthalate **p-Cresol **Di-n-butylphthalate **Di-n-octylphthalate **Diethylphthalate **1,2-Dimethylnaphthalene **1,6-Dimethylnaphthalene **3,5-Dimethylphenol **Dimethylphthalate **2-Ethylnaphthalene **9H-Fluorene (Fluorene) Indeno[1,2,3-cd]pyrene **Isophorone **Isoquinoline **1-Methyl-9H-fluorene **2-Methylanthracene **4,5-Methylenephenanthrene **1-Methylphenanthrene **1-Methylpyrene **Naphthalene Phenanthridine **2,3,6-Trimethylnaphthalene **
SVOCs not detectedC8-Alkylphenol **Azobenzene **4-Bromophenyl-phenylether **4-Chloro-3-methylphenol **bis(2-Chloroethoxy)methane **2-Chloronaphthalene **2-Chlorophenol **4-Chlorophenyl-phenylether **1,2-Dichlorobenzene (o-Dichlorobenzene) **1,3-Dichlorobenzene (m-Dichlorobenzene) **2,4-Dinitrotoluene **Nitrobenzene **N-Nitrosodi-n-propylamine **Pentachloronitrobenzene **Quinoline **1,2,4-Trichlorobenzene **
Study-unit sample size
N-Nitrosodiphenylamine **
14 2 70 10 50 4 3
Phenanthrene
|100 50 7|100 93 5|100 66 3
Phenol **
86 81 7100 82 5100 80 3
Pyrene
|100 64 7|100 95 5|100 76 3
Arsenic * 86 56 7100 38 2100 76 4
|100 99 7|100 98 5|100 97 3
Cadmium * 100 77 7100 72 2100 95 4
|100 98 7|100 100 5|100 98 3
Chromium * 43 62 70 72 2
25 54 4
|100 100 7|100 99 5|100 100 3
Copper * 100 100 7100 100 2100 100 4
|100 100 7|100 99 5|100 100 3
Lead * 0 11 7
100 41 2100 41 4
|100 100 7|100 100 5|100 99 3
Mercury * 100 71 7100 59 2100 80 4
|100 82 7|100 97 5|100 93 3
Nickel * **0 42 7
50 44 20 50 4
100 100 7100 100 5100 100 3
Selenium * 100 99 7100 100 2100 99 4
|100 100 7|100 100 5|100 100 3
Zinc * 100 100 7100 100 2100 100 4
|100 100 7|100 99 5|100 100 3

Water-Quality Data in a National Context 35
Biological indicator value, Lake Erie - Lake Saint Clair Drainages, by land use, 1996–98
Biological status assessed at a site
National ranges of biological indicators, in 16 NAWQA Study Units, 1994–98
Streams in undeveloped areasStreams in agricultural areasStreams in urban areasStreams in mixed-land-use areas75th percentile25th percentile
BIOLOGICAL INDICATORSHigher national scores suggest habitat disturbance, water-quality degradation, or naturally harsh conditions. The status of algae, invertebrates (insects, worms, and clams), and fish provide a record of water-quality and stream conditions that water- chemistry indicators may not reveal. Algal status focuses on the changes in the percentage of certain algae in response to increasing siltation, and it often correlates with higher nutrient concentrations in some regions. Invertebrate status averages 11 metrics that summarize changes in richness, tolerance, trophic conditions, and dominance associated with water-quality degradation. Fish status sums the scores of four fish metrics (percent tolerant, omnivorous, non-native individuals, and percent individuals with external anomalies) that increase in association with water-quality degradation
0 10 20 30 40 50 60 70 80 90 100
0 5 10 15 20
Algal status indicatorUndeveloped
Agricultural
Urban
Mixed
Invertebrate status indicatorUndeveloped
Agricultural
Urban
Mixed
Fish status indicatorUndeveloped
Agricultural
Urban
Mixed

A COORDINATED EFFORT
Coordination with agencies and organizations in the Lake Erie-Lake Saint Clair Drainages was integral to the success of this water-quality assessment. We thank those who served as members of our liaison committee.Federal AgenciesU.S. Environmental Protection AgencyU.S. Army Corps of EngineersU.S. Department of AgricultureEnvironment Canada, Great Lakes Division
State AgenciesOhio Environmental Protection AgencyOhio Department of Natural ResourcesOhio Lake Erie CommissionMichigan Department of AgricultureMichigan Department of Environmental QualityIndiana Department of Natural ResourcesNew York Department of Environmental Conservation
Local AgenciesCity of Fort WayneCity of ToledoSoutheast Michigan Council of GovernmentsWashtenaw County, Michigan, Health DepartmentOakland County, Michigan, Health DepartmentAllen County, Indiana, Soil and Water Conservation District
Other public and private organizationsRouge River Program Office, MichiganThe Nature ConservancyGreat Lakes CommissionInternational Association of Great Lakes ResearchersMichigan State UniversityUniversity of Michigan, Dearborn
We thank the following individuals for contributing to this effort.
Robert Pigg, Michigan Department of AgricultureJohn Estenik, Ohio Environmental Protection AgencyCharles Staudt, Ohio Environmental Protection AgencyTerry Keiser, Ohio Northern University
Special thanks to U.S. Geological Survey employees for their contributions: Kevin Metzker, lead technician, Erin Lynch, Bill Yost, Dennis Finnegan, Stephanie Brubeck, Alex Covert,
Rick Hubbell, Craig Oberst, David Eckhardt, George Casey, and Michael Wieczorek. Richard Frehs and C. Michael Eberle for production of the report, including editing, layout, and illustrations.
Appreciation also is extended to those individuals and agencies that reviewed this report: Mark Ayers, CharlesPeters, and Patrick Phillips, and others at the U.S. Geological Survey; Tom Crane, Great Lakes Commission, and Jeffrey Busch, Ohio Lake Erie Commission.
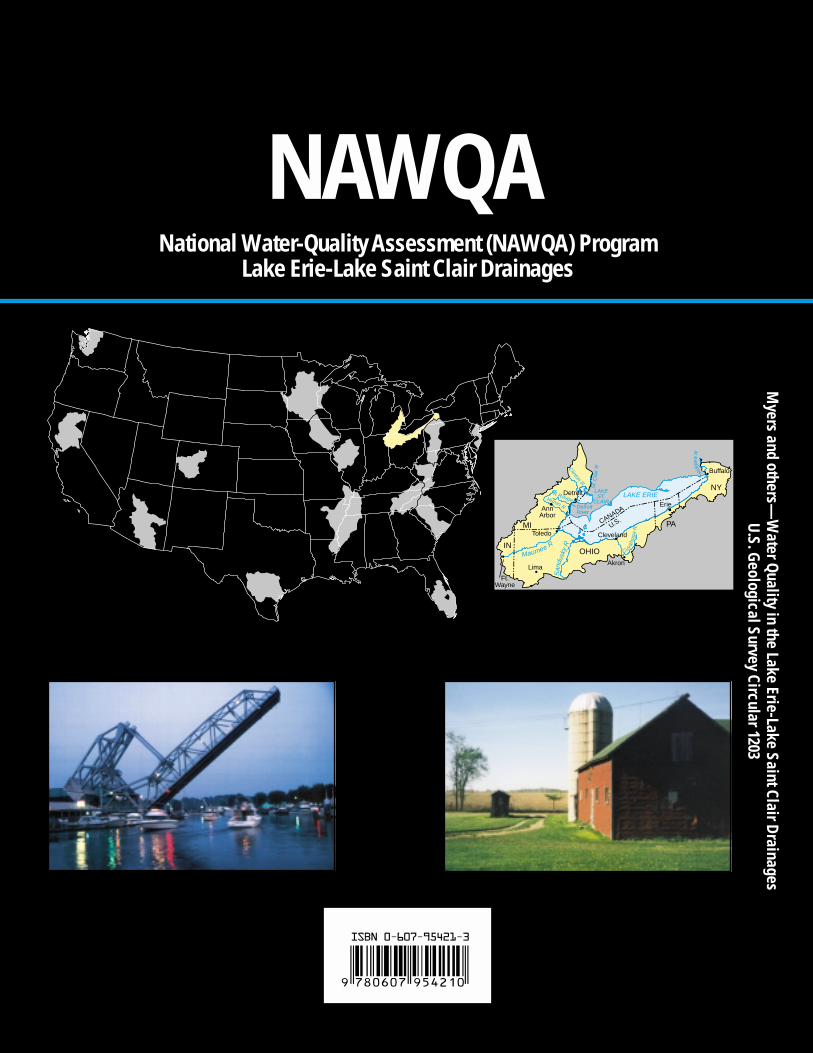
Myers and others—
Water Q
uality in the Lake Erie-Lake Saint Clair Drainages
U.S. G
eological Survey Circular 1203
National Water-Quality Assessment (NAWQA) ProgramLake Erie-Lake Saint Clair Drainages
NAWQA
St.
Cla
ir RClinton R
LAKEST.
CLAIRLAKE ERIE
San
dusk
yR
Maumee RCuya
hoga
R.
Niaga
raR
Huron R
R RougeDetroitRiver
ErieAnn
Arbor
Lima
Toledo Cleveland
Akron
Ft.Wayne
Buffalo
Detroit
PAU.S.CANADA
MI
INOHIO
NY