water quality index development for groundwater … quality index development for groundwater...
TRANSCRIPT

Singh & Hussian, Cogent Engineering (2016), 3: 1177155http://dx.doi.org/10.1080/23311916.2016.1177155
CIVIL & ENVIRONMENTAL ENGINEERING | RESEARCH ARTICLE
Water quality index development for groundwater quality assessment of Greater Noida sub-basin, Uttar Pradesh, IndiaSajal Singh1 and Athar Hussian1*
Abstract: The water quality index (WQI) is an important parameter for determin-ing the drinking water quality for the end users. The study for the same has been carried on the groundwater by collecting 47 groundwater samples from 25 blocks of Greater Noida city, India. In order to develop WQI the samples were subjected to a comprehensive physicochemical and biological analysis of 11 parameters such as pH, calcium, magnesium, chloride, nitrate, sulphate, total dissolved solids, fluorides, bicarbonate, sodium and potassium. Geographical information system has been used to map the sampling area. The coordinates in terms of latitude and longitude of the sampling locations were recorded with the help of global positioning system. Piper plots and cation–anion correlation matrix were plotted from the values ob-tained by the analysis of various parameters. The WQI index for the same has been calculated and the values ranged from 53.69 to 267.85. The WQI values from pres-ent study indicate the very poor quality water in the area dominated by industrial
*Corresponding author: Athar Hussian, Civil Engineering Department, School of Engineering, Gautam Buddha University, Greater Noida 201310, Uttar Pradesh, India E-mail: [email protected]
Reviewing editor:Shashi Dubey, Hindustan College of Engineering, India
Additional information is available at the end of the article
ABOUT THE AUTHORSSajal Singh holds M Tech in Environmental Science & Engineering and completed his MTech dissertation at National Institute of Hydrology (Ministry of water resources), Roorkee (IIT Campus). His research and development work includes monitoring of effluent treatment plants, sewage treatment plants, common effluent treatment plant and other water and wastewater sources. His research interest includes the treatment of the typically contaminated water and wastewater treatment.
Athar Hussain is currently working as an associate professor at Ch. B.P. Govt. Engineering College, Jaffarpur, Delhi, India. His research interest includes water and wastewater treatment, solid and hazardous waste management. He is specialized in biological wastewater treatment and solid waste management.
PUBLIC INTEREST STATEMENTGroundwater resources are affected in principle by major activities such as excessive use of fertilizers and pesticides in agricultural areas, untreated/partially treated wastewater to the environment and excessive pumping. Also, the improper management of aquifers results in excessive water depletion in an area. Another important aspect is solid waste disposal in open unengineered landfill is the one of the factors that cause ground water pollution due to lack of pollution control interventions such as waterproof layer, leachate treatment pond and monitoring wells. The present study has been aimed to develop the Water Quality Index (WQI) of swift developing city Greater Noida located Uttar Pradesh, India. WQI is one of the most effective tools to communicate information on the quality of water to the concerned citizens and policy-makers. WQI is a mathematical equation used to transform large number of water quality data into a single number. The water quality of the study was determined for all samples considering the eleven important parameters such as pH, Total Dissolved Solids (TDS), Total Hardness, Calcium (Ca2+), Magnesium (Mg2+), Sulphates (SO−
4), Chlorides
(Cl−), Nitrates (NO−
3), Fluorides (F−) Bicarbonate
(HCO−
3) , Sodium (Na+) and Potassium (K+) were
taken for the assessment.
Received: 02 January 2016Accepted: 07 April 2016First Published: 18 April 2016
© 2016 The Author(s). This open access article is distributed under a Creative Commons Attribution (CC-BY) 4.0 license.
Page 1 of 17

Page 2 of 17
Singh & Hussian, Cogent Engineering (2016), 3: 1177155http://dx.doi.org/10.1080/23311916.2016.1177155
and construction activities. Poor water quality has been observed in commercial zone of the study area. The analysis reveals the fact that the ground water of the Greater Noida needs a degree of treatment before consumption and needs to be protected from further contamination.
Subjects: Pollution; Water Engineering; Water Science
Keywords: water quality index; ground water quality assessment; physico chemical analysis; biological analysis; GIS; environmental sustainability engineering
1. IntroductionGroundwater is an important source of water supply throughout the world. Groundwater occurs al-most everywhere beneath the earth surface not in a single widespread aquifer but in thousands of local aquifer systems and compartments that have similar characters. Knowledge of the occurrence, replenishment and recovery of groundwater has special significance in arid and semi-arid regions due to discrepancy in monsoonal rainfall, insufficient surface waters and over drafting of groundwa-ter resources.
The ground water quality is still important to the community, therefore it is important to ensure its high quality at all time so that the consumer health is not compromised. Groundwater resources are affected in principle by three major activities. First of these activities is excessive use of fertilizers and pesticides in agricultural areas. The second one is untreated/partially treated wastewater to the environment. Finally, excessive pumping and improper management of aquifers result. The activity of solid waste disposal in open un-engineered landfill is the one of the factor that cause the ground water pollution due to lack of pollution control interventions such as water proof layer, leachate treatment pond, monitoring wells, etc. (Girija et al., 2007).
According to WHO organization, about 80% of all the diseases in human beings are caused by wa-ter. High rates of mortality and morbidity due to water borne diseases are well known in India. Access to safe drinking water remains an urgent necessity, as 30% of urban and 90% of rural households still depend completely on untreated surface or groundwater (Palanisamy et al., 2007). The quality of water is defined in terms of its physical, chemical and biological parameters. Its development and management plays a vital role in agriculture production, poverty reduction, environmental suste-nance and sustainable economic development. In India, most of the population is dependent on groundwater as the only source of drinking water supply. As per the latest estimate of Central Pollution Control Board, about 29,000 million litre/day of wastewater generated from class-I cities and class-II towns out of which about 45% is generated from 35 metro-cities alone (Mangukiya et al., 2012).
Water quality index (WQI) is defined as a rating reflecting the composite influence of different water quality parameters. Horton (1965) has firstly used the concept of WQI, which was further de-veloped by Brown, Mc Clelland, Deininger, and Tozer (1970) and improved by Deininger (Scottish Development Department, 1975). WQI is one of the most effective tools to communicate informa-tion on the quality of any water body. WQI is a mathematical equation used to transform large number of water quality data into a single number. WQI is one of the most effective tools to com-municate information on the quality of water to the concerned citizens and policy-makers. The ad-vent of satellite technology and geographical information system (GIS) has made it very easy to map of the sampling area. GIS has wide application in water quality mapping using which informative and user-friendly maps can be obtained.
The water quality of the study was determined for all samples using the weighted arithmetic index method as per Tiwari and Mishra (1985). In this method, the eleven important parameters such as pH, total dissolved solid (TDS), total hardness, calcium (Ca2+), magnesium (Mg2+), sulphates (SO−
4),
chlorides (Cl−), nitrates (NO−
3), fluorides (F−) bicarbonate (HCO−
3), sodium (Na+) and potassium (K+)
were taken for the assessment.

Page 3 of 17
Singh & Hussian, Cogent Engineering (2016), 3: 1177155http://dx.doi.org/10.1080/23311916.2016.1177155
2. Study areaGreater Noida is a town with a population of 107,676 (till March 2014) approximately is a part of Gautam Budh Nagar district (Figure 3) of Uttar Pradesh (Figure 2), India. It comes under the purview of the National Capital Region of India (Figure 1). Greater Noida is 48 km distance from New Delhi, the capital of India. The city was developed based on Greater Noida Master Plan 2001, 2021 plan report (2013). The notified area of Greater Noida comprising of 124 villages and about 40,000 hec-tare of area is broadly bounded by National Highway 24 in the north-west. Also River Hindon lies in the western side of the city. Due to nearness to Delhi and both these towns being are being well developed. Due to the pressure for development on Greater Noida the number of industries during the last decade, has grown more than ten times. Accordingly the problems related to environmental degradation have increased many folds. In summer i.e. from March to June the weather remains hot and average temperature ranges from minimum of 23 C to maximum of 45 C. Monsoon season pre-vails during mid-June to mid-September with an average rainfall of 93.2 cm (36.7 inches). Average temperature falls substantially down to as low as 3 to 4 C at the peak of winter. Total land use is 13,570 hectares with the total institutional area around 1,970 hectares along with 30 hectares of commercial area. The area is divided into different zones for water supply such as tube wells, over-head tanks and trunk and other supply lines. At present approximately 500 km length of water sup-ply lines with approximately 460 km length of sewerage network and approximately 500 km length of drainage exists. The general slope of the ground water movement is from eastern side towards river Hindon in the west.
3. Materials and methodsA total number of 47 samples during winter period were collected from different selected locations of the study area. The coordinates of the sampling locations in terms of latitudes and longitudes were taken with the GPS. The samples were collected from various sources such as private hand pumps, government hand pumps, bore wells during February 2014. The samples were preserved as per the method prescribed in American Public Health Association manual (APHA, 1999). The depth of less than 30 m was considered as shallow aquifer while the depth greater than 30 m is considered as deep aquifer.
Figure 1. Map of India.
Uttar Pradesh

Page 4 of 17
Singh & Hussian, Cogent Engineering (2016), 3: 1177155http://dx.doi.org/10.1080/23311916.2016.1177155
The samples were analysed for Ca, Mg, Na, K, HCO3, SO4, Cl, SO4, F, NO3 pH, EC, TDS, TSS, TH, turbid-ity, taste and odour, colour and total coliform. All the analyses were carried out as per the standard procedures prescribed in American Public Health Association manual (APHA, 1999). The pH, TDS and EC were measured by Systronics Water Quality Analyzer 371 F using portable Consort electrochemi-cal analyzer model. Na and K were determined by using flame photometer (Systronics mk-1/mk-III). Parameters Ca, Mg, HCO3 and Cl were analysed by titrimetric method. Total coliform were measured
Figure 2. Map of Uttar Pradesh.
Gautam Buddha
Figure 3. (a) Map of district Gautam Buddha Nagar (b) Sampling point locations in Greater Noida city.

Page 5 of 17
Singh & Hussian, Cogent Engineering (2016), 3: 1177155http://dx.doi.org/10.1080/23311916.2016.1177155
by most probable number (MPN) method as per standard method prescribed in APHA 1992. The ionic charge balance was also calculated and it lies < 10% confirming to the reliability of the analytical results. Geochemical facies type, WQI and correlation coefficient matrix of parameters were also determined.
3.1. Piper diagram and cation–anion correlation matrixIn present study, piper plots and cation–anion correlation matrix has been plotted using Aquachem software (Version 14.1) for showing trends of major ions in all the samples. In the piper plot, major ions are plotted as cation and anion percentages in terms of milliequivalents in two base triangles. The piper plot allows comparisons of six parameters between a large numbers of samples. Like all trilinear plots, it does not portray absolute ionic concentrations. Determination of hydrochemical facies has been extensively used in the chemical assessment of groundwater and surface water for several decades. This method is able to provide sufficient information on the chemical quality of water, particularly the origin. Correlation coefficient (r) values have been determined using correla-tion matrix to identify the highly correlated and interrelated water quality parameters.
3.2. Water quality indexWQI is one of the most effective tool to monitor the surface as well as ground water pollution and can be used efficiently in the implementation of water quality upgrading programmes. WQI provide information on a rating scale from zero to hundred. Eleven parameters have been selected for de-veloping the water quality index.
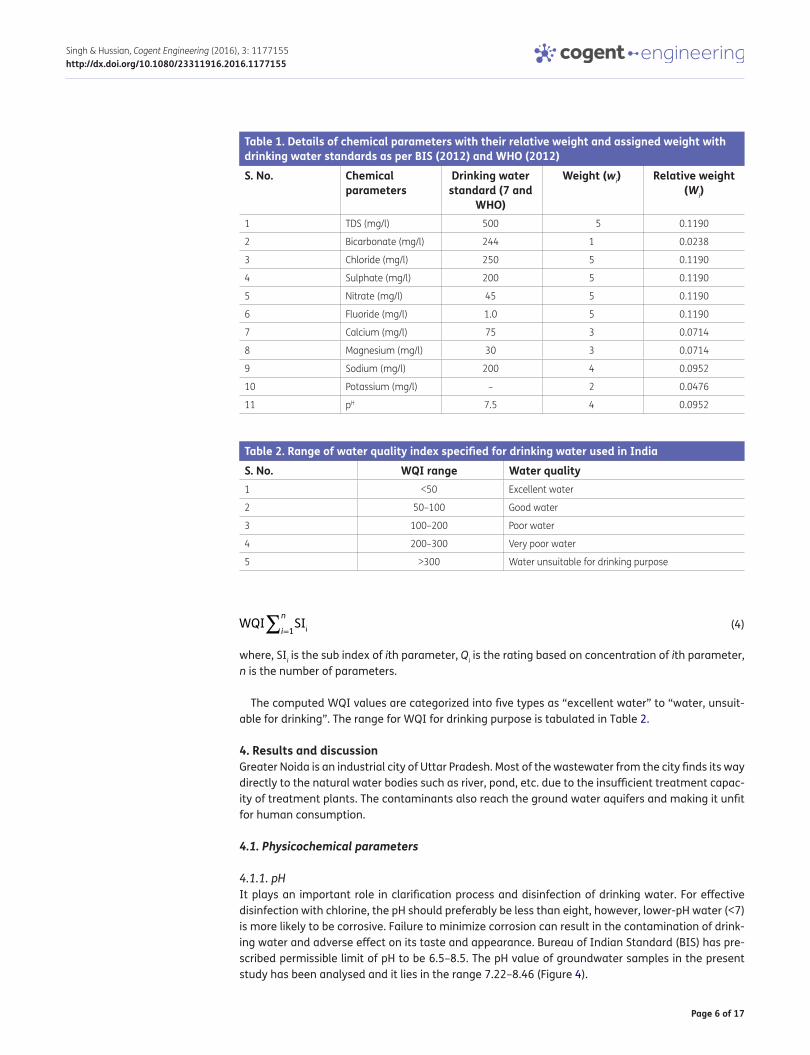
In the present study the WQI has been calculated in three steps. In the first step, each of the 11 parameters (PH, TDS, HCO3, Cl, SO4, NO3, F, Ca, Mg, Na and K) has been assigned a weight (wi) accord-ing to its relative importance in the overall quality of water for drinking purposes in Table 1.
The maximum weight of five has been assigned to the parameter nitrate due to its major impor-tance in water quality assessment (Srinivasamoorthy et al., 2008). Bicarbonate is given the mini-mum weight of 1 as it plays an insignificant role in the water quality assessment. Other parameters like calcium, magnesium, sodium and potassium were assigned weight between 1 and 5 depending on their importance in water quality determination. In the second step, the relative weight (Wi) is computed from the following equations (Equation 1–4).
Wi and wi is the relative weight and weight of each parameter, respectively, and n is the number of parameters.
In the third step, a quality rating scale (Qi) for each parameter is assigned by dividing its concen-tration in each water sample by its respective standard according to the guidelines laid down in the BIS and the result for the same is multiplied by 100 (Equation 2)
where, Qi is the quality rating, Ci is the concentration of each chemical parameter in each water sample in mg/L. Also Si is the Indian drinking water standard for each chemical parameter in mg/L according to the guidelines of the BIS.
For computing the WQI, the SI is first determined for each chemical parameter, which is then used to determine the WQI as per the following Equations (3 and 4)
(1)Wi=
wi
∑n
i=1wi
(2)Qi=
Ci× 100
Si
(3)SIi=W
i× Q
i
Page 6 of 17
Singh & Hussian, Cogent Engineering (2016), 3: 1177155http://dx.doi.org/10.1080/23311916.2016.1177155
where, SIi is the sub index of ith parameter, Qi is the rating based on concentration of ith parameter, n is the number of parameters.
The computed WQI values are categorized into five types as “excellent water” to “water, unsuit-able for drinking”. The range for WQI for drinking purpose is tabulated in Table 2.
4. Results and discussionGreater Noida is an industrial city of Uttar Pradesh. Most of the wastewater from the city finds its way directly to the natural water bodies such as river, pond, etc. due to the insufficient treatment capac-ity of treatment plants. The contaminants also reach the ground water aquifers and making it unfit for human consumption.
4.1. Physicochemical parameters
4.1.1. pHIt plays an important role in clarification process and disinfection of drinking water. For effective disinfection with chlorine, the pH should preferably be less than eight, however, lower-pH water (<7) is more likely to be corrosive. Failure to minimize corrosion can result in the contamination of drink-ing water and adverse effect on its taste and appearance. Bureau of Indian Standard (BIS) has pre-scribed permissible limit of pH to be 6.5–8.5. The pH value of groundwater samples in the present study has been analysed and it lies in the range 7.22–8.46 (Figure 4).
(4)WQI∑n
i=1SIi
Table 1. Details of chemical parameters with their relative weight and assigned weight with drinking water standards as per BIS (2012) and WHO (2012)S. No. Chemical
parametersDrinking water standard (7 and
WHO)
Weight (wi) Relative weight (Wi)
1 TDS (mg/l) 500 5 0.1190
2 Bicarbonate (mg/l) 244 1 0.0238
3 Chloride (mg/l) 250 5 0.1190
4 Sulphate (mg/l) 200 5 0.1190
5 Nitrate (mg/l) 45 5 0.1190
6 Fluoride (mg/l) 1.0 5 0.1190
7 Calcium (mg/l) 75 3 0.0714
8 Magnesium (mg/l) 30 3 0.0714
9 Sodium (mg/l) 200 4 0.0952
10 Potassium (mg/l) – 2 0.0476
11 pH 7.5 4 0.0952
Table 2. Range of water quality index specified for drinking water used in IndiaS. No. WQI range Water quality1 <50 Excellent water
2 50–100 Good water
3 100–200 Poor water
4 200–300 Very poor water
5 >300 Water unsuitable for drinking purpose

Page 7 of 17
Singh & Hussian, Cogent Engineering (2016), 3: 1177155http://dx.doi.org/10.1080/23311916.2016.1177155
4.1.2. ConductivityConductivity is a parameter in water affected by the presence of dissolved ions. Organic compounds do not conduct electric current very well and hence their contribution to conductivity is very low. Significant changes in conductivity could then be an indicator that a discharge or some other source of pollution has entered in a stream. Conductivity of collected samples varies in the range of 710–3,410 μS/cm (Figure 5).
4.1.3. TurbidityRecent research establishes a correlation between gastro-intestinal infections with high turbidity and turbidity events in distribution. The turbidity of the collected samples has been observed in the range 0.28–8.33 NTU. BIS has prescribed 1 NTU as the acceptable limit and 5 NTU as the permissible limit in absence of alternate source of drinking water. In the present study, 87% of the samples were well within the acceptable limit and rest were within the permissible limit except one sample col-lected from location G-26.
4.1.4. TDSThe presence of dissolved solids in water may affect its taste. The palatability of drinking water has been rated by panels of tasters in relation to its TDS level as follows: excellent (less than 300 mg/l), good (300–600 mg/l); fair (600–900 mg/l), poor (900–1,200 mg/l) and unacceptable (>1,200 mg/l). BIS has prescribed 500 mg/L as the acceptable limit and 2,000 mg/L as the permissible limit for TDS
Figure 4. Variation of pH in samples of all the locations.
Figure 5. Variation of electrical conductivity in all samples of different locations.

Page 8 of 17
Singh & Hussian, Cogent Engineering (2016), 3: 1177155http://dx.doi.org/10.1080/23311916.2016.1177155
for the water to be used for drinking purpose. In present study, the TDS concentration of analysed samples lies in the range of 454–2,182 mg/L (Figure 6).
It is inferred that TDS of all the samples is well within the permissible limit prescribed by BIS except the sample No. G-38, where the TDS concentration is found to be 2,182 mg/L.
4.1.5. Total hardnessIn fresh water sources, hardness is mainly due to presence of calcium and magnesium salts. Temporary hardness more than 200 mg/L as CaCO3 may cause scale deposition in the treatment works, distribution system and pipe work and tanks within buildings. Water with hardness less than 100 mg/l may, in contrast, have a low buffering capacity and will be more corrosive for water pipes. BIS has prescribed 200 mg/l as the acceptable limit and 600 mg/l as the permissible limit for total hardness in absence of alternate source of drinking water. The hardness of groundwater samples in the study area is found to be in the range 91–678 mg/L as CaCO3 (Figure 7). The hardness value of sample no is found to be 678 mg/L as Ca CO3 which is exceeding the permissible limit of 600 mg/L, while 23% of total samples were found to be within the desirable limit of 200 mg/l.
Figure 6. Variation of total dissolved solids in all the samples.
Figure 7. Variation of total hardness in all the samples from different locations.

Page 9 of 17
Singh & Hussian, Cogent Engineering (2016), 3: 1177155http://dx.doi.org/10.1080/23311916.2016.1177155
4.1.6. CalciumAnalysis of calcium has also been carried out in all the samples in present study. The BIS limit for calcium is 75 mg/l as acceptable limit and 200 mg/L as permissible limit for drinking water. The cal-cium concentration in all groundwater samples of the study area lies in the range of 10.91–135.69 mg/l (Figure 8). The concentration of all the samples is well within the permissible limit of 200 mg/l.
4.1.7. MagnesiumMagnesium is another important parameter that has been analysed in all the samples taken in the present study. The BIS limits the magnesium concentration of 30 mg/l as acceptable value and 100 mg/L as a permissible value for drinking water. The magnesium concentration of all the samples has been found to be in the range of 7.5–120.5 mg/l (Figure 9). Only 25% of the total samples has been found to be within the acceptable limit. However, the concentration of magnesium in sample number G-38 is found to be 120.5 mg/L which is greater than the permissible limit prescribed by BIS.
Figure 8. Variation of calcium hardness in all the samples.
Figure 9. Variation of magnesium hardness in samples from different locations.

Page 10 of 17
Singh & Hussian, Cogent Engineering (2016), 3: 1177155http://dx.doi.org/10.1080/23311916.2016.1177155
4.1.8. AlkalinityAlkalinity in the water may be due to hydroxides, carbonates and bicarbonates. The relationship between pH, alkalinity and water stability is shown in Figure 10. BIS has prescribed 200 mg/l as the acceptable limit and 600 mg/l as the permissible limit for total alkalinity as CaCO3 in absence of al-ternate source of drinking water. In present study, the alkalinity of all samples lies between 137 and 287 mg/l (Figure 10) and is well within the permissible limit prescribed by BIS for water used for drinking purpose.
Bicarbonate ions are the major contributor of alkalinity in ground water. In present study, the concentration of bicarbonate ions lies in the range of 168–350 mg/L in all the collected water sam-ples (Figure 10).
4.1.9. SodiumSodium is a very reactive metal, and therefore does not occur in its free form in nature. High sodium intake can have adverse effects on humans with high blood pressure or pregnant women suffering from toxaemia. At room temperature, the average taste threshold for sodium is about 200 mg/l. Based on this, WHO has prescribed 200 mg/l as a limit for sodium in drinking water and BIS has not prescribed any limit. The concentration of sodium in groundwater samples of the study area ranges between 2.5 and 995.5 mg/l during study period (Figure 11.). 89% samples were well within the pre-scribed limit for sodium.
4.1.10. ChloridesSome common chloride compounds found in natural water are sodium chloride (NaCl), potassium chloride (KCl), calcium chloride (CaCl2) and magnesium chloride (MgCl2). Taste thresholds for the chloride anion depend on the associated cations and the concentration ranges from 200 to 300 mg/L for sodium, potassium and calcium chloride. Based on taste threshold, BIS has prescribed 250 mg/l as the acceptable limit and 1,000 mg/l as the permissible limit for chloride. The concentrated of chloride in the collected samples were in the range of 33.2–675.6 mg/l (Figure 12). Chloride level in 89% samples was well within the acceptable limit and chloride level in all the samples were within permissible limit prescribed by BIS.
4.1.11. PotassiumPotassium is an essential element in humans and is seldom, if ever, found in drinking water at levels that could be a concern for humans health. Adverse health effects due to potassium consumption from drinking water are unlikely to occur in healthy individuals. The concentration of potassium in all groundwater samples of the study area ranges between 3.9 and 29.7 mg/l (Figure 13). The potassi-um concentration of 10 mg/l is permissible limit being prescribed by BIS (2012). The maximum con-centration is found to be in the sample G-38. Result analysis indicates that the concentration of
Figure 10. Comparison of alkalinity and bicarbonate variations in all the analysed samples.

Page 11 of 17
Singh & Hussian, Cogent Engineering (2016), 3: 1177155http://dx.doi.org/10.1080/23311916.2016.1177155
potassium in 87% of the total samples is found to be well within the permissible limit prescribed by BIS for drinking water.
4.1.12. SulphateThe most common form of sulphur in well-oxygenated water is sulphate. The presence of sulphate in drinking water can cause noticeable taste, and very high levels might cause a laxative effect in unaccustomed consumers. Taste thresholds have been found to range from 250 mg/l for sodium sulphate to 1,000 mg/L for calcium sulphate. BIS has prescribed 200 mg/l as the acceptable limit and 400 mg/L as the permissible limit. Sulphate concentration of groundwater samples in the study area lies in the range of 2 mg/L–1,300 mg/L (Figure 13). Sulphate concentration in all the samples is found to be within the acceptable limit prescribed by BIS for drinking water.
4.1.13. NitrateNitrate (NO3) is found naturally in the environment and is an important plant nutrient. Some ground waters may also have nitrate contamination as a consequence of leaching from natural vegetation. The presence of nitrate in drinking water is a potential health hazard when present in large
Figure 11. Variation of sodium concentration in all the samples.
Figure 12. Variation of chlorides in all the samples from different locations.

Page 12 of 17
Singh & Hussian, Cogent Engineering (2016), 3: 1177155http://dx.doi.org/10.1080/23311916.2016.1177155
quantities. The combination of nitrates with amines, amides, or other nitrogenous compounds through the action of bacteria in the digestive tract results in the formation of nitrosamines, which are potentially carcinogenic. The maximum allowable nitrate concentration as per BIS for drinking water is 45 mg/L as NO3. The concentration of nitrate in groundwater samples of the study area ranges between 3.2 and 15.1 mg/l (Figure 13) and is found to be well within the desirable limit pre-scribed by BIS.
4.1.14. FluorideFluoride is found in all natural type of waters at different concentrations. The fluoride concentration in water is limited by fluorite solubility, so that in the presence of 40 mg/L calcium it should be limited to 3.1 mg/L. It is the absence of calcium in solution which allows higher concentrations to be stable. Excess fluoride intake causes different types of fluorosis, primarily dental and skeletal fluorosis. BIS has prescribed 1 mg/l as the acceptable limit and 1.5 mg/l as the permissible limit for fluoride. The fluoride concentration of all groundwater samples in present study is in the range 0–1.70 mg/l (Figure 14). It is found that Fluoride concentration in 89% of total samples is well within the acceptable limit prescribed by BIS. However, it can also be inferred that 98% of total samples were with within permis-sible limit prescribed by BIS expect one sample (GW-1) exceeded the permissible limit.
Figure 13. Comparison of potassium, sulphate and nitrate variations in different samples of all the locations.
Figure 14. Fluoride variation in all the samples of different locations.

Page 13 of 17
Singh & Hussian, Cogent Engineering (2016), 3: 1177155http://dx.doi.org/10.1080/23311916.2016.1177155
4.1.15. MPNTotal coliform bacteria include a wide range of aerobic and facultative anaerobic, Gram-negative, non-spore-forming bacilli capable of growing in the presence of relatively high concentrations of bile salts with the fermentation of lactose and production of acid or aldehyde within 24 h at 35–37 C. This test is first in line to micro-biological analysis. Negative results of the analysis test indicate the ab-sence of any pathogens. The total coliform count in all the collected samples of the present study is found to be negative.
4.2. Hydrogeochemical facies of groundwaterHydrochemical concepts can help to elucidate mechanisms of flow and transport in groundwater systems, and unlock an archive of paleoenvironmental information (Hem, 1992; Ophori & Toth, 1989; Pierre, Glynn, & Plummer, 2005). Every sample is represented by three data points; one in each triangle and one in the projection diamond grid. Also the pH, alkalinity and water stability standard relationship has been shown through Figure 15.
The main purpose of piper plots is to indicate water type of an area. All cations and anions desig-nate a decrease trend in results as shown in Table 3. It is very useful for indication of the sample of
Figure 15. pH, alkalinity and water stability standard relationship.
Table 3. Sample analysis of the mixed concentrations of cations and anionsGroup No. Group sample ID Cation and anion mixed concentrationGroup 1. G-39, G-30, G-40, G-15, G-10, G-33 Mg-Ca-HCO3-Cl
Group 2. G-35, G-32 Mg-Ca-Cl-HCO3
Group 3. G-12 Mg-Cl-HCO3
Group 4. G-17 Mg-Ca-Na-Cl-HCO3
Group 5. G-28, G-14 Mg-Na-Ca-Cl-HCO3
Group 6. G-23, G-13, G-21 Mg-Na-HCO3-Cl
Group 7. G-2, G-7 Na-Ca-Cl-HCO3
Group 8. G-37 Na-SO4-Cl
Group 9. G-2, G-20, G-25 Na-Mg-HCO3-Cl
Group 10. G-3, G-6, G-4, G-5 Na-Ca-HCO3-Cl
Group 11. G-42, G-44, G-18 Na-Cl-HCO3
Group 12. G-45, G-46, G-43, G-1 Na-HCO3-Cl
Group 13. G-38 Na-Mg-Cl
Group 14. G-36 Na-Mg-Ca-Cl-HCO3
Group 15. G-34, G-16, G-19 Mg-Na-Cl-HCO3
Group 16. G-29, G-26, G-31, G-9 Mg-Na-Ca-HCO3-Cl

Page 14 of 17
Singh & Hussian, Cogent Engineering (2016), 3: 1177155http://dx.doi.org/10.1080/23311916.2016.1177155
mixed concentrations such as magnesium (Mg2+), bicarbonate (HCO−
3), sodium (Na+), sulphate (SO−
4)
and chloride (Cl−), etc. that varies from area to area.
Most of the samples indicate that the cations and anions are in mixed concentration in piper tri-angle. The plot shows majority of water samples fall in mixed Mg-Ca-HCO3-Cl, Na-Ca-HCO3-Cl, Na-HCO3-Cl and Mg-Na-Ca-HCO3-Cl concentration type (Figure 16) with minor representations from mixed types Mg-Ca-Cl-CO3, Mg-Cl-HCO3, Mg-Ca-Na-Cl-HCO3, Mg-Na-Ca-Cl-HCO3, etc. Only two sam-ples indicate the higher mixed concentration Na-SO4-Cl and Na-Mg-Cl sample G-37 (ID) and G-38 (ID), respectively. Alkali metal (Ca2+ + Mg2+) exceeds over the alkaline earth metal (Na+ + K+) and the temporary hardness prevails over permanent hardness (Figure 16)
4.3. Correlation coefficient matrix of water parametersA correlation coefficient (nearly 1 or −1) values lies between −1 and +1 and a correlation coefficient around zero means no relationship (Muthulakshmi et al., 2013). Positive values indicate a positive relationship while negative values of r indicate an inverse relationship. The values of correlation co-efficients (r) are given in Table 4.
Figure 16. Piper triangle diagram for comparison of cations and anions in all the samples.
Table 4. Correlation coefficient matrix of analysed water quality parameters in all samplespH Cond TDS Mg Ca Na K Cl SO4 HCO3 NO3
pH 1 0 0 0 0 0 0 0 0 0 0
Cond μS/cm 1 1 0.178 0.348 0.942 0.117 0.803 0.837 0.369 −0.101
TDS mg/l 1 0.178 0.348 0.942 0.116 0.803 0.837 0.37 −0.101
Mg mg/l 1 0.176 −0.026 0.814 0.46 0.145 −0.208 0.0064
Ca mg/l 1 0.231 0.246 0.485 0.237 0.1 −0.195
Na mg/l 1 −0.028 0.664 0.911 0.296 −0.164
K mg/l 1 0.393 0.137 −0.127 0.044
Cl mg/l 1 0.514 0.127 −0.15
SO4 mg/l 1 0.093 −0.197
HCO3 mg/l 1 0.154
NO3 mg/l 1

Page 15 of 17
Singh & Hussian, Cogent Engineering (2016), 3: 1177155http://dx.doi.org/10.1080/23311916.2016.1177155
Table 5. Details of water quality and Index rate of analysed samplesSample ID Index rate Water qualityG-1 77.43 Good water
G-2 81.14 Good water
G-3 70.11 Good water
G-4 67.02 Good water
G-5 68.68 Good water
G-6 72.14 Good water
G-7 65.5 Good water
G-8 53.69 Good water
G-9 71.12 Good water
G-10 77.46 Good water
G-11 70.72 Good water
G-12 77.46 Good water
G-13 77.46 Good water
G-14 78.75 Good water
G-15 55.5 Good water
G-16 82.86 Good water
G-17 68.92 Good water
G-18 64.98 Good water
G-19 78.37 Good water
G-20 63.64 Good water
G-21 72.06 Good water
G-22 84.76 Good water
G-23 77.04 Good water
G-24 73.72 Good water
G-25 69.68 Good water
G-26 79.91 Good water
G-27 62.15 Good water
G-28 94.36 Good water
G-29 62.66 Good water
G-30 58.0 Good water
G-31 61.79 Good water
G-32 84.00 Good water
G-33 61.84 Good water
G-34 75.06 Good water
G-35 64.53 Good water
G-36 92.05 Good water
G-37 267.85 Very poor water
G-38 152.24 Poor water
G-39 56.69 Good water
G-40 60.23 Good water
G-41 68.82 Good water
G-42 97.06 Good water
G-43 70.39 Good water
G-44 84.97 Good water
G-45 74.29 Good water
G-46 70.35 Good water
G-47 63.91 Good water

Page 16 of 17
Singh & Hussian, Cogent Engineering (2016), 3: 1177155http://dx.doi.org/10.1080/23311916.2016.1177155
Electric conductivity (EC) has a strong positive and signification correlation with TDS, Na+, Cl−, SO−
4
weak correlation with magnesium, calcium, potassium and bicarbonate and negative correlation with nitrate. The TDS showed negative correlation with nitrate. The TDS showed max correlation with sodium, chloride and sulphate and min with magnesium, calcium, potassium and bicarbonate.
The magnesium showed positive correlation with Ca2+, Cl−, SO−
4 and NO−
3. A strong positive correla-
tion of magnesium vs. potassium in the water was observed and negative with sodium and bicarbo-nate. Calcium has a weak positive correlation with Na+, K+, Cl−, SO−
4, and HCO−
3 and negative with
nitrate. Sodium showed negative correlation with K+ and NO−
3. The sodium showed max correlation
with sulphate and minimum with chloride and bicarbonate. Potassium showed negative correlation with bicarbonate and weak positive with chloride, sulphate and nitrate. Chloride has weak positive correlation with sulphate and bicarbonate and negative with nitrate. Sodium showed weak positive correlation with bicarbonate and negative with nitrate. Bicarbonate showed weak positive correla-tion with nitrate.
4.4. Developed index for ground water qualityDuring study period, very poor quality water has been observed in sample (G-37) from CHI-3 or Temple (R1 Scheme P5). This may be due to the location of the study area which is dominated by industrial and construction activities. Poor water quality is noted in (G-38) location from Radisson Hotel (Jaypee Integrated complex) of the study area, dominated by the influence of direct dump of waste on land in back side of location and domestic activities. Water quality was observed good in locations with Sample ID as G-1, G-2, G-3, G-4, G-5, G-6, G-7, G-8, G-9, G-10, G-11, G-12, G-13, G-14, G-15, G-16, G-17, G-18, G-19, G-20, G-21, G-22, G-23, G-24, G-25, G-26, G-27, G-28, G-29, G-30, G-31, G-32, G-33, G-34, G-35, G-36, G-39, G-40, G-41, G-42, G-43, G-44, G-45, G-46 and G-47.
However the study area is of granulite gneiss region, where industrial activities are dominant, and human activities such as domestic and construction, etc. are in progress (Vasanthavigar et al., 2010). Excellent water quality has not been observed in any study area. The index rate and type of water of ground water sample of the study area were calculated and the values are given in Table 5. Perusal of the data from Table 5 indicates that 96% of total water samples are observed to be of good qual-ity of water while 2% of water sample shows the poor quality of water. However the remaining 2% of water sample shows the very poor quality of water.
5. ConclusionIn the present study, the computed WQI values ranges from 53.69 to 267.85. Very poor quality water has been observed in sample G-37 taken from location CHI-3 or Temple (R1 Scheme P5) of the study area. Poor water quality has been observed in sample G-38 from location Radisson Hotel (Jaypee Integrated complex) of the study area. It has been observed that 97% of samples indicate a good water quality around the study area. Analysis of results reveals the fact that WQI pertaining to the groundwater of the area needs some degree of treatment before consumption. Only one sample of location G-8 from HGVA (Echar Village) has been observed to be best in quality for drinking and all the parameters are well within the acceptable limit prescribed by BIS (2012) for drinking water. Piper plot of the physicochemical plot indicates alkali metals exceeding over the alkaline earth metals and the temporary hardness prevails over permanent hardness.
The results of the correlation analysis indicate a strong positive correlation of magnesium with potassium ions and negative correlation between sodium and bicarbonate ions. Correlation of cal-cium with Na+, K+, Cl−, SO−
4 is found to be weakly positive and negative for nitrate. Sodium indicates
max correlation with sulphate, minimum with chloride and bicarbonate, and negative with bicarbo-nate. Chloride showed a weak positive correlation with sulphate and bicarbonate and negative cor-relation with nitrate.

Page 17 of 17
Singh & Hussian, Cogent Engineering (2016), 3: 1177155http://dx.doi.org/10.1080/23311916.2016.1177155
© 2016 The Author(s). This open access article is distributed under a Creative Commons Attribution (CC-BY) 4.0 license.You are free to: Share — copy and redistribute the material in any medium or format Adapt — remix, transform, and build upon the material for any purpose, even commercially.The licensor cannot revoke these freedoms as long as you follow the license terms.
Under the following terms:Attribution — You must give appropriate credit, provide a link to the license, and indicate if changes were made. You may do so in any reasonable manner, but not in any way that suggests the licensor endorses you or your use. No additional restrictions You may not apply legal terms or technological measures that legally restrict others from doing anything the license permits.
AcknowledgementsThe authors of this paper are thankful to Noida authority and Gautam Buddha University for using lab facilities.
Funding.This research was carried out at Gautam Buddha University, Greater Noida. The research has not been funded by government or private funding agency.
Author detailsSajal Singh1
E-mail: [email protected] Hussian1
E-mail: [email protected] Civil Engineering Department, School of Engineering,
Gautam Buddha University, Greater Noida 201310, Uttar Pradesh, India.
Citation informationCite this article as: Water quality index development for groundwater quality assessment of Greater Noida sub-basin, Uttar Pradesh, India, Sajal Singh & Athar Hussian, Cogent Engineering (2016), 3: 1177155.
ReferencesAPHA. (1999). Standard methods for the examination of water
and waste waters (18th ed.). Washington, DC: Author.BIS. (2012). Drinking water specification IS: 10500:2012. New
Delhi: Author.Brown, R. M., Mc Clelland, N., Deininger, R. A., & Tozer, R. G.
(1970). A water quality index - do we dare. Water Sewage Works, 117, 339–343.
Girija, T. R., Mahanta, C., & Chandramouli, V. (2007). Water quality assessment of an untreated effluent impacted urban stream: The Bharalu tributary of the Brahmaputra River, India. Environmental Monitoring and Assessment, 130, 221–236. http://dx.doi.org/10.1007/s10661-006-9391-6
Greater Noida Master Plan, 2001, 2021 plan report. (2013). Greater Noida Authority.
Hem, J. D. (1992). Study and interpretation of chemical characteristics of natural water (3rd ed., U.S. Geological
Survey Water-Supply Paper 2254, 263 p.). Alexandria, VA: U.S. Geological Survey.
Horton, R. K. (1965). An index number system for rating water quality. Journal of Water Pollution Control Federation, 37, 300–305.
Mangukiya, R., Bhattacharya, T., & Chakraborty, S. (2012). Quality characterization of groundwater using water quality index in Surat city, Gujarat, India. International Research Journal of Environment Sciences, 1, 14–23.
Muthulakshmi, L., Ramu, A., Kannan, N., & Murugan, A. (2013). Application of correlation and regression analysis in assessing ground water quality, Virudhunagar, India. International Journal of ChemTech Research, 5, 353–361.
Ophori, D. U., & Toth, J. (1989). Characteristics of ground water flow by field mapping and numerical simulation, Ross Creek Basin, Alberta, Canada. Ground Water, 27, 193–201.
Palanisamy, P. N., Geetha, A., Sujatha, M., Sivakumar, P., & Karunakaran, K. (2007). Assessment of ground water quality in and around Gobichettipalayam town Erode District, Tamil Nadu, India. E-Journal of Chemistry, 4, 434–439.
Pierre, D., Glynn, L., & Plummer, N. (2005). Geochemistry and the understandings of the groundwater systems. Hydrogeol Journal, 13, 263–287.
Srinivasamoorthy, K., Chidambaram, S., Prasanna, M. V., Vasanthavihar, M., John peter, A., & Anandhan, P. (2008). Identification of major sources controlling groundwater chemistry from a hard rock terrain—A case study from Mettur taluk, Salem district, Tamil Nadu, India. Journal of Earth System Science, 117, 49–58. http://dx.doi.org/10.1007/s12040-008-0012-3
Tiwari, T. N., & Mishra, M. A. (1985). A preliminary assignment of water quality index of major Indian river and ground water. Indian Journal of Environmental Protection, 5, 276–279.
Vasanthavigar, M., Srinivasamoorthy, K., Vijayaragavan, K., Ganthi, R. R., Chidambaram, S., Anandhan, P., … Vasudevan, S. (2010). Application of water quality index for groundwater quality assessment: Thirumanimuttar sub-basin, Tamil Nadu, India. Environmental Monitoring and Assessment, 171, 595–609.
WHO. (2012). Guidelines for drinking water, recommendations. Author.