Water quality monitoring quality assurance...2019/05/02 · “Collect water quality data to determine the likelihood that waterbodies in the Blackstone River Watershed meet state
100
WATER QUALITY MONITORING QUALITY ASSURANCE WORKSHOP WORCESTER, MA MAY 2, 2019 Massachusetts Rivers Alliance
ldquoA document that outlines the monitoring program including how it fits within your organizationrsquos objectives and goals ldquo - ALLARM
QAPP
The Quality Assurance Project Plan is ldquoa document that outlines the procedures and measures used to ensure the quality of the data when collecting and analyzing the samples and managing the data ldquo - ALLARM
SAMPLING AND ANALYSIS PLAN
A document that outlines the field and lab procedures followed in the monitoring program Usually specific to a monitoring year
STANDARD OPERATING PROCEDURES
An SOP is a document that describes in detail how to take samples or measurements in the field or how to perform a laboratory analysis
DATA QUALITY OBJECTIVES
DQOs are the qualitative and quantitative terms used to describe how good your data needs to be to meet project objectivesldquoCollect water quality data to determine the likelihood that waterbodies in the Blackstone River Watershed meet state water quality standardsrdquo
ParameterField
Precision(RPD)
Lab Precision (RPD)
Accuracy (R)
Field Blank Cleanliness
Water ColumnTotal Phosphorus le 30 le 20 80-120 lt RL
WATER QUALITY MONITORING PLANNING PROCESS
MONITORING PROGRAM ACTIVITIES
bull BEFORE SAMPLING BEGINS
bull DURINGIMMEDIATELY AFTER SAMPLING
bull AFTER SAMPLING amp ANALYSIS
- Study Design - QAPP- Training
- Sample Collection- Lab Analysis
- Data Management- Data Analysis- Data Review Validation amp Verification- Data Submission (optional)- Data Presentation- Program Evaluation
WHY DO YOU NEED (WHO GIVES) A QAPP
bull As a guidance document to clearly outline monitoring objectives how data will be used what steps are needed to meet your goals and Data Quality Objectives
bull Regardless of what your goals are developing a QAPP ensures you will collect data that can be used for its intended purpose
bull If want data to be used by DEP having an approved QAPP is a requirement
bull May be required to have a QAPP to obtain monitoring grants from the State of Massachusetts or from EPA
Up-front time spent writing a QAPP will save a great deal of time and headaches throughout the sampling year
STEPS TO QAPP DEVELOPMENT
This session will cover
The process of writing a QAPP
Details on major elements or sections of QAPPbull What each meansbull What to includebull Where to obtain needed information how to decide what to write
Supporting Documents
STEPS TO DEVELOPING A QAPP
1 ESTABLISH A QAPP TEAM
2 DETERMINE THE GOALS AND OBJECTIVES OF YOUR PROJECT
3 COLLECT BACKGROUND INFORMATION
4 REFINE YOUR PROJECT
5 DESIGN YOUR SAMPLING ANALYTICAL AND DATA REQUIREMENTS
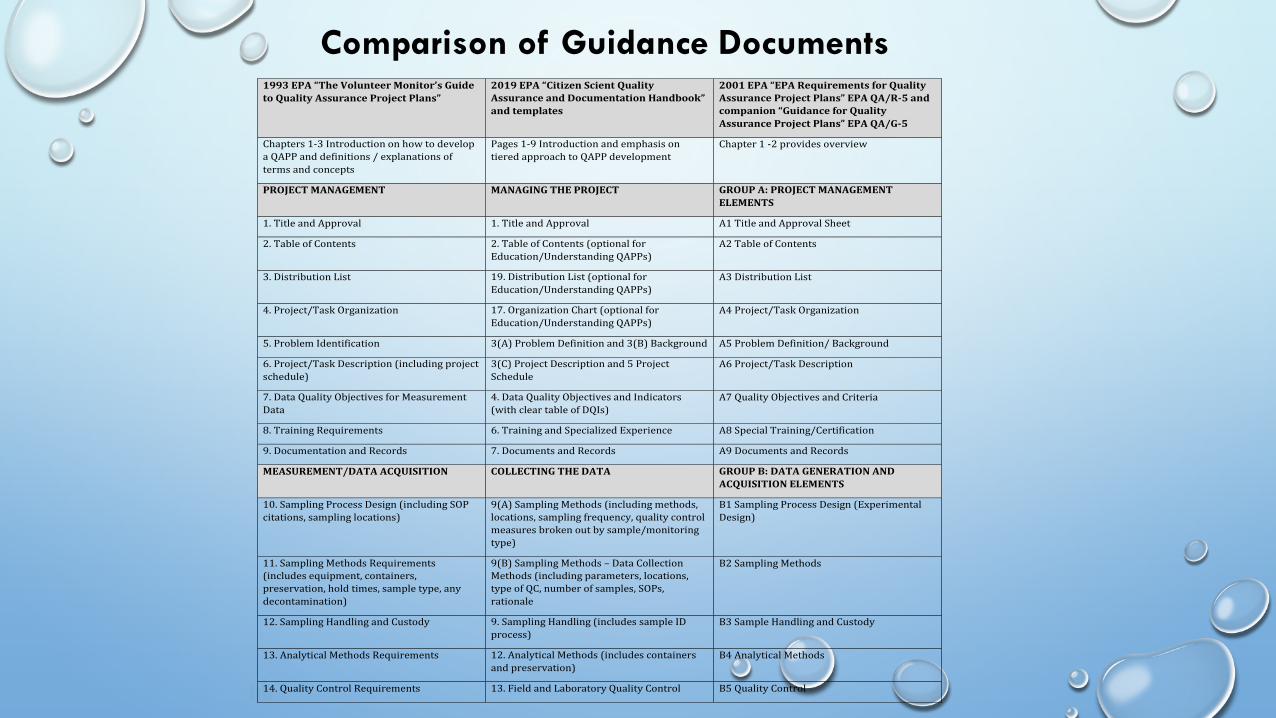
14 Quality Control Requirements 13 Field and Laboratory Quality Control B5 Quality Control
Comparison of Guidance Documents - Continued
Elements of a QAPPProject Management1 Title and Approval Page2 Table of Contents3 Distribution List4 ProjectTask Organization5 Problem Identification Background6 ProjectTask Description7 Data Quality Objectives for Measurement Data8 Training RequirementsCertification9 Documentation and RecordsMeasurementData Acquisition10 Sampling Process Design11 Sampling Methods Requirements12 Sample Handling and Custody13 Analytical Methods Requirements14 Quality Control Requirements15 InstrumentEquipment Testing Inspection and Maintenance Requirements16 Instrument Calibration and Frequency17 InspectionAcceptance Requirements for Supplies18 Data Acquisition Requirements19 Data ManagementAssessment and Oversight20 Assessment and Response Actions21 ReportsData Validation and Usability22 Data Review Validation and Verification23 Validation and Verification Methods24 Reconciliation with Data Quality Objectives
STEPS TO DEVELOPING A QAPP
1 ESTABLISH A QAPP TEAM
2 DETERMINE PROJECT GOALS amp OBJECTIVES
3 COLLECT BACKGROUND INFORMATION
4 REFINE YOUR PROJECT
5 DESIGN SAMPLING ANALYTICAL amp DATA REQUIREMENTS
6 DEVELOP IMPLEMENTATION PLAN
7 DRAFT SOPS AND QAPP
8 SOLICIT FEEDBACK ON SOPS AND QAPP
9 REVISE SUBMIT FOR FINAL APPROVAL
10 BEGIN YOUR MONITORING PROJECT
11 EVALUATE AND REFINE YOUR QAPP
Elements of a QAPPProject Management1 Title and Approval Page2 Table of Contents3 Distribution List4 ProjectTask Organization5 Problem Identification Background6 ProjectTask Description7 Data Quality Objectives for Measurement Data8 Training RequirementsCertification9 Documentation and RecordsMeasurementData Acquisition10 Sampling Process Design11 Sampling Methods Requirements12 Sample Handling and Custody13 Analytical Methods Requirements14 Quality Control Requirements15 InstrumentEquipment Testing Inspection and Maintenance Requirements16 Instrument Calibration and Frequency17 InspectionAcceptance Requirements for Supplies18 Data Acquisition Requirements19 Data ManagementAssessment and Oversight20 Assessment and Response Actions21 ReportsData Validation and Usability22 Data Review Validation and Verification23 Validation and Verification Methods24 Reconciliation with Data Quality Objectives
Elements of a QAPP ndash Suggested completion order
Data Quality Objectives for Measurement Data (7)Sampling Process Design (10) Sampling Methods Requirements (11) Sample Handling and custody Requirement (12)Analytical Methods Requirements (13) Quality Control Requirements (14)
InstrumentsEquipment Testing Inspections and Maintenance Requirements (15)Instrument Calibration and Frequency (16)Inspection Acceptance Requirements for Supplies (17)Training Requirements Certification (8)
Elements of a QAPP ndash Suggested completion order continued
Documentation and Records (9) Data Management (19)Data Acquisitions Requirements (18)
Data Review Validation and Verification Requirements (22)Validation and Verification Methods (23)Reconciliation with Data Quality Objectives (24)
Reports (21)
Assessment and Response Actions (20)
Project Task Organization (4 final version) Distribution List (3) Title and Approval Page (1)Table of Contents (2)
Problem Identification BackgroundEPA Element 5
A Problem Definition ldquoThis section describes the environmental problem question or threat to be addressed explains why this work needs to be done and provides a framework for determining the project purpose the use of the data and the project objectivesrdquo
B Background
ldquoThis is an opportunity to describe the history of the project (or environmental problem) relevant previous studies and how this project fills in a data gap (including from existing data) or complements existing informationrdquo
- Citizen Science Quality Assurance and Documentation EPA 2019
Problem Identification BackgroundEPA Element 5
From MA VM QAPP Guidebook
bull Describe your organizationbull Describe your watershed and waters of interestbull Describe the current status of your waters of interestbull State water quality issues of concernbull Describe information needed to address the concernbull List your monitoring questionsbull What are your monitoring purposesbull List intended users uses of information you collect
5 Background of DRWA Volunteer Bacteria Monitoring Program Deerfield River Watershed Association QAPP 2019
The Deerfield River Watershed encompasses approximately 665 square miles Thehellip River is widely regarded as one of the coldest and cleanest rivers in Massachusetts and attracts many sport-fishermen and whitewater enthusiasts However nonpoint source pollution has degraded segments hellip and poses a threat to other tributaries The DRWA has intermittently monitored the water quality hellip since 1990 to document the current quality of the watershed
hellip DRWA started monitoring fecal coliform bacteria at popular recreation sites to provide data in the intervening years [between DEP monitoring schedules] hellip In 1999 DRWA monitored bacteria above and below hellip WWTPs and at a few recreational siteshellip high counts of bacteria were recorded from at least one hellip site exceeding the Massachusetts Surface Water Quality Standards Class B standards This finding prompted a focused examination of bacteria levels in 2003 However concerns of impairment hellip persist According to the Massachusetts Year 2016 Draft Integrated List of Waters the lower nineteen miles of the mainstem and four important tributaries of the Deerfield are assigned to Category 5 Waters for pathogenshellip
5 Background of DRWA Volunteer Bacteria Monitoring Program Deerfield River Watershed Association QAPP 2019 ndash continued
DRWA resumed monitoring of bacteria in the Deerfield watershed in 2017 hellipthe Connecticut River Conservancy (CRC) provides [lab services] Through [this] support DRWA has been able to test bacteria in hellipand include testing parameters besides bacteria in Massachusetts In 2019 CRC received the bacteria grant from MA DEP that will help cover the costs of testing bacteria in the Massachusetts portion of the watershed
Problem StatementhellipMassDEP and hellip VT DEC have identified several potential sources of nonpoint pollution in the Deerfield Watershed including failing septic systems stormwater runoff road runoff from paved and unpaved roads hellipand agricultural activities in close proximity to rivers and streams
In Massachusetts approximately nineteen (19) river miles hellip have been assigned to Category 5 (waters that require a hellip (TMDL calculation)hellipother river segments remained unassessed for recreation
In Vermont there is a bacteria TMDL Monitoring over the past 2 years suggests that the TMDL area may need to be extended Vermont is on a 5-year watershed basin planning cycle The Deerfield Watershed is currently undergoing its basin planning process
Problem Identification BackgroundNeponset RWA QAPP 2019
A5-1 Watershed DescriptionThe Neponset River Watershed covers 117 square mileshellip
A5-2 Organizational BackgroundThe Neponset River Watershed Association (NepRWA) is hellip
A5-3 Sources of Impairment and Pollutants of ConcernRemaining water quality problems in the watershed include hellipCurrent pollutants of concern in the Neponset Watershed includehellip
A5-4 Past Sampling EffortsThe Massachusetts DEP completed a very comprehensive water quality assessment hellip The CWMN program has been working to fill water quality information gaps and facilitate water quality improvement for more than 20 yearshellip
Sources of Information About Massachusetts Waters
1 Mass Water Quality Standards httpwwwmassgoveeaagenciesmassdepwaterregulations314-cmr-4-00-mass-surface-water-quality-standardshtml
2 Massachusetts Water Quality Assessments ldquoLook here for reports on the condition of watersheds in Massachusettsrdquo httpwwwmassgoveeaagenciesmassdepwaterwatershedswater-quality-assessmentshtml3
3 Integrated List of Waters httpswwwmassgovlistsintegrated-lists-of-waters-related-reports4 TMDLs httpwwwmassgoveeaagenciesmassdepwaterwatershedstotal-maximum-daily-loads-tmdlshtml25 Older Water Quality Assessment Reports httpwwwmassgoveeaagenciesmassdepwaterwatershedswater-
quality-assessmentshtml3
Deerfield River Basin
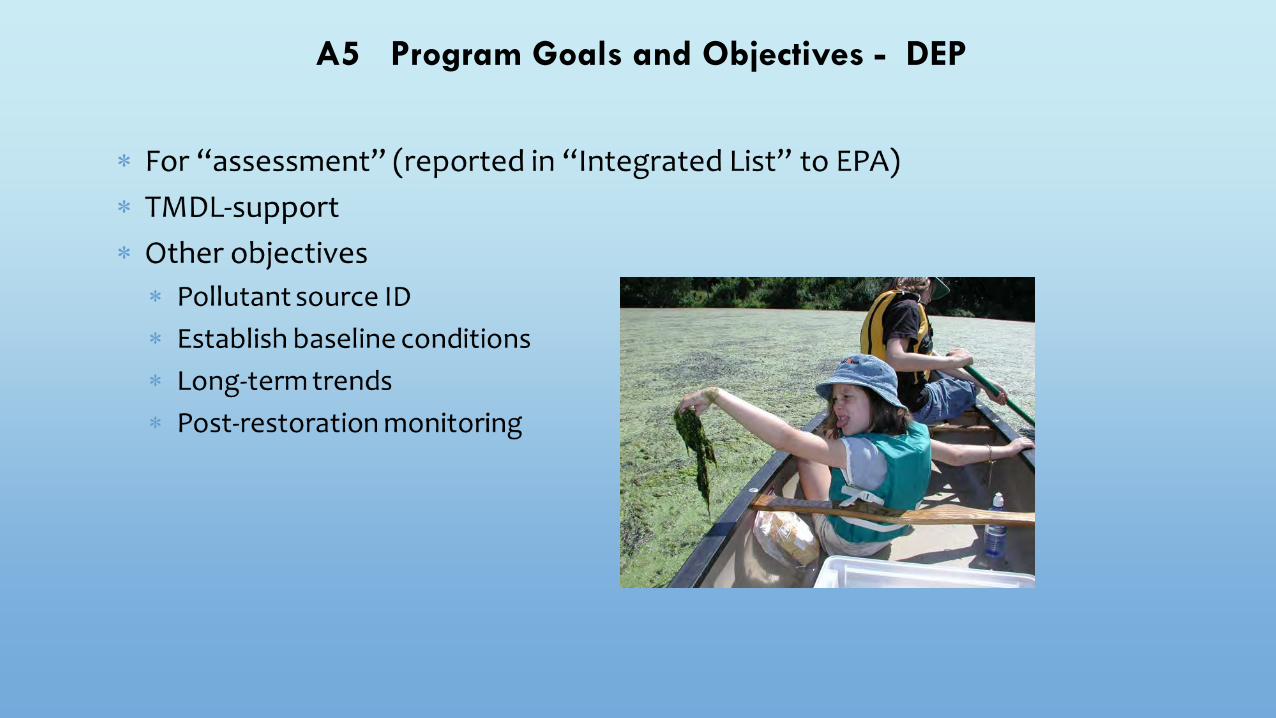
Program Goals and Objectives Part 2 of EPA Element 5
A5 Program Goals and Objectives - DEP
Project Purpose- DRWA
Objectives of Project
The principal objectives of projects under this QAPP are to 1) provide a perspective on the range of water quality conditions for recreation in the Deerfield River watershed across Vermont and Massachusetts 2) describe water quality conditions of individual tributaries and the mainstem 3) establish a database for use in documenting future changes in water quality and 4) educate and involve residents in waterbody protection
Toward those objectives DRWA will monitor 29 sites for E coli sampling during the recreation season June through September This project includes conducting a water quality monitoring program for E coli in the Vermont and the Massachusetts portions of the watershed where pathogens have been detected during previous sampling efforts undertaken by MassDEP and VT DEC
Project Purpose- DRWA
B Intended Uses of Data
The data generated under this QAPP will serve the following uses
- Use in the MassDEP CWA Integrated Report
- Document the presence and severity of bacteria as pathogen indicators
- Educate school children and local communities about water quality and any problems and improvements
- Evaluate the effectiveness of restoration projects and other management activities
A56 Program Goals and Objectives ndash NepRWANepRWArsquos CWMN program seeks to accomplish the following during the period 2019-2021
- Regularly collect in-stream water quality samples at a handful of ldquoindicator sitesrdquo that represent overall water quality conditions and trends
- Regularly collect in-stream water quality samples at a larger number of ldquosubwatershed sitesrdquo that target known or suspected problem areas
- Conduct ldquofollow uprdquo and ldquospecial studyrdquo investigations and sampling as needed to confirm and further specify suspected problem or opportunity areas identified through the regular sampling program
- hellip
- Collect in-stream samples during rainfall events
- Distribute results promptly to municipal officials state and federal regulators and the general public as a means to increase understanding of water pollution issues
- Using fully sterile methods collect data needed to help implement recommendations of the Total Maximum Daily Load (TMDL) for bacteria
- Generate data to help enhance the effectiveness of municipal state federal and private efforts to improve water quality
Monitoring Objectives amp DWM-DEP Data Levels
EducationalStewardship-levelbull Objective is to engage volunteers in monitoring to develop better understanding
of the importance of water resources and to encourage their fellow citizens to take an active role in the preservation and restoration of their local water bodies and watersheds
Screening-level bull Typically used to direct future sampling efforts and as supporting evidence only
RegulatoryAssessment-levelbull Directly usable for 305(b) and 303(d) decision-making bull Scientifically sound and legally-defensible bull Contingent on review and approval these data can help determine if a water body
is meeting water quality standards or is impaired
Monitoring Objectives amp DWM-DEP Data Levels
Project Task Description ndash EPA Element 6
In general terms describe bull The work your staffvolunteers will perform bull Where it will take placebull What kinds of samples will be takenbull What kinds of conditions will be measuredbull How you will evaluate results
DRWA Project PurposeTask Description
C Brief Description of Project- There will be a training and orientation meeting held in March organized by VTDEC but
held at VAEL - Volunteers will be trained annually prior to the start of the sampling season- River water samples will be collected at 29 sites 6 times between June and September- The project will employ the Colilert System developed by IDEXX laboratories Inc to assay
E coli bacteria Samples will be analyzed at the CRC laboratory- Data will be analyzed and reviewed for quality assurance summarized and interpreted on
an annual basis - Data that meet project quality objectives will be submitted to MassDEP and entered in the
VTDECrsquos Water Quality data management system as well as the EPArsquos national water quality data storage system known as STORET
- Information will be presented to the local community in a suitable format be it a press release public meeting or another event
- A report will be prepared and shared with the distribution list in this QAPP and published on the DRWA website (deerfieldriverorg)
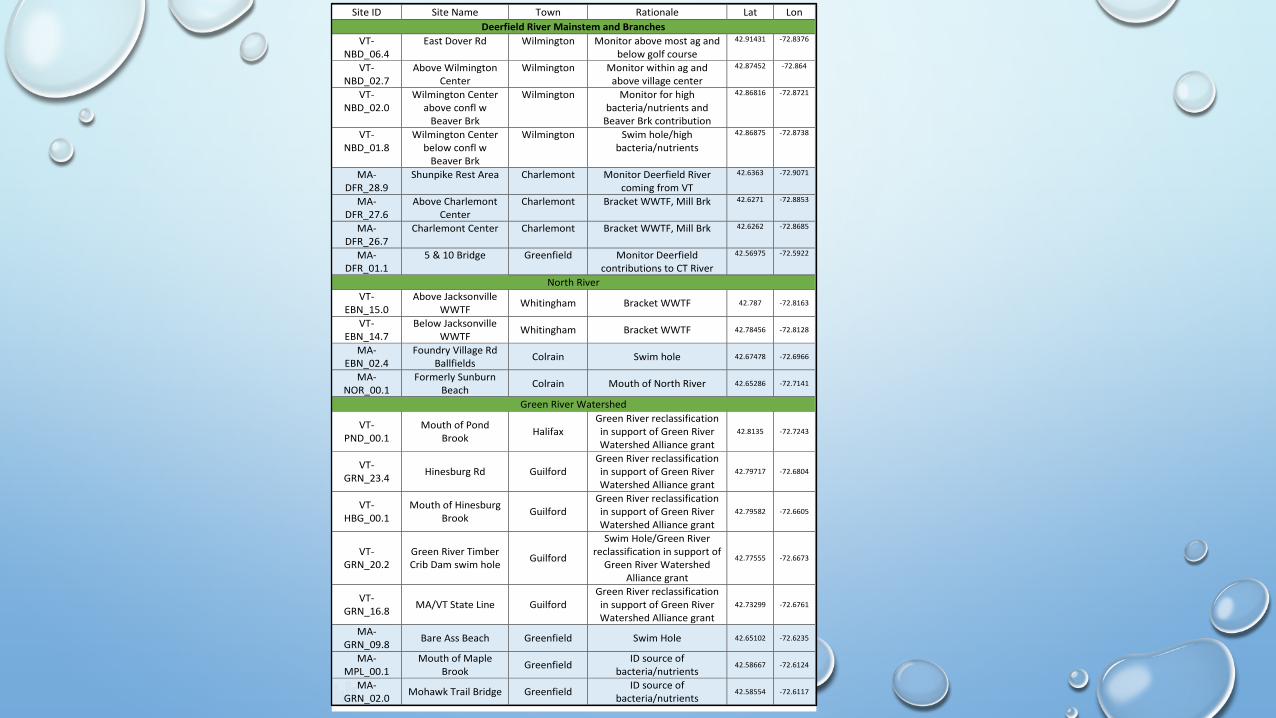
Site ID Site Name Town Rationale Lat Lon Deerfield River Mainstem and Branches
VT-NBD_064
East Dover Rd Wilmington Monitor above most ag and below golf course
4291431 -728376
VT-NBD_027
Above Wilmington Center
Wilmington Monitor within ag and above village center
4287452 -72864
VT-NBD_020
Wilmington Center above confl w
Beaver Brk
Wilmington Monitor for high bacterianutrients and
Beaver Brk contribution
4286816 -728721
VT-NBD_018
Wilmington Center below confl w
Beaver Brk
Wilmington Swim holehigh bacterianutrients
4286875 -728738
MA-DFR_289
Shunpike Rest Area Charlemont Monitor Deerfield River coming from VT
426363 -729071
MA-DFR_276
Above Charlemont Center
Charlemont Bracket WWTF Mill Brk 426271 -728853
MA-DFR_267
Charlemont Center Charlemont Bracket WWTF Mill Brk 426262 -728685
MA-DFR_011
5 amp 10 Bridge Greenfield Monitor Deerfield contributions to CT River
PrecisionThe degree of agreement among repeated measurements of an indicator on separate samples collected as close as possible in time and place
It does not mean that the sample actually reflects the ldquotruerdquo value but rather that your sampling and analysis are giving consistent results under similar conditions
AccuracyAccuracy or Bias is a measure of confidence that describes
how close a measurement is to its ldquotruerdquo value
Parameter Reporting Limit
Accuracy ( Recovery)
Field Precision (RPD)
Expected Range
E coli 1 MPN 100ml
Blanks and negatives show no colonies positives show colonies
30 of log10 transformed MPN
0-2420 MPN
These objectives will be measured as follows
Field Specific Quality Controls
10 of samples collected (3 per event in 2019) will be field blanks Sterile water poured into sterile sample bottle in the field These must register lt1 for total coliform and E coli
10 of samples collected (3 per event in 2019) will be field duplicates A second sample will be collected at the same location by the volunteer These will have a Relative Percent Difference of le 30 for log transformed e values
Laboratory Sample Batch-Specific Quality Control Samples With each new batch of samples run CRC will perform the following QC sample analysis
1 Lab Blank - Sterile water1 Positive Culture Control -sterile buffer dilution water inoculated with E coli (ie total coliform amp E coli positive)1 Negative culture Control -sterile buffer dilution water inoculated with non-fluorescent Pseudomonas sp (ie
total coliform amp E coli negative) 1 Lab Duplicate ndash 250 mL sample split into 2 100 mL samples in the lab
DRWA Data Precision and Accuracy
REPRESENTATIVENESS
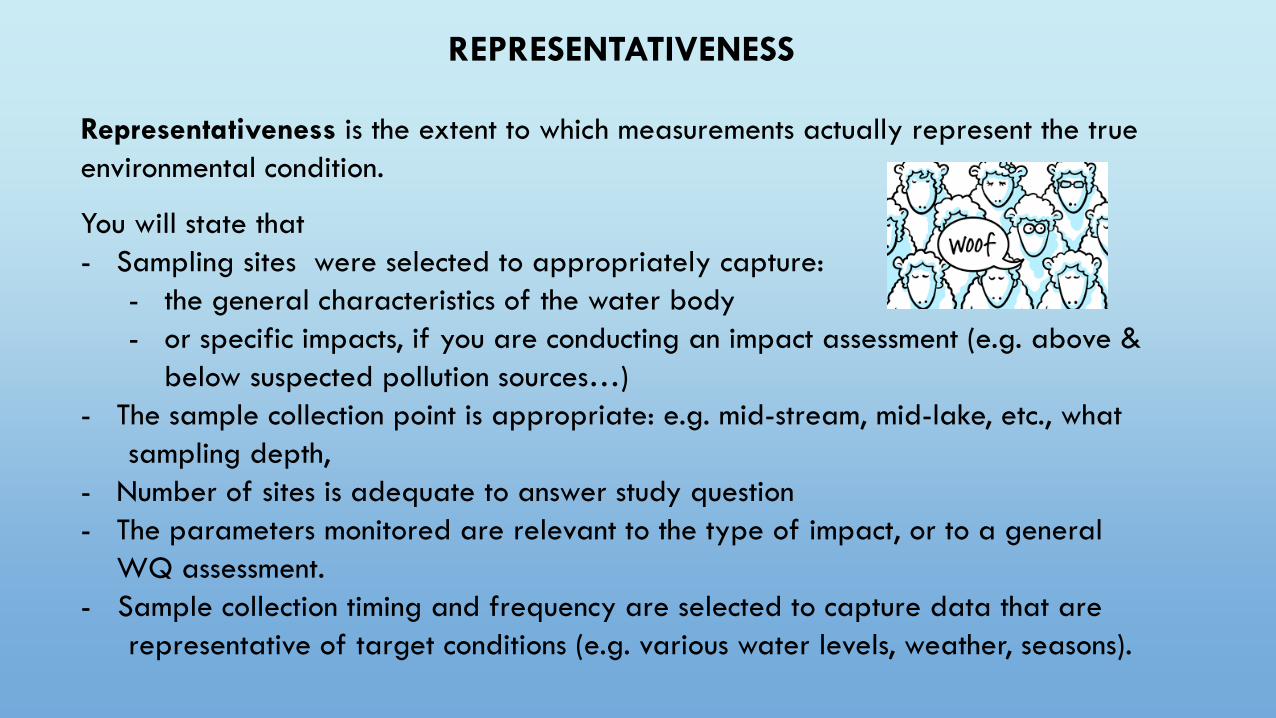
Representativeness is the extent to which measurements actually represent the true environmental condition
You will state that- Sampling sites were selected to appropriately capture
- the general characteristics of the water body- or specific impacts if you are conducting an impact assessment (eg above amp
below suspected pollution sourceshellip)- The sample collection point is appropriate eg mid-stream mid-lake etc what
sampling depth - Number of sites is adequate to answer study question- The parameters monitored are relevant to the type of impact or to a general
WQ assessment- Sample collection timing and frequency are selected to capture data that are
representative of target conditions (eg various water levels weather seasons)
MassDEP - RECOMMENDED MINIMUM SAMPLE NUMBER FREQUENCY AND TIMING FOR EXAMPLE PARAMETERS
Parameter
Streams Lakes
Min Sample Number and Frequency
Sampling Period Min Sample Number and Frequency
Sampling Period
DO (discrete) 5 results pre-dawn June - September 3 results (epilimnetic) June - September
DO (continuous) 3o days June - September 3o days June - September
pH 5 results June - September 3 results (epilimnetic) June - September
Temperature (discrete) 5 results afternoon June - September 3 results (epilimnetic) June - September
Temperature (continuous) 3o days June - September 3o days June - September
Bacteria (eg E coli) 3-5 results (in 30-90 days) April 1-October 15 3-5 results (in 30-90 days) April 1-October 15
Nutrients (inc chl a for lakes) 5 results June- September 3 results June - September
Secchi depth --- --- 3 results June - September
Chloride 3 results 4 day period (yr-round) --- ---
ldquoCleanrdquo metals 3 results 4 day period (summer) --- ---
Misc toxics emerging contam 3 results 30 day period (summer) 3 results (epilimnetic) 30 day period (summer)
Fish community 1 survey April 1-October 15 1 survey April 1-October 15
Fish tissue contaminants (eg Hg PCBs pesticides)
1 survey Any 1 survey Any
Benthic invertebrates (RBP3) 1 survey July ndash October --- ---
Weed surveys 1 survey June- September 1 survey June- September
Aesthetics 1 survey April 1-October 15 1 survey April 1-October 15
30 days (bathing) 90 days (non-bathing) ldquoworst-caserdquo typ July-Aug
REPRESENTATIVENESS
DRWAB Data RepresentativenessSamples collected at locations and depths described in this QAPP will reflect conditions of individual water bodies and tributaries in Vermont and Massachusetts To ensure representativeness all samples will be collected preserved and analyzed according to the procedures in this QAPP and within the specified holding times
NepRWAA7-5 Data RepresentativenessSampling points will be chosen to represent the water quality within the applicable geographic area of interest Staff experienced and knowledgeable in the factors affecting water quality will choose sample points that will be representative of conditions within the area of concern
COMPARABILITY
Comparability is the degree to which data can be compared directly to similar studies There are two things to consider future studies someone might undertake and past studies you (or others) will want to compare your data with
State that you will use and document standardized - sampling amp analytical methods and units of reporting- sampling sites times and dates - sample storage and transfer
Comparability
Deerfield River Watershed Association
C Data ComparabilityAll samples for each specific parameter will be collected and analyzed using the respective procedures described in this QAPP to ensure that comparisons between different sample sites sample dates depths and projects can be appropriately made Procedures are unchanged from previous years
Neponset River Watershed Association
A7-6 ComparabilityComparability is ensured by the utilization of established sampling and monitoring protocols from Massachusetts DEP MWRA Massachusetts Water Watch Partnership the Boston Water and Sewer Commission and NepRWA and by the use of standard test methods and procedures as outlined in Appendices 6 7 and 8
Completeness
Completeness is an estimate of the amount of data you will need to answer your study question Usually expressed as a of originally planned sample events after missing sample events and data no meeting DQOs are subtracted from the planned number
DRWA
D Data CompletenessAt least 80 of the anticipated number of samples will be collected at each site analyzed and determined to meet data quality objectives for the project to be considered successful A report detailing the number of anticipated samples number of valid results and percent completion (number of valid samplesnumber of anticipated samples) will be produced
NepRWAA7-8 CompletenessIn order to obtain the best picture of the watershed NepRWA expects 90 of the routine sampling and follow up sampling samples to be collected and analyzed during each scheduled sampling event In the routine sampling program uncertainties such as weather volunteer scheduling and illness sometimes result in unavoidable omissions but every effort is made to assign backup samplers when possible
Sampling Process Design - EPA Element 10From MassWWP QAPP Guide
Purpose To describe in greater detail the design of the sampling part of your monitoring program
In Section 6 you briefly outlined the sample process design In this section you should elaborate on the rationales for those choices When you complete this section you should revisit Section 6 and revise as necessary The two sections should be in agreement
What To Include bull Indicators or measures bull Types of samplesbull Sampling frequency bull Sampling period bull How you will select sample sites and identify them over timebull Site safety plans
MADEP - RECOMMENDED MINIMUM SAMPLE NUMBER FREQUENCY AND TIMING FOR EXAMPLE PARAMETERS
Parameter
Streams Lakes
Min Sample Number and Frequency
Sampling Period Min Sample Number and Frequency
Sampling Period
DO (discrete) 5 results pre-dawn June - September 3 results (epilimnetic) June - September
DO (continuous) 3o days June - September 3o days June - September
pH 5 results June - September 3 results (epilimnetic) June - September
Temperature (discrete) 5 results afternoon June - September 3 results (epilimnetic) June - September
Temperature (continuous) 3o days June - September 3o days June - September
Bacteria (eg E coli) 3-5 results (in 30-90 days) April 1-October 15 3-5 results (in 30-90 days) April 1-October 15
Nutrients (inc chl a for lakes) 5 results June- September 3 results June - September
Secchi depth --- --- 3 results June - September
Chloride 3 results 4 day period (yr-round) --- ---
ldquoCleanrdquo metals 3 results 4 day period (summer) --- ---
Misc toxics emerging contam 3 results 30 day period (summer) 3 results (epilimnetic) 30 day period (summer)
Fish community 1 survey April 1-October 15 1 survey April 1-October 15
Fish tissue contaminants (eg Hg PCBs pesticides)
1 survey Any 1 survey Any
Benthic invertebrates (RBP3) 1 survey July ndash October --- ---
Weed surveys 1 survey June- September 1 survey June- September
Aesthetics 1 survey April 1-October 15 1 survey April 1-October 15
30 days (bathing) 90 days (non-bathing) ldquoworst-caserdquo typ July-Aug
Deerfield River Watershed Association
10 Sampling Process Design
Sampling sites were selected to represent locations that receive heavy human use from swimmers boaters anglers and other contact recreational users
Samples will be collected bi-weekly from late June through early September (prime recreation period) between 10 AM and 1 PM Samplers will first fill out their field data sheet They will then collect a water sample away from the edge of the stream near the center of the stream (centroid of flow) and just below the surface following the MWWP protocol (available in the Appendix)
Samplers will place their samples immediately in a cooler with ice or frozen ice packs making sure the temperature in the cooler is at 4degC or lower Each sample bottle will be placed in an individual clean Ziploc bag to avoid cross contamination
Neponset River Watershed Association
B1 Sampling Process Design
The CWMN program is designed to develop and maintain a record of general water qualitythroughout the watershed Project goals include both evaluation of long-term changes over time across the watershed as a whole and the identification of pollution hotspots at a low order subwatershed scale
Routine sampling activities consist of collecting in-stream samples As discussed above routine sampling sites are divided among ldquoindicatorrdquo sites and ldquosubwatershed sitesrdquo in order to meet the dual objectives of the program Indicator sites are selected to be representative of overall water quality and are relatively unchanging over time to allow comparison to past and future investigations Sites have generally been selected at the downstream ends or key segmentation points of major subwatersheds and at or near locations where there is a longstanding data record
Neponset River Watershed Association
B1 Sampling Process Design ndash continued
Subwatershed sites are selected to provide higher spatial resolution along individual streams in an effort to bracket pollution sources and facilitate their identification and remediation Subwatershed sites make up roughly 60 of the overall number of sites and are more likely to change from year to year Subwatershed sites may be rotated through different watersheds over the course of several sampling seasons to provide detailed data on different subwatersheds over a period of years Specific sites are selected by the project manager on the basis of known or suspected problems or opportunities or to fill in a lack of detailed data in a specific area
Neponset River Watershed Association
B1 Sampling Process Design ndash continued
In addition to the routine sampling activities CWMN also encompasses follow up and special study sampling activities These are generally ldquoone-timerdquo investigations intended to zero in on pollution sources in a known or suspected problem areahellipSpecific sampling stations may be planned in advance or may be chosen opportunistically by samplers while in the field
The mix of parameters sampled at each site depends on its status as an indicator subwatershed or follow up station the relative location of the station in the watershed and the specific pollutant(s) of concern at that specific location Indicator sites are tested for bacteria nutrients ammonia and field measured parametershellip Subwatershed sites are generally tested for bacteria total phosphorus and field measured parameters At some subwatershed sites hellip Follow up sampling stations will generally be tested for a very narrow set of parameters based on the specific pollutant of concern A listing of current routine sampling stations and the parameters sampled is provided in the Appendix 1e
Sampling Methods Requirements - EPA Element 11
This section describes your field measurementsample collection methods It can be stated in table form with narrative descriptions if you choose
Includebull What parameters are being sampledbull Sampling containersdevices sample preservation steps Maximum holding timebull Amount of sample to be collectedbull Summarize steps taken by field samplersbull Reference to the method followed (cite specific SOPS include in appendices)bull Can also include sampling considerations (eg time of day steps taken to avoid stirring up
sediments sample collection depth etc) These will be detailed in SOPs
Deerfield River Watershed Association
ParameterMeasure Container Field Rinse Preservation Hold Time E coli 120 mL IDEXX
Cool to lt4degC 6 hours to lab 8 hours to processing
B2 Sampling Methods
B2-2 Visual ObservationsB2-3 Fecal Coliform E coli and EnterococcusB2-5 NutrientsB2-6 Specific Conductance and SalinityB2-7 TemperatureB2-8 pH B2-9 Dissolved OxygenB2-10 SurfactantsB2-11 Depth and FlowB2-12 Optical BrightenersB2-13 Qualitative Ammonia Nitrogen
Neponset River Watershed Association
Sample Handling and Custody Requirements - EPA Element 12
Demonstrate that your sampling handling and storage techniques will retainsafeguard the integrity of your samples and data records
12 Sample Handling and Custody Procedures
Samples will be collected between 7 AM and 10 AM on sampling days The samples will be kept on ice inside a cooler during transport Wilmington VT area samples will be picked up by the monitoring assistant in the Main Street parking lots or other agreed upon meeting location by 9 AM Green River VT samples will be picked up by the transporting volunteer at the Green River covered bridge or other agreed upon meeting location by 930 AM The remaining samples will be delivered directly to the CRC water quality lab by 10 AM Any exchange of possession in the samples will be documented on the Chain of Custody (CoC) form which will be completed and signed by the Lab Analyst upon receipt at the lab The CoC form will be checked by the program coordinator See Appendix for the CoC
Deerfield River Watershed Association
Analytical Methods Requirements - EPA Element 13
Deerfield River Watershed Association
13 Analytical Methods Requirements
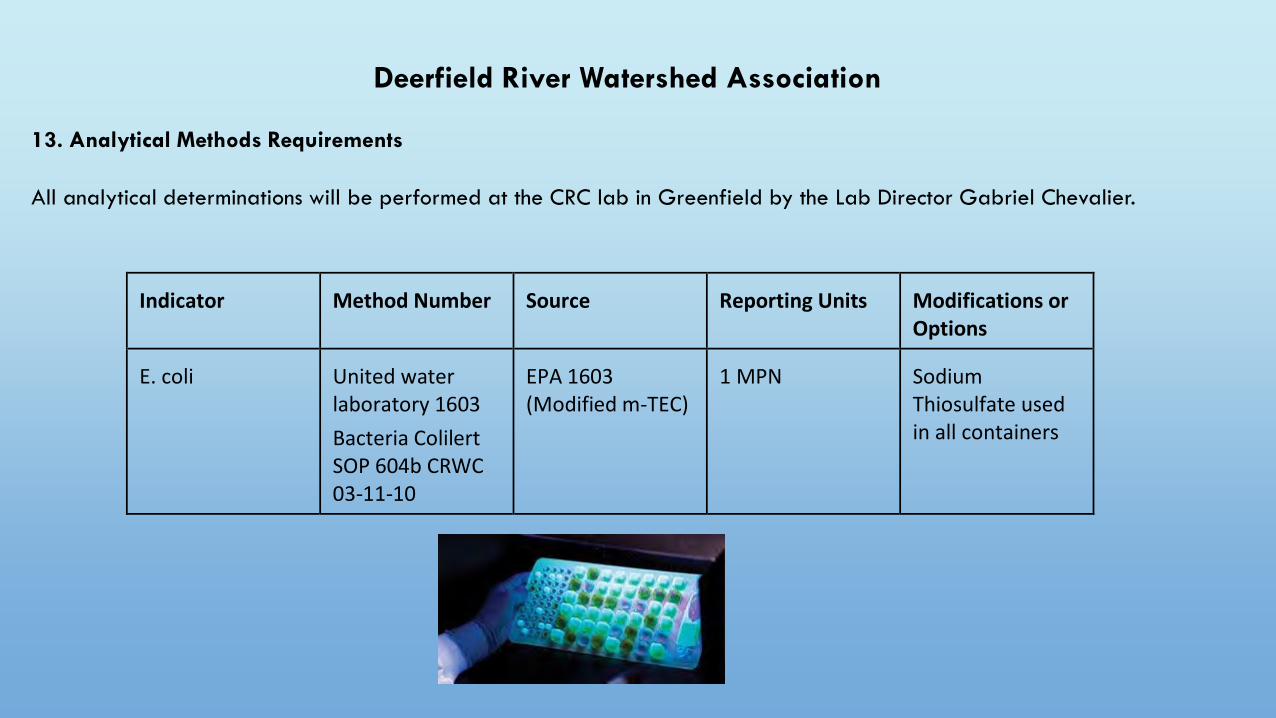
All analytical determinations will be performed at the CRC lab in Greenfield by the Lab Director Gabriel Chevalier
Indicator
Method Number
Source
Reporting Units
Modifications or Options
E coli
United water laboratory 1603 Bacteria Colilert SOP 604b CRWC 03-11-10
EPA 1603 (Modified m-TEC)
1 MPN
Sodium Thiosulfate used in all containers
Neponset River Watershed Association
Massachusetts Volunteer Monitorrsquos Guide to QAPP DevelopmentPAGE 61
Here are some things to consider in choosing a method Scientific Considerations Does it meet your data quality objectives
How accurate is it How precise (reproducible) is it What is its detection limit
Will it measure the indicator in the range that you need What lab facilities are required What equipment is required Does it yield samples that are representative Is it comparable to methods used by agencies collecting similar information
Practical and Program Considerations bull Do you have the human and financial resources to do it bull How difficult is it bull How time-consuming is it bull Will it produce data useful to the target audience
Quality Control ndash EPA Element 14
This section documents that the specific quality control measures you will take will allow you to determine whether you meet your data quality objectives
What To Include Section 7 stated your DQOs Here you describe how you are going to meet them
For each indicator include the following information
bull Accuracy Precision checks list what checks you will perform
bull List the of your samples upon which you will perform quality checks that will represent the quality of all your samples
Quality Control
Accuracy checks
There are a variety of ways to check the accuracy of your sampling and analysis
Checks can be done internally (done totally within your project lab) or externally (done with the assistance of an independent lab)
Known Samples This is an internal check that compares your results against another analyst or a ldquoknownrdquo An example of a known is a quality assurance sample that UMass WRRC sends to VM groups for pH DO or alkalinity ndash with the expected value communicated when sample is sent
Proficiency Testing (Unknown) Samples In some cases there are programs that provide proficiency testing samples for laboratory performance evaluation the concentrations of which are known to the auditor but not to the lab being tested This is relatively common for most water chemistry indicators An example of an unknown would when WRRC sends a quality assurance sample without communicating the expected value in advance
Quality Control
Accuracy checks - continued
Blank and Positive Plates Bacteriological samples should be checked using the blank and positive plate procedure The blank plate uses the rinse water media and equipment in the analysis to determine if there is contamination in the laboratory materials The result should be 0 The positive plate procedure uses a sample known to contain bacteria (eg waste- water treatment plant influent) to determine if a procedural error in the lab causes inhibition of bacterial growth Results should be rdquoToo Numerous To Countrdquo Each batch of samples should include at least one blank and one positive check sample This is an internal check
Spiked Samples Spikes are additions of a known amount of the indicator with the expectation that subsequent analysis will measure exactly that much increase over the un- spiked sample This procedure is described in Section 1020 B of Standard Methods This is an internal check
Voucher and Reference Collections For macroinvertebrates and aquatic plants maintenance of a voucher andor a working reference collection is recommended A voucher collection is a preserved collection of the type specimens ie an example of each of the individual taxa that you have given a name It should be maintained in archival condition by a trained curator typically found at a university A reference collection is an exact duplicate of the voucher collection but is the one that you will regularly use as a reference when identifying new specimens Both voucher and reference collections should be verified by an expert This is an external check Alternatively have an expert review IDs made by volunteers of at least 10 of specimens collected 90 accuracy is recommended
Quality Control
Precision Checks
Precision checks are primarily accomplished through replicate sampling amp analysis in the field and lab
Field Replication Replication can be done by the same field collectors but some replication by other collectors is good eg a pair of field collectors swapping roles or have different team collect the replicate This is an internal check
Lab Replication Additional replication should occur in the lab Lab replication is done by dividing a well-mixed sample into two or more aliquots and conducting analysis on each aliquot This is an internal check
Split Samples Split samples (a sample that is split into two sub-samples) can be done in the field or the lab
Relative Percent Difference
A measure of precision used for duplicate sample results It is calculated by dividing the difference between the two results by the mean of the two results expressed as a percentage Used when sample number equals two
eg ((98-92) 100) ((98+92))2 = 63
Deerfield River Watershed Association
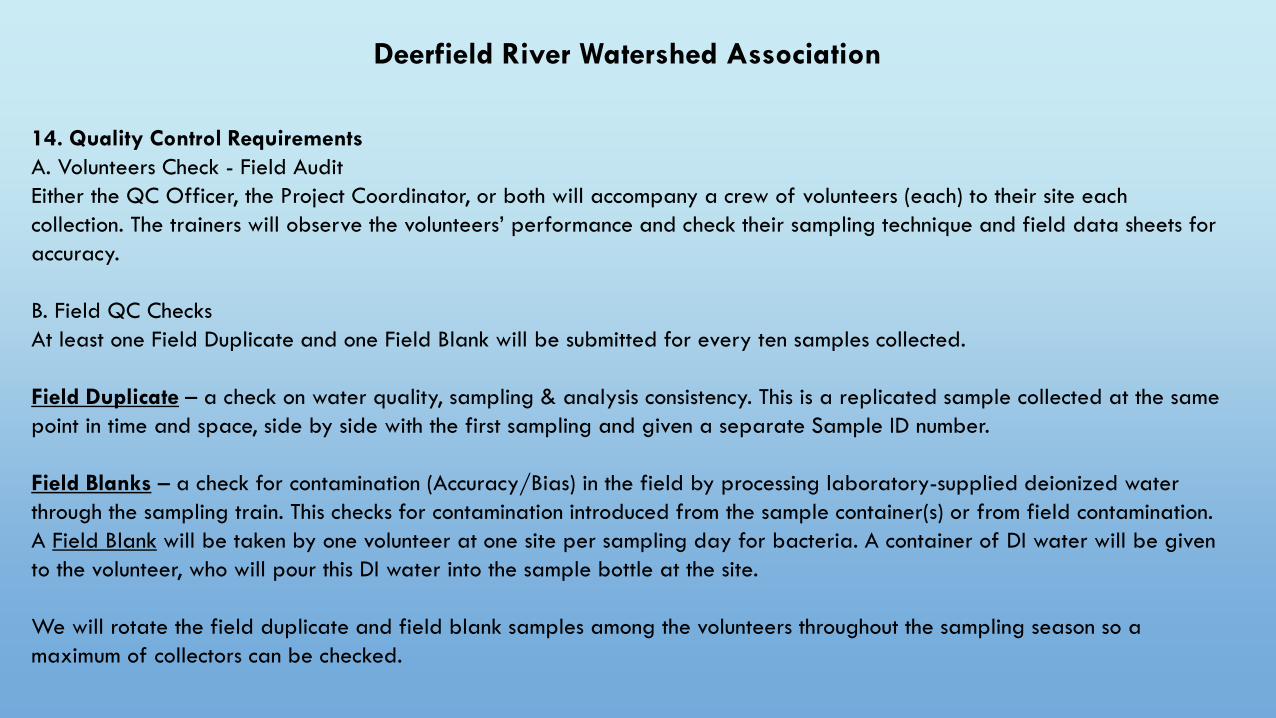
14 Quality Control RequirementsA Volunteers Check - Field AuditEither the QC Officer the Project Coordinator or both will accompany a crew of volunteers (each) to their site each collection The trainers will observe the volunteersrsquo performance and check their sampling technique and field data sheets for accuracy
B Field QC ChecksAt least one Field Duplicate and one Field Blank will be submitted for every ten samples collected
Field Duplicate ndash a check on water quality sampling amp analysis consistency This is a replicated sample collected at the same point in time and space side by side with the first sampling and given a separate Sample ID number
Field Blanks ndash a check for contamination (AccuracyBias) in the field by processing laboratory-supplied deionized water through the sampling train This checks for contamination introduced from the sample container(s) or from field contamination A Field Blank will be taken by one volunteer at one site per sampling day for bacteria A container of DI water will be given to the volunteer who will pour this DI water into the sample bottle at the site
We will rotate the field duplicate and field blank samples among the volunteers throughout the sampling season so a maximum of collectors can be checked
Deerfield River Watershed Association
14 Quality Control Requirements ndash continued
C Laboratory QC ChecksA Lab Duplicate will be analyzed each sampling day The lab will split a randomly chosen sample and analyze both subsamples
The lab will run a Lab Blank and a Positive Sample for bacteria each collection (see section 7)
D Data Analysis QC ChecksRiver data and QC data will be reviewed by the QC Officer as soon as they come in from the lab after each collection QC data will be compared to the quality objectives (eg blanks should have zero colonies sample duplicates should be within 3 standard deviations of the mean positives should show bacterial growth etc) River data will be reviewed as well to ensurethat no field or lab contamination has occurred (data will be compared to those of other sites and of previous collections)
Bacteria computations will be checked and validated If discrepancies are found the Lab Director will be called to resolve the discrepancy and corrections will be made by the QC Officer
Field data sheets will be also reviewed the day of collection by the Project Coordinator and later by the QC Officer to ensure that samples were taken at the right times and that all the required information has been filled out The Project Coordinator or collectors will be called if omissions or errors are detected If needed corrections will be made (signed anddated) on the field sheet by the QC Officer
Neponset River Watershed Association
PRECISION DQOS DEALING WITH LOW-LEVEL CONCENTRATIONS
Source Analyte Units PrecisionMassDEP WPP Monitoring QAPP
Training Requirements Certification ndash EPA Element 8
In Narrative or Table Format
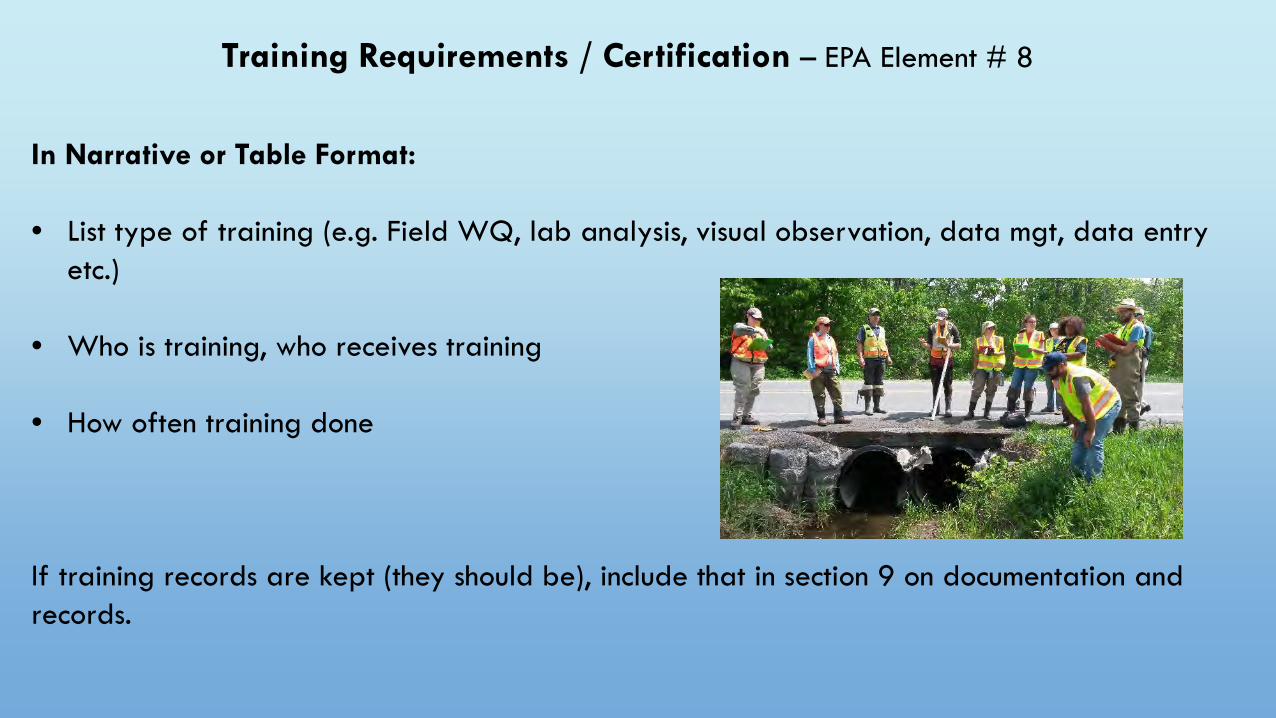
bull List type of training (eg Field WQ lab analysis visual observation data mgt data entry etc)
bull Who is training who receives training
bull How often training done
If training records are kept (they should be) include that in section 9 on documentation and records
Neponset River Watershed Association
A8 Training - ExcerptTo ensure the high quality and usability of the data that is generated by the CWMN program all participants receive training appropriate to the tasks for which they will be responsible NepRWA staff that are involved in the program are professionals with extensive training in water quality chemistry biology and field sampling NepRWA has established a program of training for volunteers that includes initial training follow-up and refresher classes These classes are given by NepRWA staff that are qualified not only in the technical matter covered but in training and education
The initial training for volunteer monitors is primarily instruction and demonstration by the trainer with repetition by the volunteer This training includes an overview of the entire project and detailed instruction in sampling procedures All monitors receive and review a copy of NepRWArsquos Water Monitoring and Sampling Manual (see Appendix 3a)
After their initial training all volunteers participate in a mandatory annual group andor individual training session These sessions are designed to update the volunteers on changes in the program further train them in equipment calibration and field-testing procedures and evaluate each volunteerrsquos performancehellip
InstrumentEquipment Testing Inspection and Maintenance Requirements ndash EPA Element 15
Instrument Calibration and Frequency ndash EPA Element 16
InspectionAcceptance Requirements for Supplies ndash EPA Element 17
DOCUMENTATION AND RECORDS ndash EPA ELEMENT 9
Neponset River Watershed AssociationA9 Documents and RecordsA9-1 Data SheetsField data sheets include information about the site location (NepRWA ID number) which specific equipment was used to make measurements (thermometer number) the sampling method used (direct fill pole or Bridge Buddy) and equipment calibration results The field data sheets are also used to record temperature velocity depth color odor and turbidity information (Appendix 4e)helliphellip See Appendix 4 for copies of the various data sheets used in the CWMN program
A9-2 Chain of Custody FormsA9-3 Sample LabelingA9-4 Equipment Custody FormA9-5 Training and Evaluation Form
Data Acquisition Requirements - EPA Element 18
Purpose To ensure that any data you use but donrsquot collect yourself has a known data quality and is consistent with your data quality objectives that others can access these data and that your use of the data is appropriate
Describe any external data you use such as GPS coordinates for site locations weather station rainfall amounts etc
Include bull The title of the document or name of the informationbull Where you obtained it and where others may find itbull Notes on the quality of the outside information such as uncertainties and caveats
Preamble to Elements 19 through 24
Consider the four separate objectives of these chapters1) Producing a good data set - 19 covers the normal data mgt routines you do to prevent data mistakes in the first place- 22 amp23 describe how you review the resulting data sets - how you find and correct
missing or erroneous data - 19 22 and 23 should produce as complete amp accurate a data set as possible 2) Ensuring that any use you make of your data is justified In 24 you decide how usable your data are Review the final data set that the above efforts have produced Compare it with your DQOs to determine whether you have to discard or qualify any data what conclusions you can draw from your data or what changes you might need to make in your DQOs3) Improve overall project performance 20 deals with how well volunteers laboratories and equipment are operating It looks at function not outcomes Who evaluates the various components of your program when problems are found what corrections are made to make your program run better4) Report your results After yoursquove run these various checks you are ready to release your data In Chapter 21 you describe the reports you will issue
Suggested order bull Data Management (19)bull Data Review Validation and Verification Requirements (22)bull (Data) Validation and Verification Methods (23)
bull Reconciliation with Data Quality Objectives (24)
bull Assessment and Response Actions (20)
bull Reports (21)
EPA Elements 19 ndash 24
bull Data Management (19)bull Assessment and Response Actions (20) bull Reports (21)bull Data Review Validation and Verification Requirements (22)bull (Data) Validation and Verification Methods (23)bull Reconciliation with Data Quality Objectives (24)
Data Management ndash EPA Element 19
Follow the data from the moment itrsquos recorded through every step to final report databaseIntent is to prevent errors or loss of data or be able to correct in timely manner
bull Before each activitystep is conducted well-designed field sheets checklists COC forms data entry software auto-QC calculations out-of-bounds highlights etc
bull During each step sheets filled completely checklist reviewed before leaving site etc
bull Immediately after Computer-entered data compared with field sheets etc
bull Long term preservation Data storage
Neponset River Watershed Association
B9 Data ManagementThe Project Manager is responsible for overseeing all data management activities Refer also to section D below for additional discussion of data review verification and validation practices
B9-1 Raw DataField data sheets are collected with the samples The sheets are turned into the NepRWA office by the site coordinators The forms are then reviewed for illegible answers errors or questionable values and checked for consistency with the COC and bottle labels as described in Appendix 3l Any questions are referred to the volunteer for clarification NepRWA staff makes corrections by crossing out the errors and writing in the correct answer All corrections must be initialed
B9-2 Data Entry and ValidationOnce the information has undergone a preliminary check it is entered into a Filemaker database The software has been customized to the data sheet Fields within the worksheet have been set-up with limits based on expected results This helps to minimize entry errors Entered data is then checked against the data sheets by another volunteer or staff person
B9-3 Data StorageThe original data sheets are filed into an event file and stored in NepRWArsquos permanent files Electronic copies of data are maintained on a secure Filemaker server Data files are kept in perpetuity along with hard copies of volunteer data sheets All electronic data is backed-up daily on to a password-protected hard drive
Data Review Validation and Verificationndash EPA Element 22
(Data) Validation and Verification Methods ndash EPA Element 23
Deerfield River Watershed Association
22 Data Review Validation and Verification ndash Summarized bullet list
All data reviewed by the Project Coordinator and QA Coordinator
Data Analysis QC Checks will includebull Data entry checks by a second personbull Computer entries compared with fieldlab sheetsbull Checks on graphs amp all other data representationsbull Calculation of measures of data quality including completeness
Corrective actionsbull Data entry errors corrected bull Data outside expected range flagged or rejected bull 2nd field sample andor laboratory aliquot taken when possiblebull Data quality problems discussed in draft and final reports
(Data) Validation and Verification Methods ndash EPA Element 23 From Inland QAPP
Validation and Verification Methods will include checks on bull Completion of all fields on data sheets missing data sheetsbull Completeness of sampling runs (eg number of sites visitedsamples taken vs number proposed were all parameters sampledanalyzed)bull Completeness of QC checks (eg number and type of QC checks performed vs numbertype proposed)bull Accuracy and precision compared to data quality objectivesbull Representativeness of samples and resulting data by examining survey metadata for unusual conditions and occurrences that may have impacted the validity of results
Deerfield River Watershed Association ndash Excerpt summarized
23 Validation and Verification Methods
The following simple measures of data quality will be calculated and included in the final report
1) To screen for contamination the average blank concentration hellip will be calculated This average value should be as close as practical to the Reporting Limit listed in Table 4
2) To assess the precision of results the ldquoMean Relative Percent Differencerdquo between field duplicate samples should be calculated The average RPD should be less than or equal to the Estimated Precision listed in Table 4 This simple measure is calculated as follows
RPD formula used hellip
Reconciliation With Data Quality Objectives ndash EPA Element 24MassWWP guide to QAPP development
What to Include bull List who will evaluate your actual data vs your data quality goals bull State how and when this will be done bull Describe the process for determining what to do if goals are not met
Neponset River Watershed Association
D2 Reconciliation with User Requirements - Summarized bulletedbull Following each sampling event and prior to the subsequent event calculations and
determinations for precision completeness and accuracy will be made bull Any corrective action will be implemented noted and initialized by the project manager bull If data quality indicators do not meet the projectrsquos specifications then data may be discarded
may be flagged or re-sampling may occur bull Investigation of problems will take place and corrections will be documented If equipment
failure is found to be the cause calibration and maintenance techniques will be reassessed Field duplicate testing may occur during the next sampling event to ensure confidence in the results
bull Any limitations on the data will be noted bull Any revisions to the project will be submitted to EPA and DEP quality assurance officers for
approval
Assessment and Response Actions - EPA Element 20 From Inland QAPP
Document that the progress and quality of the monitoring program will be continuously assessed to ensure that its objectives are being accomplished
The Monitoring Coordinator will periodically check to see the following bull Monitoring is occurring as planned bull Sufficient written commentary and supporting photographs exist bull Sufficient volunteers are available bull Volunteers have been observed as they sample their sites bull Samplers are collecting in accordance with project schedules bull Data sheets and custody control sheets are being properly completed and signed bull Data are properly interpreted bull Plans for dealing with adverse weather are in place
Assessment and Response Actions - EPA Element 20 From Inland QAPP ndash continued
The Monitoring Coordinator will periodically check to see the following bull Retraining or other corrective action is implemented at the first hint of non compliance with the
QAPP or SOPs bull Labs are adhering to the requirements of their QAPP in terms of work performed accuracy
acceptable holding times timely and understandable results and delivery process bull Data management is being handled properly ie data are entered on a timely basis is
properly backed up is easily accessed and raw data are properly stored in a safe placebull Procedure for developing and reporting the results exists
Assessment and Response Actions - EPA Element 20 From Inland QAPP ndash continued
The Monitoring Coordinator will confer with the QA Officer as necessary to discuss any problems that occur and what corrective actions are needed to maintain program integrity In addition the Monitoring Coordinator and QA Officer will meet at the end of the sampling season to review the draft report and discuss all aspects of the program and identify necessary program modifications for future sampling activities [If the program includes a technical advisory committee the TAC will be included in these discussions] Corrections may include retraining volunteers rewriting sampling instructions replacement of volunteers alteration of sampling schedules sites or methods or other actions deemed necessary All problems discovered and program modifications made will be documented in the final version of the project report If modifications require changes in the Quality Assurance Project Plan these changes will be submitted MassDEP for review
Deerfield River Watershed Association
20 Assessment and Response Actions ndash Summarized bullet list
bull There will be an on-site visit by the Quality Control Officer to observe field sampling and field analysis procedures Generally this will be done near the beginning of the project
bull A written checklist will be used for the assessments maintained by the Project Coordinator and copies will be provided with the data report
bull The Project Coordinator and QC Officer will determine if field work follows the written procedures or if there needs to be corrections by additional training or revising protocols
bull Please refer to Section 22 for additional evaluations and response actions regarding data evaluations
Reports ndash EPA Element 21
Project Task Organization ndash EPA Element 4 Reviewrevise early choices
Distribution List ndash EPA Element 3
Title and Approval Page - EPA Element 1
Table of Contents ndash EPA Element 2
Water quality monitoring quality assurance workshop
Terminology
Study design
QAPP
sampling and analysis plan
standard operating procedures
data quality objectives
Water Quality Monitoring Planning Process
Monitoring program activities
Why do you need (who Gives) a qapp
Slide Number 11
Slide Number 12
Steps to Developing a QAPP
Slide Number 14
Slide Number 15
Slide Number 16
Steps to Developing a QAPP
Slide Number 18
Slide Number 19
Slide Number 20
Slide Number 21
Slide Number 22
Slide Number 23
Slide Number 24
Sources of Information About Massachusetts Waters
Slide Number 26
Slide Number 27
Slide Number 28
Slide Number 29
Slide Number 30
Slide Number 31
Slide Number 32
Slide Number 33
Slide Number 34
Slide Number 35
Slide Number 36
Slide Number 37
Slide Number 38
Slide Number 39
Slide Number 40
Slide Number 41
Slide Number 42
Slide Number 43
Slide Number 44
Slide Number 45
Slide Number 46
MassDEP - Recommended Minimum Sample Number Frequency and Timing for Example Parameters
Slide Number 48
Slide Number 49
Slide Number 50
Slide Number 51
Slide Number 52
MaDep - Recommended Minimum Sample Number Frequency and Timing for Example Parameters
Slide Number 54
Slide Number 55
Slide Number 56
Slide Number 57
Slide Number 58
Slide Number 59
Slide Number 60
Slide Number 61
Slide Number 62
Slide Number 63
Slide Number 64
Slide Number 65
Slide Number 66
Slide Number 67
Slide Number 68
Slide Number 69
Slide Number 70
Slide Number 71
Slide Number 72
Slide Number 73
Slide Number 74
Slide Number 75
Slide Number 76
Precision DQOs Dealing with low-level concentrations
Slide Number 78
Slide Number 79
Slide Number 80
Slide Number 81
Slide Number 82
Documentation and Records ndash EPA Element 9
Slide Number 84
Slide Number 85
Slide Number 86
Slide Number 87
Slide Number 88
Slide Number 89
Slide Number 90
Slide Number 91
Slide Number 92
Slide Number 93
Slide Number 94
Slide Number 95
Slide Number 96
Slide Number 97
Slide Number 98
Slide Number 99
Slide Number 100
Site ID
Site Name
Town
Rationale
Lat
Lon
Deerfield River Mainstem and Branches
VT-NBD_064
East Dover Rd
Wilmington
Monitor above most ag and below golf course
4291431
-728376
VT-NBD_027
Above Wilmington Center
Wilmington
Monitor within ag and above village center
4287452
-72864
VT-NBD_020
Wilmington Center above confl w Beaver Brk
Wilmington
Monitor for high bacterianutrients and Beaver Brk contribution
4286816
-728721
VT-NBD_018
Wilmington Center below confl w Beaver Brk
Wilmington
Swim holehigh bacterianutrients
4286875
-728738
MA-DFR_289
Shunpike Rest Area
Charlemont
Monitor Deerfield River coming from VT
426363
-729071
MA-DFR_276
Above Charlemont Center
Charlemont
Bracket WWTF Mill Brk
426271
-728853
MA-DFR_267
Charlemont Center
Charlemont
Bracket WWTF Mill Brk
426262
-728685
MA-DFR_011
5 amp 10 Bridge
Greenfield
Monitor Deerfield contributions to CT River
4256975
-725922
North River
VT-EBN_150
Above Jacksonville WWTF
Whitingham
Bracket WWTF
42787
-728163
VT-EBN_147
Below Jacksonville WWTF
Whitingham
Bracket WWTF
4278456
-728128
MA-EBN_024
Foundry Village Rd Ballfields
Colrain
Swim hole
4267478
-726966
MA-NOR_001
Formerly Sunburn Beach
Colrain
Mouth of North River
4265286
-727141
Green River Watershed
VT-PND_001
Mouth of Pond Brook
Halifax
Green River reclassification in support of Green River Watershed Alliance grant
428135
-727243
VT-GRN_234
Hinesburg Rd
Guilford
Green River reclassification in support of Green River Watershed Alliance grant
4279717
-726804
VT-HBG_001
Mouth of Hinesburg Brook
Guilford
Green River reclassification in support of Green River Watershed Alliance grant
4279582
-726605
VT-GRN_202
Green River Timber Crib Dam swim hole
Guilford
Swim HoleGreen River reclassification in support of Green River Watershed Alliance grant
4277555
-726673
VT-GRN_168
MAVT State Line
Guilford
Green River reclassification in support of Green River Watershed Alliance grant
4273299
-726761
MA-GRN_098
Bare Ass Beach
Greenfield
Swim Hole
4265102
-726235
MA-MPL_001
Mouth of Maple Brook
Greenfield
ID source of bacterianutrients
4258667
-726124
MA-GRN_020
Mohawk Trail Bridge
Greenfield
ID source of bacterianutrients
4258554
-726117
MA-GRN_008
Pretty Plain Rd
Greenfield
Monitor Green River contributions to Deerfield River high bacterianutrients
4257636
-725984
Other Tributaries
VT-
ELS_002
Ellis Brook TBD
Wilmington
Monitor below WWTF
429202
-728381
VT-COB_003
Cold Brook Above confl with N Br Deerfield
Wilmington
General water quality monitoring effect of Mt Snow pond
4289928
-728595
VT-BVR_029
Near Shearer Hill Rd
Wilmington
Monitor for runoff
42855
-728385
VT-BVR_011
Off Rte 9 near Wahoorsquos
Wilmington
Monitor for high bacteriarunoff
4286523
-728588
MA-CHI_001
Chickley River Tower Rd
Charlemont
Monitor contributions to Deerfield River
4263005
-729016
MA-MBK_001
Mill Brook TBD
Charlemont
Monitor mouth for contribution
426271
-728728
MA-CLS_003
Clesson Brook Buckland Rec Area
Buckland
Swim hole monitor contributions to Deerfield River
4 Data Quality Objectives and Indicators (with clear table of DQIs)
A7 Quality Objectives and Criteria
8 Training Requirements
6 Training and Specialized Experience
A8 Special TrainingCertification
9 Documentation and Records
7 Documents and Records
A9 Documents and Records
MEASUREMENTDATA ACQUISITION
COLLECTING THE DATA
GROUP B DATA GENERATION AND ACQUISITION ELEMENTS
10 Sampling Process Design (including SOP citations sampling locations)
9(A) Sampling Methods (including methods locations sampling frequency quality control measures broken out by samplemonitoring type)
B1 Sampling Process Design (Experimental Design)
11 Sampling Methods Requirements (includes equipment containers preservation hold times sample type any decontamination)
9(B) Sampling Methods ndash Data Collection Methods (including parameters locations type of QC number of samples SOPs rationale
B2 Sampling Methods
12 Sampling Handling and Custody
9 Sampling Handling (includes sample ID process)
B3 Sample Handling and Custody
13 Analytical Methods Requirements
12 Analytical Methods (includes containers and preservation)
B4 Analytical Methods
14 Quality Control Requirements
13 Field and Laboratory Quality Control
B5 Quality Control
TERMINOLOGY
bull STUDY DESIGN
bull QAPP QUALITY ASSURANCE PROJECT PLAN
bull SAP SAMPLING AND ANALYSIS PLAN
bull SOP STANDARD OPERATING PROCEDURES
bull DQO DATA QUALITY OBJECTIVES
STUDY DESIGN
ldquoA document that outlines the monitoring program including how it fits within your organizationrsquos objectives and goals ldquo - ALLARM
QAPP
The Quality Assurance Project Plan is ldquoa document that outlines the procedures and measures used to ensure the quality of the data when collecting and analyzing the samples and managing the data ldquo - ALLARM
SAMPLING AND ANALYSIS PLAN
A document that outlines the field and lab procedures followed in the monitoring program Usually specific to a monitoring year
STANDARD OPERATING PROCEDURES
An SOP is a document that describes in detail how to take samples or measurements in the field or how to perform a laboratory analysis
DATA QUALITY OBJECTIVES
DQOs are the qualitative and quantitative terms used to describe how good your data needs to be to meet project objectivesldquoCollect water quality data to determine the likelihood that waterbodies in the Blackstone River Watershed meet state water quality standardsrdquo
ParameterField
Precision(RPD)
Lab Precision (RPD)
Accuracy (R)
Field Blank Cleanliness
Water ColumnTotal Phosphorus le 30 le 20 80-120 lt RL
WATER QUALITY MONITORING PLANNING PROCESS
MONITORING PROGRAM ACTIVITIES
bull BEFORE SAMPLING BEGINS
bull DURINGIMMEDIATELY AFTER SAMPLING
bull AFTER SAMPLING amp ANALYSIS
- Study Design - QAPP- Training
- Sample Collection- Lab Analysis
- Data Management- Data Analysis- Data Review Validation amp Verification- Data Submission (optional)- Data Presentation- Program Evaluation
WHY DO YOU NEED (WHO GIVES) A QAPP
bull As a guidance document to clearly outline monitoring objectives how data will be used what steps are needed to meet your goals and Data Quality Objectives
bull Regardless of what your goals are developing a QAPP ensures you will collect data that can be used for its intended purpose
bull If want data to be used by DEP having an approved QAPP is a requirement
bull May be required to have a QAPP to obtain monitoring grants from the State of Massachusetts or from EPA
Up-front time spent writing a QAPP will save a great deal of time and headaches throughout the sampling year
STEPS TO QAPP DEVELOPMENT
This session will cover
The process of writing a QAPP
Details on major elements or sections of QAPPbull What each meansbull What to includebull Where to obtain needed information how to decide what to write
Supporting Documents
STEPS TO DEVELOPING A QAPP
1 ESTABLISH A QAPP TEAM
2 DETERMINE THE GOALS AND OBJECTIVES OF YOUR PROJECT
3 COLLECT BACKGROUND INFORMATION
4 REFINE YOUR PROJECT
5 DESIGN YOUR SAMPLING ANALYTICAL AND DATA REQUIREMENTS
14 Quality Control Requirements 13 Field and Laboratory Quality Control B5 Quality Control
Comparison of Guidance Documents - Continued
Elements of a QAPPProject Management1 Title and Approval Page2 Table of Contents3 Distribution List4 ProjectTask Organization5 Problem Identification Background6 ProjectTask Description7 Data Quality Objectives for Measurement Data8 Training RequirementsCertification9 Documentation and RecordsMeasurementData Acquisition10 Sampling Process Design11 Sampling Methods Requirements12 Sample Handling and Custody13 Analytical Methods Requirements14 Quality Control Requirements15 InstrumentEquipment Testing Inspection and Maintenance Requirements16 Instrument Calibration and Frequency17 InspectionAcceptance Requirements for Supplies18 Data Acquisition Requirements19 Data ManagementAssessment and Oversight20 Assessment and Response Actions21 ReportsData Validation and Usability22 Data Review Validation and Verification23 Validation and Verification Methods24 Reconciliation with Data Quality Objectives
STEPS TO DEVELOPING A QAPP
1 ESTABLISH A QAPP TEAM
2 DETERMINE PROJECT GOALS amp OBJECTIVES
3 COLLECT BACKGROUND INFORMATION
4 REFINE YOUR PROJECT
5 DESIGN SAMPLING ANALYTICAL amp DATA REQUIREMENTS
6 DEVELOP IMPLEMENTATION PLAN
7 DRAFT SOPS AND QAPP
8 SOLICIT FEEDBACK ON SOPS AND QAPP
9 REVISE SUBMIT FOR FINAL APPROVAL
10 BEGIN YOUR MONITORING PROJECT
11 EVALUATE AND REFINE YOUR QAPP
Elements of a QAPPProject Management1 Title and Approval Page2 Table of Contents3 Distribution List4 ProjectTask Organization5 Problem Identification Background6 ProjectTask Description7 Data Quality Objectives for Measurement Data8 Training RequirementsCertification9 Documentation and RecordsMeasurementData Acquisition10 Sampling Process Design11 Sampling Methods Requirements12 Sample Handling and Custody13 Analytical Methods Requirements14 Quality Control Requirements15 InstrumentEquipment Testing Inspection and Maintenance Requirements16 Instrument Calibration and Frequency17 InspectionAcceptance Requirements for Supplies18 Data Acquisition Requirements19 Data ManagementAssessment and Oversight20 Assessment and Response Actions21 ReportsData Validation and Usability22 Data Review Validation and Verification23 Validation and Verification Methods24 Reconciliation with Data Quality Objectives
Elements of a QAPP ndash Suggested completion order
Data Quality Objectives for Measurement Data (7)Sampling Process Design (10) Sampling Methods Requirements (11) Sample Handling and custody Requirement (12)Analytical Methods Requirements (13) Quality Control Requirements (14)
InstrumentsEquipment Testing Inspections and Maintenance Requirements (15)Instrument Calibration and Frequency (16)Inspection Acceptance Requirements for Supplies (17)Training Requirements Certification (8)
Elements of a QAPP ndash Suggested completion order continued
Documentation and Records (9) Data Management (19)Data Acquisitions Requirements (18)
Data Review Validation and Verification Requirements (22)Validation and Verification Methods (23)Reconciliation with Data Quality Objectives (24)
Reports (21)
Assessment and Response Actions (20)
Project Task Organization (4 final version) Distribution List (3) Title and Approval Page (1)Table of Contents (2)
Problem Identification BackgroundEPA Element 5
A Problem Definition ldquoThis section describes the environmental problem question or threat to be addressed explains why this work needs to be done and provides a framework for determining the project purpose the use of the data and the project objectivesrdquo
B Background
ldquoThis is an opportunity to describe the history of the project (or environmental problem) relevant previous studies and how this project fills in a data gap (including from existing data) or complements existing informationrdquo
- Citizen Science Quality Assurance and Documentation EPA 2019
Problem Identification BackgroundEPA Element 5
From MA VM QAPP Guidebook
bull Describe your organizationbull Describe your watershed and waters of interestbull Describe the current status of your waters of interestbull State water quality issues of concernbull Describe information needed to address the concernbull List your monitoring questionsbull What are your monitoring purposesbull List intended users uses of information you collect
5 Background of DRWA Volunteer Bacteria Monitoring Program Deerfield River Watershed Association QAPP 2019
The Deerfield River Watershed encompasses approximately 665 square miles Thehellip River is widely regarded as one of the coldest and cleanest rivers in Massachusetts and attracts many sport-fishermen and whitewater enthusiasts However nonpoint source pollution has degraded segments hellip and poses a threat to other tributaries The DRWA has intermittently monitored the water quality hellip since 1990 to document the current quality of the watershed
hellip DRWA started monitoring fecal coliform bacteria at popular recreation sites to provide data in the intervening years [between DEP monitoring schedules] hellip In 1999 DRWA monitored bacteria above and below hellip WWTPs and at a few recreational siteshellip high counts of bacteria were recorded from at least one hellip site exceeding the Massachusetts Surface Water Quality Standards Class B standards This finding prompted a focused examination of bacteria levels in 2003 However concerns of impairment hellip persist According to the Massachusetts Year 2016 Draft Integrated List of Waters the lower nineteen miles of the mainstem and four important tributaries of the Deerfield are assigned to Category 5 Waters for pathogenshellip
5 Background of DRWA Volunteer Bacteria Monitoring Program Deerfield River Watershed Association QAPP 2019 ndash continued
DRWA resumed monitoring of bacteria in the Deerfield watershed in 2017 hellipthe Connecticut River Conservancy (CRC) provides [lab services] Through [this] support DRWA has been able to test bacteria in hellipand include testing parameters besides bacteria in Massachusetts In 2019 CRC received the bacteria grant from MA DEP that will help cover the costs of testing bacteria in the Massachusetts portion of the watershed
Problem StatementhellipMassDEP and hellip VT DEC have identified several potential sources of nonpoint pollution in the Deerfield Watershed including failing septic systems stormwater runoff road runoff from paved and unpaved roads hellipand agricultural activities in close proximity to rivers and streams
In Massachusetts approximately nineteen (19) river miles hellip have been assigned to Category 5 (waters that require a hellip (TMDL calculation)hellipother river segments remained unassessed for recreation
In Vermont there is a bacteria TMDL Monitoring over the past 2 years suggests that the TMDL area may need to be extended Vermont is on a 5-year watershed basin planning cycle The Deerfield Watershed is currently undergoing its basin planning process
Problem Identification BackgroundNeponset RWA QAPP 2019
A5-1 Watershed DescriptionThe Neponset River Watershed covers 117 square mileshellip
A5-2 Organizational BackgroundThe Neponset River Watershed Association (NepRWA) is hellip
A5-3 Sources of Impairment and Pollutants of ConcernRemaining water quality problems in the watershed include hellipCurrent pollutants of concern in the Neponset Watershed includehellip
A5-4 Past Sampling EffortsThe Massachusetts DEP completed a very comprehensive water quality assessment hellip The CWMN program has been working to fill water quality information gaps and facilitate water quality improvement for more than 20 yearshellip
Sources of Information About Massachusetts Waters
1 Mass Water Quality Standards httpwwwmassgoveeaagenciesmassdepwaterregulations314-cmr-4-00-mass-surface-water-quality-standardshtml
2 Massachusetts Water Quality Assessments ldquoLook here for reports on the condition of watersheds in Massachusettsrdquo httpwwwmassgoveeaagenciesmassdepwaterwatershedswater-quality-assessmentshtml3
3 Integrated List of Waters httpswwwmassgovlistsintegrated-lists-of-waters-related-reports4 TMDLs httpwwwmassgoveeaagenciesmassdepwaterwatershedstotal-maximum-daily-loads-tmdlshtml25 Older Water Quality Assessment Reports httpwwwmassgoveeaagenciesmassdepwaterwatershedswater-
quality-assessmentshtml3
Deerfield River Basin
Program Goals and Objectives Part 2 of EPA Element 5
A5 Program Goals and Objectives - DEP
Project Purpose- DRWA
Objectives of Project
The principal objectives of projects under this QAPP are to 1) provide a perspective on the range of water quality conditions for recreation in the Deerfield River watershed across Vermont and Massachusetts 2) describe water quality conditions of individual tributaries and the mainstem 3) establish a database for use in documenting future changes in water quality and 4) educate and involve residents in waterbody protection
Toward those objectives DRWA will monitor 29 sites for E coli sampling during the recreation season June through September This project includes conducting a water quality monitoring program for E coli in the Vermont and the Massachusetts portions of the watershed where pathogens have been detected during previous sampling efforts undertaken by MassDEP and VT DEC
Project Purpose- DRWA
B Intended Uses of Data
The data generated under this QAPP will serve the following uses
- Use in the MassDEP CWA Integrated Report
- Document the presence and severity of bacteria as pathogen indicators
- Educate school children and local communities about water quality and any problems and improvements
- Evaluate the effectiveness of restoration projects and other management activities
A56 Program Goals and Objectives ndash NepRWANepRWArsquos CWMN program seeks to accomplish the following during the period 2019-2021
- Regularly collect in-stream water quality samples at a handful of ldquoindicator sitesrdquo that represent overall water quality conditions and trends
- Regularly collect in-stream water quality samples at a larger number of ldquosubwatershed sitesrdquo that target known or suspected problem areas
- Conduct ldquofollow uprdquo and ldquospecial studyrdquo investigations and sampling as needed to confirm and further specify suspected problem or opportunity areas identified through the regular sampling program
- hellip
- Collect in-stream samples during rainfall events
- Distribute results promptly to municipal officials state and federal regulators and the general public as a means to increase understanding of water pollution issues
- Using fully sterile methods collect data needed to help implement recommendations of the Total Maximum Daily Load (TMDL) for bacteria
- Generate data to help enhance the effectiveness of municipal state federal and private efforts to improve water quality
Monitoring Objectives amp DWM-DEP Data Levels
EducationalStewardship-levelbull Objective is to engage volunteers in monitoring to develop better understanding
of the importance of water resources and to encourage their fellow citizens to take an active role in the preservation and restoration of their local water bodies and watersheds
Screening-level bull Typically used to direct future sampling efforts and as supporting evidence only
RegulatoryAssessment-levelbull Directly usable for 305(b) and 303(d) decision-making bull Scientifically sound and legally-defensible bull Contingent on review and approval these data can help determine if a water body
is meeting water quality standards or is impaired
Monitoring Objectives amp DWM-DEP Data Levels
Project Task Description ndash EPA Element 6
In general terms describe bull The work your staffvolunteers will perform bull Where it will take placebull What kinds of samples will be takenbull What kinds of conditions will be measuredbull How you will evaluate results
DRWA Project PurposeTask Description
C Brief Description of Project- There will be a training and orientation meeting held in March organized by VTDEC but
held at VAEL - Volunteers will be trained annually prior to the start of the sampling season- River water samples will be collected at 29 sites 6 times between June and September- The project will employ the Colilert System developed by IDEXX laboratories Inc to assay
E coli bacteria Samples will be analyzed at the CRC laboratory- Data will be analyzed and reviewed for quality assurance summarized and interpreted on
an annual basis - Data that meet project quality objectives will be submitted to MassDEP and entered in the
VTDECrsquos Water Quality data management system as well as the EPArsquos national water quality data storage system known as STORET
- Information will be presented to the local community in a suitable format be it a press release public meeting or another event
- A report will be prepared and shared with the distribution list in this QAPP and published on the DRWA website (deerfieldriverorg)
Site ID Site Name Town Rationale Lat Lon Deerfield River Mainstem and Branches
VT-NBD_064
East Dover Rd Wilmington Monitor above most ag and below golf course
4291431 -728376
VT-NBD_027
Above Wilmington Center
Wilmington Monitor within ag and above village center
4287452 -72864
VT-NBD_020
Wilmington Center above confl w
Beaver Brk
Wilmington Monitor for high bacterianutrients and
Beaver Brk contribution
4286816 -728721
VT-NBD_018
Wilmington Center below confl w
Beaver Brk
Wilmington Swim holehigh bacterianutrients
4286875 -728738
MA-DFR_289
Shunpike Rest Area Charlemont Monitor Deerfield River coming from VT
426363 -729071
MA-DFR_276
Above Charlemont Center
Charlemont Bracket WWTF Mill Brk 426271 -728853
MA-DFR_267
Charlemont Center Charlemont Bracket WWTF Mill Brk 426262 -728685
MA-DFR_011
5 amp 10 Bridge Greenfield Monitor Deerfield contributions to CT River
PrecisionThe degree of agreement among repeated measurements of an indicator on separate samples collected as close as possible in time and place
It does not mean that the sample actually reflects the ldquotruerdquo value but rather that your sampling and analysis are giving consistent results under similar conditions
AccuracyAccuracy or Bias is a measure of confidence that describes
how close a measurement is to its ldquotruerdquo value
Parameter Reporting Limit
Accuracy ( Recovery)
Field Precision (RPD)
Expected Range
E coli 1 MPN 100ml
Blanks and negatives show no colonies positives show colonies
30 of log10 transformed MPN
0-2420 MPN
These objectives will be measured as follows
Field Specific Quality Controls
10 of samples collected (3 per event in 2019) will be field blanks Sterile water poured into sterile sample bottle in the field These must register lt1 for total coliform and E coli
10 of samples collected (3 per event in 2019) will be field duplicates A second sample will be collected at the same location by the volunteer These will have a Relative Percent Difference of le 30 for log transformed e values
Laboratory Sample Batch-Specific Quality Control Samples With each new batch of samples run CRC will perform the following QC sample analysis
1 Lab Blank - Sterile water1 Positive Culture Control -sterile buffer dilution water inoculated with E coli (ie total coliform amp E coli positive)1 Negative culture Control -sterile buffer dilution water inoculated with non-fluorescent Pseudomonas sp (ie
total coliform amp E coli negative) 1 Lab Duplicate ndash 250 mL sample split into 2 100 mL samples in the lab
DRWA Data Precision and Accuracy
REPRESENTATIVENESS
Representativeness is the extent to which measurements actually represent the true environmental condition
You will state that- Sampling sites were selected to appropriately capture
- the general characteristics of the water body- or specific impacts if you are conducting an impact assessment (eg above amp
below suspected pollution sourceshellip)- The sample collection point is appropriate eg mid-stream mid-lake etc what
sampling depth - Number of sites is adequate to answer study question- The parameters monitored are relevant to the type of impact or to a general
WQ assessment- Sample collection timing and frequency are selected to capture data that are
representative of target conditions (eg various water levels weather seasons)
MassDEP - RECOMMENDED MINIMUM SAMPLE NUMBER FREQUENCY AND TIMING FOR EXAMPLE PARAMETERS
Parameter
Streams Lakes
Min Sample Number and Frequency
Sampling Period Min Sample Number and Frequency
Sampling Period
DO (discrete) 5 results pre-dawn June - September 3 results (epilimnetic) June - September
DO (continuous) 3o days June - September 3o days June - September
pH 5 results June - September 3 results (epilimnetic) June - September
Temperature (discrete) 5 results afternoon June - September 3 results (epilimnetic) June - September
Temperature (continuous) 3o days June - September 3o days June - September
Bacteria (eg E coli) 3-5 results (in 30-90 days) April 1-October 15 3-5 results (in 30-90 days) April 1-October 15
Nutrients (inc chl a for lakes) 5 results June- September 3 results June - September
Secchi depth --- --- 3 results June - September
Chloride 3 results 4 day period (yr-round) --- ---
ldquoCleanrdquo metals 3 results 4 day period (summer) --- ---
Misc toxics emerging contam 3 results 30 day period (summer) 3 results (epilimnetic) 30 day period (summer)
Fish community 1 survey April 1-October 15 1 survey April 1-October 15
Fish tissue contaminants (eg Hg PCBs pesticides)
1 survey Any 1 survey Any
Benthic invertebrates (RBP3) 1 survey July ndash October --- ---
Weed surveys 1 survey June- September 1 survey June- September
Aesthetics 1 survey April 1-October 15 1 survey April 1-October 15
30 days (bathing) 90 days (non-bathing) ldquoworst-caserdquo typ July-Aug
REPRESENTATIVENESS
DRWAB Data RepresentativenessSamples collected at locations and depths described in this QAPP will reflect conditions of individual water bodies and tributaries in Vermont and Massachusetts To ensure representativeness all samples will be collected preserved and analyzed according to the procedures in this QAPP and within the specified holding times
NepRWAA7-5 Data RepresentativenessSampling points will be chosen to represent the water quality within the applicable geographic area of interest Staff experienced and knowledgeable in the factors affecting water quality will choose sample points that will be representative of conditions within the area of concern
COMPARABILITY
Comparability is the degree to which data can be compared directly to similar studies There are two things to consider future studies someone might undertake and past studies you (or others) will want to compare your data with
State that you will use and document standardized - sampling amp analytical methods and units of reporting- sampling sites times and dates - sample storage and transfer
Comparability
Deerfield River Watershed Association
C Data ComparabilityAll samples for each specific parameter will be collected and analyzed using the respective procedures described in this QAPP to ensure that comparisons between different sample sites sample dates depths and projects can be appropriately made Procedures are unchanged from previous years
Neponset River Watershed Association
A7-6 ComparabilityComparability is ensured by the utilization of established sampling and monitoring protocols from Massachusetts DEP MWRA Massachusetts Water Watch Partnership the Boston Water and Sewer Commission and NepRWA and by the use of standard test methods and procedures as outlined in Appendices 6 7 and 8
Completeness
Completeness is an estimate of the amount of data you will need to answer your study question Usually expressed as a of originally planned sample events after missing sample events and data no meeting DQOs are subtracted from the planned number
DRWA
D Data CompletenessAt least 80 of the anticipated number of samples will be collected at each site analyzed and determined to meet data quality objectives for the project to be considered successful A report detailing the number of anticipated samples number of valid results and percent completion (number of valid samplesnumber of anticipated samples) will be produced
NepRWAA7-8 CompletenessIn order to obtain the best picture of the watershed NepRWA expects 90 of the routine sampling and follow up sampling samples to be collected and analyzed during each scheduled sampling event In the routine sampling program uncertainties such as weather volunteer scheduling and illness sometimes result in unavoidable omissions but every effort is made to assign backup samplers when possible
Sampling Process Design - EPA Element 10From MassWWP QAPP Guide
Purpose To describe in greater detail the design of the sampling part of your monitoring program
In Section 6 you briefly outlined the sample process design In this section you should elaborate on the rationales for those choices When you complete this section you should revisit Section 6 and revise as necessary The two sections should be in agreement
What To Include bull Indicators or measures bull Types of samplesbull Sampling frequency bull Sampling period bull How you will select sample sites and identify them over timebull Site safety plans
MADEP - RECOMMENDED MINIMUM SAMPLE NUMBER FREQUENCY AND TIMING FOR EXAMPLE PARAMETERS
Parameter
Streams Lakes
Min Sample Number and Frequency
Sampling Period Min Sample Number and Frequency
Sampling Period
DO (discrete) 5 results pre-dawn June - September 3 results (epilimnetic) June - September
DO (continuous) 3o days June - September 3o days June - September
pH 5 results June - September 3 results (epilimnetic) June - September
Temperature (discrete) 5 results afternoon June - September 3 results (epilimnetic) June - September
Temperature (continuous) 3o days June - September 3o days June - September
Bacteria (eg E coli) 3-5 results (in 30-90 days) April 1-October 15 3-5 results (in 30-90 days) April 1-October 15
Nutrients (inc chl a for lakes) 5 results June- September 3 results June - September
Secchi depth --- --- 3 results June - September
Chloride 3 results 4 day period (yr-round) --- ---
ldquoCleanrdquo metals 3 results 4 day period (summer) --- ---
Misc toxics emerging contam 3 results 30 day period (summer) 3 results (epilimnetic) 30 day period (summer)
Fish community 1 survey April 1-October 15 1 survey April 1-October 15
Fish tissue contaminants (eg Hg PCBs pesticides)
1 survey Any 1 survey Any
Benthic invertebrates (RBP3) 1 survey July ndash October --- ---
Weed surveys 1 survey June- September 1 survey June- September
Aesthetics 1 survey April 1-October 15 1 survey April 1-October 15
30 days (bathing) 90 days (non-bathing) ldquoworst-caserdquo typ July-Aug
Deerfield River Watershed Association
10 Sampling Process Design
Sampling sites were selected to represent locations that receive heavy human use from swimmers boaters anglers and other contact recreational users
Samples will be collected bi-weekly from late June through early September (prime recreation period) between 10 AM and 1 PM Samplers will first fill out their field data sheet They will then collect a water sample away from the edge of the stream near the center of the stream (centroid of flow) and just below the surface following the MWWP protocol (available in the Appendix)
Samplers will place their samples immediately in a cooler with ice or frozen ice packs making sure the temperature in the cooler is at 4degC or lower Each sample bottle will be placed in an individual clean Ziploc bag to avoid cross contamination
Neponset River Watershed Association
B1 Sampling Process Design
The CWMN program is designed to develop and maintain a record of general water qualitythroughout the watershed Project goals include both evaluation of long-term changes over time across the watershed as a whole and the identification of pollution hotspots at a low order subwatershed scale
Routine sampling activities consist of collecting in-stream samples As discussed above routine sampling sites are divided among ldquoindicatorrdquo sites and ldquosubwatershed sitesrdquo in order to meet the dual objectives of the program Indicator sites are selected to be representative of overall water quality and are relatively unchanging over time to allow comparison to past and future investigations Sites have generally been selected at the downstream ends or key segmentation points of major subwatersheds and at or near locations where there is a longstanding data record
Neponset River Watershed Association
B1 Sampling Process Design ndash continued
Subwatershed sites are selected to provide higher spatial resolution along individual streams in an effort to bracket pollution sources and facilitate their identification and remediation Subwatershed sites make up roughly 60 of the overall number of sites and are more likely to change from year to year Subwatershed sites may be rotated through different watersheds over the course of several sampling seasons to provide detailed data on different subwatersheds over a period of years Specific sites are selected by the project manager on the basis of known or suspected problems or opportunities or to fill in a lack of detailed data in a specific area
Neponset River Watershed Association
B1 Sampling Process Design ndash continued
In addition to the routine sampling activities CWMN also encompasses follow up and special study sampling activities These are generally ldquoone-timerdquo investigations intended to zero in on pollution sources in a known or suspected problem areahellipSpecific sampling stations may be planned in advance or may be chosen opportunistically by samplers while in the field
The mix of parameters sampled at each site depends on its status as an indicator subwatershed or follow up station the relative location of the station in the watershed and the specific pollutant(s) of concern at that specific location Indicator sites are tested for bacteria nutrients ammonia and field measured parametershellip Subwatershed sites are generally tested for bacteria total phosphorus and field measured parameters At some subwatershed sites hellip Follow up sampling stations will generally be tested for a very narrow set of parameters based on the specific pollutant of concern A listing of current routine sampling stations and the parameters sampled is provided in the Appendix 1e
Sampling Methods Requirements - EPA Element 11
This section describes your field measurementsample collection methods It can be stated in table form with narrative descriptions if you choose
Includebull What parameters are being sampledbull Sampling containersdevices sample preservation steps Maximum holding timebull Amount of sample to be collectedbull Summarize steps taken by field samplersbull Reference to the method followed (cite specific SOPS include in appendices)bull Can also include sampling considerations (eg time of day steps taken to avoid stirring up
sediments sample collection depth etc) These will be detailed in SOPs
Deerfield River Watershed Association
ParameterMeasure Container Field Rinse Preservation Hold Time E coli 120 mL IDEXX
Cool to lt4degC 6 hours to lab 8 hours to processing
B2 Sampling Methods
B2-2 Visual ObservationsB2-3 Fecal Coliform E coli and EnterococcusB2-5 NutrientsB2-6 Specific Conductance and SalinityB2-7 TemperatureB2-8 pH B2-9 Dissolved OxygenB2-10 SurfactantsB2-11 Depth and FlowB2-12 Optical BrightenersB2-13 Qualitative Ammonia Nitrogen
Neponset River Watershed Association
Sample Handling and Custody Requirements - EPA Element 12
Demonstrate that your sampling handling and storage techniques will retainsafeguard the integrity of your samples and data records
12 Sample Handling and Custody Procedures
Samples will be collected between 7 AM and 10 AM on sampling days The samples will be kept on ice inside a cooler during transport Wilmington VT area samples will be picked up by the monitoring assistant in the Main Street parking lots or other agreed upon meeting location by 9 AM Green River VT samples will be picked up by the transporting volunteer at the Green River covered bridge or other agreed upon meeting location by 930 AM The remaining samples will be delivered directly to the CRC water quality lab by 10 AM Any exchange of possession in the samples will be documented on the Chain of Custody (CoC) form which will be completed and signed by the Lab Analyst upon receipt at the lab The CoC form will be checked by the program coordinator See Appendix for the CoC
Deerfield River Watershed Association
Analytical Methods Requirements - EPA Element 13
Deerfield River Watershed Association
13 Analytical Methods Requirements
All analytical determinations will be performed at the CRC lab in Greenfield by the Lab Director Gabriel Chevalier
Indicator
Method Number
Source
Reporting Units
Modifications or Options
E coli
United water laboratory 1603 Bacteria Colilert SOP 604b CRWC 03-11-10
EPA 1603 (Modified m-TEC)
1 MPN
Sodium Thiosulfate used in all containers
Neponset River Watershed Association
Massachusetts Volunteer Monitorrsquos Guide to QAPP DevelopmentPAGE 61
Here are some things to consider in choosing a method Scientific Considerations Does it meet your data quality objectives
How accurate is it How precise (reproducible) is it What is its detection limit
Will it measure the indicator in the range that you need What lab facilities are required What equipment is required Does it yield samples that are representative Is it comparable to methods used by agencies collecting similar information
Practical and Program Considerations bull Do you have the human and financial resources to do it bull How difficult is it bull How time-consuming is it bull Will it produce data useful to the target audience
Quality Control ndash EPA Element 14
This section documents that the specific quality control measures you will take will allow you to determine whether you meet your data quality objectives
What To Include Section 7 stated your DQOs Here you describe how you are going to meet them
For each indicator include the following information
bull Accuracy Precision checks list what checks you will perform
bull List the of your samples upon which you will perform quality checks that will represent the quality of all your samples
Quality Control
Accuracy checks
There are a variety of ways to check the accuracy of your sampling and analysis
Checks can be done internally (done totally within your project lab) or externally (done with the assistance of an independent lab)
Known Samples This is an internal check that compares your results against another analyst or a ldquoknownrdquo An example of a known is a quality assurance sample that UMass WRRC sends to VM groups for pH DO or alkalinity ndash with the expected value communicated when sample is sent
Proficiency Testing (Unknown) Samples In some cases there are programs that provide proficiency testing samples for laboratory performance evaluation the concentrations of which are known to the auditor but not to the lab being tested This is relatively common for most water chemistry indicators An example of an unknown would when WRRC sends a quality assurance sample without communicating the expected value in advance
Quality Control
Accuracy checks - continued
Blank and Positive Plates Bacteriological samples should be checked using the blank and positive plate procedure The blank plate uses the rinse water media and equipment in the analysis to determine if there is contamination in the laboratory materials The result should be 0 The positive plate procedure uses a sample known to contain bacteria (eg waste- water treatment plant influent) to determine if a procedural error in the lab causes inhibition of bacterial growth Results should be rdquoToo Numerous To Countrdquo Each batch of samples should include at least one blank and one positive check sample This is an internal check
Spiked Samples Spikes are additions of a known amount of the indicator with the expectation that subsequent analysis will measure exactly that much increase over the un- spiked sample This procedure is described in Section 1020 B of Standard Methods This is an internal check
Voucher and Reference Collections For macroinvertebrates and aquatic plants maintenance of a voucher andor a working reference collection is recommended A voucher collection is a preserved collection of the type specimens ie an example of each of the individual taxa that you have given a name It should be maintained in archival condition by a trained curator typically found at a university A reference collection is an exact duplicate of the voucher collection but is the one that you will regularly use as a reference when identifying new specimens Both voucher and reference collections should be verified by an expert This is an external check Alternatively have an expert review IDs made by volunteers of at least 10 of specimens collected 90 accuracy is recommended
Quality Control
Precision Checks
Precision checks are primarily accomplished through replicate sampling amp analysis in the field and lab
Field Replication Replication can be done by the same field collectors but some replication by other collectors is good eg a pair of field collectors swapping roles or have different team collect the replicate This is an internal check
Lab Replication Additional replication should occur in the lab Lab replication is done by dividing a well-mixed sample into two or more aliquots and conducting analysis on each aliquot This is an internal check
Split Samples Split samples (a sample that is split into two sub-samples) can be done in the field or the lab
Relative Percent Difference
A measure of precision used for duplicate sample results It is calculated by dividing the difference between the two results by the mean of the two results expressed as a percentage Used when sample number equals two
eg ((98-92) 100) ((98+92))2 = 63
Deerfield River Watershed Association
14 Quality Control RequirementsA Volunteers Check - Field AuditEither the QC Officer the Project Coordinator or both will accompany a crew of volunteers (each) to their site each collection The trainers will observe the volunteersrsquo performance and check their sampling technique and field data sheets for accuracy
B Field QC ChecksAt least one Field Duplicate and one Field Blank will be submitted for every ten samples collected
Field Duplicate ndash a check on water quality sampling amp analysis consistency This is a replicated sample collected at the same point in time and space side by side with the first sampling and given a separate Sample ID number
Field Blanks ndash a check for contamination (AccuracyBias) in the field by processing laboratory-supplied deionized water through the sampling train This checks for contamination introduced from the sample container(s) or from field contamination A Field Blank will be taken by one volunteer at one site per sampling day for bacteria A container of DI water will be given to the volunteer who will pour this DI water into the sample bottle at the site
We will rotate the field duplicate and field blank samples among the volunteers throughout the sampling season so a maximum of collectors can be checked
Deerfield River Watershed Association
14 Quality Control Requirements ndash continued
C Laboratory QC ChecksA Lab Duplicate will be analyzed each sampling day The lab will split a randomly chosen sample and analyze both subsamples
The lab will run a Lab Blank and a Positive Sample for bacteria each collection (see section 7)
D Data Analysis QC ChecksRiver data and QC data will be reviewed by the QC Officer as soon as they come in from the lab after each collection QC data will be compared to the quality objectives (eg blanks should have zero colonies sample duplicates should be within 3 standard deviations of the mean positives should show bacterial growth etc) River data will be reviewed as well to ensurethat no field or lab contamination has occurred (data will be compared to those of other sites and of previous collections)
Bacteria computations will be checked and validated If discrepancies are found the Lab Director will be called to resolve the discrepancy and corrections will be made by the QC Officer
Field data sheets will be also reviewed the day of collection by the Project Coordinator and later by the QC Officer to ensure that samples were taken at the right times and that all the required information has been filled out The Project Coordinator or collectors will be called if omissions or errors are detected If needed corrections will be made (signed anddated) on the field sheet by the QC Officer
Neponset River Watershed Association
PRECISION DQOS DEALING WITH LOW-LEVEL CONCENTRATIONS
Source Analyte Units PrecisionMassDEP WPP Monitoring QAPP
Training Requirements Certification ndash EPA Element 8
In Narrative or Table Format
bull List type of training (eg Field WQ lab analysis visual observation data mgt data entry etc)
bull Who is training who receives training
bull How often training done
If training records are kept (they should be) include that in section 9 on documentation and records
Neponset River Watershed Association
A8 Training - ExcerptTo ensure the high quality and usability of the data that is generated by the CWMN program all participants receive training appropriate to the tasks for which they will be responsible NepRWA staff that are involved in the program are professionals with extensive training in water quality chemistry biology and field sampling NepRWA has established a program of training for volunteers that includes initial training follow-up and refresher classes These classes are given by NepRWA staff that are qualified not only in the technical matter covered but in training and education
The initial training for volunteer monitors is primarily instruction and demonstration by the trainer with repetition by the volunteer This training includes an overview of the entire project and detailed instruction in sampling procedures All monitors receive and review a copy of NepRWArsquos Water Monitoring and Sampling Manual (see Appendix 3a)
After their initial training all volunteers participate in a mandatory annual group andor individual training session These sessions are designed to update the volunteers on changes in the program further train them in equipment calibration and field-testing procedures and evaluate each volunteerrsquos performancehellip
InstrumentEquipment Testing Inspection and Maintenance Requirements ndash EPA Element 15
Instrument Calibration and Frequency ndash EPA Element 16
InspectionAcceptance Requirements for Supplies ndash EPA Element 17
DOCUMENTATION AND RECORDS ndash EPA ELEMENT 9
Neponset River Watershed AssociationA9 Documents and RecordsA9-1 Data SheetsField data sheets include information about the site location (NepRWA ID number) which specific equipment was used to make measurements (thermometer number) the sampling method used (direct fill pole or Bridge Buddy) and equipment calibration results The field data sheets are also used to record temperature velocity depth color odor and turbidity information (Appendix 4e)helliphellip See Appendix 4 for copies of the various data sheets used in the CWMN program
A9-2 Chain of Custody FormsA9-3 Sample LabelingA9-4 Equipment Custody FormA9-5 Training and Evaluation Form
Data Acquisition Requirements - EPA Element 18
Purpose To ensure that any data you use but donrsquot collect yourself has a known data quality and is consistent with your data quality objectives that others can access these data and that your use of the data is appropriate
Describe any external data you use such as GPS coordinates for site locations weather station rainfall amounts etc
Include bull The title of the document or name of the informationbull Where you obtained it and where others may find itbull Notes on the quality of the outside information such as uncertainties and caveats
Preamble to Elements 19 through 24
Consider the four separate objectives of these chapters1) Producing a good data set - 19 covers the normal data mgt routines you do to prevent data mistakes in the first place- 22 amp23 describe how you review the resulting data sets - how you find and correct
missing or erroneous data - 19 22 and 23 should produce as complete amp accurate a data set as possible 2) Ensuring that any use you make of your data is justified In 24 you decide how usable your data are Review the final data set that the above efforts have produced Compare it with your DQOs to determine whether you have to discard or qualify any data what conclusions you can draw from your data or what changes you might need to make in your DQOs3) Improve overall project performance 20 deals with how well volunteers laboratories and equipment are operating It looks at function not outcomes Who evaluates the various components of your program when problems are found what corrections are made to make your program run better4) Report your results After yoursquove run these various checks you are ready to release your data In Chapter 21 you describe the reports you will issue
Suggested order bull Data Management (19)bull Data Review Validation and Verification Requirements (22)bull (Data) Validation and Verification Methods (23)
bull Reconciliation with Data Quality Objectives (24)
bull Assessment and Response Actions (20)
bull Reports (21)
EPA Elements 19 ndash 24
bull Data Management (19)bull Assessment and Response Actions (20) bull Reports (21)bull Data Review Validation and Verification Requirements (22)bull (Data) Validation and Verification Methods (23)bull Reconciliation with Data Quality Objectives (24)
Data Management ndash EPA Element 19
Follow the data from the moment itrsquos recorded through every step to final report databaseIntent is to prevent errors or loss of data or be able to correct in timely manner
bull Before each activitystep is conducted well-designed field sheets checklists COC forms data entry software auto-QC calculations out-of-bounds highlights etc
bull During each step sheets filled completely checklist reviewed before leaving site etc
bull Immediately after Computer-entered data compared with field sheets etc
bull Long term preservation Data storage
Neponset River Watershed Association
B9 Data ManagementThe Project Manager is responsible for overseeing all data management activities Refer also to section D below for additional discussion of data review verification and validation practices
B9-1 Raw DataField data sheets are collected with the samples The sheets are turned into the NepRWA office by the site coordinators The forms are then reviewed for illegible answers errors or questionable values and checked for consistency with the COC and bottle labels as described in Appendix 3l Any questions are referred to the volunteer for clarification NepRWA staff makes corrections by crossing out the errors and writing in the correct answer All corrections must be initialed
B9-2 Data Entry and ValidationOnce the information has undergone a preliminary check it is entered into a Filemaker database The software has been customized to the data sheet Fields within the worksheet have been set-up with limits based on expected results This helps to minimize entry errors Entered data is then checked against the data sheets by another volunteer or staff person
B9-3 Data StorageThe original data sheets are filed into an event file and stored in NepRWArsquos permanent files Electronic copies of data are maintained on a secure Filemaker server Data files are kept in perpetuity along with hard copies of volunteer data sheets All electronic data is backed-up daily on to a password-protected hard drive
Data Review Validation and Verificationndash EPA Element 22
(Data) Validation and Verification Methods ndash EPA Element 23
Deerfield River Watershed Association
22 Data Review Validation and Verification ndash Summarized bullet list
All data reviewed by the Project Coordinator and QA Coordinator
Data Analysis QC Checks will includebull Data entry checks by a second personbull Computer entries compared with fieldlab sheetsbull Checks on graphs amp all other data representationsbull Calculation of measures of data quality including completeness
Corrective actionsbull Data entry errors corrected bull Data outside expected range flagged or rejected bull 2nd field sample andor laboratory aliquot taken when possiblebull Data quality problems discussed in draft and final reports
(Data) Validation and Verification Methods ndash EPA Element 23 From Inland QAPP
Validation and Verification Methods will include checks on bull Completion of all fields on data sheets missing data sheetsbull Completeness of sampling runs (eg number of sites visitedsamples taken vs number proposed were all parameters sampledanalyzed)bull Completeness of QC checks (eg number and type of QC checks performed vs numbertype proposed)bull Accuracy and precision compared to data quality objectivesbull Representativeness of samples and resulting data by examining survey metadata for unusual conditions and occurrences that may have impacted the validity of results
Deerfield River Watershed Association ndash Excerpt summarized
23 Validation and Verification Methods
The following simple measures of data quality will be calculated and included in the final report
1) To screen for contamination the average blank concentration hellip will be calculated This average value should be as close as practical to the Reporting Limit listed in Table 4
2) To assess the precision of results the ldquoMean Relative Percent Differencerdquo between field duplicate samples should be calculated The average RPD should be less than or equal to the Estimated Precision listed in Table 4 This simple measure is calculated as follows
RPD formula used hellip
Reconciliation With Data Quality Objectives ndash EPA Element 24MassWWP guide to QAPP development
What to Include bull List who will evaluate your actual data vs your data quality goals bull State how and when this will be done bull Describe the process for determining what to do if goals are not met
Neponset River Watershed Association
D2 Reconciliation with User Requirements - Summarized bulletedbull Following each sampling event and prior to the subsequent event calculations and
determinations for precision completeness and accuracy will be made bull Any corrective action will be implemented noted and initialized by the project manager bull If data quality indicators do not meet the projectrsquos specifications then data may be discarded
may be flagged or re-sampling may occur bull Investigation of problems will take place and corrections will be documented If equipment
failure is found to be the cause calibration and maintenance techniques will be reassessed Field duplicate testing may occur during the next sampling event to ensure confidence in the results
bull Any limitations on the data will be noted bull Any revisions to the project will be submitted to EPA and DEP quality assurance officers for
approval
Assessment and Response Actions - EPA Element 20 From Inland QAPP
Document that the progress and quality of the monitoring program will be continuously assessed to ensure that its objectives are being accomplished
The Monitoring Coordinator will periodically check to see the following bull Monitoring is occurring as planned bull Sufficient written commentary and supporting photographs exist bull Sufficient volunteers are available bull Volunteers have been observed as they sample their sites bull Samplers are collecting in accordance with project schedules bull Data sheets and custody control sheets are being properly completed and signed bull Data are properly interpreted bull Plans for dealing with adverse weather are in place
Assessment and Response Actions - EPA Element 20 From Inland QAPP ndash continued
The Monitoring Coordinator will periodically check to see the following bull Retraining or other corrective action is implemented at the first hint of non compliance with the
QAPP or SOPs bull Labs are adhering to the requirements of their QAPP in terms of work performed accuracy
acceptable holding times timely and understandable results and delivery process bull Data management is being handled properly ie data are entered on a timely basis is
properly backed up is easily accessed and raw data are properly stored in a safe placebull Procedure for developing and reporting the results exists
Assessment and Response Actions - EPA Element 20 From Inland QAPP ndash continued
The Monitoring Coordinator will confer with the QA Officer as necessary to discuss any problems that occur and what corrective actions are needed to maintain program integrity In addition the Monitoring Coordinator and QA Officer will meet at the end of the sampling season to review the draft report and discuss all aspects of the program and identify necessary program modifications for future sampling activities [If the program includes a technical advisory committee the TAC will be included in these discussions] Corrections may include retraining volunteers rewriting sampling instructions replacement of volunteers alteration of sampling schedules sites or methods or other actions deemed necessary All problems discovered and program modifications made will be documented in the final version of the project report If modifications require changes in the Quality Assurance Project Plan these changes will be submitted MassDEP for review
Deerfield River Watershed Association
20 Assessment and Response Actions ndash Summarized bullet list
bull There will be an on-site visit by the Quality Control Officer to observe field sampling and field analysis procedures Generally this will be done near the beginning of the project
bull A written checklist will be used for the assessments maintained by the Project Coordinator and copies will be provided with the data report
bull The Project Coordinator and QC Officer will determine if field work follows the written procedures or if there needs to be corrections by additional training or revising protocols
bull Please refer to Section 22 for additional evaluations and response actions regarding data evaluations
Reports ndash EPA Element 21
Project Task Organization ndash EPA Element 4 Reviewrevise early choices
Distribution List ndash EPA Element 3
Title and Approval Page - EPA Element 1
Table of Contents ndash EPA Element 2
Water quality monitoring quality assurance workshop
Terminology
Study design
QAPP
sampling and analysis plan
standard operating procedures
data quality objectives
Water Quality Monitoring Planning Process
Monitoring program activities
Why do you need (who Gives) a qapp
Slide Number 11
Slide Number 12
Steps to Developing a QAPP
Slide Number 14
Slide Number 15
Slide Number 16
Steps to Developing a QAPP
Slide Number 18
Slide Number 19
Slide Number 20
Slide Number 21
Slide Number 22
Slide Number 23
Slide Number 24
Sources of Information About Massachusetts Waters
Slide Number 26
Slide Number 27
Slide Number 28
Slide Number 29
Slide Number 30
Slide Number 31
Slide Number 32
Slide Number 33
Slide Number 34
Slide Number 35
Slide Number 36
Slide Number 37
Slide Number 38
Slide Number 39
Slide Number 40
Slide Number 41
Slide Number 42
Slide Number 43
Slide Number 44
Slide Number 45
Slide Number 46
MassDEP - Recommended Minimum Sample Number Frequency and Timing for Example Parameters
Slide Number 48
Slide Number 49
Slide Number 50
Slide Number 51
Slide Number 52
MaDep - Recommended Minimum Sample Number Frequency and Timing for Example Parameters
Slide Number 54
Slide Number 55
Slide Number 56
Slide Number 57
Slide Number 58
Slide Number 59
Slide Number 60
Slide Number 61
Slide Number 62
Slide Number 63
Slide Number 64
Slide Number 65
Slide Number 66
Slide Number 67
Slide Number 68
Slide Number 69
Slide Number 70
Slide Number 71
Slide Number 72
Slide Number 73
Slide Number 74
Slide Number 75
Slide Number 76
Precision DQOs Dealing with low-level concentrations
Slide Number 78
Slide Number 79
Slide Number 80
Slide Number 81
Slide Number 82
Documentation and Records ndash EPA Element 9
Slide Number 84
Slide Number 85
Slide Number 86
Slide Number 87
Slide Number 88
Slide Number 89
Slide Number 90
Slide Number 91
Slide Number 92
Slide Number 93
Slide Number 94
Slide Number 95
Slide Number 96
Slide Number 97
Slide Number 98
Slide Number 99
Slide Number 100
Site ID
Site Name
Town
Rationale
Lat
Lon
Deerfield River Mainstem and Branches
VT-NBD_064
East Dover Rd
Wilmington
Monitor above most ag and below golf course
4291431
-728376
VT-NBD_027
Above Wilmington Center
Wilmington
Monitor within ag and above village center
4287452
-72864
VT-NBD_020
Wilmington Center above confl w Beaver Brk
Wilmington
Monitor for high bacterianutrients and Beaver Brk contribution
4286816
-728721
VT-NBD_018
Wilmington Center below confl w Beaver Brk
Wilmington
Swim holehigh bacterianutrients
4286875
-728738
MA-DFR_289
Shunpike Rest Area
Charlemont
Monitor Deerfield River coming from VT
426363
-729071
MA-DFR_276
Above Charlemont Center
Charlemont
Bracket WWTF Mill Brk
426271
-728853
MA-DFR_267
Charlemont Center
Charlemont
Bracket WWTF Mill Brk
426262
-728685
MA-DFR_011
5 amp 10 Bridge
Greenfield
Monitor Deerfield contributions to CT River
4256975
-725922
North River
VT-EBN_150
Above Jacksonville WWTF
Whitingham
Bracket WWTF
42787
-728163
VT-EBN_147
Below Jacksonville WWTF
Whitingham
Bracket WWTF
4278456
-728128
MA-EBN_024
Foundry Village Rd Ballfields
Colrain
Swim hole
4267478
-726966
MA-NOR_001
Formerly Sunburn Beach
Colrain
Mouth of North River
4265286
-727141
Green River Watershed
VT-PND_001
Mouth of Pond Brook
Halifax
Green River reclassification in support of Green River Watershed Alliance grant
428135
-727243
VT-GRN_234
Hinesburg Rd
Guilford
Green River reclassification in support of Green River Watershed Alliance grant
4279717
-726804
VT-HBG_001
Mouth of Hinesburg Brook
Guilford
Green River reclassification in support of Green River Watershed Alliance grant
4279582
-726605
VT-GRN_202
Green River Timber Crib Dam swim hole
Guilford
Swim HoleGreen River reclassification in support of Green River Watershed Alliance grant
4277555
-726673
VT-GRN_168
MAVT State Line
Guilford
Green River reclassification in support of Green River Watershed Alliance grant
4273299
-726761
MA-GRN_098
Bare Ass Beach
Greenfield
Swim Hole
4265102
-726235
MA-MPL_001
Mouth of Maple Brook
Greenfield
ID source of bacterianutrients
4258667
-726124
MA-GRN_020
Mohawk Trail Bridge
Greenfield
ID source of bacterianutrients
4258554
-726117
MA-GRN_008
Pretty Plain Rd
Greenfield
Monitor Green River contributions to Deerfield River high bacterianutrients
4257636
-725984
Other Tributaries
VT-
ELS_002
Ellis Brook TBD
Wilmington
Monitor below WWTF
429202
-728381
VT-COB_003
Cold Brook Above confl with N Br Deerfield
Wilmington
General water quality monitoring effect of Mt Snow pond
4289928
-728595
VT-BVR_029
Near Shearer Hill Rd
Wilmington
Monitor for runoff
42855
-728385
VT-BVR_011
Off Rte 9 near Wahoorsquos
Wilmington
Monitor for high bacteriarunoff
4286523
-728588
MA-CHI_001
Chickley River Tower Rd
Charlemont
Monitor contributions to Deerfield River
4263005
-729016
MA-MBK_001
Mill Brook TBD
Charlemont
Monitor mouth for contribution
426271
-728728
MA-CLS_003
Clesson Brook Buckland Rec Area
Buckland
Swim hole monitor contributions to Deerfield River
4 Data Quality Objectives and Indicators (with clear table of DQIs)
A7 Quality Objectives and Criteria
8 Training Requirements
6 Training and Specialized Experience
A8 Special TrainingCertification
9 Documentation and Records
7 Documents and Records
A9 Documents and Records
MEASUREMENTDATA ACQUISITION
COLLECTING THE DATA
GROUP B DATA GENERATION AND ACQUISITION ELEMENTS
10 Sampling Process Design (including SOP citations sampling locations)
9(A) Sampling Methods (including methods locations sampling frequency quality control measures broken out by samplemonitoring type)
B1 Sampling Process Design (Experimental Design)
11 Sampling Methods Requirements (includes equipment containers preservation hold times sample type any decontamination)
9(B) Sampling Methods ndash Data Collection Methods (including parameters locations type of QC number of samples SOPs rationale
B2 Sampling Methods
12 Sampling Handling and Custody
9 Sampling Handling (includes sample ID process)
B3 Sample Handling and Custody
13 Analytical Methods Requirements
12 Analytical Methods (includes containers and preservation)
B4 Analytical Methods
14 Quality Control Requirements
13 Field and Laboratory Quality Control
B5 Quality Control
QAPP
The Quality Assurance Project Plan is ldquoa document that outlines the procedures and measures used to ensure the quality of the data when collecting and analyzing the samples and managing the data ldquo - ALLARM
SAMPLING AND ANALYSIS PLAN
A document that outlines the field and lab procedures followed in the monitoring program Usually specific to a monitoring year
STANDARD OPERATING PROCEDURES
An SOP is a document that describes in detail how to take samples or measurements in the field or how to perform a laboratory analysis
DATA QUALITY OBJECTIVES
DQOs are the qualitative and quantitative terms used to describe how good your data needs to be to meet project objectivesldquoCollect water quality data to determine the likelihood that waterbodies in the Blackstone River Watershed meet state water quality standardsrdquo
ParameterField
Precision(RPD)
Lab Precision (RPD)
Accuracy (R)
Field Blank Cleanliness
Water ColumnTotal Phosphorus le 30 le 20 80-120 lt RL
WATER QUALITY MONITORING PLANNING PROCESS
MONITORING PROGRAM ACTIVITIES
bull BEFORE SAMPLING BEGINS
bull DURINGIMMEDIATELY AFTER SAMPLING
bull AFTER SAMPLING amp ANALYSIS
- Study Design - QAPP- Training
- Sample Collection- Lab Analysis
- Data Management- Data Analysis- Data Review Validation amp Verification- Data Submission (optional)- Data Presentation- Program Evaluation
WHY DO YOU NEED (WHO GIVES) A QAPP
bull As a guidance document to clearly outline monitoring objectives how data will be used what steps are needed to meet your goals and Data Quality Objectives
bull Regardless of what your goals are developing a QAPP ensures you will collect data that can be used for its intended purpose
bull If want data to be used by DEP having an approved QAPP is a requirement
bull May be required to have a QAPP to obtain monitoring grants from the State of Massachusetts or from EPA
Up-front time spent writing a QAPP will save a great deal of time and headaches throughout the sampling year
STEPS TO QAPP DEVELOPMENT
This session will cover
The process of writing a QAPP
Details on major elements or sections of QAPPbull What each meansbull What to includebull Where to obtain needed information how to decide what to write
Supporting Documents
STEPS TO DEVELOPING A QAPP
1 ESTABLISH A QAPP TEAM
2 DETERMINE THE GOALS AND OBJECTIVES OF YOUR PROJECT
3 COLLECT BACKGROUND INFORMATION
4 REFINE YOUR PROJECT
5 DESIGN YOUR SAMPLING ANALYTICAL AND DATA REQUIREMENTS
14 Quality Control Requirements 13 Field and Laboratory Quality Control B5 Quality Control
Comparison of Guidance Documents - Continued
Elements of a QAPPProject Management1 Title and Approval Page2 Table of Contents3 Distribution List4 ProjectTask Organization5 Problem Identification Background6 ProjectTask Description7 Data Quality Objectives for Measurement Data8 Training RequirementsCertification9 Documentation and RecordsMeasurementData Acquisition10 Sampling Process Design11 Sampling Methods Requirements12 Sample Handling and Custody13 Analytical Methods Requirements14 Quality Control Requirements15 InstrumentEquipment Testing Inspection and Maintenance Requirements16 Instrument Calibration and Frequency17 InspectionAcceptance Requirements for Supplies18 Data Acquisition Requirements19 Data ManagementAssessment and Oversight20 Assessment and Response Actions21 ReportsData Validation and Usability22 Data Review Validation and Verification23 Validation and Verification Methods24 Reconciliation with Data Quality Objectives
STEPS TO DEVELOPING A QAPP
1 ESTABLISH A QAPP TEAM
2 DETERMINE PROJECT GOALS amp OBJECTIVES
3 COLLECT BACKGROUND INFORMATION
4 REFINE YOUR PROJECT
5 DESIGN SAMPLING ANALYTICAL amp DATA REQUIREMENTS
6 DEVELOP IMPLEMENTATION PLAN
7 DRAFT SOPS AND QAPP
8 SOLICIT FEEDBACK ON SOPS AND QAPP
9 REVISE SUBMIT FOR FINAL APPROVAL
10 BEGIN YOUR MONITORING PROJECT
11 EVALUATE AND REFINE YOUR QAPP
Elements of a QAPPProject Management1 Title and Approval Page2 Table of Contents3 Distribution List4 ProjectTask Organization5 Problem Identification Background6 ProjectTask Description7 Data Quality Objectives for Measurement Data8 Training RequirementsCertification9 Documentation and RecordsMeasurementData Acquisition10 Sampling Process Design11 Sampling Methods Requirements12 Sample Handling and Custody13 Analytical Methods Requirements14 Quality Control Requirements15 InstrumentEquipment Testing Inspection and Maintenance Requirements16 Instrument Calibration and Frequency17 InspectionAcceptance Requirements for Supplies18 Data Acquisition Requirements19 Data ManagementAssessment and Oversight20 Assessment and Response Actions21 ReportsData Validation and Usability22 Data Review Validation and Verification23 Validation and Verification Methods24 Reconciliation with Data Quality Objectives
Elements of a QAPP ndash Suggested completion order
Data Quality Objectives for Measurement Data (7)Sampling Process Design (10) Sampling Methods Requirements (11) Sample Handling and custody Requirement (12)Analytical Methods Requirements (13) Quality Control Requirements (14)
InstrumentsEquipment Testing Inspections and Maintenance Requirements (15)Instrument Calibration and Frequency (16)Inspection Acceptance Requirements for Supplies (17)Training Requirements Certification (8)
Elements of a QAPP ndash Suggested completion order continued
Documentation and Records (9) Data Management (19)Data Acquisitions Requirements (18)
Data Review Validation and Verification Requirements (22)Validation and Verification Methods (23)Reconciliation with Data Quality Objectives (24)
Reports (21)
Assessment and Response Actions (20)
Project Task Organization (4 final version) Distribution List (3) Title and Approval Page (1)Table of Contents (2)
Problem Identification BackgroundEPA Element 5
A Problem Definition ldquoThis section describes the environmental problem question or threat to be addressed explains why this work needs to be done and provides a framework for determining the project purpose the use of the data and the project objectivesrdquo
B Background
ldquoThis is an opportunity to describe the history of the project (or environmental problem) relevant previous studies and how this project fills in a data gap (including from existing data) or complements existing informationrdquo
- Citizen Science Quality Assurance and Documentation EPA 2019
Problem Identification BackgroundEPA Element 5
From MA VM QAPP Guidebook
bull Describe your organizationbull Describe your watershed and waters of interestbull Describe the current status of your waters of interestbull State water quality issues of concernbull Describe information needed to address the concernbull List your monitoring questionsbull What are your monitoring purposesbull List intended users uses of information you collect
5 Background of DRWA Volunteer Bacteria Monitoring Program Deerfield River Watershed Association QAPP 2019
The Deerfield River Watershed encompasses approximately 665 square miles Thehellip River is widely regarded as one of the coldest and cleanest rivers in Massachusetts and attracts many sport-fishermen and whitewater enthusiasts However nonpoint source pollution has degraded segments hellip and poses a threat to other tributaries The DRWA has intermittently monitored the water quality hellip since 1990 to document the current quality of the watershed
hellip DRWA started monitoring fecal coliform bacteria at popular recreation sites to provide data in the intervening years [between DEP monitoring schedules] hellip In 1999 DRWA monitored bacteria above and below hellip WWTPs and at a few recreational siteshellip high counts of bacteria were recorded from at least one hellip site exceeding the Massachusetts Surface Water Quality Standards Class B standards This finding prompted a focused examination of bacteria levels in 2003 However concerns of impairment hellip persist According to the Massachusetts Year 2016 Draft Integrated List of Waters the lower nineteen miles of the mainstem and four important tributaries of the Deerfield are assigned to Category 5 Waters for pathogenshellip
5 Background of DRWA Volunteer Bacteria Monitoring Program Deerfield River Watershed Association QAPP 2019 ndash continued
DRWA resumed monitoring of bacteria in the Deerfield watershed in 2017 hellipthe Connecticut River Conservancy (CRC) provides [lab services] Through [this] support DRWA has been able to test bacteria in hellipand include testing parameters besides bacteria in Massachusetts In 2019 CRC received the bacteria grant from MA DEP that will help cover the costs of testing bacteria in the Massachusetts portion of the watershed
Problem StatementhellipMassDEP and hellip VT DEC have identified several potential sources of nonpoint pollution in the Deerfield Watershed including failing septic systems stormwater runoff road runoff from paved and unpaved roads hellipand agricultural activities in close proximity to rivers and streams
In Massachusetts approximately nineteen (19) river miles hellip have been assigned to Category 5 (waters that require a hellip (TMDL calculation)hellipother river segments remained unassessed for recreation
In Vermont there is a bacteria TMDL Monitoring over the past 2 years suggests that the TMDL area may need to be extended Vermont is on a 5-year watershed basin planning cycle The Deerfield Watershed is currently undergoing its basin planning process
Problem Identification BackgroundNeponset RWA QAPP 2019
A5-1 Watershed DescriptionThe Neponset River Watershed covers 117 square mileshellip
A5-2 Organizational BackgroundThe Neponset River Watershed Association (NepRWA) is hellip
A5-3 Sources of Impairment and Pollutants of ConcernRemaining water quality problems in the watershed include hellipCurrent pollutants of concern in the Neponset Watershed includehellip
A5-4 Past Sampling EffortsThe Massachusetts DEP completed a very comprehensive water quality assessment hellip The CWMN program has been working to fill water quality information gaps and facilitate water quality improvement for more than 20 yearshellip
Sources of Information About Massachusetts Waters
1 Mass Water Quality Standards httpwwwmassgoveeaagenciesmassdepwaterregulations314-cmr-4-00-mass-surface-water-quality-standardshtml
2 Massachusetts Water Quality Assessments ldquoLook here for reports on the condition of watersheds in Massachusettsrdquo httpwwwmassgoveeaagenciesmassdepwaterwatershedswater-quality-assessmentshtml3
3 Integrated List of Waters httpswwwmassgovlistsintegrated-lists-of-waters-related-reports4 TMDLs httpwwwmassgoveeaagenciesmassdepwaterwatershedstotal-maximum-daily-loads-tmdlshtml25 Older Water Quality Assessment Reports httpwwwmassgoveeaagenciesmassdepwaterwatershedswater-
quality-assessmentshtml3
Deerfield River Basin
Program Goals and Objectives Part 2 of EPA Element 5
A5 Program Goals and Objectives - DEP
Project Purpose- DRWA
Objectives of Project
The principal objectives of projects under this QAPP are to 1) provide a perspective on the range of water quality conditions for recreation in the Deerfield River watershed across Vermont and Massachusetts 2) describe water quality conditions of individual tributaries and the mainstem 3) establish a database for use in documenting future changes in water quality and 4) educate and involve residents in waterbody protection
Toward those objectives DRWA will monitor 29 sites for E coli sampling during the recreation season June through September This project includes conducting a water quality monitoring program for E coli in the Vermont and the Massachusetts portions of the watershed where pathogens have been detected during previous sampling efforts undertaken by MassDEP and VT DEC
Project Purpose- DRWA
B Intended Uses of Data
The data generated under this QAPP will serve the following uses
- Use in the MassDEP CWA Integrated Report
- Document the presence and severity of bacteria as pathogen indicators
- Educate school children and local communities about water quality and any problems and improvements
- Evaluate the effectiveness of restoration projects and other management activities
A56 Program Goals and Objectives ndash NepRWANepRWArsquos CWMN program seeks to accomplish the following during the period 2019-2021
- Regularly collect in-stream water quality samples at a handful of ldquoindicator sitesrdquo that represent overall water quality conditions and trends
- Regularly collect in-stream water quality samples at a larger number of ldquosubwatershed sitesrdquo that target known or suspected problem areas
- Conduct ldquofollow uprdquo and ldquospecial studyrdquo investigations and sampling as needed to confirm and further specify suspected problem or opportunity areas identified through the regular sampling program
- hellip
- Collect in-stream samples during rainfall events
- Distribute results promptly to municipal officials state and federal regulators and the general public as a means to increase understanding of water pollution issues
- Using fully sterile methods collect data needed to help implement recommendations of the Total Maximum Daily Load (TMDL) for bacteria
- Generate data to help enhance the effectiveness of municipal state federal and private efforts to improve water quality
Monitoring Objectives amp DWM-DEP Data Levels
EducationalStewardship-levelbull Objective is to engage volunteers in monitoring to develop better understanding
of the importance of water resources and to encourage their fellow citizens to take an active role in the preservation and restoration of their local water bodies and watersheds
Screening-level bull Typically used to direct future sampling efforts and as supporting evidence only
RegulatoryAssessment-levelbull Directly usable for 305(b) and 303(d) decision-making bull Scientifically sound and legally-defensible bull Contingent on review and approval these data can help determine if a water body
is meeting water quality standards or is impaired
Monitoring Objectives amp DWM-DEP Data Levels
Project Task Description ndash EPA Element 6
In general terms describe bull The work your staffvolunteers will perform bull Where it will take placebull What kinds of samples will be takenbull What kinds of conditions will be measuredbull How you will evaluate results
DRWA Project PurposeTask Description
C Brief Description of Project- There will be a training and orientation meeting held in March organized by VTDEC but
held at VAEL - Volunteers will be trained annually prior to the start of the sampling season- River water samples will be collected at 29 sites 6 times between June and September- The project will employ the Colilert System developed by IDEXX laboratories Inc to assay
E coli bacteria Samples will be analyzed at the CRC laboratory- Data will be analyzed and reviewed for quality assurance summarized and interpreted on
an annual basis - Data that meet project quality objectives will be submitted to MassDEP and entered in the
VTDECrsquos Water Quality data management system as well as the EPArsquos national water quality data storage system known as STORET
- Information will be presented to the local community in a suitable format be it a press release public meeting or another event
- A report will be prepared and shared with the distribution list in this QAPP and published on the DRWA website (deerfieldriverorg)
Site ID Site Name Town Rationale Lat Lon Deerfield River Mainstem and Branches
VT-NBD_064
East Dover Rd Wilmington Monitor above most ag and below golf course
4291431 -728376
VT-NBD_027
Above Wilmington Center
Wilmington Monitor within ag and above village center
4287452 -72864
VT-NBD_020
Wilmington Center above confl w
Beaver Brk
Wilmington Monitor for high bacterianutrients and
Beaver Brk contribution
4286816 -728721
VT-NBD_018
Wilmington Center below confl w
Beaver Brk
Wilmington Swim holehigh bacterianutrients
4286875 -728738
MA-DFR_289
Shunpike Rest Area Charlemont Monitor Deerfield River coming from VT
426363 -729071
MA-DFR_276
Above Charlemont Center
Charlemont Bracket WWTF Mill Brk 426271 -728853
MA-DFR_267
Charlemont Center Charlemont Bracket WWTF Mill Brk 426262 -728685
MA-DFR_011
5 amp 10 Bridge Greenfield Monitor Deerfield contributions to CT River
PrecisionThe degree of agreement among repeated measurements of an indicator on separate samples collected as close as possible in time and place
It does not mean that the sample actually reflects the ldquotruerdquo value but rather that your sampling and analysis are giving consistent results under similar conditions
AccuracyAccuracy or Bias is a measure of confidence that describes
how close a measurement is to its ldquotruerdquo value
Parameter Reporting Limit
Accuracy ( Recovery)
Field Precision (RPD)
Expected Range
E coli 1 MPN 100ml
Blanks and negatives show no colonies positives show colonies
30 of log10 transformed MPN
0-2420 MPN
These objectives will be measured as follows
Field Specific Quality Controls
10 of samples collected (3 per event in 2019) will be field blanks Sterile water poured into sterile sample bottle in the field These must register lt1 for total coliform and E coli
10 of samples collected (3 per event in 2019) will be field duplicates A second sample will be collected at the same location by the volunteer These will have a Relative Percent Difference of le 30 for log transformed e values
Laboratory Sample Batch-Specific Quality Control Samples With each new batch of samples run CRC will perform the following QC sample analysis
1 Lab Blank - Sterile water1 Positive Culture Control -sterile buffer dilution water inoculated with E coli (ie total coliform amp E coli positive)1 Negative culture Control -sterile buffer dilution water inoculated with non-fluorescent Pseudomonas sp (ie
total coliform amp E coli negative) 1 Lab Duplicate ndash 250 mL sample split into 2 100 mL samples in the lab
DRWA Data Precision and Accuracy
REPRESENTATIVENESS
Representativeness is the extent to which measurements actually represent the true environmental condition
You will state that- Sampling sites were selected to appropriately capture
- the general characteristics of the water body- or specific impacts if you are conducting an impact assessment (eg above amp
below suspected pollution sourceshellip)- The sample collection point is appropriate eg mid-stream mid-lake etc what
sampling depth - Number of sites is adequate to answer study question- The parameters monitored are relevant to the type of impact or to a general
WQ assessment- Sample collection timing and frequency are selected to capture data that are
representative of target conditions (eg various water levels weather seasons)
MassDEP - RECOMMENDED MINIMUM SAMPLE NUMBER FREQUENCY AND TIMING FOR EXAMPLE PARAMETERS
Parameter
Streams Lakes
Min Sample Number and Frequency
Sampling Period Min Sample Number and Frequency
Sampling Period
DO (discrete) 5 results pre-dawn June - September 3 results (epilimnetic) June - September
DO (continuous) 3o days June - September 3o days June - September
pH 5 results June - September 3 results (epilimnetic) June - September
Temperature (discrete) 5 results afternoon June - September 3 results (epilimnetic) June - September
Temperature (continuous) 3o days June - September 3o days June - September
Bacteria (eg E coli) 3-5 results (in 30-90 days) April 1-October 15 3-5 results (in 30-90 days) April 1-October 15
Nutrients (inc chl a for lakes) 5 results June- September 3 results June - September
Secchi depth --- --- 3 results June - September
Chloride 3 results 4 day period (yr-round) --- ---
ldquoCleanrdquo metals 3 results 4 day period (summer) --- ---
Misc toxics emerging contam 3 results 30 day period (summer) 3 results (epilimnetic) 30 day period (summer)
Fish community 1 survey April 1-October 15 1 survey April 1-October 15
Fish tissue contaminants (eg Hg PCBs pesticides)
1 survey Any 1 survey Any
Benthic invertebrates (RBP3) 1 survey July ndash October --- ---
Weed surveys 1 survey June- September 1 survey June- September
Aesthetics 1 survey April 1-October 15 1 survey April 1-October 15
30 days (bathing) 90 days (non-bathing) ldquoworst-caserdquo typ July-Aug
REPRESENTATIVENESS
DRWAB Data RepresentativenessSamples collected at locations and depths described in this QAPP will reflect conditions of individual water bodies and tributaries in Vermont and Massachusetts To ensure representativeness all samples will be collected preserved and analyzed according to the procedures in this QAPP and within the specified holding times
NepRWAA7-5 Data RepresentativenessSampling points will be chosen to represent the water quality within the applicable geographic area of interest Staff experienced and knowledgeable in the factors affecting water quality will choose sample points that will be representative of conditions within the area of concern
COMPARABILITY
Comparability is the degree to which data can be compared directly to similar studies There are two things to consider future studies someone might undertake and past studies you (or others) will want to compare your data with
State that you will use and document standardized - sampling amp analytical methods and units of reporting- sampling sites times and dates - sample storage and transfer
Comparability
Deerfield River Watershed Association
C Data ComparabilityAll samples for each specific parameter will be collected and analyzed using the respective procedures described in this QAPP to ensure that comparisons between different sample sites sample dates depths and projects can be appropriately made Procedures are unchanged from previous years
Neponset River Watershed Association
A7-6 ComparabilityComparability is ensured by the utilization of established sampling and monitoring protocols from Massachusetts DEP MWRA Massachusetts Water Watch Partnership the Boston Water and Sewer Commission and NepRWA and by the use of standard test methods and procedures as outlined in Appendices 6 7 and 8
Completeness
Completeness is an estimate of the amount of data you will need to answer your study question Usually expressed as a of originally planned sample events after missing sample events and data no meeting DQOs are subtracted from the planned number
DRWA
D Data CompletenessAt least 80 of the anticipated number of samples will be collected at each site analyzed and determined to meet data quality objectives for the project to be considered successful A report detailing the number of anticipated samples number of valid results and percent completion (number of valid samplesnumber of anticipated samples) will be produced
NepRWAA7-8 CompletenessIn order to obtain the best picture of the watershed NepRWA expects 90 of the routine sampling and follow up sampling samples to be collected and analyzed during each scheduled sampling event In the routine sampling program uncertainties such as weather volunteer scheduling and illness sometimes result in unavoidable omissions but every effort is made to assign backup samplers when possible
Sampling Process Design - EPA Element 10From MassWWP QAPP Guide
Purpose To describe in greater detail the design of the sampling part of your monitoring program
In Section 6 you briefly outlined the sample process design In this section you should elaborate on the rationales for those choices When you complete this section you should revisit Section 6 and revise as necessary The two sections should be in agreement
What To Include bull Indicators or measures bull Types of samplesbull Sampling frequency bull Sampling period bull How you will select sample sites and identify them over timebull Site safety plans
MADEP - RECOMMENDED MINIMUM SAMPLE NUMBER FREQUENCY AND TIMING FOR EXAMPLE PARAMETERS
Parameter
Streams Lakes
Min Sample Number and Frequency
Sampling Period Min Sample Number and Frequency
Sampling Period
DO (discrete) 5 results pre-dawn June - September 3 results (epilimnetic) June - September
DO (continuous) 3o days June - September 3o days June - September
pH 5 results June - September 3 results (epilimnetic) June - September
Temperature (discrete) 5 results afternoon June - September 3 results (epilimnetic) June - September
Temperature (continuous) 3o days June - September 3o days June - September
Bacteria (eg E coli) 3-5 results (in 30-90 days) April 1-October 15 3-5 results (in 30-90 days) April 1-October 15
Nutrients (inc chl a for lakes) 5 results June- September 3 results June - September
Secchi depth --- --- 3 results June - September
Chloride 3 results 4 day period (yr-round) --- ---
ldquoCleanrdquo metals 3 results 4 day period (summer) --- ---
Misc toxics emerging contam 3 results 30 day period (summer) 3 results (epilimnetic) 30 day period (summer)
Fish community 1 survey April 1-October 15 1 survey April 1-October 15
Fish tissue contaminants (eg Hg PCBs pesticides)
1 survey Any 1 survey Any
Benthic invertebrates (RBP3) 1 survey July ndash October --- ---
Weed surveys 1 survey June- September 1 survey June- September
Aesthetics 1 survey April 1-October 15 1 survey April 1-October 15
30 days (bathing) 90 days (non-bathing) ldquoworst-caserdquo typ July-Aug
Deerfield River Watershed Association
10 Sampling Process Design
Sampling sites were selected to represent locations that receive heavy human use from swimmers boaters anglers and other contact recreational users
Samples will be collected bi-weekly from late June through early September (prime recreation period) between 10 AM and 1 PM Samplers will first fill out their field data sheet They will then collect a water sample away from the edge of the stream near the center of the stream (centroid of flow) and just below the surface following the MWWP protocol (available in the Appendix)
Samplers will place their samples immediately in a cooler with ice or frozen ice packs making sure the temperature in the cooler is at 4degC or lower Each sample bottle will be placed in an individual clean Ziploc bag to avoid cross contamination
Neponset River Watershed Association
B1 Sampling Process Design
The CWMN program is designed to develop and maintain a record of general water qualitythroughout the watershed Project goals include both evaluation of long-term changes over time across the watershed as a whole and the identification of pollution hotspots at a low order subwatershed scale
Routine sampling activities consist of collecting in-stream samples As discussed above routine sampling sites are divided among ldquoindicatorrdquo sites and ldquosubwatershed sitesrdquo in order to meet the dual objectives of the program Indicator sites are selected to be representative of overall water quality and are relatively unchanging over time to allow comparison to past and future investigations Sites have generally been selected at the downstream ends or key segmentation points of major subwatersheds and at or near locations where there is a longstanding data record
Neponset River Watershed Association
B1 Sampling Process Design ndash continued
Subwatershed sites are selected to provide higher spatial resolution along individual streams in an effort to bracket pollution sources and facilitate their identification and remediation Subwatershed sites make up roughly 60 of the overall number of sites and are more likely to change from year to year Subwatershed sites may be rotated through different watersheds over the course of several sampling seasons to provide detailed data on different subwatersheds over a period of years Specific sites are selected by the project manager on the basis of known or suspected problems or opportunities or to fill in a lack of detailed data in a specific area
Neponset River Watershed Association
B1 Sampling Process Design ndash continued
In addition to the routine sampling activities CWMN also encompasses follow up and special study sampling activities These are generally ldquoone-timerdquo investigations intended to zero in on pollution sources in a known or suspected problem areahellipSpecific sampling stations may be planned in advance or may be chosen opportunistically by samplers while in the field
The mix of parameters sampled at each site depends on its status as an indicator subwatershed or follow up station the relative location of the station in the watershed and the specific pollutant(s) of concern at that specific location Indicator sites are tested for bacteria nutrients ammonia and field measured parametershellip Subwatershed sites are generally tested for bacteria total phosphorus and field measured parameters At some subwatershed sites hellip Follow up sampling stations will generally be tested for a very narrow set of parameters based on the specific pollutant of concern A listing of current routine sampling stations and the parameters sampled is provided in the Appendix 1e
Sampling Methods Requirements - EPA Element 11
This section describes your field measurementsample collection methods It can be stated in table form with narrative descriptions if you choose
Includebull What parameters are being sampledbull Sampling containersdevices sample preservation steps Maximum holding timebull Amount of sample to be collectedbull Summarize steps taken by field samplersbull Reference to the method followed (cite specific SOPS include in appendices)bull Can also include sampling considerations (eg time of day steps taken to avoid stirring up
sediments sample collection depth etc) These will be detailed in SOPs
Deerfield River Watershed Association
ParameterMeasure Container Field Rinse Preservation Hold Time E coli 120 mL IDEXX
Cool to lt4degC 6 hours to lab 8 hours to processing
B2 Sampling Methods
B2-2 Visual ObservationsB2-3 Fecal Coliform E coli and EnterococcusB2-5 NutrientsB2-6 Specific Conductance and SalinityB2-7 TemperatureB2-8 pH B2-9 Dissolved OxygenB2-10 SurfactantsB2-11 Depth and FlowB2-12 Optical BrightenersB2-13 Qualitative Ammonia Nitrogen
Neponset River Watershed Association
Sample Handling and Custody Requirements - EPA Element 12
Demonstrate that your sampling handling and storage techniques will retainsafeguard the integrity of your samples and data records
12 Sample Handling and Custody Procedures
Samples will be collected between 7 AM and 10 AM on sampling days The samples will be kept on ice inside a cooler during transport Wilmington VT area samples will be picked up by the monitoring assistant in the Main Street parking lots or other agreed upon meeting location by 9 AM Green River VT samples will be picked up by the transporting volunteer at the Green River covered bridge or other agreed upon meeting location by 930 AM The remaining samples will be delivered directly to the CRC water quality lab by 10 AM Any exchange of possession in the samples will be documented on the Chain of Custody (CoC) form which will be completed and signed by the Lab Analyst upon receipt at the lab The CoC form will be checked by the program coordinator See Appendix for the CoC
Deerfield River Watershed Association
Analytical Methods Requirements - EPA Element 13
Deerfield River Watershed Association
13 Analytical Methods Requirements
All analytical determinations will be performed at the CRC lab in Greenfield by the Lab Director Gabriel Chevalier
Indicator
Method Number
Source
Reporting Units
Modifications or Options
E coli
United water laboratory 1603 Bacteria Colilert SOP 604b CRWC 03-11-10
EPA 1603 (Modified m-TEC)
1 MPN
Sodium Thiosulfate used in all containers
Neponset River Watershed Association
Massachusetts Volunteer Monitorrsquos Guide to QAPP DevelopmentPAGE 61
Here are some things to consider in choosing a method Scientific Considerations Does it meet your data quality objectives
How accurate is it How precise (reproducible) is it What is its detection limit
Will it measure the indicator in the range that you need What lab facilities are required What equipment is required Does it yield samples that are representative Is it comparable to methods used by agencies collecting similar information
Practical and Program Considerations bull Do you have the human and financial resources to do it bull How difficult is it bull How time-consuming is it bull Will it produce data useful to the target audience
Quality Control ndash EPA Element 14
This section documents that the specific quality control measures you will take will allow you to determine whether you meet your data quality objectives
What To Include Section 7 stated your DQOs Here you describe how you are going to meet them
For each indicator include the following information
bull Accuracy Precision checks list what checks you will perform
bull List the of your samples upon which you will perform quality checks that will represent the quality of all your samples
Quality Control
Accuracy checks
There are a variety of ways to check the accuracy of your sampling and analysis
Checks can be done internally (done totally within your project lab) or externally (done with the assistance of an independent lab)
Known Samples This is an internal check that compares your results against another analyst or a ldquoknownrdquo An example of a known is a quality assurance sample that UMass WRRC sends to VM groups for pH DO or alkalinity ndash with the expected value communicated when sample is sent
Proficiency Testing (Unknown) Samples In some cases there are programs that provide proficiency testing samples for laboratory performance evaluation the concentrations of which are known to the auditor but not to the lab being tested This is relatively common for most water chemistry indicators An example of an unknown would when WRRC sends a quality assurance sample without communicating the expected value in advance
Quality Control
Accuracy checks - continued
Blank and Positive Plates Bacteriological samples should be checked using the blank and positive plate procedure The blank plate uses the rinse water media and equipment in the analysis to determine if there is contamination in the laboratory materials The result should be 0 The positive plate procedure uses a sample known to contain bacteria (eg waste- water treatment plant influent) to determine if a procedural error in the lab causes inhibition of bacterial growth Results should be rdquoToo Numerous To Countrdquo Each batch of samples should include at least one blank and one positive check sample This is an internal check
Spiked Samples Spikes are additions of a known amount of the indicator with the expectation that subsequent analysis will measure exactly that much increase over the un- spiked sample This procedure is described in Section 1020 B of Standard Methods This is an internal check
Voucher and Reference Collections For macroinvertebrates and aquatic plants maintenance of a voucher andor a working reference collection is recommended A voucher collection is a preserved collection of the type specimens ie an example of each of the individual taxa that you have given a name It should be maintained in archival condition by a trained curator typically found at a university A reference collection is an exact duplicate of the voucher collection but is the one that you will regularly use as a reference when identifying new specimens Both voucher and reference collections should be verified by an expert This is an external check Alternatively have an expert review IDs made by volunteers of at least 10 of specimens collected 90 accuracy is recommended
Quality Control
Precision Checks
Precision checks are primarily accomplished through replicate sampling amp analysis in the field and lab
Field Replication Replication can be done by the same field collectors but some replication by other collectors is good eg a pair of field collectors swapping roles or have different team collect the replicate This is an internal check
Lab Replication Additional replication should occur in the lab Lab replication is done by dividing a well-mixed sample into two or more aliquots and conducting analysis on each aliquot This is an internal check
Split Samples Split samples (a sample that is split into two sub-samples) can be done in the field or the lab
Relative Percent Difference
A measure of precision used for duplicate sample results It is calculated by dividing the difference between the two results by the mean of the two results expressed as a percentage Used when sample number equals two
eg ((98-92) 100) ((98+92))2 = 63
Deerfield River Watershed Association
14 Quality Control RequirementsA Volunteers Check - Field AuditEither the QC Officer the Project Coordinator or both will accompany a crew of volunteers (each) to their site each collection The trainers will observe the volunteersrsquo performance and check their sampling technique and field data sheets for accuracy
B Field QC ChecksAt least one Field Duplicate and one Field Blank will be submitted for every ten samples collected
Field Duplicate ndash a check on water quality sampling amp analysis consistency This is a replicated sample collected at the same point in time and space side by side with the first sampling and given a separate Sample ID number
Field Blanks ndash a check for contamination (AccuracyBias) in the field by processing laboratory-supplied deionized water through the sampling train This checks for contamination introduced from the sample container(s) or from field contamination A Field Blank will be taken by one volunteer at one site per sampling day for bacteria A container of DI water will be given to the volunteer who will pour this DI water into the sample bottle at the site
We will rotate the field duplicate and field blank samples among the volunteers throughout the sampling season so a maximum of collectors can be checked
Deerfield River Watershed Association
14 Quality Control Requirements ndash continued
C Laboratory QC ChecksA Lab Duplicate will be analyzed each sampling day The lab will split a randomly chosen sample and analyze both subsamples
The lab will run a Lab Blank and a Positive Sample for bacteria each collection (see section 7)
D Data Analysis QC ChecksRiver data and QC data will be reviewed by the QC Officer as soon as they come in from the lab after each collection QC data will be compared to the quality objectives (eg blanks should have zero colonies sample duplicates should be within 3 standard deviations of the mean positives should show bacterial growth etc) River data will be reviewed as well to ensurethat no field or lab contamination has occurred (data will be compared to those of other sites and of previous collections)
Bacteria computations will be checked and validated If discrepancies are found the Lab Director will be called to resolve the discrepancy and corrections will be made by the QC Officer
Field data sheets will be also reviewed the day of collection by the Project Coordinator and later by the QC Officer to ensure that samples were taken at the right times and that all the required information has been filled out The Project Coordinator or collectors will be called if omissions or errors are detected If needed corrections will be made (signed anddated) on the field sheet by the QC Officer
Neponset River Watershed Association
PRECISION DQOS DEALING WITH LOW-LEVEL CONCENTRATIONS
Source Analyte Units PrecisionMassDEP WPP Monitoring QAPP
Training Requirements Certification ndash EPA Element 8
In Narrative or Table Format
bull List type of training (eg Field WQ lab analysis visual observation data mgt data entry etc)
bull Who is training who receives training
bull How often training done
If training records are kept (they should be) include that in section 9 on documentation and records
Neponset River Watershed Association
A8 Training - ExcerptTo ensure the high quality and usability of the data that is generated by the CWMN program all participants receive training appropriate to the tasks for which they will be responsible NepRWA staff that are involved in the program are professionals with extensive training in water quality chemistry biology and field sampling NepRWA has established a program of training for volunteers that includes initial training follow-up and refresher classes These classes are given by NepRWA staff that are qualified not only in the technical matter covered but in training and education
The initial training for volunteer monitors is primarily instruction and demonstration by the trainer with repetition by the volunteer This training includes an overview of the entire project and detailed instruction in sampling procedures All monitors receive and review a copy of NepRWArsquos Water Monitoring and Sampling Manual (see Appendix 3a)
After their initial training all volunteers participate in a mandatory annual group andor individual training session These sessions are designed to update the volunteers on changes in the program further train them in equipment calibration and field-testing procedures and evaluate each volunteerrsquos performancehellip
InstrumentEquipment Testing Inspection and Maintenance Requirements ndash EPA Element 15
Instrument Calibration and Frequency ndash EPA Element 16
InspectionAcceptance Requirements for Supplies ndash EPA Element 17
DOCUMENTATION AND RECORDS ndash EPA ELEMENT 9
Neponset River Watershed AssociationA9 Documents and RecordsA9-1 Data SheetsField data sheets include information about the site location (NepRWA ID number) which specific equipment was used to make measurements (thermometer number) the sampling method used (direct fill pole or Bridge Buddy) and equipment calibration results The field data sheets are also used to record temperature velocity depth color odor and turbidity information (Appendix 4e)helliphellip See Appendix 4 for copies of the various data sheets used in the CWMN program
A9-2 Chain of Custody FormsA9-3 Sample LabelingA9-4 Equipment Custody FormA9-5 Training and Evaluation Form
Data Acquisition Requirements - EPA Element 18
Purpose To ensure that any data you use but donrsquot collect yourself has a known data quality and is consistent with your data quality objectives that others can access these data and that your use of the data is appropriate
Describe any external data you use such as GPS coordinates for site locations weather station rainfall amounts etc
Include bull The title of the document or name of the informationbull Where you obtained it and where others may find itbull Notes on the quality of the outside information such as uncertainties and caveats
Preamble to Elements 19 through 24
Consider the four separate objectives of these chapters1) Producing a good data set - 19 covers the normal data mgt routines you do to prevent data mistakes in the first place- 22 amp23 describe how you review the resulting data sets - how you find and correct
missing or erroneous data - 19 22 and 23 should produce as complete amp accurate a data set as possible 2) Ensuring that any use you make of your data is justified In 24 you decide how usable your data are Review the final data set that the above efforts have produced Compare it with your DQOs to determine whether you have to discard or qualify any data what conclusions you can draw from your data or what changes you might need to make in your DQOs3) Improve overall project performance 20 deals with how well volunteers laboratories and equipment are operating It looks at function not outcomes Who evaluates the various components of your program when problems are found what corrections are made to make your program run better4) Report your results After yoursquove run these various checks you are ready to release your data In Chapter 21 you describe the reports you will issue
Suggested order bull Data Management (19)bull Data Review Validation and Verification Requirements (22)bull (Data) Validation and Verification Methods (23)
bull Reconciliation with Data Quality Objectives (24)
bull Assessment and Response Actions (20)
bull Reports (21)
EPA Elements 19 ndash 24
bull Data Management (19)bull Assessment and Response Actions (20) bull Reports (21)bull Data Review Validation and Verification Requirements (22)bull (Data) Validation and Verification Methods (23)bull Reconciliation with Data Quality Objectives (24)
Data Management ndash EPA Element 19
Follow the data from the moment itrsquos recorded through every step to final report databaseIntent is to prevent errors or loss of data or be able to correct in timely manner
bull Before each activitystep is conducted well-designed field sheets checklists COC forms data entry software auto-QC calculations out-of-bounds highlights etc
bull During each step sheets filled completely checklist reviewed before leaving site etc
bull Immediately after Computer-entered data compared with field sheets etc
bull Long term preservation Data storage
Neponset River Watershed Association
B9 Data ManagementThe Project Manager is responsible for overseeing all data management activities Refer also to section D below for additional discussion of data review verification and validation practices
B9-1 Raw DataField data sheets are collected with the samples The sheets are turned into the NepRWA office by the site coordinators The forms are then reviewed for illegible answers errors or questionable values and checked for consistency with the COC and bottle labels as described in Appendix 3l Any questions are referred to the volunteer for clarification NepRWA staff makes corrections by crossing out the errors and writing in the correct answer All corrections must be initialed
B9-2 Data Entry and ValidationOnce the information has undergone a preliminary check it is entered into a Filemaker database The software has been customized to the data sheet Fields within the worksheet have been set-up with limits based on expected results This helps to minimize entry errors Entered data is then checked against the data sheets by another volunteer or staff person
B9-3 Data StorageThe original data sheets are filed into an event file and stored in NepRWArsquos permanent files Electronic copies of data are maintained on a secure Filemaker server Data files are kept in perpetuity along with hard copies of volunteer data sheets All electronic data is backed-up daily on to a password-protected hard drive
Data Review Validation and Verificationndash EPA Element 22
(Data) Validation and Verification Methods ndash EPA Element 23
Deerfield River Watershed Association
22 Data Review Validation and Verification ndash Summarized bullet list
All data reviewed by the Project Coordinator and QA Coordinator
Data Analysis QC Checks will includebull Data entry checks by a second personbull Computer entries compared with fieldlab sheetsbull Checks on graphs amp all other data representationsbull Calculation of measures of data quality including completeness
Corrective actionsbull Data entry errors corrected bull Data outside expected range flagged or rejected bull 2nd field sample andor laboratory aliquot taken when possiblebull Data quality problems discussed in draft and final reports
(Data) Validation and Verification Methods ndash EPA Element 23 From Inland QAPP
Validation and Verification Methods will include checks on bull Completion of all fields on data sheets missing data sheetsbull Completeness of sampling runs (eg number of sites visitedsamples taken vs number proposed were all parameters sampledanalyzed)bull Completeness of QC checks (eg number and type of QC checks performed vs numbertype proposed)bull Accuracy and precision compared to data quality objectivesbull Representativeness of samples and resulting data by examining survey metadata for unusual conditions and occurrences that may have impacted the validity of results
Deerfield River Watershed Association ndash Excerpt summarized
23 Validation and Verification Methods
The following simple measures of data quality will be calculated and included in the final report
1) To screen for contamination the average blank concentration hellip will be calculated This average value should be as close as practical to the Reporting Limit listed in Table 4
2) To assess the precision of results the ldquoMean Relative Percent Differencerdquo between field duplicate samples should be calculated The average RPD should be less than or equal to the Estimated Precision listed in Table 4 This simple measure is calculated as follows
RPD formula used hellip
Reconciliation With Data Quality Objectives ndash EPA Element 24MassWWP guide to QAPP development
What to Include bull List who will evaluate your actual data vs your data quality goals bull State how and when this will be done bull Describe the process for determining what to do if goals are not met
Neponset River Watershed Association
D2 Reconciliation with User Requirements - Summarized bulletedbull Following each sampling event and prior to the subsequent event calculations and
determinations for precision completeness and accuracy will be made bull Any corrective action will be implemented noted and initialized by the project manager bull If data quality indicators do not meet the projectrsquos specifications then data may be discarded
may be flagged or re-sampling may occur bull Investigation of problems will take place and corrections will be documented If equipment
failure is found to be the cause calibration and maintenance techniques will be reassessed Field duplicate testing may occur during the next sampling event to ensure confidence in the results
bull Any limitations on the data will be noted bull Any revisions to the project will be submitted to EPA and DEP quality assurance officers for
approval
Assessment and Response Actions - EPA Element 20 From Inland QAPP
Document that the progress and quality of the monitoring program will be continuously assessed to ensure that its objectives are being accomplished
The Monitoring Coordinator will periodically check to see the following bull Monitoring is occurring as planned bull Sufficient written commentary and supporting photographs exist bull Sufficient volunteers are available bull Volunteers have been observed as they sample their sites bull Samplers are collecting in accordance with project schedules bull Data sheets and custody control sheets are being properly completed and signed bull Data are properly interpreted bull Plans for dealing with adverse weather are in place
Assessment and Response Actions - EPA Element 20 From Inland QAPP ndash continued
The Monitoring Coordinator will periodically check to see the following bull Retraining or other corrective action is implemented at the first hint of non compliance with the
QAPP or SOPs bull Labs are adhering to the requirements of their QAPP in terms of work performed accuracy
acceptable holding times timely and understandable results and delivery process bull Data management is being handled properly ie data are entered on a timely basis is
properly backed up is easily accessed and raw data are properly stored in a safe placebull Procedure for developing and reporting the results exists
Assessment and Response Actions - EPA Element 20 From Inland QAPP ndash continued
The Monitoring Coordinator will confer with the QA Officer as necessary to discuss any problems that occur and what corrective actions are needed to maintain program integrity In addition the Monitoring Coordinator and QA Officer will meet at the end of the sampling season to review the draft report and discuss all aspects of the program and identify necessary program modifications for future sampling activities [If the program includes a technical advisory committee the TAC will be included in these discussions] Corrections may include retraining volunteers rewriting sampling instructions replacement of volunteers alteration of sampling schedules sites or methods or other actions deemed necessary All problems discovered and program modifications made will be documented in the final version of the project report If modifications require changes in the Quality Assurance Project Plan these changes will be submitted MassDEP for review
Deerfield River Watershed Association
20 Assessment and Response Actions ndash Summarized bullet list
bull There will be an on-site visit by the Quality Control Officer to observe field sampling and field analysis procedures Generally this will be done near the beginning of the project
bull A written checklist will be used for the assessments maintained by the Project Coordinator and copies will be provided with the data report
bull The Project Coordinator and QC Officer will determine if field work follows the written procedures or if there needs to be corrections by additional training or revising protocols
bull Please refer to Section 22 for additional evaluations and response actions regarding data evaluations
Reports ndash EPA Element 21
Project Task Organization ndash EPA Element 4 Reviewrevise early choices
Distribution List ndash EPA Element 3
Title and Approval Page - EPA Element 1
Table of Contents ndash EPA Element 2
Water quality monitoring quality assurance workshop
Terminology
Study design
QAPP
sampling and analysis plan
standard operating procedures
data quality objectives
Water Quality Monitoring Planning Process
Monitoring program activities
Why do you need (who Gives) a qapp
Slide Number 11
Slide Number 12
Steps to Developing a QAPP
Slide Number 14
Slide Number 15
Slide Number 16
Steps to Developing a QAPP
Slide Number 18
Slide Number 19
Slide Number 20
Slide Number 21
Slide Number 22
Slide Number 23
Slide Number 24
Sources of Information About Massachusetts Waters
Slide Number 26
Slide Number 27
Slide Number 28
Slide Number 29
Slide Number 30
Slide Number 31
Slide Number 32
Slide Number 33
Slide Number 34
Slide Number 35
Slide Number 36
Slide Number 37
Slide Number 38
Slide Number 39
Slide Number 40
Slide Number 41
Slide Number 42
Slide Number 43
Slide Number 44
Slide Number 45
Slide Number 46
MassDEP - Recommended Minimum Sample Number Frequency and Timing for Example Parameters
Slide Number 48
Slide Number 49
Slide Number 50
Slide Number 51
Slide Number 52
MaDep - Recommended Minimum Sample Number Frequency and Timing for Example Parameters
Slide Number 54
Slide Number 55
Slide Number 56
Slide Number 57
Slide Number 58
Slide Number 59
Slide Number 60
Slide Number 61
Slide Number 62
Slide Number 63
Slide Number 64
Slide Number 65
Slide Number 66
Slide Number 67
Slide Number 68
Slide Number 69
Slide Number 70
Slide Number 71
Slide Number 72
Slide Number 73
Slide Number 74
Slide Number 75
Slide Number 76
Precision DQOs Dealing with low-level concentrations
Slide Number 78
Slide Number 79
Slide Number 80
Slide Number 81
Slide Number 82
Documentation and Records ndash EPA Element 9
Slide Number 84
Slide Number 85
Slide Number 86
Slide Number 87
Slide Number 88
Slide Number 89
Slide Number 90
Slide Number 91
Slide Number 92
Slide Number 93
Slide Number 94
Slide Number 95
Slide Number 96
Slide Number 97
Slide Number 98
Slide Number 99
Slide Number 100
Site ID
Site Name
Town
Rationale
Lat
Lon
Deerfield River Mainstem and Branches
VT-NBD_064
East Dover Rd
Wilmington
Monitor above most ag and below golf course
4291431
-728376
VT-NBD_027
Above Wilmington Center
Wilmington
Monitor within ag and above village center
4287452
-72864
VT-NBD_020
Wilmington Center above confl w Beaver Brk
Wilmington
Monitor for high bacterianutrients and Beaver Brk contribution
4286816
-728721
VT-NBD_018
Wilmington Center below confl w Beaver Brk
Wilmington
Swim holehigh bacterianutrients
4286875
-728738
MA-DFR_289
Shunpike Rest Area
Charlemont
Monitor Deerfield River coming from VT
426363
-729071
MA-DFR_276
Above Charlemont Center
Charlemont
Bracket WWTF Mill Brk
426271
-728853
MA-DFR_267
Charlemont Center
Charlemont
Bracket WWTF Mill Brk
426262
-728685
MA-DFR_011
5 amp 10 Bridge
Greenfield
Monitor Deerfield contributions to CT River
4256975
-725922
North River
VT-EBN_150
Above Jacksonville WWTF
Whitingham
Bracket WWTF
42787
-728163
VT-EBN_147
Below Jacksonville WWTF
Whitingham
Bracket WWTF
4278456
-728128
MA-EBN_024
Foundry Village Rd Ballfields
Colrain
Swim hole
4267478
-726966
MA-NOR_001
Formerly Sunburn Beach
Colrain
Mouth of North River
4265286
-727141
Green River Watershed
VT-PND_001
Mouth of Pond Brook
Halifax
Green River reclassification in support of Green River Watershed Alliance grant
428135
-727243
VT-GRN_234
Hinesburg Rd
Guilford
Green River reclassification in support of Green River Watershed Alliance grant
4279717
-726804
VT-HBG_001
Mouth of Hinesburg Brook
Guilford
Green River reclassification in support of Green River Watershed Alliance grant
4279582
-726605
VT-GRN_202
Green River Timber Crib Dam swim hole
Guilford
Swim HoleGreen River reclassification in support of Green River Watershed Alliance grant
4277555
-726673
VT-GRN_168
MAVT State Line
Guilford
Green River reclassification in support of Green River Watershed Alliance grant
4273299
-726761
MA-GRN_098
Bare Ass Beach
Greenfield
Swim Hole
4265102
-726235
MA-MPL_001
Mouth of Maple Brook
Greenfield
ID source of bacterianutrients
4258667
-726124
MA-GRN_020
Mohawk Trail Bridge
Greenfield
ID source of bacterianutrients
4258554
-726117
MA-GRN_008
Pretty Plain Rd
Greenfield
Monitor Green River contributions to Deerfield River high bacterianutrients
4257636
-725984
Other Tributaries
VT-
ELS_002
Ellis Brook TBD
Wilmington
Monitor below WWTF
429202
-728381
VT-COB_003
Cold Brook Above confl with N Br Deerfield
Wilmington
General water quality monitoring effect of Mt Snow pond
4289928
-728595
VT-BVR_029
Near Shearer Hill Rd
Wilmington
Monitor for runoff
42855
-728385
VT-BVR_011
Off Rte 9 near Wahoorsquos
Wilmington
Monitor for high bacteriarunoff
4286523
-728588
MA-CHI_001
Chickley River Tower Rd
Charlemont
Monitor contributions to Deerfield River
4263005
-729016
MA-MBK_001
Mill Brook TBD
Charlemont
Monitor mouth for contribution
426271
-728728
MA-CLS_003
Clesson Brook Buckland Rec Area
Buckland
Swim hole monitor contributions to Deerfield River
4 Data Quality Objectives and Indicators (with clear table of DQIs)
A7 Quality Objectives and Criteria
8 Training Requirements
6 Training and Specialized Experience
A8 Special TrainingCertification
9 Documentation and Records
7 Documents and Records
A9 Documents and Records
MEASUREMENTDATA ACQUISITION
COLLECTING THE DATA
GROUP B DATA GENERATION AND ACQUISITION ELEMENTS
10 Sampling Process Design (including SOP citations sampling locations)
9(A) Sampling Methods (including methods locations sampling frequency quality control measures broken out by samplemonitoring type)
B1 Sampling Process Design (Experimental Design)
11 Sampling Methods Requirements (includes equipment containers preservation hold times sample type any decontamination)
9(B) Sampling Methods ndash Data Collection Methods (including parameters locations type of QC number of samples SOPs rationale
B2 Sampling Methods
12 Sampling Handling and Custody
9 Sampling Handling (includes sample ID process)
B3 Sample Handling and Custody
13 Analytical Methods Requirements
12 Analytical Methods (includes containers and preservation)
B4 Analytical Methods
14 Quality Control Requirements
13 Field and Laboratory Quality Control
B5 Quality Control
STEPS TO QAPP DEVELOPMENT
This session will cover
The process of writing a QAPP
Details on major elements or sections of QAPPbull What each meansbull What to includebull Where to obtain needed information how to decide what to write
Supporting Documents
STEPS TO DEVELOPING A QAPP
1 ESTABLISH A QAPP TEAM
2 DETERMINE THE GOALS AND OBJECTIVES OF YOUR PROJECT
3 COLLECT BACKGROUND INFORMATION
4 REFINE YOUR PROJECT
5 DESIGN YOUR SAMPLING ANALYTICAL AND DATA REQUIREMENTS
14 Quality Control Requirements 13 Field and Laboratory Quality Control B5 Quality Control
Comparison of Guidance Documents - Continued
Elements of a QAPPProject Management1 Title and Approval Page2 Table of Contents3 Distribution List4 ProjectTask Organization5 Problem Identification Background6 ProjectTask Description7 Data Quality Objectives for Measurement Data8 Training RequirementsCertification9 Documentation and RecordsMeasurementData Acquisition10 Sampling Process Design11 Sampling Methods Requirements12 Sample Handling and Custody13 Analytical Methods Requirements14 Quality Control Requirements15 InstrumentEquipment Testing Inspection and Maintenance Requirements16 Instrument Calibration and Frequency17 InspectionAcceptance Requirements for Supplies18 Data Acquisition Requirements19 Data ManagementAssessment and Oversight20 Assessment and Response Actions21 ReportsData Validation and Usability22 Data Review Validation and Verification23 Validation and Verification Methods24 Reconciliation with Data Quality Objectives
STEPS TO DEVELOPING A QAPP
1 ESTABLISH A QAPP TEAM
2 DETERMINE PROJECT GOALS amp OBJECTIVES
3 COLLECT BACKGROUND INFORMATION
4 REFINE YOUR PROJECT
5 DESIGN SAMPLING ANALYTICAL amp DATA REQUIREMENTS
6 DEVELOP IMPLEMENTATION PLAN
7 DRAFT SOPS AND QAPP
8 SOLICIT FEEDBACK ON SOPS AND QAPP
9 REVISE SUBMIT FOR FINAL APPROVAL
10 BEGIN YOUR MONITORING PROJECT
11 EVALUATE AND REFINE YOUR QAPP
Elements of a QAPPProject Management1 Title and Approval Page2 Table of Contents3 Distribution List4 ProjectTask Organization5 Problem Identification Background6 ProjectTask Description7 Data Quality Objectives for Measurement Data8 Training RequirementsCertification9 Documentation and RecordsMeasurementData Acquisition10 Sampling Process Design11 Sampling Methods Requirements12 Sample Handling and Custody13 Analytical Methods Requirements14 Quality Control Requirements15 InstrumentEquipment Testing Inspection and Maintenance Requirements16 Instrument Calibration and Frequency17 InspectionAcceptance Requirements for Supplies18 Data Acquisition Requirements19 Data ManagementAssessment and Oversight20 Assessment and Response Actions21 ReportsData Validation and Usability22 Data Review Validation and Verification23 Validation and Verification Methods24 Reconciliation with Data Quality Objectives
Elements of a QAPP ndash Suggested completion order
Data Quality Objectives for Measurement Data (7)Sampling Process Design (10) Sampling Methods Requirements (11) Sample Handling and custody Requirement (12)Analytical Methods Requirements (13) Quality Control Requirements (14)
InstrumentsEquipment Testing Inspections and Maintenance Requirements (15)Instrument Calibration and Frequency (16)Inspection Acceptance Requirements for Supplies (17)Training Requirements Certification (8)
Elements of a QAPP ndash Suggested completion order continued
Documentation and Records (9) Data Management (19)Data Acquisitions Requirements (18)
Data Review Validation and Verification Requirements (22)Validation and Verification Methods (23)Reconciliation with Data Quality Objectives (24)
Reports (21)
Assessment and Response Actions (20)
Project Task Organization (4 final version) Distribution List (3) Title and Approval Page (1)Table of Contents (2)
Problem Identification BackgroundEPA Element 5
A Problem Definition ldquoThis section describes the environmental problem question or threat to be addressed explains why this work needs to be done and provides a framework for determining the project purpose the use of the data and the project objectivesrdquo
B Background
ldquoThis is an opportunity to describe the history of the project (or environmental problem) relevant previous studies and how this project fills in a data gap (including from existing data) or complements existing informationrdquo
- Citizen Science Quality Assurance and Documentation EPA 2019
Problem Identification BackgroundEPA Element 5
From MA VM QAPP Guidebook
bull Describe your organizationbull Describe your watershed and waters of interestbull Describe the current status of your waters of interestbull State water quality issues of concernbull Describe information needed to address the concernbull List your monitoring questionsbull What are your monitoring purposesbull List intended users uses of information you collect
5 Background of DRWA Volunteer Bacteria Monitoring Program Deerfield River Watershed Association QAPP 2019
The Deerfield River Watershed encompasses approximately 665 square miles Thehellip River is widely regarded as one of the coldest and cleanest rivers in Massachusetts and attracts many sport-fishermen and whitewater enthusiasts However nonpoint source pollution has degraded segments hellip and poses a threat to other tributaries The DRWA has intermittently monitored the water quality hellip since 1990 to document the current quality of the watershed
hellip DRWA started monitoring fecal coliform bacteria at popular recreation sites to provide data in the intervening years [between DEP monitoring schedules] hellip In 1999 DRWA monitored bacteria above and below hellip WWTPs and at a few recreational siteshellip high counts of bacteria were recorded from at least one hellip site exceeding the Massachusetts Surface Water Quality Standards Class B standards This finding prompted a focused examination of bacteria levels in 2003 However concerns of impairment hellip persist According to the Massachusetts Year 2016 Draft Integrated List of Waters the lower nineteen miles of the mainstem and four important tributaries of the Deerfield are assigned to Category 5 Waters for pathogenshellip
5 Background of DRWA Volunteer Bacteria Monitoring Program Deerfield River Watershed Association QAPP 2019 ndash continued
DRWA resumed monitoring of bacteria in the Deerfield watershed in 2017 hellipthe Connecticut River Conservancy (CRC) provides [lab services] Through [this] support DRWA has been able to test bacteria in hellipand include testing parameters besides bacteria in Massachusetts In 2019 CRC received the bacteria grant from MA DEP that will help cover the costs of testing bacteria in the Massachusetts portion of the watershed
Problem StatementhellipMassDEP and hellip VT DEC have identified several potential sources of nonpoint pollution in the Deerfield Watershed including failing septic systems stormwater runoff road runoff from paved and unpaved roads hellipand agricultural activities in close proximity to rivers and streams
In Massachusetts approximately nineteen (19) river miles hellip have been assigned to Category 5 (waters that require a hellip (TMDL calculation)hellipother river segments remained unassessed for recreation
In Vermont there is a bacteria TMDL Monitoring over the past 2 years suggests that the TMDL area may need to be extended Vermont is on a 5-year watershed basin planning cycle The Deerfield Watershed is currently undergoing its basin planning process
Problem Identification BackgroundNeponset RWA QAPP 2019
A5-1 Watershed DescriptionThe Neponset River Watershed covers 117 square mileshellip
A5-2 Organizational BackgroundThe Neponset River Watershed Association (NepRWA) is hellip
A5-3 Sources of Impairment and Pollutants of ConcernRemaining water quality problems in the watershed include hellipCurrent pollutants of concern in the Neponset Watershed includehellip
A5-4 Past Sampling EffortsThe Massachusetts DEP completed a very comprehensive water quality assessment hellip The CWMN program has been working to fill water quality information gaps and facilitate water quality improvement for more than 20 yearshellip
Sources of Information About Massachusetts Waters
1 Mass Water Quality Standards httpwwwmassgoveeaagenciesmassdepwaterregulations314-cmr-4-00-mass-surface-water-quality-standardshtml
2 Massachusetts Water Quality Assessments ldquoLook here for reports on the condition of watersheds in Massachusettsrdquo httpwwwmassgoveeaagenciesmassdepwaterwatershedswater-quality-assessmentshtml3
3 Integrated List of Waters httpswwwmassgovlistsintegrated-lists-of-waters-related-reports4 TMDLs httpwwwmassgoveeaagenciesmassdepwaterwatershedstotal-maximum-daily-loads-tmdlshtml25 Older Water Quality Assessment Reports httpwwwmassgoveeaagenciesmassdepwaterwatershedswater-
quality-assessmentshtml3
Deerfield River Basin
Program Goals and Objectives Part 2 of EPA Element 5
A5 Program Goals and Objectives - DEP
Project Purpose- DRWA
Objectives of Project
The principal objectives of projects under this QAPP are to 1) provide a perspective on the range of water quality conditions for recreation in the Deerfield River watershed across Vermont and Massachusetts 2) describe water quality conditions of individual tributaries and the mainstem 3) establish a database for use in documenting future changes in water quality and 4) educate and involve residents in waterbody protection
Toward those objectives DRWA will monitor 29 sites for E coli sampling during the recreation season June through September This project includes conducting a water quality monitoring program for E coli in the Vermont and the Massachusetts portions of the watershed where pathogens have been detected during previous sampling efforts undertaken by MassDEP and VT DEC
Project Purpose- DRWA
B Intended Uses of Data
The data generated under this QAPP will serve the following uses
- Use in the MassDEP CWA Integrated Report
- Document the presence and severity of bacteria as pathogen indicators
- Educate school children and local communities about water quality and any problems and improvements
- Evaluate the effectiveness of restoration projects and other management activities
A56 Program Goals and Objectives ndash NepRWANepRWArsquos CWMN program seeks to accomplish the following during the period 2019-2021
- Regularly collect in-stream water quality samples at a handful of ldquoindicator sitesrdquo that represent overall water quality conditions and trends
- Regularly collect in-stream water quality samples at a larger number of ldquosubwatershed sitesrdquo that target known or suspected problem areas
- Conduct ldquofollow uprdquo and ldquospecial studyrdquo investigations and sampling as needed to confirm and further specify suspected problem or opportunity areas identified through the regular sampling program
- hellip
- Collect in-stream samples during rainfall events
- Distribute results promptly to municipal officials state and federal regulators and the general public as a means to increase understanding of water pollution issues
- Using fully sterile methods collect data needed to help implement recommendations of the Total Maximum Daily Load (TMDL) for bacteria
- Generate data to help enhance the effectiveness of municipal state federal and private efforts to improve water quality
Monitoring Objectives amp DWM-DEP Data Levels
EducationalStewardship-levelbull Objective is to engage volunteers in monitoring to develop better understanding
of the importance of water resources and to encourage their fellow citizens to take an active role in the preservation and restoration of their local water bodies and watersheds
Screening-level bull Typically used to direct future sampling efforts and as supporting evidence only
RegulatoryAssessment-levelbull Directly usable for 305(b) and 303(d) decision-making bull Scientifically sound and legally-defensible bull Contingent on review and approval these data can help determine if a water body
is meeting water quality standards or is impaired
Monitoring Objectives amp DWM-DEP Data Levels
Project Task Description ndash EPA Element 6
In general terms describe bull The work your staffvolunteers will perform bull Where it will take placebull What kinds of samples will be takenbull What kinds of conditions will be measuredbull How you will evaluate results
DRWA Project PurposeTask Description
C Brief Description of Project- There will be a training and orientation meeting held in March organized by VTDEC but
held at VAEL - Volunteers will be trained annually prior to the start of the sampling season- River water samples will be collected at 29 sites 6 times between June and September- The project will employ the Colilert System developed by IDEXX laboratories Inc to assay
E coli bacteria Samples will be analyzed at the CRC laboratory- Data will be analyzed and reviewed for quality assurance summarized and interpreted on
an annual basis - Data that meet project quality objectives will be submitted to MassDEP and entered in the
VTDECrsquos Water Quality data management system as well as the EPArsquos national water quality data storage system known as STORET
- Information will be presented to the local community in a suitable format be it a press release public meeting or another event
- A report will be prepared and shared with the distribution list in this QAPP and published on the DRWA website (deerfieldriverorg)
Site ID Site Name Town Rationale Lat Lon Deerfield River Mainstem and Branches
VT-NBD_064
East Dover Rd Wilmington Monitor above most ag and below golf course
4291431 -728376
VT-NBD_027
Above Wilmington Center
Wilmington Monitor within ag and above village center
4287452 -72864
VT-NBD_020
Wilmington Center above confl w
Beaver Brk
Wilmington Monitor for high bacterianutrients and
Beaver Brk contribution
4286816 -728721
VT-NBD_018
Wilmington Center below confl w
Beaver Brk
Wilmington Swim holehigh bacterianutrients
4286875 -728738
MA-DFR_289
Shunpike Rest Area Charlemont Monitor Deerfield River coming from VT
426363 -729071
MA-DFR_276
Above Charlemont Center
Charlemont Bracket WWTF Mill Brk 426271 -728853
MA-DFR_267
Charlemont Center Charlemont Bracket WWTF Mill Brk 426262 -728685
MA-DFR_011
5 amp 10 Bridge Greenfield Monitor Deerfield contributions to CT River
PrecisionThe degree of agreement among repeated measurements of an indicator on separate samples collected as close as possible in time and place
It does not mean that the sample actually reflects the ldquotruerdquo value but rather that your sampling and analysis are giving consistent results under similar conditions
AccuracyAccuracy or Bias is a measure of confidence that describes
how close a measurement is to its ldquotruerdquo value
Parameter Reporting Limit
Accuracy ( Recovery)
Field Precision (RPD)
Expected Range
E coli 1 MPN 100ml
Blanks and negatives show no colonies positives show colonies
30 of log10 transformed MPN
0-2420 MPN
These objectives will be measured as follows
Field Specific Quality Controls
10 of samples collected (3 per event in 2019) will be field blanks Sterile water poured into sterile sample bottle in the field These must register lt1 for total coliform and E coli
10 of samples collected (3 per event in 2019) will be field duplicates A second sample will be collected at the same location by the volunteer These will have a Relative Percent Difference of le 30 for log transformed e values
Laboratory Sample Batch-Specific Quality Control Samples With each new batch of samples run CRC will perform the following QC sample analysis
1 Lab Blank - Sterile water1 Positive Culture Control -sterile buffer dilution water inoculated with E coli (ie total coliform amp E coli positive)1 Negative culture Control -sterile buffer dilution water inoculated with non-fluorescent Pseudomonas sp (ie
total coliform amp E coli negative) 1 Lab Duplicate ndash 250 mL sample split into 2 100 mL samples in the lab
DRWA Data Precision and Accuracy
REPRESENTATIVENESS
Representativeness is the extent to which measurements actually represent the true environmental condition
You will state that- Sampling sites were selected to appropriately capture
- the general characteristics of the water body- or specific impacts if you are conducting an impact assessment (eg above amp
below suspected pollution sourceshellip)- The sample collection point is appropriate eg mid-stream mid-lake etc what
sampling depth - Number of sites is adequate to answer study question- The parameters monitored are relevant to the type of impact or to a general
WQ assessment- Sample collection timing and frequency are selected to capture data that are
representative of target conditions (eg various water levels weather seasons)
MassDEP - RECOMMENDED MINIMUM SAMPLE NUMBER FREQUENCY AND TIMING FOR EXAMPLE PARAMETERS
Parameter
Streams Lakes
Min Sample Number and Frequency
Sampling Period Min Sample Number and Frequency
Sampling Period
DO (discrete) 5 results pre-dawn June - September 3 results (epilimnetic) June - September
DO (continuous) 3o days June - September 3o days June - September
pH 5 results June - September 3 results (epilimnetic) June - September
Temperature (discrete) 5 results afternoon June - September 3 results (epilimnetic) June - September
Temperature (continuous) 3o days June - September 3o days June - September
Bacteria (eg E coli) 3-5 results (in 30-90 days) April 1-October 15 3-5 results (in 30-90 days) April 1-October 15
Nutrients (inc chl a for lakes) 5 results June- September 3 results June - September
Secchi depth --- --- 3 results June - September
Chloride 3 results 4 day period (yr-round) --- ---
ldquoCleanrdquo metals 3 results 4 day period (summer) --- ---
Misc toxics emerging contam 3 results 30 day period (summer) 3 results (epilimnetic) 30 day period (summer)
Fish community 1 survey April 1-October 15 1 survey April 1-October 15
Fish tissue contaminants (eg Hg PCBs pesticides)
1 survey Any 1 survey Any
Benthic invertebrates (RBP3) 1 survey July ndash October --- ---
Weed surveys 1 survey June- September 1 survey June- September
Aesthetics 1 survey April 1-October 15 1 survey April 1-October 15
30 days (bathing) 90 days (non-bathing) ldquoworst-caserdquo typ July-Aug
REPRESENTATIVENESS
DRWAB Data RepresentativenessSamples collected at locations and depths described in this QAPP will reflect conditions of individual water bodies and tributaries in Vermont and Massachusetts To ensure representativeness all samples will be collected preserved and analyzed according to the procedures in this QAPP and within the specified holding times
NepRWAA7-5 Data RepresentativenessSampling points will be chosen to represent the water quality within the applicable geographic area of interest Staff experienced and knowledgeable in the factors affecting water quality will choose sample points that will be representative of conditions within the area of concern
COMPARABILITY
Comparability is the degree to which data can be compared directly to similar studies There are two things to consider future studies someone might undertake and past studies you (or others) will want to compare your data with
State that you will use and document standardized - sampling amp analytical methods and units of reporting- sampling sites times and dates - sample storage and transfer
Comparability
Deerfield River Watershed Association
C Data ComparabilityAll samples for each specific parameter will be collected and analyzed using the respective procedures described in this QAPP to ensure that comparisons between different sample sites sample dates depths and projects can be appropriately made Procedures are unchanged from previous years
Neponset River Watershed Association
A7-6 ComparabilityComparability is ensured by the utilization of established sampling and monitoring protocols from Massachusetts DEP MWRA Massachusetts Water Watch Partnership the Boston Water and Sewer Commission and NepRWA and by the use of standard test methods and procedures as outlined in Appendices 6 7 and 8
Completeness
Completeness is an estimate of the amount of data you will need to answer your study question Usually expressed as a of originally planned sample events after missing sample events and data no meeting DQOs are subtracted from the planned number
DRWA
D Data CompletenessAt least 80 of the anticipated number of samples will be collected at each site analyzed and determined to meet data quality objectives for the project to be considered successful A report detailing the number of anticipated samples number of valid results and percent completion (number of valid samplesnumber of anticipated samples) will be produced
NepRWAA7-8 CompletenessIn order to obtain the best picture of the watershed NepRWA expects 90 of the routine sampling and follow up sampling samples to be collected and analyzed during each scheduled sampling event In the routine sampling program uncertainties such as weather volunteer scheduling and illness sometimes result in unavoidable omissions but every effort is made to assign backup samplers when possible
Sampling Process Design - EPA Element 10From MassWWP QAPP Guide
Purpose To describe in greater detail the design of the sampling part of your monitoring program
In Section 6 you briefly outlined the sample process design In this section you should elaborate on the rationales for those choices When you complete this section you should revisit Section 6 and revise as necessary The two sections should be in agreement
What To Include bull Indicators or measures bull Types of samplesbull Sampling frequency bull Sampling period bull How you will select sample sites and identify them over timebull Site safety plans
MADEP - RECOMMENDED MINIMUM SAMPLE NUMBER FREQUENCY AND TIMING FOR EXAMPLE PARAMETERS
Parameter
Streams Lakes
Min Sample Number and Frequency
Sampling Period Min Sample Number and Frequency
Sampling Period
DO (discrete) 5 results pre-dawn June - September 3 results (epilimnetic) June - September
DO (continuous) 3o days June - September 3o days June - September
pH 5 results June - September 3 results (epilimnetic) June - September
Temperature (discrete) 5 results afternoon June - September 3 results (epilimnetic) June - September
Temperature (continuous) 3o days June - September 3o days June - September
Bacteria (eg E coli) 3-5 results (in 30-90 days) April 1-October 15 3-5 results (in 30-90 days) April 1-October 15
Nutrients (inc chl a for lakes) 5 results June- September 3 results June - September
Secchi depth --- --- 3 results June - September
Chloride 3 results 4 day period (yr-round) --- ---
ldquoCleanrdquo metals 3 results 4 day period (summer) --- ---
Misc toxics emerging contam 3 results 30 day period (summer) 3 results (epilimnetic) 30 day period (summer)
Fish community 1 survey April 1-October 15 1 survey April 1-October 15
Fish tissue contaminants (eg Hg PCBs pesticides)
1 survey Any 1 survey Any
Benthic invertebrates (RBP3) 1 survey July ndash October --- ---
Weed surveys 1 survey June- September 1 survey June- September
Aesthetics 1 survey April 1-October 15 1 survey April 1-October 15
30 days (bathing) 90 days (non-bathing) ldquoworst-caserdquo typ July-Aug
Deerfield River Watershed Association
10 Sampling Process Design
Sampling sites were selected to represent locations that receive heavy human use from swimmers boaters anglers and other contact recreational users
Samples will be collected bi-weekly from late June through early September (prime recreation period) between 10 AM and 1 PM Samplers will first fill out their field data sheet They will then collect a water sample away from the edge of the stream near the center of the stream (centroid of flow) and just below the surface following the MWWP protocol (available in the Appendix)
Samplers will place their samples immediately in a cooler with ice or frozen ice packs making sure the temperature in the cooler is at 4degC or lower Each sample bottle will be placed in an individual clean Ziploc bag to avoid cross contamination
Neponset River Watershed Association
B1 Sampling Process Design
The CWMN program is designed to develop and maintain a record of general water qualitythroughout the watershed Project goals include both evaluation of long-term changes over time across the watershed as a whole and the identification of pollution hotspots at a low order subwatershed scale
Routine sampling activities consist of collecting in-stream samples As discussed above routine sampling sites are divided among ldquoindicatorrdquo sites and ldquosubwatershed sitesrdquo in order to meet the dual objectives of the program Indicator sites are selected to be representative of overall water quality and are relatively unchanging over time to allow comparison to past and future investigations Sites have generally been selected at the downstream ends or key segmentation points of major subwatersheds and at or near locations where there is a longstanding data record
Neponset River Watershed Association
B1 Sampling Process Design ndash continued
Subwatershed sites are selected to provide higher spatial resolution along individual streams in an effort to bracket pollution sources and facilitate their identification and remediation Subwatershed sites make up roughly 60 of the overall number of sites and are more likely to change from year to year Subwatershed sites may be rotated through different watersheds over the course of several sampling seasons to provide detailed data on different subwatersheds over a period of years Specific sites are selected by the project manager on the basis of known or suspected problems or opportunities or to fill in a lack of detailed data in a specific area
Neponset River Watershed Association
B1 Sampling Process Design ndash continued
In addition to the routine sampling activities CWMN also encompasses follow up and special study sampling activities These are generally ldquoone-timerdquo investigations intended to zero in on pollution sources in a known or suspected problem areahellipSpecific sampling stations may be planned in advance or may be chosen opportunistically by samplers while in the field
The mix of parameters sampled at each site depends on its status as an indicator subwatershed or follow up station the relative location of the station in the watershed and the specific pollutant(s) of concern at that specific location Indicator sites are tested for bacteria nutrients ammonia and field measured parametershellip Subwatershed sites are generally tested for bacteria total phosphorus and field measured parameters At some subwatershed sites hellip Follow up sampling stations will generally be tested for a very narrow set of parameters based on the specific pollutant of concern A listing of current routine sampling stations and the parameters sampled is provided in the Appendix 1e
Sampling Methods Requirements - EPA Element 11
This section describes your field measurementsample collection methods It can be stated in table form with narrative descriptions if you choose
Includebull What parameters are being sampledbull Sampling containersdevices sample preservation steps Maximum holding timebull Amount of sample to be collectedbull Summarize steps taken by field samplersbull Reference to the method followed (cite specific SOPS include in appendices)bull Can also include sampling considerations (eg time of day steps taken to avoid stirring up
sediments sample collection depth etc) These will be detailed in SOPs
Deerfield River Watershed Association
ParameterMeasure Container Field Rinse Preservation Hold Time E coli 120 mL IDEXX
Cool to lt4degC 6 hours to lab 8 hours to processing
B2 Sampling Methods
B2-2 Visual ObservationsB2-3 Fecal Coliform E coli and EnterococcusB2-5 NutrientsB2-6 Specific Conductance and SalinityB2-7 TemperatureB2-8 pH B2-9 Dissolved OxygenB2-10 SurfactantsB2-11 Depth and FlowB2-12 Optical BrightenersB2-13 Qualitative Ammonia Nitrogen
Neponset River Watershed Association
Sample Handling and Custody Requirements - EPA Element 12
Demonstrate that your sampling handling and storage techniques will retainsafeguard the integrity of your samples and data records
12 Sample Handling and Custody Procedures
Samples will be collected between 7 AM and 10 AM on sampling days The samples will be kept on ice inside a cooler during transport Wilmington VT area samples will be picked up by the monitoring assistant in the Main Street parking lots or other agreed upon meeting location by 9 AM Green River VT samples will be picked up by the transporting volunteer at the Green River covered bridge or other agreed upon meeting location by 930 AM The remaining samples will be delivered directly to the CRC water quality lab by 10 AM Any exchange of possession in the samples will be documented on the Chain of Custody (CoC) form which will be completed and signed by the Lab Analyst upon receipt at the lab The CoC form will be checked by the program coordinator See Appendix for the CoC
Deerfield River Watershed Association
Analytical Methods Requirements - EPA Element 13
Deerfield River Watershed Association
13 Analytical Methods Requirements
All analytical determinations will be performed at the CRC lab in Greenfield by the Lab Director Gabriel Chevalier
Indicator
Method Number
Source
Reporting Units
Modifications or Options
E coli
United water laboratory 1603 Bacteria Colilert SOP 604b CRWC 03-11-10
EPA 1603 (Modified m-TEC)
1 MPN
Sodium Thiosulfate used in all containers
Neponset River Watershed Association
Massachusetts Volunteer Monitorrsquos Guide to QAPP DevelopmentPAGE 61
Here are some things to consider in choosing a method Scientific Considerations Does it meet your data quality objectives
How accurate is it How precise (reproducible) is it What is its detection limit
Will it measure the indicator in the range that you need What lab facilities are required What equipment is required Does it yield samples that are representative Is it comparable to methods used by agencies collecting similar information
Practical and Program Considerations bull Do you have the human and financial resources to do it bull How difficult is it bull How time-consuming is it bull Will it produce data useful to the target audience
Quality Control ndash EPA Element 14
This section documents that the specific quality control measures you will take will allow you to determine whether you meet your data quality objectives
What To Include Section 7 stated your DQOs Here you describe how you are going to meet them
For each indicator include the following information
bull Accuracy Precision checks list what checks you will perform
bull List the of your samples upon which you will perform quality checks that will represent the quality of all your samples
Quality Control
Accuracy checks
There are a variety of ways to check the accuracy of your sampling and analysis
Checks can be done internally (done totally within your project lab) or externally (done with the assistance of an independent lab)
Known Samples This is an internal check that compares your results against another analyst or a ldquoknownrdquo An example of a known is a quality assurance sample that UMass WRRC sends to VM groups for pH DO or alkalinity ndash with the expected value communicated when sample is sent
Proficiency Testing (Unknown) Samples In some cases there are programs that provide proficiency testing samples for laboratory performance evaluation the concentrations of which are known to the auditor but not to the lab being tested This is relatively common for most water chemistry indicators An example of an unknown would when WRRC sends a quality assurance sample without communicating the expected value in advance
Quality Control
Accuracy checks - continued
Blank and Positive Plates Bacteriological samples should be checked using the blank and positive plate procedure The blank plate uses the rinse water media and equipment in the analysis to determine if there is contamination in the laboratory materials The result should be 0 The positive plate procedure uses a sample known to contain bacteria (eg waste- water treatment plant influent) to determine if a procedural error in the lab causes inhibition of bacterial growth Results should be rdquoToo Numerous To Countrdquo Each batch of samples should include at least one blank and one positive check sample This is an internal check
Spiked Samples Spikes are additions of a known amount of the indicator with the expectation that subsequent analysis will measure exactly that much increase over the un- spiked sample This procedure is described in Section 1020 B of Standard Methods This is an internal check
Voucher and Reference Collections For macroinvertebrates and aquatic plants maintenance of a voucher andor a working reference collection is recommended A voucher collection is a preserved collection of the type specimens ie an example of each of the individual taxa that you have given a name It should be maintained in archival condition by a trained curator typically found at a university A reference collection is an exact duplicate of the voucher collection but is the one that you will regularly use as a reference when identifying new specimens Both voucher and reference collections should be verified by an expert This is an external check Alternatively have an expert review IDs made by volunteers of at least 10 of specimens collected 90 accuracy is recommended
Quality Control
Precision Checks
Precision checks are primarily accomplished through replicate sampling amp analysis in the field and lab
Field Replication Replication can be done by the same field collectors but some replication by other collectors is good eg a pair of field collectors swapping roles or have different team collect the replicate This is an internal check
Lab Replication Additional replication should occur in the lab Lab replication is done by dividing a well-mixed sample into two or more aliquots and conducting analysis on each aliquot This is an internal check
Split Samples Split samples (a sample that is split into two sub-samples) can be done in the field or the lab
Relative Percent Difference
A measure of precision used for duplicate sample results It is calculated by dividing the difference between the two results by the mean of the two results expressed as a percentage Used when sample number equals two
eg ((98-92) 100) ((98+92))2 = 63
Deerfield River Watershed Association
14 Quality Control RequirementsA Volunteers Check - Field AuditEither the QC Officer the Project Coordinator or both will accompany a crew of volunteers (each) to their site each collection The trainers will observe the volunteersrsquo performance and check their sampling technique and field data sheets for accuracy
B Field QC ChecksAt least one Field Duplicate and one Field Blank will be submitted for every ten samples collected
Field Duplicate ndash a check on water quality sampling amp analysis consistency This is a replicated sample collected at the same point in time and space side by side with the first sampling and given a separate Sample ID number
Field Blanks ndash a check for contamination (AccuracyBias) in the field by processing laboratory-supplied deionized water through the sampling train This checks for contamination introduced from the sample container(s) or from field contamination A Field Blank will be taken by one volunteer at one site per sampling day for bacteria A container of DI water will be given to the volunteer who will pour this DI water into the sample bottle at the site
We will rotate the field duplicate and field blank samples among the volunteers throughout the sampling season so a maximum of collectors can be checked
Deerfield River Watershed Association
14 Quality Control Requirements ndash continued
C Laboratory QC ChecksA Lab Duplicate will be analyzed each sampling day The lab will split a randomly chosen sample and analyze both subsamples
The lab will run a Lab Blank and a Positive Sample for bacteria each collection (see section 7)
D Data Analysis QC ChecksRiver data and QC data will be reviewed by the QC Officer as soon as they come in from the lab after each collection QC data will be compared to the quality objectives (eg blanks should have zero colonies sample duplicates should be within 3 standard deviations of the mean positives should show bacterial growth etc) River data will be reviewed as well to ensurethat no field or lab contamination has occurred (data will be compared to those of other sites and of previous collections)
Bacteria computations will be checked and validated If discrepancies are found the Lab Director will be called to resolve the discrepancy and corrections will be made by the QC Officer
Field data sheets will be also reviewed the day of collection by the Project Coordinator and later by the QC Officer to ensure that samples were taken at the right times and that all the required information has been filled out The Project Coordinator or collectors will be called if omissions or errors are detected If needed corrections will be made (signed anddated) on the field sheet by the QC Officer
Neponset River Watershed Association
PRECISION DQOS DEALING WITH LOW-LEVEL CONCENTRATIONS
Source Analyte Units PrecisionMassDEP WPP Monitoring QAPP
Training Requirements Certification ndash EPA Element 8
In Narrative or Table Format
bull List type of training (eg Field WQ lab analysis visual observation data mgt data entry etc)
bull Who is training who receives training
bull How often training done
If training records are kept (they should be) include that in section 9 on documentation and records
Neponset River Watershed Association
A8 Training - ExcerptTo ensure the high quality and usability of the data that is generated by the CWMN program all participants receive training appropriate to the tasks for which they will be responsible NepRWA staff that are involved in the program are professionals with extensive training in water quality chemistry biology and field sampling NepRWA has established a program of training for volunteers that includes initial training follow-up and refresher classes These classes are given by NepRWA staff that are qualified not only in the technical matter covered but in training and education
The initial training for volunteer monitors is primarily instruction and demonstration by the trainer with repetition by the volunteer This training includes an overview of the entire project and detailed instruction in sampling procedures All monitors receive and review a copy of NepRWArsquos Water Monitoring and Sampling Manual (see Appendix 3a)
After their initial training all volunteers participate in a mandatory annual group andor individual training session These sessions are designed to update the volunteers on changes in the program further train them in equipment calibration and field-testing procedures and evaluate each volunteerrsquos performancehellip
InstrumentEquipment Testing Inspection and Maintenance Requirements ndash EPA Element 15
Instrument Calibration and Frequency ndash EPA Element 16
InspectionAcceptance Requirements for Supplies ndash EPA Element 17
DOCUMENTATION AND RECORDS ndash EPA ELEMENT 9
Neponset River Watershed AssociationA9 Documents and RecordsA9-1 Data SheetsField data sheets include information about the site location (NepRWA ID number) which specific equipment was used to make measurements (thermometer number) the sampling method used (direct fill pole or Bridge Buddy) and equipment calibration results The field data sheets are also used to record temperature velocity depth color odor and turbidity information (Appendix 4e)helliphellip See Appendix 4 for copies of the various data sheets used in the CWMN program
A9-2 Chain of Custody FormsA9-3 Sample LabelingA9-4 Equipment Custody FormA9-5 Training and Evaluation Form
Data Acquisition Requirements - EPA Element 18
Purpose To ensure that any data you use but donrsquot collect yourself has a known data quality and is consistent with your data quality objectives that others can access these data and that your use of the data is appropriate
Describe any external data you use such as GPS coordinates for site locations weather station rainfall amounts etc
Include bull The title of the document or name of the informationbull Where you obtained it and where others may find itbull Notes on the quality of the outside information such as uncertainties and caveats
Preamble to Elements 19 through 24
Consider the four separate objectives of these chapters1) Producing a good data set - 19 covers the normal data mgt routines you do to prevent data mistakes in the first place- 22 amp23 describe how you review the resulting data sets - how you find and correct
missing or erroneous data - 19 22 and 23 should produce as complete amp accurate a data set as possible 2) Ensuring that any use you make of your data is justified In 24 you decide how usable your data are Review the final data set that the above efforts have produced Compare it with your DQOs to determine whether you have to discard or qualify any data what conclusions you can draw from your data or what changes you might need to make in your DQOs3) Improve overall project performance 20 deals with how well volunteers laboratories and equipment are operating It looks at function not outcomes Who evaluates the various components of your program when problems are found what corrections are made to make your program run better4) Report your results After yoursquove run these various checks you are ready to release your data In Chapter 21 you describe the reports you will issue
Suggested order bull Data Management (19)bull Data Review Validation and Verification Requirements (22)bull (Data) Validation and Verification Methods (23)
bull Reconciliation with Data Quality Objectives (24)
bull Assessment and Response Actions (20)
bull Reports (21)
EPA Elements 19 ndash 24
bull Data Management (19)bull Assessment and Response Actions (20) bull Reports (21)bull Data Review Validation and Verification Requirements (22)bull (Data) Validation and Verification Methods (23)bull Reconciliation with Data Quality Objectives (24)
Data Management ndash EPA Element 19
Follow the data from the moment itrsquos recorded through every step to final report databaseIntent is to prevent errors or loss of data or be able to correct in timely manner
bull Before each activitystep is conducted well-designed field sheets checklists COC forms data entry software auto-QC calculations out-of-bounds highlights etc
bull During each step sheets filled completely checklist reviewed before leaving site etc
bull Immediately after Computer-entered data compared with field sheets etc
bull Long term preservation Data storage
Neponset River Watershed Association
B9 Data ManagementThe Project Manager is responsible for overseeing all data management activities Refer also to section D below for additional discussion of data review verification and validation practices
B9-1 Raw DataField data sheets are collected with the samples The sheets are turned into the NepRWA office by the site coordinators The forms are then reviewed for illegible answers errors or questionable values and checked for consistency with the COC and bottle labels as described in Appendix 3l Any questions are referred to the volunteer for clarification NepRWA staff makes corrections by crossing out the errors and writing in the correct answer All corrections must be initialed
B9-2 Data Entry and ValidationOnce the information has undergone a preliminary check it is entered into a Filemaker database The software has been customized to the data sheet Fields within the worksheet have been set-up with limits based on expected results This helps to minimize entry errors Entered data is then checked against the data sheets by another volunteer or staff person
B9-3 Data StorageThe original data sheets are filed into an event file and stored in NepRWArsquos permanent files Electronic copies of data are maintained on a secure Filemaker server Data files are kept in perpetuity along with hard copies of volunteer data sheets All electronic data is backed-up daily on to a password-protected hard drive
Data Review Validation and Verificationndash EPA Element 22
(Data) Validation and Verification Methods ndash EPA Element 23
Deerfield River Watershed Association
22 Data Review Validation and Verification ndash Summarized bullet list
All data reviewed by the Project Coordinator and QA Coordinator
Data Analysis QC Checks will includebull Data entry checks by a second personbull Computer entries compared with fieldlab sheetsbull Checks on graphs amp all other data representationsbull Calculation of measures of data quality including completeness
Corrective actionsbull Data entry errors corrected bull Data outside expected range flagged or rejected bull 2nd field sample andor laboratory aliquot taken when possiblebull Data quality problems discussed in draft and final reports
(Data) Validation and Verification Methods ndash EPA Element 23 From Inland QAPP
Validation and Verification Methods will include checks on bull Completion of all fields on data sheets missing data sheetsbull Completeness of sampling runs (eg number of sites visitedsamples taken vs number proposed were all parameters sampledanalyzed)bull Completeness of QC checks (eg number and type of QC checks performed vs numbertype proposed)bull Accuracy and precision compared to data quality objectivesbull Representativeness of samples and resulting data by examining survey metadata for unusual conditions and occurrences that may have impacted the validity of results
Deerfield River Watershed Association ndash Excerpt summarized
23 Validation and Verification Methods
The following simple measures of data quality will be calculated and included in the final report
1) To screen for contamination the average blank concentration hellip will be calculated This average value should be as close as practical to the Reporting Limit listed in Table 4
2) To assess the precision of results the ldquoMean Relative Percent Differencerdquo between field duplicate samples should be calculated The average RPD should be less than or equal to the Estimated Precision listed in Table 4 This simple measure is calculated as follows
RPD formula used hellip
Reconciliation With Data Quality Objectives ndash EPA Element 24MassWWP guide to QAPP development
What to Include bull List who will evaluate your actual data vs your data quality goals bull State how and when this will be done bull Describe the process for determining what to do if goals are not met
Neponset River Watershed Association
D2 Reconciliation with User Requirements - Summarized bulletedbull Following each sampling event and prior to the subsequent event calculations and
determinations for precision completeness and accuracy will be made bull Any corrective action will be implemented noted and initialized by the project manager bull If data quality indicators do not meet the projectrsquos specifications then data may be discarded
may be flagged or re-sampling may occur bull Investigation of problems will take place and corrections will be documented If equipment
failure is found to be the cause calibration and maintenance techniques will be reassessed Field duplicate testing may occur during the next sampling event to ensure confidence in the results
bull Any limitations on the data will be noted bull Any revisions to the project will be submitted to EPA and DEP quality assurance officers for
approval
Assessment and Response Actions - EPA Element 20 From Inland QAPP
Document that the progress and quality of the monitoring program will be continuously assessed to ensure that its objectives are being accomplished
The Monitoring Coordinator will periodically check to see the following bull Monitoring is occurring as planned bull Sufficient written commentary and supporting photographs exist bull Sufficient volunteers are available bull Volunteers have been observed as they sample their sites bull Samplers are collecting in accordance with project schedules bull Data sheets and custody control sheets are being properly completed and signed bull Data are properly interpreted bull Plans for dealing with adverse weather are in place
Assessment and Response Actions - EPA Element 20 From Inland QAPP ndash continued
The Monitoring Coordinator will periodically check to see the following bull Retraining or other corrective action is implemented at the first hint of non compliance with the
QAPP or SOPs bull Labs are adhering to the requirements of their QAPP in terms of work performed accuracy
acceptable holding times timely and understandable results and delivery process bull Data management is being handled properly ie data are entered on a timely basis is
properly backed up is easily accessed and raw data are properly stored in a safe placebull Procedure for developing and reporting the results exists
Assessment and Response Actions - EPA Element 20 From Inland QAPP ndash continued
The Monitoring Coordinator will confer with the QA Officer as necessary to discuss any problems that occur and what corrective actions are needed to maintain program integrity In addition the Monitoring Coordinator and QA Officer will meet at the end of the sampling season to review the draft report and discuss all aspects of the program and identify necessary program modifications for future sampling activities [If the program includes a technical advisory committee the TAC will be included in these discussions] Corrections may include retraining volunteers rewriting sampling instructions replacement of volunteers alteration of sampling schedules sites or methods or other actions deemed necessary All problems discovered and program modifications made will be documented in the final version of the project report If modifications require changes in the Quality Assurance Project Plan these changes will be submitted MassDEP for review
Deerfield River Watershed Association
20 Assessment and Response Actions ndash Summarized bullet list
bull There will be an on-site visit by the Quality Control Officer to observe field sampling and field analysis procedures Generally this will be done near the beginning of the project
bull A written checklist will be used for the assessments maintained by the Project Coordinator and copies will be provided with the data report
bull The Project Coordinator and QC Officer will determine if field work follows the written procedures or if there needs to be corrections by additional training or revising protocols
bull Please refer to Section 22 for additional evaluations and response actions regarding data evaluations
Reports ndash EPA Element 21
Project Task Organization ndash EPA Element 4 Reviewrevise early choices
Distribution List ndash EPA Element 3
Title and Approval Page - EPA Element 1
Table of Contents ndash EPA Element 2
Water quality monitoring quality assurance workshop
Terminology
Study design
QAPP
sampling and analysis plan
standard operating procedures
data quality objectives
Water Quality Monitoring Planning Process
Monitoring program activities
Why do you need (who Gives) a qapp
Slide Number 11
Slide Number 12
Steps to Developing a QAPP
Slide Number 14
Slide Number 15
Slide Number 16
Steps to Developing a QAPP
Slide Number 18
Slide Number 19
Slide Number 20
Slide Number 21
Slide Number 22
Slide Number 23
Slide Number 24
Sources of Information About Massachusetts Waters
Slide Number 26
Slide Number 27
Slide Number 28
Slide Number 29
Slide Number 30
Slide Number 31
Slide Number 32
Slide Number 33
Slide Number 34
Slide Number 35
Slide Number 36
Slide Number 37
Slide Number 38
Slide Number 39
Slide Number 40
Slide Number 41
Slide Number 42
Slide Number 43
Slide Number 44
Slide Number 45
Slide Number 46
MassDEP - Recommended Minimum Sample Number Frequency and Timing for Example Parameters
Slide Number 48
Slide Number 49
Slide Number 50
Slide Number 51
Slide Number 52
MaDep - Recommended Minimum Sample Number Frequency and Timing for Example Parameters
Slide Number 54
Slide Number 55
Slide Number 56
Slide Number 57
Slide Number 58
Slide Number 59
Slide Number 60
Slide Number 61
Slide Number 62
Slide Number 63
Slide Number 64
Slide Number 65
Slide Number 66
Slide Number 67
Slide Number 68
Slide Number 69
Slide Number 70
Slide Number 71
Slide Number 72
Slide Number 73
Slide Number 74
Slide Number 75
Slide Number 76
Precision DQOs Dealing with low-level concentrations
Slide Number 78
Slide Number 79
Slide Number 80
Slide Number 81
Slide Number 82
Documentation and Records ndash EPA Element 9
Slide Number 84
Slide Number 85
Slide Number 86
Slide Number 87
Slide Number 88
Slide Number 89
Slide Number 90
Slide Number 91
Slide Number 92
Slide Number 93
Slide Number 94
Slide Number 95
Slide Number 96
Slide Number 97
Slide Number 98
Slide Number 99
Slide Number 100
Site ID
Site Name
Town
Rationale
Lat
Lon
Deerfield River Mainstem and Branches
VT-NBD_064
East Dover Rd
Wilmington
Monitor above most ag and below golf course
4291431
-728376
VT-NBD_027
Above Wilmington Center
Wilmington
Monitor within ag and above village center
4287452
-72864
VT-NBD_020
Wilmington Center above confl w Beaver Brk
Wilmington
Monitor for high bacterianutrients and Beaver Brk contribution
4286816
-728721
VT-NBD_018
Wilmington Center below confl w Beaver Brk
Wilmington
Swim holehigh bacterianutrients
4286875
-728738
MA-DFR_289
Shunpike Rest Area
Charlemont
Monitor Deerfield River coming from VT
426363
-729071
MA-DFR_276
Above Charlemont Center
Charlemont
Bracket WWTF Mill Brk
426271
-728853
MA-DFR_267
Charlemont Center
Charlemont
Bracket WWTF Mill Brk
426262
-728685
MA-DFR_011
5 amp 10 Bridge
Greenfield
Monitor Deerfield contributions to CT River
4256975
-725922
North River
VT-EBN_150
Above Jacksonville WWTF
Whitingham
Bracket WWTF
42787
-728163
VT-EBN_147
Below Jacksonville WWTF
Whitingham
Bracket WWTF
4278456
-728128
MA-EBN_024
Foundry Village Rd Ballfields
Colrain
Swim hole
4267478
-726966
MA-NOR_001
Formerly Sunburn Beach
Colrain
Mouth of North River
4265286
-727141
Green River Watershed
VT-PND_001
Mouth of Pond Brook
Halifax
Green River reclassification in support of Green River Watershed Alliance grant
428135
-727243
VT-GRN_234
Hinesburg Rd
Guilford
Green River reclassification in support of Green River Watershed Alliance grant
4279717
-726804
VT-HBG_001
Mouth of Hinesburg Brook
Guilford
Green River reclassification in support of Green River Watershed Alliance grant
4279582
-726605
VT-GRN_202
Green River Timber Crib Dam swim hole
Guilford
Swim HoleGreen River reclassification in support of Green River Watershed Alliance grant
4277555
-726673
VT-GRN_168
MAVT State Line
Guilford
Green River reclassification in support of Green River Watershed Alliance grant
4273299
-726761
MA-GRN_098
Bare Ass Beach
Greenfield
Swim Hole
4265102
-726235
MA-MPL_001
Mouth of Maple Brook
Greenfield
ID source of bacterianutrients
4258667
-726124
MA-GRN_020
Mohawk Trail Bridge
Greenfield
ID source of bacterianutrients
4258554
-726117
MA-GRN_008
Pretty Plain Rd
Greenfield
Monitor Green River contributions to Deerfield River high bacterianutrients
4257636
-725984
Other Tributaries
VT-
ELS_002
Ellis Brook TBD
Wilmington
Monitor below WWTF
429202
-728381
VT-COB_003
Cold Brook Above confl with N Br Deerfield
Wilmington
General water quality monitoring effect of Mt Snow pond
4289928
-728595
VT-BVR_029
Near Shearer Hill Rd
Wilmington
Monitor for runoff
42855
-728385
VT-BVR_011
Off Rte 9 near Wahoorsquos
Wilmington
Monitor for high bacteriarunoff
4286523
-728588
MA-CHI_001
Chickley River Tower Rd
Charlemont
Monitor contributions to Deerfield River
4263005
-729016
MA-MBK_001
Mill Brook TBD
Charlemont
Monitor mouth for contribution
426271
-728728
MA-CLS_003
Clesson Brook Buckland Rec Area
Buckland
Swim hole monitor contributions to Deerfield River
4 Data Quality Objectives and Indicators (with clear table of DQIs)
A7 Quality Objectives and Criteria
8 Training Requirements
6 Training and Specialized Experience
A8 Special TrainingCertification
9 Documentation and Records
7 Documents and Records
A9 Documents and Records
MEASUREMENTDATA ACQUISITION
COLLECTING THE DATA
GROUP B DATA GENERATION AND ACQUISITION ELEMENTS
10 Sampling Process Design (including SOP citations sampling locations)
9(A) Sampling Methods (including methods locations sampling frequency quality control measures broken out by samplemonitoring type)
B1 Sampling Process Design (Experimental Design)
11 Sampling Methods Requirements (includes equipment containers preservation hold times sample type any decontamination)
9(B) Sampling Methods ndash Data Collection Methods (including parameters locations type of QC number of samples SOPs rationale
B2 Sampling Methods
12 Sampling Handling and Custody
9 Sampling Handling (includes sample ID process)
B3 Sample Handling and Custody
13 Analytical Methods Requirements
12 Analytical Methods (includes containers and preservation)
B4 Analytical Methods
14 Quality Control Requirements
13 Field and Laboratory Quality Control
B5 Quality Control
Comparison of Guidance Documents - Continued
Elements of a QAPPProject Management1 Title and Approval Page2 Table of Contents3 Distribution List4 ProjectTask Organization5 Problem Identification Background6 ProjectTask Description7 Data Quality Objectives for Measurement Data8 Training RequirementsCertification9 Documentation and RecordsMeasurementData Acquisition10 Sampling Process Design11 Sampling Methods Requirements12 Sample Handling and Custody13 Analytical Methods Requirements14 Quality Control Requirements15 InstrumentEquipment Testing Inspection and Maintenance Requirements16 Instrument Calibration and Frequency17 InspectionAcceptance Requirements for Supplies18 Data Acquisition Requirements19 Data ManagementAssessment and Oversight20 Assessment and Response Actions21 ReportsData Validation and Usability22 Data Review Validation and Verification23 Validation and Verification Methods24 Reconciliation with Data Quality Objectives
STEPS TO DEVELOPING A QAPP
1 ESTABLISH A QAPP TEAM
2 DETERMINE PROJECT GOALS amp OBJECTIVES
3 COLLECT BACKGROUND INFORMATION
4 REFINE YOUR PROJECT
5 DESIGN SAMPLING ANALYTICAL amp DATA REQUIREMENTS
6 DEVELOP IMPLEMENTATION PLAN
7 DRAFT SOPS AND QAPP
8 SOLICIT FEEDBACK ON SOPS AND QAPP
9 REVISE SUBMIT FOR FINAL APPROVAL
10 BEGIN YOUR MONITORING PROJECT
11 EVALUATE AND REFINE YOUR QAPP
Elements of a QAPPProject Management1 Title and Approval Page2 Table of Contents3 Distribution List4 ProjectTask Organization5 Problem Identification Background6 ProjectTask Description7 Data Quality Objectives for Measurement Data8 Training RequirementsCertification9 Documentation and RecordsMeasurementData Acquisition10 Sampling Process Design11 Sampling Methods Requirements12 Sample Handling and Custody13 Analytical Methods Requirements14 Quality Control Requirements15 InstrumentEquipment Testing Inspection and Maintenance Requirements16 Instrument Calibration and Frequency17 InspectionAcceptance Requirements for Supplies18 Data Acquisition Requirements19 Data ManagementAssessment and Oversight20 Assessment and Response Actions21 ReportsData Validation and Usability22 Data Review Validation and Verification23 Validation and Verification Methods24 Reconciliation with Data Quality Objectives
Elements of a QAPP ndash Suggested completion order
Data Quality Objectives for Measurement Data (7)Sampling Process Design (10) Sampling Methods Requirements (11) Sample Handling and custody Requirement (12)Analytical Methods Requirements (13) Quality Control Requirements (14)
InstrumentsEquipment Testing Inspections and Maintenance Requirements (15)Instrument Calibration and Frequency (16)Inspection Acceptance Requirements for Supplies (17)Training Requirements Certification (8)
Elements of a QAPP ndash Suggested completion order continued
Documentation and Records (9) Data Management (19)Data Acquisitions Requirements (18)
Data Review Validation and Verification Requirements (22)Validation and Verification Methods (23)Reconciliation with Data Quality Objectives (24)
Reports (21)
Assessment and Response Actions (20)
Project Task Organization (4 final version) Distribution List (3) Title and Approval Page (1)Table of Contents (2)
Problem Identification BackgroundEPA Element 5
A Problem Definition ldquoThis section describes the environmental problem question or threat to be addressed explains why this work needs to be done and provides a framework for determining the project purpose the use of the data and the project objectivesrdquo
B Background
ldquoThis is an opportunity to describe the history of the project (or environmental problem) relevant previous studies and how this project fills in a data gap (including from existing data) or complements existing informationrdquo
- Citizen Science Quality Assurance and Documentation EPA 2019
Problem Identification BackgroundEPA Element 5
From MA VM QAPP Guidebook
bull Describe your organizationbull Describe your watershed and waters of interestbull Describe the current status of your waters of interestbull State water quality issues of concernbull Describe information needed to address the concernbull List your monitoring questionsbull What are your monitoring purposesbull List intended users uses of information you collect
5 Background of DRWA Volunteer Bacteria Monitoring Program Deerfield River Watershed Association QAPP 2019
The Deerfield River Watershed encompasses approximately 665 square miles Thehellip River is widely regarded as one of the coldest and cleanest rivers in Massachusetts and attracts many sport-fishermen and whitewater enthusiasts However nonpoint source pollution has degraded segments hellip and poses a threat to other tributaries The DRWA has intermittently monitored the water quality hellip since 1990 to document the current quality of the watershed
hellip DRWA started monitoring fecal coliform bacteria at popular recreation sites to provide data in the intervening years [between DEP monitoring schedules] hellip In 1999 DRWA monitored bacteria above and below hellip WWTPs and at a few recreational siteshellip high counts of bacteria were recorded from at least one hellip site exceeding the Massachusetts Surface Water Quality Standards Class B standards This finding prompted a focused examination of bacteria levels in 2003 However concerns of impairment hellip persist According to the Massachusetts Year 2016 Draft Integrated List of Waters the lower nineteen miles of the mainstem and four important tributaries of the Deerfield are assigned to Category 5 Waters for pathogenshellip
5 Background of DRWA Volunteer Bacteria Monitoring Program Deerfield River Watershed Association QAPP 2019 ndash continued
DRWA resumed monitoring of bacteria in the Deerfield watershed in 2017 hellipthe Connecticut River Conservancy (CRC) provides [lab services] Through [this] support DRWA has been able to test bacteria in hellipand include testing parameters besides bacteria in Massachusetts In 2019 CRC received the bacteria grant from MA DEP that will help cover the costs of testing bacteria in the Massachusetts portion of the watershed
Problem StatementhellipMassDEP and hellip VT DEC have identified several potential sources of nonpoint pollution in the Deerfield Watershed including failing septic systems stormwater runoff road runoff from paved and unpaved roads hellipand agricultural activities in close proximity to rivers and streams
In Massachusetts approximately nineteen (19) river miles hellip have been assigned to Category 5 (waters that require a hellip (TMDL calculation)hellipother river segments remained unassessed for recreation
In Vermont there is a bacteria TMDL Monitoring over the past 2 years suggests that the TMDL area may need to be extended Vermont is on a 5-year watershed basin planning cycle The Deerfield Watershed is currently undergoing its basin planning process
Problem Identification BackgroundNeponset RWA QAPP 2019
A5-1 Watershed DescriptionThe Neponset River Watershed covers 117 square mileshellip
A5-2 Organizational BackgroundThe Neponset River Watershed Association (NepRWA) is hellip
A5-3 Sources of Impairment and Pollutants of ConcernRemaining water quality problems in the watershed include hellipCurrent pollutants of concern in the Neponset Watershed includehellip
A5-4 Past Sampling EffortsThe Massachusetts DEP completed a very comprehensive water quality assessment hellip The CWMN program has been working to fill water quality information gaps and facilitate water quality improvement for more than 20 yearshellip
Sources of Information About Massachusetts Waters
1 Mass Water Quality Standards httpwwwmassgoveeaagenciesmassdepwaterregulations314-cmr-4-00-mass-surface-water-quality-standardshtml
2 Massachusetts Water Quality Assessments ldquoLook here for reports on the condition of watersheds in Massachusettsrdquo httpwwwmassgoveeaagenciesmassdepwaterwatershedswater-quality-assessmentshtml3
3 Integrated List of Waters httpswwwmassgovlistsintegrated-lists-of-waters-related-reports4 TMDLs httpwwwmassgoveeaagenciesmassdepwaterwatershedstotal-maximum-daily-loads-tmdlshtml25 Older Water Quality Assessment Reports httpwwwmassgoveeaagenciesmassdepwaterwatershedswater-
quality-assessmentshtml3
Deerfield River Basin
Program Goals and Objectives Part 2 of EPA Element 5
A5 Program Goals and Objectives - DEP
Project Purpose- DRWA
Objectives of Project
The principal objectives of projects under this QAPP are to 1) provide a perspective on the range of water quality conditions for recreation in the Deerfield River watershed across Vermont and Massachusetts 2) describe water quality conditions of individual tributaries and the mainstem 3) establish a database for use in documenting future changes in water quality and 4) educate and involve residents in waterbody protection
Toward those objectives DRWA will monitor 29 sites for E coli sampling during the recreation season June through September This project includes conducting a water quality monitoring program for E coli in the Vermont and the Massachusetts portions of the watershed where pathogens have been detected during previous sampling efforts undertaken by MassDEP and VT DEC
Project Purpose- DRWA
B Intended Uses of Data
The data generated under this QAPP will serve the following uses
- Use in the MassDEP CWA Integrated Report
- Document the presence and severity of bacteria as pathogen indicators
- Educate school children and local communities about water quality and any problems and improvements
- Evaluate the effectiveness of restoration projects and other management activities
A56 Program Goals and Objectives ndash NepRWANepRWArsquos CWMN program seeks to accomplish the following during the period 2019-2021
- Regularly collect in-stream water quality samples at a handful of ldquoindicator sitesrdquo that represent overall water quality conditions and trends
- Regularly collect in-stream water quality samples at a larger number of ldquosubwatershed sitesrdquo that target known or suspected problem areas
- Conduct ldquofollow uprdquo and ldquospecial studyrdquo investigations and sampling as needed to confirm and further specify suspected problem or opportunity areas identified through the regular sampling program
- hellip
- Collect in-stream samples during rainfall events
- Distribute results promptly to municipal officials state and federal regulators and the general public as a means to increase understanding of water pollution issues
- Using fully sterile methods collect data needed to help implement recommendations of the Total Maximum Daily Load (TMDL) for bacteria
- Generate data to help enhance the effectiveness of municipal state federal and private efforts to improve water quality
Monitoring Objectives amp DWM-DEP Data Levels
EducationalStewardship-levelbull Objective is to engage volunteers in monitoring to develop better understanding
of the importance of water resources and to encourage their fellow citizens to take an active role in the preservation and restoration of their local water bodies and watersheds
Screening-level bull Typically used to direct future sampling efforts and as supporting evidence only
RegulatoryAssessment-levelbull Directly usable for 305(b) and 303(d) decision-making bull Scientifically sound and legally-defensible bull Contingent on review and approval these data can help determine if a water body
is meeting water quality standards or is impaired
Monitoring Objectives amp DWM-DEP Data Levels
Project Task Description ndash EPA Element 6
In general terms describe bull The work your staffvolunteers will perform bull Where it will take placebull What kinds of samples will be takenbull What kinds of conditions will be measuredbull How you will evaluate results
DRWA Project PurposeTask Description
C Brief Description of Project- There will be a training and orientation meeting held in March organized by VTDEC but
held at VAEL - Volunteers will be trained annually prior to the start of the sampling season- River water samples will be collected at 29 sites 6 times between June and September- The project will employ the Colilert System developed by IDEXX laboratories Inc to assay
E coli bacteria Samples will be analyzed at the CRC laboratory- Data will be analyzed and reviewed for quality assurance summarized and interpreted on
an annual basis - Data that meet project quality objectives will be submitted to MassDEP and entered in the
VTDECrsquos Water Quality data management system as well as the EPArsquos national water quality data storage system known as STORET
- Information will be presented to the local community in a suitable format be it a press release public meeting or another event
- A report will be prepared and shared with the distribution list in this QAPP and published on the DRWA website (deerfieldriverorg)
Site ID Site Name Town Rationale Lat Lon Deerfield River Mainstem and Branches
VT-NBD_064
East Dover Rd Wilmington Monitor above most ag and below golf course
4291431 -728376
VT-NBD_027
Above Wilmington Center
Wilmington Monitor within ag and above village center
4287452 -72864
VT-NBD_020
Wilmington Center above confl w
Beaver Brk
Wilmington Monitor for high bacterianutrients and
Beaver Brk contribution
4286816 -728721
VT-NBD_018
Wilmington Center below confl w
Beaver Brk
Wilmington Swim holehigh bacterianutrients
4286875 -728738
MA-DFR_289
Shunpike Rest Area Charlemont Monitor Deerfield River coming from VT
426363 -729071
MA-DFR_276
Above Charlemont Center
Charlemont Bracket WWTF Mill Brk 426271 -728853
MA-DFR_267
Charlemont Center Charlemont Bracket WWTF Mill Brk 426262 -728685
MA-DFR_011
5 amp 10 Bridge Greenfield Monitor Deerfield contributions to CT River
PrecisionThe degree of agreement among repeated measurements of an indicator on separate samples collected as close as possible in time and place
It does not mean that the sample actually reflects the ldquotruerdquo value but rather that your sampling and analysis are giving consistent results under similar conditions
AccuracyAccuracy or Bias is a measure of confidence that describes
how close a measurement is to its ldquotruerdquo value
Parameter Reporting Limit
Accuracy ( Recovery)
Field Precision (RPD)
Expected Range
E coli 1 MPN 100ml
Blanks and negatives show no colonies positives show colonies
30 of log10 transformed MPN
0-2420 MPN
These objectives will be measured as follows
Field Specific Quality Controls
10 of samples collected (3 per event in 2019) will be field blanks Sterile water poured into sterile sample bottle in the field These must register lt1 for total coliform and E coli
10 of samples collected (3 per event in 2019) will be field duplicates A second sample will be collected at the same location by the volunteer These will have a Relative Percent Difference of le 30 for log transformed e values
Laboratory Sample Batch-Specific Quality Control Samples With each new batch of samples run CRC will perform the following QC sample analysis
1 Lab Blank - Sterile water1 Positive Culture Control -sterile buffer dilution water inoculated with E coli (ie total coliform amp E coli positive)1 Negative culture Control -sterile buffer dilution water inoculated with non-fluorescent Pseudomonas sp (ie
total coliform amp E coli negative) 1 Lab Duplicate ndash 250 mL sample split into 2 100 mL samples in the lab
DRWA Data Precision and Accuracy
REPRESENTATIVENESS
Representativeness is the extent to which measurements actually represent the true environmental condition
You will state that- Sampling sites were selected to appropriately capture
- the general characteristics of the water body- or specific impacts if you are conducting an impact assessment (eg above amp
below suspected pollution sourceshellip)- The sample collection point is appropriate eg mid-stream mid-lake etc what
sampling depth - Number of sites is adequate to answer study question- The parameters monitored are relevant to the type of impact or to a general
WQ assessment- Sample collection timing and frequency are selected to capture data that are
representative of target conditions (eg various water levels weather seasons)
MassDEP - RECOMMENDED MINIMUM SAMPLE NUMBER FREQUENCY AND TIMING FOR EXAMPLE PARAMETERS
Parameter
Streams Lakes
Min Sample Number and Frequency
Sampling Period Min Sample Number and Frequency
Sampling Period
DO (discrete) 5 results pre-dawn June - September 3 results (epilimnetic) June - September
DO (continuous) 3o days June - September 3o days June - September
pH 5 results June - September 3 results (epilimnetic) June - September
Temperature (discrete) 5 results afternoon June - September 3 results (epilimnetic) June - September
Temperature (continuous) 3o days June - September 3o days June - September
Bacteria (eg E coli) 3-5 results (in 30-90 days) April 1-October 15 3-5 results (in 30-90 days) April 1-October 15
Nutrients (inc chl a for lakes) 5 results June- September 3 results June - September
Secchi depth --- --- 3 results June - September
Chloride 3 results 4 day period (yr-round) --- ---
ldquoCleanrdquo metals 3 results 4 day period (summer) --- ---
Misc toxics emerging contam 3 results 30 day period (summer) 3 results (epilimnetic) 30 day period (summer)
Fish community 1 survey April 1-October 15 1 survey April 1-October 15
Fish tissue contaminants (eg Hg PCBs pesticides)
1 survey Any 1 survey Any
Benthic invertebrates (RBP3) 1 survey July ndash October --- ---
Weed surveys 1 survey June- September 1 survey June- September
Aesthetics 1 survey April 1-October 15 1 survey April 1-October 15
30 days (bathing) 90 days (non-bathing) ldquoworst-caserdquo typ July-Aug
REPRESENTATIVENESS
DRWAB Data RepresentativenessSamples collected at locations and depths described in this QAPP will reflect conditions of individual water bodies and tributaries in Vermont and Massachusetts To ensure representativeness all samples will be collected preserved and analyzed according to the procedures in this QAPP and within the specified holding times
NepRWAA7-5 Data RepresentativenessSampling points will be chosen to represent the water quality within the applicable geographic area of interest Staff experienced and knowledgeable in the factors affecting water quality will choose sample points that will be representative of conditions within the area of concern
COMPARABILITY
Comparability is the degree to which data can be compared directly to similar studies There are two things to consider future studies someone might undertake and past studies you (or others) will want to compare your data with
State that you will use and document standardized - sampling amp analytical methods and units of reporting- sampling sites times and dates - sample storage and transfer
Comparability
Deerfield River Watershed Association
C Data ComparabilityAll samples for each specific parameter will be collected and analyzed using the respective procedures described in this QAPP to ensure that comparisons between different sample sites sample dates depths and projects can be appropriately made Procedures are unchanged from previous years
Neponset River Watershed Association
A7-6 ComparabilityComparability is ensured by the utilization of established sampling and monitoring protocols from Massachusetts DEP MWRA Massachusetts Water Watch Partnership the Boston Water and Sewer Commission and NepRWA and by the use of standard test methods and procedures as outlined in Appendices 6 7 and 8
Completeness
Completeness is an estimate of the amount of data you will need to answer your study question Usually expressed as a of originally planned sample events after missing sample events and data no meeting DQOs are subtracted from the planned number
DRWA
D Data CompletenessAt least 80 of the anticipated number of samples will be collected at each site analyzed and determined to meet data quality objectives for the project to be considered successful A report detailing the number of anticipated samples number of valid results and percent completion (number of valid samplesnumber of anticipated samples) will be produced
NepRWAA7-8 CompletenessIn order to obtain the best picture of the watershed NepRWA expects 90 of the routine sampling and follow up sampling samples to be collected and analyzed during each scheduled sampling event In the routine sampling program uncertainties such as weather volunteer scheduling and illness sometimes result in unavoidable omissions but every effort is made to assign backup samplers when possible
Sampling Process Design - EPA Element 10From MassWWP QAPP Guide
Purpose To describe in greater detail the design of the sampling part of your monitoring program
In Section 6 you briefly outlined the sample process design In this section you should elaborate on the rationales for those choices When you complete this section you should revisit Section 6 and revise as necessary The two sections should be in agreement
What To Include bull Indicators or measures bull Types of samplesbull Sampling frequency bull Sampling period bull How you will select sample sites and identify them over timebull Site safety plans
MADEP - RECOMMENDED MINIMUM SAMPLE NUMBER FREQUENCY AND TIMING FOR EXAMPLE PARAMETERS
Parameter
Streams Lakes
Min Sample Number and Frequency
Sampling Period Min Sample Number and Frequency
Sampling Period
DO (discrete) 5 results pre-dawn June - September 3 results (epilimnetic) June - September
DO (continuous) 3o days June - September 3o days June - September
pH 5 results June - September 3 results (epilimnetic) June - September
Temperature (discrete) 5 results afternoon June - September 3 results (epilimnetic) June - September
Temperature (continuous) 3o days June - September 3o days June - September
Bacteria (eg E coli) 3-5 results (in 30-90 days) April 1-October 15 3-5 results (in 30-90 days) April 1-October 15
Nutrients (inc chl a for lakes) 5 results June- September 3 results June - September
Secchi depth --- --- 3 results June - September
Chloride 3 results 4 day period (yr-round) --- ---
ldquoCleanrdquo metals 3 results 4 day period (summer) --- ---
Misc toxics emerging contam 3 results 30 day period (summer) 3 results (epilimnetic) 30 day period (summer)
Fish community 1 survey April 1-October 15 1 survey April 1-October 15
Fish tissue contaminants (eg Hg PCBs pesticides)
1 survey Any 1 survey Any
Benthic invertebrates (RBP3) 1 survey July ndash October --- ---
Weed surveys 1 survey June- September 1 survey June- September
Aesthetics 1 survey April 1-October 15 1 survey April 1-October 15
30 days (bathing) 90 days (non-bathing) ldquoworst-caserdquo typ July-Aug
Deerfield River Watershed Association
10 Sampling Process Design
Sampling sites were selected to represent locations that receive heavy human use from swimmers boaters anglers and other contact recreational users
Samples will be collected bi-weekly from late June through early September (prime recreation period) between 10 AM and 1 PM Samplers will first fill out their field data sheet They will then collect a water sample away from the edge of the stream near the center of the stream (centroid of flow) and just below the surface following the MWWP protocol (available in the Appendix)
Samplers will place their samples immediately in a cooler with ice or frozen ice packs making sure the temperature in the cooler is at 4degC or lower Each sample bottle will be placed in an individual clean Ziploc bag to avoid cross contamination
Neponset River Watershed Association
B1 Sampling Process Design
The CWMN program is designed to develop and maintain a record of general water qualitythroughout the watershed Project goals include both evaluation of long-term changes over time across the watershed as a whole and the identification of pollution hotspots at a low order subwatershed scale
Routine sampling activities consist of collecting in-stream samples As discussed above routine sampling sites are divided among ldquoindicatorrdquo sites and ldquosubwatershed sitesrdquo in order to meet the dual objectives of the program Indicator sites are selected to be representative of overall water quality and are relatively unchanging over time to allow comparison to past and future investigations Sites have generally been selected at the downstream ends or key segmentation points of major subwatersheds and at or near locations where there is a longstanding data record
Neponset River Watershed Association
B1 Sampling Process Design ndash continued
Subwatershed sites are selected to provide higher spatial resolution along individual streams in an effort to bracket pollution sources and facilitate their identification and remediation Subwatershed sites make up roughly 60 of the overall number of sites and are more likely to change from year to year Subwatershed sites may be rotated through different watersheds over the course of several sampling seasons to provide detailed data on different subwatersheds over a period of years Specific sites are selected by the project manager on the basis of known or suspected problems or opportunities or to fill in a lack of detailed data in a specific area
Neponset River Watershed Association
B1 Sampling Process Design ndash continued
In addition to the routine sampling activities CWMN also encompasses follow up and special study sampling activities These are generally ldquoone-timerdquo investigations intended to zero in on pollution sources in a known or suspected problem areahellipSpecific sampling stations may be planned in advance or may be chosen opportunistically by samplers while in the field
The mix of parameters sampled at each site depends on its status as an indicator subwatershed or follow up station the relative location of the station in the watershed and the specific pollutant(s) of concern at that specific location Indicator sites are tested for bacteria nutrients ammonia and field measured parametershellip Subwatershed sites are generally tested for bacteria total phosphorus and field measured parameters At some subwatershed sites hellip Follow up sampling stations will generally be tested for a very narrow set of parameters based on the specific pollutant of concern A listing of current routine sampling stations and the parameters sampled is provided in the Appendix 1e
Sampling Methods Requirements - EPA Element 11
This section describes your field measurementsample collection methods It can be stated in table form with narrative descriptions if you choose
Includebull What parameters are being sampledbull Sampling containersdevices sample preservation steps Maximum holding timebull Amount of sample to be collectedbull Summarize steps taken by field samplersbull Reference to the method followed (cite specific SOPS include in appendices)bull Can also include sampling considerations (eg time of day steps taken to avoid stirring up
sediments sample collection depth etc) These will be detailed in SOPs
Deerfield River Watershed Association
ParameterMeasure Container Field Rinse Preservation Hold Time E coli 120 mL IDEXX
Cool to lt4degC 6 hours to lab 8 hours to processing
B2 Sampling Methods
B2-2 Visual ObservationsB2-3 Fecal Coliform E coli and EnterococcusB2-5 NutrientsB2-6 Specific Conductance and SalinityB2-7 TemperatureB2-8 pH B2-9 Dissolved OxygenB2-10 SurfactantsB2-11 Depth and FlowB2-12 Optical BrightenersB2-13 Qualitative Ammonia Nitrogen
Neponset River Watershed Association
Sample Handling and Custody Requirements - EPA Element 12
Demonstrate that your sampling handling and storage techniques will retainsafeguard the integrity of your samples and data records
12 Sample Handling and Custody Procedures
Samples will be collected between 7 AM and 10 AM on sampling days The samples will be kept on ice inside a cooler during transport Wilmington VT area samples will be picked up by the monitoring assistant in the Main Street parking lots or other agreed upon meeting location by 9 AM Green River VT samples will be picked up by the transporting volunteer at the Green River covered bridge or other agreed upon meeting location by 930 AM The remaining samples will be delivered directly to the CRC water quality lab by 10 AM Any exchange of possession in the samples will be documented on the Chain of Custody (CoC) form which will be completed and signed by the Lab Analyst upon receipt at the lab The CoC form will be checked by the program coordinator See Appendix for the CoC
Deerfield River Watershed Association
Analytical Methods Requirements - EPA Element 13
Deerfield River Watershed Association
13 Analytical Methods Requirements
All analytical determinations will be performed at the CRC lab in Greenfield by the Lab Director Gabriel Chevalier
Indicator
Method Number
Source
Reporting Units
Modifications or Options
E coli
United water laboratory 1603 Bacteria Colilert SOP 604b CRWC 03-11-10
EPA 1603 (Modified m-TEC)
1 MPN
Sodium Thiosulfate used in all containers
Neponset River Watershed Association
Massachusetts Volunteer Monitorrsquos Guide to QAPP DevelopmentPAGE 61
Here are some things to consider in choosing a method Scientific Considerations Does it meet your data quality objectives
How accurate is it How precise (reproducible) is it What is its detection limit
Will it measure the indicator in the range that you need What lab facilities are required What equipment is required Does it yield samples that are representative Is it comparable to methods used by agencies collecting similar information
Practical and Program Considerations bull Do you have the human and financial resources to do it bull How difficult is it bull How time-consuming is it bull Will it produce data useful to the target audience
Quality Control ndash EPA Element 14
This section documents that the specific quality control measures you will take will allow you to determine whether you meet your data quality objectives
What To Include Section 7 stated your DQOs Here you describe how you are going to meet them
For each indicator include the following information
bull Accuracy Precision checks list what checks you will perform
bull List the of your samples upon which you will perform quality checks that will represent the quality of all your samples
Quality Control
Accuracy checks
There are a variety of ways to check the accuracy of your sampling and analysis
Checks can be done internally (done totally within your project lab) or externally (done with the assistance of an independent lab)
Known Samples This is an internal check that compares your results against another analyst or a ldquoknownrdquo An example of a known is a quality assurance sample that UMass WRRC sends to VM groups for pH DO or alkalinity ndash with the expected value communicated when sample is sent
Proficiency Testing (Unknown) Samples In some cases there are programs that provide proficiency testing samples for laboratory performance evaluation the concentrations of which are known to the auditor but not to the lab being tested This is relatively common for most water chemistry indicators An example of an unknown would when WRRC sends a quality assurance sample without communicating the expected value in advance
Quality Control
Accuracy checks - continued
Blank and Positive Plates Bacteriological samples should be checked using the blank and positive plate procedure The blank plate uses the rinse water media and equipment in the analysis to determine if there is contamination in the laboratory materials The result should be 0 The positive plate procedure uses a sample known to contain bacteria (eg waste- water treatment plant influent) to determine if a procedural error in the lab causes inhibition of bacterial growth Results should be rdquoToo Numerous To Countrdquo Each batch of samples should include at least one blank and one positive check sample This is an internal check
Spiked Samples Spikes are additions of a known amount of the indicator with the expectation that subsequent analysis will measure exactly that much increase over the un- spiked sample This procedure is described in Section 1020 B of Standard Methods This is an internal check
Voucher and Reference Collections For macroinvertebrates and aquatic plants maintenance of a voucher andor a working reference collection is recommended A voucher collection is a preserved collection of the type specimens ie an example of each of the individual taxa that you have given a name It should be maintained in archival condition by a trained curator typically found at a university A reference collection is an exact duplicate of the voucher collection but is the one that you will regularly use as a reference when identifying new specimens Both voucher and reference collections should be verified by an expert This is an external check Alternatively have an expert review IDs made by volunteers of at least 10 of specimens collected 90 accuracy is recommended
Quality Control
Precision Checks
Precision checks are primarily accomplished through replicate sampling amp analysis in the field and lab
Field Replication Replication can be done by the same field collectors but some replication by other collectors is good eg a pair of field collectors swapping roles or have different team collect the replicate This is an internal check
Lab Replication Additional replication should occur in the lab Lab replication is done by dividing a well-mixed sample into two or more aliquots and conducting analysis on each aliquot This is an internal check
Split Samples Split samples (a sample that is split into two sub-samples) can be done in the field or the lab
Relative Percent Difference
A measure of precision used for duplicate sample results It is calculated by dividing the difference between the two results by the mean of the two results expressed as a percentage Used when sample number equals two
eg ((98-92) 100) ((98+92))2 = 63
Deerfield River Watershed Association
14 Quality Control RequirementsA Volunteers Check - Field AuditEither the QC Officer the Project Coordinator or both will accompany a crew of volunteers (each) to their site each collection The trainers will observe the volunteersrsquo performance and check their sampling technique and field data sheets for accuracy
B Field QC ChecksAt least one Field Duplicate and one Field Blank will be submitted for every ten samples collected
Field Duplicate ndash a check on water quality sampling amp analysis consistency This is a replicated sample collected at the same point in time and space side by side with the first sampling and given a separate Sample ID number
Field Blanks ndash a check for contamination (AccuracyBias) in the field by processing laboratory-supplied deionized water through the sampling train This checks for contamination introduced from the sample container(s) or from field contamination A Field Blank will be taken by one volunteer at one site per sampling day for bacteria A container of DI water will be given to the volunteer who will pour this DI water into the sample bottle at the site
We will rotate the field duplicate and field blank samples among the volunteers throughout the sampling season so a maximum of collectors can be checked
Deerfield River Watershed Association
14 Quality Control Requirements ndash continued
C Laboratory QC ChecksA Lab Duplicate will be analyzed each sampling day The lab will split a randomly chosen sample and analyze both subsamples
The lab will run a Lab Blank and a Positive Sample for bacteria each collection (see section 7)
D Data Analysis QC ChecksRiver data and QC data will be reviewed by the QC Officer as soon as they come in from the lab after each collection QC data will be compared to the quality objectives (eg blanks should have zero colonies sample duplicates should be within 3 standard deviations of the mean positives should show bacterial growth etc) River data will be reviewed as well to ensurethat no field or lab contamination has occurred (data will be compared to those of other sites and of previous collections)
Bacteria computations will be checked and validated If discrepancies are found the Lab Director will be called to resolve the discrepancy and corrections will be made by the QC Officer
Field data sheets will be also reviewed the day of collection by the Project Coordinator and later by the QC Officer to ensure that samples were taken at the right times and that all the required information has been filled out The Project Coordinator or collectors will be called if omissions or errors are detected If needed corrections will be made (signed anddated) on the field sheet by the QC Officer
Neponset River Watershed Association
PRECISION DQOS DEALING WITH LOW-LEVEL CONCENTRATIONS
Source Analyte Units PrecisionMassDEP WPP Monitoring QAPP
Training Requirements Certification ndash EPA Element 8
In Narrative or Table Format
bull List type of training (eg Field WQ lab analysis visual observation data mgt data entry etc)
bull Who is training who receives training
bull How often training done
If training records are kept (they should be) include that in section 9 on documentation and records
Neponset River Watershed Association
A8 Training - ExcerptTo ensure the high quality and usability of the data that is generated by the CWMN program all participants receive training appropriate to the tasks for which they will be responsible NepRWA staff that are involved in the program are professionals with extensive training in water quality chemistry biology and field sampling NepRWA has established a program of training for volunteers that includes initial training follow-up and refresher classes These classes are given by NepRWA staff that are qualified not only in the technical matter covered but in training and education
The initial training for volunteer monitors is primarily instruction and demonstration by the trainer with repetition by the volunteer This training includes an overview of the entire project and detailed instruction in sampling procedures All monitors receive and review a copy of NepRWArsquos Water Monitoring and Sampling Manual (see Appendix 3a)
After their initial training all volunteers participate in a mandatory annual group andor individual training session These sessions are designed to update the volunteers on changes in the program further train them in equipment calibration and field-testing procedures and evaluate each volunteerrsquos performancehellip
InstrumentEquipment Testing Inspection and Maintenance Requirements ndash EPA Element 15
Instrument Calibration and Frequency ndash EPA Element 16
InspectionAcceptance Requirements for Supplies ndash EPA Element 17
DOCUMENTATION AND RECORDS ndash EPA ELEMENT 9
Neponset River Watershed AssociationA9 Documents and RecordsA9-1 Data SheetsField data sheets include information about the site location (NepRWA ID number) which specific equipment was used to make measurements (thermometer number) the sampling method used (direct fill pole or Bridge Buddy) and equipment calibration results The field data sheets are also used to record temperature velocity depth color odor and turbidity information (Appendix 4e)helliphellip See Appendix 4 for copies of the various data sheets used in the CWMN program
A9-2 Chain of Custody FormsA9-3 Sample LabelingA9-4 Equipment Custody FormA9-5 Training and Evaluation Form
Data Acquisition Requirements - EPA Element 18
Purpose To ensure that any data you use but donrsquot collect yourself has a known data quality and is consistent with your data quality objectives that others can access these data and that your use of the data is appropriate
Describe any external data you use such as GPS coordinates for site locations weather station rainfall amounts etc
Include bull The title of the document or name of the informationbull Where you obtained it and where others may find itbull Notes on the quality of the outside information such as uncertainties and caveats
Preamble to Elements 19 through 24
Consider the four separate objectives of these chapters1) Producing a good data set - 19 covers the normal data mgt routines you do to prevent data mistakes in the first place- 22 amp23 describe how you review the resulting data sets - how you find and correct
missing or erroneous data - 19 22 and 23 should produce as complete amp accurate a data set as possible 2) Ensuring that any use you make of your data is justified In 24 you decide how usable your data are Review the final data set that the above efforts have produced Compare it with your DQOs to determine whether you have to discard or qualify any data what conclusions you can draw from your data or what changes you might need to make in your DQOs3) Improve overall project performance 20 deals with how well volunteers laboratories and equipment are operating It looks at function not outcomes Who evaluates the various components of your program when problems are found what corrections are made to make your program run better4) Report your results After yoursquove run these various checks you are ready to release your data In Chapter 21 you describe the reports you will issue
Suggested order bull Data Management (19)bull Data Review Validation and Verification Requirements (22)bull (Data) Validation and Verification Methods (23)
bull Reconciliation with Data Quality Objectives (24)
bull Assessment and Response Actions (20)
bull Reports (21)
EPA Elements 19 ndash 24
bull Data Management (19)bull Assessment and Response Actions (20) bull Reports (21)bull Data Review Validation and Verification Requirements (22)bull (Data) Validation and Verification Methods (23)bull Reconciliation with Data Quality Objectives (24)
Data Management ndash EPA Element 19
Follow the data from the moment itrsquos recorded through every step to final report databaseIntent is to prevent errors or loss of data or be able to correct in timely manner
bull Before each activitystep is conducted well-designed field sheets checklists COC forms data entry software auto-QC calculations out-of-bounds highlights etc
bull During each step sheets filled completely checklist reviewed before leaving site etc
bull Immediately after Computer-entered data compared with field sheets etc
bull Long term preservation Data storage
Neponset River Watershed Association
B9 Data ManagementThe Project Manager is responsible for overseeing all data management activities Refer also to section D below for additional discussion of data review verification and validation practices
B9-1 Raw DataField data sheets are collected with the samples The sheets are turned into the NepRWA office by the site coordinators The forms are then reviewed for illegible answers errors or questionable values and checked for consistency with the COC and bottle labels as described in Appendix 3l Any questions are referred to the volunteer for clarification NepRWA staff makes corrections by crossing out the errors and writing in the correct answer All corrections must be initialed
B9-2 Data Entry and ValidationOnce the information has undergone a preliminary check it is entered into a Filemaker database The software has been customized to the data sheet Fields within the worksheet have been set-up with limits based on expected results This helps to minimize entry errors Entered data is then checked against the data sheets by another volunteer or staff person
B9-3 Data StorageThe original data sheets are filed into an event file and stored in NepRWArsquos permanent files Electronic copies of data are maintained on a secure Filemaker server Data files are kept in perpetuity along with hard copies of volunteer data sheets All electronic data is backed-up daily on to a password-protected hard drive
Data Review Validation and Verificationndash EPA Element 22
(Data) Validation and Verification Methods ndash EPA Element 23
Deerfield River Watershed Association
22 Data Review Validation and Verification ndash Summarized bullet list
All data reviewed by the Project Coordinator and QA Coordinator
Data Analysis QC Checks will includebull Data entry checks by a second personbull Computer entries compared with fieldlab sheetsbull Checks on graphs amp all other data representationsbull Calculation of measures of data quality including completeness
Corrective actionsbull Data entry errors corrected bull Data outside expected range flagged or rejected bull 2nd field sample andor laboratory aliquot taken when possiblebull Data quality problems discussed in draft and final reports
(Data) Validation and Verification Methods ndash EPA Element 23 From Inland QAPP
Validation and Verification Methods will include checks on bull Completion of all fields on data sheets missing data sheetsbull Completeness of sampling runs (eg number of sites visitedsamples taken vs number proposed were all parameters sampledanalyzed)bull Completeness of QC checks (eg number and type of QC checks performed vs numbertype proposed)bull Accuracy and precision compared to data quality objectivesbull Representativeness of samples and resulting data by examining survey metadata for unusual conditions and occurrences that may have impacted the validity of results
Deerfield River Watershed Association ndash Excerpt summarized
23 Validation and Verification Methods
The following simple measures of data quality will be calculated and included in the final report
1) To screen for contamination the average blank concentration hellip will be calculated This average value should be as close as practical to the Reporting Limit listed in Table 4
2) To assess the precision of results the ldquoMean Relative Percent Differencerdquo between field duplicate samples should be calculated The average RPD should be less than or equal to the Estimated Precision listed in Table 4 This simple measure is calculated as follows
RPD formula used hellip
Reconciliation With Data Quality Objectives ndash EPA Element 24MassWWP guide to QAPP development
What to Include bull List who will evaluate your actual data vs your data quality goals bull State how and when this will be done bull Describe the process for determining what to do if goals are not met
Neponset River Watershed Association
D2 Reconciliation with User Requirements - Summarized bulletedbull Following each sampling event and prior to the subsequent event calculations and
determinations for precision completeness and accuracy will be made bull Any corrective action will be implemented noted and initialized by the project manager bull If data quality indicators do not meet the projectrsquos specifications then data may be discarded
may be flagged or re-sampling may occur bull Investigation of problems will take place and corrections will be documented If equipment
failure is found to be the cause calibration and maintenance techniques will be reassessed Field duplicate testing may occur during the next sampling event to ensure confidence in the results
bull Any limitations on the data will be noted bull Any revisions to the project will be submitted to EPA and DEP quality assurance officers for
approval
Assessment and Response Actions - EPA Element 20 From Inland QAPP
Document that the progress and quality of the monitoring program will be continuously assessed to ensure that its objectives are being accomplished
The Monitoring Coordinator will periodically check to see the following bull Monitoring is occurring as planned bull Sufficient written commentary and supporting photographs exist bull Sufficient volunteers are available bull Volunteers have been observed as they sample their sites bull Samplers are collecting in accordance with project schedules bull Data sheets and custody control sheets are being properly completed and signed bull Data are properly interpreted bull Plans for dealing with adverse weather are in place
Assessment and Response Actions - EPA Element 20 From Inland QAPP ndash continued
The Monitoring Coordinator will periodically check to see the following bull Retraining or other corrective action is implemented at the first hint of non compliance with the
QAPP or SOPs bull Labs are adhering to the requirements of their QAPP in terms of work performed accuracy
acceptable holding times timely and understandable results and delivery process bull Data management is being handled properly ie data are entered on a timely basis is
properly backed up is easily accessed and raw data are properly stored in a safe placebull Procedure for developing and reporting the results exists
Assessment and Response Actions - EPA Element 20 From Inland QAPP ndash continued
The Monitoring Coordinator will confer with the QA Officer as necessary to discuss any problems that occur and what corrective actions are needed to maintain program integrity In addition the Monitoring Coordinator and QA Officer will meet at the end of the sampling season to review the draft report and discuss all aspects of the program and identify necessary program modifications for future sampling activities [If the program includes a technical advisory committee the TAC will be included in these discussions] Corrections may include retraining volunteers rewriting sampling instructions replacement of volunteers alteration of sampling schedules sites or methods or other actions deemed necessary All problems discovered and program modifications made will be documented in the final version of the project report If modifications require changes in the Quality Assurance Project Plan these changes will be submitted MassDEP for review
Deerfield River Watershed Association
20 Assessment and Response Actions ndash Summarized bullet list
bull There will be an on-site visit by the Quality Control Officer to observe field sampling and field analysis procedures Generally this will be done near the beginning of the project
bull A written checklist will be used for the assessments maintained by the Project Coordinator and copies will be provided with the data report
bull The Project Coordinator and QC Officer will determine if field work follows the written procedures or if there needs to be corrections by additional training or revising protocols
bull Please refer to Section 22 for additional evaluations and response actions regarding data evaluations
Reports ndash EPA Element 21
Project Task Organization ndash EPA Element 4 Reviewrevise early choices
Distribution List ndash EPA Element 3
Title and Approval Page - EPA Element 1
Table of Contents ndash EPA Element 2
Water quality monitoring quality assurance workshop
Terminology
Study design
QAPP
sampling and analysis plan
standard operating procedures
data quality objectives
Water Quality Monitoring Planning Process
Monitoring program activities
Why do you need (who Gives) a qapp
Slide Number 11
Slide Number 12
Steps to Developing a QAPP
Slide Number 14
Slide Number 15
Slide Number 16
Steps to Developing a QAPP
Slide Number 18
Slide Number 19
Slide Number 20
Slide Number 21
Slide Number 22
Slide Number 23
Slide Number 24
Sources of Information About Massachusetts Waters
Slide Number 26
Slide Number 27
Slide Number 28
Slide Number 29
Slide Number 30
Slide Number 31
Slide Number 32
Slide Number 33
Slide Number 34
Slide Number 35
Slide Number 36
Slide Number 37
Slide Number 38
Slide Number 39
Slide Number 40
Slide Number 41
Slide Number 42
Slide Number 43
Slide Number 44
Slide Number 45
Slide Number 46
MassDEP - Recommended Minimum Sample Number Frequency and Timing for Example Parameters
Slide Number 48
Slide Number 49
Slide Number 50
Slide Number 51
Slide Number 52
MaDep - Recommended Minimum Sample Number Frequency and Timing for Example Parameters
Slide Number 54
Slide Number 55
Slide Number 56
Slide Number 57
Slide Number 58
Slide Number 59
Slide Number 60
Slide Number 61
Slide Number 62
Slide Number 63
Slide Number 64
Slide Number 65
Slide Number 66
Slide Number 67
Slide Number 68
Slide Number 69
Slide Number 70
Slide Number 71
Slide Number 72
Slide Number 73
Slide Number 74
Slide Number 75
Slide Number 76
Precision DQOs Dealing with low-level concentrations
Slide Number 78
Slide Number 79
Slide Number 80
Slide Number 81
Slide Number 82
Documentation and Records ndash EPA Element 9
Slide Number 84
Slide Number 85
Slide Number 86
Slide Number 87
Slide Number 88
Slide Number 89
Slide Number 90
Slide Number 91
Slide Number 92
Slide Number 93
Slide Number 94
Slide Number 95
Slide Number 96
Slide Number 97
Slide Number 98
Slide Number 99
Slide Number 100
Site ID
Site Name
Town
Rationale
Lat
Lon
Deerfield River Mainstem and Branches
VT-NBD_064
East Dover Rd
Wilmington
Monitor above most ag and below golf course
4291431
-728376
VT-NBD_027
Above Wilmington Center
Wilmington
Monitor within ag and above village center
4287452
-72864
VT-NBD_020
Wilmington Center above confl w Beaver Brk
Wilmington
Monitor for high bacterianutrients and Beaver Brk contribution
4286816
-728721
VT-NBD_018
Wilmington Center below confl w Beaver Brk
Wilmington
Swim holehigh bacterianutrients
4286875
-728738
MA-DFR_289
Shunpike Rest Area
Charlemont
Monitor Deerfield River coming from VT
426363
-729071
MA-DFR_276
Above Charlemont Center
Charlemont
Bracket WWTF Mill Brk
426271
-728853
MA-DFR_267
Charlemont Center
Charlemont
Bracket WWTF Mill Brk
426262
-728685
MA-DFR_011
5 amp 10 Bridge
Greenfield
Monitor Deerfield contributions to CT River
4256975
-725922
North River
VT-EBN_150
Above Jacksonville WWTF
Whitingham
Bracket WWTF
42787
-728163
VT-EBN_147
Below Jacksonville WWTF
Whitingham
Bracket WWTF
4278456
-728128
MA-EBN_024
Foundry Village Rd Ballfields
Colrain
Swim hole
4267478
-726966
MA-NOR_001
Formerly Sunburn Beach
Colrain
Mouth of North River
4265286
-727141
Green River Watershed
VT-PND_001
Mouth of Pond Brook
Halifax
Green River reclassification in support of Green River Watershed Alliance grant
428135
-727243
VT-GRN_234
Hinesburg Rd
Guilford
Green River reclassification in support of Green River Watershed Alliance grant
4279717
-726804
VT-HBG_001
Mouth of Hinesburg Brook
Guilford
Green River reclassification in support of Green River Watershed Alliance grant
4279582
-726605
VT-GRN_202
Green River Timber Crib Dam swim hole
Guilford
Swim HoleGreen River reclassification in support of Green River Watershed Alliance grant
4277555
-726673
VT-GRN_168
MAVT State Line
Guilford
Green River reclassification in support of Green River Watershed Alliance grant
4273299
-726761
MA-GRN_098
Bare Ass Beach
Greenfield
Swim Hole
4265102
-726235
MA-MPL_001
Mouth of Maple Brook
Greenfield
ID source of bacterianutrients
4258667
-726124
MA-GRN_020
Mohawk Trail Bridge
Greenfield
ID source of bacterianutrients
4258554
-726117
MA-GRN_008
Pretty Plain Rd
Greenfield
Monitor Green River contributions to Deerfield River high bacterianutrients
4257636
-725984
Other Tributaries
VT-
ELS_002
Ellis Brook TBD
Wilmington
Monitor below WWTF
429202
-728381
VT-COB_003
Cold Brook Above confl with N Br Deerfield
Wilmington
General water quality monitoring effect of Mt Snow pond
4289928
-728595
VT-BVR_029
Near Shearer Hill Rd
Wilmington
Monitor for runoff
42855
-728385
VT-BVR_011
Off Rte 9 near Wahoorsquos
Wilmington
Monitor for high bacteriarunoff
4286523
-728588
MA-CHI_001
Chickley River Tower Rd
Charlemont
Monitor contributions to Deerfield River
4263005
-729016
MA-MBK_001
Mill Brook TBD
Charlemont
Monitor mouth for contribution
426271
-728728
MA-CLS_003
Clesson Brook Buckland Rec Area
Buckland
Swim hole monitor contributions to Deerfield River
2019 EPA ldquoCitizen Scient Quality Assurance and Documentation Handbookrdquo and templates
2001 EPA ldquoEPA Requirements for Quality Assurance Project Plansrdquo EPA QAR-5 and companion ldquoGuidance for Quality Assurance Project Plansrdquo EPA QAG-5
MEASUREMENTDATA ACQUISITION
COLLECTING THE DATA
GROUP B DATA GENERATION AND ACQUISITION ELEMENTS
15 InstrumentEquipment Testing Inspection and Maintenance Requirements
11 EquipmentInstrument Maintenance Testing Inspection and Calibration
B6 InstrumentEquipment Testing Inspection and Maintenance
16 Instrument Calibration and Frequency
B7 InstrumentEquipment Calibration and Frequency
17 InspectionAcceptance Requirements for Supplies
B8 Inspection Acceptance of Supplies and Consumables
18 Data Acquisition Requirements
8 Existing Data
B9 Non-Direct Measurements
19 Data Management
14 Data Management
B10 Data Management
ASSESSMENT AND OVERSIGHT
ASSESSING THE DATA
GROUP C ASSESSMENT AND OVERSIGHT ELEMENTS
20 Assessment and Response Actions
15 Reporting Oversight and Assessments and some of 14
C1 Assessments and Response Actions
21 Reports
C2 Reports to Management
DATA VALIDATION AND USABILITY
REVIEWING THE DATA
GROUP D DATA VALIDATION AND USABILITY ELEMENTS
22 Data Review Verification and Validation
16 Data Review and Usability (more sensibly described)
D1 Data Review Verification and Validation
23 Verification and Validation Methods
D2 Verification and Validation Methods
24 Reconciliation with User Requirements
D3 Reconciliation with User Requirements
Elements of a QAPPProject Management1 Title and Approval Page2 Table of Contents3 Distribution List4 ProjectTask Organization5 Problem Identification Background6 ProjectTask Description7 Data Quality Objectives for Measurement Data8 Training RequirementsCertification9 Documentation and RecordsMeasurementData Acquisition10 Sampling Process Design11 Sampling Methods Requirements12 Sample Handling and Custody13 Analytical Methods Requirements14 Quality Control Requirements15 InstrumentEquipment Testing Inspection and Maintenance Requirements16 Instrument Calibration and Frequency17 InspectionAcceptance Requirements for Supplies18 Data Acquisition Requirements19 Data ManagementAssessment and Oversight20 Assessment and Response Actions21 ReportsData Validation and Usability22 Data Review Validation and Verification23 Validation and Verification Methods24 Reconciliation with Data Quality Objectives
STEPS TO DEVELOPING A QAPP
1 ESTABLISH A QAPP TEAM
2 DETERMINE PROJECT GOALS amp OBJECTIVES
3 COLLECT BACKGROUND INFORMATION
4 REFINE YOUR PROJECT
5 DESIGN SAMPLING ANALYTICAL amp DATA REQUIREMENTS
6 DEVELOP IMPLEMENTATION PLAN
7 DRAFT SOPS AND QAPP
8 SOLICIT FEEDBACK ON SOPS AND QAPP
9 REVISE SUBMIT FOR FINAL APPROVAL
10 BEGIN YOUR MONITORING PROJECT
11 EVALUATE AND REFINE YOUR QAPP
Elements of a QAPPProject Management1 Title and Approval Page2 Table of Contents3 Distribution List4 ProjectTask Organization5 Problem Identification Background6 ProjectTask Description7 Data Quality Objectives for Measurement Data8 Training RequirementsCertification9 Documentation and RecordsMeasurementData Acquisition10 Sampling Process Design11 Sampling Methods Requirements12 Sample Handling and Custody13 Analytical Methods Requirements14 Quality Control Requirements15 InstrumentEquipment Testing Inspection and Maintenance Requirements16 Instrument Calibration and Frequency17 InspectionAcceptance Requirements for Supplies18 Data Acquisition Requirements19 Data ManagementAssessment and Oversight20 Assessment and Response Actions21 ReportsData Validation and Usability22 Data Review Validation and Verification23 Validation and Verification Methods24 Reconciliation with Data Quality Objectives
Elements of a QAPP ndash Suggested completion order
Data Quality Objectives for Measurement Data (7)Sampling Process Design (10) Sampling Methods Requirements (11) Sample Handling and custody Requirement (12)Analytical Methods Requirements (13) Quality Control Requirements (14)
InstrumentsEquipment Testing Inspections and Maintenance Requirements (15)Instrument Calibration and Frequency (16)Inspection Acceptance Requirements for Supplies (17)Training Requirements Certification (8)
Elements of a QAPP ndash Suggested completion order continued
Documentation and Records (9) Data Management (19)Data Acquisitions Requirements (18)
Data Review Validation and Verification Requirements (22)Validation and Verification Methods (23)Reconciliation with Data Quality Objectives (24)
Reports (21)
Assessment and Response Actions (20)
Project Task Organization (4 final version) Distribution List (3) Title and Approval Page (1)Table of Contents (2)
Problem Identification BackgroundEPA Element 5
A Problem Definition ldquoThis section describes the environmental problem question or threat to be addressed explains why this work needs to be done and provides a framework for determining the project purpose the use of the data and the project objectivesrdquo
B Background
ldquoThis is an opportunity to describe the history of the project (or environmental problem) relevant previous studies and how this project fills in a data gap (including from existing data) or complements existing informationrdquo
- Citizen Science Quality Assurance and Documentation EPA 2019
Problem Identification BackgroundEPA Element 5
From MA VM QAPP Guidebook
bull Describe your organizationbull Describe your watershed and waters of interestbull Describe the current status of your waters of interestbull State water quality issues of concernbull Describe information needed to address the concernbull List your monitoring questionsbull What are your monitoring purposesbull List intended users uses of information you collect
5 Background of DRWA Volunteer Bacteria Monitoring Program Deerfield River Watershed Association QAPP 2019
The Deerfield River Watershed encompasses approximately 665 square miles Thehellip River is widely regarded as one of the coldest and cleanest rivers in Massachusetts and attracts many sport-fishermen and whitewater enthusiasts However nonpoint source pollution has degraded segments hellip and poses a threat to other tributaries The DRWA has intermittently monitored the water quality hellip since 1990 to document the current quality of the watershed
hellip DRWA started monitoring fecal coliform bacteria at popular recreation sites to provide data in the intervening years [between DEP monitoring schedules] hellip In 1999 DRWA monitored bacteria above and below hellip WWTPs and at a few recreational siteshellip high counts of bacteria were recorded from at least one hellip site exceeding the Massachusetts Surface Water Quality Standards Class B standards This finding prompted a focused examination of bacteria levels in 2003 However concerns of impairment hellip persist According to the Massachusetts Year 2016 Draft Integrated List of Waters the lower nineteen miles of the mainstem and four important tributaries of the Deerfield are assigned to Category 5 Waters for pathogenshellip
5 Background of DRWA Volunteer Bacteria Monitoring Program Deerfield River Watershed Association QAPP 2019 ndash continued
DRWA resumed monitoring of bacteria in the Deerfield watershed in 2017 hellipthe Connecticut River Conservancy (CRC) provides [lab services] Through [this] support DRWA has been able to test bacteria in hellipand include testing parameters besides bacteria in Massachusetts In 2019 CRC received the bacteria grant from MA DEP that will help cover the costs of testing bacteria in the Massachusetts portion of the watershed
Problem StatementhellipMassDEP and hellip VT DEC have identified several potential sources of nonpoint pollution in the Deerfield Watershed including failing septic systems stormwater runoff road runoff from paved and unpaved roads hellipand agricultural activities in close proximity to rivers and streams
In Massachusetts approximately nineteen (19) river miles hellip have been assigned to Category 5 (waters that require a hellip (TMDL calculation)hellipother river segments remained unassessed for recreation
In Vermont there is a bacteria TMDL Monitoring over the past 2 years suggests that the TMDL area may need to be extended Vermont is on a 5-year watershed basin planning cycle The Deerfield Watershed is currently undergoing its basin planning process
Problem Identification BackgroundNeponset RWA QAPP 2019
A5-1 Watershed DescriptionThe Neponset River Watershed covers 117 square mileshellip
A5-2 Organizational BackgroundThe Neponset River Watershed Association (NepRWA) is hellip
A5-3 Sources of Impairment and Pollutants of ConcernRemaining water quality problems in the watershed include hellipCurrent pollutants of concern in the Neponset Watershed includehellip
A5-4 Past Sampling EffortsThe Massachusetts DEP completed a very comprehensive water quality assessment hellip The CWMN program has been working to fill water quality information gaps and facilitate water quality improvement for more than 20 yearshellip
Sources of Information About Massachusetts Waters
1 Mass Water Quality Standards httpwwwmassgoveeaagenciesmassdepwaterregulations314-cmr-4-00-mass-surface-water-quality-standardshtml
2 Massachusetts Water Quality Assessments ldquoLook here for reports on the condition of watersheds in Massachusettsrdquo httpwwwmassgoveeaagenciesmassdepwaterwatershedswater-quality-assessmentshtml3
3 Integrated List of Waters httpswwwmassgovlistsintegrated-lists-of-waters-related-reports4 TMDLs httpwwwmassgoveeaagenciesmassdepwaterwatershedstotal-maximum-daily-loads-tmdlshtml25 Older Water Quality Assessment Reports httpwwwmassgoveeaagenciesmassdepwaterwatershedswater-
quality-assessmentshtml3
Deerfield River Basin
Program Goals and Objectives Part 2 of EPA Element 5
A5 Program Goals and Objectives - DEP
Project Purpose- DRWA
Objectives of Project
The principal objectives of projects under this QAPP are to 1) provide a perspective on the range of water quality conditions for recreation in the Deerfield River watershed across Vermont and Massachusetts 2) describe water quality conditions of individual tributaries and the mainstem 3) establish a database for use in documenting future changes in water quality and 4) educate and involve residents in waterbody protection
Toward those objectives DRWA will monitor 29 sites for E coli sampling during the recreation season June through September This project includes conducting a water quality monitoring program for E coli in the Vermont and the Massachusetts portions of the watershed where pathogens have been detected during previous sampling efforts undertaken by MassDEP and VT DEC
Project Purpose- DRWA
B Intended Uses of Data
The data generated under this QAPP will serve the following uses
- Use in the MassDEP CWA Integrated Report
- Document the presence and severity of bacteria as pathogen indicators
- Educate school children and local communities about water quality and any problems and improvements
- Evaluate the effectiveness of restoration projects and other management activities
A56 Program Goals and Objectives ndash NepRWANepRWArsquos CWMN program seeks to accomplish the following during the period 2019-2021
- Regularly collect in-stream water quality samples at a handful of ldquoindicator sitesrdquo that represent overall water quality conditions and trends
- Regularly collect in-stream water quality samples at a larger number of ldquosubwatershed sitesrdquo that target known or suspected problem areas
- Conduct ldquofollow uprdquo and ldquospecial studyrdquo investigations and sampling as needed to confirm and further specify suspected problem or opportunity areas identified through the regular sampling program
- hellip
- Collect in-stream samples during rainfall events
- Distribute results promptly to municipal officials state and federal regulators and the general public as a means to increase understanding of water pollution issues
- Using fully sterile methods collect data needed to help implement recommendations of the Total Maximum Daily Load (TMDL) for bacteria
- Generate data to help enhance the effectiveness of municipal state federal and private efforts to improve water quality
Monitoring Objectives amp DWM-DEP Data Levels
EducationalStewardship-levelbull Objective is to engage volunteers in monitoring to develop better understanding
of the importance of water resources and to encourage their fellow citizens to take an active role in the preservation and restoration of their local water bodies and watersheds
Screening-level bull Typically used to direct future sampling efforts and as supporting evidence only
RegulatoryAssessment-levelbull Directly usable for 305(b) and 303(d) decision-making bull Scientifically sound and legally-defensible bull Contingent on review and approval these data can help determine if a water body
is meeting water quality standards or is impaired
Monitoring Objectives amp DWM-DEP Data Levels
Project Task Description ndash EPA Element 6
In general terms describe bull The work your staffvolunteers will perform bull Where it will take placebull What kinds of samples will be takenbull What kinds of conditions will be measuredbull How you will evaluate results
DRWA Project PurposeTask Description
C Brief Description of Project- There will be a training and orientation meeting held in March organized by VTDEC but
held at VAEL - Volunteers will be trained annually prior to the start of the sampling season- River water samples will be collected at 29 sites 6 times between June and September- The project will employ the Colilert System developed by IDEXX laboratories Inc to assay
E coli bacteria Samples will be analyzed at the CRC laboratory- Data will be analyzed and reviewed for quality assurance summarized and interpreted on
an annual basis - Data that meet project quality objectives will be submitted to MassDEP and entered in the
VTDECrsquos Water Quality data management system as well as the EPArsquos national water quality data storage system known as STORET
- Information will be presented to the local community in a suitable format be it a press release public meeting or another event
- A report will be prepared and shared with the distribution list in this QAPP and published on the DRWA website (deerfieldriverorg)
Site ID Site Name Town Rationale Lat Lon Deerfield River Mainstem and Branches
VT-NBD_064
East Dover Rd Wilmington Monitor above most ag and below golf course
4291431 -728376
VT-NBD_027
Above Wilmington Center
Wilmington Monitor within ag and above village center
4287452 -72864
VT-NBD_020
Wilmington Center above confl w
Beaver Brk
Wilmington Monitor for high bacterianutrients and
Beaver Brk contribution
4286816 -728721
VT-NBD_018
Wilmington Center below confl w
Beaver Brk
Wilmington Swim holehigh bacterianutrients
4286875 -728738
MA-DFR_289
Shunpike Rest Area Charlemont Monitor Deerfield River coming from VT
426363 -729071
MA-DFR_276
Above Charlemont Center
Charlemont Bracket WWTF Mill Brk 426271 -728853
MA-DFR_267
Charlemont Center Charlemont Bracket WWTF Mill Brk 426262 -728685
MA-DFR_011
5 amp 10 Bridge Greenfield Monitor Deerfield contributions to CT River
PrecisionThe degree of agreement among repeated measurements of an indicator on separate samples collected as close as possible in time and place
It does not mean that the sample actually reflects the ldquotruerdquo value but rather that your sampling and analysis are giving consistent results under similar conditions
AccuracyAccuracy or Bias is a measure of confidence that describes
how close a measurement is to its ldquotruerdquo value
Parameter Reporting Limit
Accuracy ( Recovery)
Field Precision (RPD)
Expected Range
E coli 1 MPN 100ml
Blanks and negatives show no colonies positives show colonies
30 of log10 transformed MPN
0-2420 MPN
These objectives will be measured as follows
Field Specific Quality Controls
10 of samples collected (3 per event in 2019) will be field blanks Sterile water poured into sterile sample bottle in the field These must register lt1 for total coliform and E coli
10 of samples collected (3 per event in 2019) will be field duplicates A second sample will be collected at the same location by the volunteer These will have a Relative Percent Difference of le 30 for log transformed e values
Laboratory Sample Batch-Specific Quality Control Samples With each new batch of samples run CRC will perform the following QC sample analysis
1 Lab Blank - Sterile water1 Positive Culture Control -sterile buffer dilution water inoculated with E coli (ie total coliform amp E coli positive)1 Negative culture Control -sterile buffer dilution water inoculated with non-fluorescent Pseudomonas sp (ie
total coliform amp E coli negative) 1 Lab Duplicate ndash 250 mL sample split into 2 100 mL samples in the lab
DRWA Data Precision and Accuracy
REPRESENTATIVENESS
Representativeness is the extent to which measurements actually represent the true environmental condition
You will state that- Sampling sites were selected to appropriately capture
- the general characteristics of the water body- or specific impacts if you are conducting an impact assessment (eg above amp
below suspected pollution sourceshellip)- The sample collection point is appropriate eg mid-stream mid-lake etc what
sampling depth - Number of sites is adequate to answer study question- The parameters monitored are relevant to the type of impact or to a general
WQ assessment- Sample collection timing and frequency are selected to capture data that are
representative of target conditions (eg various water levels weather seasons)
MassDEP - RECOMMENDED MINIMUM SAMPLE NUMBER FREQUENCY AND TIMING FOR EXAMPLE PARAMETERS
Parameter
Streams Lakes
Min Sample Number and Frequency
Sampling Period Min Sample Number and Frequency
Sampling Period
DO (discrete) 5 results pre-dawn June - September 3 results (epilimnetic) June - September
DO (continuous) 3o days June - September 3o days June - September
pH 5 results June - September 3 results (epilimnetic) June - September
Temperature (discrete) 5 results afternoon June - September 3 results (epilimnetic) June - September
Temperature (continuous) 3o days June - September 3o days June - September
Bacteria (eg E coli) 3-5 results (in 30-90 days) April 1-October 15 3-5 results (in 30-90 days) April 1-October 15
Nutrients (inc chl a for lakes) 5 results June- September 3 results June - September
Secchi depth --- --- 3 results June - September
Chloride 3 results 4 day period (yr-round) --- ---
ldquoCleanrdquo metals 3 results 4 day period (summer) --- ---
Misc toxics emerging contam 3 results 30 day period (summer) 3 results (epilimnetic) 30 day period (summer)
Fish community 1 survey April 1-October 15 1 survey April 1-October 15
Fish tissue contaminants (eg Hg PCBs pesticides)
1 survey Any 1 survey Any
Benthic invertebrates (RBP3) 1 survey July ndash October --- ---
Weed surveys 1 survey June- September 1 survey June- September
Aesthetics 1 survey April 1-October 15 1 survey April 1-October 15
30 days (bathing) 90 days (non-bathing) ldquoworst-caserdquo typ July-Aug
REPRESENTATIVENESS
DRWAB Data RepresentativenessSamples collected at locations and depths described in this QAPP will reflect conditions of individual water bodies and tributaries in Vermont and Massachusetts To ensure representativeness all samples will be collected preserved and analyzed according to the procedures in this QAPP and within the specified holding times
NepRWAA7-5 Data RepresentativenessSampling points will be chosen to represent the water quality within the applicable geographic area of interest Staff experienced and knowledgeable in the factors affecting water quality will choose sample points that will be representative of conditions within the area of concern
COMPARABILITY
Comparability is the degree to which data can be compared directly to similar studies There are two things to consider future studies someone might undertake and past studies you (or others) will want to compare your data with
State that you will use and document standardized - sampling amp analytical methods and units of reporting- sampling sites times and dates - sample storage and transfer
Comparability
Deerfield River Watershed Association
C Data ComparabilityAll samples for each specific parameter will be collected and analyzed using the respective procedures described in this QAPP to ensure that comparisons between different sample sites sample dates depths and projects can be appropriately made Procedures are unchanged from previous years
Neponset River Watershed Association
A7-6 ComparabilityComparability is ensured by the utilization of established sampling and monitoring protocols from Massachusetts DEP MWRA Massachusetts Water Watch Partnership the Boston Water and Sewer Commission and NepRWA and by the use of standard test methods and procedures as outlined in Appendices 6 7 and 8
Completeness
Completeness is an estimate of the amount of data you will need to answer your study question Usually expressed as a of originally planned sample events after missing sample events and data no meeting DQOs are subtracted from the planned number
DRWA
D Data CompletenessAt least 80 of the anticipated number of samples will be collected at each site analyzed and determined to meet data quality objectives for the project to be considered successful A report detailing the number of anticipated samples number of valid results and percent completion (number of valid samplesnumber of anticipated samples) will be produced
NepRWAA7-8 CompletenessIn order to obtain the best picture of the watershed NepRWA expects 90 of the routine sampling and follow up sampling samples to be collected and analyzed during each scheduled sampling event In the routine sampling program uncertainties such as weather volunteer scheduling and illness sometimes result in unavoidable omissions but every effort is made to assign backup samplers when possible
Sampling Process Design - EPA Element 10From MassWWP QAPP Guide
Purpose To describe in greater detail the design of the sampling part of your monitoring program
In Section 6 you briefly outlined the sample process design In this section you should elaborate on the rationales for those choices When you complete this section you should revisit Section 6 and revise as necessary The two sections should be in agreement
What To Include bull Indicators or measures bull Types of samplesbull Sampling frequency bull Sampling period bull How you will select sample sites and identify them over timebull Site safety plans
MADEP - RECOMMENDED MINIMUM SAMPLE NUMBER FREQUENCY AND TIMING FOR EXAMPLE PARAMETERS
Parameter
Streams Lakes
Min Sample Number and Frequency
Sampling Period Min Sample Number and Frequency
Sampling Period
DO (discrete) 5 results pre-dawn June - September 3 results (epilimnetic) June - September
DO (continuous) 3o days June - September 3o days June - September
pH 5 results June - September 3 results (epilimnetic) June - September
Temperature (discrete) 5 results afternoon June - September 3 results (epilimnetic) June - September
Temperature (continuous) 3o days June - September 3o days June - September
Bacteria (eg E coli) 3-5 results (in 30-90 days) April 1-October 15 3-5 results (in 30-90 days) April 1-October 15
Nutrients (inc chl a for lakes) 5 results June- September 3 results June - September
Secchi depth --- --- 3 results June - September
Chloride 3 results 4 day period (yr-round) --- ---
ldquoCleanrdquo metals 3 results 4 day period (summer) --- ---
Misc toxics emerging contam 3 results 30 day period (summer) 3 results (epilimnetic) 30 day period (summer)
Fish community 1 survey April 1-October 15 1 survey April 1-October 15
Fish tissue contaminants (eg Hg PCBs pesticides)
1 survey Any 1 survey Any
Benthic invertebrates (RBP3) 1 survey July ndash October --- ---
Weed surveys 1 survey June- September 1 survey June- September
Aesthetics 1 survey April 1-October 15 1 survey April 1-October 15
30 days (bathing) 90 days (non-bathing) ldquoworst-caserdquo typ July-Aug
Deerfield River Watershed Association
10 Sampling Process Design
Sampling sites were selected to represent locations that receive heavy human use from swimmers boaters anglers and other contact recreational users
Samples will be collected bi-weekly from late June through early September (prime recreation period) between 10 AM and 1 PM Samplers will first fill out their field data sheet They will then collect a water sample away from the edge of the stream near the center of the stream (centroid of flow) and just below the surface following the MWWP protocol (available in the Appendix)
Samplers will place their samples immediately in a cooler with ice or frozen ice packs making sure the temperature in the cooler is at 4degC or lower Each sample bottle will be placed in an individual clean Ziploc bag to avoid cross contamination
Neponset River Watershed Association
B1 Sampling Process Design
The CWMN program is designed to develop and maintain a record of general water qualitythroughout the watershed Project goals include both evaluation of long-term changes over time across the watershed as a whole and the identification of pollution hotspots at a low order subwatershed scale
Routine sampling activities consist of collecting in-stream samples As discussed above routine sampling sites are divided among ldquoindicatorrdquo sites and ldquosubwatershed sitesrdquo in order to meet the dual objectives of the program Indicator sites are selected to be representative of overall water quality and are relatively unchanging over time to allow comparison to past and future investigations Sites have generally been selected at the downstream ends or key segmentation points of major subwatersheds and at or near locations where there is a longstanding data record
Neponset River Watershed Association
B1 Sampling Process Design ndash continued
Subwatershed sites are selected to provide higher spatial resolution along individual streams in an effort to bracket pollution sources and facilitate their identification and remediation Subwatershed sites make up roughly 60 of the overall number of sites and are more likely to change from year to year Subwatershed sites may be rotated through different watersheds over the course of several sampling seasons to provide detailed data on different subwatersheds over a period of years Specific sites are selected by the project manager on the basis of known or suspected problems or opportunities or to fill in a lack of detailed data in a specific area
Neponset River Watershed Association
B1 Sampling Process Design ndash continued
In addition to the routine sampling activities CWMN also encompasses follow up and special study sampling activities These are generally ldquoone-timerdquo investigations intended to zero in on pollution sources in a known or suspected problem areahellipSpecific sampling stations may be planned in advance or may be chosen opportunistically by samplers while in the field
The mix of parameters sampled at each site depends on its status as an indicator subwatershed or follow up station the relative location of the station in the watershed and the specific pollutant(s) of concern at that specific location Indicator sites are tested for bacteria nutrients ammonia and field measured parametershellip Subwatershed sites are generally tested for bacteria total phosphorus and field measured parameters At some subwatershed sites hellip Follow up sampling stations will generally be tested for a very narrow set of parameters based on the specific pollutant of concern A listing of current routine sampling stations and the parameters sampled is provided in the Appendix 1e
Sampling Methods Requirements - EPA Element 11
This section describes your field measurementsample collection methods It can be stated in table form with narrative descriptions if you choose
Includebull What parameters are being sampledbull Sampling containersdevices sample preservation steps Maximum holding timebull Amount of sample to be collectedbull Summarize steps taken by field samplersbull Reference to the method followed (cite specific SOPS include in appendices)bull Can also include sampling considerations (eg time of day steps taken to avoid stirring up
sediments sample collection depth etc) These will be detailed in SOPs
Deerfield River Watershed Association
ParameterMeasure Container Field Rinse Preservation Hold Time E coli 120 mL IDEXX
Cool to lt4degC 6 hours to lab 8 hours to processing
B2 Sampling Methods
B2-2 Visual ObservationsB2-3 Fecal Coliform E coli and EnterococcusB2-5 NutrientsB2-6 Specific Conductance and SalinityB2-7 TemperatureB2-8 pH B2-9 Dissolved OxygenB2-10 SurfactantsB2-11 Depth and FlowB2-12 Optical BrightenersB2-13 Qualitative Ammonia Nitrogen
Neponset River Watershed Association
Sample Handling and Custody Requirements - EPA Element 12
Demonstrate that your sampling handling and storage techniques will retainsafeguard the integrity of your samples and data records
12 Sample Handling and Custody Procedures
Samples will be collected between 7 AM and 10 AM on sampling days The samples will be kept on ice inside a cooler during transport Wilmington VT area samples will be picked up by the monitoring assistant in the Main Street parking lots or other agreed upon meeting location by 9 AM Green River VT samples will be picked up by the transporting volunteer at the Green River covered bridge or other agreed upon meeting location by 930 AM The remaining samples will be delivered directly to the CRC water quality lab by 10 AM Any exchange of possession in the samples will be documented on the Chain of Custody (CoC) form which will be completed and signed by the Lab Analyst upon receipt at the lab The CoC form will be checked by the program coordinator See Appendix for the CoC
Deerfield River Watershed Association
Analytical Methods Requirements - EPA Element 13
Deerfield River Watershed Association
13 Analytical Methods Requirements
All analytical determinations will be performed at the CRC lab in Greenfield by the Lab Director Gabriel Chevalier
Indicator
Method Number
Source
Reporting Units
Modifications or Options
E coli
United water laboratory 1603 Bacteria Colilert SOP 604b CRWC 03-11-10
EPA 1603 (Modified m-TEC)
1 MPN
Sodium Thiosulfate used in all containers
Neponset River Watershed Association
Massachusetts Volunteer Monitorrsquos Guide to QAPP DevelopmentPAGE 61
Here are some things to consider in choosing a method Scientific Considerations Does it meet your data quality objectives
How accurate is it How precise (reproducible) is it What is its detection limit
Will it measure the indicator in the range that you need What lab facilities are required What equipment is required Does it yield samples that are representative Is it comparable to methods used by agencies collecting similar information
Practical and Program Considerations bull Do you have the human and financial resources to do it bull How difficult is it bull How time-consuming is it bull Will it produce data useful to the target audience
Quality Control ndash EPA Element 14
This section documents that the specific quality control measures you will take will allow you to determine whether you meet your data quality objectives
What To Include Section 7 stated your DQOs Here you describe how you are going to meet them
For each indicator include the following information
bull Accuracy Precision checks list what checks you will perform
bull List the of your samples upon which you will perform quality checks that will represent the quality of all your samples
Quality Control
Accuracy checks
There are a variety of ways to check the accuracy of your sampling and analysis
Checks can be done internally (done totally within your project lab) or externally (done with the assistance of an independent lab)
Known Samples This is an internal check that compares your results against another analyst or a ldquoknownrdquo An example of a known is a quality assurance sample that UMass WRRC sends to VM groups for pH DO or alkalinity ndash with the expected value communicated when sample is sent
Proficiency Testing (Unknown) Samples In some cases there are programs that provide proficiency testing samples for laboratory performance evaluation the concentrations of which are known to the auditor but not to the lab being tested This is relatively common for most water chemistry indicators An example of an unknown would when WRRC sends a quality assurance sample without communicating the expected value in advance
Quality Control
Accuracy checks - continued
Blank and Positive Plates Bacteriological samples should be checked using the blank and positive plate procedure The blank plate uses the rinse water media and equipment in the analysis to determine if there is contamination in the laboratory materials The result should be 0 The positive plate procedure uses a sample known to contain bacteria (eg waste- water treatment plant influent) to determine if a procedural error in the lab causes inhibition of bacterial growth Results should be rdquoToo Numerous To Countrdquo Each batch of samples should include at least one blank and one positive check sample This is an internal check
Spiked Samples Spikes are additions of a known amount of the indicator with the expectation that subsequent analysis will measure exactly that much increase over the un- spiked sample This procedure is described in Section 1020 B of Standard Methods This is an internal check
Voucher and Reference Collections For macroinvertebrates and aquatic plants maintenance of a voucher andor a working reference collection is recommended A voucher collection is a preserved collection of the type specimens ie an example of each of the individual taxa that you have given a name It should be maintained in archival condition by a trained curator typically found at a university A reference collection is an exact duplicate of the voucher collection but is the one that you will regularly use as a reference when identifying new specimens Both voucher and reference collections should be verified by an expert This is an external check Alternatively have an expert review IDs made by volunteers of at least 10 of specimens collected 90 accuracy is recommended
Quality Control
Precision Checks
Precision checks are primarily accomplished through replicate sampling amp analysis in the field and lab
Field Replication Replication can be done by the same field collectors but some replication by other collectors is good eg a pair of field collectors swapping roles or have different team collect the replicate This is an internal check
Lab Replication Additional replication should occur in the lab Lab replication is done by dividing a well-mixed sample into two or more aliquots and conducting analysis on each aliquot This is an internal check
Split Samples Split samples (a sample that is split into two sub-samples) can be done in the field or the lab
Relative Percent Difference
A measure of precision used for duplicate sample results It is calculated by dividing the difference between the two results by the mean of the two results expressed as a percentage Used when sample number equals two
eg ((98-92) 100) ((98+92))2 = 63
Deerfield River Watershed Association
14 Quality Control RequirementsA Volunteers Check - Field AuditEither the QC Officer the Project Coordinator or both will accompany a crew of volunteers (each) to their site each collection The trainers will observe the volunteersrsquo performance and check their sampling technique and field data sheets for accuracy
B Field QC ChecksAt least one Field Duplicate and one Field Blank will be submitted for every ten samples collected
Field Duplicate ndash a check on water quality sampling amp analysis consistency This is a replicated sample collected at the same point in time and space side by side with the first sampling and given a separate Sample ID number
Field Blanks ndash a check for contamination (AccuracyBias) in the field by processing laboratory-supplied deionized water through the sampling train This checks for contamination introduced from the sample container(s) or from field contamination A Field Blank will be taken by one volunteer at one site per sampling day for bacteria A container of DI water will be given to the volunteer who will pour this DI water into the sample bottle at the site
We will rotate the field duplicate and field blank samples among the volunteers throughout the sampling season so a maximum of collectors can be checked
Deerfield River Watershed Association
14 Quality Control Requirements ndash continued
C Laboratory QC ChecksA Lab Duplicate will be analyzed each sampling day The lab will split a randomly chosen sample and analyze both subsamples
The lab will run a Lab Blank and a Positive Sample for bacteria each collection (see section 7)
D Data Analysis QC ChecksRiver data and QC data will be reviewed by the QC Officer as soon as they come in from the lab after each collection QC data will be compared to the quality objectives (eg blanks should have zero colonies sample duplicates should be within 3 standard deviations of the mean positives should show bacterial growth etc) River data will be reviewed as well to ensurethat no field or lab contamination has occurred (data will be compared to those of other sites and of previous collections)
Bacteria computations will be checked and validated If discrepancies are found the Lab Director will be called to resolve the discrepancy and corrections will be made by the QC Officer
Field data sheets will be also reviewed the day of collection by the Project Coordinator and later by the QC Officer to ensure that samples were taken at the right times and that all the required information has been filled out The Project Coordinator or collectors will be called if omissions or errors are detected If needed corrections will be made (signed anddated) on the field sheet by the QC Officer
Neponset River Watershed Association
PRECISION DQOS DEALING WITH LOW-LEVEL CONCENTRATIONS
Source Analyte Units PrecisionMassDEP WPP Monitoring QAPP
Training Requirements Certification ndash EPA Element 8
In Narrative or Table Format
bull List type of training (eg Field WQ lab analysis visual observation data mgt data entry etc)
bull Who is training who receives training
bull How often training done
If training records are kept (they should be) include that in section 9 on documentation and records
Neponset River Watershed Association
A8 Training - ExcerptTo ensure the high quality and usability of the data that is generated by the CWMN program all participants receive training appropriate to the tasks for which they will be responsible NepRWA staff that are involved in the program are professionals with extensive training in water quality chemistry biology and field sampling NepRWA has established a program of training for volunteers that includes initial training follow-up and refresher classes These classes are given by NepRWA staff that are qualified not only in the technical matter covered but in training and education
The initial training for volunteer monitors is primarily instruction and demonstration by the trainer with repetition by the volunteer This training includes an overview of the entire project and detailed instruction in sampling procedures All monitors receive and review a copy of NepRWArsquos Water Monitoring and Sampling Manual (see Appendix 3a)
After their initial training all volunteers participate in a mandatory annual group andor individual training session These sessions are designed to update the volunteers on changes in the program further train them in equipment calibration and field-testing procedures and evaluate each volunteerrsquos performancehellip
InstrumentEquipment Testing Inspection and Maintenance Requirements ndash EPA Element 15
Instrument Calibration and Frequency ndash EPA Element 16
InspectionAcceptance Requirements for Supplies ndash EPA Element 17
DOCUMENTATION AND RECORDS ndash EPA ELEMENT 9
Neponset River Watershed AssociationA9 Documents and RecordsA9-1 Data SheetsField data sheets include information about the site location (NepRWA ID number) which specific equipment was used to make measurements (thermometer number) the sampling method used (direct fill pole or Bridge Buddy) and equipment calibration results The field data sheets are also used to record temperature velocity depth color odor and turbidity information (Appendix 4e)helliphellip See Appendix 4 for copies of the various data sheets used in the CWMN program
A9-2 Chain of Custody FormsA9-3 Sample LabelingA9-4 Equipment Custody FormA9-5 Training and Evaluation Form
Data Acquisition Requirements - EPA Element 18
Purpose To ensure that any data you use but donrsquot collect yourself has a known data quality and is consistent with your data quality objectives that others can access these data and that your use of the data is appropriate
Describe any external data you use such as GPS coordinates for site locations weather station rainfall amounts etc
Include bull The title of the document or name of the informationbull Where you obtained it and where others may find itbull Notes on the quality of the outside information such as uncertainties and caveats
Preamble to Elements 19 through 24
Consider the four separate objectives of these chapters1) Producing a good data set - 19 covers the normal data mgt routines you do to prevent data mistakes in the first place- 22 amp23 describe how you review the resulting data sets - how you find and correct
missing or erroneous data - 19 22 and 23 should produce as complete amp accurate a data set as possible 2) Ensuring that any use you make of your data is justified In 24 you decide how usable your data are Review the final data set that the above efforts have produced Compare it with your DQOs to determine whether you have to discard or qualify any data what conclusions you can draw from your data or what changes you might need to make in your DQOs3) Improve overall project performance 20 deals with how well volunteers laboratories and equipment are operating It looks at function not outcomes Who evaluates the various components of your program when problems are found what corrections are made to make your program run better4) Report your results After yoursquove run these various checks you are ready to release your data In Chapter 21 you describe the reports you will issue
Suggested order bull Data Management (19)bull Data Review Validation and Verification Requirements (22)bull (Data) Validation and Verification Methods (23)
bull Reconciliation with Data Quality Objectives (24)
bull Assessment and Response Actions (20)
bull Reports (21)
EPA Elements 19 ndash 24
bull Data Management (19)bull Assessment and Response Actions (20) bull Reports (21)bull Data Review Validation and Verification Requirements (22)bull (Data) Validation and Verification Methods (23)bull Reconciliation with Data Quality Objectives (24)
Data Management ndash EPA Element 19
Follow the data from the moment itrsquos recorded through every step to final report databaseIntent is to prevent errors or loss of data or be able to correct in timely manner
bull Before each activitystep is conducted well-designed field sheets checklists COC forms data entry software auto-QC calculations out-of-bounds highlights etc
bull During each step sheets filled completely checklist reviewed before leaving site etc
bull Immediately after Computer-entered data compared with field sheets etc
bull Long term preservation Data storage
Neponset River Watershed Association
B9 Data ManagementThe Project Manager is responsible for overseeing all data management activities Refer also to section D below for additional discussion of data review verification and validation practices
B9-1 Raw DataField data sheets are collected with the samples The sheets are turned into the NepRWA office by the site coordinators The forms are then reviewed for illegible answers errors or questionable values and checked for consistency with the COC and bottle labels as described in Appendix 3l Any questions are referred to the volunteer for clarification NepRWA staff makes corrections by crossing out the errors and writing in the correct answer All corrections must be initialed
B9-2 Data Entry and ValidationOnce the information has undergone a preliminary check it is entered into a Filemaker database The software has been customized to the data sheet Fields within the worksheet have been set-up with limits based on expected results This helps to minimize entry errors Entered data is then checked against the data sheets by another volunteer or staff person
B9-3 Data StorageThe original data sheets are filed into an event file and stored in NepRWArsquos permanent files Electronic copies of data are maintained on a secure Filemaker server Data files are kept in perpetuity along with hard copies of volunteer data sheets All electronic data is backed-up daily on to a password-protected hard drive
Data Review Validation and Verificationndash EPA Element 22
(Data) Validation and Verification Methods ndash EPA Element 23
Deerfield River Watershed Association
22 Data Review Validation and Verification ndash Summarized bullet list
All data reviewed by the Project Coordinator and QA Coordinator
Data Analysis QC Checks will includebull Data entry checks by a second personbull Computer entries compared with fieldlab sheetsbull Checks on graphs amp all other data representationsbull Calculation of measures of data quality including completeness
Corrective actionsbull Data entry errors corrected bull Data outside expected range flagged or rejected bull 2nd field sample andor laboratory aliquot taken when possiblebull Data quality problems discussed in draft and final reports
(Data) Validation and Verification Methods ndash EPA Element 23 From Inland QAPP
Validation and Verification Methods will include checks on bull Completion of all fields on data sheets missing data sheetsbull Completeness of sampling runs (eg number of sites visitedsamples taken vs number proposed were all parameters sampledanalyzed)bull Completeness of QC checks (eg number and type of QC checks performed vs numbertype proposed)bull Accuracy and precision compared to data quality objectivesbull Representativeness of samples and resulting data by examining survey metadata for unusual conditions and occurrences that may have impacted the validity of results
Deerfield River Watershed Association ndash Excerpt summarized
23 Validation and Verification Methods
The following simple measures of data quality will be calculated and included in the final report
1) To screen for contamination the average blank concentration hellip will be calculated This average value should be as close as practical to the Reporting Limit listed in Table 4
2) To assess the precision of results the ldquoMean Relative Percent Differencerdquo between field duplicate samples should be calculated The average RPD should be less than or equal to the Estimated Precision listed in Table 4 This simple measure is calculated as follows
RPD formula used hellip
Reconciliation With Data Quality Objectives ndash EPA Element 24MassWWP guide to QAPP development
What to Include bull List who will evaluate your actual data vs your data quality goals bull State how and when this will be done bull Describe the process for determining what to do if goals are not met
Neponset River Watershed Association
D2 Reconciliation with User Requirements - Summarized bulletedbull Following each sampling event and prior to the subsequent event calculations and
determinations for precision completeness and accuracy will be made bull Any corrective action will be implemented noted and initialized by the project manager bull If data quality indicators do not meet the projectrsquos specifications then data may be discarded
may be flagged or re-sampling may occur bull Investigation of problems will take place and corrections will be documented If equipment
failure is found to be the cause calibration and maintenance techniques will be reassessed Field duplicate testing may occur during the next sampling event to ensure confidence in the results
bull Any limitations on the data will be noted bull Any revisions to the project will be submitted to EPA and DEP quality assurance officers for
approval
Assessment and Response Actions - EPA Element 20 From Inland QAPP
Document that the progress and quality of the monitoring program will be continuously assessed to ensure that its objectives are being accomplished
The Monitoring Coordinator will periodically check to see the following bull Monitoring is occurring as planned bull Sufficient written commentary and supporting photographs exist bull Sufficient volunteers are available bull Volunteers have been observed as they sample their sites bull Samplers are collecting in accordance with project schedules bull Data sheets and custody control sheets are being properly completed and signed bull Data are properly interpreted bull Plans for dealing with adverse weather are in place
Assessment and Response Actions - EPA Element 20 From Inland QAPP ndash continued
The Monitoring Coordinator will periodically check to see the following bull Retraining or other corrective action is implemented at the first hint of non compliance with the
QAPP or SOPs bull Labs are adhering to the requirements of their QAPP in terms of work performed accuracy
acceptable holding times timely and understandable results and delivery process bull Data management is being handled properly ie data are entered on a timely basis is
properly backed up is easily accessed and raw data are properly stored in a safe placebull Procedure for developing and reporting the results exists
Assessment and Response Actions - EPA Element 20 From Inland QAPP ndash continued
The Monitoring Coordinator will confer with the QA Officer as necessary to discuss any problems that occur and what corrective actions are needed to maintain program integrity In addition the Monitoring Coordinator and QA Officer will meet at the end of the sampling season to review the draft report and discuss all aspects of the program and identify necessary program modifications for future sampling activities [If the program includes a technical advisory committee the TAC will be included in these discussions] Corrections may include retraining volunteers rewriting sampling instructions replacement of volunteers alteration of sampling schedules sites or methods or other actions deemed necessary All problems discovered and program modifications made will be documented in the final version of the project report If modifications require changes in the Quality Assurance Project Plan these changes will be submitted MassDEP for review
Deerfield River Watershed Association
20 Assessment and Response Actions ndash Summarized bullet list
bull There will be an on-site visit by the Quality Control Officer to observe field sampling and field analysis procedures Generally this will be done near the beginning of the project
bull A written checklist will be used for the assessments maintained by the Project Coordinator and copies will be provided with the data report
bull The Project Coordinator and QC Officer will determine if field work follows the written procedures or if there needs to be corrections by additional training or revising protocols
bull Please refer to Section 22 for additional evaluations and response actions regarding data evaluations
Reports ndash EPA Element 21
Project Task Organization ndash EPA Element 4 Reviewrevise early choices
Distribution List ndash EPA Element 3
Title and Approval Page - EPA Element 1
Table of Contents ndash EPA Element 2
Water quality monitoring quality assurance workshop
Terminology
Study design
QAPP
sampling and analysis plan
standard operating procedures
data quality objectives
Water Quality Monitoring Planning Process
Monitoring program activities
Why do you need (who Gives) a qapp
Slide Number 11
Slide Number 12
Steps to Developing a QAPP
Slide Number 14
Slide Number 15
Slide Number 16
Steps to Developing a QAPP
Slide Number 18
Slide Number 19
Slide Number 20
Slide Number 21
Slide Number 22
Slide Number 23
Slide Number 24
Sources of Information About Massachusetts Waters
Slide Number 26
Slide Number 27
Slide Number 28
Slide Number 29
Slide Number 30
Slide Number 31
Slide Number 32
Slide Number 33
Slide Number 34
Slide Number 35
Slide Number 36
Slide Number 37
Slide Number 38
Slide Number 39
Slide Number 40
Slide Number 41
Slide Number 42
Slide Number 43
Slide Number 44
Slide Number 45
Slide Number 46
MassDEP - Recommended Minimum Sample Number Frequency and Timing for Example Parameters
Slide Number 48
Slide Number 49
Slide Number 50
Slide Number 51
Slide Number 52
MaDep - Recommended Minimum Sample Number Frequency and Timing for Example Parameters
Slide Number 54
Slide Number 55
Slide Number 56
Slide Number 57
Slide Number 58
Slide Number 59
Slide Number 60
Slide Number 61
Slide Number 62
Slide Number 63
Slide Number 64
Slide Number 65
Slide Number 66
Slide Number 67
Slide Number 68
Slide Number 69
Slide Number 70
Slide Number 71
Slide Number 72
Slide Number 73
Slide Number 74
Slide Number 75
Slide Number 76
Precision DQOs Dealing with low-level concentrations
Slide Number 78
Slide Number 79
Slide Number 80
Slide Number 81
Slide Number 82
Documentation and Records ndash EPA Element 9
Slide Number 84
Slide Number 85
Slide Number 86
Slide Number 87
Slide Number 88
Slide Number 89
Slide Number 90
Slide Number 91
Slide Number 92
Slide Number 93
Slide Number 94
Slide Number 95
Slide Number 96
Slide Number 97
Slide Number 98
Slide Number 99
Slide Number 100
Site ID
Site Name
Town
Rationale
Lat
Lon
Deerfield River Mainstem and Branches
VT-NBD_064
East Dover Rd
Wilmington
Monitor above most ag and below golf course
4291431
-728376
VT-NBD_027
Above Wilmington Center
Wilmington
Monitor within ag and above village center
4287452
-72864
VT-NBD_020
Wilmington Center above confl w Beaver Brk
Wilmington
Monitor for high bacterianutrients and Beaver Brk contribution
4286816
-728721
VT-NBD_018
Wilmington Center below confl w Beaver Brk
Wilmington
Swim holehigh bacterianutrients
4286875
-728738
MA-DFR_289
Shunpike Rest Area
Charlemont
Monitor Deerfield River coming from VT
426363
-729071
MA-DFR_276
Above Charlemont Center
Charlemont
Bracket WWTF Mill Brk
426271
-728853
MA-DFR_267
Charlemont Center
Charlemont
Bracket WWTF Mill Brk
426262
-728685
MA-DFR_011
5 amp 10 Bridge
Greenfield
Monitor Deerfield contributions to CT River
4256975
-725922
North River
VT-EBN_150
Above Jacksonville WWTF
Whitingham
Bracket WWTF
42787
-728163
VT-EBN_147
Below Jacksonville WWTF
Whitingham
Bracket WWTF
4278456
-728128
MA-EBN_024
Foundry Village Rd Ballfields
Colrain
Swim hole
4267478
-726966
MA-NOR_001
Formerly Sunburn Beach
Colrain
Mouth of North River
4265286
-727141
Green River Watershed
VT-PND_001
Mouth of Pond Brook
Halifax
Green River reclassification in support of Green River Watershed Alliance grant
428135
-727243
VT-GRN_234
Hinesburg Rd
Guilford
Green River reclassification in support of Green River Watershed Alliance grant
4279717
-726804
VT-HBG_001
Mouth of Hinesburg Brook
Guilford
Green River reclassification in support of Green River Watershed Alliance grant
4279582
-726605
VT-GRN_202
Green River Timber Crib Dam swim hole
Guilford
Swim HoleGreen River reclassification in support of Green River Watershed Alliance grant
4277555
-726673
VT-GRN_168
MAVT State Line
Guilford
Green River reclassification in support of Green River Watershed Alliance grant
4273299
-726761
MA-GRN_098
Bare Ass Beach
Greenfield
Swim Hole
4265102
-726235
MA-MPL_001
Mouth of Maple Brook
Greenfield
ID source of bacterianutrients
4258667
-726124
MA-GRN_020
Mohawk Trail Bridge
Greenfield
ID source of bacterianutrients
4258554
-726117
MA-GRN_008
Pretty Plain Rd
Greenfield
Monitor Green River contributions to Deerfield River high bacterianutrients
4257636
-725984
Other Tributaries
VT-
ELS_002
Ellis Brook TBD
Wilmington
Monitor below WWTF
429202
-728381
VT-COB_003
Cold Brook Above confl with N Br Deerfield
Wilmington
General water quality monitoring effect of Mt Snow pond
4289928
-728595
VT-BVR_029
Near Shearer Hill Rd
Wilmington
Monitor for runoff
42855
-728385
VT-BVR_011
Off Rte 9 near Wahoorsquos
Wilmington
Monitor for high bacteriarunoff
4286523
-728588
MA-CHI_001
Chickley River Tower Rd
Charlemont
Monitor contributions to Deerfield River
4263005
-729016
MA-MBK_001
Mill Brook TBD
Charlemont
Monitor mouth for contribution
426271
-728728
MA-CLS_003
Clesson Brook Buckland Rec Area
Buckland
Swim hole monitor contributions to Deerfield River
4261553
-72767
MA-SOU_024
South River Reeds Bridge Rd
Conway
Swim hole
4254131
-726901
Problem Identification BackgroundEPA Element 5
From MA VM QAPP Guidebook
bull Describe your organizationbull Describe your watershed and waters of interestbull Describe the current status of your waters of interestbull State water quality issues of concernbull Describe information needed to address the concernbull List your monitoring questionsbull What are your monitoring purposesbull List intended users uses of information you collect
5 Background of DRWA Volunteer Bacteria Monitoring Program Deerfield River Watershed Association QAPP 2019
The Deerfield River Watershed encompasses approximately 665 square miles Thehellip River is widely regarded as one of the coldest and cleanest rivers in Massachusetts and attracts many sport-fishermen and whitewater enthusiasts However nonpoint source pollution has degraded segments hellip and poses a threat to other tributaries The DRWA has intermittently monitored the water quality hellip since 1990 to document the current quality of the watershed
hellip DRWA started monitoring fecal coliform bacteria at popular recreation sites to provide data in the intervening years [between DEP monitoring schedules] hellip In 1999 DRWA monitored bacteria above and below hellip WWTPs and at a few recreational siteshellip high counts of bacteria were recorded from at least one hellip site exceeding the Massachusetts Surface Water Quality Standards Class B standards This finding prompted a focused examination of bacteria levels in 2003 However concerns of impairment hellip persist According to the Massachusetts Year 2016 Draft Integrated List of Waters the lower nineteen miles of the mainstem and four important tributaries of the Deerfield are assigned to Category 5 Waters for pathogenshellip
5 Background of DRWA Volunteer Bacteria Monitoring Program Deerfield River Watershed Association QAPP 2019 ndash continued
DRWA resumed monitoring of bacteria in the Deerfield watershed in 2017 hellipthe Connecticut River Conservancy (CRC) provides [lab services] Through [this] support DRWA has been able to test bacteria in hellipand include testing parameters besides bacteria in Massachusetts In 2019 CRC received the bacteria grant from MA DEP that will help cover the costs of testing bacteria in the Massachusetts portion of the watershed
Problem StatementhellipMassDEP and hellip VT DEC have identified several potential sources of nonpoint pollution in the Deerfield Watershed including failing septic systems stormwater runoff road runoff from paved and unpaved roads hellipand agricultural activities in close proximity to rivers and streams
In Massachusetts approximately nineteen (19) river miles hellip have been assigned to Category 5 (waters that require a hellip (TMDL calculation)hellipother river segments remained unassessed for recreation
In Vermont there is a bacteria TMDL Monitoring over the past 2 years suggests that the TMDL area may need to be extended Vermont is on a 5-year watershed basin planning cycle The Deerfield Watershed is currently undergoing its basin planning process
Problem Identification BackgroundNeponset RWA QAPP 2019
A5-1 Watershed DescriptionThe Neponset River Watershed covers 117 square mileshellip
A5-2 Organizational BackgroundThe Neponset River Watershed Association (NepRWA) is hellip
A5-3 Sources of Impairment and Pollutants of ConcernRemaining water quality problems in the watershed include hellipCurrent pollutants of concern in the Neponset Watershed includehellip
A5-4 Past Sampling EffortsThe Massachusetts DEP completed a very comprehensive water quality assessment hellip The CWMN program has been working to fill water quality information gaps and facilitate water quality improvement for more than 20 yearshellip
Sources of Information About Massachusetts Waters
1 Mass Water Quality Standards httpwwwmassgoveeaagenciesmassdepwaterregulations314-cmr-4-00-mass-surface-water-quality-standardshtml
2 Massachusetts Water Quality Assessments ldquoLook here for reports on the condition of watersheds in Massachusettsrdquo httpwwwmassgoveeaagenciesmassdepwaterwatershedswater-quality-assessmentshtml3
3 Integrated List of Waters httpswwwmassgovlistsintegrated-lists-of-waters-related-reports4 TMDLs httpwwwmassgoveeaagenciesmassdepwaterwatershedstotal-maximum-daily-loads-tmdlshtml25 Older Water Quality Assessment Reports httpwwwmassgoveeaagenciesmassdepwaterwatershedswater-
quality-assessmentshtml3
Deerfield River Basin
Program Goals and Objectives Part 2 of EPA Element 5
A5 Program Goals and Objectives - DEP
Project Purpose- DRWA
Objectives of Project
The principal objectives of projects under this QAPP are to 1) provide a perspective on the range of water quality conditions for recreation in the Deerfield River watershed across Vermont and Massachusetts 2) describe water quality conditions of individual tributaries and the mainstem 3) establish a database for use in documenting future changes in water quality and 4) educate and involve residents in waterbody protection
Toward those objectives DRWA will monitor 29 sites for E coli sampling during the recreation season June through September This project includes conducting a water quality monitoring program for E coli in the Vermont and the Massachusetts portions of the watershed where pathogens have been detected during previous sampling efforts undertaken by MassDEP and VT DEC
Project Purpose- DRWA
B Intended Uses of Data
The data generated under this QAPP will serve the following uses
- Use in the MassDEP CWA Integrated Report
- Document the presence and severity of bacteria as pathogen indicators
- Educate school children and local communities about water quality and any problems and improvements
- Evaluate the effectiveness of restoration projects and other management activities
A56 Program Goals and Objectives ndash NepRWANepRWArsquos CWMN program seeks to accomplish the following during the period 2019-2021
- Regularly collect in-stream water quality samples at a handful of ldquoindicator sitesrdquo that represent overall water quality conditions and trends
- Regularly collect in-stream water quality samples at a larger number of ldquosubwatershed sitesrdquo that target known or suspected problem areas
- Conduct ldquofollow uprdquo and ldquospecial studyrdquo investigations and sampling as needed to confirm and further specify suspected problem or opportunity areas identified through the regular sampling program
- hellip
- Collect in-stream samples during rainfall events
- Distribute results promptly to municipal officials state and federal regulators and the general public as a means to increase understanding of water pollution issues
- Using fully sterile methods collect data needed to help implement recommendations of the Total Maximum Daily Load (TMDL) for bacteria
- Generate data to help enhance the effectiveness of municipal state federal and private efforts to improve water quality
Monitoring Objectives amp DWM-DEP Data Levels
EducationalStewardship-levelbull Objective is to engage volunteers in monitoring to develop better understanding
of the importance of water resources and to encourage their fellow citizens to take an active role in the preservation and restoration of their local water bodies and watersheds
Screening-level bull Typically used to direct future sampling efforts and as supporting evidence only
RegulatoryAssessment-levelbull Directly usable for 305(b) and 303(d) decision-making bull Scientifically sound and legally-defensible bull Contingent on review and approval these data can help determine if a water body
is meeting water quality standards or is impaired
Monitoring Objectives amp DWM-DEP Data Levels
Project Task Description ndash EPA Element 6
In general terms describe bull The work your staffvolunteers will perform bull Where it will take placebull What kinds of samples will be takenbull What kinds of conditions will be measuredbull How you will evaluate results
DRWA Project PurposeTask Description
C Brief Description of Project- There will be a training and orientation meeting held in March organized by VTDEC but
held at VAEL - Volunteers will be trained annually prior to the start of the sampling season- River water samples will be collected at 29 sites 6 times between June and September- The project will employ the Colilert System developed by IDEXX laboratories Inc to assay
E coli bacteria Samples will be analyzed at the CRC laboratory- Data will be analyzed and reviewed for quality assurance summarized and interpreted on
an annual basis - Data that meet project quality objectives will be submitted to MassDEP and entered in the
VTDECrsquos Water Quality data management system as well as the EPArsquos national water quality data storage system known as STORET
- Information will be presented to the local community in a suitable format be it a press release public meeting or another event
- A report will be prepared and shared with the distribution list in this QAPP and published on the DRWA website (deerfieldriverorg)
Site ID Site Name Town Rationale Lat Lon Deerfield River Mainstem and Branches
VT-NBD_064
East Dover Rd Wilmington Monitor above most ag and below golf course
4291431 -728376
VT-NBD_027
Above Wilmington Center
Wilmington Monitor within ag and above village center
4287452 -72864
VT-NBD_020
Wilmington Center above confl w
Beaver Brk
Wilmington Monitor for high bacterianutrients and
Beaver Brk contribution
4286816 -728721
VT-NBD_018
Wilmington Center below confl w
Beaver Brk
Wilmington Swim holehigh bacterianutrients
4286875 -728738
MA-DFR_289
Shunpike Rest Area Charlemont Monitor Deerfield River coming from VT
426363 -729071
MA-DFR_276
Above Charlemont Center
Charlemont Bracket WWTF Mill Brk 426271 -728853
MA-DFR_267
Charlemont Center Charlemont Bracket WWTF Mill Brk 426262 -728685
MA-DFR_011
5 amp 10 Bridge Greenfield Monitor Deerfield contributions to CT River
PrecisionThe degree of agreement among repeated measurements of an indicator on separate samples collected as close as possible in time and place
It does not mean that the sample actually reflects the ldquotruerdquo value but rather that your sampling and analysis are giving consistent results under similar conditions
AccuracyAccuracy or Bias is a measure of confidence that describes
how close a measurement is to its ldquotruerdquo value
Parameter Reporting Limit
Accuracy ( Recovery)
Field Precision (RPD)
Expected Range
E coli 1 MPN 100ml
Blanks and negatives show no colonies positives show colonies
30 of log10 transformed MPN
0-2420 MPN
These objectives will be measured as follows
Field Specific Quality Controls
10 of samples collected (3 per event in 2019) will be field blanks Sterile water poured into sterile sample bottle in the field These must register lt1 for total coliform and E coli
10 of samples collected (3 per event in 2019) will be field duplicates A second sample will be collected at the same location by the volunteer These will have a Relative Percent Difference of le 30 for log transformed e values
Laboratory Sample Batch-Specific Quality Control Samples With each new batch of samples run CRC will perform the following QC sample analysis
1 Lab Blank - Sterile water1 Positive Culture Control -sterile buffer dilution water inoculated with E coli (ie total coliform amp E coli positive)1 Negative culture Control -sterile buffer dilution water inoculated with non-fluorescent Pseudomonas sp (ie
total coliform amp E coli negative) 1 Lab Duplicate ndash 250 mL sample split into 2 100 mL samples in the lab
DRWA Data Precision and Accuracy
REPRESENTATIVENESS
Representativeness is the extent to which measurements actually represent the true environmental condition
You will state that- Sampling sites were selected to appropriately capture
- the general characteristics of the water body- or specific impacts if you are conducting an impact assessment (eg above amp
below suspected pollution sourceshellip)- The sample collection point is appropriate eg mid-stream mid-lake etc what
sampling depth - Number of sites is adequate to answer study question- The parameters monitored are relevant to the type of impact or to a general
WQ assessment- Sample collection timing and frequency are selected to capture data that are
representative of target conditions (eg various water levels weather seasons)
MassDEP - RECOMMENDED MINIMUM SAMPLE NUMBER FREQUENCY AND TIMING FOR EXAMPLE PARAMETERS
Parameter
Streams Lakes
Min Sample Number and Frequency
Sampling Period Min Sample Number and Frequency
Sampling Period
DO (discrete) 5 results pre-dawn June - September 3 results (epilimnetic) June - September
DO (continuous) 3o days June - September 3o days June - September
pH 5 results June - September 3 results (epilimnetic) June - September
Temperature (discrete) 5 results afternoon June - September 3 results (epilimnetic) June - September
Temperature (continuous) 3o days June - September 3o days June - September
Bacteria (eg E coli) 3-5 results (in 30-90 days) April 1-October 15 3-5 results (in 30-90 days) April 1-October 15
Nutrients (inc chl a for lakes) 5 results June- September 3 results June - September
Secchi depth --- --- 3 results June - September
Chloride 3 results 4 day period (yr-round) --- ---
ldquoCleanrdquo metals 3 results 4 day period (summer) --- ---
Misc toxics emerging contam 3 results 30 day period (summer) 3 results (epilimnetic) 30 day period (summer)
Fish community 1 survey April 1-October 15 1 survey April 1-October 15
Fish tissue contaminants (eg Hg PCBs pesticides)
1 survey Any 1 survey Any
Benthic invertebrates (RBP3) 1 survey July ndash October --- ---
Weed surveys 1 survey June- September 1 survey June- September
Aesthetics 1 survey April 1-October 15 1 survey April 1-October 15
30 days (bathing) 90 days (non-bathing) ldquoworst-caserdquo typ July-Aug
REPRESENTATIVENESS
DRWAB Data RepresentativenessSamples collected at locations and depths described in this QAPP will reflect conditions of individual water bodies and tributaries in Vermont and Massachusetts To ensure representativeness all samples will be collected preserved and analyzed according to the procedures in this QAPP and within the specified holding times
NepRWAA7-5 Data RepresentativenessSampling points will be chosen to represent the water quality within the applicable geographic area of interest Staff experienced and knowledgeable in the factors affecting water quality will choose sample points that will be representative of conditions within the area of concern
COMPARABILITY
Comparability is the degree to which data can be compared directly to similar studies There are two things to consider future studies someone might undertake and past studies you (or others) will want to compare your data with
State that you will use and document standardized - sampling amp analytical methods and units of reporting- sampling sites times and dates - sample storage and transfer
Comparability
Deerfield River Watershed Association
C Data ComparabilityAll samples for each specific parameter will be collected and analyzed using the respective procedures described in this QAPP to ensure that comparisons between different sample sites sample dates depths and projects can be appropriately made Procedures are unchanged from previous years
Neponset River Watershed Association
A7-6 ComparabilityComparability is ensured by the utilization of established sampling and monitoring protocols from Massachusetts DEP MWRA Massachusetts Water Watch Partnership the Boston Water and Sewer Commission and NepRWA and by the use of standard test methods and procedures as outlined in Appendices 6 7 and 8
Completeness
Completeness is an estimate of the amount of data you will need to answer your study question Usually expressed as a of originally planned sample events after missing sample events and data no meeting DQOs are subtracted from the planned number
DRWA
D Data CompletenessAt least 80 of the anticipated number of samples will be collected at each site analyzed and determined to meet data quality objectives for the project to be considered successful A report detailing the number of anticipated samples number of valid results and percent completion (number of valid samplesnumber of anticipated samples) will be produced
NepRWAA7-8 CompletenessIn order to obtain the best picture of the watershed NepRWA expects 90 of the routine sampling and follow up sampling samples to be collected and analyzed during each scheduled sampling event In the routine sampling program uncertainties such as weather volunteer scheduling and illness sometimes result in unavoidable omissions but every effort is made to assign backup samplers when possible
Sampling Process Design - EPA Element 10From MassWWP QAPP Guide
Purpose To describe in greater detail the design of the sampling part of your monitoring program
In Section 6 you briefly outlined the sample process design In this section you should elaborate on the rationales for those choices When you complete this section you should revisit Section 6 and revise as necessary The two sections should be in agreement
What To Include bull Indicators or measures bull Types of samplesbull Sampling frequency bull Sampling period bull How you will select sample sites and identify them over timebull Site safety plans
MADEP - RECOMMENDED MINIMUM SAMPLE NUMBER FREQUENCY AND TIMING FOR EXAMPLE PARAMETERS
Parameter
Streams Lakes
Min Sample Number and Frequency
Sampling Period Min Sample Number and Frequency
Sampling Period
DO (discrete) 5 results pre-dawn June - September 3 results (epilimnetic) June - September
DO (continuous) 3o days June - September 3o days June - September
pH 5 results June - September 3 results (epilimnetic) June - September
Temperature (discrete) 5 results afternoon June - September 3 results (epilimnetic) June - September
Temperature (continuous) 3o days June - September 3o days June - September
Bacteria (eg E coli) 3-5 results (in 30-90 days) April 1-October 15 3-5 results (in 30-90 days) April 1-October 15
Nutrients (inc chl a for lakes) 5 results June- September 3 results June - September
Secchi depth --- --- 3 results June - September
Chloride 3 results 4 day period (yr-round) --- ---
ldquoCleanrdquo metals 3 results 4 day period (summer) --- ---
Misc toxics emerging contam 3 results 30 day period (summer) 3 results (epilimnetic) 30 day period (summer)
Fish community 1 survey April 1-October 15 1 survey April 1-October 15
Fish tissue contaminants (eg Hg PCBs pesticides)
1 survey Any 1 survey Any
Benthic invertebrates (RBP3) 1 survey July ndash October --- ---
Weed surveys 1 survey June- September 1 survey June- September
Aesthetics 1 survey April 1-October 15 1 survey April 1-October 15
30 days (bathing) 90 days (non-bathing) ldquoworst-caserdquo typ July-Aug
Deerfield River Watershed Association
10 Sampling Process Design
Sampling sites were selected to represent locations that receive heavy human use from swimmers boaters anglers and other contact recreational users
Samples will be collected bi-weekly from late June through early September (prime recreation period) between 10 AM and 1 PM Samplers will first fill out their field data sheet They will then collect a water sample away from the edge of the stream near the center of the stream (centroid of flow) and just below the surface following the MWWP protocol (available in the Appendix)
Samplers will place their samples immediately in a cooler with ice or frozen ice packs making sure the temperature in the cooler is at 4degC or lower Each sample bottle will be placed in an individual clean Ziploc bag to avoid cross contamination
Neponset River Watershed Association
B1 Sampling Process Design
The CWMN program is designed to develop and maintain a record of general water qualitythroughout the watershed Project goals include both evaluation of long-term changes over time across the watershed as a whole and the identification of pollution hotspots at a low order subwatershed scale
Routine sampling activities consist of collecting in-stream samples As discussed above routine sampling sites are divided among ldquoindicatorrdquo sites and ldquosubwatershed sitesrdquo in order to meet the dual objectives of the program Indicator sites are selected to be representative of overall water quality and are relatively unchanging over time to allow comparison to past and future investigations Sites have generally been selected at the downstream ends or key segmentation points of major subwatersheds and at or near locations where there is a longstanding data record
Neponset River Watershed Association
B1 Sampling Process Design ndash continued
Subwatershed sites are selected to provide higher spatial resolution along individual streams in an effort to bracket pollution sources and facilitate their identification and remediation Subwatershed sites make up roughly 60 of the overall number of sites and are more likely to change from year to year Subwatershed sites may be rotated through different watersheds over the course of several sampling seasons to provide detailed data on different subwatersheds over a period of years Specific sites are selected by the project manager on the basis of known or suspected problems or opportunities or to fill in a lack of detailed data in a specific area
Neponset River Watershed Association
B1 Sampling Process Design ndash continued
In addition to the routine sampling activities CWMN also encompasses follow up and special study sampling activities These are generally ldquoone-timerdquo investigations intended to zero in on pollution sources in a known or suspected problem areahellipSpecific sampling stations may be planned in advance or may be chosen opportunistically by samplers while in the field
The mix of parameters sampled at each site depends on its status as an indicator subwatershed or follow up station the relative location of the station in the watershed and the specific pollutant(s) of concern at that specific location Indicator sites are tested for bacteria nutrients ammonia and field measured parametershellip Subwatershed sites are generally tested for bacteria total phosphorus and field measured parameters At some subwatershed sites hellip Follow up sampling stations will generally be tested for a very narrow set of parameters based on the specific pollutant of concern A listing of current routine sampling stations and the parameters sampled is provided in the Appendix 1e
Sampling Methods Requirements - EPA Element 11
This section describes your field measurementsample collection methods It can be stated in table form with narrative descriptions if you choose
Includebull What parameters are being sampledbull Sampling containersdevices sample preservation steps Maximum holding timebull Amount of sample to be collectedbull Summarize steps taken by field samplersbull Reference to the method followed (cite specific SOPS include in appendices)bull Can also include sampling considerations (eg time of day steps taken to avoid stirring up
sediments sample collection depth etc) These will be detailed in SOPs
Deerfield River Watershed Association
ParameterMeasure Container Field Rinse Preservation Hold Time E coli 120 mL IDEXX
Cool to lt4degC 6 hours to lab 8 hours to processing
B2 Sampling Methods
B2-2 Visual ObservationsB2-3 Fecal Coliform E coli and EnterococcusB2-5 NutrientsB2-6 Specific Conductance and SalinityB2-7 TemperatureB2-8 pH B2-9 Dissolved OxygenB2-10 SurfactantsB2-11 Depth and FlowB2-12 Optical BrightenersB2-13 Qualitative Ammonia Nitrogen
Neponset River Watershed Association
Sample Handling and Custody Requirements - EPA Element 12
Demonstrate that your sampling handling and storage techniques will retainsafeguard the integrity of your samples and data records
12 Sample Handling and Custody Procedures
Samples will be collected between 7 AM and 10 AM on sampling days The samples will be kept on ice inside a cooler during transport Wilmington VT area samples will be picked up by the monitoring assistant in the Main Street parking lots or other agreed upon meeting location by 9 AM Green River VT samples will be picked up by the transporting volunteer at the Green River covered bridge or other agreed upon meeting location by 930 AM The remaining samples will be delivered directly to the CRC water quality lab by 10 AM Any exchange of possession in the samples will be documented on the Chain of Custody (CoC) form which will be completed and signed by the Lab Analyst upon receipt at the lab The CoC form will be checked by the program coordinator See Appendix for the CoC
Deerfield River Watershed Association
Analytical Methods Requirements - EPA Element 13
Deerfield River Watershed Association
13 Analytical Methods Requirements
All analytical determinations will be performed at the CRC lab in Greenfield by the Lab Director Gabriel Chevalier
Indicator
Method Number
Source
Reporting Units
Modifications or Options
E coli
United water laboratory 1603 Bacteria Colilert SOP 604b CRWC 03-11-10
EPA 1603 (Modified m-TEC)
1 MPN
Sodium Thiosulfate used in all containers
Neponset River Watershed Association
Massachusetts Volunteer Monitorrsquos Guide to QAPP DevelopmentPAGE 61
Here are some things to consider in choosing a method Scientific Considerations Does it meet your data quality objectives
How accurate is it How precise (reproducible) is it What is its detection limit
Will it measure the indicator in the range that you need What lab facilities are required What equipment is required Does it yield samples that are representative Is it comparable to methods used by agencies collecting similar information
Practical and Program Considerations bull Do you have the human and financial resources to do it bull How difficult is it bull How time-consuming is it bull Will it produce data useful to the target audience
Quality Control ndash EPA Element 14
This section documents that the specific quality control measures you will take will allow you to determine whether you meet your data quality objectives
What To Include Section 7 stated your DQOs Here you describe how you are going to meet them
For each indicator include the following information
bull Accuracy Precision checks list what checks you will perform
bull List the of your samples upon which you will perform quality checks that will represent the quality of all your samples
Quality Control
Accuracy checks
There are a variety of ways to check the accuracy of your sampling and analysis
Checks can be done internally (done totally within your project lab) or externally (done with the assistance of an independent lab)
Known Samples This is an internal check that compares your results against another analyst or a ldquoknownrdquo An example of a known is a quality assurance sample that UMass WRRC sends to VM groups for pH DO or alkalinity ndash with the expected value communicated when sample is sent
Proficiency Testing (Unknown) Samples In some cases there are programs that provide proficiency testing samples for laboratory performance evaluation the concentrations of which are known to the auditor but not to the lab being tested This is relatively common for most water chemistry indicators An example of an unknown would when WRRC sends a quality assurance sample without communicating the expected value in advance
Quality Control
Accuracy checks - continued
Blank and Positive Plates Bacteriological samples should be checked using the blank and positive plate procedure The blank plate uses the rinse water media and equipment in the analysis to determine if there is contamination in the laboratory materials The result should be 0 The positive plate procedure uses a sample known to contain bacteria (eg waste- water treatment plant influent) to determine if a procedural error in the lab causes inhibition of bacterial growth Results should be rdquoToo Numerous To Countrdquo Each batch of samples should include at least one blank and one positive check sample This is an internal check
Spiked Samples Spikes are additions of a known amount of the indicator with the expectation that subsequent analysis will measure exactly that much increase over the un- spiked sample This procedure is described in Section 1020 B of Standard Methods This is an internal check
Voucher and Reference Collections For macroinvertebrates and aquatic plants maintenance of a voucher andor a working reference collection is recommended A voucher collection is a preserved collection of the type specimens ie an example of each of the individual taxa that you have given a name It should be maintained in archival condition by a trained curator typically found at a university A reference collection is an exact duplicate of the voucher collection but is the one that you will regularly use as a reference when identifying new specimens Both voucher and reference collections should be verified by an expert This is an external check Alternatively have an expert review IDs made by volunteers of at least 10 of specimens collected 90 accuracy is recommended
Quality Control
Precision Checks
Precision checks are primarily accomplished through replicate sampling amp analysis in the field and lab
Field Replication Replication can be done by the same field collectors but some replication by other collectors is good eg a pair of field collectors swapping roles or have different team collect the replicate This is an internal check
Lab Replication Additional replication should occur in the lab Lab replication is done by dividing a well-mixed sample into two or more aliquots and conducting analysis on each aliquot This is an internal check
Split Samples Split samples (a sample that is split into two sub-samples) can be done in the field or the lab
Relative Percent Difference
A measure of precision used for duplicate sample results It is calculated by dividing the difference between the two results by the mean of the two results expressed as a percentage Used when sample number equals two
eg ((98-92) 100) ((98+92))2 = 63
Deerfield River Watershed Association
14 Quality Control RequirementsA Volunteers Check - Field AuditEither the QC Officer the Project Coordinator or both will accompany a crew of volunteers (each) to their site each collection The trainers will observe the volunteersrsquo performance and check their sampling technique and field data sheets for accuracy
B Field QC ChecksAt least one Field Duplicate and one Field Blank will be submitted for every ten samples collected
Field Duplicate ndash a check on water quality sampling amp analysis consistency This is a replicated sample collected at the same point in time and space side by side with the first sampling and given a separate Sample ID number
Field Blanks ndash a check for contamination (AccuracyBias) in the field by processing laboratory-supplied deionized water through the sampling train This checks for contamination introduced from the sample container(s) or from field contamination A Field Blank will be taken by one volunteer at one site per sampling day for bacteria A container of DI water will be given to the volunteer who will pour this DI water into the sample bottle at the site
We will rotate the field duplicate and field blank samples among the volunteers throughout the sampling season so a maximum of collectors can be checked
Deerfield River Watershed Association
14 Quality Control Requirements ndash continued
C Laboratory QC ChecksA Lab Duplicate will be analyzed each sampling day The lab will split a randomly chosen sample and analyze both subsamples
The lab will run a Lab Blank and a Positive Sample for bacteria each collection (see section 7)
D Data Analysis QC ChecksRiver data and QC data will be reviewed by the QC Officer as soon as they come in from the lab after each collection QC data will be compared to the quality objectives (eg blanks should have zero colonies sample duplicates should be within 3 standard deviations of the mean positives should show bacterial growth etc) River data will be reviewed as well to ensurethat no field or lab contamination has occurred (data will be compared to those of other sites and of previous collections)
Bacteria computations will be checked and validated If discrepancies are found the Lab Director will be called to resolve the discrepancy and corrections will be made by the QC Officer
Field data sheets will be also reviewed the day of collection by the Project Coordinator and later by the QC Officer to ensure that samples were taken at the right times and that all the required information has been filled out The Project Coordinator or collectors will be called if omissions or errors are detected If needed corrections will be made (signed anddated) on the field sheet by the QC Officer
Neponset River Watershed Association
PRECISION DQOS DEALING WITH LOW-LEVEL CONCENTRATIONS
Source Analyte Units PrecisionMassDEP WPP Monitoring QAPP
Training Requirements Certification ndash EPA Element 8
In Narrative or Table Format
bull List type of training (eg Field WQ lab analysis visual observation data mgt data entry etc)
bull Who is training who receives training
bull How often training done
If training records are kept (they should be) include that in section 9 on documentation and records
Neponset River Watershed Association
A8 Training - ExcerptTo ensure the high quality and usability of the data that is generated by the CWMN program all participants receive training appropriate to the tasks for which they will be responsible NepRWA staff that are involved in the program are professionals with extensive training in water quality chemistry biology and field sampling NepRWA has established a program of training for volunteers that includes initial training follow-up and refresher classes These classes are given by NepRWA staff that are qualified not only in the technical matter covered but in training and education
The initial training for volunteer monitors is primarily instruction and demonstration by the trainer with repetition by the volunteer This training includes an overview of the entire project and detailed instruction in sampling procedures All monitors receive and review a copy of NepRWArsquos Water Monitoring and Sampling Manual (see Appendix 3a)
After their initial training all volunteers participate in a mandatory annual group andor individual training session These sessions are designed to update the volunteers on changes in the program further train them in equipment calibration and field-testing procedures and evaluate each volunteerrsquos performancehellip
InstrumentEquipment Testing Inspection and Maintenance Requirements ndash EPA Element 15
Instrument Calibration and Frequency ndash EPA Element 16
InspectionAcceptance Requirements for Supplies ndash EPA Element 17
DOCUMENTATION AND RECORDS ndash EPA ELEMENT 9
Neponset River Watershed AssociationA9 Documents and RecordsA9-1 Data SheetsField data sheets include information about the site location (NepRWA ID number) which specific equipment was used to make measurements (thermometer number) the sampling method used (direct fill pole or Bridge Buddy) and equipment calibration results The field data sheets are also used to record temperature velocity depth color odor and turbidity information (Appendix 4e)helliphellip See Appendix 4 for copies of the various data sheets used in the CWMN program
A9-2 Chain of Custody FormsA9-3 Sample LabelingA9-4 Equipment Custody FormA9-5 Training and Evaluation Form
Data Acquisition Requirements - EPA Element 18
Purpose To ensure that any data you use but donrsquot collect yourself has a known data quality and is consistent with your data quality objectives that others can access these data and that your use of the data is appropriate
Describe any external data you use such as GPS coordinates for site locations weather station rainfall amounts etc
Include bull The title of the document or name of the informationbull Where you obtained it and where others may find itbull Notes on the quality of the outside information such as uncertainties and caveats
Preamble to Elements 19 through 24
Consider the four separate objectives of these chapters1) Producing a good data set - 19 covers the normal data mgt routines you do to prevent data mistakes in the first place- 22 amp23 describe how you review the resulting data sets - how you find and correct
missing or erroneous data - 19 22 and 23 should produce as complete amp accurate a data set as possible 2) Ensuring that any use you make of your data is justified In 24 you decide how usable your data are Review the final data set that the above efforts have produced Compare it with your DQOs to determine whether you have to discard or qualify any data what conclusions you can draw from your data or what changes you might need to make in your DQOs3) Improve overall project performance 20 deals with how well volunteers laboratories and equipment are operating It looks at function not outcomes Who evaluates the various components of your program when problems are found what corrections are made to make your program run better4) Report your results After yoursquove run these various checks you are ready to release your data In Chapter 21 you describe the reports you will issue
Suggested order bull Data Management (19)bull Data Review Validation and Verification Requirements (22)bull (Data) Validation and Verification Methods (23)
bull Reconciliation with Data Quality Objectives (24)
bull Assessment and Response Actions (20)
bull Reports (21)
EPA Elements 19 ndash 24
bull Data Management (19)bull Assessment and Response Actions (20) bull Reports (21)bull Data Review Validation and Verification Requirements (22)bull (Data) Validation and Verification Methods (23)bull Reconciliation with Data Quality Objectives (24)
Data Management ndash EPA Element 19
Follow the data from the moment itrsquos recorded through every step to final report databaseIntent is to prevent errors or loss of data or be able to correct in timely manner
bull Before each activitystep is conducted well-designed field sheets checklists COC forms data entry software auto-QC calculations out-of-bounds highlights etc
bull During each step sheets filled completely checklist reviewed before leaving site etc
bull Immediately after Computer-entered data compared with field sheets etc
bull Long term preservation Data storage
Neponset River Watershed Association
B9 Data ManagementThe Project Manager is responsible for overseeing all data management activities Refer also to section D below for additional discussion of data review verification and validation practices
B9-1 Raw DataField data sheets are collected with the samples The sheets are turned into the NepRWA office by the site coordinators The forms are then reviewed for illegible answers errors or questionable values and checked for consistency with the COC and bottle labels as described in Appendix 3l Any questions are referred to the volunteer for clarification NepRWA staff makes corrections by crossing out the errors and writing in the correct answer All corrections must be initialed
B9-2 Data Entry and ValidationOnce the information has undergone a preliminary check it is entered into a Filemaker database The software has been customized to the data sheet Fields within the worksheet have been set-up with limits based on expected results This helps to minimize entry errors Entered data is then checked against the data sheets by another volunteer or staff person
B9-3 Data StorageThe original data sheets are filed into an event file and stored in NepRWArsquos permanent files Electronic copies of data are maintained on a secure Filemaker server Data files are kept in perpetuity along with hard copies of volunteer data sheets All electronic data is backed-up daily on to a password-protected hard drive
Data Review Validation and Verificationndash EPA Element 22
(Data) Validation and Verification Methods ndash EPA Element 23
Deerfield River Watershed Association
22 Data Review Validation and Verification ndash Summarized bullet list
All data reviewed by the Project Coordinator and QA Coordinator
Data Analysis QC Checks will includebull Data entry checks by a second personbull Computer entries compared with fieldlab sheetsbull Checks on graphs amp all other data representationsbull Calculation of measures of data quality including completeness
Corrective actionsbull Data entry errors corrected bull Data outside expected range flagged or rejected bull 2nd field sample andor laboratory aliquot taken when possiblebull Data quality problems discussed in draft and final reports
(Data) Validation and Verification Methods ndash EPA Element 23 From Inland QAPP
Validation and Verification Methods will include checks on bull Completion of all fields on data sheets missing data sheetsbull Completeness of sampling runs (eg number of sites visitedsamples taken vs number proposed were all parameters sampledanalyzed)bull Completeness of QC checks (eg number and type of QC checks performed vs numbertype proposed)bull Accuracy and precision compared to data quality objectivesbull Representativeness of samples and resulting data by examining survey metadata for unusual conditions and occurrences that may have impacted the validity of results
Deerfield River Watershed Association ndash Excerpt summarized
23 Validation and Verification Methods
The following simple measures of data quality will be calculated and included in the final report
1) To screen for contamination the average blank concentration hellip will be calculated This average value should be as close as practical to the Reporting Limit listed in Table 4
2) To assess the precision of results the ldquoMean Relative Percent Differencerdquo between field duplicate samples should be calculated The average RPD should be less than or equal to the Estimated Precision listed in Table 4 This simple measure is calculated as follows
RPD formula used hellip
Reconciliation With Data Quality Objectives ndash EPA Element 24MassWWP guide to QAPP development
What to Include bull List who will evaluate your actual data vs your data quality goals bull State how and when this will be done bull Describe the process for determining what to do if goals are not met
Neponset River Watershed Association
D2 Reconciliation with User Requirements - Summarized bulletedbull Following each sampling event and prior to the subsequent event calculations and
determinations for precision completeness and accuracy will be made bull Any corrective action will be implemented noted and initialized by the project manager bull If data quality indicators do not meet the projectrsquos specifications then data may be discarded
may be flagged or re-sampling may occur bull Investigation of problems will take place and corrections will be documented If equipment
failure is found to be the cause calibration and maintenance techniques will be reassessed Field duplicate testing may occur during the next sampling event to ensure confidence in the results
bull Any limitations on the data will be noted bull Any revisions to the project will be submitted to EPA and DEP quality assurance officers for
approval
Assessment and Response Actions - EPA Element 20 From Inland QAPP
Document that the progress and quality of the monitoring program will be continuously assessed to ensure that its objectives are being accomplished
The Monitoring Coordinator will periodically check to see the following bull Monitoring is occurring as planned bull Sufficient written commentary and supporting photographs exist bull Sufficient volunteers are available bull Volunteers have been observed as they sample their sites bull Samplers are collecting in accordance with project schedules bull Data sheets and custody control sheets are being properly completed and signed bull Data are properly interpreted bull Plans for dealing with adverse weather are in place
Assessment and Response Actions - EPA Element 20 From Inland QAPP ndash continued
The Monitoring Coordinator will periodically check to see the following bull Retraining or other corrective action is implemented at the first hint of non compliance with the
QAPP or SOPs bull Labs are adhering to the requirements of their QAPP in terms of work performed accuracy
acceptable holding times timely and understandable results and delivery process bull Data management is being handled properly ie data are entered on a timely basis is
properly backed up is easily accessed and raw data are properly stored in a safe placebull Procedure for developing and reporting the results exists
Assessment and Response Actions - EPA Element 20 From Inland QAPP ndash continued
The Monitoring Coordinator will confer with the QA Officer as necessary to discuss any problems that occur and what corrective actions are needed to maintain program integrity In addition the Monitoring Coordinator and QA Officer will meet at the end of the sampling season to review the draft report and discuss all aspects of the program and identify necessary program modifications for future sampling activities [If the program includes a technical advisory committee the TAC will be included in these discussions] Corrections may include retraining volunteers rewriting sampling instructions replacement of volunteers alteration of sampling schedules sites or methods or other actions deemed necessary All problems discovered and program modifications made will be documented in the final version of the project report If modifications require changes in the Quality Assurance Project Plan these changes will be submitted MassDEP for review
Deerfield River Watershed Association
20 Assessment and Response Actions ndash Summarized bullet list
bull There will be an on-site visit by the Quality Control Officer to observe field sampling and field analysis procedures Generally this will be done near the beginning of the project
bull A written checklist will be used for the assessments maintained by the Project Coordinator and copies will be provided with the data report
bull The Project Coordinator and QC Officer will determine if field work follows the written procedures or if there needs to be corrections by additional training or revising protocols
bull Please refer to Section 22 for additional evaluations and response actions regarding data evaluations
Reports ndash EPA Element 21
Project Task Organization ndash EPA Element 4 Reviewrevise early choices
Distribution List ndash EPA Element 3
Title and Approval Page - EPA Element 1
Table of Contents ndash EPA Element 2
Water quality monitoring quality assurance workshop
Terminology
Study design
QAPP
sampling and analysis plan
standard operating procedures
data quality objectives
Water Quality Monitoring Planning Process
Monitoring program activities
Why do you need (who Gives) a qapp
Slide Number 11
Slide Number 12
Steps to Developing a QAPP
Slide Number 14
Slide Number 15
Slide Number 16
Steps to Developing a QAPP
Slide Number 18
Slide Number 19
Slide Number 20
Slide Number 21
Slide Number 22
Slide Number 23
Slide Number 24
Sources of Information About Massachusetts Waters
Slide Number 26
Slide Number 27
Slide Number 28
Slide Number 29
Slide Number 30
Slide Number 31
Slide Number 32
Slide Number 33
Slide Number 34
Slide Number 35
Slide Number 36
Slide Number 37
Slide Number 38
Slide Number 39
Slide Number 40
Slide Number 41
Slide Number 42
Slide Number 43
Slide Number 44
Slide Number 45
Slide Number 46
MassDEP - Recommended Minimum Sample Number Frequency and Timing for Example Parameters
Slide Number 48
Slide Number 49
Slide Number 50
Slide Number 51
Slide Number 52
MaDep - Recommended Minimum Sample Number Frequency and Timing for Example Parameters
Slide Number 54
Slide Number 55
Slide Number 56
Slide Number 57
Slide Number 58
Slide Number 59
Slide Number 60
Slide Number 61
Slide Number 62
Slide Number 63
Slide Number 64
Slide Number 65
Slide Number 66
Slide Number 67
Slide Number 68
Slide Number 69
Slide Number 70
Slide Number 71
Slide Number 72
Slide Number 73
Slide Number 74
Slide Number 75
Slide Number 76
Precision DQOs Dealing with low-level concentrations
Slide Number 78
Slide Number 79
Slide Number 80
Slide Number 81
Slide Number 82
Documentation and Records ndash EPA Element 9
Slide Number 84
Slide Number 85
Slide Number 86
Slide Number 87
Slide Number 88
Slide Number 89
Slide Number 90
Slide Number 91
Slide Number 92
Slide Number 93
Slide Number 94
Slide Number 95
Slide Number 96
Slide Number 97
Slide Number 98
Slide Number 99
Slide Number 100
Site ID
Site Name
Town
Rationale
Lat
Lon
Deerfield River Mainstem and Branches
VT-NBD_064
East Dover Rd
Wilmington
Monitor above most ag and below golf course
4291431
-728376
VT-NBD_027
Above Wilmington Center
Wilmington
Monitor within ag and above village center
4287452
-72864
VT-NBD_020
Wilmington Center above confl w Beaver Brk
Wilmington
Monitor for high bacterianutrients and Beaver Brk contribution
4286816
-728721
VT-NBD_018
Wilmington Center below confl w Beaver Brk
Wilmington
Swim holehigh bacterianutrients
4286875
-728738
MA-DFR_289
Shunpike Rest Area
Charlemont
Monitor Deerfield River coming from VT
426363
-729071
MA-DFR_276
Above Charlemont Center
Charlemont
Bracket WWTF Mill Brk
426271
-728853
MA-DFR_267
Charlemont Center
Charlemont
Bracket WWTF Mill Brk
426262
-728685
MA-DFR_011
5 amp 10 Bridge
Greenfield
Monitor Deerfield contributions to CT River
4256975
-725922
North River
VT-EBN_150
Above Jacksonville WWTF
Whitingham
Bracket WWTF
42787
-728163
VT-EBN_147
Below Jacksonville WWTF
Whitingham
Bracket WWTF
4278456
-728128
MA-EBN_024
Foundry Village Rd Ballfields
Colrain
Swim hole
4267478
-726966
MA-NOR_001
Formerly Sunburn Beach
Colrain
Mouth of North River
4265286
-727141
Green River Watershed
VT-PND_001
Mouth of Pond Brook
Halifax
Green River reclassification in support of Green River Watershed Alliance grant
428135
-727243
VT-GRN_234
Hinesburg Rd
Guilford
Green River reclassification in support of Green River Watershed Alliance grant
4279717
-726804
VT-HBG_001
Mouth of Hinesburg Brook
Guilford
Green River reclassification in support of Green River Watershed Alliance grant
4279582
-726605
VT-GRN_202
Green River Timber Crib Dam swim hole
Guilford
Swim HoleGreen River reclassification in support of Green River Watershed Alliance grant
4277555
-726673
VT-GRN_168
MAVT State Line
Guilford
Green River reclassification in support of Green River Watershed Alliance grant
4273299
-726761
MA-GRN_098
Bare Ass Beach
Greenfield
Swim Hole
4265102
-726235
MA-MPL_001
Mouth of Maple Brook
Greenfield
ID source of bacterianutrients
4258667
-726124
MA-GRN_020
Mohawk Trail Bridge
Greenfield
ID source of bacterianutrients
4258554
-726117
MA-GRN_008
Pretty Plain Rd
Greenfield
Monitor Green River contributions to Deerfield River high bacterianutrients
4257636
-725984
Other Tributaries
VT-
ELS_002
Ellis Brook TBD
Wilmington
Monitor below WWTF
429202
-728381
VT-COB_003
Cold Brook Above confl with N Br Deerfield
Wilmington
General water quality monitoring effect of Mt Snow pond
4289928
-728595
VT-BVR_029
Near Shearer Hill Rd
Wilmington
Monitor for runoff
42855
-728385
VT-BVR_011
Off Rte 9 near Wahoorsquos
Wilmington
Monitor for high bacteriarunoff
4286523
-728588
MA-CHI_001
Chickley River Tower Rd
Charlemont
Monitor contributions to Deerfield River
4263005
-729016
MA-MBK_001
Mill Brook TBD
Charlemont
Monitor mouth for contribution
426271
-728728
MA-CLS_003
Clesson Brook Buckland Rec Area
Buckland
Swim hole monitor contributions to Deerfield River
4261553
-72767
MA-SOU_024
South River Reeds Bridge Rd
Conway
Swim hole
4254131
-726901
Sources of Information About Massachusetts Waters
1 Mass Water Quality Standards httpwwwmassgoveeaagenciesmassdepwaterregulations314-cmr-4-00-mass-surface-water-quality-standardshtml
2 Massachusetts Water Quality Assessments ldquoLook here for reports on the condition of watersheds in Massachusettsrdquo httpwwwmassgoveeaagenciesmassdepwaterwatershedswater-quality-assessmentshtml3
3 Integrated List of Waters httpswwwmassgovlistsintegrated-lists-of-waters-related-reports4 TMDLs httpwwwmassgoveeaagenciesmassdepwaterwatershedstotal-maximum-daily-loads-tmdlshtml25 Older Water Quality Assessment Reports httpwwwmassgoveeaagenciesmassdepwaterwatershedswater-
quality-assessmentshtml3
Deerfield River Basin
Program Goals and Objectives Part 2 of EPA Element 5
A5 Program Goals and Objectives - DEP
Project Purpose- DRWA
Objectives of Project
The principal objectives of projects under this QAPP are to 1) provide a perspective on the range of water quality conditions for recreation in the Deerfield River watershed across Vermont and Massachusetts 2) describe water quality conditions of individual tributaries and the mainstem 3) establish a database for use in documenting future changes in water quality and 4) educate and involve residents in waterbody protection
Toward those objectives DRWA will monitor 29 sites for E coli sampling during the recreation season June through September This project includes conducting a water quality monitoring program for E coli in the Vermont and the Massachusetts portions of the watershed where pathogens have been detected during previous sampling efforts undertaken by MassDEP and VT DEC
Project Purpose- DRWA
B Intended Uses of Data
The data generated under this QAPP will serve the following uses
- Use in the MassDEP CWA Integrated Report
- Document the presence and severity of bacteria as pathogen indicators
- Educate school children and local communities about water quality and any problems and improvements
- Evaluate the effectiveness of restoration projects and other management activities
A56 Program Goals and Objectives ndash NepRWANepRWArsquos CWMN program seeks to accomplish the following during the period 2019-2021
- Regularly collect in-stream water quality samples at a handful of ldquoindicator sitesrdquo that represent overall water quality conditions and trends
- Regularly collect in-stream water quality samples at a larger number of ldquosubwatershed sitesrdquo that target known or suspected problem areas
- Conduct ldquofollow uprdquo and ldquospecial studyrdquo investigations and sampling as needed to confirm and further specify suspected problem or opportunity areas identified through the regular sampling program
- hellip
- Collect in-stream samples during rainfall events
- Distribute results promptly to municipal officials state and federal regulators and the general public as a means to increase understanding of water pollution issues
- Using fully sterile methods collect data needed to help implement recommendations of the Total Maximum Daily Load (TMDL) for bacteria
- Generate data to help enhance the effectiveness of municipal state federal and private efforts to improve water quality
Monitoring Objectives amp DWM-DEP Data Levels
EducationalStewardship-levelbull Objective is to engage volunteers in monitoring to develop better understanding
of the importance of water resources and to encourage their fellow citizens to take an active role in the preservation and restoration of their local water bodies and watersheds
Screening-level bull Typically used to direct future sampling efforts and as supporting evidence only
RegulatoryAssessment-levelbull Directly usable for 305(b) and 303(d) decision-making bull Scientifically sound and legally-defensible bull Contingent on review and approval these data can help determine if a water body
is meeting water quality standards or is impaired
Monitoring Objectives amp DWM-DEP Data Levels
Project Task Description ndash EPA Element 6
In general terms describe bull The work your staffvolunteers will perform bull Where it will take placebull What kinds of samples will be takenbull What kinds of conditions will be measuredbull How you will evaluate results
DRWA Project PurposeTask Description
C Brief Description of Project- There will be a training and orientation meeting held in March organized by VTDEC but
held at VAEL - Volunteers will be trained annually prior to the start of the sampling season- River water samples will be collected at 29 sites 6 times between June and September- The project will employ the Colilert System developed by IDEXX laboratories Inc to assay
E coli bacteria Samples will be analyzed at the CRC laboratory- Data will be analyzed and reviewed for quality assurance summarized and interpreted on
an annual basis - Data that meet project quality objectives will be submitted to MassDEP and entered in the
VTDECrsquos Water Quality data management system as well as the EPArsquos national water quality data storage system known as STORET
- Information will be presented to the local community in a suitable format be it a press release public meeting or another event
- A report will be prepared and shared with the distribution list in this QAPP and published on the DRWA website (deerfieldriverorg)
Site ID Site Name Town Rationale Lat Lon Deerfield River Mainstem and Branches
VT-NBD_064
East Dover Rd Wilmington Monitor above most ag and below golf course
4291431 -728376
VT-NBD_027
Above Wilmington Center
Wilmington Monitor within ag and above village center
4287452 -72864
VT-NBD_020
Wilmington Center above confl w
Beaver Brk
Wilmington Monitor for high bacterianutrients and
Beaver Brk contribution
4286816 -728721
VT-NBD_018
Wilmington Center below confl w
Beaver Brk
Wilmington Swim holehigh bacterianutrients
4286875 -728738
MA-DFR_289
Shunpike Rest Area Charlemont Monitor Deerfield River coming from VT
426363 -729071
MA-DFR_276
Above Charlemont Center
Charlemont Bracket WWTF Mill Brk 426271 -728853
MA-DFR_267
Charlemont Center Charlemont Bracket WWTF Mill Brk 426262 -728685
MA-DFR_011
5 amp 10 Bridge Greenfield Monitor Deerfield contributions to CT River
PrecisionThe degree of agreement among repeated measurements of an indicator on separate samples collected as close as possible in time and place
It does not mean that the sample actually reflects the ldquotruerdquo value but rather that your sampling and analysis are giving consistent results under similar conditions
AccuracyAccuracy or Bias is a measure of confidence that describes
how close a measurement is to its ldquotruerdquo value
Parameter Reporting Limit
Accuracy ( Recovery)
Field Precision (RPD)
Expected Range
E coli 1 MPN 100ml
Blanks and negatives show no colonies positives show colonies
30 of log10 transformed MPN
0-2420 MPN
These objectives will be measured as follows
Field Specific Quality Controls
10 of samples collected (3 per event in 2019) will be field blanks Sterile water poured into sterile sample bottle in the field These must register lt1 for total coliform and E coli
10 of samples collected (3 per event in 2019) will be field duplicates A second sample will be collected at the same location by the volunteer These will have a Relative Percent Difference of le 30 for log transformed e values
Laboratory Sample Batch-Specific Quality Control Samples With each new batch of samples run CRC will perform the following QC sample analysis
1 Lab Blank - Sterile water1 Positive Culture Control -sterile buffer dilution water inoculated with E coli (ie total coliform amp E coli positive)1 Negative culture Control -sterile buffer dilution water inoculated with non-fluorescent Pseudomonas sp (ie
total coliform amp E coli negative) 1 Lab Duplicate ndash 250 mL sample split into 2 100 mL samples in the lab
DRWA Data Precision and Accuracy
REPRESENTATIVENESS
Representativeness is the extent to which measurements actually represent the true environmental condition
You will state that- Sampling sites were selected to appropriately capture
- the general characteristics of the water body- or specific impacts if you are conducting an impact assessment (eg above amp
below suspected pollution sourceshellip)- The sample collection point is appropriate eg mid-stream mid-lake etc what
sampling depth - Number of sites is adequate to answer study question- The parameters monitored are relevant to the type of impact or to a general
WQ assessment- Sample collection timing and frequency are selected to capture data that are
representative of target conditions (eg various water levels weather seasons)
MassDEP - RECOMMENDED MINIMUM SAMPLE NUMBER FREQUENCY AND TIMING FOR EXAMPLE PARAMETERS
Parameter
Streams Lakes
Min Sample Number and Frequency
Sampling Period Min Sample Number and Frequency
Sampling Period
DO (discrete) 5 results pre-dawn June - September 3 results (epilimnetic) June - September
DO (continuous) 3o days June - September 3o days June - September
pH 5 results June - September 3 results (epilimnetic) June - September
Temperature (discrete) 5 results afternoon June - September 3 results (epilimnetic) June - September
Temperature (continuous) 3o days June - September 3o days June - September
Bacteria (eg E coli) 3-5 results (in 30-90 days) April 1-October 15 3-5 results (in 30-90 days) April 1-October 15
Nutrients (inc chl a for lakes) 5 results June- September 3 results June - September
Secchi depth --- --- 3 results June - September
Chloride 3 results 4 day period (yr-round) --- ---
ldquoCleanrdquo metals 3 results 4 day period (summer) --- ---
Misc toxics emerging contam 3 results 30 day period (summer) 3 results (epilimnetic) 30 day period (summer)
Fish community 1 survey April 1-October 15 1 survey April 1-October 15
Fish tissue contaminants (eg Hg PCBs pesticides)
1 survey Any 1 survey Any
Benthic invertebrates (RBP3) 1 survey July ndash October --- ---
Weed surveys 1 survey June- September 1 survey June- September
Aesthetics 1 survey April 1-October 15 1 survey April 1-October 15
30 days (bathing) 90 days (non-bathing) ldquoworst-caserdquo typ July-Aug
REPRESENTATIVENESS
DRWAB Data RepresentativenessSamples collected at locations and depths described in this QAPP will reflect conditions of individual water bodies and tributaries in Vermont and Massachusetts To ensure representativeness all samples will be collected preserved and analyzed according to the procedures in this QAPP and within the specified holding times
NepRWAA7-5 Data RepresentativenessSampling points will be chosen to represent the water quality within the applicable geographic area of interest Staff experienced and knowledgeable in the factors affecting water quality will choose sample points that will be representative of conditions within the area of concern
COMPARABILITY
Comparability is the degree to which data can be compared directly to similar studies There are two things to consider future studies someone might undertake and past studies you (or others) will want to compare your data with
State that you will use and document standardized - sampling amp analytical methods and units of reporting- sampling sites times and dates - sample storage and transfer
Comparability
Deerfield River Watershed Association
C Data ComparabilityAll samples for each specific parameter will be collected and analyzed using the respective procedures described in this QAPP to ensure that comparisons between different sample sites sample dates depths and projects can be appropriately made Procedures are unchanged from previous years
Neponset River Watershed Association
A7-6 ComparabilityComparability is ensured by the utilization of established sampling and monitoring protocols from Massachusetts DEP MWRA Massachusetts Water Watch Partnership the Boston Water and Sewer Commission and NepRWA and by the use of standard test methods and procedures as outlined in Appendices 6 7 and 8
Completeness
Completeness is an estimate of the amount of data you will need to answer your study question Usually expressed as a of originally planned sample events after missing sample events and data no meeting DQOs are subtracted from the planned number
DRWA
D Data CompletenessAt least 80 of the anticipated number of samples will be collected at each site analyzed and determined to meet data quality objectives for the project to be considered successful A report detailing the number of anticipated samples number of valid results and percent completion (number of valid samplesnumber of anticipated samples) will be produced
NepRWAA7-8 CompletenessIn order to obtain the best picture of the watershed NepRWA expects 90 of the routine sampling and follow up sampling samples to be collected and analyzed during each scheduled sampling event In the routine sampling program uncertainties such as weather volunteer scheduling and illness sometimes result in unavoidable omissions but every effort is made to assign backup samplers when possible
Sampling Process Design - EPA Element 10From MassWWP QAPP Guide
Purpose To describe in greater detail the design of the sampling part of your monitoring program
In Section 6 you briefly outlined the sample process design In this section you should elaborate on the rationales for those choices When you complete this section you should revisit Section 6 and revise as necessary The two sections should be in agreement
What To Include bull Indicators or measures bull Types of samplesbull Sampling frequency bull Sampling period bull How you will select sample sites and identify them over timebull Site safety plans
MADEP - RECOMMENDED MINIMUM SAMPLE NUMBER FREQUENCY AND TIMING FOR EXAMPLE PARAMETERS
Parameter
Streams Lakes
Min Sample Number and Frequency
Sampling Period Min Sample Number and Frequency
Sampling Period
DO (discrete) 5 results pre-dawn June - September 3 results (epilimnetic) June - September
DO (continuous) 3o days June - September 3o days June - September
pH 5 results June - September 3 results (epilimnetic) June - September
Temperature (discrete) 5 results afternoon June - September 3 results (epilimnetic) June - September
Temperature (continuous) 3o days June - September 3o days June - September
Bacteria (eg E coli) 3-5 results (in 30-90 days) April 1-October 15 3-5 results (in 30-90 days) April 1-October 15
Nutrients (inc chl a for lakes) 5 results June- September 3 results June - September
Secchi depth --- --- 3 results June - September
Chloride 3 results 4 day period (yr-round) --- ---
ldquoCleanrdquo metals 3 results 4 day period (summer) --- ---
Misc toxics emerging contam 3 results 30 day period (summer) 3 results (epilimnetic) 30 day period (summer)
Fish community 1 survey April 1-October 15 1 survey April 1-October 15
Fish tissue contaminants (eg Hg PCBs pesticides)
1 survey Any 1 survey Any
Benthic invertebrates (RBP3) 1 survey July ndash October --- ---
Weed surveys 1 survey June- September 1 survey June- September
Aesthetics 1 survey April 1-October 15 1 survey April 1-October 15
30 days (bathing) 90 days (non-bathing) ldquoworst-caserdquo typ July-Aug
Deerfield River Watershed Association
10 Sampling Process Design
Sampling sites were selected to represent locations that receive heavy human use from swimmers boaters anglers and other contact recreational users
Samples will be collected bi-weekly from late June through early September (prime recreation period) between 10 AM and 1 PM Samplers will first fill out their field data sheet They will then collect a water sample away from the edge of the stream near the center of the stream (centroid of flow) and just below the surface following the MWWP protocol (available in the Appendix)
Samplers will place their samples immediately in a cooler with ice or frozen ice packs making sure the temperature in the cooler is at 4degC or lower Each sample bottle will be placed in an individual clean Ziploc bag to avoid cross contamination
Neponset River Watershed Association
B1 Sampling Process Design
The CWMN program is designed to develop and maintain a record of general water qualitythroughout the watershed Project goals include both evaluation of long-term changes over time across the watershed as a whole and the identification of pollution hotspots at a low order subwatershed scale
Routine sampling activities consist of collecting in-stream samples As discussed above routine sampling sites are divided among ldquoindicatorrdquo sites and ldquosubwatershed sitesrdquo in order to meet the dual objectives of the program Indicator sites are selected to be representative of overall water quality and are relatively unchanging over time to allow comparison to past and future investigations Sites have generally been selected at the downstream ends or key segmentation points of major subwatersheds and at or near locations where there is a longstanding data record
Neponset River Watershed Association
B1 Sampling Process Design ndash continued
Subwatershed sites are selected to provide higher spatial resolution along individual streams in an effort to bracket pollution sources and facilitate their identification and remediation Subwatershed sites make up roughly 60 of the overall number of sites and are more likely to change from year to year Subwatershed sites may be rotated through different watersheds over the course of several sampling seasons to provide detailed data on different subwatersheds over a period of years Specific sites are selected by the project manager on the basis of known or suspected problems or opportunities or to fill in a lack of detailed data in a specific area
Neponset River Watershed Association
B1 Sampling Process Design ndash continued
In addition to the routine sampling activities CWMN also encompasses follow up and special study sampling activities These are generally ldquoone-timerdquo investigations intended to zero in on pollution sources in a known or suspected problem areahellipSpecific sampling stations may be planned in advance or may be chosen opportunistically by samplers while in the field
The mix of parameters sampled at each site depends on its status as an indicator subwatershed or follow up station the relative location of the station in the watershed and the specific pollutant(s) of concern at that specific location Indicator sites are tested for bacteria nutrients ammonia and field measured parametershellip Subwatershed sites are generally tested for bacteria total phosphorus and field measured parameters At some subwatershed sites hellip Follow up sampling stations will generally be tested for a very narrow set of parameters based on the specific pollutant of concern A listing of current routine sampling stations and the parameters sampled is provided in the Appendix 1e
Sampling Methods Requirements - EPA Element 11
This section describes your field measurementsample collection methods It can be stated in table form with narrative descriptions if you choose
Includebull What parameters are being sampledbull Sampling containersdevices sample preservation steps Maximum holding timebull Amount of sample to be collectedbull Summarize steps taken by field samplersbull Reference to the method followed (cite specific SOPS include in appendices)bull Can also include sampling considerations (eg time of day steps taken to avoid stirring up
sediments sample collection depth etc) These will be detailed in SOPs
Deerfield River Watershed Association
ParameterMeasure Container Field Rinse Preservation Hold Time E coli 120 mL IDEXX
Cool to lt4degC 6 hours to lab 8 hours to processing
B2 Sampling Methods
B2-2 Visual ObservationsB2-3 Fecal Coliform E coli and EnterococcusB2-5 NutrientsB2-6 Specific Conductance and SalinityB2-7 TemperatureB2-8 pH B2-9 Dissolved OxygenB2-10 SurfactantsB2-11 Depth and FlowB2-12 Optical BrightenersB2-13 Qualitative Ammonia Nitrogen
Neponset River Watershed Association
Sample Handling and Custody Requirements - EPA Element 12
Demonstrate that your sampling handling and storage techniques will retainsafeguard the integrity of your samples and data records
12 Sample Handling and Custody Procedures
Samples will be collected between 7 AM and 10 AM on sampling days The samples will be kept on ice inside a cooler during transport Wilmington VT area samples will be picked up by the monitoring assistant in the Main Street parking lots or other agreed upon meeting location by 9 AM Green River VT samples will be picked up by the transporting volunteer at the Green River covered bridge or other agreed upon meeting location by 930 AM The remaining samples will be delivered directly to the CRC water quality lab by 10 AM Any exchange of possession in the samples will be documented on the Chain of Custody (CoC) form which will be completed and signed by the Lab Analyst upon receipt at the lab The CoC form will be checked by the program coordinator See Appendix for the CoC
Deerfield River Watershed Association
Analytical Methods Requirements - EPA Element 13
Deerfield River Watershed Association
13 Analytical Methods Requirements
All analytical determinations will be performed at the CRC lab in Greenfield by the Lab Director Gabriel Chevalier
Indicator
Method Number
Source
Reporting Units
Modifications or Options
E coli
United water laboratory 1603 Bacteria Colilert SOP 604b CRWC 03-11-10
EPA 1603 (Modified m-TEC)
1 MPN
Sodium Thiosulfate used in all containers
Neponset River Watershed Association
Massachusetts Volunteer Monitorrsquos Guide to QAPP DevelopmentPAGE 61
Here are some things to consider in choosing a method Scientific Considerations Does it meet your data quality objectives
How accurate is it How precise (reproducible) is it What is its detection limit
Will it measure the indicator in the range that you need What lab facilities are required What equipment is required Does it yield samples that are representative Is it comparable to methods used by agencies collecting similar information
Practical and Program Considerations bull Do you have the human and financial resources to do it bull How difficult is it bull How time-consuming is it bull Will it produce data useful to the target audience
Quality Control ndash EPA Element 14
This section documents that the specific quality control measures you will take will allow you to determine whether you meet your data quality objectives
What To Include Section 7 stated your DQOs Here you describe how you are going to meet them
For each indicator include the following information
bull Accuracy Precision checks list what checks you will perform
bull List the of your samples upon which you will perform quality checks that will represent the quality of all your samples
Quality Control
Accuracy checks
There are a variety of ways to check the accuracy of your sampling and analysis
Checks can be done internally (done totally within your project lab) or externally (done with the assistance of an independent lab)
Known Samples This is an internal check that compares your results against another analyst or a ldquoknownrdquo An example of a known is a quality assurance sample that UMass WRRC sends to VM groups for pH DO or alkalinity ndash with the expected value communicated when sample is sent
Proficiency Testing (Unknown) Samples In some cases there are programs that provide proficiency testing samples for laboratory performance evaluation the concentrations of which are known to the auditor but not to the lab being tested This is relatively common for most water chemistry indicators An example of an unknown would when WRRC sends a quality assurance sample without communicating the expected value in advance
Quality Control
Accuracy checks - continued
Blank and Positive Plates Bacteriological samples should be checked using the blank and positive plate procedure The blank plate uses the rinse water media and equipment in the analysis to determine if there is contamination in the laboratory materials The result should be 0 The positive plate procedure uses a sample known to contain bacteria (eg waste- water treatment plant influent) to determine if a procedural error in the lab causes inhibition of bacterial growth Results should be rdquoToo Numerous To Countrdquo Each batch of samples should include at least one blank and one positive check sample This is an internal check
Spiked Samples Spikes are additions of a known amount of the indicator with the expectation that subsequent analysis will measure exactly that much increase over the un- spiked sample This procedure is described in Section 1020 B of Standard Methods This is an internal check
Voucher and Reference Collections For macroinvertebrates and aquatic plants maintenance of a voucher andor a working reference collection is recommended A voucher collection is a preserved collection of the type specimens ie an example of each of the individual taxa that you have given a name It should be maintained in archival condition by a trained curator typically found at a university A reference collection is an exact duplicate of the voucher collection but is the one that you will regularly use as a reference when identifying new specimens Both voucher and reference collections should be verified by an expert This is an external check Alternatively have an expert review IDs made by volunteers of at least 10 of specimens collected 90 accuracy is recommended
Quality Control
Precision Checks
Precision checks are primarily accomplished through replicate sampling amp analysis in the field and lab
Field Replication Replication can be done by the same field collectors but some replication by other collectors is good eg a pair of field collectors swapping roles or have different team collect the replicate This is an internal check
Lab Replication Additional replication should occur in the lab Lab replication is done by dividing a well-mixed sample into two or more aliquots and conducting analysis on each aliquot This is an internal check
Split Samples Split samples (a sample that is split into two sub-samples) can be done in the field or the lab
Relative Percent Difference
A measure of precision used for duplicate sample results It is calculated by dividing the difference between the two results by the mean of the two results expressed as a percentage Used when sample number equals two
eg ((98-92) 100) ((98+92))2 = 63
Deerfield River Watershed Association
14 Quality Control RequirementsA Volunteers Check - Field AuditEither the QC Officer the Project Coordinator or both will accompany a crew of volunteers (each) to their site each collection The trainers will observe the volunteersrsquo performance and check their sampling technique and field data sheets for accuracy
B Field QC ChecksAt least one Field Duplicate and one Field Blank will be submitted for every ten samples collected
Field Duplicate ndash a check on water quality sampling amp analysis consistency This is a replicated sample collected at the same point in time and space side by side with the first sampling and given a separate Sample ID number
Field Blanks ndash a check for contamination (AccuracyBias) in the field by processing laboratory-supplied deionized water through the sampling train This checks for contamination introduced from the sample container(s) or from field contamination A Field Blank will be taken by one volunteer at one site per sampling day for bacteria A container of DI water will be given to the volunteer who will pour this DI water into the sample bottle at the site
We will rotate the field duplicate and field blank samples among the volunteers throughout the sampling season so a maximum of collectors can be checked
Deerfield River Watershed Association
14 Quality Control Requirements ndash continued
C Laboratory QC ChecksA Lab Duplicate will be analyzed each sampling day The lab will split a randomly chosen sample and analyze both subsamples
The lab will run a Lab Blank and a Positive Sample for bacteria each collection (see section 7)
D Data Analysis QC ChecksRiver data and QC data will be reviewed by the QC Officer as soon as they come in from the lab after each collection QC data will be compared to the quality objectives (eg blanks should have zero colonies sample duplicates should be within 3 standard deviations of the mean positives should show bacterial growth etc) River data will be reviewed as well to ensurethat no field or lab contamination has occurred (data will be compared to those of other sites and of previous collections)
Bacteria computations will be checked and validated If discrepancies are found the Lab Director will be called to resolve the discrepancy and corrections will be made by the QC Officer
Field data sheets will be also reviewed the day of collection by the Project Coordinator and later by the QC Officer to ensure that samples were taken at the right times and that all the required information has been filled out The Project Coordinator or collectors will be called if omissions or errors are detected If needed corrections will be made (signed anddated) on the field sheet by the QC Officer
Neponset River Watershed Association
PRECISION DQOS DEALING WITH LOW-LEVEL CONCENTRATIONS
Source Analyte Units PrecisionMassDEP WPP Monitoring QAPP
Training Requirements Certification ndash EPA Element 8
In Narrative or Table Format
bull List type of training (eg Field WQ lab analysis visual observation data mgt data entry etc)
bull Who is training who receives training
bull How often training done
If training records are kept (they should be) include that in section 9 on documentation and records
Neponset River Watershed Association
A8 Training - ExcerptTo ensure the high quality and usability of the data that is generated by the CWMN program all participants receive training appropriate to the tasks for which they will be responsible NepRWA staff that are involved in the program are professionals with extensive training in water quality chemistry biology and field sampling NepRWA has established a program of training for volunteers that includes initial training follow-up and refresher classes These classes are given by NepRWA staff that are qualified not only in the technical matter covered but in training and education
The initial training for volunteer monitors is primarily instruction and demonstration by the trainer with repetition by the volunteer This training includes an overview of the entire project and detailed instruction in sampling procedures All monitors receive and review a copy of NepRWArsquos Water Monitoring and Sampling Manual (see Appendix 3a)
After their initial training all volunteers participate in a mandatory annual group andor individual training session These sessions are designed to update the volunteers on changes in the program further train them in equipment calibration and field-testing procedures and evaluate each volunteerrsquos performancehellip
InstrumentEquipment Testing Inspection and Maintenance Requirements ndash EPA Element 15
Instrument Calibration and Frequency ndash EPA Element 16
InspectionAcceptance Requirements for Supplies ndash EPA Element 17
DOCUMENTATION AND RECORDS ndash EPA ELEMENT 9
Neponset River Watershed AssociationA9 Documents and RecordsA9-1 Data SheetsField data sheets include information about the site location (NepRWA ID number) which specific equipment was used to make measurements (thermometer number) the sampling method used (direct fill pole or Bridge Buddy) and equipment calibration results The field data sheets are also used to record temperature velocity depth color odor and turbidity information (Appendix 4e)helliphellip See Appendix 4 for copies of the various data sheets used in the CWMN program
A9-2 Chain of Custody FormsA9-3 Sample LabelingA9-4 Equipment Custody FormA9-5 Training and Evaluation Form
Data Acquisition Requirements - EPA Element 18
Purpose To ensure that any data you use but donrsquot collect yourself has a known data quality and is consistent with your data quality objectives that others can access these data and that your use of the data is appropriate
Describe any external data you use such as GPS coordinates for site locations weather station rainfall amounts etc
Include bull The title of the document or name of the informationbull Where you obtained it and where others may find itbull Notes on the quality of the outside information such as uncertainties and caveats
Preamble to Elements 19 through 24
Consider the four separate objectives of these chapters1) Producing a good data set - 19 covers the normal data mgt routines you do to prevent data mistakes in the first place- 22 amp23 describe how you review the resulting data sets - how you find and correct
missing or erroneous data - 19 22 and 23 should produce as complete amp accurate a data set as possible 2) Ensuring that any use you make of your data is justified In 24 you decide how usable your data are Review the final data set that the above efforts have produced Compare it with your DQOs to determine whether you have to discard or qualify any data what conclusions you can draw from your data or what changes you might need to make in your DQOs3) Improve overall project performance 20 deals with how well volunteers laboratories and equipment are operating It looks at function not outcomes Who evaluates the various components of your program when problems are found what corrections are made to make your program run better4) Report your results After yoursquove run these various checks you are ready to release your data In Chapter 21 you describe the reports you will issue
Suggested order bull Data Management (19)bull Data Review Validation and Verification Requirements (22)bull (Data) Validation and Verification Methods (23)
bull Reconciliation with Data Quality Objectives (24)
bull Assessment and Response Actions (20)
bull Reports (21)
EPA Elements 19 ndash 24
bull Data Management (19)bull Assessment and Response Actions (20) bull Reports (21)bull Data Review Validation and Verification Requirements (22)bull (Data) Validation and Verification Methods (23)bull Reconciliation with Data Quality Objectives (24)
Data Management ndash EPA Element 19
Follow the data from the moment itrsquos recorded through every step to final report databaseIntent is to prevent errors or loss of data or be able to correct in timely manner
bull Before each activitystep is conducted well-designed field sheets checklists COC forms data entry software auto-QC calculations out-of-bounds highlights etc
bull During each step sheets filled completely checklist reviewed before leaving site etc
bull Immediately after Computer-entered data compared with field sheets etc
bull Long term preservation Data storage
Neponset River Watershed Association
B9 Data ManagementThe Project Manager is responsible for overseeing all data management activities Refer also to section D below for additional discussion of data review verification and validation practices
B9-1 Raw DataField data sheets are collected with the samples The sheets are turned into the NepRWA office by the site coordinators The forms are then reviewed for illegible answers errors or questionable values and checked for consistency with the COC and bottle labels as described in Appendix 3l Any questions are referred to the volunteer for clarification NepRWA staff makes corrections by crossing out the errors and writing in the correct answer All corrections must be initialed
B9-2 Data Entry and ValidationOnce the information has undergone a preliminary check it is entered into a Filemaker database The software has been customized to the data sheet Fields within the worksheet have been set-up with limits based on expected results This helps to minimize entry errors Entered data is then checked against the data sheets by another volunteer or staff person
B9-3 Data StorageThe original data sheets are filed into an event file and stored in NepRWArsquos permanent files Electronic copies of data are maintained on a secure Filemaker server Data files are kept in perpetuity along with hard copies of volunteer data sheets All electronic data is backed-up daily on to a password-protected hard drive
Data Review Validation and Verificationndash EPA Element 22
(Data) Validation and Verification Methods ndash EPA Element 23
Deerfield River Watershed Association
22 Data Review Validation and Verification ndash Summarized bullet list
All data reviewed by the Project Coordinator and QA Coordinator
Data Analysis QC Checks will includebull Data entry checks by a second personbull Computer entries compared with fieldlab sheetsbull Checks on graphs amp all other data representationsbull Calculation of measures of data quality including completeness
Corrective actionsbull Data entry errors corrected bull Data outside expected range flagged or rejected bull 2nd field sample andor laboratory aliquot taken when possiblebull Data quality problems discussed in draft and final reports
(Data) Validation and Verification Methods ndash EPA Element 23 From Inland QAPP
Validation and Verification Methods will include checks on bull Completion of all fields on data sheets missing data sheetsbull Completeness of sampling runs (eg number of sites visitedsamples taken vs number proposed were all parameters sampledanalyzed)bull Completeness of QC checks (eg number and type of QC checks performed vs numbertype proposed)bull Accuracy and precision compared to data quality objectivesbull Representativeness of samples and resulting data by examining survey metadata for unusual conditions and occurrences that may have impacted the validity of results
Deerfield River Watershed Association ndash Excerpt summarized
23 Validation and Verification Methods
The following simple measures of data quality will be calculated and included in the final report
1) To screen for contamination the average blank concentration hellip will be calculated This average value should be as close as practical to the Reporting Limit listed in Table 4
2) To assess the precision of results the ldquoMean Relative Percent Differencerdquo between field duplicate samples should be calculated The average RPD should be less than or equal to the Estimated Precision listed in Table 4 This simple measure is calculated as follows
RPD formula used hellip
Reconciliation With Data Quality Objectives ndash EPA Element 24MassWWP guide to QAPP development
What to Include bull List who will evaluate your actual data vs your data quality goals bull State how and when this will be done bull Describe the process for determining what to do if goals are not met
Neponset River Watershed Association
D2 Reconciliation with User Requirements - Summarized bulletedbull Following each sampling event and prior to the subsequent event calculations and
determinations for precision completeness and accuracy will be made bull Any corrective action will be implemented noted and initialized by the project manager bull If data quality indicators do not meet the projectrsquos specifications then data may be discarded
may be flagged or re-sampling may occur bull Investigation of problems will take place and corrections will be documented If equipment
failure is found to be the cause calibration and maintenance techniques will be reassessed Field duplicate testing may occur during the next sampling event to ensure confidence in the results
bull Any limitations on the data will be noted bull Any revisions to the project will be submitted to EPA and DEP quality assurance officers for
approval
Assessment and Response Actions - EPA Element 20 From Inland QAPP
Document that the progress and quality of the monitoring program will be continuously assessed to ensure that its objectives are being accomplished
The Monitoring Coordinator will periodically check to see the following bull Monitoring is occurring as planned bull Sufficient written commentary and supporting photographs exist bull Sufficient volunteers are available bull Volunteers have been observed as they sample their sites bull Samplers are collecting in accordance with project schedules bull Data sheets and custody control sheets are being properly completed and signed bull Data are properly interpreted bull Plans for dealing with adverse weather are in place
Assessment and Response Actions - EPA Element 20 From Inland QAPP ndash continued
The Monitoring Coordinator will periodically check to see the following bull Retraining or other corrective action is implemented at the first hint of non compliance with the
QAPP or SOPs bull Labs are adhering to the requirements of their QAPP in terms of work performed accuracy
acceptable holding times timely and understandable results and delivery process bull Data management is being handled properly ie data are entered on a timely basis is
properly backed up is easily accessed and raw data are properly stored in a safe placebull Procedure for developing and reporting the results exists
Assessment and Response Actions - EPA Element 20 From Inland QAPP ndash continued
The Monitoring Coordinator will confer with the QA Officer as necessary to discuss any problems that occur and what corrective actions are needed to maintain program integrity In addition the Monitoring Coordinator and QA Officer will meet at the end of the sampling season to review the draft report and discuss all aspects of the program and identify necessary program modifications for future sampling activities [If the program includes a technical advisory committee the TAC will be included in these discussions] Corrections may include retraining volunteers rewriting sampling instructions replacement of volunteers alteration of sampling schedules sites or methods or other actions deemed necessary All problems discovered and program modifications made will be documented in the final version of the project report If modifications require changes in the Quality Assurance Project Plan these changes will be submitted MassDEP for review
Deerfield River Watershed Association
20 Assessment and Response Actions ndash Summarized bullet list
bull There will be an on-site visit by the Quality Control Officer to observe field sampling and field analysis procedures Generally this will be done near the beginning of the project
bull A written checklist will be used for the assessments maintained by the Project Coordinator and copies will be provided with the data report
bull The Project Coordinator and QC Officer will determine if field work follows the written procedures or if there needs to be corrections by additional training or revising protocols
bull Please refer to Section 22 for additional evaluations and response actions regarding data evaluations
Reports ndash EPA Element 21
Project Task Organization ndash EPA Element 4 Reviewrevise early choices
Distribution List ndash EPA Element 3
Title and Approval Page - EPA Element 1
Table of Contents ndash EPA Element 2
Water quality monitoring quality assurance workshop
Terminology
Study design
QAPP
sampling and analysis plan
standard operating procedures
data quality objectives
Water Quality Monitoring Planning Process
Monitoring program activities
Why do you need (who Gives) a qapp
Slide Number 11
Slide Number 12
Steps to Developing a QAPP
Slide Number 14
Slide Number 15
Slide Number 16
Steps to Developing a QAPP
Slide Number 18
Slide Number 19
Slide Number 20
Slide Number 21
Slide Number 22
Slide Number 23
Slide Number 24
Sources of Information About Massachusetts Waters
Slide Number 26
Slide Number 27
Slide Number 28
Slide Number 29
Slide Number 30
Slide Number 31
Slide Number 32
Slide Number 33
Slide Number 34
Slide Number 35
Slide Number 36
Slide Number 37
Slide Number 38
Slide Number 39
Slide Number 40
Slide Number 41
Slide Number 42
Slide Number 43
Slide Number 44
Slide Number 45
Slide Number 46
MassDEP - Recommended Minimum Sample Number Frequency and Timing for Example Parameters
Slide Number 48
Slide Number 49
Slide Number 50
Slide Number 51
Slide Number 52
MaDep - Recommended Minimum Sample Number Frequency and Timing for Example Parameters
Slide Number 54
Slide Number 55
Slide Number 56
Slide Number 57
Slide Number 58
Slide Number 59
Slide Number 60
Slide Number 61
Slide Number 62
Slide Number 63
Slide Number 64
Slide Number 65
Slide Number 66
Slide Number 67
Slide Number 68
Slide Number 69
Slide Number 70
Slide Number 71
Slide Number 72
Slide Number 73
Slide Number 74
Slide Number 75
Slide Number 76
Precision DQOs Dealing with low-level concentrations
Slide Number 78
Slide Number 79
Slide Number 80
Slide Number 81
Slide Number 82
Documentation and Records ndash EPA Element 9
Slide Number 84
Slide Number 85
Slide Number 86
Slide Number 87
Slide Number 88
Slide Number 89
Slide Number 90
Slide Number 91
Slide Number 92
Slide Number 93
Slide Number 94
Slide Number 95
Slide Number 96
Slide Number 97
Slide Number 98
Slide Number 99
Slide Number 100
Site ID
Site Name
Town
Rationale
Lat
Lon
Deerfield River Mainstem and Branches
VT-NBD_064
East Dover Rd
Wilmington
Monitor above most ag and below golf course
4291431
-728376
VT-NBD_027
Above Wilmington Center
Wilmington
Monitor within ag and above village center
4287452
-72864
VT-NBD_020
Wilmington Center above confl w Beaver Brk
Wilmington
Monitor for high bacterianutrients and Beaver Brk contribution
4286816
-728721
VT-NBD_018
Wilmington Center below confl w Beaver Brk
Wilmington
Swim holehigh bacterianutrients
4286875
-728738
MA-DFR_289
Shunpike Rest Area
Charlemont
Monitor Deerfield River coming from VT
426363
-729071
MA-DFR_276
Above Charlemont Center
Charlemont
Bracket WWTF Mill Brk
426271
-728853
MA-DFR_267
Charlemont Center
Charlemont
Bracket WWTF Mill Brk
426262
-728685
MA-DFR_011
5 amp 10 Bridge
Greenfield
Monitor Deerfield contributions to CT River
4256975
-725922
North River
VT-EBN_150
Above Jacksonville WWTF
Whitingham
Bracket WWTF
42787
-728163
VT-EBN_147
Below Jacksonville WWTF
Whitingham
Bracket WWTF
4278456
-728128
MA-EBN_024
Foundry Village Rd Ballfields
Colrain
Swim hole
4267478
-726966
MA-NOR_001
Formerly Sunburn Beach
Colrain
Mouth of North River
4265286
-727141
Green River Watershed
VT-PND_001
Mouth of Pond Brook
Halifax
Green River reclassification in support of Green River Watershed Alliance grant
428135
-727243
VT-GRN_234
Hinesburg Rd
Guilford
Green River reclassification in support of Green River Watershed Alliance grant
4279717
-726804
VT-HBG_001
Mouth of Hinesburg Brook
Guilford
Green River reclassification in support of Green River Watershed Alliance grant
4279582
-726605
VT-GRN_202
Green River Timber Crib Dam swim hole
Guilford
Swim HoleGreen River reclassification in support of Green River Watershed Alliance grant
4277555
-726673
VT-GRN_168
MAVT State Line
Guilford
Green River reclassification in support of Green River Watershed Alliance grant
4273299
-726761
MA-GRN_098
Bare Ass Beach
Greenfield
Swim Hole
4265102
-726235
MA-MPL_001
Mouth of Maple Brook
Greenfield
ID source of bacterianutrients
4258667
-726124
MA-GRN_020
Mohawk Trail Bridge
Greenfield
ID source of bacterianutrients
4258554
-726117
MA-GRN_008
Pretty Plain Rd
Greenfield
Monitor Green River contributions to Deerfield River high bacterianutrients
4257636
-725984
Other Tributaries
VT-
ELS_002
Ellis Brook TBD
Wilmington
Monitor below WWTF
429202
-728381
VT-COB_003
Cold Brook Above confl with N Br Deerfield
Wilmington
General water quality monitoring effect of Mt Snow pond
4289928
-728595
VT-BVR_029
Near Shearer Hill Rd
Wilmington
Monitor for runoff
42855
-728385
VT-BVR_011
Off Rte 9 near Wahoorsquos
Wilmington
Monitor for high bacteriarunoff
4286523
-728588
MA-CHI_001
Chickley River Tower Rd
Charlemont
Monitor contributions to Deerfield River
4263005
-729016
MA-MBK_001
Mill Brook TBD
Charlemont
Monitor mouth for contribution
426271
-728728
MA-CLS_003
Clesson Brook Buckland Rec Area
Buckland
Swim hole monitor contributions to Deerfield River
4261553
-72767
MA-SOU_024
South River Reeds Bridge Rd
Conway
Swim hole
4254131
-726901
Project Purpose- DRWA
B Intended Uses of Data
The data generated under this QAPP will serve the following uses
- Use in the MassDEP CWA Integrated Report
- Document the presence and severity of bacteria as pathogen indicators
- Educate school children and local communities about water quality and any problems and improvements
- Evaluate the effectiveness of restoration projects and other management activities
A56 Program Goals and Objectives ndash NepRWANepRWArsquos CWMN program seeks to accomplish the following during the period 2019-2021
- Regularly collect in-stream water quality samples at a handful of ldquoindicator sitesrdquo that represent overall water quality conditions and trends
- Regularly collect in-stream water quality samples at a larger number of ldquosubwatershed sitesrdquo that target known or suspected problem areas
- Conduct ldquofollow uprdquo and ldquospecial studyrdquo investigations and sampling as needed to confirm and further specify suspected problem or opportunity areas identified through the regular sampling program
- hellip
- Collect in-stream samples during rainfall events
- Distribute results promptly to municipal officials state and federal regulators and the general public as a means to increase understanding of water pollution issues
- Using fully sterile methods collect data needed to help implement recommendations of the Total Maximum Daily Load (TMDL) for bacteria
- Generate data to help enhance the effectiveness of municipal state federal and private efforts to improve water quality
Monitoring Objectives amp DWM-DEP Data Levels
EducationalStewardship-levelbull Objective is to engage volunteers in monitoring to develop better understanding
of the importance of water resources and to encourage their fellow citizens to take an active role in the preservation and restoration of their local water bodies and watersheds
Screening-level bull Typically used to direct future sampling efforts and as supporting evidence only
RegulatoryAssessment-levelbull Directly usable for 305(b) and 303(d) decision-making bull Scientifically sound and legally-defensible bull Contingent on review and approval these data can help determine if a water body
is meeting water quality standards or is impaired
Monitoring Objectives amp DWM-DEP Data Levels
Project Task Description ndash EPA Element 6
In general terms describe bull The work your staffvolunteers will perform bull Where it will take placebull What kinds of samples will be takenbull What kinds of conditions will be measuredbull How you will evaluate results
DRWA Project PurposeTask Description
C Brief Description of Project- There will be a training and orientation meeting held in March organized by VTDEC but
held at VAEL - Volunteers will be trained annually prior to the start of the sampling season- River water samples will be collected at 29 sites 6 times between June and September- The project will employ the Colilert System developed by IDEXX laboratories Inc to assay
E coli bacteria Samples will be analyzed at the CRC laboratory- Data will be analyzed and reviewed for quality assurance summarized and interpreted on
an annual basis - Data that meet project quality objectives will be submitted to MassDEP and entered in the
VTDECrsquos Water Quality data management system as well as the EPArsquos national water quality data storage system known as STORET
- Information will be presented to the local community in a suitable format be it a press release public meeting or another event
- A report will be prepared and shared with the distribution list in this QAPP and published on the DRWA website (deerfieldriverorg)
Site ID Site Name Town Rationale Lat Lon Deerfield River Mainstem and Branches
VT-NBD_064
East Dover Rd Wilmington Monitor above most ag and below golf course
4291431 -728376
VT-NBD_027
Above Wilmington Center
Wilmington Monitor within ag and above village center
4287452 -72864
VT-NBD_020
Wilmington Center above confl w
Beaver Brk
Wilmington Monitor for high bacterianutrients and
Beaver Brk contribution
4286816 -728721
VT-NBD_018
Wilmington Center below confl w
Beaver Brk
Wilmington Swim holehigh bacterianutrients
4286875 -728738
MA-DFR_289
Shunpike Rest Area Charlemont Monitor Deerfield River coming from VT
426363 -729071
MA-DFR_276
Above Charlemont Center
Charlemont Bracket WWTF Mill Brk 426271 -728853
MA-DFR_267
Charlemont Center Charlemont Bracket WWTF Mill Brk 426262 -728685
MA-DFR_011
5 amp 10 Bridge Greenfield Monitor Deerfield contributions to CT River
PrecisionThe degree of agreement among repeated measurements of an indicator on separate samples collected as close as possible in time and place
It does not mean that the sample actually reflects the ldquotruerdquo value but rather that your sampling and analysis are giving consistent results under similar conditions
AccuracyAccuracy or Bias is a measure of confidence that describes
how close a measurement is to its ldquotruerdquo value
Parameter Reporting Limit
Accuracy ( Recovery)
Field Precision (RPD)
Expected Range
E coli 1 MPN 100ml
Blanks and negatives show no colonies positives show colonies
30 of log10 transformed MPN
0-2420 MPN
These objectives will be measured as follows
Field Specific Quality Controls
10 of samples collected (3 per event in 2019) will be field blanks Sterile water poured into sterile sample bottle in the field These must register lt1 for total coliform and E coli
10 of samples collected (3 per event in 2019) will be field duplicates A second sample will be collected at the same location by the volunteer These will have a Relative Percent Difference of le 30 for log transformed e values
Laboratory Sample Batch-Specific Quality Control Samples With each new batch of samples run CRC will perform the following QC sample analysis
1 Lab Blank - Sterile water1 Positive Culture Control -sterile buffer dilution water inoculated with E coli (ie total coliform amp E coli positive)1 Negative culture Control -sterile buffer dilution water inoculated with non-fluorescent Pseudomonas sp (ie
total coliform amp E coli negative) 1 Lab Duplicate ndash 250 mL sample split into 2 100 mL samples in the lab
DRWA Data Precision and Accuracy
REPRESENTATIVENESS
Representativeness is the extent to which measurements actually represent the true environmental condition
You will state that- Sampling sites were selected to appropriately capture
- the general characteristics of the water body- or specific impacts if you are conducting an impact assessment (eg above amp
below suspected pollution sourceshellip)- The sample collection point is appropriate eg mid-stream mid-lake etc what
sampling depth - Number of sites is adequate to answer study question- The parameters monitored are relevant to the type of impact or to a general
WQ assessment- Sample collection timing and frequency are selected to capture data that are
representative of target conditions (eg various water levels weather seasons)
MassDEP - RECOMMENDED MINIMUM SAMPLE NUMBER FREQUENCY AND TIMING FOR EXAMPLE PARAMETERS
Parameter
Streams Lakes
Min Sample Number and Frequency
Sampling Period Min Sample Number and Frequency
Sampling Period
DO (discrete) 5 results pre-dawn June - September 3 results (epilimnetic) June - September
DO (continuous) 3o days June - September 3o days June - September
pH 5 results June - September 3 results (epilimnetic) June - September
Temperature (discrete) 5 results afternoon June - September 3 results (epilimnetic) June - September
Temperature (continuous) 3o days June - September 3o days June - September
Bacteria (eg E coli) 3-5 results (in 30-90 days) April 1-October 15 3-5 results (in 30-90 days) April 1-October 15
Nutrients (inc chl a for lakes) 5 results June- September 3 results June - September
Secchi depth --- --- 3 results June - September
Chloride 3 results 4 day period (yr-round) --- ---
ldquoCleanrdquo metals 3 results 4 day period (summer) --- ---
Misc toxics emerging contam 3 results 30 day period (summer) 3 results (epilimnetic) 30 day period (summer)
Fish community 1 survey April 1-October 15 1 survey April 1-October 15
Fish tissue contaminants (eg Hg PCBs pesticides)
1 survey Any 1 survey Any
Benthic invertebrates (RBP3) 1 survey July ndash October --- ---
Weed surveys 1 survey June- September 1 survey June- September
Aesthetics 1 survey April 1-October 15 1 survey April 1-October 15
30 days (bathing) 90 days (non-bathing) ldquoworst-caserdquo typ July-Aug
REPRESENTATIVENESS
DRWAB Data RepresentativenessSamples collected at locations and depths described in this QAPP will reflect conditions of individual water bodies and tributaries in Vermont and Massachusetts To ensure representativeness all samples will be collected preserved and analyzed according to the procedures in this QAPP and within the specified holding times
NepRWAA7-5 Data RepresentativenessSampling points will be chosen to represent the water quality within the applicable geographic area of interest Staff experienced and knowledgeable in the factors affecting water quality will choose sample points that will be representative of conditions within the area of concern
COMPARABILITY
Comparability is the degree to which data can be compared directly to similar studies There are two things to consider future studies someone might undertake and past studies you (or others) will want to compare your data with
State that you will use and document standardized - sampling amp analytical methods and units of reporting- sampling sites times and dates - sample storage and transfer
Comparability
Deerfield River Watershed Association
C Data ComparabilityAll samples for each specific parameter will be collected and analyzed using the respective procedures described in this QAPP to ensure that comparisons between different sample sites sample dates depths and projects can be appropriately made Procedures are unchanged from previous years
Neponset River Watershed Association
A7-6 ComparabilityComparability is ensured by the utilization of established sampling and monitoring protocols from Massachusetts DEP MWRA Massachusetts Water Watch Partnership the Boston Water and Sewer Commission and NepRWA and by the use of standard test methods and procedures as outlined in Appendices 6 7 and 8
Completeness
Completeness is an estimate of the amount of data you will need to answer your study question Usually expressed as a of originally planned sample events after missing sample events and data no meeting DQOs are subtracted from the planned number
DRWA
D Data CompletenessAt least 80 of the anticipated number of samples will be collected at each site analyzed and determined to meet data quality objectives for the project to be considered successful A report detailing the number of anticipated samples number of valid results and percent completion (number of valid samplesnumber of anticipated samples) will be produced
NepRWAA7-8 CompletenessIn order to obtain the best picture of the watershed NepRWA expects 90 of the routine sampling and follow up sampling samples to be collected and analyzed during each scheduled sampling event In the routine sampling program uncertainties such as weather volunteer scheduling and illness sometimes result in unavoidable omissions but every effort is made to assign backup samplers when possible
Sampling Process Design - EPA Element 10From MassWWP QAPP Guide
Purpose To describe in greater detail the design of the sampling part of your monitoring program
In Section 6 you briefly outlined the sample process design In this section you should elaborate on the rationales for those choices When you complete this section you should revisit Section 6 and revise as necessary The two sections should be in agreement
What To Include bull Indicators or measures bull Types of samplesbull Sampling frequency bull Sampling period bull How you will select sample sites and identify them over timebull Site safety plans
MADEP - RECOMMENDED MINIMUM SAMPLE NUMBER FREQUENCY AND TIMING FOR EXAMPLE PARAMETERS
Parameter
Streams Lakes
Min Sample Number and Frequency
Sampling Period Min Sample Number and Frequency
Sampling Period
DO (discrete) 5 results pre-dawn June - September 3 results (epilimnetic) June - September
DO (continuous) 3o days June - September 3o days June - September
pH 5 results June - September 3 results (epilimnetic) June - September
Temperature (discrete) 5 results afternoon June - September 3 results (epilimnetic) June - September
Temperature (continuous) 3o days June - September 3o days June - September
Bacteria (eg E coli) 3-5 results (in 30-90 days) April 1-October 15 3-5 results (in 30-90 days) April 1-October 15
Nutrients (inc chl a for lakes) 5 results June- September 3 results June - September
Secchi depth --- --- 3 results June - September
Chloride 3 results 4 day period (yr-round) --- ---
ldquoCleanrdquo metals 3 results 4 day period (summer) --- ---
Misc toxics emerging contam 3 results 30 day period (summer) 3 results (epilimnetic) 30 day period (summer)
Fish community 1 survey April 1-October 15 1 survey April 1-October 15
Fish tissue contaminants (eg Hg PCBs pesticides)
1 survey Any 1 survey Any
Benthic invertebrates (RBP3) 1 survey July ndash October --- ---
Weed surveys 1 survey June- September 1 survey June- September
Aesthetics 1 survey April 1-October 15 1 survey April 1-October 15
30 days (bathing) 90 days (non-bathing) ldquoworst-caserdquo typ July-Aug
Deerfield River Watershed Association
10 Sampling Process Design
Sampling sites were selected to represent locations that receive heavy human use from swimmers boaters anglers and other contact recreational users
Samples will be collected bi-weekly from late June through early September (prime recreation period) between 10 AM and 1 PM Samplers will first fill out their field data sheet They will then collect a water sample away from the edge of the stream near the center of the stream (centroid of flow) and just below the surface following the MWWP protocol (available in the Appendix)
Samplers will place their samples immediately in a cooler with ice or frozen ice packs making sure the temperature in the cooler is at 4degC or lower Each sample bottle will be placed in an individual clean Ziploc bag to avoid cross contamination
Neponset River Watershed Association
B1 Sampling Process Design
The CWMN program is designed to develop and maintain a record of general water qualitythroughout the watershed Project goals include both evaluation of long-term changes over time across the watershed as a whole and the identification of pollution hotspots at a low order subwatershed scale
Routine sampling activities consist of collecting in-stream samples As discussed above routine sampling sites are divided among ldquoindicatorrdquo sites and ldquosubwatershed sitesrdquo in order to meet the dual objectives of the program Indicator sites are selected to be representative of overall water quality and are relatively unchanging over time to allow comparison to past and future investigations Sites have generally been selected at the downstream ends or key segmentation points of major subwatersheds and at or near locations where there is a longstanding data record
Neponset River Watershed Association
B1 Sampling Process Design ndash continued
Subwatershed sites are selected to provide higher spatial resolution along individual streams in an effort to bracket pollution sources and facilitate their identification and remediation Subwatershed sites make up roughly 60 of the overall number of sites and are more likely to change from year to year Subwatershed sites may be rotated through different watersheds over the course of several sampling seasons to provide detailed data on different subwatersheds over a period of years Specific sites are selected by the project manager on the basis of known or suspected problems or opportunities or to fill in a lack of detailed data in a specific area
Neponset River Watershed Association
B1 Sampling Process Design ndash continued
In addition to the routine sampling activities CWMN also encompasses follow up and special study sampling activities These are generally ldquoone-timerdquo investigations intended to zero in on pollution sources in a known or suspected problem areahellipSpecific sampling stations may be planned in advance or may be chosen opportunistically by samplers while in the field
The mix of parameters sampled at each site depends on its status as an indicator subwatershed or follow up station the relative location of the station in the watershed and the specific pollutant(s) of concern at that specific location Indicator sites are tested for bacteria nutrients ammonia and field measured parametershellip Subwatershed sites are generally tested for bacteria total phosphorus and field measured parameters At some subwatershed sites hellip Follow up sampling stations will generally be tested for a very narrow set of parameters based on the specific pollutant of concern A listing of current routine sampling stations and the parameters sampled is provided in the Appendix 1e
Sampling Methods Requirements - EPA Element 11
This section describes your field measurementsample collection methods It can be stated in table form with narrative descriptions if you choose
Includebull What parameters are being sampledbull Sampling containersdevices sample preservation steps Maximum holding timebull Amount of sample to be collectedbull Summarize steps taken by field samplersbull Reference to the method followed (cite specific SOPS include in appendices)bull Can also include sampling considerations (eg time of day steps taken to avoid stirring up
sediments sample collection depth etc) These will be detailed in SOPs
Deerfield River Watershed Association
ParameterMeasure Container Field Rinse Preservation Hold Time E coli 120 mL IDEXX
Cool to lt4degC 6 hours to lab 8 hours to processing
B2 Sampling Methods
B2-2 Visual ObservationsB2-3 Fecal Coliform E coli and EnterococcusB2-5 NutrientsB2-6 Specific Conductance and SalinityB2-7 TemperatureB2-8 pH B2-9 Dissolved OxygenB2-10 SurfactantsB2-11 Depth and FlowB2-12 Optical BrightenersB2-13 Qualitative Ammonia Nitrogen
Neponset River Watershed Association
Sample Handling and Custody Requirements - EPA Element 12
Demonstrate that your sampling handling and storage techniques will retainsafeguard the integrity of your samples and data records
12 Sample Handling and Custody Procedures
Samples will be collected between 7 AM and 10 AM on sampling days The samples will be kept on ice inside a cooler during transport Wilmington VT area samples will be picked up by the monitoring assistant in the Main Street parking lots or other agreed upon meeting location by 9 AM Green River VT samples will be picked up by the transporting volunteer at the Green River covered bridge or other agreed upon meeting location by 930 AM The remaining samples will be delivered directly to the CRC water quality lab by 10 AM Any exchange of possession in the samples will be documented on the Chain of Custody (CoC) form which will be completed and signed by the Lab Analyst upon receipt at the lab The CoC form will be checked by the program coordinator See Appendix for the CoC
Deerfield River Watershed Association
Analytical Methods Requirements - EPA Element 13
Deerfield River Watershed Association
13 Analytical Methods Requirements
All analytical determinations will be performed at the CRC lab in Greenfield by the Lab Director Gabriel Chevalier
Indicator
Method Number
Source
Reporting Units
Modifications or Options
E coli
United water laboratory 1603 Bacteria Colilert SOP 604b CRWC 03-11-10
EPA 1603 (Modified m-TEC)
1 MPN
Sodium Thiosulfate used in all containers
Neponset River Watershed Association
Massachusetts Volunteer Monitorrsquos Guide to QAPP DevelopmentPAGE 61
Here are some things to consider in choosing a method Scientific Considerations Does it meet your data quality objectives
How accurate is it How precise (reproducible) is it What is its detection limit
Will it measure the indicator in the range that you need What lab facilities are required What equipment is required Does it yield samples that are representative Is it comparable to methods used by agencies collecting similar information
Practical and Program Considerations bull Do you have the human and financial resources to do it bull How difficult is it bull How time-consuming is it bull Will it produce data useful to the target audience
Quality Control ndash EPA Element 14
This section documents that the specific quality control measures you will take will allow you to determine whether you meet your data quality objectives
What To Include Section 7 stated your DQOs Here you describe how you are going to meet them
For each indicator include the following information
bull Accuracy Precision checks list what checks you will perform
bull List the of your samples upon which you will perform quality checks that will represent the quality of all your samples
Quality Control
Accuracy checks
There are a variety of ways to check the accuracy of your sampling and analysis
Checks can be done internally (done totally within your project lab) or externally (done with the assistance of an independent lab)
Known Samples This is an internal check that compares your results against another analyst or a ldquoknownrdquo An example of a known is a quality assurance sample that UMass WRRC sends to VM groups for pH DO or alkalinity ndash with the expected value communicated when sample is sent
Proficiency Testing (Unknown) Samples In some cases there are programs that provide proficiency testing samples for laboratory performance evaluation the concentrations of which are known to the auditor but not to the lab being tested This is relatively common for most water chemistry indicators An example of an unknown would when WRRC sends a quality assurance sample without communicating the expected value in advance
Quality Control
Accuracy checks - continued
Blank and Positive Plates Bacteriological samples should be checked using the blank and positive plate procedure The blank plate uses the rinse water media and equipment in the analysis to determine if there is contamination in the laboratory materials The result should be 0 The positive plate procedure uses a sample known to contain bacteria (eg waste- water treatment plant influent) to determine if a procedural error in the lab causes inhibition of bacterial growth Results should be rdquoToo Numerous To Countrdquo Each batch of samples should include at least one blank and one positive check sample This is an internal check
Spiked Samples Spikes are additions of a known amount of the indicator with the expectation that subsequent analysis will measure exactly that much increase over the un- spiked sample This procedure is described in Section 1020 B of Standard Methods This is an internal check
Voucher and Reference Collections For macroinvertebrates and aquatic plants maintenance of a voucher andor a working reference collection is recommended A voucher collection is a preserved collection of the type specimens ie an example of each of the individual taxa that you have given a name It should be maintained in archival condition by a trained curator typically found at a university A reference collection is an exact duplicate of the voucher collection but is the one that you will regularly use as a reference when identifying new specimens Both voucher and reference collections should be verified by an expert This is an external check Alternatively have an expert review IDs made by volunteers of at least 10 of specimens collected 90 accuracy is recommended
Quality Control
Precision Checks
Precision checks are primarily accomplished through replicate sampling amp analysis in the field and lab
Field Replication Replication can be done by the same field collectors but some replication by other collectors is good eg a pair of field collectors swapping roles or have different team collect the replicate This is an internal check
Lab Replication Additional replication should occur in the lab Lab replication is done by dividing a well-mixed sample into two or more aliquots and conducting analysis on each aliquot This is an internal check
Split Samples Split samples (a sample that is split into two sub-samples) can be done in the field or the lab
Relative Percent Difference
A measure of precision used for duplicate sample results It is calculated by dividing the difference between the two results by the mean of the two results expressed as a percentage Used when sample number equals two
eg ((98-92) 100) ((98+92))2 = 63
Deerfield River Watershed Association
14 Quality Control RequirementsA Volunteers Check - Field AuditEither the QC Officer the Project Coordinator or both will accompany a crew of volunteers (each) to their site each collection The trainers will observe the volunteersrsquo performance and check their sampling technique and field data sheets for accuracy
B Field QC ChecksAt least one Field Duplicate and one Field Blank will be submitted for every ten samples collected
Field Duplicate ndash a check on water quality sampling amp analysis consistency This is a replicated sample collected at the same point in time and space side by side with the first sampling and given a separate Sample ID number
Field Blanks ndash a check for contamination (AccuracyBias) in the field by processing laboratory-supplied deionized water through the sampling train This checks for contamination introduced from the sample container(s) or from field contamination A Field Blank will be taken by one volunteer at one site per sampling day for bacteria A container of DI water will be given to the volunteer who will pour this DI water into the sample bottle at the site
We will rotate the field duplicate and field blank samples among the volunteers throughout the sampling season so a maximum of collectors can be checked
Deerfield River Watershed Association
14 Quality Control Requirements ndash continued
C Laboratory QC ChecksA Lab Duplicate will be analyzed each sampling day The lab will split a randomly chosen sample and analyze both subsamples
The lab will run a Lab Blank and a Positive Sample for bacteria each collection (see section 7)
D Data Analysis QC ChecksRiver data and QC data will be reviewed by the QC Officer as soon as they come in from the lab after each collection QC data will be compared to the quality objectives (eg blanks should have zero colonies sample duplicates should be within 3 standard deviations of the mean positives should show bacterial growth etc) River data will be reviewed as well to ensurethat no field or lab contamination has occurred (data will be compared to those of other sites and of previous collections)
Bacteria computations will be checked and validated If discrepancies are found the Lab Director will be called to resolve the discrepancy and corrections will be made by the QC Officer
Field data sheets will be also reviewed the day of collection by the Project Coordinator and later by the QC Officer to ensure that samples were taken at the right times and that all the required information has been filled out The Project Coordinator or collectors will be called if omissions or errors are detected If needed corrections will be made (signed anddated) on the field sheet by the QC Officer
Neponset River Watershed Association
PRECISION DQOS DEALING WITH LOW-LEVEL CONCENTRATIONS
Source Analyte Units PrecisionMassDEP WPP Monitoring QAPP
Training Requirements Certification ndash EPA Element 8
In Narrative or Table Format
bull List type of training (eg Field WQ lab analysis visual observation data mgt data entry etc)
bull Who is training who receives training
bull How often training done
If training records are kept (they should be) include that in section 9 on documentation and records
Neponset River Watershed Association
A8 Training - ExcerptTo ensure the high quality and usability of the data that is generated by the CWMN program all participants receive training appropriate to the tasks for which they will be responsible NepRWA staff that are involved in the program are professionals with extensive training in water quality chemistry biology and field sampling NepRWA has established a program of training for volunteers that includes initial training follow-up and refresher classes These classes are given by NepRWA staff that are qualified not only in the technical matter covered but in training and education
The initial training for volunteer monitors is primarily instruction and demonstration by the trainer with repetition by the volunteer This training includes an overview of the entire project and detailed instruction in sampling procedures All monitors receive and review a copy of NepRWArsquos Water Monitoring and Sampling Manual (see Appendix 3a)
After their initial training all volunteers participate in a mandatory annual group andor individual training session These sessions are designed to update the volunteers on changes in the program further train them in equipment calibration and field-testing procedures and evaluate each volunteerrsquos performancehellip
InstrumentEquipment Testing Inspection and Maintenance Requirements ndash EPA Element 15
Instrument Calibration and Frequency ndash EPA Element 16
InspectionAcceptance Requirements for Supplies ndash EPA Element 17
DOCUMENTATION AND RECORDS ndash EPA ELEMENT 9
Neponset River Watershed AssociationA9 Documents and RecordsA9-1 Data SheetsField data sheets include information about the site location (NepRWA ID number) which specific equipment was used to make measurements (thermometer number) the sampling method used (direct fill pole or Bridge Buddy) and equipment calibration results The field data sheets are also used to record temperature velocity depth color odor and turbidity information (Appendix 4e)helliphellip See Appendix 4 for copies of the various data sheets used in the CWMN program
A9-2 Chain of Custody FormsA9-3 Sample LabelingA9-4 Equipment Custody FormA9-5 Training and Evaluation Form
Data Acquisition Requirements - EPA Element 18
Purpose To ensure that any data you use but donrsquot collect yourself has a known data quality and is consistent with your data quality objectives that others can access these data and that your use of the data is appropriate
Describe any external data you use such as GPS coordinates for site locations weather station rainfall amounts etc
Include bull The title of the document or name of the informationbull Where you obtained it and where others may find itbull Notes on the quality of the outside information such as uncertainties and caveats
Preamble to Elements 19 through 24
Consider the four separate objectives of these chapters1) Producing a good data set - 19 covers the normal data mgt routines you do to prevent data mistakes in the first place- 22 amp23 describe how you review the resulting data sets - how you find and correct
missing or erroneous data - 19 22 and 23 should produce as complete amp accurate a data set as possible 2) Ensuring that any use you make of your data is justified In 24 you decide how usable your data are Review the final data set that the above efforts have produced Compare it with your DQOs to determine whether you have to discard or qualify any data what conclusions you can draw from your data or what changes you might need to make in your DQOs3) Improve overall project performance 20 deals with how well volunteers laboratories and equipment are operating It looks at function not outcomes Who evaluates the various components of your program when problems are found what corrections are made to make your program run better4) Report your results After yoursquove run these various checks you are ready to release your data In Chapter 21 you describe the reports you will issue
Suggested order bull Data Management (19)bull Data Review Validation and Verification Requirements (22)bull (Data) Validation and Verification Methods (23)
bull Reconciliation with Data Quality Objectives (24)
bull Assessment and Response Actions (20)
bull Reports (21)
EPA Elements 19 ndash 24
bull Data Management (19)bull Assessment and Response Actions (20) bull Reports (21)bull Data Review Validation and Verification Requirements (22)bull (Data) Validation and Verification Methods (23)bull Reconciliation with Data Quality Objectives (24)
Data Management ndash EPA Element 19
Follow the data from the moment itrsquos recorded through every step to final report databaseIntent is to prevent errors or loss of data or be able to correct in timely manner
bull Before each activitystep is conducted well-designed field sheets checklists COC forms data entry software auto-QC calculations out-of-bounds highlights etc
bull During each step sheets filled completely checklist reviewed before leaving site etc
bull Immediately after Computer-entered data compared with field sheets etc
bull Long term preservation Data storage
Neponset River Watershed Association
B9 Data ManagementThe Project Manager is responsible for overseeing all data management activities Refer also to section D below for additional discussion of data review verification and validation practices
B9-1 Raw DataField data sheets are collected with the samples The sheets are turned into the NepRWA office by the site coordinators The forms are then reviewed for illegible answers errors or questionable values and checked for consistency with the COC and bottle labels as described in Appendix 3l Any questions are referred to the volunteer for clarification NepRWA staff makes corrections by crossing out the errors and writing in the correct answer All corrections must be initialed
B9-2 Data Entry and ValidationOnce the information has undergone a preliminary check it is entered into a Filemaker database The software has been customized to the data sheet Fields within the worksheet have been set-up with limits based on expected results This helps to minimize entry errors Entered data is then checked against the data sheets by another volunteer or staff person
B9-3 Data StorageThe original data sheets are filed into an event file and stored in NepRWArsquos permanent files Electronic copies of data are maintained on a secure Filemaker server Data files are kept in perpetuity along with hard copies of volunteer data sheets All electronic data is backed-up daily on to a password-protected hard drive
Data Review Validation and Verificationndash EPA Element 22
(Data) Validation and Verification Methods ndash EPA Element 23
Deerfield River Watershed Association
22 Data Review Validation and Verification ndash Summarized bullet list
All data reviewed by the Project Coordinator and QA Coordinator
Data Analysis QC Checks will includebull Data entry checks by a second personbull Computer entries compared with fieldlab sheetsbull Checks on graphs amp all other data representationsbull Calculation of measures of data quality including completeness
Corrective actionsbull Data entry errors corrected bull Data outside expected range flagged or rejected bull 2nd field sample andor laboratory aliquot taken when possiblebull Data quality problems discussed in draft and final reports
(Data) Validation and Verification Methods ndash EPA Element 23 From Inland QAPP
Validation and Verification Methods will include checks on bull Completion of all fields on data sheets missing data sheetsbull Completeness of sampling runs (eg number of sites visitedsamples taken vs number proposed were all parameters sampledanalyzed)bull Completeness of QC checks (eg number and type of QC checks performed vs numbertype proposed)bull Accuracy and precision compared to data quality objectivesbull Representativeness of samples and resulting data by examining survey metadata for unusual conditions and occurrences that may have impacted the validity of results
Deerfield River Watershed Association ndash Excerpt summarized
23 Validation and Verification Methods
The following simple measures of data quality will be calculated and included in the final report
1) To screen for contamination the average blank concentration hellip will be calculated This average value should be as close as practical to the Reporting Limit listed in Table 4
2) To assess the precision of results the ldquoMean Relative Percent Differencerdquo between field duplicate samples should be calculated The average RPD should be less than or equal to the Estimated Precision listed in Table 4 This simple measure is calculated as follows
RPD formula used hellip
Reconciliation With Data Quality Objectives ndash EPA Element 24MassWWP guide to QAPP development
What to Include bull List who will evaluate your actual data vs your data quality goals bull State how and when this will be done bull Describe the process for determining what to do if goals are not met
Neponset River Watershed Association
D2 Reconciliation with User Requirements - Summarized bulletedbull Following each sampling event and prior to the subsequent event calculations and
determinations for precision completeness and accuracy will be made bull Any corrective action will be implemented noted and initialized by the project manager bull If data quality indicators do not meet the projectrsquos specifications then data may be discarded
may be flagged or re-sampling may occur bull Investigation of problems will take place and corrections will be documented If equipment
failure is found to be the cause calibration and maintenance techniques will be reassessed Field duplicate testing may occur during the next sampling event to ensure confidence in the results
bull Any limitations on the data will be noted bull Any revisions to the project will be submitted to EPA and DEP quality assurance officers for
approval
Assessment and Response Actions - EPA Element 20 From Inland QAPP
Document that the progress and quality of the monitoring program will be continuously assessed to ensure that its objectives are being accomplished
The Monitoring Coordinator will periodically check to see the following bull Monitoring is occurring as planned bull Sufficient written commentary and supporting photographs exist bull Sufficient volunteers are available bull Volunteers have been observed as they sample their sites bull Samplers are collecting in accordance with project schedules bull Data sheets and custody control sheets are being properly completed and signed bull Data are properly interpreted bull Plans for dealing with adverse weather are in place
Assessment and Response Actions - EPA Element 20 From Inland QAPP ndash continued
The Monitoring Coordinator will periodically check to see the following bull Retraining or other corrective action is implemented at the first hint of non compliance with the
QAPP or SOPs bull Labs are adhering to the requirements of their QAPP in terms of work performed accuracy
acceptable holding times timely and understandable results and delivery process bull Data management is being handled properly ie data are entered on a timely basis is
properly backed up is easily accessed and raw data are properly stored in a safe placebull Procedure for developing and reporting the results exists
Assessment and Response Actions - EPA Element 20 From Inland QAPP ndash continued
The Monitoring Coordinator will confer with the QA Officer as necessary to discuss any problems that occur and what corrective actions are needed to maintain program integrity In addition the Monitoring Coordinator and QA Officer will meet at the end of the sampling season to review the draft report and discuss all aspects of the program and identify necessary program modifications for future sampling activities [If the program includes a technical advisory committee the TAC will be included in these discussions] Corrections may include retraining volunteers rewriting sampling instructions replacement of volunteers alteration of sampling schedules sites or methods or other actions deemed necessary All problems discovered and program modifications made will be documented in the final version of the project report If modifications require changes in the Quality Assurance Project Plan these changes will be submitted MassDEP for review
Deerfield River Watershed Association
20 Assessment and Response Actions ndash Summarized bullet list
bull There will be an on-site visit by the Quality Control Officer to observe field sampling and field analysis procedures Generally this will be done near the beginning of the project
bull A written checklist will be used for the assessments maintained by the Project Coordinator and copies will be provided with the data report
bull The Project Coordinator and QC Officer will determine if field work follows the written procedures or if there needs to be corrections by additional training or revising protocols
bull Please refer to Section 22 for additional evaluations and response actions regarding data evaluations
Reports ndash EPA Element 21
Project Task Organization ndash EPA Element 4 Reviewrevise early choices
Distribution List ndash EPA Element 3
Title and Approval Page - EPA Element 1
Table of Contents ndash EPA Element 2
Water quality monitoring quality assurance workshop
Terminology
Study design
QAPP
sampling and analysis plan
standard operating procedures
data quality objectives
Water Quality Monitoring Planning Process
Monitoring program activities
Why do you need (who Gives) a qapp
Slide Number 11
Slide Number 12
Steps to Developing a QAPP
Slide Number 14
Slide Number 15
Slide Number 16
Steps to Developing a QAPP
Slide Number 18
Slide Number 19
Slide Number 20
Slide Number 21
Slide Number 22
Slide Number 23
Slide Number 24
Sources of Information About Massachusetts Waters
Slide Number 26
Slide Number 27
Slide Number 28
Slide Number 29
Slide Number 30
Slide Number 31
Slide Number 32
Slide Number 33
Slide Number 34
Slide Number 35
Slide Number 36
Slide Number 37
Slide Number 38
Slide Number 39
Slide Number 40
Slide Number 41
Slide Number 42
Slide Number 43
Slide Number 44
Slide Number 45
Slide Number 46
MassDEP - Recommended Minimum Sample Number Frequency and Timing for Example Parameters
Slide Number 48
Slide Number 49
Slide Number 50
Slide Number 51
Slide Number 52
MaDep - Recommended Minimum Sample Number Frequency and Timing for Example Parameters
Slide Number 54
Slide Number 55
Slide Number 56
Slide Number 57
Slide Number 58
Slide Number 59
Slide Number 60
Slide Number 61
Slide Number 62
Slide Number 63
Slide Number 64
Slide Number 65
Slide Number 66
Slide Number 67
Slide Number 68
Slide Number 69
Slide Number 70
Slide Number 71
Slide Number 72
Slide Number 73
Slide Number 74
Slide Number 75
Slide Number 76
Precision DQOs Dealing with low-level concentrations
Slide Number 78
Slide Number 79
Slide Number 80
Slide Number 81
Slide Number 82
Documentation and Records ndash EPA Element 9
Slide Number 84
Slide Number 85
Slide Number 86
Slide Number 87
Slide Number 88
Slide Number 89
Slide Number 90
Slide Number 91
Slide Number 92
Slide Number 93
Slide Number 94
Slide Number 95
Slide Number 96
Slide Number 97
Slide Number 98
Slide Number 99
Slide Number 100
Site ID
Site Name
Town
Rationale
Lat
Lon
Deerfield River Mainstem and Branches
VT-NBD_064
East Dover Rd
Wilmington
Monitor above most ag and below golf course
4291431
-728376
VT-NBD_027
Above Wilmington Center
Wilmington
Monitor within ag and above village center
4287452
-72864
VT-NBD_020
Wilmington Center above confl w Beaver Brk
Wilmington
Monitor for high bacterianutrients and Beaver Brk contribution
4286816
-728721
VT-NBD_018
Wilmington Center below confl w Beaver Brk
Wilmington
Swim holehigh bacterianutrients
4286875
-728738
MA-DFR_289
Shunpike Rest Area
Charlemont
Monitor Deerfield River coming from VT
426363
-729071
MA-DFR_276
Above Charlemont Center
Charlemont
Bracket WWTF Mill Brk
426271
-728853
MA-DFR_267
Charlemont Center
Charlemont
Bracket WWTF Mill Brk
426262
-728685
MA-DFR_011
5 amp 10 Bridge
Greenfield
Monitor Deerfield contributions to CT River
4256975
-725922
North River
VT-EBN_150
Above Jacksonville WWTF
Whitingham
Bracket WWTF
42787
-728163
VT-EBN_147
Below Jacksonville WWTF
Whitingham
Bracket WWTF
4278456
-728128
MA-EBN_024
Foundry Village Rd Ballfields
Colrain
Swim hole
4267478
-726966
MA-NOR_001
Formerly Sunburn Beach
Colrain
Mouth of North River
4265286
-727141
Green River Watershed
VT-PND_001
Mouth of Pond Brook
Halifax
Green River reclassification in support of Green River Watershed Alliance grant
428135
-727243
VT-GRN_234
Hinesburg Rd
Guilford
Green River reclassification in support of Green River Watershed Alliance grant
4279717
-726804
VT-HBG_001
Mouth of Hinesburg Brook
Guilford
Green River reclassification in support of Green River Watershed Alliance grant
4279582
-726605
VT-GRN_202
Green River Timber Crib Dam swim hole
Guilford
Swim HoleGreen River reclassification in support of Green River Watershed Alliance grant
4277555
-726673
VT-GRN_168
MAVT State Line
Guilford
Green River reclassification in support of Green River Watershed Alliance grant
4273299
-726761
MA-GRN_098
Bare Ass Beach
Greenfield
Swim Hole
4265102
-726235
MA-MPL_001
Mouth of Maple Brook
Greenfield
ID source of bacterianutrients
4258667
-726124
MA-GRN_020
Mohawk Trail Bridge
Greenfield
ID source of bacterianutrients
4258554
-726117
MA-GRN_008
Pretty Plain Rd
Greenfield
Monitor Green River contributions to Deerfield River high bacterianutrients
4257636
-725984
Other Tributaries
VT-
ELS_002
Ellis Brook TBD
Wilmington
Monitor below WWTF
429202
-728381
VT-COB_003
Cold Brook Above confl with N Br Deerfield
Wilmington
General water quality monitoring effect of Mt Snow pond
4289928
-728595
VT-BVR_029
Near Shearer Hill Rd
Wilmington
Monitor for runoff
42855
-728385
VT-BVR_011
Off Rte 9 near Wahoorsquos
Wilmington
Monitor for high bacteriarunoff
4286523
-728588
MA-CHI_001
Chickley River Tower Rd
Charlemont
Monitor contributions to Deerfield River
4263005
-729016
MA-MBK_001
Mill Brook TBD
Charlemont
Monitor mouth for contribution
426271
-728728
MA-CLS_003
Clesson Brook Buckland Rec Area
Buckland
Swim hole monitor contributions to Deerfield River
4261553
-72767
MA-SOU_024
South River Reeds Bridge Rd
Conway
Swim hole
4254131
-726901
Monitoring Objectives amp DWM-DEP Data Levels
Project Task Description ndash EPA Element 6
In general terms describe bull The work your staffvolunteers will perform bull Where it will take placebull What kinds of samples will be takenbull What kinds of conditions will be measuredbull How you will evaluate results
DRWA Project PurposeTask Description
C Brief Description of Project- There will be a training and orientation meeting held in March organized by VTDEC but
held at VAEL - Volunteers will be trained annually prior to the start of the sampling season- River water samples will be collected at 29 sites 6 times between June and September- The project will employ the Colilert System developed by IDEXX laboratories Inc to assay
E coli bacteria Samples will be analyzed at the CRC laboratory- Data will be analyzed and reviewed for quality assurance summarized and interpreted on
an annual basis - Data that meet project quality objectives will be submitted to MassDEP and entered in the
VTDECrsquos Water Quality data management system as well as the EPArsquos national water quality data storage system known as STORET
- Information will be presented to the local community in a suitable format be it a press release public meeting or another event
- A report will be prepared and shared with the distribution list in this QAPP and published on the DRWA website (deerfieldriverorg)
Site ID Site Name Town Rationale Lat Lon Deerfield River Mainstem and Branches
VT-NBD_064
East Dover Rd Wilmington Monitor above most ag and below golf course
4291431 -728376
VT-NBD_027
Above Wilmington Center
Wilmington Monitor within ag and above village center
4287452 -72864
VT-NBD_020
Wilmington Center above confl w
Beaver Brk
Wilmington Monitor for high bacterianutrients and
Beaver Brk contribution
4286816 -728721
VT-NBD_018
Wilmington Center below confl w
Beaver Brk
Wilmington Swim holehigh bacterianutrients
4286875 -728738
MA-DFR_289
Shunpike Rest Area Charlemont Monitor Deerfield River coming from VT
426363 -729071
MA-DFR_276
Above Charlemont Center
Charlemont Bracket WWTF Mill Brk 426271 -728853
MA-DFR_267
Charlemont Center Charlemont Bracket WWTF Mill Brk 426262 -728685
MA-DFR_011
5 amp 10 Bridge Greenfield Monitor Deerfield contributions to CT River
PrecisionThe degree of agreement among repeated measurements of an indicator on separate samples collected as close as possible in time and place
It does not mean that the sample actually reflects the ldquotruerdquo value but rather that your sampling and analysis are giving consistent results under similar conditions
AccuracyAccuracy or Bias is a measure of confidence that describes
how close a measurement is to its ldquotruerdquo value
Parameter Reporting Limit
Accuracy ( Recovery)
Field Precision (RPD)
Expected Range
E coli 1 MPN 100ml
Blanks and negatives show no colonies positives show colonies
30 of log10 transformed MPN
0-2420 MPN
These objectives will be measured as follows
Field Specific Quality Controls
10 of samples collected (3 per event in 2019) will be field blanks Sterile water poured into sterile sample bottle in the field These must register lt1 for total coliform and E coli
10 of samples collected (3 per event in 2019) will be field duplicates A second sample will be collected at the same location by the volunteer These will have a Relative Percent Difference of le 30 for log transformed e values
Laboratory Sample Batch-Specific Quality Control Samples With each new batch of samples run CRC will perform the following QC sample analysis
1 Lab Blank - Sterile water1 Positive Culture Control -sterile buffer dilution water inoculated with E coli (ie total coliform amp E coli positive)1 Negative culture Control -sterile buffer dilution water inoculated with non-fluorescent Pseudomonas sp (ie
total coliform amp E coli negative) 1 Lab Duplicate ndash 250 mL sample split into 2 100 mL samples in the lab
DRWA Data Precision and Accuracy
REPRESENTATIVENESS
Representativeness is the extent to which measurements actually represent the true environmental condition
You will state that- Sampling sites were selected to appropriately capture
- the general characteristics of the water body- or specific impacts if you are conducting an impact assessment (eg above amp
below suspected pollution sourceshellip)- The sample collection point is appropriate eg mid-stream mid-lake etc what
sampling depth - Number of sites is adequate to answer study question- The parameters monitored are relevant to the type of impact or to a general
WQ assessment- Sample collection timing and frequency are selected to capture data that are
representative of target conditions (eg various water levels weather seasons)
MassDEP - RECOMMENDED MINIMUM SAMPLE NUMBER FREQUENCY AND TIMING FOR EXAMPLE PARAMETERS
Parameter
Streams Lakes
Min Sample Number and Frequency
Sampling Period Min Sample Number and Frequency
Sampling Period
DO (discrete) 5 results pre-dawn June - September 3 results (epilimnetic) June - September
DO (continuous) 3o days June - September 3o days June - September
pH 5 results June - September 3 results (epilimnetic) June - September
Temperature (discrete) 5 results afternoon June - September 3 results (epilimnetic) June - September
Temperature (continuous) 3o days June - September 3o days June - September
Bacteria (eg E coli) 3-5 results (in 30-90 days) April 1-October 15 3-5 results (in 30-90 days) April 1-October 15
Nutrients (inc chl a for lakes) 5 results June- September 3 results June - September
Secchi depth --- --- 3 results June - September
Chloride 3 results 4 day period (yr-round) --- ---
ldquoCleanrdquo metals 3 results 4 day period (summer) --- ---
Misc toxics emerging contam 3 results 30 day period (summer) 3 results (epilimnetic) 30 day period (summer)
Fish community 1 survey April 1-October 15 1 survey April 1-October 15
Fish tissue contaminants (eg Hg PCBs pesticides)
1 survey Any 1 survey Any
Benthic invertebrates (RBP3) 1 survey July ndash October --- ---
Weed surveys 1 survey June- September 1 survey June- September
Aesthetics 1 survey April 1-October 15 1 survey April 1-October 15
30 days (bathing) 90 days (non-bathing) ldquoworst-caserdquo typ July-Aug
REPRESENTATIVENESS
DRWAB Data RepresentativenessSamples collected at locations and depths described in this QAPP will reflect conditions of individual water bodies and tributaries in Vermont and Massachusetts To ensure representativeness all samples will be collected preserved and analyzed according to the procedures in this QAPP and within the specified holding times
NepRWAA7-5 Data RepresentativenessSampling points will be chosen to represent the water quality within the applicable geographic area of interest Staff experienced and knowledgeable in the factors affecting water quality will choose sample points that will be representative of conditions within the area of concern
COMPARABILITY
Comparability is the degree to which data can be compared directly to similar studies There are two things to consider future studies someone might undertake and past studies you (or others) will want to compare your data with
State that you will use and document standardized - sampling amp analytical methods and units of reporting- sampling sites times and dates - sample storage and transfer
Comparability
Deerfield River Watershed Association
C Data ComparabilityAll samples for each specific parameter will be collected and analyzed using the respective procedures described in this QAPP to ensure that comparisons between different sample sites sample dates depths and projects can be appropriately made Procedures are unchanged from previous years
Neponset River Watershed Association
A7-6 ComparabilityComparability is ensured by the utilization of established sampling and monitoring protocols from Massachusetts DEP MWRA Massachusetts Water Watch Partnership the Boston Water and Sewer Commission and NepRWA and by the use of standard test methods and procedures as outlined in Appendices 6 7 and 8
Completeness
Completeness is an estimate of the amount of data you will need to answer your study question Usually expressed as a of originally planned sample events after missing sample events and data no meeting DQOs are subtracted from the planned number
DRWA
D Data CompletenessAt least 80 of the anticipated number of samples will be collected at each site analyzed and determined to meet data quality objectives for the project to be considered successful A report detailing the number of anticipated samples number of valid results and percent completion (number of valid samplesnumber of anticipated samples) will be produced
NepRWAA7-8 CompletenessIn order to obtain the best picture of the watershed NepRWA expects 90 of the routine sampling and follow up sampling samples to be collected and analyzed during each scheduled sampling event In the routine sampling program uncertainties such as weather volunteer scheduling and illness sometimes result in unavoidable omissions but every effort is made to assign backup samplers when possible
Sampling Process Design - EPA Element 10From MassWWP QAPP Guide
Purpose To describe in greater detail the design of the sampling part of your monitoring program
In Section 6 you briefly outlined the sample process design In this section you should elaborate on the rationales for those choices When you complete this section you should revisit Section 6 and revise as necessary The two sections should be in agreement
What To Include bull Indicators or measures bull Types of samplesbull Sampling frequency bull Sampling period bull How you will select sample sites and identify them over timebull Site safety plans
MADEP - RECOMMENDED MINIMUM SAMPLE NUMBER FREQUENCY AND TIMING FOR EXAMPLE PARAMETERS
Parameter
Streams Lakes
Min Sample Number and Frequency
Sampling Period Min Sample Number and Frequency
Sampling Period
DO (discrete) 5 results pre-dawn June - September 3 results (epilimnetic) June - September
DO (continuous) 3o days June - September 3o days June - September
pH 5 results June - September 3 results (epilimnetic) June - September
Temperature (discrete) 5 results afternoon June - September 3 results (epilimnetic) June - September
Temperature (continuous) 3o days June - September 3o days June - September
Bacteria (eg E coli) 3-5 results (in 30-90 days) April 1-October 15 3-5 results (in 30-90 days) April 1-October 15
Nutrients (inc chl a for lakes) 5 results June- September 3 results June - September
Secchi depth --- --- 3 results June - September
Chloride 3 results 4 day period (yr-round) --- ---
ldquoCleanrdquo metals 3 results 4 day period (summer) --- ---
Misc toxics emerging contam 3 results 30 day period (summer) 3 results (epilimnetic) 30 day period (summer)
Fish community 1 survey April 1-October 15 1 survey April 1-October 15
Fish tissue contaminants (eg Hg PCBs pesticides)
1 survey Any 1 survey Any
Benthic invertebrates (RBP3) 1 survey July ndash October --- ---
Weed surveys 1 survey June- September 1 survey June- September
Aesthetics 1 survey April 1-October 15 1 survey April 1-October 15
30 days (bathing) 90 days (non-bathing) ldquoworst-caserdquo typ July-Aug
Deerfield River Watershed Association
10 Sampling Process Design
Sampling sites were selected to represent locations that receive heavy human use from swimmers boaters anglers and other contact recreational users
Samples will be collected bi-weekly from late June through early September (prime recreation period) between 10 AM and 1 PM Samplers will first fill out their field data sheet They will then collect a water sample away from the edge of the stream near the center of the stream (centroid of flow) and just below the surface following the MWWP protocol (available in the Appendix)
Samplers will place their samples immediately in a cooler with ice or frozen ice packs making sure the temperature in the cooler is at 4degC or lower Each sample bottle will be placed in an individual clean Ziploc bag to avoid cross contamination
Neponset River Watershed Association
B1 Sampling Process Design
The CWMN program is designed to develop and maintain a record of general water qualitythroughout the watershed Project goals include both evaluation of long-term changes over time across the watershed as a whole and the identification of pollution hotspots at a low order subwatershed scale
Routine sampling activities consist of collecting in-stream samples As discussed above routine sampling sites are divided among ldquoindicatorrdquo sites and ldquosubwatershed sitesrdquo in order to meet the dual objectives of the program Indicator sites are selected to be representative of overall water quality and are relatively unchanging over time to allow comparison to past and future investigations Sites have generally been selected at the downstream ends or key segmentation points of major subwatersheds and at or near locations where there is a longstanding data record
Neponset River Watershed Association
B1 Sampling Process Design ndash continued
Subwatershed sites are selected to provide higher spatial resolution along individual streams in an effort to bracket pollution sources and facilitate their identification and remediation Subwatershed sites make up roughly 60 of the overall number of sites and are more likely to change from year to year Subwatershed sites may be rotated through different watersheds over the course of several sampling seasons to provide detailed data on different subwatersheds over a period of years Specific sites are selected by the project manager on the basis of known or suspected problems or opportunities or to fill in a lack of detailed data in a specific area
Neponset River Watershed Association
B1 Sampling Process Design ndash continued
In addition to the routine sampling activities CWMN also encompasses follow up and special study sampling activities These are generally ldquoone-timerdquo investigations intended to zero in on pollution sources in a known or suspected problem areahellipSpecific sampling stations may be planned in advance or may be chosen opportunistically by samplers while in the field
The mix of parameters sampled at each site depends on its status as an indicator subwatershed or follow up station the relative location of the station in the watershed and the specific pollutant(s) of concern at that specific location Indicator sites are tested for bacteria nutrients ammonia and field measured parametershellip Subwatershed sites are generally tested for bacteria total phosphorus and field measured parameters At some subwatershed sites hellip Follow up sampling stations will generally be tested for a very narrow set of parameters based on the specific pollutant of concern A listing of current routine sampling stations and the parameters sampled is provided in the Appendix 1e
Sampling Methods Requirements - EPA Element 11
This section describes your field measurementsample collection methods It can be stated in table form with narrative descriptions if you choose
Includebull What parameters are being sampledbull Sampling containersdevices sample preservation steps Maximum holding timebull Amount of sample to be collectedbull Summarize steps taken by field samplersbull Reference to the method followed (cite specific SOPS include in appendices)bull Can also include sampling considerations (eg time of day steps taken to avoid stirring up
sediments sample collection depth etc) These will be detailed in SOPs
Deerfield River Watershed Association
ParameterMeasure Container Field Rinse Preservation Hold Time E coli 120 mL IDEXX
Cool to lt4degC 6 hours to lab 8 hours to processing
B2 Sampling Methods
B2-2 Visual ObservationsB2-3 Fecal Coliform E coli and EnterococcusB2-5 NutrientsB2-6 Specific Conductance and SalinityB2-7 TemperatureB2-8 pH B2-9 Dissolved OxygenB2-10 SurfactantsB2-11 Depth and FlowB2-12 Optical BrightenersB2-13 Qualitative Ammonia Nitrogen
Neponset River Watershed Association
Sample Handling and Custody Requirements - EPA Element 12
Demonstrate that your sampling handling and storage techniques will retainsafeguard the integrity of your samples and data records
12 Sample Handling and Custody Procedures
Samples will be collected between 7 AM and 10 AM on sampling days The samples will be kept on ice inside a cooler during transport Wilmington VT area samples will be picked up by the monitoring assistant in the Main Street parking lots or other agreed upon meeting location by 9 AM Green River VT samples will be picked up by the transporting volunteer at the Green River covered bridge or other agreed upon meeting location by 930 AM The remaining samples will be delivered directly to the CRC water quality lab by 10 AM Any exchange of possession in the samples will be documented on the Chain of Custody (CoC) form which will be completed and signed by the Lab Analyst upon receipt at the lab The CoC form will be checked by the program coordinator See Appendix for the CoC
Deerfield River Watershed Association
Analytical Methods Requirements - EPA Element 13
Deerfield River Watershed Association
13 Analytical Methods Requirements
All analytical determinations will be performed at the CRC lab in Greenfield by the Lab Director Gabriel Chevalier
Indicator
Method Number
Source
Reporting Units
Modifications or Options
E coli
United water laboratory 1603 Bacteria Colilert SOP 604b CRWC 03-11-10
EPA 1603 (Modified m-TEC)
1 MPN
Sodium Thiosulfate used in all containers
Neponset River Watershed Association
Massachusetts Volunteer Monitorrsquos Guide to QAPP DevelopmentPAGE 61
Here are some things to consider in choosing a method Scientific Considerations Does it meet your data quality objectives
How accurate is it How precise (reproducible) is it What is its detection limit
Will it measure the indicator in the range that you need What lab facilities are required What equipment is required Does it yield samples that are representative Is it comparable to methods used by agencies collecting similar information
Practical and Program Considerations bull Do you have the human and financial resources to do it bull How difficult is it bull How time-consuming is it bull Will it produce data useful to the target audience
Quality Control ndash EPA Element 14
This section documents that the specific quality control measures you will take will allow you to determine whether you meet your data quality objectives
What To Include Section 7 stated your DQOs Here you describe how you are going to meet them
For each indicator include the following information
bull Accuracy Precision checks list what checks you will perform
bull List the of your samples upon which you will perform quality checks that will represent the quality of all your samples
Quality Control
Accuracy checks
There are a variety of ways to check the accuracy of your sampling and analysis
Checks can be done internally (done totally within your project lab) or externally (done with the assistance of an independent lab)
Known Samples This is an internal check that compares your results against another analyst or a ldquoknownrdquo An example of a known is a quality assurance sample that UMass WRRC sends to VM groups for pH DO or alkalinity ndash with the expected value communicated when sample is sent
Proficiency Testing (Unknown) Samples In some cases there are programs that provide proficiency testing samples for laboratory performance evaluation the concentrations of which are known to the auditor but not to the lab being tested This is relatively common for most water chemistry indicators An example of an unknown would when WRRC sends a quality assurance sample without communicating the expected value in advance
Quality Control
Accuracy checks - continued
Blank and Positive Plates Bacteriological samples should be checked using the blank and positive plate procedure The blank plate uses the rinse water media and equipment in the analysis to determine if there is contamination in the laboratory materials The result should be 0 The positive plate procedure uses a sample known to contain bacteria (eg waste- water treatment plant influent) to determine if a procedural error in the lab causes inhibition of bacterial growth Results should be rdquoToo Numerous To Countrdquo Each batch of samples should include at least one blank and one positive check sample This is an internal check
Spiked Samples Spikes are additions of a known amount of the indicator with the expectation that subsequent analysis will measure exactly that much increase over the un- spiked sample This procedure is described in Section 1020 B of Standard Methods This is an internal check
Voucher and Reference Collections For macroinvertebrates and aquatic plants maintenance of a voucher andor a working reference collection is recommended A voucher collection is a preserved collection of the type specimens ie an example of each of the individual taxa that you have given a name It should be maintained in archival condition by a trained curator typically found at a university A reference collection is an exact duplicate of the voucher collection but is the one that you will regularly use as a reference when identifying new specimens Both voucher and reference collections should be verified by an expert This is an external check Alternatively have an expert review IDs made by volunteers of at least 10 of specimens collected 90 accuracy is recommended
Quality Control
Precision Checks
Precision checks are primarily accomplished through replicate sampling amp analysis in the field and lab
Field Replication Replication can be done by the same field collectors but some replication by other collectors is good eg a pair of field collectors swapping roles or have different team collect the replicate This is an internal check
Lab Replication Additional replication should occur in the lab Lab replication is done by dividing a well-mixed sample into two or more aliquots and conducting analysis on each aliquot This is an internal check
Split Samples Split samples (a sample that is split into two sub-samples) can be done in the field or the lab
Relative Percent Difference
A measure of precision used for duplicate sample results It is calculated by dividing the difference between the two results by the mean of the two results expressed as a percentage Used when sample number equals two
eg ((98-92) 100) ((98+92))2 = 63
Deerfield River Watershed Association
14 Quality Control RequirementsA Volunteers Check - Field AuditEither the QC Officer the Project Coordinator or both will accompany a crew of volunteers (each) to their site each collection The trainers will observe the volunteersrsquo performance and check their sampling technique and field data sheets for accuracy
B Field QC ChecksAt least one Field Duplicate and one Field Blank will be submitted for every ten samples collected
Field Duplicate ndash a check on water quality sampling amp analysis consistency This is a replicated sample collected at the same point in time and space side by side with the first sampling and given a separate Sample ID number
Field Blanks ndash a check for contamination (AccuracyBias) in the field by processing laboratory-supplied deionized water through the sampling train This checks for contamination introduced from the sample container(s) or from field contamination A Field Blank will be taken by one volunteer at one site per sampling day for bacteria A container of DI water will be given to the volunteer who will pour this DI water into the sample bottle at the site
We will rotate the field duplicate and field blank samples among the volunteers throughout the sampling season so a maximum of collectors can be checked
Deerfield River Watershed Association
14 Quality Control Requirements ndash continued
C Laboratory QC ChecksA Lab Duplicate will be analyzed each sampling day The lab will split a randomly chosen sample and analyze both subsamples
The lab will run a Lab Blank and a Positive Sample for bacteria each collection (see section 7)
D Data Analysis QC ChecksRiver data and QC data will be reviewed by the QC Officer as soon as they come in from the lab after each collection QC data will be compared to the quality objectives (eg blanks should have zero colonies sample duplicates should be within 3 standard deviations of the mean positives should show bacterial growth etc) River data will be reviewed as well to ensurethat no field or lab contamination has occurred (data will be compared to those of other sites and of previous collections)
Bacteria computations will be checked and validated If discrepancies are found the Lab Director will be called to resolve the discrepancy and corrections will be made by the QC Officer
Field data sheets will be also reviewed the day of collection by the Project Coordinator and later by the QC Officer to ensure that samples were taken at the right times and that all the required information has been filled out The Project Coordinator or collectors will be called if omissions or errors are detected If needed corrections will be made (signed anddated) on the field sheet by the QC Officer
Neponset River Watershed Association
PRECISION DQOS DEALING WITH LOW-LEVEL CONCENTRATIONS
Source Analyte Units PrecisionMassDEP WPP Monitoring QAPP
Training Requirements Certification ndash EPA Element 8
In Narrative or Table Format
bull List type of training (eg Field WQ lab analysis visual observation data mgt data entry etc)
bull Who is training who receives training
bull How often training done
If training records are kept (they should be) include that in section 9 on documentation and records
Neponset River Watershed Association
A8 Training - ExcerptTo ensure the high quality and usability of the data that is generated by the CWMN program all participants receive training appropriate to the tasks for which they will be responsible NepRWA staff that are involved in the program are professionals with extensive training in water quality chemistry biology and field sampling NepRWA has established a program of training for volunteers that includes initial training follow-up and refresher classes These classes are given by NepRWA staff that are qualified not only in the technical matter covered but in training and education
The initial training for volunteer monitors is primarily instruction and demonstration by the trainer with repetition by the volunteer This training includes an overview of the entire project and detailed instruction in sampling procedures All monitors receive and review a copy of NepRWArsquos Water Monitoring and Sampling Manual (see Appendix 3a)
After their initial training all volunteers participate in a mandatory annual group andor individual training session These sessions are designed to update the volunteers on changes in the program further train them in equipment calibration and field-testing procedures and evaluate each volunteerrsquos performancehellip
InstrumentEquipment Testing Inspection and Maintenance Requirements ndash EPA Element 15
Instrument Calibration and Frequency ndash EPA Element 16
InspectionAcceptance Requirements for Supplies ndash EPA Element 17
DOCUMENTATION AND RECORDS ndash EPA ELEMENT 9
Neponset River Watershed AssociationA9 Documents and RecordsA9-1 Data SheetsField data sheets include information about the site location (NepRWA ID number) which specific equipment was used to make measurements (thermometer number) the sampling method used (direct fill pole or Bridge Buddy) and equipment calibration results The field data sheets are also used to record temperature velocity depth color odor and turbidity information (Appendix 4e)helliphellip See Appendix 4 for copies of the various data sheets used in the CWMN program
A9-2 Chain of Custody FormsA9-3 Sample LabelingA9-4 Equipment Custody FormA9-5 Training and Evaluation Form
Data Acquisition Requirements - EPA Element 18
Purpose To ensure that any data you use but donrsquot collect yourself has a known data quality and is consistent with your data quality objectives that others can access these data and that your use of the data is appropriate
Describe any external data you use such as GPS coordinates for site locations weather station rainfall amounts etc
Include bull The title of the document or name of the informationbull Where you obtained it and where others may find itbull Notes on the quality of the outside information such as uncertainties and caveats
Preamble to Elements 19 through 24
Consider the four separate objectives of these chapters1) Producing a good data set - 19 covers the normal data mgt routines you do to prevent data mistakes in the first place- 22 amp23 describe how you review the resulting data sets - how you find and correct
missing or erroneous data - 19 22 and 23 should produce as complete amp accurate a data set as possible 2) Ensuring that any use you make of your data is justified In 24 you decide how usable your data are Review the final data set that the above efforts have produced Compare it with your DQOs to determine whether you have to discard or qualify any data what conclusions you can draw from your data or what changes you might need to make in your DQOs3) Improve overall project performance 20 deals with how well volunteers laboratories and equipment are operating It looks at function not outcomes Who evaluates the various components of your program when problems are found what corrections are made to make your program run better4) Report your results After yoursquove run these various checks you are ready to release your data In Chapter 21 you describe the reports you will issue
Suggested order bull Data Management (19)bull Data Review Validation and Verification Requirements (22)bull (Data) Validation and Verification Methods (23)
bull Reconciliation with Data Quality Objectives (24)
bull Assessment and Response Actions (20)
bull Reports (21)
EPA Elements 19 ndash 24
bull Data Management (19)bull Assessment and Response Actions (20) bull Reports (21)bull Data Review Validation and Verification Requirements (22)bull (Data) Validation and Verification Methods (23)bull Reconciliation with Data Quality Objectives (24)
Data Management ndash EPA Element 19
Follow the data from the moment itrsquos recorded through every step to final report databaseIntent is to prevent errors or loss of data or be able to correct in timely manner
bull Before each activitystep is conducted well-designed field sheets checklists COC forms data entry software auto-QC calculations out-of-bounds highlights etc
bull During each step sheets filled completely checklist reviewed before leaving site etc
bull Immediately after Computer-entered data compared with field sheets etc
bull Long term preservation Data storage
Neponset River Watershed Association
B9 Data ManagementThe Project Manager is responsible for overseeing all data management activities Refer also to section D below for additional discussion of data review verification and validation practices
B9-1 Raw DataField data sheets are collected with the samples The sheets are turned into the NepRWA office by the site coordinators The forms are then reviewed for illegible answers errors or questionable values and checked for consistency with the COC and bottle labels as described in Appendix 3l Any questions are referred to the volunteer for clarification NepRWA staff makes corrections by crossing out the errors and writing in the correct answer All corrections must be initialed
B9-2 Data Entry and ValidationOnce the information has undergone a preliminary check it is entered into a Filemaker database The software has been customized to the data sheet Fields within the worksheet have been set-up with limits based on expected results This helps to minimize entry errors Entered data is then checked against the data sheets by another volunteer or staff person
B9-3 Data StorageThe original data sheets are filed into an event file and stored in NepRWArsquos permanent files Electronic copies of data are maintained on a secure Filemaker server Data files are kept in perpetuity along with hard copies of volunteer data sheets All electronic data is backed-up daily on to a password-protected hard drive
Data Review Validation and Verificationndash EPA Element 22
(Data) Validation and Verification Methods ndash EPA Element 23
Deerfield River Watershed Association
22 Data Review Validation and Verification ndash Summarized bullet list
All data reviewed by the Project Coordinator and QA Coordinator
Data Analysis QC Checks will includebull Data entry checks by a second personbull Computer entries compared with fieldlab sheetsbull Checks on graphs amp all other data representationsbull Calculation of measures of data quality including completeness
Corrective actionsbull Data entry errors corrected bull Data outside expected range flagged or rejected bull 2nd field sample andor laboratory aliquot taken when possiblebull Data quality problems discussed in draft and final reports
(Data) Validation and Verification Methods ndash EPA Element 23 From Inland QAPP
Validation and Verification Methods will include checks on bull Completion of all fields on data sheets missing data sheetsbull Completeness of sampling runs (eg number of sites visitedsamples taken vs number proposed were all parameters sampledanalyzed)bull Completeness of QC checks (eg number and type of QC checks performed vs numbertype proposed)bull Accuracy and precision compared to data quality objectivesbull Representativeness of samples and resulting data by examining survey metadata for unusual conditions and occurrences that may have impacted the validity of results
Deerfield River Watershed Association ndash Excerpt summarized
23 Validation and Verification Methods
The following simple measures of data quality will be calculated and included in the final report
1) To screen for contamination the average blank concentration hellip will be calculated This average value should be as close as practical to the Reporting Limit listed in Table 4
2) To assess the precision of results the ldquoMean Relative Percent Differencerdquo between field duplicate samples should be calculated The average RPD should be less than or equal to the Estimated Precision listed in Table 4 This simple measure is calculated as follows
RPD formula used hellip
Reconciliation With Data Quality Objectives ndash EPA Element 24MassWWP guide to QAPP development
What to Include bull List who will evaluate your actual data vs your data quality goals bull State how and when this will be done bull Describe the process for determining what to do if goals are not met
Neponset River Watershed Association
D2 Reconciliation with User Requirements - Summarized bulletedbull Following each sampling event and prior to the subsequent event calculations and
determinations for precision completeness and accuracy will be made bull Any corrective action will be implemented noted and initialized by the project manager bull If data quality indicators do not meet the projectrsquos specifications then data may be discarded
may be flagged or re-sampling may occur bull Investigation of problems will take place and corrections will be documented If equipment
failure is found to be the cause calibration and maintenance techniques will be reassessed Field duplicate testing may occur during the next sampling event to ensure confidence in the results
bull Any limitations on the data will be noted bull Any revisions to the project will be submitted to EPA and DEP quality assurance officers for
approval
Assessment and Response Actions - EPA Element 20 From Inland QAPP
Document that the progress and quality of the monitoring program will be continuously assessed to ensure that its objectives are being accomplished
The Monitoring Coordinator will periodically check to see the following bull Monitoring is occurring as planned bull Sufficient written commentary and supporting photographs exist bull Sufficient volunteers are available bull Volunteers have been observed as they sample their sites bull Samplers are collecting in accordance with project schedules bull Data sheets and custody control sheets are being properly completed and signed bull Data are properly interpreted bull Plans for dealing with adverse weather are in place
Assessment and Response Actions - EPA Element 20 From Inland QAPP ndash continued
The Monitoring Coordinator will periodically check to see the following bull Retraining or other corrective action is implemented at the first hint of non compliance with the
QAPP or SOPs bull Labs are adhering to the requirements of their QAPP in terms of work performed accuracy
acceptable holding times timely and understandable results and delivery process bull Data management is being handled properly ie data are entered on a timely basis is
properly backed up is easily accessed and raw data are properly stored in a safe placebull Procedure for developing and reporting the results exists
Assessment and Response Actions - EPA Element 20 From Inland QAPP ndash continued
The Monitoring Coordinator will confer with the QA Officer as necessary to discuss any problems that occur and what corrective actions are needed to maintain program integrity In addition the Monitoring Coordinator and QA Officer will meet at the end of the sampling season to review the draft report and discuss all aspects of the program and identify necessary program modifications for future sampling activities [If the program includes a technical advisory committee the TAC will be included in these discussions] Corrections may include retraining volunteers rewriting sampling instructions replacement of volunteers alteration of sampling schedules sites or methods or other actions deemed necessary All problems discovered and program modifications made will be documented in the final version of the project report If modifications require changes in the Quality Assurance Project Plan these changes will be submitted MassDEP for review
Deerfield River Watershed Association
20 Assessment and Response Actions ndash Summarized bullet list
bull There will be an on-site visit by the Quality Control Officer to observe field sampling and field analysis procedures Generally this will be done near the beginning of the project
bull A written checklist will be used for the assessments maintained by the Project Coordinator and copies will be provided with the data report
bull The Project Coordinator and QC Officer will determine if field work follows the written procedures or if there needs to be corrections by additional training or revising protocols
bull Please refer to Section 22 for additional evaluations and response actions regarding data evaluations
Reports ndash EPA Element 21
Project Task Organization ndash EPA Element 4 Reviewrevise early choices
Distribution List ndash EPA Element 3
Title and Approval Page - EPA Element 1
Table of Contents ndash EPA Element 2
Water quality monitoring quality assurance workshop
Terminology
Study design
QAPP
sampling and analysis plan
standard operating procedures
data quality objectives
Water Quality Monitoring Planning Process
Monitoring program activities
Why do you need (who Gives) a qapp
Slide Number 11
Slide Number 12
Steps to Developing a QAPP
Slide Number 14
Slide Number 15
Slide Number 16
Steps to Developing a QAPP
Slide Number 18
Slide Number 19
Slide Number 20
Slide Number 21
Slide Number 22
Slide Number 23
Slide Number 24
Sources of Information About Massachusetts Waters
Slide Number 26
Slide Number 27
Slide Number 28
Slide Number 29
Slide Number 30
Slide Number 31
Slide Number 32
Slide Number 33
Slide Number 34
Slide Number 35
Slide Number 36
Slide Number 37
Slide Number 38
Slide Number 39
Slide Number 40
Slide Number 41
Slide Number 42
Slide Number 43
Slide Number 44
Slide Number 45
Slide Number 46
MassDEP - Recommended Minimum Sample Number Frequency and Timing for Example Parameters
Slide Number 48
Slide Number 49
Slide Number 50
Slide Number 51
Slide Number 52
MaDep - Recommended Minimum Sample Number Frequency and Timing for Example Parameters
Slide Number 54
Slide Number 55
Slide Number 56
Slide Number 57
Slide Number 58
Slide Number 59
Slide Number 60
Slide Number 61
Slide Number 62
Slide Number 63
Slide Number 64
Slide Number 65
Slide Number 66
Slide Number 67
Slide Number 68
Slide Number 69
Slide Number 70
Slide Number 71
Slide Number 72
Slide Number 73
Slide Number 74
Slide Number 75
Slide Number 76
Precision DQOs Dealing with low-level concentrations
Slide Number 78
Slide Number 79
Slide Number 80
Slide Number 81
Slide Number 82
Documentation and Records ndash EPA Element 9
Slide Number 84
Slide Number 85
Slide Number 86
Slide Number 87
Slide Number 88
Slide Number 89
Slide Number 90
Slide Number 91
Slide Number 92
Slide Number 93
Slide Number 94
Slide Number 95
Slide Number 96
Slide Number 97
Slide Number 98
Slide Number 99
Slide Number 100
Site ID
Site Name
Town
Rationale
Lat
Lon
Deerfield River Mainstem and Branches
VT-NBD_064
East Dover Rd
Wilmington
Monitor above most ag and below golf course
4291431
-728376
VT-NBD_027
Above Wilmington Center
Wilmington
Monitor within ag and above village center
4287452
-72864
VT-NBD_020
Wilmington Center above confl w Beaver Brk
Wilmington
Monitor for high bacterianutrients and Beaver Brk contribution
4286816
-728721
VT-NBD_018
Wilmington Center below confl w Beaver Brk
Wilmington
Swim holehigh bacterianutrients
4286875
-728738
MA-DFR_289
Shunpike Rest Area
Charlemont
Monitor Deerfield River coming from VT
426363
-729071
MA-DFR_276
Above Charlemont Center
Charlemont
Bracket WWTF Mill Brk
426271
-728853
MA-DFR_267
Charlemont Center
Charlemont
Bracket WWTF Mill Brk
426262
-728685
MA-DFR_011
5 amp 10 Bridge
Greenfield
Monitor Deerfield contributions to CT River
4256975
-725922
North River
VT-EBN_150
Above Jacksonville WWTF
Whitingham
Bracket WWTF
42787
-728163
VT-EBN_147
Below Jacksonville WWTF
Whitingham
Bracket WWTF
4278456
-728128
MA-EBN_024
Foundry Village Rd Ballfields
Colrain
Swim hole
4267478
-726966
MA-NOR_001
Formerly Sunburn Beach
Colrain
Mouth of North River
4265286
-727141
Green River Watershed
VT-PND_001
Mouth of Pond Brook
Halifax
Green River reclassification in support of Green River Watershed Alliance grant
428135
-727243
VT-GRN_234
Hinesburg Rd
Guilford
Green River reclassification in support of Green River Watershed Alliance grant
4279717
-726804
VT-HBG_001
Mouth of Hinesburg Brook
Guilford
Green River reclassification in support of Green River Watershed Alliance grant
4279582
-726605
VT-GRN_202
Green River Timber Crib Dam swim hole
Guilford
Swim HoleGreen River reclassification in support of Green River Watershed Alliance grant
4277555
-726673
VT-GRN_168
MAVT State Line
Guilford
Green River reclassification in support of Green River Watershed Alliance grant
4273299
-726761
MA-GRN_098
Bare Ass Beach
Greenfield
Swim Hole
4265102
-726235
MA-MPL_001
Mouth of Maple Brook
Greenfield
ID source of bacterianutrients
4258667
-726124
MA-GRN_020
Mohawk Trail Bridge
Greenfield
ID source of bacterianutrients
4258554
-726117
MA-GRN_008
Pretty Plain Rd
Greenfield
Monitor Green River contributions to Deerfield River high bacterianutrients
4257636
-725984
Other Tributaries
VT-
ELS_002
Ellis Brook TBD
Wilmington
Monitor below WWTF
429202
-728381
VT-COB_003
Cold Brook Above confl with N Br Deerfield
Wilmington
General water quality monitoring effect of Mt Snow pond
4289928
-728595
VT-BVR_029
Near Shearer Hill Rd
Wilmington
Monitor for runoff
42855
-728385
VT-BVR_011
Off Rte 9 near Wahoorsquos
Wilmington
Monitor for high bacteriarunoff
4286523
-728588
MA-CHI_001
Chickley River Tower Rd
Charlemont
Monitor contributions to Deerfield River
4263005
-729016
MA-MBK_001
Mill Brook TBD
Charlemont
Monitor mouth for contribution
426271
-728728
MA-CLS_003
Clesson Brook Buckland Rec Area
Buckland
Swim hole monitor contributions to Deerfield River
4261553
-72767
MA-SOU_024
South River Reeds Bridge Rd
Conway
Swim hole
4254131
-726901
Deerfield River Watershed Association Project Task Description
PrecisionThe degree of agreement among repeated measurements of an indicator on separate samples collected as close as possible in time and place
It does not mean that the sample actually reflects the ldquotruerdquo value but rather that your sampling and analysis are giving consistent results under similar conditions
AccuracyAccuracy or Bias is a measure of confidence that describes
how close a measurement is to its ldquotruerdquo value
Parameter Reporting Limit
Accuracy ( Recovery)
Field Precision (RPD)
Expected Range
E coli 1 MPN 100ml
Blanks and negatives show no colonies positives show colonies
30 of log10 transformed MPN
0-2420 MPN
These objectives will be measured as follows
Field Specific Quality Controls
10 of samples collected (3 per event in 2019) will be field blanks Sterile water poured into sterile sample bottle in the field These must register lt1 for total coliform and E coli
10 of samples collected (3 per event in 2019) will be field duplicates A second sample will be collected at the same location by the volunteer These will have a Relative Percent Difference of le 30 for log transformed e values
Laboratory Sample Batch-Specific Quality Control Samples With each new batch of samples run CRC will perform the following QC sample analysis
1 Lab Blank - Sterile water1 Positive Culture Control -sterile buffer dilution water inoculated with E coli (ie total coliform amp E coli positive)1 Negative culture Control -sterile buffer dilution water inoculated with non-fluorescent Pseudomonas sp (ie
total coliform amp E coli negative) 1 Lab Duplicate ndash 250 mL sample split into 2 100 mL samples in the lab
DRWA Data Precision and Accuracy
REPRESENTATIVENESS
Representativeness is the extent to which measurements actually represent the true environmental condition
You will state that- Sampling sites were selected to appropriately capture
- the general characteristics of the water body- or specific impacts if you are conducting an impact assessment (eg above amp
below suspected pollution sourceshellip)- The sample collection point is appropriate eg mid-stream mid-lake etc what
sampling depth - Number of sites is adequate to answer study question- The parameters monitored are relevant to the type of impact or to a general
WQ assessment- Sample collection timing and frequency are selected to capture data that are
representative of target conditions (eg various water levels weather seasons)
MassDEP - RECOMMENDED MINIMUM SAMPLE NUMBER FREQUENCY AND TIMING FOR EXAMPLE PARAMETERS
Parameter
Streams Lakes
Min Sample Number and Frequency
Sampling Period Min Sample Number and Frequency
Sampling Period
DO (discrete) 5 results pre-dawn June - September 3 results (epilimnetic) June - September
DO (continuous) 3o days June - September 3o days June - September
pH 5 results June - September 3 results (epilimnetic) June - September
Temperature (discrete) 5 results afternoon June - September 3 results (epilimnetic) June - September
Temperature (continuous) 3o days June - September 3o days June - September
Bacteria (eg E coli) 3-5 results (in 30-90 days) April 1-October 15 3-5 results (in 30-90 days) April 1-October 15
Nutrients (inc chl a for lakes) 5 results June- September 3 results June - September
Secchi depth --- --- 3 results June - September
Chloride 3 results 4 day period (yr-round) --- ---
ldquoCleanrdquo metals 3 results 4 day period (summer) --- ---
Misc toxics emerging contam 3 results 30 day period (summer) 3 results (epilimnetic) 30 day period (summer)
Fish community 1 survey April 1-October 15 1 survey April 1-October 15
Fish tissue contaminants (eg Hg PCBs pesticides)
1 survey Any 1 survey Any
Benthic invertebrates (RBP3) 1 survey July ndash October --- ---
Weed surveys 1 survey June- September 1 survey June- September
Aesthetics 1 survey April 1-October 15 1 survey April 1-October 15
30 days (bathing) 90 days (non-bathing) ldquoworst-caserdquo typ July-Aug
REPRESENTATIVENESS
DRWAB Data RepresentativenessSamples collected at locations and depths described in this QAPP will reflect conditions of individual water bodies and tributaries in Vermont and Massachusetts To ensure representativeness all samples will be collected preserved and analyzed according to the procedures in this QAPP and within the specified holding times
NepRWAA7-5 Data RepresentativenessSampling points will be chosen to represent the water quality within the applicable geographic area of interest Staff experienced and knowledgeable in the factors affecting water quality will choose sample points that will be representative of conditions within the area of concern
COMPARABILITY
Comparability is the degree to which data can be compared directly to similar studies There are two things to consider future studies someone might undertake and past studies you (or others) will want to compare your data with
State that you will use and document standardized - sampling amp analytical methods and units of reporting- sampling sites times and dates - sample storage and transfer
Comparability
Deerfield River Watershed Association
C Data ComparabilityAll samples for each specific parameter will be collected and analyzed using the respective procedures described in this QAPP to ensure that comparisons between different sample sites sample dates depths and projects can be appropriately made Procedures are unchanged from previous years
Neponset River Watershed Association
A7-6 ComparabilityComparability is ensured by the utilization of established sampling and monitoring protocols from Massachusetts DEP MWRA Massachusetts Water Watch Partnership the Boston Water and Sewer Commission and NepRWA and by the use of standard test methods and procedures as outlined in Appendices 6 7 and 8
Completeness
Completeness is an estimate of the amount of data you will need to answer your study question Usually expressed as a of originally planned sample events after missing sample events and data no meeting DQOs are subtracted from the planned number
DRWA
D Data CompletenessAt least 80 of the anticipated number of samples will be collected at each site analyzed and determined to meet data quality objectives for the project to be considered successful A report detailing the number of anticipated samples number of valid results and percent completion (number of valid samplesnumber of anticipated samples) will be produced
NepRWAA7-8 CompletenessIn order to obtain the best picture of the watershed NepRWA expects 90 of the routine sampling and follow up sampling samples to be collected and analyzed during each scheduled sampling event In the routine sampling program uncertainties such as weather volunteer scheduling and illness sometimes result in unavoidable omissions but every effort is made to assign backup samplers when possible
Sampling Process Design - EPA Element 10From MassWWP QAPP Guide
Purpose To describe in greater detail the design of the sampling part of your monitoring program
In Section 6 you briefly outlined the sample process design In this section you should elaborate on the rationales for those choices When you complete this section you should revisit Section 6 and revise as necessary The two sections should be in agreement
What To Include bull Indicators or measures bull Types of samplesbull Sampling frequency bull Sampling period bull How you will select sample sites and identify them over timebull Site safety plans
MADEP - RECOMMENDED MINIMUM SAMPLE NUMBER FREQUENCY AND TIMING FOR EXAMPLE PARAMETERS
Parameter
Streams Lakes
Min Sample Number and Frequency
Sampling Period Min Sample Number and Frequency
Sampling Period
DO (discrete) 5 results pre-dawn June - September 3 results (epilimnetic) June - September
DO (continuous) 3o days June - September 3o days June - September
pH 5 results June - September 3 results (epilimnetic) June - September
Temperature (discrete) 5 results afternoon June - September 3 results (epilimnetic) June - September
Temperature (continuous) 3o days June - September 3o days June - September
Bacteria (eg E coli) 3-5 results (in 30-90 days) April 1-October 15 3-5 results (in 30-90 days) April 1-October 15
Nutrients (inc chl a for lakes) 5 results June- September 3 results June - September
Secchi depth --- --- 3 results June - September
Chloride 3 results 4 day period (yr-round) --- ---
ldquoCleanrdquo metals 3 results 4 day period (summer) --- ---
Misc toxics emerging contam 3 results 30 day period (summer) 3 results (epilimnetic) 30 day period (summer)
Fish community 1 survey April 1-October 15 1 survey April 1-October 15
Fish tissue contaminants (eg Hg PCBs pesticides)
1 survey Any 1 survey Any
Benthic invertebrates (RBP3) 1 survey July ndash October --- ---
Weed surveys 1 survey June- September 1 survey June- September
Aesthetics 1 survey April 1-October 15 1 survey April 1-October 15
30 days (bathing) 90 days (non-bathing) ldquoworst-caserdquo typ July-Aug
Deerfield River Watershed Association
10 Sampling Process Design
Sampling sites were selected to represent locations that receive heavy human use from swimmers boaters anglers and other contact recreational users
Samples will be collected bi-weekly from late June through early September (prime recreation period) between 10 AM and 1 PM Samplers will first fill out their field data sheet They will then collect a water sample away from the edge of the stream near the center of the stream (centroid of flow) and just below the surface following the MWWP protocol (available in the Appendix)
Samplers will place their samples immediately in a cooler with ice or frozen ice packs making sure the temperature in the cooler is at 4degC or lower Each sample bottle will be placed in an individual clean Ziploc bag to avoid cross contamination
Neponset River Watershed Association
B1 Sampling Process Design
The CWMN program is designed to develop and maintain a record of general water qualitythroughout the watershed Project goals include both evaluation of long-term changes over time across the watershed as a whole and the identification of pollution hotspots at a low order subwatershed scale
Routine sampling activities consist of collecting in-stream samples As discussed above routine sampling sites are divided among ldquoindicatorrdquo sites and ldquosubwatershed sitesrdquo in order to meet the dual objectives of the program Indicator sites are selected to be representative of overall water quality and are relatively unchanging over time to allow comparison to past and future investigations Sites have generally been selected at the downstream ends or key segmentation points of major subwatersheds and at or near locations where there is a longstanding data record
Neponset River Watershed Association
B1 Sampling Process Design ndash continued
Subwatershed sites are selected to provide higher spatial resolution along individual streams in an effort to bracket pollution sources and facilitate their identification and remediation Subwatershed sites make up roughly 60 of the overall number of sites and are more likely to change from year to year Subwatershed sites may be rotated through different watersheds over the course of several sampling seasons to provide detailed data on different subwatersheds over a period of years Specific sites are selected by the project manager on the basis of known or suspected problems or opportunities or to fill in a lack of detailed data in a specific area
Neponset River Watershed Association
B1 Sampling Process Design ndash continued
In addition to the routine sampling activities CWMN also encompasses follow up and special study sampling activities These are generally ldquoone-timerdquo investigations intended to zero in on pollution sources in a known or suspected problem areahellipSpecific sampling stations may be planned in advance or may be chosen opportunistically by samplers while in the field
The mix of parameters sampled at each site depends on its status as an indicator subwatershed or follow up station the relative location of the station in the watershed and the specific pollutant(s) of concern at that specific location Indicator sites are tested for bacteria nutrients ammonia and field measured parametershellip Subwatershed sites are generally tested for bacteria total phosphorus and field measured parameters At some subwatershed sites hellip Follow up sampling stations will generally be tested for a very narrow set of parameters based on the specific pollutant of concern A listing of current routine sampling stations and the parameters sampled is provided in the Appendix 1e
Sampling Methods Requirements - EPA Element 11
This section describes your field measurementsample collection methods It can be stated in table form with narrative descriptions if you choose
Includebull What parameters are being sampledbull Sampling containersdevices sample preservation steps Maximum holding timebull Amount of sample to be collectedbull Summarize steps taken by field samplersbull Reference to the method followed (cite specific SOPS include in appendices)bull Can also include sampling considerations (eg time of day steps taken to avoid stirring up
sediments sample collection depth etc) These will be detailed in SOPs
Deerfield River Watershed Association
ParameterMeasure Container Field Rinse Preservation Hold Time E coli 120 mL IDEXX
Cool to lt4degC 6 hours to lab 8 hours to processing
B2 Sampling Methods
B2-2 Visual ObservationsB2-3 Fecal Coliform E coli and EnterococcusB2-5 NutrientsB2-6 Specific Conductance and SalinityB2-7 TemperatureB2-8 pH B2-9 Dissolved OxygenB2-10 SurfactantsB2-11 Depth and FlowB2-12 Optical BrightenersB2-13 Qualitative Ammonia Nitrogen
Neponset River Watershed Association
Sample Handling and Custody Requirements - EPA Element 12
Demonstrate that your sampling handling and storage techniques will retainsafeguard the integrity of your samples and data records
12 Sample Handling and Custody Procedures
Samples will be collected between 7 AM and 10 AM on sampling days The samples will be kept on ice inside a cooler during transport Wilmington VT area samples will be picked up by the monitoring assistant in the Main Street parking lots or other agreed upon meeting location by 9 AM Green River VT samples will be picked up by the transporting volunteer at the Green River covered bridge or other agreed upon meeting location by 930 AM The remaining samples will be delivered directly to the CRC water quality lab by 10 AM Any exchange of possession in the samples will be documented on the Chain of Custody (CoC) form which will be completed and signed by the Lab Analyst upon receipt at the lab The CoC form will be checked by the program coordinator See Appendix for the CoC
Deerfield River Watershed Association
Analytical Methods Requirements - EPA Element 13
Deerfield River Watershed Association
13 Analytical Methods Requirements
All analytical determinations will be performed at the CRC lab in Greenfield by the Lab Director Gabriel Chevalier
Indicator
Method Number
Source
Reporting Units
Modifications or Options
E coli
United water laboratory 1603 Bacteria Colilert SOP 604b CRWC 03-11-10
EPA 1603 (Modified m-TEC)
1 MPN
Sodium Thiosulfate used in all containers
Neponset River Watershed Association
Massachusetts Volunteer Monitorrsquos Guide to QAPP DevelopmentPAGE 61
Here are some things to consider in choosing a method Scientific Considerations Does it meet your data quality objectives
How accurate is it How precise (reproducible) is it What is its detection limit
Will it measure the indicator in the range that you need What lab facilities are required What equipment is required Does it yield samples that are representative Is it comparable to methods used by agencies collecting similar information
Practical and Program Considerations bull Do you have the human and financial resources to do it bull How difficult is it bull How time-consuming is it bull Will it produce data useful to the target audience
Quality Control ndash EPA Element 14
This section documents that the specific quality control measures you will take will allow you to determine whether you meet your data quality objectives
What To Include Section 7 stated your DQOs Here you describe how you are going to meet them
For each indicator include the following information
bull Accuracy Precision checks list what checks you will perform
bull List the of your samples upon which you will perform quality checks that will represent the quality of all your samples
Quality Control
Accuracy checks
There are a variety of ways to check the accuracy of your sampling and analysis
Checks can be done internally (done totally within your project lab) or externally (done with the assistance of an independent lab)
Known Samples This is an internal check that compares your results against another analyst or a ldquoknownrdquo An example of a known is a quality assurance sample that UMass WRRC sends to VM groups for pH DO or alkalinity ndash with the expected value communicated when sample is sent
Proficiency Testing (Unknown) Samples In some cases there are programs that provide proficiency testing samples for laboratory performance evaluation the concentrations of which are known to the auditor but not to the lab being tested This is relatively common for most water chemistry indicators An example of an unknown would when WRRC sends a quality assurance sample without communicating the expected value in advance
Quality Control
Accuracy checks - continued
Blank and Positive Plates Bacteriological samples should be checked using the blank and positive plate procedure The blank plate uses the rinse water media and equipment in the analysis to determine if there is contamination in the laboratory materials The result should be 0 The positive plate procedure uses a sample known to contain bacteria (eg waste- water treatment plant influent) to determine if a procedural error in the lab causes inhibition of bacterial growth Results should be rdquoToo Numerous To Countrdquo Each batch of samples should include at least one blank and one positive check sample This is an internal check
Spiked Samples Spikes are additions of a known amount of the indicator with the expectation that subsequent analysis will measure exactly that much increase over the un- spiked sample This procedure is described in Section 1020 B of Standard Methods This is an internal check
Voucher and Reference Collections For macroinvertebrates and aquatic plants maintenance of a voucher andor a working reference collection is recommended A voucher collection is a preserved collection of the type specimens ie an example of each of the individual taxa that you have given a name It should be maintained in archival condition by a trained curator typically found at a university A reference collection is an exact duplicate of the voucher collection but is the one that you will regularly use as a reference when identifying new specimens Both voucher and reference collections should be verified by an expert This is an external check Alternatively have an expert review IDs made by volunteers of at least 10 of specimens collected 90 accuracy is recommended
Quality Control
Precision Checks
Precision checks are primarily accomplished through replicate sampling amp analysis in the field and lab
Field Replication Replication can be done by the same field collectors but some replication by other collectors is good eg a pair of field collectors swapping roles or have different team collect the replicate This is an internal check
Lab Replication Additional replication should occur in the lab Lab replication is done by dividing a well-mixed sample into two or more aliquots and conducting analysis on each aliquot This is an internal check
Split Samples Split samples (a sample that is split into two sub-samples) can be done in the field or the lab
Relative Percent Difference
A measure of precision used for duplicate sample results It is calculated by dividing the difference between the two results by the mean of the two results expressed as a percentage Used when sample number equals two
eg ((98-92) 100) ((98+92))2 = 63
Deerfield River Watershed Association
14 Quality Control RequirementsA Volunteers Check - Field AuditEither the QC Officer the Project Coordinator or both will accompany a crew of volunteers (each) to their site each collection The trainers will observe the volunteersrsquo performance and check their sampling technique and field data sheets for accuracy
B Field QC ChecksAt least one Field Duplicate and one Field Blank will be submitted for every ten samples collected
Field Duplicate ndash a check on water quality sampling amp analysis consistency This is a replicated sample collected at the same point in time and space side by side with the first sampling and given a separate Sample ID number
Field Blanks ndash a check for contamination (AccuracyBias) in the field by processing laboratory-supplied deionized water through the sampling train This checks for contamination introduced from the sample container(s) or from field contamination A Field Blank will be taken by one volunteer at one site per sampling day for bacteria A container of DI water will be given to the volunteer who will pour this DI water into the sample bottle at the site
We will rotate the field duplicate and field blank samples among the volunteers throughout the sampling season so a maximum of collectors can be checked
Deerfield River Watershed Association
14 Quality Control Requirements ndash continued
C Laboratory QC ChecksA Lab Duplicate will be analyzed each sampling day The lab will split a randomly chosen sample and analyze both subsamples
The lab will run a Lab Blank and a Positive Sample for bacteria each collection (see section 7)
D Data Analysis QC ChecksRiver data and QC data will be reviewed by the QC Officer as soon as they come in from the lab after each collection QC data will be compared to the quality objectives (eg blanks should have zero colonies sample duplicates should be within 3 standard deviations of the mean positives should show bacterial growth etc) River data will be reviewed as well to ensurethat no field or lab contamination has occurred (data will be compared to those of other sites and of previous collections)
Bacteria computations will be checked and validated If discrepancies are found the Lab Director will be called to resolve the discrepancy and corrections will be made by the QC Officer
Field data sheets will be also reviewed the day of collection by the Project Coordinator and later by the QC Officer to ensure that samples were taken at the right times and that all the required information has been filled out The Project Coordinator or collectors will be called if omissions or errors are detected If needed corrections will be made (signed anddated) on the field sheet by the QC Officer
Neponset River Watershed Association
PRECISION DQOS DEALING WITH LOW-LEVEL CONCENTRATIONS
Source Analyte Units PrecisionMassDEP WPP Monitoring QAPP
Training Requirements Certification ndash EPA Element 8
In Narrative or Table Format
bull List type of training (eg Field WQ lab analysis visual observation data mgt data entry etc)
bull Who is training who receives training
bull How often training done
If training records are kept (they should be) include that in section 9 on documentation and records
Neponset River Watershed Association
A8 Training - ExcerptTo ensure the high quality and usability of the data that is generated by the CWMN program all participants receive training appropriate to the tasks for which they will be responsible NepRWA staff that are involved in the program are professionals with extensive training in water quality chemistry biology and field sampling NepRWA has established a program of training for volunteers that includes initial training follow-up and refresher classes These classes are given by NepRWA staff that are qualified not only in the technical matter covered but in training and education
The initial training for volunteer monitors is primarily instruction and demonstration by the trainer with repetition by the volunteer This training includes an overview of the entire project and detailed instruction in sampling procedures All monitors receive and review a copy of NepRWArsquos Water Monitoring and Sampling Manual (see Appendix 3a)
After their initial training all volunteers participate in a mandatory annual group andor individual training session These sessions are designed to update the volunteers on changes in the program further train them in equipment calibration and field-testing procedures and evaluate each volunteerrsquos performancehellip
InstrumentEquipment Testing Inspection and Maintenance Requirements ndash EPA Element 15
Instrument Calibration and Frequency ndash EPA Element 16
InspectionAcceptance Requirements for Supplies ndash EPA Element 17
DOCUMENTATION AND RECORDS ndash EPA ELEMENT 9
Neponset River Watershed AssociationA9 Documents and RecordsA9-1 Data SheetsField data sheets include information about the site location (NepRWA ID number) which specific equipment was used to make measurements (thermometer number) the sampling method used (direct fill pole or Bridge Buddy) and equipment calibration results The field data sheets are also used to record temperature velocity depth color odor and turbidity information (Appendix 4e)helliphellip See Appendix 4 for copies of the various data sheets used in the CWMN program
A9-2 Chain of Custody FormsA9-3 Sample LabelingA9-4 Equipment Custody FormA9-5 Training and Evaluation Form
Data Acquisition Requirements - EPA Element 18
Purpose To ensure that any data you use but donrsquot collect yourself has a known data quality and is consistent with your data quality objectives that others can access these data and that your use of the data is appropriate
Describe any external data you use such as GPS coordinates for site locations weather station rainfall amounts etc
Include bull The title of the document or name of the informationbull Where you obtained it and where others may find itbull Notes on the quality of the outside information such as uncertainties and caveats
Preamble to Elements 19 through 24
Consider the four separate objectives of these chapters1) Producing a good data set - 19 covers the normal data mgt routines you do to prevent data mistakes in the first place- 22 amp23 describe how you review the resulting data sets - how you find and correct
missing or erroneous data - 19 22 and 23 should produce as complete amp accurate a data set as possible 2) Ensuring that any use you make of your data is justified In 24 you decide how usable your data are Review the final data set that the above efforts have produced Compare it with your DQOs to determine whether you have to discard or qualify any data what conclusions you can draw from your data or what changes you might need to make in your DQOs3) Improve overall project performance 20 deals with how well volunteers laboratories and equipment are operating It looks at function not outcomes Who evaluates the various components of your program when problems are found what corrections are made to make your program run better4) Report your results After yoursquove run these various checks you are ready to release your data In Chapter 21 you describe the reports you will issue
Suggested order bull Data Management (19)bull Data Review Validation and Verification Requirements (22)bull (Data) Validation and Verification Methods (23)
bull Reconciliation with Data Quality Objectives (24)
bull Assessment and Response Actions (20)
bull Reports (21)
EPA Elements 19 ndash 24
bull Data Management (19)bull Assessment and Response Actions (20) bull Reports (21)bull Data Review Validation and Verification Requirements (22)bull (Data) Validation and Verification Methods (23)bull Reconciliation with Data Quality Objectives (24)
Data Management ndash EPA Element 19
Follow the data from the moment itrsquos recorded through every step to final report databaseIntent is to prevent errors or loss of data or be able to correct in timely manner
bull Before each activitystep is conducted well-designed field sheets checklists COC forms data entry software auto-QC calculations out-of-bounds highlights etc
bull During each step sheets filled completely checklist reviewed before leaving site etc
bull Immediately after Computer-entered data compared with field sheets etc
bull Long term preservation Data storage
Neponset River Watershed Association
B9 Data ManagementThe Project Manager is responsible for overseeing all data management activities Refer also to section D below for additional discussion of data review verification and validation practices
B9-1 Raw DataField data sheets are collected with the samples The sheets are turned into the NepRWA office by the site coordinators The forms are then reviewed for illegible answers errors or questionable values and checked for consistency with the COC and bottle labels as described in Appendix 3l Any questions are referred to the volunteer for clarification NepRWA staff makes corrections by crossing out the errors and writing in the correct answer All corrections must be initialed
B9-2 Data Entry and ValidationOnce the information has undergone a preliminary check it is entered into a Filemaker database The software has been customized to the data sheet Fields within the worksheet have been set-up with limits based on expected results This helps to minimize entry errors Entered data is then checked against the data sheets by another volunteer or staff person
B9-3 Data StorageThe original data sheets are filed into an event file and stored in NepRWArsquos permanent files Electronic copies of data are maintained on a secure Filemaker server Data files are kept in perpetuity along with hard copies of volunteer data sheets All electronic data is backed-up daily on to a password-protected hard drive
Data Review Validation and Verificationndash EPA Element 22
(Data) Validation and Verification Methods ndash EPA Element 23
Deerfield River Watershed Association
22 Data Review Validation and Verification ndash Summarized bullet list
All data reviewed by the Project Coordinator and QA Coordinator
Data Analysis QC Checks will includebull Data entry checks by a second personbull Computer entries compared with fieldlab sheetsbull Checks on graphs amp all other data representationsbull Calculation of measures of data quality including completeness
Corrective actionsbull Data entry errors corrected bull Data outside expected range flagged or rejected bull 2nd field sample andor laboratory aliquot taken when possiblebull Data quality problems discussed in draft and final reports
(Data) Validation and Verification Methods ndash EPA Element 23 From Inland QAPP
Validation and Verification Methods will include checks on bull Completion of all fields on data sheets missing data sheetsbull Completeness of sampling runs (eg number of sites visitedsamples taken vs number proposed were all parameters sampledanalyzed)bull Completeness of QC checks (eg number and type of QC checks performed vs numbertype proposed)bull Accuracy and precision compared to data quality objectivesbull Representativeness of samples and resulting data by examining survey metadata for unusual conditions and occurrences that may have impacted the validity of results
Deerfield River Watershed Association ndash Excerpt summarized
23 Validation and Verification Methods
The following simple measures of data quality will be calculated and included in the final report
1) To screen for contamination the average blank concentration hellip will be calculated This average value should be as close as practical to the Reporting Limit listed in Table 4
2) To assess the precision of results the ldquoMean Relative Percent Differencerdquo between field duplicate samples should be calculated The average RPD should be less than or equal to the Estimated Precision listed in Table 4 This simple measure is calculated as follows
RPD formula used hellip
Reconciliation With Data Quality Objectives ndash EPA Element 24MassWWP guide to QAPP development
What to Include bull List who will evaluate your actual data vs your data quality goals bull State how and when this will be done bull Describe the process for determining what to do if goals are not met
Neponset River Watershed Association
D2 Reconciliation with User Requirements - Summarized bulletedbull Following each sampling event and prior to the subsequent event calculations and
determinations for precision completeness and accuracy will be made bull Any corrective action will be implemented noted and initialized by the project manager bull If data quality indicators do not meet the projectrsquos specifications then data may be discarded
may be flagged or re-sampling may occur bull Investigation of problems will take place and corrections will be documented If equipment
failure is found to be the cause calibration and maintenance techniques will be reassessed Field duplicate testing may occur during the next sampling event to ensure confidence in the results
bull Any limitations on the data will be noted bull Any revisions to the project will be submitted to EPA and DEP quality assurance officers for
approval
Assessment and Response Actions - EPA Element 20 From Inland QAPP
Document that the progress and quality of the monitoring program will be continuously assessed to ensure that its objectives are being accomplished
The Monitoring Coordinator will periodically check to see the following bull Monitoring is occurring as planned bull Sufficient written commentary and supporting photographs exist bull Sufficient volunteers are available bull Volunteers have been observed as they sample their sites bull Samplers are collecting in accordance with project schedules bull Data sheets and custody control sheets are being properly completed and signed bull Data are properly interpreted bull Plans for dealing with adverse weather are in place
Assessment and Response Actions - EPA Element 20 From Inland QAPP ndash continued
The Monitoring Coordinator will periodically check to see the following bull Retraining or other corrective action is implemented at the first hint of non compliance with the
QAPP or SOPs bull Labs are adhering to the requirements of their QAPP in terms of work performed accuracy
acceptable holding times timely and understandable results and delivery process bull Data management is being handled properly ie data are entered on a timely basis is
properly backed up is easily accessed and raw data are properly stored in a safe placebull Procedure for developing and reporting the results exists
Assessment and Response Actions - EPA Element 20 From Inland QAPP ndash continued
The Monitoring Coordinator will confer with the QA Officer as necessary to discuss any problems that occur and what corrective actions are needed to maintain program integrity In addition the Monitoring Coordinator and QA Officer will meet at the end of the sampling season to review the draft report and discuss all aspects of the program and identify necessary program modifications for future sampling activities [If the program includes a technical advisory committee the TAC will be included in these discussions] Corrections may include retraining volunteers rewriting sampling instructions replacement of volunteers alteration of sampling schedules sites or methods or other actions deemed necessary All problems discovered and program modifications made will be documented in the final version of the project report If modifications require changes in the Quality Assurance Project Plan these changes will be submitted MassDEP for review
Deerfield River Watershed Association
20 Assessment and Response Actions ndash Summarized bullet list
bull There will be an on-site visit by the Quality Control Officer to observe field sampling and field analysis procedures Generally this will be done near the beginning of the project
bull A written checklist will be used for the assessments maintained by the Project Coordinator and copies will be provided with the data report
bull The Project Coordinator and QC Officer will determine if field work follows the written procedures or if there needs to be corrections by additional training or revising protocols
bull Please refer to Section 22 for additional evaluations and response actions regarding data evaluations
Reports ndash EPA Element 21
Project Task Organization ndash EPA Element 4 Reviewrevise early choices
Distribution List ndash EPA Element 3
Title and Approval Page - EPA Element 1
Table of Contents ndash EPA Element 2
Water quality monitoring quality assurance workshop
Terminology
Study design
QAPP
sampling and analysis plan
standard operating procedures
data quality objectives
Water Quality Monitoring Planning Process
Monitoring program activities
Why do you need (who Gives) a qapp
Slide Number 11
Slide Number 12
Steps to Developing a QAPP
Slide Number 14
Slide Number 15
Slide Number 16
Steps to Developing a QAPP
Slide Number 18
Slide Number 19
Slide Number 20
Slide Number 21
Slide Number 22
Slide Number 23
Slide Number 24
Sources of Information About Massachusetts Waters
Slide Number 26
Slide Number 27
Slide Number 28
Slide Number 29
Slide Number 30
Slide Number 31
Slide Number 32
Slide Number 33
Slide Number 34
Slide Number 35
Slide Number 36
Slide Number 37
Slide Number 38
Slide Number 39
Slide Number 40
Slide Number 41
Slide Number 42
Slide Number 43
Slide Number 44
Slide Number 45
Slide Number 46
MassDEP - Recommended Minimum Sample Number Frequency and Timing for Example Parameters
Slide Number 48
Slide Number 49
Slide Number 50
Slide Number 51
Slide Number 52
MaDep - Recommended Minimum Sample Number Frequency and Timing for Example Parameters
Slide Number 54
Slide Number 55
Slide Number 56
Slide Number 57
Slide Number 58
Slide Number 59
Slide Number 60
Slide Number 61
Slide Number 62
Slide Number 63
Slide Number 64
Slide Number 65
Slide Number 66
Slide Number 67
Slide Number 68
Slide Number 69
Slide Number 70
Slide Number 71
Slide Number 72
Slide Number 73
Slide Number 74
Slide Number 75
Slide Number 76
Precision DQOs Dealing with low-level concentrations
Slide Number 78
Slide Number 79
Slide Number 80
Slide Number 81
Slide Number 82
Documentation and Records ndash EPA Element 9
Slide Number 84
Slide Number 85
Slide Number 86
Slide Number 87
Slide Number 88
Slide Number 89
Slide Number 90
Slide Number 91
Slide Number 92
Slide Number 93
Slide Number 94
Slide Number 95
Slide Number 96
Slide Number 97
Slide Number 98
Slide Number 99
Slide Number 100
REPRESENTATIVENESS
Representativeness is the extent to which measurements actually represent the true environmental condition
You will state that- Sampling sites were selected to appropriately capture
- the general characteristics of the water body- or specific impacts if you are conducting an impact assessment (eg above amp
below suspected pollution sourceshellip)- The sample collection point is appropriate eg mid-stream mid-lake etc what
sampling depth - Number of sites is adequate to answer study question- The parameters monitored are relevant to the type of impact or to a general
WQ assessment- Sample collection timing and frequency are selected to capture data that are
representative of target conditions (eg various water levels weather seasons)
MassDEP - RECOMMENDED MINIMUM SAMPLE NUMBER FREQUENCY AND TIMING FOR EXAMPLE PARAMETERS
Parameter
Streams Lakes
Min Sample Number and Frequency
Sampling Period Min Sample Number and Frequency
Sampling Period
DO (discrete) 5 results pre-dawn June - September 3 results (epilimnetic) June - September
DO (continuous) 3o days June - September 3o days June - September
pH 5 results June - September 3 results (epilimnetic) June - September
Temperature (discrete) 5 results afternoon June - September 3 results (epilimnetic) June - September
Temperature (continuous) 3o days June - September 3o days June - September
Bacteria (eg E coli) 3-5 results (in 30-90 days) April 1-October 15 3-5 results (in 30-90 days) April 1-October 15
Nutrients (inc chl a for lakes) 5 results June- September 3 results June - September
Secchi depth --- --- 3 results June - September
Chloride 3 results 4 day period (yr-round) --- ---
ldquoCleanrdquo metals 3 results 4 day period (summer) --- ---
Misc toxics emerging contam 3 results 30 day period (summer) 3 results (epilimnetic) 30 day period (summer)
Fish community 1 survey April 1-October 15 1 survey April 1-October 15
Fish tissue contaminants (eg Hg PCBs pesticides)
1 survey Any 1 survey Any
Benthic invertebrates (RBP3) 1 survey July ndash October --- ---
Weed surveys 1 survey June- September 1 survey June- September
Aesthetics 1 survey April 1-October 15 1 survey April 1-October 15
30 days (bathing) 90 days (non-bathing) ldquoworst-caserdquo typ July-Aug
REPRESENTATIVENESS
DRWAB Data RepresentativenessSamples collected at locations and depths described in this QAPP will reflect conditions of individual water bodies and tributaries in Vermont and Massachusetts To ensure representativeness all samples will be collected preserved and analyzed according to the procedures in this QAPP and within the specified holding times
NepRWAA7-5 Data RepresentativenessSampling points will be chosen to represent the water quality within the applicable geographic area of interest Staff experienced and knowledgeable in the factors affecting water quality will choose sample points that will be representative of conditions within the area of concern
COMPARABILITY
Comparability is the degree to which data can be compared directly to similar studies There are two things to consider future studies someone might undertake and past studies you (or others) will want to compare your data with
State that you will use and document standardized - sampling amp analytical methods and units of reporting- sampling sites times and dates - sample storage and transfer
Comparability
Deerfield River Watershed Association
C Data ComparabilityAll samples for each specific parameter will be collected and analyzed using the respective procedures described in this QAPP to ensure that comparisons between different sample sites sample dates depths and projects can be appropriately made Procedures are unchanged from previous years
Neponset River Watershed Association
A7-6 ComparabilityComparability is ensured by the utilization of established sampling and monitoring protocols from Massachusetts DEP MWRA Massachusetts Water Watch Partnership the Boston Water and Sewer Commission and NepRWA and by the use of standard test methods and procedures as outlined in Appendices 6 7 and 8
Completeness
Completeness is an estimate of the amount of data you will need to answer your study question Usually expressed as a of originally planned sample events after missing sample events and data no meeting DQOs are subtracted from the planned number
DRWA
D Data CompletenessAt least 80 of the anticipated number of samples will be collected at each site analyzed and determined to meet data quality objectives for the project to be considered successful A report detailing the number of anticipated samples number of valid results and percent completion (number of valid samplesnumber of anticipated samples) will be produced
NepRWAA7-8 CompletenessIn order to obtain the best picture of the watershed NepRWA expects 90 of the routine sampling and follow up sampling samples to be collected and analyzed during each scheduled sampling event In the routine sampling program uncertainties such as weather volunteer scheduling and illness sometimes result in unavoidable omissions but every effort is made to assign backup samplers when possible
Sampling Process Design - EPA Element 10From MassWWP QAPP Guide
Purpose To describe in greater detail the design of the sampling part of your monitoring program
In Section 6 you briefly outlined the sample process design In this section you should elaborate on the rationales for those choices When you complete this section you should revisit Section 6 and revise as necessary The two sections should be in agreement
What To Include bull Indicators or measures bull Types of samplesbull Sampling frequency bull Sampling period bull How you will select sample sites and identify them over timebull Site safety plans
MADEP - RECOMMENDED MINIMUM SAMPLE NUMBER FREQUENCY AND TIMING FOR EXAMPLE PARAMETERS
Parameter
Streams Lakes
Min Sample Number and Frequency
Sampling Period Min Sample Number and Frequency
Sampling Period
DO (discrete) 5 results pre-dawn June - September 3 results (epilimnetic) June - September
DO (continuous) 3o days June - September 3o days June - September
pH 5 results June - September 3 results (epilimnetic) June - September
Temperature (discrete) 5 results afternoon June - September 3 results (epilimnetic) June - September
Temperature (continuous) 3o days June - September 3o days June - September
Bacteria (eg E coli) 3-5 results (in 30-90 days) April 1-October 15 3-5 results (in 30-90 days) April 1-October 15
Nutrients (inc chl a for lakes) 5 results June- September 3 results June - September
Secchi depth --- --- 3 results June - September
Chloride 3 results 4 day period (yr-round) --- ---
ldquoCleanrdquo metals 3 results 4 day period (summer) --- ---
Misc toxics emerging contam 3 results 30 day period (summer) 3 results (epilimnetic) 30 day period (summer)
Fish community 1 survey April 1-October 15 1 survey April 1-October 15
Fish tissue contaminants (eg Hg PCBs pesticides)
1 survey Any 1 survey Any
Benthic invertebrates (RBP3) 1 survey July ndash October --- ---
Weed surveys 1 survey June- September 1 survey June- September
Aesthetics 1 survey April 1-October 15 1 survey April 1-October 15
30 days (bathing) 90 days (non-bathing) ldquoworst-caserdquo typ July-Aug
Deerfield River Watershed Association
10 Sampling Process Design
Sampling sites were selected to represent locations that receive heavy human use from swimmers boaters anglers and other contact recreational users
Samples will be collected bi-weekly from late June through early September (prime recreation period) between 10 AM and 1 PM Samplers will first fill out their field data sheet They will then collect a water sample away from the edge of the stream near the center of the stream (centroid of flow) and just below the surface following the MWWP protocol (available in the Appendix)
Samplers will place their samples immediately in a cooler with ice or frozen ice packs making sure the temperature in the cooler is at 4degC or lower Each sample bottle will be placed in an individual clean Ziploc bag to avoid cross contamination
Neponset River Watershed Association
B1 Sampling Process Design
The CWMN program is designed to develop and maintain a record of general water qualitythroughout the watershed Project goals include both evaluation of long-term changes over time across the watershed as a whole and the identification of pollution hotspots at a low order subwatershed scale
Routine sampling activities consist of collecting in-stream samples As discussed above routine sampling sites are divided among ldquoindicatorrdquo sites and ldquosubwatershed sitesrdquo in order to meet the dual objectives of the program Indicator sites are selected to be representative of overall water quality and are relatively unchanging over time to allow comparison to past and future investigations Sites have generally been selected at the downstream ends or key segmentation points of major subwatersheds and at or near locations where there is a longstanding data record
Neponset River Watershed Association
B1 Sampling Process Design ndash continued
Subwatershed sites are selected to provide higher spatial resolution along individual streams in an effort to bracket pollution sources and facilitate their identification and remediation Subwatershed sites make up roughly 60 of the overall number of sites and are more likely to change from year to year Subwatershed sites may be rotated through different watersheds over the course of several sampling seasons to provide detailed data on different subwatersheds over a period of years Specific sites are selected by the project manager on the basis of known or suspected problems or opportunities or to fill in a lack of detailed data in a specific area
Neponset River Watershed Association
B1 Sampling Process Design ndash continued
In addition to the routine sampling activities CWMN also encompasses follow up and special study sampling activities These are generally ldquoone-timerdquo investigations intended to zero in on pollution sources in a known or suspected problem areahellipSpecific sampling stations may be planned in advance or may be chosen opportunistically by samplers while in the field
The mix of parameters sampled at each site depends on its status as an indicator subwatershed or follow up station the relative location of the station in the watershed and the specific pollutant(s) of concern at that specific location Indicator sites are tested for bacteria nutrients ammonia and field measured parametershellip Subwatershed sites are generally tested for bacteria total phosphorus and field measured parameters At some subwatershed sites hellip Follow up sampling stations will generally be tested for a very narrow set of parameters based on the specific pollutant of concern A listing of current routine sampling stations and the parameters sampled is provided in the Appendix 1e
Sampling Methods Requirements - EPA Element 11
This section describes your field measurementsample collection methods It can be stated in table form with narrative descriptions if you choose
Includebull What parameters are being sampledbull Sampling containersdevices sample preservation steps Maximum holding timebull Amount of sample to be collectedbull Summarize steps taken by field samplersbull Reference to the method followed (cite specific SOPS include in appendices)bull Can also include sampling considerations (eg time of day steps taken to avoid stirring up
sediments sample collection depth etc) These will be detailed in SOPs
Deerfield River Watershed Association
ParameterMeasure Container Field Rinse Preservation Hold Time E coli 120 mL IDEXX
Cool to lt4degC 6 hours to lab 8 hours to processing
B2 Sampling Methods
B2-2 Visual ObservationsB2-3 Fecal Coliform E coli and EnterococcusB2-5 NutrientsB2-6 Specific Conductance and SalinityB2-7 TemperatureB2-8 pH B2-9 Dissolved OxygenB2-10 SurfactantsB2-11 Depth and FlowB2-12 Optical BrightenersB2-13 Qualitative Ammonia Nitrogen
Neponset River Watershed Association
Sample Handling and Custody Requirements - EPA Element 12
Demonstrate that your sampling handling and storage techniques will retainsafeguard the integrity of your samples and data records
12 Sample Handling and Custody Procedures
Samples will be collected between 7 AM and 10 AM on sampling days The samples will be kept on ice inside a cooler during transport Wilmington VT area samples will be picked up by the monitoring assistant in the Main Street parking lots or other agreed upon meeting location by 9 AM Green River VT samples will be picked up by the transporting volunteer at the Green River covered bridge or other agreed upon meeting location by 930 AM The remaining samples will be delivered directly to the CRC water quality lab by 10 AM Any exchange of possession in the samples will be documented on the Chain of Custody (CoC) form which will be completed and signed by the Lab Analyst upon receipt at the lab The CoC form will be checked by the program coordinator See Appendix for the CoC
Deerfield River Watershed Association
Analytical Methods Requirements - EPA Element 13
Deerfield River Watershed Association
13 Analytical Methods Requirements
All analytical determinations will be performed at the CRC lab in Greenfield by the Lab Director Gabriel Chevalier
Indicator
Method Number
Source
Reporting Units
Modifications or Options
E coli
United water laboratory 1603 Bacteria Colilert SOP 604b CRWC 03-11-10
EPA 1603 (Modified m-TEC)
1 MPN
Sodium Thiosulfate used in all containers
Neponset River Watershed Association
Massachusetts Volunteer Monitorrsquos Guide to QAPP DevelopmentPAGE 61
Here are some things to consider in choosing a method Scientific Considerations Does it meet your data quality objectives
How accurate is it How precise (reproducible) is it What is its detection limit
Will it measure the indicator in the range that you need What lab facilities are required What equipment is required Does it yield samples that are representative Is it comparable to methods used by agencies collecting similar information
Practical and Program Considerations bull Do you have the human and financial resources to do it bull How difficult is it bull How time-consuming is it bull Will it produce data useful to the target audience
Quality Control ndash EPA Element 14
This section documents that the specific quality control measures you will take will allow you to determine whether you meet your data quality objectives
What To Include Section 7 stated your DQOs Here you describe how you are going to meet them
For each indicator include the following information
bull Accuracy Precision checks list what checks you will perform
bull List the of your samples upon which you will perform quality checks that will represent the quality of all your samples
Quality Control
Accuracy checks
There are a variety of ways to check the accuracy of your sampling and analysis
Checks can be done internally (done totally within your project lab) or externally (done with the assistance of an independent lab)
Known Samples This is an internal check that compares your results against another analyst or a ldquoknownrdquo An example of a known is a quality assurance sample that UMass WRRC sends to VM groups for pH DO or alkalinity ndash with the expected value communicated when sample is sent
Proficiency Testing (Unknown) Samples In some cases there are programs that provide proficiency testing samples for laboratory performance evaluation the concentrations of which are known to the auditor but not to the lab being tested This is relatively common for most water chemistry indicators An example of an unknown would when WRRC sends a quality assurance sample without communicating the expected value in advance
Quality Control
Accuracy checks - continued
Blank and Positive Plates Bacteriological samples should be checked using the blank and positive plate procedure The blank plate uses the rinse water media and equipment in the analysis to determine if there is contamination in the laboratory materials The result should be 0 The positive plate procedure uses a sample known to contain bacteria (eg waste- water treatment plant influent) to determine if a procedural error in the lab causes inhibition of bacterial growth Results should be rdquoToo Numerous To Countrdquo Each batch of samples should include at least one blank and one positive check sample This is an internal check
Spiked Samples Spikes are additions of a known amount of the indicator with the expectation that subsequent analysis will measure exactly that much increase over the un- spiked sample This procedure is described in Section 1020 B of Standard Methods This is an internal check
Voucher and Reference Collections For macroinvertebrates and aquatic plants maintenance of a voucher andor a working reference collection is recommended A voucher collection is a preserved collection of the type specimens ie an example of each of the individual taxa that you have given a name It should be maintained in archival condition by a trained curator typically found at a university A reference collection is an exact duplicate of the voucher collection but is the one that you will regularly use as a reference when identifying new specimens Both voucher and reference collections should be verified by an expert This is an external check Alternatively have an expert review IDs made by volunteers of at least 10 of specimens collected 90 accuracy is recommended
Quality Control
Precision Checks
Precision checks are primarily accomplished through replicate sampling amp analysis in the field and lab
Field Replication Replication can be done by the same field collectors but some replication by other collectors is good eg a pair of field collectors swapping roles or have different team collect the replicate This is an internal check
Lab Replication Additional replication should occur in the lab Lab replication is done by dividing a well-mixed sample into two or more aliquots and conducting analysis on each aliquot This is an internal check
Split Samples Split samples (a sample that is split into two sub-samples) can be done in the field or the lab
Relative Percent Difference
A measure of precision used for duplicate sample results It is calculated by dividing the difference between the two results by the mean of the two results expressed as a percentage Used when sample number equals two
eg ((98-92) 100) ((98+92))2 = 63
Deerfield River Watershed Association
14 Quality Control RequirementsA Volunteers Check - Field AuditEither the QC Officer the Project Coordinator or both will accompany a crew of volunteers (each) to their site each collection The trainers will observe the volunteersrsquo performance and check their sampling technique and field data sheets for accuracy
B Field QC ChecksAt least one Field Duplicate and one Field Blank will be submitted for every ten samples collected
Field Duplicate ndash a check on water quality sampling amp analysis consistency This is a replicated sample collected at the same point in time and space side by side with the first sampling and given a separate Sample ID number
Field Blanks ndash a check for contamination (AccuracyBias) in the field by processing laboratory-supplied deionized water through the sampling train This checks for contamination introduced from the sample container(s) or from field contamination A Field Blank will be taken by one volunteer at one site per sampling day for bacteria A container of DI water will be given to the volunteer who will pour this DI water into the sample bottle at the site
We will rotate the field duplicate and field blank samples among the volunteers throughout the sampling season so a maximum of collectors can be checked
Deerfield River Watershed Association
14 Quality Control Requirements ndash continued
C Laboratory QC ChecksA Lab Duplicate will be analyzed each sampling day The lab will split a randomly chosen sample and analyze both subsamples
The lab will run a Lab Blank and a Positive Sample for bacteria each collection (see section 7)
D Data Analysis QC ChecksRiver data and QC data will be reviewed by the QC Officer as soon as they come in from the lab after each collection QC data will be compared to the quality objectives (eg blanks should have zero colonies sample duplicates should be within 3 standard deviations of the mean positives should show bacterial growth etc) River data will be reviewed as well to ensurethat no field or lab contamination has occurred (data will be compared to those of other sites and of previous collections)
Bacteria computations will be checked and validated If discrepancies are found the Lab Director will be called to resolve the discrepancy and corrections will be made by the QC Officer
Field data sheets will be also reviewed the day of collection by the Project Coordinator and later by the QC Officer to ensure that samples were taken at the right times and that all the required information has been filled out The Project Coordinator or collectors will be called if omissions or errors are detected If needed corrections will be made (signed anddated) on the field sheet by the QC Officer
Neponset River Watershed Association
PRECISION DQOS DEALING WITH LOW-LEVEL CONCENTRATIONS
Source Analyte Units PrecisionMassDEP WPP Monitoring QAPP
Training Requirements Certification ndash EPA Element 8
In Narrative or Table Format
bull List type of training (eg Field WQ lab analysis visual observation data mgt data entry etc)
bull Who is training who receives training
bull How often training done
If training records are kept (they should be) include that in section 9 on documentation and records
Neponset River Watershed Association
A8 Training - ExcerptTo ensure the high quality and usability of the data that is generated by the CWMN program all participants receive training appropriate to the tasks for which they will be responsible NepRWA staff that are involved in the program are professionals with extensive training in water quality chemistry biology and field sampling NepRWA has established a program of training for volunteers that includes initial training follow-up and refresher classes These classes are given by NepRWA staff that are qualified not only in the technical matter covered but in training and education
The initial training for volunteer monitors is primarily instruction and demonstration by the trainer with repetition by the volunteer This training includes an overview of the entire project and detailed instruction in sampling procedures All monitors receive and review a copy of NepRWArsquos Water Monitoring and Sampling Manual (see Appendix 3a)
After their initial training all volunteers participate in a mandatory annual group andor individual training session These sessions are designed to update the volunteers on changes in the program further train them in equipment calibration and field-testing procedures and evaluate each volunteerrsquos performancehellip
InstrumentEquipment Testing Inspection and Maintenance Requirements ndash EPA Element 15
Instrument Calibration and Frequency ndash EPA Element 16
InspectionAcceptance Requirements for Supplies ndash EPA Element 17
DOCUMENTATION AND RECORDS ndash EPA ELEMENT 9
Neponset River Watershed AssociationA9 Documents and RecordsA9-1 Data SheetsField data sheets include information about the site location (NepRWA ID number) which specific equipment was used to make measurements (thermometer number) the sampling method used (direct fill pole or Bridge Buddy) and equipment calibration results The field data sheets are also used to record temperature velocity depth color odor and turbidity information (Appendix 4e)helliphellip See Appendix 4 for copies of the various data sheets used in the CWMN program
A9-2 Chain of Custody FormsA9-3 Sample LabelingA9-4 Equipment Custody FormA9-5 Training and Evaluation Form
Data Acquisition Requirements - EPA Element 18
Purpose To ensure that any data you use but donrsquot collect yourself has a known data quality and is consistent with your data quality objectives that others can access these data and that your use of the data is appropriate
Describe any external data you use such as GPS coordinates for site locations weather station rainfall amounts etc
Include bull The title of the document or name of the informationbull Where you obtained it and where others may find itbull Notes on the quality of the outside information such as uncertainties and caveats
Preamble to Elements 19 through 24
Consider the four separate objectives of these chapters1) Producing a good data set - 19 covers the normal data mgt routines you do to prevent data mistakes in the first place- 22 amp23 describe how you review the resulting data sets - how you find and correct
missing or erroneous data - 19 22 and 23 should produce as complete amp accurate a data set as possible 2) Ensuring that any use you make of your data is justified In 24 you decide how usable your data are Review the final data set that the above efforts have produced Compare it with your DQOs to determine whether you have to discard or qualify any data what conclusions you can draw from your data or what changes you might need to make in your DQOs3) Improve overall project performance 20 deals with how well volunteers laboratories and equipment are operating It looks at function not outcomes Who evaluates the various components of your program when problems are found what corrections are made to make your program run better4) Report your results After yoursquove run these various checks you are ready to release your data In Chapter 21 you describe the reports you will issue
Suggested order bull Data Management (19)bull Data Review Validation and Verification Requirements (22)bull (Data) Validation and Verification Methods (23)
bull Reconciliation with Data Quality Objectives (24)
bull Assessment and Response Actions (20)
bull Reports (21)
EPA Elements 19 ndash 24
bull Data Management (19)bull Assessment and Response Actions (20) bull Reports (21)bull Data Review Validation and Verification Requirements (22)bull (Data) Validation and Verification Methods (23)bull Reconciliation with Data Quality Objectives (24)
Data Management ndash EPA Element 19
Follow the data from the moment itrsquos recorded through every step to final report databaseIntent is to prevent errors or loss of data or be able to correct in timely manner
bull Before each activitystep is conducted well-designed field sheets checklists COC forms data entry software auto-QC calculations out-of-bounds highlights etc
bull During each step sheets filled completely checklist reviewed before leaving site etc
bull Immediately after Computer-entered data compared with field sheets etc
bull Long term preservation Data storage
Neponset River Watershed Association
B9 Data ManagementThe Project Manager is responsible for overseeing all data management activities Refer also to section D below for additional discussion of data review verification and validation practices
B9-1 Raw DataField data sheets are collected with the samples The sheets are turned into the NepRWA office by the site coordinators The forms are then reviewed for illegible answers errors or questionable values and checked for consistency with the COC and bottle labels as described in Appendix 3l Any questions are referred to the volunteer for clarification NepRWA staff makes corrections by crossing out the errors and writing in the correct answer All corrections must be initialed
B9-2 Data Entry and ValidationOnce the information has undergone a preliminary check it is entered into a Filemaker database The software has been customized to the data sheet Fields within the worksheet have been set-up with limits based on expected results This helps to minimize entry errors Entered data is then checked against the data sheets by another volunteer or staff person
B9-3 Data StorageThe original data sheets are filed into an event file and stored in NepRWArsquos permanent files Electronic copies of data are maintained on a secure Filemaker server Data files are kept in perpetuity along with hard copies of volunteer data sheets All electronic data is backed-up daily on to a password-protected hard drive
Data Review Validation and Verificationndash EPA Element 22
(Data) Validation and Verification Methods ndash EPA Element 23
Deerfield River Watershed Association
22 Data Review Validation and Verification ndash Summarized bullet list
All data reviewed by the Project Coordinator and QA Coordinator
Data Analysis QC Checks will includebull Data entry checks by a second personbull Computer entries compared with fieldlab sheetsbull Checks on graphs amp all other data representationsbull Calculation of measures of data quality including completeness
Corrective actionsbull Data entry errors corrected bull Data outside expected range flagged or rejected bull 2nd field sample andor laboratory aliquot taken when possiblebull Data quality problems discussed in draft and final reports
(Data) Validation and Verification Methods ndash EPA Element 23 From Inland QAPP
Validation and Verification Methods will include checks on bull Completion of all fields on data sheets missing data sheetsbull Completeness of sampling runs (eg number of sites visitedsamples taken vs number proposed were all parameters sampledanalyzed)bull Completeness of QC checks (eg number and type of QC checks performed vs numbertype proposed)bull Accuracy and precision compared to data quality objectivesbull Representativeness of samples and resulting data by examining survey metadata for unusual conditions and occurrences that may have impacted the validity of results
Deerfield River Watershed Association ndash Excerpt summarized
23 Validation and Verification Methods
The following simple measures of data quality will be calculated and included in the final report
1) To screen for contamination the average blank concentration hellip will be calculated This average value should be as close as practical to the Reporting Limit listed in Table 4
2) To assess the precision of results the ldquoMean Relative Percent Differencerdquo between field duplicate samples should be calculated The average RPD should be less than or equal to the Estimated Precision listed in Table 4 This simple measure is calculated as follows
RPD formula used hellip
Reconciliation With Data Quality Objectives ndash EPA Element 24MassWWP guide to QAPP development
What to Include bull List who will evaluate your actual data vs your data quality goals bull State how and when this will be done bull Describe the process for determining what to do if goals are not met
Neponset River Watershed Association
D2 Reconciliation with User Requirements - Summarized bulletedbull Following each sampling event and prior to the subsequent event calculations and
determinations for precision completeness and accuracy will be made bull Any corrective action will be implemented noted and initialized by the project manager bull If data quality indicators do not meet the projectrsquos specifications then data may be discarded
may be flagged or re-sampling may occur bull Investigation of problems will take place and corrections will be documented If equipment
failure is found to be the cause calibration and maintenance techniques will be reassessed Field duplicate testing may occur during the next sampling event to ensure confidence in the results
bull Any limitations on the data will be noted bull Any revisions to the project will be submitted to EPA and DEP quality assurance officers for
approval
Assessment and Response Actions - EPA Element 20 From Inland QAPP
Document that the progress and quality of the monitoring program will be continuously assessed to ensure that its objectives are being accomplished
The Monitoring Coordinator will periodically check to see the following bull Monitoring is occurring as planned bull Sufficient written commentary and supporting photographs exist bull Sufficient volunteers are available bull Volunteers have been observed as they sample their sites bull Samplers are collecting in accordance with project schedules bull Data sheets and custody control sheets are being properly completed and signed bull Data are properly interpreted bull Plans for dealing with adverse weather are in place
Assessment and Response Actions - EPA Element 20 From Inland QAPP ndash continued
The Monitoring Coordinator will periodically check to see the following bull Retraining or other corrective action is implemented at the first hint of non compliance with the
QAPP or SOPs bull Labs are adhering to the requirements of their QAPP in terms of work performed accuracy
acceptable holding times timely and understandable results and delivery process bull Data management is being handled properly ie data are entered on a timely basis is
properly backed up is easily accessed and raw data are properly stored in a safe placebull Procedure for developing and reporting the results exists
Assessment and Response Actions - EPA Element 20 From Inland QAPP ndash continued
The Monitoring Coordinator will confer with the QA Officer as necessary to discuss any problems that occur and what corrective actions are needed to maintain program integrity In addition the Monitoring Coordinator and QA Officer will meet at the end of the sampling season to review the draft report and discuss all aspects of the program and identify necessary program modifications for future sampling activities [If the program includes a technical advisory committee the TAC will be included in these discussions] Corrections may include retraining volunteers rewriting sampling instructions replacement of volunteers alteration of sampling schedules sites or methods or other actions deemed necessary All problems discovered and program modifications made will be documented in the final version of the project report If modifications require changes in the Quality Assurance Project Plan these changes will be submitted MassDEP for review
Deerfield River Watershed Association
20 Assessment and Response Actions ndash Summarized bullet list
bull There will be an on-site visit by the Quality Control Officer to observe field sampling and field analysis procedures Generally this will be done near the beginning of the project
bull A written checklist will be used for the assessments maintained by the Project Coordinator and copies will be provided with the data report
bull The Project Coordinator and QC Officer will determine if field work follows the written procedures or if there needs to be corrections by additional training or revising protocols
bull Please refer to Section 22 for additional evaluations and response actions regarding data evaluations
Reports ndash EPA Element 21
Project Task Organization ndash EPA Element 4 Reviewrevise early choices
Distribution List ndash EPA Element 3
Title and Approval Page - EPA Element 1
Table of Contents ndash EPA Element 2
Water quality monitoring quality assurance workshop
Terminology
Study design
QAPP
sampling and analysis plan
standard operating procedures
data quality objectives
Water Quality Monitoring Planning Process
Monitoring program activities
Why do you need (who Gives) a qapp
Slide Number 11
Slide Number 12
Steps to Developing a QAPP
Slide Number 14
Slide Number 15
Slide Number 16
Steps to Developing a QAPP
Slide Number 18
Slide Number 19
Slide Number 20
Slide Number 21
Slide Number 22
Slide Number 23
Slide Number 24
Sources of Information About Massachusetts Waters
Slide Number 26
Slide Number 27
Slide Number 28
Slide Number 29
Slide Number 30
Slide Number 31
Slide Number 32
Slide Number 33
Slide Number 34
Slide Number 35
Slide Number 36
Slide Number 37
Slide Number 38
Slide Number 39
Slide Number 40
Slide Number 41
Slide Number 42
Slide Number 43
Slide Number 44
Slide Number 45
Slide Number 46
MassDEP - Recommended Minimum Sample Number Frequency and Timing for Example Parameters
Slide Number 48
Slide Number 49
Slide Number 50
Slide Number 51
Slide Number 52
MaDep - Recommended Minimum Sample Number Frequency and Timing for Example Parameters
Slide Number 54
Slide Number 55
Slide Number 56
Slide Number 57
Slide Number 58
Slide Number 59
Slide Number 60
Slide Number 61
Slide Number 62
Slide Number 63
Slide Number 64
Slide Number 65
Slide Number 66
Slide Number 67
Slide Number 68
Slide Number 69
Slide Number 70
Slide Number 71
Slide Number 72
Slide Number 73
Slide Number 74
Slide Number 75
Slide Number 76
Precision DQOs Dealing with low-level concentrations
Slide Number 78
Slide Number 79
Slide Number 80
Slide Number 81
Slide Number 82
Documentation and Records ndash EPA Element 9
Slide Number 84
Slide Number 85
Slide Number 86
Slide Number 87
Slide Number 88
Slide Number 89
Slide Number 90
Slide Number 91
Slide Number 92
Slide Number 93
Slide Number 94
Slide Number 95
Slide Number 96
Slide Number 97
Slide Number 98
Slide Number 99
Slide Number 100
Deerfield River Watershed Association
10 Sampling Process Design
Sampling sites were selected to represent locations that receive heavy human use from swimmers boaters anglers and other contact recreational users
Samples will be collected bi-weekly from late June through early September (prime recreation period) between 10 AM and 1 PM Samplers will first fill out their field data sheet They will then collect a water sample away from the edge of the stream near the center of the stream (centroid of flow) and just below the surface following the MWWP protocol (available in the Appendix)
Samplers will place their samples immediately in a cooler with ice or frozen ice packs making sure the temperature in the cooler is at 4degC or lower Each sample bottle will be placed in an individual clean Ziploc bag to avoid cross contamination
Neponset River Watershed Association
B1 Sampling Process Design
The CWMN program is designed to develop and maintain a record of general water qualitythroughout the watershed Project goals include both evaluation of long-term changes over time across the watershed as a whole and the identification of pollution hotspots at a low order subwatershed scale
Routine sampling activities consist of collecting in-stream samples As discussed above routine sampling sites are divided among ldquoindicatorrdquo sites and ldquosubwatershed sitesrdquo in order to meet the dual objectives of the program Indicator sites are selected to be representative of overall water quality and are relatively unchanging over time to allow comparison to past and future investigations Sites have generally been selected at the downstream ends or key segmentation points of major subwatersheds and at or near locations where there is a longstanding data record
Neponset River Watershed Association
B1 Sampling Process Design ndash continued
Subwatershed sites are selected to provide higher spatial resolution along individual streams in an effort to bracket pollution sources and facilitate their identification and remediation Subwatershed sites make up roughly 60 of the overall number of sites and are more likely to change from year to year Subwatershed sites may be rotated through different watersheds over the course of several sampling seasons to provide detailed data on different subwatersheds over a period of years Specific sites are selected by the project manager on the basis of known or suspected problems or opportunities or to fill in a lack of detailed data in a specific area
Neponset River Watershed Association
B1 Sampling Process Design ndash continued
In addition to the routine sampling activities CWMN also encompasses follow up and special study sampling activities These are generally ldquoone-timerdquo investigations intended to zero in on pollution sources in a known or suspected problem areahellipSpecific sampling stations may be planned in advance or may be chosen opportunistically by samplers while in the field
The mix of parameters sampled at each site depends on its status as an indicator subwatershed or follow up station the relative location of the station in the watershed and the specific pollutant(s) of concern at that specific location Indicator sites are tested for bacteria nutrients ammonia and field measured parametershellip Subwatershed sites are generally tested for bacteria total phosphorus and field measured parameters At some subwatershed sites hellip Follow up sampling stations will generally be tested for a very narrow set of parameters based on the specific pollutant of concern A listing of current routine sampling stations and the parameters sampled is provided in the Appendix 1e
Sampling Methods Requirements - EPA Element 11
This section describes your field measurementsample collection methods It can be stated in table form with narrative descriptions if you choose
Includebull What parameters are being sampledbull Sampling containersdevices sample preservation steps Maximum holding timebull Amount of sample to be collectedbull Summarize steps taken by field samplersbull Reference to the method followed (cite specific SOPS include in appendices)bull Can also include sampling considerations (eg time of day steps taken to avoid stirring up
sediments sample collection depth etc) These will be detailed in SOPs
Deerfield River Watershed Association
ParameterMeasure Container Field Rinse Preservation Hold Time E coli 120 mL IDEXX
Cool to lt4degC 6 hours to lab 8 hours to processing
B2 Sampling Methods
B2-2 Visual ObservationsB2-3 Fecal Coliform E coli and EnterococcusB2-5 NutrientsB2-6 Specific Conductance and SalinityB2-7 TemperatureB2-8 pH B2-9 Dissolved OxygenB2-10 SurfactantsB2-11 Depth and FlowB2-12 Optical BrightenersB2-13 Qualitative Ammonia Nitrogen
Neponset River Watershed Association
Sample Handling and Custody Requirements - EPA Element 12
Demonstrate that your sampling handling and storage techniques will retainsafeguard the integrity of your samples and data records
12 Sample Handling and Custody Procedures
Samples will be collected between 7 AM and 10 AM on sampling days The samples will be kept on ice inside a cooler during transport Wilmington VT area samples will be picked up by the monitoring assistant in the Main Street parking lots or other agreed upon meeting location by 9 AM Green River VT samples will be picked up by the transporting volunteer at the Green River covered bridge or other agreed upon meeting location by 930 AM The remaining samples will be delivered directly to the CRC water quality lab by 10 AM Any exchange of possession in the samples will be documented on the Chain of Custody (CoC) form which will be completed and signed by the Lab Analyst upon receipt at the lab The CoC form will be checked by the program coordinator See Appendix for the CoC
Deerfield River Watershed Association
Analytical Methods Requirements - EPA Element 13
Deerfield River Watershed Association
13 Analytical Methods Requirements
All analytical determinations will be performed at the CRC lab in Greenfield by the Lab Director Gabriel Chevalier
Indicator
Method Number
Source
Reporting Units
Modifications or Options
E coli
United water laboratory 1603 Bacteria Colilert SOP 604b CRWC 03-11-10
EPA 1603 (Modified m-TEC)
1 MPN
Sodium Thiosulfate used in all containers
Neponset River Watershed Association
Massachusetts Volunteer Monitorrsquos Guide to QAPP DevelopmentPAGE 61
Here are some things to consider in choosing a method Scientific Considerations Does it meet your data quality objectives
How accurate is it How precise (reproducible) is it What is its detection limit
Will it measure the indicator in the range that you need What lab facilities are required What equipment is required Does it yield samples that are representative Is it comparable to methods used by agencies collecting similar information
Practical and Program Considerations bull Do you have the human and financial resources to do it bull How difficult is it bull How time-consuming is it bull Will it produce data useful to the target audience
Quality Control ndash EPA Element 14
This section documents that the specific quality control measures you will take will allow you to determine whether you meet your data quality objectives
What To Include Section 7 stated your DQOs Here you describe how you are going to meet them
For each indicator include the following information
bull Accuracy Precision checks list what checks you will perform
bull List the of your samples upon which you will perform quality checks that will represent the quality of all your samples
Quality Control
Accuracy checks
There are a variety of ways to check the accuracy of your sampling and analysis
Checks can be done internally (done totally within your project lab) or externally (done with the assistance of an independent lab)
Known Samples This is an internal check that compares your results against another analyst or a ldquoknownrdquo An example of a known is a quality assurance sample that UMass WRRC sends to VM groups for pH DO or alkalinity ndash with the expected value communicated when sample is sent
Proficiency Testing (Unknown) Samples In some cases there are programs that provide proficiency testing samples for laboratory performance evaluation the concentrations of which are known to the auditor but not to the lab being tested This is relatively common for most water chemistry indicators An example of an unknown would when WRRC sends a quality assurance sample without communicating the expected value in advance
Quality Control
Accuracy checks - continued
Blank and Positive Plates Bacteriological samples should be checked using the blank and positive plate procedure The blank plate uses the rinse water media and equipment in the analysis to determine if there is contamination in the laboratory materials The result should be 0 The positive plate procedure uses a sample known to contain bacteria (eg waste- water treatment plant influent) to determine if a procedural error in the lab causes inhibition of bacterial growth Results should be rdquoToo Numerous To Countrdquo Each batch of samples should include at least one blank and one positive check sample This is an internal check
Spiked Samples Spikes are additions of a known amount of the indicator with the expectation that subsequent analysis will measure exactly that much increase over the un- spiked sample This procedure is described in Section 1020 B of Standard Methods This is an internal check
Voucher and Reference Collections For macroinvertebrates and aquatic plants maintenance of a voucher andor a working reference collection is recommended A voucher collection is a preserved collection of the type specimens ie an example of each of the individual taxa that you have given a name It should be maintained in archival condition by a trained curator typically found at a university A reference collection is an exact duplicate of the voucher collection but is the one that you will regularly use as a reference when identifying new specimens Both voucher and reference collections should be verified by an expert This is an external check Alternatively have an expert review IDs made by volunteers of at least 10 of specimens collected 90 accuracy is recommended
Quality Control
Precision Checks
Precision checks are primarily accomplished through replicate sampling amp analysis in the field and lab
Field Replication Replication can be done by the same field collectors but some replication by other collectors is good eg a pair of field collectors swapping roles or have different team collect the replicate This is an internal check
Lab Replication Additional replication should occur in the lab Lab replication is done by dividing a well-mixed sample into two or more aliquots and conducting analysis on each aliquot This is an internal check
Split Samples Split samples (a sample that is split into two sub-samples) can be done in the field or the lab
Relative Percent Difference
A measure of precision used for duplicate sample results It is calculated by dividing the difference between the two results by the mean of the two results expressed as a percentage Used when sample number equals two
eg ((98-92) 100) ((98+92))2 = 63
Deerfield River Watershed Association
14 Quality Control RequirementsA Volunteers Check - Field AuditEither the QC Officer the Project Coordinator or both will accompany a crew of volunteers (each) to their site each collection The trainers will observe the volunteersrsquo performance and check their sampling technique and field data sheets for accuracy
B Field QC ChecksAt least one Field Duplicate and one Field Blank will be submitted for every ten samples collected
Field Duplicate ndash a check on water quality sampling amp analysis consistency This is a replicated sample collected at the same point in time and space side by side with the first sampling and given a separate Sample ID number
Field Blanks ndash a check for contamination (AccuracyBias) in the field by processing laboratory-supplied deionized water through the sampling train This checks for contamination introduced from the sample container(s) or from field contamination A Field Blank will be taken by one volunteer at one site per sampling day for bacteria A container of DI water will be given to the volunteer who will pour this DI water into the sample bottle at the site
We will rotate the field duplicate and field blank samples among the volunteers throughout the sampling season so a maximum of collectors can be checked
Deerfield River Watershed Association
14 Quality Control Requirements ndash continued
C Laboratory QC ChecksA Lab Duplicate will be analyzed each sampling day The lab will split a randomly chosen sample and analyze both subsamples
The lab will run a Lab Blank and a Positive Sample for bacteria each collection (see section 7)
D Data Analysis QC ChecksRiver data and QC data will be reviewed by the QC Officer as soon as they come in from the lab after each collection QC data will be compared to the quality objectives (eg blanks should have zero colonies sample duplicates should be within 3 standard deviations of the mean positives should show bacterial growth etc) River data will be reviewed as well to ensurethat no field or lab contamination has occurred (data will be compared to those of other sites and of previous collections)
Bacteria computations will be checked and validated If discrepancies are found the Lab Director will be called to resolve the discrepancy and corrections will be made by the QC Officer
Field data sheets will be also reviewed the day of collection by the Project Coordinator and later by the QC Officer to ensure that samples were taken at the right times and that all the required information has been filled out The Project Coordinator or collectors will be called if omissions or errors are detected If needed corrections will be made (signed anddated) on the field sheet by the QC Officer
Neponset River Watershed Association
PRECISION DQOS DEALING WITH LOW-LEVEL CONCENTRATIONS
Source Analyte Units PrecisionMassDEP WPP Monitoring QAPP
Training Requirements Certification ndash EPA Element 8
In Narrative or Table Format
bull List type of training (eg Field WQ lab analysis visual observation data mgt data entry etc)
bull Who is training who receives training
bull How often training done
If training records are kept (they should be) include that in section 9 on documentation and records
Neponset River Watershed Association
A8 Training - ExcerptTo ensure the high quality and usability of the data that is generated by the CWMN program all participants receive training appropriate to the tasks for which they will be responsible NepRWA staff that are involved in the program are professionals with extensive training in water quality chemistry biology and field sampling NepRWA has established a program of training for volunteers that includes initial training follow-up and refresher classes These classes are given by NepRWA staff that are qualified not only in the technical matter covered but in training and education
The initial training for volunteer monitors is primarily instruction and demonstration by the trainer with repetition by the volunteer This training includes an overview of the entire project and detailed instruction in sampling procedures All monitors receive and review a copy of NepRWArsquos Water Monitoring and Sampling Manual (see Appendix 3a)
After their initial training all volunteers participate in a mandatory annual group andor individual training session These sessions are designed to update the volunteers on changes in the program further train them in equipment calibration and field-testing procedures and evaluate each volunteerrsquos performancehellip
InstrumentEquipment Testing Inspection and Maintenance Requirements ndash EPA Element 15
Instrument Calibration and Frequency ndash EPA Element 16
InspectionAcceptance Requirements for Supplies ndash EPA Element 17
DOCUMENTATION AND RECORDS ndash EPA ELEMENT 9
Neponset River Watershed AssociationA9 Documents and RecordsA9-1 Data SheetsField data sheets include information about the site location (NepRWA ID number) which specific equipment was used to make measurements (thermometer number) the sampling method used (direct fill pole or Bridge Buddy) and equipment calibration results The field data sheets are also used to record temperature velocity depth color odor and turbidity information (Appendix 4e)helliphellip See Appendix 4 for copies of the various data sheets used in the CWMN program
A9-2 Chain of Custody FormsA9-3 Sample LabelingA9-4 Equipment Custody FormA9-5 Training and Evaluation Form
Data Acquisition Requirements - EPA Element 18
Purpose To ensure that any data you use but donrsquot collect yourself has a known data quality and is consistent with your data quality objectives that others can access these data and that your use of the data is appropriate
Describe any external data you use such as GPS coordinates for site locations weather station rainfall amounts etc
Include bull The title of the document or name of the informationbull Where you obtained it and where others may find itbull Notes on the quality of the outside information such as uncertainties and caveats
Preamble to Elements 19 through 24
Consider the four separate objectives of these chapters1) Producing a good data set - 19 covers the normal data mgt routines you do to prevent data mistakes in the first place- 22 amp23 describe how you review the resulting data sets - how you find and correct
missing or erroneous data - 19 22 and 23 should produce as complete amp accurate a data set as possible 2) Ensuring that any use you make of your data is justified In 24 you decide how usable your data are Review the final data set that the above efforts have produced Compare it with your DQOs to determine whether you have to discard or qualify any data what conclusions you can draw from your data or what changes you might need to make in your DQOs3) Improve overall project performance 20 deals with how well volunteers laboratories and equipment are operating It looks at function not outcomes Who evaluates the various components of your program when problems are found what corrections are made to make your program run better4) Report your results After yoursquove run these various checks you are ready to release your data In Chapter 21 you describe the reports you will issue
Suggested order bull Data Management (19)bull Data Review Validation and Verification Requirements (22)bull (Data) Validation and Verification Methods (23)
bull Reconciliation with Data Quality Objectives (24)
bull Assessment and Response Actions (20)
bull Reports (21)
EPA Elements 19 ndash 24
bull Data Management (19)bull Assessment and Response Actions (20) bull Reports (21)bull Data Review Validation and Verification Requirements (22)bull (Data) Validation and Verification Methods (23)bull Reconciliation with Data Quality Objectives (24)
Data Management ndash EPA Element 19
Follow the data from the moment itrsquos recorded through every step to final report databaseIntent is to prevent errors or loss of data or be able to correct in timely manner
bull Before each activitystep is conducted well-designed field sheets checklists COC forms data entry software auto-QC calculations out-of-bounds highlights etc
bull During each step sheets filled completely checklist reviewed before leaving site etc
bull Immediately after Computer-entered data compared with field sheets etc
bull Long term preservation Data storage
Neponset River Watershed Association
B9 Data ManagementThe Project Manager is responsible for overseeing all data management activities Refer also to section D below for additional discussion of data review verification and validation practices
B9-1 Raw DataField data sheets are collected with the samples The sheets are turned into the NepRWA office by the site coordinators The forms are then reviewed for illegible answers errors or questionable values and checked for consistency with the COC and bottle labels as described in Appendix 3l Any questions are referred to the volunteer for clarification NepRWA staff makes corrections by crossing out the errors and writing in the correct answer All corrections must be initialed
B9-2 Data Entry and ValidationOnce the information has undergone a preliminary check it is entered into a Filemaker database The software has been customized to the data sheet Fields within the worksheet have been set-up with limits based on expected results This helps to minimize entry errors Entered data is then checked against the data sheets by another volunteer or staff person
B9-3 Data StorageThe original data sheets are filed into an event file and stored in NepRWArsquos permanent files Electronic copies of data are maintained on a secure Filemaker server Data files are kept in perpetuity along with hard copies of volunteer data sheets All electronic data is backed-up daily on to a password-protected hard drive
Data Review Validation and Verificationndash EPA Element 22
(Data) Validation and Verification Methods ndash EPA Element 23
Deerfield River Watershed Association
22 Data Review Validation and Verification ndash Summarized bullet list
All data reviewed by the Project Coordinator and QA Coordinator
Data Analysis QC Checks will includebull Data entry checks by a second personbull Computer entries compared with fieldlab sheetsbull Checks on graphs amp all other data representationsbull Calculation of measures of data quality including completeness
Corrective actionsbull Data entry errors corrected bull Data outside expected range flagged or rejected bull 2nd field sample andor laboratory aliquot taken when possiblebull Data quality problems discussed in draft and final reports
(Data) Validation and Verification Methods ndash EPA Element 23 From Inland QAPP
Validation and Verification Methods will include checks on bull Completion of all fields on data sheets missing data sheetsbull Completeness of sampling runs (eg number of sites visitedsamples taken vs number proposed were all parameters sampledanalyzed)bull Completeness of QC checks (eg number and type of QC checks performed vs numbertype proposed)bull Accuracy and precision compared to data quality objectivesbull Representativeness of samples and resulting data by examining survey metadata for unusual conditions and occurrences that may have impacted the validity of results
Deerfield River Watershed Association ndash Excerpt summarized
23 Validation and Verification Methods
The following simple measures of data quality will be calculated and included in the final report
1) To screen for contamination the average blank concentration hellip will be calculated This average value should be as close as practical to the Reporting Limit listed in Table 4
2) To assess the precision of results the ldquoMean Relative Percent Differencerdquo between field duplicate samples should be calculated The average RPD should be less than or equal to the Estimated Precision listed in Table 4 This simple measure is calculated as follows
RPD formula used hellip
Reconciliation With Data Quality Objectives ndash EPA Element 24MassWWP guide to QAPP development
What to Include bull List who will evaluate your actual data vs your data quality goals bull State how and when this will be done bull Describe the process for determining what to do if goals are not met
Neponset River Watershed Association
D2 Reconciliation with User Requirements - Summarized bulletedbull Following each sampling event and prior to the subsequent event calculations and
determinations for precision completeness and accuracy will be made bull Any corrective action will be implemented noted and initialized by the project manager bull If data quality indicators do not meet the projectrsquos specifications then data may be discarded
may be flagged or re-sampling may occur bull Investigation of problems will take place and corrections will be documented If equipment
failure is found to be the cause calibration and maintenance techniques will be reassessed Field duplicate testing may occur during the next sampling event to ensure confidence in the results
bull Any limitations on the data will be noted bull Any revisions to the project will be submitted to EPA and DEP quality assurance officers for
approval
Assessment and Response Actions - EPA Element 20 From Inland QAPP
Document that the progress and quality of the monitoring program will be continuously assessed to ensure that its objectives are being accomplished
The Monitoring Coordinator will periodically check to see the following bull Monitoring is occurring as planned bull Sufficient written commentary and supporting photographs exist bull Sufficient volunteers are available bull Volunteers have been observed as they sample their sites bull Samplers are collecting in accordance with project schedules bull Data sheets and custody control sheets are being properly completed and signed bull Data are properly interpreted bull Plans for dealing with adverse weather are in place
Assessment and Response Actions - EPA Element 20 From Inland QAPP ndash continued
The Monitoring Coordinator will periodically check to see the following bull Retraining or other corrective action is implemented at the first hint of non compliance with the
QAPP or SOPs bull Labs are adhering to the requirements of their QAPP in terms of work performed accuracy
acceptable holding times timely and understandable results and delivery process bull Data management is being handled properly ie data are entered on a timely basis is
properly backed up is easily accessed and raw data are properly stored in a safe placebull Procedure for developing and reporting the results exists
Assessment and Response Actions - EPA Element 20 From Inland QAPP ndash continued
The Monitoring Coordinator will confer with the QA Officer as necessary to discuss any problems that occur and what corrective actions are needed to maintain program integrity In addition the Monitoring Coordinator and QA Officer will meet at the end of the sampling season to review the draft report and discuss all aspects of the program and identify necessary program modifications for future sampling activities [If the program includes a technical advisory committee the TAC will be included in these discussions] Corrections may include retraining volunteers rewriting sampling instructions replacement of volunteers alteration of sampling schedules sites or methods or other actions deemed necessary All problems discovered and program modifications made will be documented in the final version of the project report If modifications require changes in the Quality Assurance Project Plan these changes will be submitted MassDEP for review
Deerfield River Watershed Association
20 Assessment and Response Actions ndash Summarized bullet list
bull There will be an on-site visit by the Quality Control Officer to observe field sampling and field analysis procedures Generally this will be done near the beginning of the project
bull A written checklist will be used for the assessments maintained by the Project Coordinator and copies will be provided with the data report
bull The Project Coordinator and QC Officer will determine if field work follows the written procedures or if there needs to be corrections by additional training or revising protocols
bull Please refer to Section 22 for additional evaluations and response actions regarding data evaluations
Reports ndash EPA Element 21
Project Task Organization ndash EPA Element 4 Reviewrevise early choices
Distribution List ndash EPA Element 3
Title and Approval Page - EPA Element 1
Table of Contents ndash EPA Element 2
Water quality monitoring quality assurance workshop
Terminology
Study design
QAPP
sampling and analysis plan
standard operating procedures
data quality objectives
Water Quality Monitoring Planning Process
Monitoring program activities
Why do you need (who Gives) a qapp
Slide Number 11
Slide Number 12
Steps to Developing a QAPP
Slide Number 14
Slide Number 15
Slide Number 16
Steps to Developing a QAPP
Slide Number 18
Slide Number 19
Slide Number 20
Slide Number 21
Slide Number 22
Slide Number 23
Slide Number 24
Sources of Information About Massachusetts Waters
Slide Number 26
Slide Number 27
Slide Number 28
Slide Number 29
Slide Number 30
Slide Number 31
Slide Number 32
Slide Number 33
Slide Number 34
Slide Number 35
Slide Number 36
Slide Number 37
Slide Number 38
Slide Number 39
Slide Number 40
Slide Number 41
Slide Number 42
Slide Number 43
Slide Number 44
Slide Number 45
Slide Number 46
MassDEP - Recommended Minimum Sample Number Frequency and Timing for Example Parameters
Slide Number 48
Slide Number 49
Slide Number 50
Slide Number 51
Slide Number 52
MaDep - Recommended Minimum Sample Number Frequency and Timing for Example Parameters
Slide Number 54
Slide Number 55
Slide Number 56
Slide Number 57
Slide Number 58
Slide Number 59
Slide Number 60
Slide Number 61
Slide Number 62
Slide Number 63
Slide Number 64
Slide Number 65
Slide Number 66
Slide Number 67
Slide Number 68
Slide Number 69
Slide Number 70
Slide Number 71
Slide Number 72
Slide Number 73
Slide Number 74
Slide Number 75
Slide Number 76
Precision DQOs Dealing with low-level concentrations
Slide Number 78
Slide Number 79
Slide Number 80
Slide Number 81
Slide Number 82
Documentation and Records ndash EPA Element 9
Slide Number 84
Slide Number 85
Slide Number 86
Slide Number 87
Slide Number 88
Slide Number 89
Slide Number 90
Slide Number 91
Slide Number 92
Slide Number 93
Slide Number 94
Slide Number 95
Slide Number 96
Slide Number 97
Slide Number 98
Slide Number 99
Slide Number 100
Neponset River Watershed Association
B1 Sampling Process Design ndash continued
In addition to the routine sampling activities CWMN also encompasses follow up and special study sampling activities These are generally ldquoone-timerdquo investigations intended to zero in on pollution sources in a known or suspected problem areahellipSpecific sampling stations may be planned in advance or may be chosen opportunistically by samplers while in the field
The mix of parameters sampled at each site depends on its status as an indicator subwatershed or follow up station the relative location of the station in the watershed and the specific pollutant(s) of concern at that specific location Indicator sites are tested for bacteria nutrients ammonia and field measured parametershellip Subwatershed sites are generally tested for bacteria total phosphorus and field measured parameters At some subwatershed sites hellip Follow up sampling stations will generally be tested for a very narrow set of parameters based on the specific pollutant of concern A listing of current routine sampling stations and the parameters sampled is provided in the Appendix 1e
Sampling Methods Requirements - EPA Element 11
This section describes your field measurementsample collection methods It can be stated in table form with narrative descriptions if you choose
Includebull What parameters are being sampledbull Sampling containersdevices sample preservation steps Maximum holding timebull Amount of sample to be collectedbull Summarize steps taken by field samplersbull Reference to the method followed (cite specific SOPS include in appendices)bull Can also include sampling considerations (eg time of day steps taken to avoid stirring up
sediments sample collection depth etc) These will be detailed in SOPs
Deerfield River Watershed Association
ParameterMeasure Container Field Rinse Preservation Hold Time E coli 120 mL IDEXX
Cool to lt4degC 6 hours to lab 8 hours to processing
B2 Sampling Methods
B2-2 Visual ObservationsB2-3 Fecal Coliform E coli and EnterococcusB2-5 NutrientsB2-6 Specific Conductance and SalinityB2-7 TemperatureB2-8 pH B2-9 Dissolved OxygenB2-10 SurfactantsB2-11 Depth and FlowB2-12 Optical BrightenersB2-13 Qualitative Ammonia Nitrogen
Neponset River Watershed Association
Sample Handling and Custody Requirements - EPA Element 12
Demonstrate that your sampling handling and storage techniques will retainsafeguard the integrity of your samples and data records
12 Sample Handling and Custody Procedures
Samples will be collected between 7 AM and 10 AM on sampling days The samples will be kept on ice inside a cooler during transport Wilmington VT area samples will be picked up by the monitoring assistant in the Main Street parking lots or other agreed upon meeting location by 9 AM Green River VT samples will be picked up by the transporting volunteer at the Green River covered bridge or other agreed upon meeting location by 930 AM The remaining samples will be delivered directly to the CRC water quality lab by 10 AM Any exchange of possession in the samples will be documented on the Chain of Custody (CoC) form which will be completed and signed by the Lab Analyst upon receipt at the lab The CoC form will be checked by the program coordinator See Appendix for the CoC
Deerfield River Watershed Association
Analytical Methods Requirements - EPA Element 13
Deerfield River Watershed Association
13 Analytical Methods Requirements
All analytical determinations will be performed at the CRC lab in Greenfield by the Lab Director Gabriel Chevalier
Indicator
Method Number
Source
Reporting Units
Modifications or Options
E coli
United water laboratory 1603 Bacteria Colilert SOP 604b CRWC 03-11-10
EPA 1603 (Modified m-TEC)
1 MPN
Sodium Thiosulfate used in all containers
Neponset River Watershed Association
Massachusetts Volunteer Monitorrsquos Guide to QAPP DevelopmentPAGE 61
Here are some things to consider in choosing a method Scientific Considerations Does it meet your data quality objectives
How accurate is it How precise (reproducible) is it What is its detection limit
Will it measure the indicator in the range that you need What lab facilities are required What equipment is required Does it yield samples that are representative Is it comparable to methods used by agencies collecting similar information
Practical and Program Considerations bull Do you have the human and financial resources to do it bull How difficult is it bull How time-consuming is it bull Will it produce data useful to the target audience
Quality Control ndash EPA Element 14
This section documents that the specific quality control measures you will take will allow you to determine whether you meet your data quality objectives
What To Include Section 7 stated your DQOs Here you describe how you are going to meet them
For each indicator include the following information
bull Accuracy Precision checks list what checks you will perform
bull List the of your samples upon which you will perform quality checks that will represent the quality of all your samples
Quality Control
Accuracy checks
There are a variety of ways to check the accuracy of your sampling and analysis
Checks can be done internally (done totally within your project lab) or externally (done with the assistance of an independent lab)
Known Samples This is an internal check that compares your results against another analyst or a ldquoknownrdquo An example of a known is a quality assurance sample that UMass WRRC sends to VM groups for pH DO or alkalinity ndash with the expected value communicated when sample is sent
Proficiency Testing (Unknown) Samples In some cases there are programs that provide proficiency testing samples for laboratory performance evaluation the concentrations of which are known to the auditor but not to the lab being tested This is relatively common for most water chemistry indicators An example of an unknown would when WRRC sends a quality assurance sample without communicating the expected value in advance
Quality Control
Accuracy checks - continued
Blank and Positive Plates Bacteriological samples should be checked using the blank and positive plate procedure The blank plate uses the rinse water media and equipment in the analysis to determine if there is contamination in the laboratory materials The result should be 0 The positive plate procedure uses a sample known to contain bacteria (eg waste- water treatment plant influent) to determine if a procedural error in the lab causes inhibition of bacterial growth Results should be rdquoToo Numerous To Countrdquo Each batch of samples should include at least one blank and one positive check sample This is an internal check
Spiked Samples Spikes are additions of a known amount of the indicator with the expectation that subsequent analysis will measure exactly that much increase over the un- spiked sample This procedure is described in Section 1020 B of Standard Methods This is an internal check
Voucher and Reference Collections For macroinvertebrates and aquatic plants maintenance of a voucher andor a working reference collection is recommended A voucher collection is a preserved collection of the type specimens ie an example of each of the individual taxa that you have given a name It should be maintained in archival condition by a trained curator typically found at a university A reference collection is an exact duplicate of the voucher collection but is the one that you will regularly use as a reference when identifying new specimens Both voucher and reference collections should be verified by an expert This is an external check Alternatively have an expert review IDs made by volunteers of at least 10 of specimens collected 90 accuracy is recommended
Quality Control
Precision Checks
Precision checks are primarily accomplished through replicate sampling amp analysis in the field and lab
Field Replication Replication can be done by the same field collectors but some replication by other collectors is good eg a pair of field collectors swapping roles or have different team collect the replicate This is an internal check
Lab Replication Additional replication should occur in the lab Lab replication is done by dividing a well-mixed sample into two or more aliquots and conducting analysis on each aliquot This is an internal check
Split Samples Split samples (a sample that is split into two sub-samples) can be done in the field or the lab
Relative Percent Difference
A measure of precision used for duplicate sample results It is calculated by dividing the difference between the two results by the mean of the two results expressed as a percentage Used when sample number equals two
eg ((98-92) 100) ((98+92))2 = 63
Deerfield River Watershed Association
14 Quality Control RequirementsA Volunteers Check - Field AuditEither the QC Officer the Project Coordinator or both will accompany a crew of volunteers (each) to their site each collection The trainers will observe the volunteersrsquo performance and check their sampling technique and field data sheets for accuracy
B Field QC ChecksAt least one Field Duplicate and one Field Blank will be submitted for every ten samples collected
Field Duplicate ndash a check on water quality sampling amp analysis consistency This is a replicated sample collected at the same point in time and space side by side with the first sampling and given a separate Sample ID number
Field Blanks ndash a check for contamination (AccuracyBias) in the field by processing laboratory-supplied deionized water through the sampling train This checks for contamination introduced from the sample container(s) or from field contamination A Field Blank will be taken by one volunteer at one site per sampling day for bacteria A container of DI water will be given to the volunteer who will pour this DI water into the sample bottle at the site
We will rotate the field duplicate and field blank samples among the volunteers throughout the sampling season so a maximum of collectors can be checked
Deerfield River Watershed Association
14 Quality Control Requirements ndash continued
C Laboratory QC ChecksA Lab Duplicate will be analyzed each sampling day The lab will split a randomly chosen sample and analyze both subsamples
The lab will run a Lab Blank and a Positive Sample for bacteria each collection (see section 7)
D Data Analysis QC ChecksRiver data and QC data will be reviewed by the QC Officer as soon as they come in from the lab after each collection QC data will be compared to the quality objectives (eg blanks should have zero colonies sample duplicates should be within 3 standard deviations of the mean positives should show bacterial growth etc) River data will be reviewed as well to ensurethat no field or lab contamination has occurred (data will be compared to those of other sites and of previous collections)
Bacteria computations will be checked and validated If discrepancies are found the Lab Director will be called to resolve the discrepancy and corrections will be made by the QC Officer
Field data sheets will be also reviewed the day of collection by the Project Coordinator and later by the QC Officer to ensure that samples were taken at the right times and that all the required information has been filled out The Project Coordinator or collectors will be called if omissions or errors are detected If needed corrections will be made (signed anddated) on the field sheet by the QC Officer
Neponset River Watershed Association
PRECISION DQOS DEALING WITH LOW-LEVEL CONCENTRATIONS
Source Analyte Units PrecisionMassDEP WPP Monitoring QAPP
Training Requirements Certification ndash EPA Element 8
In Narrative or Table Format
bull List type of training (eg Field WQ lab analysis visual observation data mgt data entry etc)
bull Who is training who receives training
bull How often training done
If training records are kept (they should be) include that in section 9 on documentation and records
Neponset River Watershed Association
A8 Training - ExcerptTo ensure the high quality and usability of the data that is generated by the CWMN program all participants receive training appropriate to the tasks for which they will be responsible NepRWA staff that are involved in the program are professionals with extensive training in water quality chemistry biology and field sampling NepRWA has established a program of training for volunteers that includes initial training follow-up and refresher classes These classes are given by NepRWA staff that are qualified not only in the technical matter covered but in training and education
The initial training for volunteer monitors is primarily instruction and demonstration by the trainer with repetition by the volunteer This training includes an overview of the entire project and detailed instruction in sampling procedures All monitors receive and review a copy of NepRWArsquos Water Monitoring and Sampling Manual (see Appendix 3a)
After their initial training all volunteers participate in a mandatory annual group andor individual training session These sessions are designed to update the volunteers on changes in the program further train them in equipment calibration and field-testing procedures and evaluate each volunteerrsquos performancehellip
InstrumentEquipment Testing Inspection and Maintenance Requirements ndash EPA Element 15
Instrument Calibration and Frequency ndash EPA Element 16
InspectionAcceptance Requirements for Supplies ndash EPA Element 17
DOCUMENTATION AND RECORDS ndash EPA ELEMENT 9
Neponset River Watershed AssociationA9 Documents and RecordsA9-1 Data SheetsField data sheets include information about the site location (NepRWA ID number) which specific equipment was used to make measurements (thermometer number) the sampling method used (direct fill pole or Bridge Buddy) and equipment calibration results The field data sheets are also used to record temperature velocity depth color odor and turbidity information (Appendix 4e)helliphellip See Appendix 4 for copies of the various data sheets used in the CWMN program
A9-2 Chain of Custody FormsA9-3 Sample LabelingA9-4 Equipment Custody FormA9-5 Training and Evaluation Form
Data Acquisition Requirements - EPA Element 18
Purpose To ensure that any data you use but donrsquot collect yourself has a known data quality and is consistent with your data quality objectives that others can access these data and that your use of the data is appropriate
Describe any external data you use such as GPS coordinates for site locations weather station rainfall amounts etc
Include bull The title of the document or name of the informationbull Where you obtained it and where others may find itbull Notes on the quality of the outside information such as uncertainties and caveats
Preamble to Elements 19 through 24
Consider the four separate objectives of these chapters1) Producing a good data set - 19 covers the normal data mgt routines you do to prevent data mistakes in the first place- 22 amp23 describe how you review the resulting data sets - how you find and correct
missing or erroneous data - 19 22 and 23 should produce as complete amp accurate a data set as possible 2) Ensuring that any use you make of your data is justified In 24 you decide how usable your data are Review the final data set that the above efforts have produced Compare it with your DQOs to determine whether you have to discard or qualify any data what conclusions you can draw from your data or what changes you might need to make in your DQOs3) Improve overall project performance 20 deals with how well volunteers laboratories and equipment are operating It looks at function not outcomes Who evaluates the various components of your program when problems are found what corrections are made to make your program run better4) Report your results After yoursquove run these various checks you are ready to release your data In Chapter 21 you describe the reports you will issue
Suggested order bull Data Management (19)bull Data Review Validation and Verification Requirements (22)bull (Data) Validation and Verification Methods (23)
bull Reconciliation with Data Quality Objectives (24)
bull Assessment and Response Actions (20)
bull Reports (21)
EPA Elements 19 ndash 24
bull Data Management (19)bull Assessment and Response Actions (20) bull Reports (21)bull Data Review Validation and Verification Requirements (22)bull (Data) Validation and Verification Methods (23)bull Reconciliation with Data Quality Objectives (24)
Data Management ndash EPA Element 19
Follow the data from the moment itrsquos recorded through every step to final report databaseIntent is to prevent errors or loss of data or be able to correct in timely manner
bull Before each activitystep is conducted well-designed field sheets checklists COC forms data entry software auto-QC calculations out-of-bounds highlights etc
bull During each step sheets filled completely checklist reviewed before leaving site etc
bull Immediately after Computer-entered data compared with field sheets etc
bull Long term preservation Data storage
Neponset River Watershed Association
B9 Data ManagementThe Project Manager is responsible for overseeing all data management activities Refer also to section D below for additional discussion of data review verification and validation practices
B9-1 Raw DataField data sheets are collected with the samples The sheets are turned into the NepRWA office by the site coordinators The forms are then reviewed for illegible answers errors or questionable values and checked for consistency with the COC and bottle labels as described in Appendix 3l Any questions are referred to the volunteer for clarification NepRWA staff makes corrections by crossing out the errors and writing in the correct answer All corrections must be initialed
B9-2 Data Entry and ValidationOnce the information has undergone a preliminary check it is entered into a Filemaker database The software has been customized to the data sheet Fields within the worksheet have been set-up with limits based on expected results This helps to minimize entry errors Entered data is then checked against the data sheets by another volunteer or staff person
B9-3 Data StorageThe original data sheets are filed into an event file and stored in NepRWArsquos permanent files Electronic copies of data are maintained on a secure Filemaker server Data files are kept in perpetuity along with hard copies of volunteer data sheets All electronic data is backed-up daily on to a password-protected hard drive
Data Review Validation and Verificationndash EPA Element 22
(Data) Validation and Verification Methods ndash EPA Element 23
Deerfield River Watershed Association
22 Data Review Validation and Verification ndash Summarized bullet list
All data reviewed by the Project Coordinator and QA Coordinator
Data Analysis QC Checks will includebull Data entry checks by a second personbull Computer entries compared with fieldlab sheetsbull Checks on graphs amp all other data representationsbull Calculation of measures of data quality including completeness
Corrective actionsbull Data entry errors corrected bull Data outside expected range flagged or rejected bull 2nd field sample andor laboratory aliquot taken when possiblebull Data quality problems discussed in draft and final reports
(Data) Validation and Verification Methods ndash EPA Element 23 From Inland QAPP
Validation and Verification Methods will include checks on bull Completion of all fields on data sheets missing data sheetsbull Completeness of sampling runs (eg number of sites visitedsamples taken vs number proposed were all parameters sampledanalyzed)bull Completeness of QC checks (eg number and type of QC checks performed vs numbertype proposed)bull Accuracy and precision compared to data quality objectivesbull Representativeness of samples and resulting data by examining survey metadata for unusual conditions and occurrences that may have impacted the validity of results
Deerfield River Watershed Association ndash Excerpt summarized
23 Validation and Verification Methods
The following simple measures of data quality will be calculated and included in the final report
1) To screen for contamination the average blank concentration hellip will be calculated This average value should be as close as practical to the Reporting Limit listed in Table 4
2) To assess the precision of results the ldquoMean Relative Percent Differencerdquo between field duplicate samples should be calculated The average RPD should be less than or equal to the Estimated Precision listed in Table 4 This simple measure is calculated as follows
RPD formula used hellip
Reconciliation With Data Quality Objectives ndash EPA Element 24MassWWP guide to QAPP development
What to Include bull List who will evaluate your actual data vs your data quality goals bull State how and when this will be done bull Describe the process for determining what to do if goals are not met
Neponset River Watershed Association
D2 Reconciliation with User Requirements - Summarized bulletedbull Following each sampling event and prior to the subsequent event calculations and
determinations for precision completeness and accuracy will be made bull Any corrective action will be implemented noted and initialized by the project manager bull If data quality indicators do not meet the projectrsquos specifications then data may be discarded
may be flagged or re-sampling may occur bull Investigation of problems will take place and corrections will be documented If equipment
failure is found to be the cause calibration and maintenance techniques will be reassessed Field duplicate testing may occur during the next sampling event to ensure confidence in the results
bull Any limitations on the data will be noted bull Any revisions to the project will be submitted to EPA and DEP quality assurance officers for
approval
Assessment and Response Actions - EPA Element 20 From Inland QAPP
Document that the progress and quality of the monitoring program will be continuously assessed to ensure that its objectives are being accomplished
The Monitoring Coordinator will periodically check to see the following bull Monitoring is occurring as planned bull Sufficient written commentary and supporting photographs exist bull Sufficient volunteers are available bull Volunteers have been observed as they sample their sites bull Samplers are collecting in accordance with project schedules bull Data sheets and custody control sheets are being properly completed and signed bull Data are properly interpreted bull Plans for dealing with adverse weather are in place
Assessment and Response Actions - EPA Element 20 From Inland QAPP ndash continued
The Monitoring Coordinator will periodically check to see the following bull Retraining or other corrective action is implemented at the first hint of non compliance with the
QAPP or SOPs bull Labs are adhering to the requirements of their QAPP in terms of work performed accuracy
acceptable holding times timely and understandable results and delivery process bull Data management is being handled properly ie data are entered on a timely basis is
properly backed up is easily accessed and raw data are properly stored in a safe placebull Procedure for developing and reporting the results exists
Assessment and Response Actions - EPA Element 20 From Inland QAPP ndash continued
The Monitoring Coordinator will confer with the QA Officer as necessary to discuss any problems that occur and what corrective actions are needed to maintain program integrity In addition the Monitoring Coordinator and QA Officer will meet at the end of the sampling season to review the draft report and discuss all aspects of the program and identify necessary program modifications for future sampling activities [If the program includes a technical advisory committee the TAC will be included in these discussions] Corrections may include retraining volunteers rewriting sampling instructions replacement of volunteers alteration of sampling schedules sites or methods or other actions deemed necessary All problems discovered and program modifications made will be documented in the final version of the project report If modifications require changes in the Quality Assurance Project Plan these changes will be submitted MassDEP for review
Deerfield River Watershed Association
20 Assessment and Response Actions ndash Summarized bullet list
bull There will be an on-site visit by the Quality Control Officer to observe field sampling and field analysis procedures Generally this will be done near the beginning of the project
bull A written checklist will be used for the assessments maintained by the Project Coordinator and copies will be provided with the data report
bull The Project Coordinator and QC Officer will determine if field work follows the written procedures or if there needs to be corrections by additional training or revising protocols
bull Please refer to Section 22 for additional evaluations and response actions regarding data evaluations
Reports ndash EPA Element 21
Project Task Organization ndash EPA Element 4 Reviewrevise early choices
Distribution List ndash EPA Element 3
Title and Approval Page - EPA Element 1
Table of Contents ndash EPA Element 2
Water quality monitoring quality assurance workshop
Terminology
Study design
QAPP
sampling and analysis plan
standard operating procedures
data quality objectives
Water Quality Monitoring Planning Process
Monitoring program activities
Why do you need (who Gives) a qapp
Slide Number 11
Slide Number 12
Steps to Developing a QAPP
Slide Number 14
Slide Number 15
Slide Number 16
Steps to Developing a QAPP
Slide Number 18
Slide Number 19
Slide Number 20
Slide Number 21
Slide Number 22
Slide Number 23
Slide Number 24
Sources of Information About Massachusetts Waters
Slide Number 26
Slide Number 27
Slide Number 28
Slide Number 29
Slide Number 30
Slide Number 31
Slide Number 32
Slide Number 33
Slide Number 34
Slide Number 35
Slide Number 36
Slide Number 37
Slide Number 38
Slide Number 39
Slide Number 40
Slide Number 41
Slide Number 42
Slide Number 43
Slide Number 44
Slide Number 45
Slide Number 46
MassDEP - Recommended Minimum Sample Number Frequency and Timing for Example Parameters
Slide Number 48
Slide Number 49
Slide Number 50
Slide Number 51
Slide Number 52
MaDep - Recommended Minimum Sample Number Frequency and Timing for Example Parameters
Slide Number 54
Slide Number 55
Slide Number 56
Slide Number 57
Slide Number 58
Slide Number 59
Slide Number 60
Slide Number 61
Slide Number 62
Slide Number 63
Slide Number 64
Slide Number 65
Slide Number 66
Slide Number 67
Slide Number 68
Slide Number 69
Slide Number 70
Slide Number 71
Slide Number 72
Slide Number 73
Slide Number 74
Slide Number 75
Slide Number 76
Precision DQOs Dealing with low-level concentrations
Slide Number 78
Slide Number 79
Slide Number 80
Slide Number 81
Slide Number 82
Documentation and Records ndash EPA Element 9
Slide Number 84
Slide Number 85
Slide Number 86
Slide Number 87
Slide Number 88
Slide Number 89
Slide Number 90
Slide Number 91
Slide Number 92
Slide Number 93
Slide Number 94
Slide Number 95
Slide Number 96
Slide Number 97
Slide Number 98
Slide Number 99
Slide Number 100
Deerfield River Watershed Association
ParameterMeasure Container Field Rinse Preservation Hold Time E coli 120 mL IDEXX
Cool to lt4degC 6 hours to lab 8 hours to processing
B2 Sampling Methods
B2-2 Visual ObservationsB2-3 Fecal Coliform E coli and EnterococcusB2-5 NutrientsB2-6 Specific Conductance and SalinityB2-7 TemperatureB2-8 pH B2-9 Dissolved OxygenB2-10 SurfactantsB2-11 Depth and FlowB2-12 Optical BrightenersB2-13 Qualitative Ammonia Nitrogen
Neponset River Watershed Association
Sample Handling and Custody Requirements - EPA Element 12
Demonstrate that your sampling handling and storage techniques will retainsafeguard the integrity of your samples and data records
12 Sample Handling and Custody Procedures
Samples will be collected between 7 AM and 10 AM on sampling days The samples will be kept on ice inside a cooler during transport Wilmington VT area samples will be picked up by the monitoring assistant in the Main Street parking lots or other agreed upon meeting location by 9 AM Green River VT samples will be picked up by the transporting volunteer at the Green River covered bridge or other agreed upon meeting location by 930 AM The remaining samples will be delivered directly to the CRC water quality lab by 10 AM Any exchange of possession in the samples will be documented on the Chain of Custody (CoC) form which will be completed and signed by the Lab Analyst upon receipt at the lab The CoC form will be checked by the program coordinator See Appendix for the CoC
Deerfield River Watershed Association
Analytical Methods Requirements - EPA Element 13
Deerfield River Watershed Association
13 Analytical Methods Requirements
All analytical determinations will be performed at the CRC lab in Greenfield by the Lab Director Gabriel Chevalier
Indicator
Method Number
Source
Reporting Units
Modifications or Options
E coli
United water laboratory 1603 Bacteria Colilert SOP 604b CRWC 03-11-10
EPA 1603 (Modified m-TEC)
1 MPN
Sodium Thiosulfate used in all containers
Neponset River Watershed Association
Massachusetts Volunteer Monitorrsquos Guide to QAPP DevelopmentPAGE 61
Here are some things to consider in choosing a method Scientific Considerations Does it meet your data quality objectives
How accurate is it How precise (reproducible) is it What is its detection limit
Will it measure the indicator in the range that you need What lab facilities are required What equipment is required Does it yield samples that are representative Is it comparable to methods used by agencies collecting similar information
Practical and Program Considerations bull Do you have the human and financial resources to do it bull How difficult is it bull How time-consuming is it bull Will it produce data useful to the target audience
Quality Control ndash EPA Element 14
This section documents that the specific quality control measures you will take will allow you to determine whether you meet your data quality objectives
What To Include Section 7 stated your DQOs Here you describe how you are going to meet them
For each indicator include the following information
bull Accuracy Precision checks list what checks you will perform
bull List the of your samples upon which you will perform quality checks that will represent the quality of all your samples
Quality Control
Accuracy checks
There are a variety of ways to check the accuracy of your sampling and analysis
Checks can be done internally (done totally within your project lab) or externally (done with the assistance of an independent lab)
Known Samples This is an internal check that compares your results against another analyst or a ldquoknownrdquo An example of a known is a quality assurance sample that UMass WRRC sends to VM groups for pH DO or alkalinity ndash with the expected value communicated when sample is sent
Proficiency Testing (Unknown) Samples In some cases there are programs that provide proficiency testing samples for laboratory performance evaluation the concentrations of which are known to the auditor but not to the lab being tested This is relatively common for most water chemistry indicators An example of an unknown would when WRRC sends a quality assurance sample without communicating the expected value in advance
Quality Control
Accuracy checks - continued
Blank and Positive Plates Bacteriological samples should be checked using the blank and positive plate procedure The blank plate uses the rinse water media and equipment in the analysis to determine if there is contamination in the laboratory materials The result should be 0 The positive plate procedure uses a sample known to contain bacteria (eg waste- water treatment plant influent) to determine if a procedural error in the lab causes inhibition of bacterial growth Results should be rdquoToo Numerous To Countrdquo Each batch of samples should include at least one blank and one positive check sample This is an internal check
Spiked Samples Spikes are additions of a known amount of the indicator with the expectation that subsequent analysis will measure exactly that much increase over the un- spiked sample This procedure is described in Section 1020 B of Standard Methods This is an internal check
Voucher and Reference Collections For macroinvertebrates and aquatic plants maintenance of a voucher andor a working reference collection is recommended A voucher collection is a preserved collection of the type specimens ie an example of each of the individual taxa that you have given a name It should be maintained in archival condition by a trained curator typically found at a university A reference collection is an exact duplicate of the voucher collection but is the one that you will regularly use as a reference when identifying new specimens Both voucher and reference collections should be verified by an expert This is an external check Alternatively have an expert review IDs made by volunteers of at least 10 of specimens collected 90 accuracy is recommended
Quality Control
Precision Checks
Precision checks are primarily accomplished through replicate sampling amp analysis in the field and lab
Field Replication Replication can be done by the same field collectors but some replication by other collectors is good eg a pair of field collectors swapping roles or have different team collect the replicate This is an internal check
Lab Replication Additional replication should occur in the lab Lab replication is done by dividing a well-mixed sample into two or more aliquots and conducting analysis on each aliquot This is an internal check
Split Samples Split samples (a sample that is split into two sub-samples) can be done in the field or the lab
Relative Percent Difference
A measure of precision used for duplicate sample results It is calculated by dividing the difference between the two results by the mean of the two results expressed as a percentage Used when sample number equals two
eg ((98-92) 100) ((98+92))2 = 63
Deerfield River Watershed Association
14 Quality Control RequirementsA Volunteers Check - Field AuditEither the QC Officer the Project Coordinator or both will accompany a crew of volunteers (each) to their site each collection The trainers will observe the volunteersrsquo performance and check their sampling technique and field data sheets for accuracy
B Field QC ChecksAt least one Field Duplicate and one Field Blank will be submitted for every ten samples collected
Field Duplicate ndash a check on water quality sampling amp analysis consistency This is a replicated sample collected at the same point in time and space side by side with the first sampling and given a separate Sample ID number
Field Blanks ndash a check for contamination (AccuracyBias) in the field by processing laboratory-supplied deionized water through the sampling train This checks for contamination introduced from the sample container(s) or from field contamination A Field Blank will be taken by one volunteer at one site per sampling day for bacteria A container of DI water will be given to the volunteer who will pour this DI water into the sample bottle at the site
We will rotate the field duplicate and field blank samples among the volunteers throughout the sampling season so a maximum of collectors can be checked
Deerfield River Watershed Association
14 Quality Control Requirements ndash continued
C Laboratory QC ChecksA Lab Duplicate will be analyzed each sampling day The lab will split a randomly chosen sample and analyze both subsamples
The lab will run a Lab Blank and a Positive Sample for bacteria each collection (see section 7)
D Data Analysis QC ChecksRiver data and QC data will be reviewed by the QC Officer as soon as they come in from the lab after each collection QC data will be compared to the quality objectives (eg blanks should have zero colonies sample duplicates should be within 3 standard deviations of the mean positives should show bacterial growth etc) River data will be reviewed as well to ensurethat no field or lab contamination has occurred (data will be compared to those of other sites and of previous collections)
Bacteria computations will be checked and validated If discrepancies are found the Lab Director will be called to resolve the discrepancy and corrections will be made by the QC Officer
Field data sheets will be also reviewed the day of collection by the Project Coordinator and later by the QC Officer to ensure that samples were taken at the right times and that all the required information has been filled out The Project Coordinator or collectors will be called if omissions or errors are detected If needed corrections will be made (signed anddated) on the field sheet by the QC Officer
Neponset River Watershed Association
PRECISION DQOS DEALING WITH LOW-LEVEL CONCENTRATIONS
Source Analyte Units PrecisionMassDEP WPP Monitoring QAPP
Training Requirements Certification ndash EPA Element 8
In Narrative or Table Format
bull List type of training (eg Field WQ lab analysis visual observation data mgt data entry etc)
bull Who is training who receives training
bull How often training done
If training records are kept (they should be) include that in section 9 on documentation and records
Neponset River Watershed Association
A8 Training - ExcerptTo ensure the high quality and usability of the data that is generated by the CWMN program all participants receive training appropriate to the tasks for which they will be responsible NepRWA staff that are involved in the program are professionals with extensive training in water quality chemistry biology and field sampling NepRWA has established a program of training for volunteers that includes initial training follow-up and refresher classes These classes are given by NepRWA staff that are qualified not only in the technical matter covered but in training and education
The initial training for volunteer monitors is primarily instruction and demonstration by the trainer with repetition by the volunteer This training includes an overview of the entire project and detailed instruction in sampling procedures All monitors receive and review a copy of NepRWArsquos Water Monitoring and Sampling Manual (see Appendix 3a)
After their initial training all volunteers participate in a mandatory annual group andor individual training session These sessions are designed to update the volunteers on changes in the program further train them in equipment calibration and field-testing procedures and evaluate each volunteerrsquos performancehellip
InstrumentEquipment Testing Inspection and Maintenance Requirements ndash EPA Element 15
Instrument Calibration and Frequency ndash EPA Element 16
InspectionAcceptance Requirements for Supplies ndash EPA Element 17
DOCUMENTATION AND RECORDS ndash EPA ELEMENT 9
Neponset River Watershed AssociationA9 Documents and RecordsA9-1 Data SheetsField data sheets include information about the site location (NepRWA ID number) which specific equipment was used to make measurements (thermometer number) the sampling method used (direct fill pole or Bridge Buddy) and equipment calibration results The field data sheets are also used to record temperature velocity depth color odor and turbidity information (Appendix 4e)helliphellip See Appendix 4 for copies of the various data sheets used in the CWMN program
A9-2 Chain of Custody FormsA9-3 Sample LabelingA9-4 Equipment Custody FormA9-5 Training and Evaluation Form
Data Acquisition Requirements - EPA Element 18
Purpose To ensure that any data you use but donrsquot collect yourself has a known data quality and is consistent with your data quality objectives that others can access these data and that your use of the data is appropriate
Describe any external data you use such as GPS coordinates for site locations weather station rainfall amounts etc
Include bull The title of the document or name of the informationbull Where you obtained it and where others may find itbull Notes on the quality of the outside information such as uncertainties and caveats
Preamble to Elements 19 through 24
Consider the four separate objectives of these chapters1) Producing a good data set - 19 covers the normal data mgt routines you do to prevent data mistakes in the first place- 22 amp23 describe how you review the resulting data sets - how you find and correct
missing or erroneous data - 19 22 and 23 should produce as complete amp accurate a data set as possible 2) Ensuring that any use you make of your data is justified In 24 you decide how usable your data are Review the final data set that the above efforts have produced Compare it with your DQOs to determine whether you have to discard or qualify any data what conclusions you can draw from your data or what changes you might need to make in your DQOs3) Improve overall project performance 20 deals with how well volunteers laboratories and equipment are operating It looks at function not outcomes Who evaluates the various components of your program when problems are found what corrections are made to make your program run better4) Report your results After yoursquove run these various checks you are ready to release your data In Chapter 21 you describe the reports you will issue
Suggested order bull Data Management (19)bull Data Review Validation and Verification Requirements (22)bull (Data) Validation and Verification Methods (23)
bull Reconciliation with Data Quality Objectives (24)
bull Assessment and Response Actions (20)
bull Reports (21)
EPA Elements 19 ndash 24
bull Data Management (19)bull Assessment and Response Actions (20) bull Reports (21)bull Data Review Validation and Verification Requirements (22)bull (Data) Validation and Verification Methods (23)bull Reconciliation with Data Quality Objectives (24)
Data Management ndash EPA Element 19
Follow the data from the moment itrsquos recorded through every step to final report databaseIntent is to prevent errors or loss of data or be able to correct in timely manner
bull Before each activitystep is conducted well-designed field sheets checklists COC forms data entry software auto-QC calculations out-of-bounds highlights etc
bull During each step sheets filled completely checklist reviewed before leaving site etc
bull Immediately after Computer-entered data compared with field sheets etc
bull Long term preservation Data storage
Neponset River Watershed Association
B9 Data ManagementThe Project Manager is responsible for overseeing all data management activities Refer also to section D below for additional discussion of data review verification and validation practices
B9-1 Raw DataField data sheets are collected with the samples The sheets are turned into the NepRWA office by the site coordinators The forms are then reviewed for illegible answers errors or questionable values and checked for consistency with the COC and bottle labels as described in Appendix 3l Any questions are referred to the volunteer for clarification NepRWA staff makes corrections by crossing out the errors and writing in the correct answer All corrections must be initialed
B9-2 Data Entry and ValidationOnce the information has undergone a preliminary check it is entered into a Filemaker database The software has been customized to the data sheet Fields within the worksheet have been set-up with limits based on expected results This helps to minimize entry errors Entered data is then checked against the data sheets by another volunteer or staff person
B9-3 Data StorageThe original data sheets are filed into an event file and stored in NepRWArsquos permanent files Electronic copies of data are maintained on a secure Filemaker server Data files are kept in perpetuity along with hard copies of volunteer data sheets All electronic data is backed-up daily on to a password-protected hard drive
Data Review Validation and Verificationndash EPA Element 22
(Data) Validation and Verification Methods ndash EPA Element 23
Deerfield River Watershed Association
22 Data Review Validation and Verification ndash Summarized bullet list
All data reviewed by the Project Coordinator and QA Coordinator
Data Analysis QC Checks will includebull Data entry checks by a second personbull Computer entries compared with fieldlab sheetsbull Checks on graphs amp all other data representationsbull Calculation of measures of data quality including completeness
Corrective actionsbull Data entry errors corrected bull Data outside expected range flagged or rejected bull 2nd field sample andor laboratory aliquot taken when possiblebull Data quality problems discussed in draft and final reports
(Data) Validation and Verification Methods ndash EPA Element 23 From Inland QAPP
Validation and Verification Methods will include checks on bull Completion of all fields on data sheets missing data sheetsbull Completeness of sampling runs (eg number of sites visitedsamples taken vs number proposed were all parameters sampledanalyzed)bull Completeness of QC checks (eg number and type of QC checks performed vs numbertype proposed)bull Accuracy and precision compared to data quality objectivesbull Representativeness of samples and resulting data by examining survey metadata for unusual conditions and occurrences that may have impacted the validity of results
Deerfield River Watershed Association ndash Excerpt summarized
23 Validation and Verification Methods
The following simple measures of data quality will be calculated and included in the final report
1) To screen for contamination the average blank concentration hellip will be calculated This average value should be as close as practical to the Reporting Limit listed in Table 4
2) To assess the precision of results the ldquoMean Relative Percent Differencerdquo between field duplicate samples should be calculated The average RPD should be less than or equal to the Estimated Precision listed in Table 4 This simple measure is calculated as follows
RPD formula used hellip
Reconciliation With Data Quality Objectives ndash EPA Element 24MassWWP guide to QAPP development
What to Include bull List who will evaluate your actual data vs your data quality goals bull State how and when this will be done bull Describe the process for determining what to do if goals are not met
Neponset River Watershed Association
D2 Reconciliation with User Requirements - Summarized bulletedbull Following each sampling event and prior to the subsequent event calculations and
determinations for precision completeness and accuracy will be made bull Any corrective action will be implemented noted and initialized by the project manager bull If data quality indicators do not meet the projectrsquos specifications then data may be discarded
may be flagged or re-sampling may occur bull Investigation of problems will take place and corrections will be documented If equipment
failure is found to be the cause calibration and maintenance techniques will be reassessed Field duplicate testing may occur during the next sampling event to ensure confidence in the results
bull Any limitations on the data will be noted bull Any revisions to the project will be submitted to EPA and DEP quality assurance officers for
approval
Assessment and Response Actions - EPA Element 20 From Inland QAPP
Document that the progress and quality of the monitoring program will be continuously assessed to ensure that its objectives are being accomplished
The Monitoring Coordinator will periodically check to see the following bull Monitoring is occurring as planned bull Sufficient written commentary and supporting photographs exist bull Sufficient volunteers are available bull Volunteers have been observed as they sample their sites bull Samplers are collecting in accordance with project schedules bull Data sheets and custody control sheets are being properly completed and signed bull Data are properly interpreted bull Plans for dealing with adverse weather are in place
Assessment and Response Actions - EPA Element 20 From Inland QAPP ndash continued
The Monitoring Coordinator will periodically check to see the following bull Retraining or other corrective action is implemented at the first hint of non compliance with the
QAPP or SOPs bull Labs are adhering to the requirements of their QAPP in terms of work performed accuracy
acceptable holding times timely and understandable results and delivery process bull Data management is being handled properly ie data are entered on a timely basis is
properly backed up is easily accessed and raw data are properly stored in a safe placebull Procedure for developing and reporting the results exists
Assessment and Response Actions - EPA Element 20 From Inland QAPP ndash continued
The Monitoring Coordinator will confer with the QA Officer as necessary to discuss any problems that occur and what corrective actions are needed to maintain program integrity In addition the Monitoring Coordinator and QA Officer will meet at the end of the sampling season to review the draft report and discuss all aspects of the program and identify necessary program modifications for future sampling activities [If the program includes a technical advisory committee the TAC will be included in these discussions] Corrections may include retraining volunteers rewriting sampling instructions replacement of volunteers alteration of sampling schedules sites or methods or other actions deemed necessary All problems discovered and program modifications made will be documented in the final version of the project report If modifications require changes in the Quality Assurance Project Plan these changes will be submitted MassDEP for review
Deerfield River Watershed Association
20 Assessment and Response Actions ndash Summarized bullet list
bull There will be an on-site visit by the Quality Control Officer to observe field sampling and field analysis procedures Generally this will be done near the beginning of the project
bull A written checklist will be used for the assessments maintained by the Project Coordinator and copies will be provided with the data report
bull The Project Coordinator and QC Officer will determine if field work follows the written procedures or if there needs to be corrections by additional training or revising protocols
bull Please refer to Section 22 for additional evaluations and response actions regarding data evaluations
Reports ndash EPA Element 21
Project Task Organization ndash EPA Element 4 Reviewrevise early choices
Distribution List ndash EPA Element 3
Title and Approval Page - EPA Element 1
Table of Contents ndash EPA Element 2
Water quality monitoring quality assurance workshop
Terminology
Study design
QAPP
sampling and analysis plan
standard operating procedures
data quality objectives
Water Quality Monitoring Planning Process
Monitoring program activities
Why do you need (who Gives) a qapp
Slide Number 11
Slide Number 12
Steps to Developing a QAPP
Slide Number 14
Slide Number 15
Slide Number 16
Steps to Developing a QAPP
Slide Number 18
Slide Number 19
Slide Number 20
Slide Number 21
Slide Number 22
Slide Number 23
Slide Number 24
Sources of Information About Massachusetts Waters
Slide Number 26
Slide Number 27
Slide Number 28
Slide Number 29
Slide Number 30
Slide Number 31
Slide Number 32
Slide Number 33
Slide Number 34
Slide Number 35
Slide Number 36
Slide Number 37
Slide Number 38
Slide Number 39
Slide Number 40
Slide Number 41
Slide Number 42
Slide Number 43
Slide Number 44
Slide Number 45
Slide Number 46
MassDEP - Recommended Minimum Sample Number Frequency and Timing for Example Parameters
Slide Number 48
Slide Number 49
Slide Number 50
Slide Number 51
Slide Number 52
MaDep - Recommended Minimum Sample Number Frequency and Timing for Example Parameters
Slide Number 54
Slide Number 55
Slide Number 56
Slide Number 57
Slide Number 58
Slide Number 59
Slide Number 60
Slide Number 61
Slide Number 62
Slide Number 63
Slide Number 64
Slide Number 65
Slide Number 66
Slide Number 67
Slide Number 68
Slide Number 69
Slide Number 70
Slide Number 71
Slide Number 72
Slide Number 73
Slide Number 74
Slide Number 75
Slide Number 76
Precision DQOs Dealing with low-level concentrations
Slide Number 78
Slide Number 79
Slide Number 80
Slide Number 81
Slide Number 82
Documentation and Records ndash EPA Element 9
Slide Number 84
Slide Number 85
Slide Number 86
Slide Number 87
Slide Number 88
Slide Number 89
Slide Number 90
Slide Number 91
Slide Number 92
Slide Number 93
Slide Number 94
Slide Number 95
Slide Number 96
Slide Number 97
Slide Number 98
Slide Number 99
Slide Number 100
Deerfield River Watershed Association
13 Analytical Methods Requirements
All analytical determinations will be performed at the CRC lab in Greenfield by the Lab Director Gabriel Chevalier
Indicator
Method Number
Source
Reporting Units
Modifications or Options
E coli
United water laboratory 1603 Bacteria Colilert SOP 604b CRWC 03-11-10
EPA 1603 (Modified m-TEC)
1 MPN
Sodium Thiosulfate used in all containers
Neponset River Watershed Association
Massachusetts Volunteer Monitorrsquos Guide to QAPP DevelopmentPAGE 61
Here are some things to consider in choosing a method Scientific Considerations Does it meet your data quality objectives
How accurate is it How precise (reproducible) is it What is its detection limit
Will it measure the indicator in the range that you need What lab facilities are required What equipment is required Does it yield samples that are representative Is it comparable to methods used by agencies collecting similar information
Practical and Program Considerations bull Do you have the human and financial resources to do it bull How difficult is it bull How time-consuming is it bull Will it produce data useful to the target audience
Quality Control ndash EPA Element 14
This section documents that the specific quality control measures you will take will allow you to determine whether you meet your data quality objectives
What To Include Section 7 stated your DQOs Here you describe how you are going to meet them
For each indicator include the following information
bull Accuracy Precision checks list what checks you will perform
bull List the of your samples upon which you will perform quality checks that will represent the quality of all your samples
Quality Control
Accuracy checks
There are a variety of ways to check the accuracy of your sampling and analysis
Checks can be done internally (done totally within your project lab) or externally (done with the assistance of an independent lab)
Known Samples This is an internal check that compares your results against another analyst or a ldquoknownrdquo An example of a known is a quality assurance sample that UMass WRRC sends to VM groups for pH DO or alkalinity ndash with the expected value communicated when sample is sent
Proficiency Testing (Unknown) Samples In some cases there are programs that provide proficiency testing samples for laboratory performance evaluation the concentrations of which are known to the auditor but not to the lab being tested This is relatively common for most water chemistry indicators An example of an unknown would when WRRC sends a quality assurance sample without communicating the expected value in advance
Quality Control
Accuracy checks - continued
Blank and Positive Plates Bacteriological samples should be checked using the blank and positive plate procedure The blank plate uses the rinse water media and equipment in the analysis to determine if there is contamination in the laboratory materials The result should be 0 The positive plate procedure uses a sample known to contain bacteria (eg waste- water treatment plant influent) to determine if a procedural error in the lab causes inhibition of bacterial growth Results should be rdquoToo Numerous To Countrdquo Each batch of samples should include at least one blank and one positive check sample This is an internal check
Spiked Samples Spikes are additions of a known amount of the indicator with the expectation that subsequent analysis will measure exactly that much increase over the un- spiked sample This procedure is described in Section 1020 B of Standard Methods This is an internal check
Voucher and Reference Collections For macroinvertebrates and aquatic plants maintenance of a voucher andor a working reference collection is recommended A voucher collection is a preserved collection of the type specimens ie an example of each of the individual taxa that you have given a name It should be maintained in archival condition by a trained curator typically found at a university A reference collection is an exact duplicate of the voucher collection but is the one that you will regularly use as a reference when identifying new specimens Both voucher and reference collections should be verified by an expert This is an external check Alternatively have an expert review IDs made by volunteers of at least 10 of specimens collected 90 accuracy is recommended
Quality Control
Precision Checks
Precision checks are primarily accomplished through replicate sampling amp analysis in the field and lab
Field Replication Replication can be done by the same field collectors but some replication by other collectors is good eg a pair of field collectors swapping roles or have different team collect the replicate This is an internal check
Lab Replication Additional replication should occur in the lab Lab replication is done by dividing a well-mixed sample into two or more aliquots and conducting analysis on each aliquot This is an internal check
Split Samples Split samples (a sample that is split into two sub-samples) can be done in the field or the lab
Relative Percent Difference
A measure of precision used for duplicate sample results It is calculated by dividing the difference between the two results by the mean of the two results expressed as a percentage Used when sample number equals two
eg ((98-92) 100) ((98+92))2 = 63
Deerfield River Watershed Association
14 Quality Control RequirementsA Volunteers Check - Field AuditEither the QC Officer the Project Coordinator or both will accompany a crew of volunteers (each) to their site each collection The trainers will observe the volunteersrsquo performance and check their sampling technique and field data sheets for accuracy
B Field QC ChecksAt least one Field Duplicate and one Field Blank will be submitted for every ten samples collected
Field Duplicate ndash a check on water quality sampling amp analysis consistency This is a replicated sample collected at the same point in time and space side by side with the first sampling and given a separate Sample ID number
Field Blanks ndash a check for contamination (AccuracyBias) in the field by processing laboratory-supplied deionized water through the sampling train This checks for contamination introduced from the sample container(s) or from field contamination A Field Blank will be taken by one volunteer at one site per sampling day for bacteria A container of DI water will be given to the volunteer who will pour this DI water into the sample bottle at the site
We will rotate the field duplicate and field blank samples among the volunteers throughout the sampling season so a maximum of collectors can be checked
Deerfield River Watershed Association
14 Quality Control Requirements ndash continued
C Laboratory QC ChecksA Lab Duplicate will be analyzed each sampling day The lab will split a randomly chosen sample and analyze both subsamples
The lab will run a Lab Blank and a Positive Sample for bacteria each collection (see section 7)
D Data Analysis QC ChecksRiver data and QC data will be reviewed by the QC Officer as soon as they come in from the lab after each collection QC data will be compared to the quality objectives (eg blanks should have zero colonies sample duplicates should be within 3 standard deviations of the mean positives should show bacterial growth etc) River data will be reviewed as well to ensurethat no field or lab contamination has occurred (data will be compared to those of other sites and of previous collections)
Bacteria computations will be checked and validated If discrepancies are found the Lab Director will be called to resolve the discrepancy and corrections will be made by the QC Officer
Field data sheets will be also reviewed the day of collection by the Project Coordinator and later by the QC Officer to ensure that samples were taken at the right times and that all the required information has been filled out The Project Coordinator or collectors will be called if omissions or errors are detected If needed corrections will be made (signed anddated) on the field sheet by the QC Officer
Neponset River Watershed Association
PRECISION DQOS DEALING WITH LOW-LEVEL CONCENTRATIONS
Source Analyte Units PrecisionMassDEP WPP Monitoring QAPP
Training Requirements Certification ndash EPA Element 8
In Narrative or Table Format
bull List type of training (eg Field WQ lab analysis visual observation data mgt data entry etc)
bull Who is training who receives training
bull How often training done
If training records are kept (they should be) include that in section 9 on documentation and records
Neponset River Watershed Association
A8 Training - ExcerptTo ensure the high quality and usability of the data that is generated by the CWMN program all participants receive training appropriate to the tasks for which they will be responsible NepRWA staff that are involved in the program are professionals with extensive training in water quality chemistry biology and field sampling NepRWA has established a program of training for volunteers that includes initial training follow-up and refresher classes These classes are given by NepRWA staff that are qualified not only in the technical matter covered but in training and education
The initial training for volunteer monitors is primarily instruction and demonstration by the trainer with repetition by the volunteer This training includes an overview of the entire project and detailed instruction in sampling procedures All monitors receive and review a copy of NepRWArsquos Water Monitoring and Sampling Manual (see Appendix 3a)
After their initial training all volunteers participate in a mandatory annual group andor individual training session These sessions are designed to update the volunteers on changes in the program further train them in equipment calibration and field-testing procedures and evaluate each volunteerrsquos performancehellip
InstrumentEquipment Testing Inspection and Maintenance Requirements ndash EPA Element 15
Instrument Calibration and Frequency ndash EPA Element 16
InspectionAcceptance Requirements for Supplies ndash EPA Element 17
DOCUMENTATION AND RECORDS ndash EPA ELEMENT 9
Neponset River Watershed AssociationA9 Documents and RecordsA9-1 Data SheetsField data sheets include information about the site location (NepRWA ID number) which specific equipment was used to make measurements (thermometer number) the sampling method used (direct fill pole or Bridge Buddy) and equipment calibration results The field data sheets are also used to record temperature velocity depth color odor and turbidity information (Appendix 4e)helliphellip See Appendix 4 for copies of the various data sheets used in the CWMN program
A9-2 Chain of Custody FormsA9-3 Sample LabelingA9-4 Equipment Custody FormA9-5 Training and Evaluation Form
Data Acquisition Requirements - EPA Element 18
Purpose To ensure that any data you use but donrsquot collect yourself has a known data quality and is consistent with your data quality objectives that others can access these data and that your use of the data is appropriate
Describe any external data you use such as GPS coordinates for site locations weather station rainfall amounts etc
Include bull The title of the document or name of the informationbull Where you obtained it and where others may find itbull Notes on the quality of the outside information such as uncertainties and caveats
Preamble to Elements 19 through 24
Consider the four separate objectives of these chapters1) Producing a good data set - 19 covers the normal data mgt routines you do to prevent data mistakes in the first place- 22 amp23 describe how you review the resulting data sets - how you find and correct
missing or erroneous data - 19 22 and 23 should produce as complete amp accurate a data set as possible 2) Ensuring that any use you make of your data is justified In 24 you decide how usable your data are Review the final data set that the above efforts have produced Compare it with your DQOs to determine whether you have to discard or qualify any data what conclusions you can draw from your data or what changes you might need to make in your DQOs3) Improve overall project performance 20 deals with how well volunteers laboratories and equipment are operating It looks at function not outcomes Who evaluates the various components of your program when problems are found what corrections are made to make your program run better4) Report your results After yoursquove run these various checks you are ready to release your data In Chapter 21 you describe the reports you will issue
Suggested order bull Data Management (19)bull Data Review Validation and Verification Requirements (22)bull (Data) Validation and Verification Methods (23)
bull Reconciliation with Data Quality Objectives (24)
bull Assessment and Response Actions (20)
bull Reports (21)
EPA Elements 19 ndash 24
bull Data Management (19)bull Assessment and Response Actions (20) bull Reports (21)bull Data Review Validation and Verification Requirements (22)bull (Data) Validation and Verification Methods (23)bull Reconciliation with Data Quality Objectives (24)
Data Management ndash EPA Element 19
Follow the data from the moment itrsquos recorded through every step to final report databaseIntent is to prevent errors or loss of data or be able to correct in timely manner
bull Before each activitystep is conducted well-designed field sheets checklists COC forms data entry software auto-QC calculations out-of-bounds highlights etc
bull During each step sheets filled completely checklist reviewed before leaving site etc
bull Immediately after Computer-entered data compared with field sheets etc
bull Long term preservation Data storage
Neponset River Watershed Association
B9 Data ManagementThe Project Manager is responsible for overseeing all data management activities Refer also to section D below for additional discussion of data review verification and validation practices
B9-1 Raw DataField data sheets are collected with the samples The sheets are turned into the NepRWA office by the site coordinators The forms are then reviewed for illegible answers errors or questionable values and checked for consistency with the COC and bottle labels as described in Appendix 3l Any questions are referred to the volunteer for clarification NepRWA staff makes corrections by crossing out the errors and writing in the correct answer All corrections must be initialed
B9-2 Data Entry and ValidationOnce the information has undergone a preliminary check it is entered into a Filemaker database The software has been customized to the data sheet Fields within the worksheet have been set-up with limits based on expected results This helps to minimize entry errors Entered data is then checked against the data sheets by another volunteer or staff person
B9-3 Data StorageThe original data sheets are filed into an event file and stored in NepRWArsquos permanent files Electronic copies of data are maintained on a secure Filemaker server Data files are kept in perpetuity along with hard copies of volunteer data sheets All electronic data is backed-up daily on to a password-protected hard drive
Data Review Validation and Verificationndash EPA Element 22
(Data) Validation and Verification Methods ndash EPA Element 23
Deerfield River Watershed Association
22 Data Review Validation and Verification ndash Summarized bullet list
All data reviewed by the Project Coordinator and QA Coordinator
Data Analysis QC Checks will includebull Data entry checks by a second personbull Computer entries compared with fieldlab sheetsbull Checks on graphs amp all other data representationsbull Calculation of measures of data quality including completeness
Corrective actionsbull Data entry errors corrected bull Data outside expected range flagged or rejected bull 2nd field sample andor laboratory aliquot taken when possiblebull Data quality problems discussed in draft and final reports
(Data) Validation and Verification Methods ndash EPA Element 23 From Inland QAPP
Validation and Verification Methods will include checks on bull Completion of all fields on data sheets missing data sheetsbull Completeness of sampling runs (eg number of sites visitedsamples taken vs number proposed were all parameters sampledanalyzed)bull Completeness of QC checks (eg number and type of QC checks performed vs numbertype proposed)bull Accuracy and precision compared to data quality objectivesbull Representativeness of samples and resulting data by examining survey metadata for unusual conditions and occurrences that may have impacted the validity of results
Deerfield River Watershed Association ndash Excerpt summarized
23 Validation and Verification Methods
The following simple measures of data quality will be calculated and included in the final report
1) To screen for contamination the average blank concentration hellip will be calculated This average value should be as close as practical to the Reporting Limit listed in Table 4
2) To assess the precision of results the ldquoMean Relative Percent Differencerdquo between field duplicate samples should be calculated The average RPD should be less than or equal to the Estimated Precision listed in Table 4 This simple measure is calculated as follows
RPD formula used hellip
Reconciliation With Data Quality Objectives ndash EPA Element 24MassWWP guide to QAPP development
What to Include bull List who will evaluate your actual data vs your data quality goals bull State how and when this will be done bull Describe the process for determining what to do if goals are not met
Neponset River Watershed Association
D2 Reconciliation with User Requirements - Summarized bulletedbull Following each sampling event and prior to the subsequent event calculations and
determinations for precision completeness and accuracy will be made bull Any corrective action will be implemented noted and initialized by the project manager bull If data quality indicators do not meet the projectrsquos specifications then data may be discarded
may be flagged or re-sampling may occur bull Investigation of problems will take place and corrections will be documented If equipment
failure is found to be the cause calibration and maintenance techniques will be reassessed Field duplicate testing may occur during the next sampling event to ensure confidence in the results
bull Any limitations on the data will be noted bull Any revisions to the project will be submitted to EPA and DEP quality assurance officers for
approval
Assessment and Response Actions - EPA Element 20 From Inland QAPP
Document that the progress and quality of the monitoring program will be continuously assessed to ensure that its objectives are being accomplished
The Monitoring Coordinator will periodically check to see the following bull Monitoring is occurring as planned bull Sufficient written commentary and supporting photographs exist bull Sufficient volunteers are available bull Volunteers have been observed as they sample their sites bull Samplers are collecting in accordance with project schedules bull Data sheets and custody control sheets are being properly completed and signed bull Data are properly interpreted bull Plans for dealing with adverse weather are in place
Assessment and Response Actions - EPA Element 20 From Inland QAPP ndash continued
The Monitoring Coordinator will periodically check to see the following bull Retraining or other corrective action is implemented at the first hint of non compliance with the
QAPP or SOPs bull Labs are adhering to the requirements of their QAPP in terms of work performed accuracy
acceptable holding times timely and understandable results and delivery process bull Data management is being handled properly ie data are entered on a timely basis is
properly backed up is easily accessed and raw data are properly stored in a safe placebull Procedure for developing and reporting the results exists
Assessment and Response Actions - EPA Element 20 From Inland QAPP ndash continued
The Monitoring Coordinator will confer with the QA Officer as necessary to discuss any problems that occur and what corrective actions are needed to maintain program integrity In addition the Monitoring Coordinator and QA Officer will meet at the end of the sampling season to review the draft report and discuss all aspects of the program and identify necessary program modifications for future sampling activities [If the program includes a technical advisory committee the TAC will be included in these discussions] Corrections may include retraining volunteers rewriting sampling instructions replacement of volunteers alteration of sampling schedules sites or methods or other actions deemed necessary All problems discovered and program modifications made will be documented in the final version of the project report If modifications require changes in the Quality Assurance Project Plan these changes will be submitted MassDEP for review
Deerfield River Watershed Association
20 Assessment and Response Actions ndash Summarized bullet list
bull There will be an on-site visit by the Quality Control Officer to observe field sampling and field analysis procedures Generally this will be done near the beginning of the project
bull A written checklist will be used for the assessments maintained by the Project Coordinator and copies will be provided with the data report
bull The Project Coordinator and QC Officer will determine if field work follows the written procedures or if there needs to be corrections by additional training or revising protocols
bull Please refer to Section 22 for additional evaluations and response actions regarding data evaluations
Reports ndash EPA Element 21
Project Task Organization ndash EPA Element 4 Reviewrevise early choices
Distribution List ndash EPA Element 3
Title and Approval Page - EPA Element 1
Table of Contents ndash EPA Element 2
Water quality monitoring quality assurance workshop
Terminology
Study design
QAPP
sampling and analysis plan
standard operating procedures
data quality objectives
Water Quality Monitoring Planning Process
Monitoring program activities
Why do you need (who Gives) a qapp
Slide Number 11
Slide Number 12
Steps to Developing a QAPP
Slide Number 14
Slide Number 15
Slide Number 16
Steps to Developing a QAPP
Slide Number 18
Slide Number 19
Slide Number 20
Slide Number 21
Slide Number 22
Slide Number 23
Slide Number 24
Sources of Information About Massachusetts Waters
Slide Number 26
Slide Number 27
Slide Number 28
Slide Number 29
Slide Number 30
Slide Number 31
Slide Number 32
Slide Number 33
Slide Number 34
Slide Number 35
Slide Number 36
Slide Number 37
Slide Number 38
Slide Number 39
Slide Number 40
Slide Number 41
Slide Number 42
Slide Number 43
Slide Number 44
Slide Number 45
Slide Number 46
MassDEP - Recommended Minimum Sample Number Frequency and Timing for Example Parameters
Slide Number 48
Slide Number 49
Slide Number 50
Slide Number 51
Slide Number 52
MaDep - Recommended Minimum Sample Number Frequency and Timing for Example Parameters
Slide Number 54
Slide Number 55
Slide Number 56
Slide Number 57
Slide Number 58
Slide Number 59
Slide Number 60
Slide Number 61
Slide Number 62
Slide Number 63
Slide Number 64
Slide Number 65
Slide Number 66
Slide Number 67
Slide Number 68
Slide Number 69
Slide Number 70
Slide Number 71
Slide Number 72
Slide Number 73
Slide Number 74
Slide Number 75
Slide Number 76
Precision DQOs Dealing with low-level concentrations
Slide Number 78
Slide Number 79
Slide Number 80
Slide Number 81
Slide Number 82
Documentation and Records ndash EPA Element 9
Slide Number 84
Slide Number 85
Slide Number 86
Slide Number 87
Slide Number 88
Slide Number 89
Slide Number 90
Slide Number 91
Slide Number 92
Slide Number 93
Slide Number 94
Slide Number 95
Slide Number 96
Slide Number 97
Slide Number 98
Slide Number 99
Slide Number 100
Neponset River Watershed Association
Massachusetts Volunteer Monitorrsquos Guide to QAPP DevelopmentPAGE 61
Here are some things to consider in choosing a method Scientific Considerations Does it meet your data quality objectives
How accurate is it How precise (reproducible) is it What is its detection limit
Will it measure the indicator in the range that you need What lab facilities are required What equipment is required Does it yield samples that are representative Is it comparable to methods used by agencies collecting similar information
Practical and Program Considerations bull Do you have the human and financial resources to do it bull How difficult is it bull How time-consuming is it bull Will it produce data useful to the target audience
Quality Control ndash EPA Element 14
This section documents that the specific quality control measures you will take will allow you to determine whether you meet your data quality objectives
What To Include Section 7 stated your DQOs Here you describe how you are going to meet them
For each indicator include the following information
bull Accuracy Precision checks list what checks you will perform
bull List the of your samples upon which you will perform quality checks that will represent the quality of all your samples
Quality Control
Accuracy checks
There are a variety of ways to check the accuracy of your sampling and analysis
Checks can be done internally (done totally within your project lab) or externally (done with the assistance of an independent lab)
Known Samples This is an internal check that compares your results against another analyst or a ldquoknownrdquo An example of a known is a quality assurance sample that UMass WRRC sends to VM groups for pH DO or alkalinity ndash with the expected value communicated when sample is sent
Proficiency Testing (Unknown) Samples In some cases there are programs that provide proficiency testing samples for laboratory performance evaluation the concentrations of which are known to the auditor but not to the lab being tested This is relatively common for most water chemistry indicators An example of an unknown would when WRRC sends a quality assurance sample without communicating the expected value in advance
Quality Control
Accuracy checks - continued
Blank and Positive Plates Bacteriological samples should be checked using the blank and positive plate procedure The blank plate uses the rinse water media and equipment in the analysis to determine if there is contamination in the laboratory materials The result should be 0 The positive plate procedure uses a sample known to contain bacteria (eg waste- water treatment plant influent) to determine if a procedural error in the lab causes inhibition of bacterial growth Results should be rdquoToo Numerous To Countrdquo Each batch of samples should include at least one blank and one positive check sample This is an internal check
Spiked Samples Spikes are additions of a known amount of the indicator with the expectation that subsequent analysis will measure exactly that much increase over the un- spiked sample This procedure is described in Section 1020 B of Standard Methods This is an internal check
Voucher and Reference Collections For macroinvertebrates and aquatic plants maintenance of a voucher andor a working reference collection is recommended A voucher collection is a preserved collection of the type specimens ie an example of each of the individual taxa that you have given a name It should be maintained in archival condition by a trained curator typically found at a university A reference collection is an exact duplicate of the voucher collection but is the one that you will regularly use as a reference when identifying new specimens Both voucher and reference collections should be verified by an expert This is an external check Alternatively have an expert review IDs made by volunteers of at least 10 of specimens collected 90 accuracy is recommended
Quality Control
Precision Checks
Precision checks are primarily accomplished through replicate sampling amp analysis in the field and lab
Field Replication Replication can be done by the same field collectors but some replication by other collectors is good eg a pair of field collectors swapping roles or have different team collect the replicate This is an internal check
Lab Replication Additional replication should occur in the lab Lab replication is done by dividing a well-mixed sample into two or more aliquots and conducting analysis on each aliquot This is an internal check
Split Samples Split samples (a sample that is split into two sub-samples) can be done in the field or the lab
Relative Percent Difference
A measure of precision used for duplicate sample results It is calculated by dividing the difference between the two results by the mean of the two results expressed as a percentage Used when sample number equals two
eg ((98-92) 100) ((98+92))2 = 63
Deerfield River Watershed Association
14 Quality Control RequirementsA Volunteers Check - Field AuditEither the QC Officer the Project Coordinator or both will accompany a crew of volunteers (each) to their site each collection The trainers will observe the volunteersrsquo performance and check their sampling technique and field data sheets for accuracy
B Field QC ChecksAt least one Field Duplicate and one Field Blank will be submitted for every ten samples collected
Field Duplicate ndash a check on water quality sampling amp analysis consistency This is a replicated sample collected at the same point in time and space side by side with the first sampling and given a separate Sample ID number
Field Blanks ndash a check for contamination (AccuracyBias) in the field by processing laboratory-supplied deionized water through the sampling train This checks for contamination introduced from the sample container(s) or from field contamination A Field Blank will be taken by one volunteer at one site per sampling day for bacteria A container of DI water will be given to the volunteer who will pour this DI water into the sample bottle at the site
We will rotate the field duplicate and field blank samples among the volunteers throughout the sampling season so a maximum of collectors can be checked
Deerfield River Watershed Association
14 Quality Control Requirements ndash continued
C Laboratory QC ChecksA Lab Duplicate will be analyzed each sampling day The lab will split a randomly chosen sample and analyze both subsamples
The lab will run a Lab Blank and a Positive Sample for bacteria each collection (see section 7)
D Data Analysis QC ChecksRiver data and QC data will be reviewed by the QC Officer as soon as they come in from the lab after each collection QC data will be compared to the quality objectives (eg blanks should have zero colonies sample duplicates should be within 3 standard deviations of the mean positives should show bacterial growth etc) River data will be reviewed as well to ensurethat no field or lab contamination has occurred (data will be compared to those of other sites and of previous collections)
Bacteria computations will be checked and validated If discrepancies are found the Lab Director will be called to resolve the discrepancy and corrections will be made by the QC Officer
Field data sheets will be also reviewed the day of collection by the Project Coordinator and later by the QC Officer to ensure that samples were taken at the right times and that all the required information has been filled out The Project Coordinator or collectors will be called if omissions or errors are detected If needed corrections will be made (signed anddated) on the field sheet by the QC Officer
Neponset River Watershed Association
PRECISION DQOS DEALING WITH LOW-LEVEL CONCENTRATIONS
Source Analyte Units PrecisionMassDEP WPP Monitoring QAPP
Training Requirements Certification ndash EPA Element 8
In Narrative or Table Format
bull List type of training (eg Field WQ lab analysis visual observation data mgt data entry etc)
bull Who is training who receives training
bull How often training done
If training records are kept (they should be) include that in section 9 on documentation and records
Neponset River Watershed Association
A8 Training - ExcerptTo ensure the high quality and usability of the data that is generated by the CWMN program all participants receive training appropriate to the tasks for which they will be responsible NepRWA staff that are involved in the program are professionals with extensive training in water quality chemistry biology and field sampling NepRWA has established a program of training for volunteers that includes initial training follow-up and refresher classes These classes are given by NepRWA staff that are qualified not only in the technical matter covered but in training and education
The initial training for volunteer monitors is primarily instruction and demonstration by the trainer with repetition by the volunteer This training includes an overview of the entire project and detailed instruction in sampling procedures All monitors receive and review a copy of NepRWArsquos Water Monitoring and Sampling Manual (see Appendix 3a)
After their initial training all volunteers participate in a mandatory annual group andor individual training session These sessions are designed to update the volunteers on changes in the program further train them in equipment calibration and field-testing procedures and evaluate each volunteerrsquos performancehellip
InstrumentEquipment Testing Inspection and Maintenance Requirements ndash EPA Element 15
Instrument Calibration and Frequency ndash EPA Element 16
InspectionAcceptance Requirements for Supplies ndash EPA Element 17
DOCUMENTATION AND RECORDS ndash EPA ELEMENT 9
Neponset River Watershed AssociationA9 Documents and RecordsA9-1 Data SheetsField data sheets include information about the site location (NepRWA ID number) which specific equipment was used to make measurements (thermometer number) the sampling method used (direct fill pole or Bridge Buddy) and equipment calibration results The field data sheets are also used to record temperature velocity depth color odor and turbidity information (Appendix 4e)helliphellip See Appendix 4 for copies of the various data sheets used in the CWMN program
A9-2 Chain of Custody FormsA9-3 Sample LabelingA9-4 Equipment Custody FormA9-5 Training and Evaluation Form
Data Acquisition Requirements - EPA Element 18
Purpose To ensure that any data you use but donrsquot collect yourself has a known data quality and is consistent with your data quality objectives that others can access these data and that your use of the data is appropriate
Describe any external data you use such as GPS coordinates for site locations weather station rainfall amounts etc
Include bull The title of the document or name of the informationbull Where you obtained it and where others may find itbull Notes on the quality of the outside information such as uncertainties and caveats
Preamble to Elements 19 through 24
Consider the four separate objectives of these chapters1) Producing a good data set - 19 covers the normal data mgt routines you do to prevent data mistakes in the first place- 22 amp23 describe how you review the resulting data sets - how you find and correct
missing or erroneous data - 19 22 and 23 should produce as complete amp accurate a data set as possible 2) Ensuring that any use you make of your data is justified In 24 you decide how usable your data are Review the final data set that the above efforts have produced Compare it with your DQOs to determine whether you have to discard or qualify any data what conclusions you can draw from your data or what changes you might need to make in your DQOs3) Improve overall project performance 20 deals with how well volunteers laboratories and equipment are operating It looks at function not outcomes Who evaluates the various components of your program when problems are found what corrections are made to make your program run better4) Report your results After yoursquove run these various checks you are ready to release your data In Chapter 21 you describe the reports you will issue
Suggested order bull Data Management (19)bull Data Review Validation and Verification Requirements (22)bull (Data) Validation and Verification Methods (23)
bull Reconciliation with Data Quality Objectives (24)
bull Assessment and Response Actions (20)
bull Reports (21)
EPA Elements 19 ndash 24
bull Data Management (19)bull Assessment and Response Actions (20) bull Reports (21)bull Data Review Validation and Verification Requirements (22)bull (Data) Validation and Verification Methods (23)bull Reconciliation with Data Quality Objectives (24)
Data Management ndash EPA Element 19
Follow the data from the moment itrsquos recorded through every step to final report databaseIntent is to prevent errors or loss of data or be able to correct in timely manner
bull Before each activitystep is conducted well-designed field sheets checklists COC forms data entry software auto-QC calculations out-of-bounds highlights etc
bull During each step sheets filled completely checklist reviewed before leaving site etc
bull Immediately after Computer-entered data compared with field sheets etc
bull Long term preservation Data storage
Neponset River Watershed Association
B9 Data ManagementThe Project Manager is responsible for overseeing all data management activities Refer also to section D below for additional discussion of data review verification and validation practices
B9-1 Raw DataField data sheets are collected with the samples The sheets are turned into the NepRWA office by the site coordinators The forms are then reviewed for illegible answers errors or questionable values and checked for consistency with the COC and bottle labels as described in Appendix 3l Any questions are referred to the volunteer for clarification NepRWA staff makes corrections by crossing out the errors and writing in the correct answer All corrections must be initialed
B9-2 Data Entry and ValidationOnce the information has undergone a preliminary check it is entered into a Filemaker database The software has been customized to the data sheet Fields within the worksheet have been set-up with limits based on expected results This helps to minimize entry errors Entered data is then checked against the data sheets by another volunteer or staff person
B9-3 Data StorageThe original data sheets are filed into an event file and stored in NepRWArsquos permanent files Electronic copies of data are maintained on a secure Filemaker server Data files are kept in perpetuity along with hard copies of volunteer data sheets All electronic data is backed-up daily on to a password-protected hard drive
Data Review Validation and Verificationndash EPA Element 22
(Data) Validation and Verification Methods ndash EPA Element 23
Deerfield River Watershed Association
22 Data Review Validation and Verification ndash Summarized bullet list
All data reviewed by the Project Coordinator and QA Coordinator
Data Analysis QC Checks will includebull Data entry checks by a second personbull Computer entries compared with fieldlab sheetsbull Checks on graphs amp all other data representationsbull Calculation of measures of data quality including completeness
Corrective actionsbull Data entry errors corrected bull Data outside expected range flagged or rejected bull 2nd field sample andor laboratory aliquot taken when possiblebull Data quality problems discussed in draft and final reports
(Data) Validation and Verification Methods ndash EPA Element 23 From Inland QAPP
Validation and Verification Methods will include checks on bull Completion of all fields on data sheets missing data sheetsbull Completeness of sampling runs (eg number of sites visitedsamples taken vs number proposed were all parameters sampledanalyzed)bull Completeness of QC checks (eg number and type of QC checks performed vs numbertype proposed)bull Accuracy and precision compared to data quality objectivesbull Representativeness of samples and resulting data by examining survey metadata for unusual conditions and occurrences that may have impacted the validity of results
Deerfield River Watershed Association ndash Excerpt summarized
23 Validation and Verification Methods
The following simple measures of data quality will be calculated and included in the final report
1) To screen for contamination the average blank concentration hellip will be calculated This average value should be as close as practical to the Reporting Limit listed in Table 4
2) To assess the precision of results the ldquoMean Relative Percent Differencerdquo between field duplicate samples should be calculated The average RPD should be less than or equal to the Estimated Precision listed in Table 4 This simple measure is calculated as follows
RPD formula used hellip
Reconciliation With Data Quality Objectives ndash EPA Element 24MassWWP guide to QAPP development
What to Include bull List who will evaluate your actual data vs your data quality goals bull State how and when this will be done bull Describe the process for determining what to do if goals are not met
Neponset River Watershed Association
D2 Reconciliation with User Requirements - Summarized bulletedbull Following each sampling event and prior to the subsequent event calculations and
determinations for precision completeness and accuracy will be made bull Any corrective action will be implemented noted and initialized by the project manager bull If data quality indicators do not meet the projectrsquos specifications then data may be discarded
may be flagged or re-sampling may occur bull Investigation of problems will take place and corrections will be documented If equipment
failure is found to be the cause calibration and maintenance techniques will be reassessed Field duplicate testing may occur during the next sampling event to ensure confidence in the results
bull Any limitations on the data will be noted bull Any revisions to the project will be submitted to EPA and DEP quality assurance officers for
approval
Assessment and Response Actions - EPA Element 20 From Inland QAPP
Document that the progress and quality of the monitoring program will be continuously assessed to ensure that its objectives are being accomplished
The Monitoring Coordinator will periodically check to see the following bull Monitoring is occurring as planned bull Sufficient written commentary and supporting photographs exist bull Sufficient volunteers are available bull Volunteers have been observed as they sample their sites bull Samplers are collecting in accordance with project schedules bull Data sheets and custody control sheets are being properly completed and signed bull Data are properly interpreted bull Plans for dealing with adverse weather are in place
Assessment and Response Actions - EPA Element 20 From Inland QAPP ndash continued
The Monitoring Coordinator will periodically check to see the following bull Retraining or other corrective action is implemented at the first hint of non compliance with the
QAPP or SOPs bull Labs are adhering to the requirements of their QAPP in terms of work performed accuracy
acceptable holding times timely and understandable results and delivery process bull Data management is being handled properly ie data are entered on a timely basis is
properly backed up is easily accessed and raw data are properly stored in a safe placebull Procedure for developing and reporting the results exists
Assessment and Response Actions - EPA Element 20 From Inland QAPP ndash continued
The Monitoring Coordinator will confer with the QA Officer as necessary to discuss any problems that occur and what corrective actions are needed to maintain program integrity In addition the Monitoring Coordinator and QA Officer will meet at the end of the sampling season to review the draft report and discuss all aspects of the program and identify necessary program modifications for future sampling activities [If the program includes a technical advisory committee the TAC will be included in these discussions] Corrections may include retraining volunteers rewriting sampling instructions replacement of volunteers alteration of sampling schedules sites or methods or other actions deemed necessary All problems discovered and program modifications made will be documented in the final version of the project report If modifications require changes in the Quality Assurance Project Plan these changes will be submitted MassDEP for review
Deerfield River Watershed Association
20 Assessment and Response Actions ndash Summarized bullet list
bull There will be an on-site visit by the Quality Control Officer to observe field sampling and field analysis procedures Generally this will be done near the beginning of the project
bull A written checklist will be used for the assessments maintained by the Project Coordinator and copies will be provided with the data report
bull The Project Coordinator and QC Officer will determine if field work follows the written procedures or if there needs to be corrections by additional training or revising protocols
bull Please refer to Section 22 for additional evaluations and response actions regarding data evaluations
Reports ndash EPA Element 21
Project Task Organization ndash EPA Element 4 Reviewrevise early choices
Distribution List ndash EPA Element 3
Title and Approval Page - EPA Element 1
Table of Contents ndash EPA Element 2
Water quality monitoring quality assurance workshop
Terminology
Study design
QAPP
sampling and analysis plan
standard operating procedures
data quality objectives
Water Quality Monitoring Planning Process
Monitoring program activities
Why do you need (who Gives) a qapp
Slide Number 11
Slide Number 12
Steps to Developing a QAPP
Slide Number 14
Slide Number 15
Slide Number 16
Steps to Developing a QAPP
Slide Number 18
Slide Number 19
Slide Number 20
Slide Number 21
Slide Number 22
Slide Number 23
Slide Number 24
Sources of Information About Massachusetts Waters
Slide Number 26
Slide Number 27
Slide Number 28
Slide Number 29
Slide Number 30
Slide Number 31
Slide Number 32
Slide Number 33
Slide Number 34
Slide Number 35
Slide Number 36
Slide Number 37
Slide Number 38
Slide Number 39
Slide Number 40
Slide Number 41
Slide Number 42
Slide Number 43
Slide Number 44
Slide Number 45
Slide Number 46
MassDEP - Recommended Minimum Sample Number Frequency and Timing for Example Parameters
Slide Number 48
Slide Number 49
Slide Number 50
Slide Number 51
Slide Number 52
MaDep - Recommended Minimum Sample Number Frequency and Timing for Example Parameters
Slide Number 54
Slide Number 55
Slide Number 56
Slide Number 57
Slide Number 58
Slide Number 59
Slide Number 60
Slide Number 61
Slide Number 62
Slide Number 63
Slide Number 64
Slide Number 65
Slide Number 66
Slide Number 67
Slide Number 68
Slide Number 69
Slide Number 70
Slide Number 71
Slide Number 72
Slide Number 73
Slide Number 74
Slide Number 75
Slide Number 76
Precision DQOs Dealing with low-level concentrations
Slide Number 78
Slide Number 79
Slide Number 80
Slide Number 81
Slide Number 82
Documentation and Records ndash EPA Element 9
Slide Number 84
Slide Number 85
Slide Number 86
Slide Number 87
Slide Number 88
Slide Number 89
Slide Number 90
Slide Number 91
Slide Number 92
Slide Number 93
Slide Number 94
Slide Number 95
Slide Number 96
Slide Number 97
Slide Number 98
Slide Number 99
Slide Number 100
Quality Control
Precision Checks
Precision checks are primarily accomplished through replicate sampling amp analysis in the field and lab
Field Replication Replication can be done by the same field collectors but some replication by other collectors is good eg a pair of field collectors swapping roles or have different team collect the replicate This is an internal check
Lab Replication Additional replication should occur in the lab Lab replication is done by dividing a well-mixed sample into two or more aliquots and conducting analysis on each aliquot This is an internal check
Split Samples Split samples (a sample that is split into two sub-samples) can be done in the field or the lab
Relative Percent Difference
A measure of precision used for duplicate sample results It is calculated by dividing the difference between the two results by the mean of the two results expressed as a percentage Used when sample number equals two
eg ((98-92) 100) ((98+92))2 = 63
Deerfield River Watershed Association
14 Quality Control RequirementsA Volunteers Check - Field AuditEither the QC Officer the Project Coordinator or both will accompany a crew of volunteers (each) to their site each collection The trainers will observe the volunteersrsquo performance and check their sampling technique and field data sheets for accuracy
B Field QC ChecksAt least one Field Duplicate and one Field Blank will be submitted for every ten samples collected
Field Duplicate ndash a check on water quality sampling amp analysis consistency This is a replicated sample collected at the same point in time and space side by side with the first sampling and given a separate Sample ID number
Field Blanks ndash a check for contamination (AccuracyBias) in the field by processing laboratory-supplied deionized water through the sampling train This checks for contamination introduced from the sample container(s) or from field contamination A Field Blank will be taken by one volunteer at one site per sampling day for bacteria A container of DI water will be given to the volunteer who will pour this DI water into the sample bottle at the site
We will rotate the field duplicate and field blank samples among the volunteers throughout the sampling season so a maximum of collectors can be checked
Deerfield River Watershed Association
14 Quality Control Requirements ndash continued
C Laboratory QC ChecksA Lab Duplicate will be analyzed each sampling day The lab will split a randomly chosen sample and analyze both subsamples
The lab will run a Lab Blank and a Positive Sample for bacteria each collection (see section 7)
D Data Analysis QC ChecksRiver data and QC data will be reviewed by the QC Officer as soon as they come in from the lab after each collection QC data will be compared to the quality objectives (eg blanks should have zero colonies sample duplicates should be within 3 standard deviations of the mean positives should show bacterial growth etc) River data will be reviewed as well to ensurethat no field or lab contamination has occurred (data will be compared to those of other sites and of previous collections)
Bacteria computations will be checked and validated If discrepancies are found the Lab Director will be called to resolve the discrepancy and corrections will be made by the QC Officer
Field data sheets will be also reviewed the day of collection by the Project Coordinator and later by the QC Officer to ensure that samples were taken at the right times and that all the required information has been filled out The Project Coordinator or collectors will be called if omissions or errors are detected If needed corrections will be made (signed anddated) on the field sheet by the QC Officer
Neponset River Watershed Association
PRECISION DQOS DEALING WITH LOW-LEVEL CONCENTRATIONS
Source Analyte Units PrecisionMassDEP WPP Monitoring QAPP
Training Requirements Certification ndash EPA Element 8
In Narrative or Table Format
bull List type of training (eg Field WQ lab analysis visual observation data mgt data entry etc)
bull Who is training who receives training
bull How often training done
If training records are kept (they should be) include that in section 9 on documentation and records
Neponset River Watershed Association
A8 Training - ExcerptTo ensure the high quality and usability of the data that is generated by the CWMN program all participants receive training appropriate to the tasks for which they will be responsible NepRWA staff that are involved in the program are professionals with extensive training in water quality chemistry biology and field sampling NepRWA has established a program of training for volunteers that includes initial training follow-up and refresher classes These classes are given by NepRWA staff that are qualified not only in the technical matter covered but in training and education
The initial training for volunteer monitors is primarily instruction and demonstration by the trainer with repetition by the volunteer This training includes an overview of the entire project and detailed instruction in sampling procedures All monitors receive and review a copy of NepRWArsquos Water Monitoring and Sampling Manual (see Appendix 3a)
After their initial training all volunteers participate in a mandatory annual group andor individual training session These sessions are designed to update the volunteers on changes in the program further train them in equipment calibration and field-testing procedures and evaluate each volunteerrsquos performancehellip
InstrumentEquipment Testing Inspection and Maintenance Requirements ndash EPA Element 15
Instrument Calibration and Frequency ndash EPA Element 16
InspectionAcceptance Requirements for Supplies ndash EPA Element 17
DOCUMENTATION AND RECORDS ndash EPA ELEMENT 9
Neponset River Watershed AssociationA9 Documents and RecordsA9-1 Data SheetsField data sheets include information about the site location (NepRWA ID number) which specific equipment was used to make measurements (thermometer number) the sampling method used (direct fill pole or Bridge Buddy) and equipment calibration results The field data sheets are also used to record temperature velocity depth color odor and turbidity information (Appendix 4e)helliphellip See Appendix 4 for copies of the various data sheets used in the CWMN program
A9-2 Chain of Custody FormsA9-3 Sample LabelingA9-4 Equipment Custody FormA9-5 Training and Evaluation Form
Data Acquisition Requirements - EPA Element 18
Purpose To ensure that any data you use but donrsquot collect yourself has a known data quality and is consistent with your data quality objectives that others can access these data and that your use of the data is appropriate
Describe any external data you use such as GPS coordinates for site locations weather station rainfall amounts etc
Include bull The title of the document or name of the informationbull Where you obtained it and where others may find itbull Notes on the quality of the outside information such as uncertainties and caveats
Preamble to Elements 19 through 24
Consider the four separate objectives of these chapters1) Producing a good data set - 19 covers the normal data mgt routines you do to prevent data mistakes in the first place- 22 amp23 describe how you review the resulting data sets - how you find and correct
missing or erroneous data - 19 22 and 23 should produce as complete amp accurate a data set as possible 2) Ensuring that any use you make of your data is justified In 24 you decide how usable your data are Review the final data set that the above efforts have produced Compare it with your DQOs to determine whether you have to discard or qualify any data what conclusions you can draw from your data or what changes you might need to make in your DQOs3) Improve overall project performance 20 deals with how well volunteers laboratories and equipment are operating It looks at function not outcomes Who evaluates the various components of your program when problems are found what corrections are made to make your program run better4) Report your results After yoursquove run these various checks you are ready to release your data In Chapter 21 you describe the reports you will issue
Suggested order bull Data Management (19)bull Data Review Validation and Verification Requirements (22)bull (Data) Validation and Verification Methods (23)
bull Reconciliation with Data Quality Objectives (24)
bull Assessment and Response Actions (20)
bull Reports (21)
EPA Elements 19 ndash 24
bull Data Management (19)bull Assessment and Response Actions (20) bull Reports (21)bull Data Review Validation and Verification Requirements (22)bull (Data) Validation and Verification Methods (23)bull Reconciliation with Data Quality Objectives (24)
Data Management ndash EPA Element 19
Follow the data from the moment itrsquos recorded through every step to final report databaseIntent is to prevent errors or loss of data or be able to correct in timely manner
bull Before each activitystep is conducted well-designed field sheets checklists COC forms data entry software auto-QC calculations out-of-bounds highlights etc
bull During each step sheets filled completely checklist reviewed before leaving site etc
bull Immediately after Computer-entered data compared with field sheets etc
bull Long term preservation Data storage
Neponset River Watershed Association
B9 Data ManagementThe Project Manager is responsible for overseeing all data management activities Refer also to section D below for additional discussion of data review verification and validation practices
B9-1 Raw DataField data sheets are collected with the samples The sheets are turned into the NepRWA office by the site coordinators The forms are then reviewed for illegible answers errors or questionable values and checked for consistency with the COC and bottle labels as described in Appendix 3l Any questions are referred to the volunteer for clarification NepRWA staff makes corrections by crossing out the errors and writing in the correct answer All corrections must be initialed
B9-2 Data Entry and ValidationOnce the information has undergone a preliminary check it is entered into a Filemaker database The software has been customized to the data sheet Fields within the worksheet have been set-up with limits based on expected results This helps to minimize entry errors Entered data is then checked against the data sheets by another volunteer or staff person
B9-3 Data StorageThe original data sheets are filed into an event file and stored in NepRWArsquos permanent files Electronic copies of data are maintained on a secure Filemaker server Data files are kept in perpetuity along with hard copies of volunteer data sheets All electronic data is backed-up daily on to a password-protected hard drive
Data Review Validation and Verificationndash EPA Element 22
(Data) Validation and Verification Methods ndash EPA Element 23
Deerfield River Watershed Association
22 Data Review Validation and Verification ndash Summarized bullet list
All data reviewed by the Project Coordinator and QA Coordinator
Data Analysis QC Checks will includebull Data entry checks by a second personbull Computer entries compared with fieldlab sheetsbull Checks on graphs amp all other data representationsbull Calculation of measures of data quality including completeness
Corrective actionsbull Data entry errors corrected bull Data outside expected range flagged or rejected bull 2nd field sample andor laboratory aliquot taken when possiblebull Data quality problems discussed in draft and final reports
(Data) Validation and Verification Methods ndash EPA Element 23 From Inland QAPP
Validation and Verification Methods will include checks on bull Completion of all fields on data sheets missing data sheetsbull Completeness of sampling runs (eg number of sites visitedsamples taken vs number proposed were all parameters sampledanalyzed)bull Completeness of QC checks (eg number and type of QC checks performed vs numbertype proposed)bull Accuracy and precision compared to data quality objectivesbull Representativeness of samples and resulting data by examining survey metadata for unusual conditions and occurrences that may have impacted the validity of results
Deerfield River Watershed Association ndash Excerpt summarized
23 Validation and Verification Methods
The following simple measures of data quality will be calculated and included in the final report
1) To screen for contamination the average blank concentration hellip will be calculated This average value should be as close as practical to the Reporting Limit listed in Table 4
2) To assess the precision of results the ldquoMean Relative Percent Differencerdquo between field duplicate samples should be calculated The average RPD should be less than or equal to the Estimated Precision listed in Table 4 This simple measure is calculated as follows
RPD formula used hellip
Reconciliation With Data Quality Objectives ndash EPA Element 24MassWWP guide to QAPP development
What to Include bull List who will evaluate your actual data vs your data quality goals bull State how and when this will be done bull Describe the process for determining what to do if goals are not met
Neponset River Watershed Association
D2 Reconciliation with User Requirements - Summarized bulletedbull Following each sampling event and prior to the subsequent event calculations and
determinations for precision completeness and accuracy will be made bull Any corrective action will be implemented noted and initialized by the project manager bull If data quality indicators do not meet the projectrsquos specifications then data may be discarded
may be flagged or re-sampling may occur bull Investigation of problems will take place and corrections will be documented If equipment
failure is found to be the cause calibration and maintenance techniques will be reassessed Field duplicate testing may occur during the next sampling event to ensure confidence in the results
bull Any limitations on the data will be noted bull Any revisions to the project will be submitted to EPA and DEP quality assurance officers for
approval
Assessment and Response Actions - EPA Element 20 From Inland QAPP
Document that the progress and quality of the monitoring program will be continuously assessed to ensure that its objectives are being accomplished
The Monitoring Coordinator will periodically check to see the following bull Monitoring is occurring as planned bull Sufficient written commentary and supporting photographs exist bull Sufficient volunteers are available bull Volunteers have been observed as they sample their sites bull Samplers are collecting in accordance with project schedules bull Data sheets and custody control sheets are being properly completed and signed bull Data are properly interpreted bull Plans for dealing with adverse weather are in place
Assessment and Response Actions - EPA Element 20 From Inland QAPP ndash continued
The Monitoring Coordinator will periodically check to see the following bull Retraining or other corrective action is implemented at the first hint of non compliance with the
QAPP or SOPs bull Labs are adhering to the requirements of their QAPP in terms of work performed accuracy
acceptable holding times timely and understandable results and delivery process bull Data management is being handled properly ie data are entered on a timely basis is
properly backed up is easily accessed and raw data are properly stored in a safe placebull Procedure for developing and reporting the results exists
Assessment and Response Actions - EPA Element 20 From Inland QAPP ndash continued
The Monitoring Coordinator will confer with the QA Officer as necessary to discuss any problems that occur and what corrective actions are needed to maintain program integrity In addition the Monitoring Coordinator and QA Officer will meet at the end of the sampling season to review the draft report and discuss all aspects of the program and identify necessary program modifications for future sampling activities [If the program includes a technical advisory committee the TAC will be included in these discussions] Corrections may include retraining volunteers rewriting sampling instructions replacement of volunteers alteration of sampling schedules sites or methods or other actions deemed necessary All problems discovered and program modifications made will be documented in the final version of the project report If modifications require changes in the Quality Assurance Project Plan these changes will be submitted MassDEP for review
Deerfield River Watershed Association
20 Assessment and Response Actions ndash Summarized bullet list
bull There will be an on-site visit by the Quality Control Officer to observe field sampling and field analysis procedures Generally this will be done near the beginning of the project
bull A written checklist will be used for the assessments maintained by the Project Coordinator and copies will be provided with the data report
bull The Project Coordinator and QC Officer will determine if field work follows the written procedures or if there needs to be corrections by additional training or revising protocols
bull Please refer to Section 22 for additional evaluations and response actions regarding data evaluations
Reports ndash EPA Element 21
Project Task Organization ndash EPA Element 4 Reviewrevise early choices
Distribution List ndash EPA Element 3
Title and Approval Page - EPA Element 1
Table of Contents ndash EPA Element 2
Water quality monitoring quality assurance workshop
Terminology
Study design
QAPP
sampling and analysis plan
standard operating procedures
data quality objectives
Water Quality Monitoring Planning Process
Monitoring program activities
Why do you need (who Gives) a qapp
Slide Number 11
Slide Number 12
Steps to Developing a QAPP
Slide Number 14
Slide Number 15
Slide Number 16
Steps to Developing a QAPP
Slide Number 18
Slide Number 19
Slide Number 20
Slide Number 21
Slide Number 22
Slide Number 23
Slide Number 24
Sources of Information About Massachusetts Waters
Slide Number 26
Slide Number 27
Slide Number 28
Slide Number 29
Slide Number 30
Slide Number 31
Slide Number 32
Slide Number 33
Slide Number 34
Slide Number 35
Slide Number 36
Slide Number 37
Slide Number 38
Slide Number 39
Slide Number 40
Slide Number 41
Slide Number 42
Slide Number 43
Slide Number 44
Slide Number 45
Slide Number 46
MassDEP - Recommended Minimum Sample Number Frequency and Timing for Example Parameters
Slide Number 48
Slide Number 49
Slide Number 50
Slide Number 51
Slide Number 52
MaDep - Recommended Minimum Sample Number Frequency and Timing for Example Parameters
Slide Number 54
Slide Number 55
Slide Number 56
Slide Number 57
Slide Number 58
Slide Number 59
Slide Number 60
Slide Number 61
Slide Number 62
Slide Number 63
Slide Number 64
Slide Number 65
Slide Number 66
Slide Number 67
Slide Number 68
Slide Number 69
Slide Number 70
Slide Number 71
Slide Number 72
Slide Number 73
Slide Number 74
Slide Number 75
Slide Number 76
Precision DQOs Dealing with low-level concentrations
Slide Number 78
Slide Number 79
Slide Number 80
Slide Number 81
Slide Number 82
Documentation and Records ndash EPA Element 9
Slide Number 84
Slide Number 85
Slide Number 86
Slide Number 87
Slide Number 88
Slide Number 89
Slide Number 90
Slide Number 91
Slide Number 92
Slide Number 93
Slide Number 94
Slide Number 95
Slide Number 96
Slide Number 97
Slide Number 98
Slide Number 99
Slide Number 100
Deerfield River Watershed Association
14 Quality Control Requirements ndash continued
C Laboratory QC ChecksA Lab Duplicate will be analyzed each sampling day The lab will split a randomly chosen sample and analyze both subsamples
The lab will run a Lab Blank and a Positive Sample for bacteria each collection (see section 7)
D Data Analysis QC ChecksRiver data and QC data will be reviewed by the QC Officer as soon as they come in from the lab after each collection QC data will be compared to the quality objectives (eg blanks should have zero colonies sample duplicates should be within 3 standard deviations of the mean positives should show bacterial growth etc) River data will be reviewed as well to ensurethat no field or lab contamination has occurred (data will be compared to those of other sites and of previous collections)
Bacteria computations will be checked and validated If discrepancies are found the Lab Director will be called to resolve the discrepancy and corrections will be made by the QC Officer
Field data sheets will be also reviewed the day of collection by the Project Coordinator and later by the QC Officer to ensure that samples were taken at the right times and that all the required information has been filled out The Project Coordinator or collectors will be called if omissions or errors are detected If needed corrections will be made (signed anddated) on the field sheet by the QC Officer
Neponset River Watershed Association
PRECISION DQOS DEALING WITH LOW-LEVEL CONCENTRATIONS
Source Analyte Units PrecisionMassDEP WPP Monitoring QAPP
Training Requirements Certification ndash EPA Element 8
In Narrative or Table Format
bull List type of training (eg Field WQ lab analysis visual observation data mgt data entry etc)
bull Who is training who receives training
bull How often training done
If training records are kept (they should be) include that in section 9 on documentation and records
Neponset River Watershed Association
A8 Training - ExcerptTo ensure the high quality and usability of the data that is generated by the CWMN program all participants receive training appropriate to the tasks for which they will be responsible NepRWA staff that are involved in the program are professionals with extensive training in water quality chemistry biology and field sampling NepRWA has established a program of training for volunteers that includes initial training follow-up and refresher classes These classes are given by NepRWA staff that are qualified not only in the technical matter covered but in training and education
The initial training for volunteer monitors is primarily instruction and demonstration by the trainer with repetition by the volunteer This training includes an overview of the entire project and detailed instruction in sampling procedures All monitors receive and review a copy of NepRWArsquos Water Monitoring and Sampling Manual (see Appendix 3a)
After their initial training all volunteers participate in a mandatory annual group andor individual training session These sessions are designed to update the volunteers on changes in the program further train them in equipment calibration and field-testing procedures and evaluate each volunteerrsquos performancehellip
InstrumentEquipment Testing Inspection and Maintenance Requirements ndash EPA Element 15
Instrument Calibration and Frequency ndash EPA Element 16
InspectionAcceptance Requirements for Supplies ndash EPA Element 17
DOCUMENTATION AND RECORDS ndash EPA ELEMENT 9
Neponset River Watershed AssociationA9 Documents and RecordsA9-1 Data SheetsField data sheets include information about the site location (NepRWA ID number) which specific equipment was used to make measurements (thermometer number) the sampling method used (direct fill pole or Bridge Buddy) and equipment calibration results The field data sheets are also used to record temperature velocity depth color odor and turbidity information (Appendix 4e)helliphellip See Appendix 4 for copies of the various data sheets used in the CWMN program
A9-2 Chain of Custody FormsA9-3 Sample LabelingA9-4 Equipment Custody FormA9-5 Training and Evaluation Form
Data Acquisition Requirements - EPA Element 18
Purpose To ensure that any data you use but donrsquot collect yourself has a known data quality and is consistent with your data quality objectives that others can access these data and that your use of the data is appropriate
Describe any external data you use such as GPS coordinates for site locations weather station rainfall amounts etc
Include bull The title of the document or name of the informationbull Where you obtained it and where others may find itbull Notes on the quality of the outside information such as uncertainties and caveats
Preamble to Elements 19 through 24
Consider the four separate objectives of these chapters1) Producing a good data set - 19 covers the normal data mgt routines you do to prevent data mistakes in the first place- 22 amp23 describe how you review the resulting data sets - how you find and correct
missing or erroneous data - 19 22 and 23 should produce as complete amp accurate a data set as possible 2) Ensuring that any use you make of your data is justified In 24 you decide how usable your data are Review the final data set that the above efforts have produced Compare it with your DQOs to determine whether you have to discard or qualify any data what conclusions you can draw from your data or what changes you might need to make in your DQOs3) Improve overall project performance 20 deals with how well volunteers laboratories and equipment are operating It looks at function not outcomes Who evaluates the various components of your program when problems are found what corrections are made to make your program run better4) Report your results After yoursquove run these various checks you are ready to release your data In Chapter 21 you describe the reports you will issue
Suggested order bull Data Management (19)bull Data Review Validation and Verification Requirements (22)bull (Data) Validation and Verification Methods (23)
bull Reconciliation with Data Quality Objectives (24)
bull Assessment and Response Actions (20)
bull Reports (21)
EPA Elements 19 ndash 24
bull Data Management (19)bull Assessment and Response Actions (20) bull Reports (21)bull Data Review Validation and Verification Requirements (22)bull (Data) Validation and Verification Methods (23)bull Reconciliation with Data Quality Objectives (24)
Data Management ndash EPA Element 19
Follow the data from the moment itrsquos recorded through every step to final report databaseIntent is to prevent errors or loss of data or be able to correct in timely manner
bull Before each activitystep is conducted well-designed field sheets checklists COC forms data entry software auto-QC calculations out-of-bounds highlights etc
bull During each step sheets filled completely checklist reviewed before leaving site etc
bull Immediately after Computer-entered data compared with field sheets etc
bull Long term preservation Data storage
Neponset River Watershed Association
B9 Data ManagementThe Project Manager is responsible for overseeing all data management activities Refer also to section D below for additional discussion of data review verification and validation practices
B9-1 Raw DataField data sheets are collected with the samples The sheets are turned into the NepRWA office by the site coordinators The forms are then reviewed for illegible answers errors or questionable values and checked for consistency with the COC and bottle labels as described in Appendix 3l Any questions are referred to the volunteer for clarification NepRWA staff makes corrections by crossing out the errors and writing in the correct answer All corrections must be initialed
B9-2 Data Entry and ValidationOnce the information has undergone a preliminary check it is entered into a Filemaker database The software has been customized to the data sheet Fields within the worksheet have been set-up with limits based on expected results This helps to minimize entry errors Entered data is then checked against the data sheets by another volunteer or staff person
B9-3 Data StorageThe original data sheets are filed into an event file and stored in NepRWArsquos permanent files Electronic copies of data are maintained on a secure Filemaker server Data files are kept in perpetuity along with hard copies of volunteer data sheets All electronic data is backed-up daily on to a password-protected hard drive
Data Review Validation and Verificationndash EPA Element 22
(Data) Validation and Verification Methods ndash EPA Element 23
Deerfield River Watershed Association
22 Data Review Validation and Verification ndash Summarized bullet list
All data reviewed by the Project Coordinator and QA Coordinator
Data Analysis QC Checks will includebull Data entry checks by a second personbull Computer entries compared with fieldlab sheetsbull Checks on graphs amp all other data representationsbull Calculation of measures of data quality including completeness
Corrective actionsbull Data entry errors corrected bull Data outside expected range flagged or rejected bull 2nd field sample andor laboratory aliquot taken when possiblebull Data quality problems discussed in draft and final reports
(Data) Validation and Verification Methods ndash EPA Element 23 From Inland QAPP
Validation and Verification Methods will include checks on bull Completion of all fields on data sheets missing data sheetsbull Completeness of sampling runs (eg number of sites visitedsamples taken vs number proposed were all parameters sampledanalyzed)bull Completeness of QC checks (eg number and type of QC checks performed vs numbertype proposed)bull Accuracy and precision compared to data quality objectivesbull Representativeness of samples and resulting data by examining survey metadata for unusual conditions and occurrences that may have impacted the validity of results
Deerfield River Watershed Association ndash Excerpt summarized
23 Validation and Verification Methods
The following simple measures of data quality will be calculated and included in the final report
1) To screen for contamination the average blank concentration hellip will be calculated This average value should be as close as practical to the Reporting Limit listed in Table 4
2) To assess the precision of results the ldquoMean Relative Percent Differencerdquo between field duplicate samples should be calculated The average RPD should be less than or equal to the Estimated Precision listed in Table 4 This simple measure is calculated as follows
RPD formula used hellip
Reconciliation With Data Quality Objectives ndash EPA Element 24MassWWP guide to QAPP development
What to Include bull List who will evaluate your actual data vs your data quality goals bull State how and when this will be done bull Describe the process for determining what to do if goals are not met
Neponset River Watershed Association
D2 Reconciliation with User Requirements - Summarized bulletedbull Following each sampling event and prior to the subsequent event calculations and
determinations for precision completeness and accuracy will be made bull Any corrective action will be implemented noted and initialized by the project manager bull If data quality indicators do not meet the projectrsquos specifications then data may be discarded
may be flagged or re-sampling may occur bull Investigation of problems will take place and corrections will be documented If equipment
failure is found to be the cause calibration and maintenance techniques will be reassessed Field duplicate testing may occur during the next sampling event to ensure confidence in the results
bull Any limitations on the data will be noted bull Any revisions to the project will be submitted to EPA and DEP quality assurance officers for
approval
Assessment and Response Actions - EPA Element 20 From Inland QAPP
Document that the progress and quality of the monitoring program will be continuously assessed to ensure that its objectives are being accomplished
The Monitoring Coordinator will periodically check to see the following bull Monitoring is occurring as planned bull Sufficient written commentary and supporting photographs exist bull Sufficient volunteers are available bull Volunteers have been observed as they sample their sites bull Samplers are collecting in accordance with project schedules bull Data sheets and custody control sheets are being properly completed and signed bull Data are properly interpreted bull Plans for dealing with adverse weather are in place
Assessment and Response Actions - EPA Element 20 From Inland QAPP ndash continued
The Monitoring Coordinator will periodically check to see the following bull Retraining or other corrective action is implemented at the first hint of non compliance with the
QAPP or SOPs bull Labs are adhering to the requirements of their QAPP in terms of work performed accuracy
acceptable holding times timely and understandable results and delivery process bull Data management is being handled properly ie data are entered on a timely basis is
properly backed up is easily accessed and raw data are properly stored in a safe placebull Procedure for developing and reporting the results exists
Assessment and Response Actions - EPA Element 20 From Inland QAPP ndash continued
The Monitoring Coordinator will confer with the QA Officer as necessary to discuss any problems that occur and what corrective actions are needed to maintain program integrity In addition the Monitoring Coordinator and QA Officer will meet at the end of the sampling season to review the draft report and discuss all aspects of the program and identify necessary program modifications for future sampling activities [If the program includes a technical advisory committee the TAC will be included in these discussions] Corrections may include retraining volunteers rewriting sampling instructions replacement of volunteers alteration of sampling schedules sites or methods or other actions deemed necessary All problems discovered and program modifications made will be documented in the final version of the project report If modifications require changes in the Quality Assurance Project Plan these changes will be submitted MassDEP for review
Deerfield River Watershed Association
20 Assessment and Response Actions ndash Summarized bullet list
bull There will be an on-site visit by the Quality Control Officer to observe field sampling and field analysis procedures Generally this will be done near the beginning of the project
bull A written checklist will be used for the assessments maintained by the Project Coordinator and copies will be provided with the data report
bull The Project Coordinator and QC Officer will determine if field work follows the written procedures or if there needs to be corrections by additional training or revising protocols
bull Please refer to Section 22 for additional evaluations and response actions regarding data evaluations
Reports ndash EPA Element 21
Project Task Organization ndash EPA Element 4 Reviewrevise early choices
Distribution List ndash EPA Element 3
Title and Approval Page - EPA Element 1
Table of Contents ndash EPA Element 2
Water quality monitoring quality assurance workshop
Terminology
Study design
QAPP
sampling and analysis plan
standard operating procedures
data quality objectives
Water Quality Monitoring Planning Process
Monitoring program activities
Why do you need (who Gives) a qapp
Slide Number 11
Slide Number 12
Steps to Developing a QAPP
Slide Number 14
Slide Number 15
Slide Number 16
Steps to Developing a QAPP
Slide Number 18
Slide Number 19
Slide Number 20
Slide Number 21
Slide Number 22
Slide Number 23
Slide Number 24
Sources of Information About Massachusetts Waters
Slide Number 26
Slide Number 27
Slide Number 28
Slide Number 29
Slide Number 30
Slide Number 31
Slide Number 32
Slide Number 33
Slide Number 34
Slide Number 35
Slide Number 36
Slide Number 37
Slide Number 38
Slide Number 39
Slide Number 40
Slide Number 41
Slide Number 42
Slide Number 43
Slide Number 44
Slide Number 45
Slide Number 46
MassDEP - Recommended Minimum Sample Number Frequency and Timing for Example Parameters
Slide Number 48
Slide Number 49
Slide Number 50
Slide Number 51
Slide Number 52
MaDep - Recommended Minimum Sample Number Frequency and Timing for Example Parameters
Slide Number 54
Slide Number 55
Slide Number 56
Slide Number 57
Slide Number 58
Slide Number 59
Slide Number 60
Slide Number 61
Slide Number 62
Slide Number 63
Slide Number 64
Slide Number 65
Slide Number 66
Slide Number 67
Slide Number 68
Slide Number 69
Slide Number 70
Slide Number 71
Slide Number 72
Slide Number 73
Slide Number 74
Slide Number 75
Slide Number 76
Precision DQOs Dealing with low-level concentrations
Slide Number 78
Slide Number 79
Slide Number 80
Slide Number 81
Slide Number 82
Documentation and Records ndash EPA Element 9
Slide Number 84
Slide Number 85
Slide Number 86
Slide Number 87
Slide Number 88
Slide Number 89
Slide Number 90
Slide Number 91
Slide Number 92
Slide Number 93
Slide Number 94
Slide Number 95
Slide Number 96
Slide Number 97
Slide Number 98
Slide Number 99
Slide Number 100
Neponset River Watershed Association
PRECISION DQOS DEALING WITH LOW-LEVEL CONCENTRATIONS
Source Analyte Units PrecisionMassDEP WPP Monitoring QAPP
Training Requirements Certification ndash EPA Element 8
In Narrative or Table Format
bull List type of training (eg Field WQ lab analysis visual observation data mgt data entry etc)
bull Who is training who receives training
bull How often training done
If training records are kept (they should be) include that in section 9 on documentation and records
Neponset River Watershed Association
A8 Training - ExcerptTo ensure the high quality and usability of the data that is generated by the CWMN program all participants receive training appropriate to the tasks for which they will be responsible NepRWA staff that are involved in the program are professionals with extensive training in water quality chemistry biology and field sampling NepRWA has established a program of training for volunteers that includes initial training follow-up and refresher classes These classes are given by NepRWA staff that are qualified not only in the technical matter covered but in training and education
The initial training for volunteer monitors is primarily instruction and demonstration by the trainer with repetition by the volunteer This training includes an overview of the entire project and detailed instruction in sampling procedures All monitors receive and review a copy of NepRWArsquos Water Monitoring and Sampling Manual (see Appendix 3a)
After their initial training all volunteers participate in a mandatory annual group andor individual training session These sessions are designed to update the volunteers on changes in the program further train them in equipment calibration and field-testing procedures and evaluate each volunteerrsquos performancehellip
InstrumentEquipment Testing Inspection and Maintenance Requirements ndash EPA Element 15
Instrument Calibration and Frequency ndash EPA Element 16
InspectionAcceptance Requirements for Supplies ndash EPA Element 17
DOCUMENTATION AND RECORDS ndash EPA ELEMENT 9
Neponset River Watershed AssociationA9 Documents and RecordsA9-1 Data SheetsField data sheets include information about the site location (NepRWA ID number) which specific equipment was used to make measurements (thermometer number) the sampling method used (direct fill pole or Bridge Buddy) and equipment calibration results The field data sheets are also used to record temperature velocity depth color odor and turbidity information (Appendix 4e)helliphellip See Appendix 4 for copies of the various data sheets used in the CWMN program
A9-2 Chain of Custody FormsA9-3 Sample LabelingA9-4 Equipment Custody FormA9-5 Training and Evaluation Form
Data Acquisition Requirements - EPA Element 18
Purpose To ensure that any data you use but donrsquot collect yourself has a known data quality and is consistent with your data quality objectives that others can access these data and that your use of the data is appropriate
Describe any external data you use such as GPS coordinates for site locations weather station rainfall amounts etc
Include bull The title of the document or name of the informationbull Where you obtained it and where others may find itbull Notes on the quality of the outside information such as uncertainties and caveats
Preamble to Elements 19 through 24
Consider the four separate objectives of these chapters1) Producing a good data set - 19 covers the normal data mgt routines you do to prevent data mistakes in the first place- 22 amp23 describe how you review the resulting data sets - how you find and correct
missing or erroneous data - 19 22 and 23 should produce as complete amp accurate a data set as possible 2) Ensuring that any use you make of your data is justified In 24 you decide how usable your data are Review the final data set that the above efforts have produced Compare it with your DQOs to determine whether you have to discard or qualify any data what conclusions you can draw from your data or what changes you might need to make in your DQOs3) Improve overall project performance 20 deals with how well volunteers laboratories and equipment are operating It looks at function not outcomes Who evaluates the various components of your program when problems are found what corrections are made to make your program run better4) Report your results After yoursquove run these various checks you are ready to release your data In Chapter 21 you describe the reports you will issue
Suggested order bull Data Management (19)bull Data Review Validation and Verification Requirements (22)bull (Data) Validation and Verification Methods (23)
bull Reconciliation with Data Quality Objectives (24)
bull Assessment and Response Actions (20)
bull Reports (21)
EPA Elements 19 ndash 24
bull Data Management (19)bull Assessment and Response Actions (20) bull Reports (21)bull Data Review Validation and Verification Requirements (22)bull (Data) Validation and Verification Methods (23)bull Reconciliation with Data Quality Objectives (24)
Data Management ndash EPA Element 19
Follow the data from the moment itrsquos recorded through every step to final report databaseIntent is to prevent errors or loss of data or be able to correct in timely manner
bull Before each activitystep is conducted well-designed field sheets checklists COC forms data entry software auto-QC calculations out-of-bounds highlights etc
bull During each step sheets filled completely checklist reviewed before leaving site etc
bull Immediately after Computer-entered data compared with field sheets etc
bull Long term preservation Data storage
Neponset River Watershed Association
B9 Data ManagementThe Project Manager is responsible for overseeing all data management activities Refer also to section D below for additional discussion of data review verification and validation practices
B9-1 Raw DataField data sheets are collected with the samples The sheets are turned into the NepRWA office by the site coordinators The forms are then reviewed for illegible answers errors or questionable values and checked for consistency with the COC and bottle labels as described in Appendix 3l Any questions are referred to the volunteer for clarification NepRWA staff makes corrections by crossing out the errors and writing in the correct answer All corrections must be initialed
B9-2 Data Entry and ValidationOnce the information has undergone a preliminary check it is entered into a Filemaker database The software has been customized to the data sheet Fields within the worksheet have been set-up with limits based on expected results This helps to minimize entry errors Entered data is then checked against the data sheets by another volunteer or staff person
B9-3 Data StorageThe original data sheets are filed into an event file and stored in NepRWArsquos permanent files Electronic copies of data are maintained on a secure Filemaker server Data files are kept in perpetuity along with hard copies of volunteer data sheets All electronic data is backed-up daily on to a password-protected hard drive
Data Review Validation and Verificationndash EPA Element 22
(Data) Validation and Verification Methods ndash EPA Element 23
Deerfield River Watershed Association
22 Data Review Validation and Verification ndash Summarized bullet list
All data reviewed by the Project Coordinator and QA Coordinator
Data Analysis QC Checks will includebull Data entry checks by a second personbull Computer entries compared with fieldlab sheetsbull Checks on graphs amp all other data representationsbull Calculation of measures of data quality including completeness
Corrective actionsbull Data entry errors corrected bull Data outside expected range flagged or rejected bull 2nd field sample andor laboratory aliquot taken when possiblebull Data quality problems discussed in draft and final reports
(Data) Validation and Verification Methods ndash EPA Element 23 From Inland QAPP
Validation and Verification Methods will include checks on bull Completion of all fields on data sheets missing data sheetsbull Completeness of sampling runs (eg number of sites visitedsamples taken vs number proposed were all parameters sampledanalyzed)bull Completeness of QC checks (eg number and type of QC checks performed vs numbertype proposed)bull Accuracy and precision compared to data quality objectivesbull Representativeness of samples and resulting data by examining survey metadata for unusual conditions and occurrences that may have impacted the validity of results
Deerfield River Watershed Association ndash Excerpt summarized
23 Validation and Verification Methods
The following simple measures of data quality will be calculated and included in the final report
1) To screen for contamination the average blank concentration hellip will be calculated This average value should be as close as practical to the Reporting Limit listed in Table 4
2) To assess the precision of results the ldquoMean Relative Percent Differencerdquo between field duplicate samples should be calculated The average RPD should be less than or equal to the Estimated Precision listed in Table 4 This simple measure is calculated as follows
RPD formula used hellip
Reconciliation With Data Quality Objectives ndash EPA Element 24MassWWP guide to QAPP development
What to Include bull List who will evaluate your actual data vs your data quality goals bull State how and when this will be done bull Describe the process for determining what to do if goals are not met
Neponset River Watershed Association
D2 Reconciliation with User Requirements - Summarized bulletedbull Following each sampling event and prior to the subsequent event calculations and
determinations for precision completeness and accuracy will be made bull Any corrective action will be implemented noted and initialized by the project manager bull If data quality indicators do not meet the projectrsquos specifications then data may be discarded
may be flagged or re-sampling may occur bull Investigation of problems will take place and corrections will be documented If equipment
failure is found to be the cause calibration and maintenance techniques will be reassessed Field duplicate testing may occur during the next sampling event to ensure confidence in the results
bull Any limitations on the data will be noted bull Any revisions to the project will be submitted to EPA and DEP quality assurance officers for
approval
Assessment and Response Actions - EPA Element 20 From Inland QAPP
Document that the progress and quality of the monitoring program will be continuously assessed to ensure that its objectives are being accomplished
The Monitoring Coordinator will periodically check to see the following bull Monitoring is occurring as planned bull Sufficient written commentary and supporting photographs exist bull Sufficient volunteers are available bull Volunteers have been observed as they sample their sites bull Samplers are collecting in accordance with project schedules bull Data sheets and custody control sheets are being properly completed and signed bull Data are properly interpreted bull Plans for dealing with adverse weather are in place
Assessment and Response Actions - EPA Element 20 From Inland QAPP ndash continued
The Monitoring Coordinator will periodically check to see the following bull Retraining or other corrective action is implemented at the first hint of non compliance with the
QAPP or SOPs bull Labs are adhering to the requirements of their QAPP in terms of work performed accuracy
acceptable holding times timely and understandable results and delivery process bull Data management is being handled properly ie data are entered on a timely basis is
properly backed up is easily accessed and raw data are properly stored in a safe placebull Procedure for developing and reporting the results exists
Assessment and Response Actions - EPA Element 20 From Inland QAPP ndash continued
The Monitoring Coordinator will confer with the QA Officer as necessary to discuss any problems that occur and what corrective actions are needed to maintain program integrity In addition the Monitoring Coordinator and QA Officer will meet at the end of the sampling season to review the draft report and discuss all aspects of the program and identify necessary program modifications for future sampling activities [If the program includes a technical advisory committee the TAC will be included in these discussions] Corrections may include retraining volunteers rewriting sampling instructions replacement of volunteers alteration of sampling schedules sites or methods or other actions deemed necessary All problems discovered and program modifications made will be documented in the final version of the project report If modifications require changes in the Quality Assurance Project Plan these changes will be submitted MassDEP for review
Deerfield River Watershed Association
20 Assessment and Response Actions ndash Summarized bullet list
bull There will be an on-site visit by the Quality Control Officer to observe field sampling and field analysis procedures Generally this will be done near the beginning of the project
bull A written checklist will be used for the assessments maintained by the Project Coordinator and copies will be provided with the data report
bull The Project Coordinator and QC Officer will determine if field work follows the written procedures or if there needs to be corrections by additional training or revising protocols
bull Please refer to Section 22 for additional evaluations and response actions regarding data evaluations
Reports ndash EPA Element 21
Project Task Organization ndash EPA Element 4 Reviewrevise early choices
Distribution List ndash EPA Element 3
Title and Approval Page - EPA Element 1
Table of Contents ndash EPA Element 2
Water quality monitoring quality assurance workshop
Terminology
Study design
QAPP
sampling and analysis plan
standard operating procedures
data quality objectives
Water Quality Monitoring Planning Process
Monitoring program activities
Why do you need (who Gives) a qapp
Slide Number 11
Slide Number 12
Steps to Developing a QAPP
Slide Number 14
Slide Number 15
Slide Number 16
Steps to Developing a QAPP
Slide Number 18
Slide Number 19
Slide Number 20
Slide Number 21
Slide Number 22
Slide Number 23
Slide Number 24
Sources of Information About Massachusetts Waters
Slide Number 26
Slide Number 27
Slide Number 28
Slide Number 29
Slide Number 30
Slide Number 31
Slide Number 32
Slide Number 33
Slide Number 34
Slide Number 35
Slide Number 36
Slide Number 37
Slide Number 38
Slide Number 39
Slide Number 40
Slide Number 41
Slide Number 42
Slide Number 43
Slide Number 44
Slide Number 45
Slide Number 46
MassDEP - Recommended Minimum Sample Number Frequency and Timing for Example Parameters
Slide Number 48
Slide Number 49
Slide Number 50
Slide Number 51
Slide Number 52
MaDep - Recommended Minimum Sample Number Frequency and Timing for Example Parameters
Slide Number 54
Slide Number 55
Slide Number 56
Slide Number 57
Slide Number 58
Slide Number 59
Slide Number 60
Slide Number 61
Slide Number 62
Slide Number 63
Slide Number 64
Slide Number 65
Slide Number 66
Slide Number 67
Slide Number 68
Slide Number 69
Slide Number 70
Slide Number 71
Slide Number 72
Slide Number 73
Slide Number 74
Slide Number 75
Slide Number 76
Precision DQOs Dealing with low-level concentrations
Slide Number 78
Slide Number 79
Slide Number 80
Slide Number 81
Slide Number 82
Documentation and Records ndash EPA Element 9
Slide Number 84
Slide Number 85
Slide Number 86
Slide Number 87
Slide Number 88
Slide Number 89
Slide Number 90
Slide Number 91
Slide Number 92
Slide Number 93
Slide Number 94
Slide Number 95
Slide Number 96
Slide Number 97
Slide Number 98
Slide Number 99
Slide Number 100
Neponset River Watershed Association
A8 Training - ExcerptTo ensure the high quality and usability of the data that is generated by the CWMN program all participants receive training appropriate to the tasks for which they will be responsible NepRWA staff that are involved in the program are professionals with extensive training in water quality chemistry biology and field sampling NepRWA has established a program of training for volunteers that includes initial training follow-up and refresher classes These classes are given by NepRWA staff that are qualified not only in the technical matter covered but in training and education
The initial training for volunteer monitors is primarily instruction and demonstration by the trainer with repetition by the volunteer This training includes an overview of the entire project and detailed instruction in sampling procedures All monitors receive and review a copy of NepRWArsquos Water Monitoring and Sampling Manual (see Appendix 3a)
After their initial training all volunteers participate in a mandatory annual group andor individual training session These sessions are designed to update the volunteers on changes in the program further train them in equipment calibration and field-testing procedures and evaluate each volunteerrsquos performancehellip
InstrumentEquipment Testing Inspection and Maintenance Requirements ndash EPA Element 15
Instrument Calibration and Frequency ndash EPA Element 16
InspectionAcceptance Requirements for Supplies ndash EPA Element 17
DOCUMENTATION AND RECORDS ndash EPA ELEMENT 9
Neponset River Watershed AssociationA9 Documents and RecordsA9-1 Data SheetsField data sheets include information about the site location (NepRWA ID number) which specific equipment was used to make measurements (thermometer number) the sampling method used (direct fill pole or Bridge Buddy) and equipment calibration results The field data sheets are also used to record temperature velocity depth color odor and turbidity information (Appendix 4e)helliphellip See Appendix 4 for copies of the various data sheets used in the CWMN program
A9-2 Chain of Custody FormsA9-3 Sample LabelingA9-4 Equipment Custody FormA9-5 Training and Evaluation Form
Data Acquisition Requirements - EPA Element 18
Purpose To ensure that any data you use but donrsquot collect yourself has a known data quality and is consistent with your data quality objectives that others can access these data and that your use of the data is appropriate
Describe any external data you use such as GPS coordinates for site locations weather station rainfall amounts etc
Include bull The title of the document or name of the informationbull Where you obtained it and where others may find itbull Notes on the quality of the outside information such as uncertainties and caveats
Preamble to Elements 19 through 24
Consider the four separate objectives of these chapters1) Producing a good data set - 19 covers the normal data mgt routines you do to prevent data mistakes in the first place- 22 amp23 describe how you review the resulting data sets - how you find and correct
missing or erroneous data - 19 22 and 23 should produce as complete amp accurate a data set as possible 2) Ensuring that any use you make of your data is justified In 24 you decide how usable your data are Review the final data set that the above efforts have produced Compare it with your DQOs to determine whether you have to discard or qualify any data what conclusions you can draw from your data or what changes you might need to make in your DQOs3) Improve overall project performance 20 deals with how well volunteers laboratories and equipment are operating It looks at function not outcomes Who evaluates the various components of your program when problems are found what corrections are made to make your program run better4) Report your results After yoursquove run these various checks you are ready to release your data In Chapter 21 you describe the reports you will issue
Suggested order bull Data Management (19)bull Data Review Validation and Verification Requirements (22)bull (Data) Validation and Verification Methods (23)
bull Reconciliation with Data Quality Objectives (24)
bull Assessment and Response Actions (20)
bull Reports (21)
EPA Elements 19 ndash 24
bull Data Management (19)bull Assessment and Response Actions (20) bull Reports (21)bull Data Review Validation and Verification Requirements (22)bull (Data) Validation and Verification Methods (23)bull Reconciliation with Data Quality Objectives (24)
Data Management ndash EPA Element 19
Follow the data from the moment itrsquos recorded through every step to final report databaseIntent is to prevent errors or loss of data or be able to correct in timely manner
bull Before each activitystep is conducted well-designed field sheets checklists COC forms data entry software auto-QC calculations out-of-bounds highlights etc
bull During each step sheets filled completely checklist reviewed before leaving site etc
bull Immediately after Computer-entered data compared with field sheets etc
bull Long term preservation Data storage
Neponset River Watershed Association
B9 Data ManagementThe Project Manager is responsible for overseeing all data management activities Refer also to section D below for additional discussion of data review verification and validation practices
B9-1 Raw DataField data sheets are collected with the samples The sheets are turned into the NepRWA office by the site coordinators The forms are then reviewed for illegible answers errors or questionable values and checked for consistency with the COC and bottle labels as described in Appendix 3l Any questions are referred to the volunteer for clarification NepRWA staff makes corrections by crossing out the errors and writing in the correct answer All corrections must be initialed
B9-2 Data Entry and ValidationOnce the information has undergone a preliminary check it is entered into a Filemaker database The software has been customized to the data sheet Fields within the worksheet have been set-up with limits based on expected results This helps to minimize entry errors Entered data is then checked against the data sheets by another volunteer or staff person
B9-3 Data StorageThe original data sheets are filed into an event file and stored in NepRWArsquos permanent files Electronic copies of data are maintained on a secure Filemaker server Data files are kept in perpetuity along with hard copies of volunteer data sheets All electronic data is backed-up daily on to a password-protected hard drive
Data Review Validation and Verificationndash EPA Element 22
(Data) Validation and Verification Methods ndash EPA Element 23
Deerfield River Watershed Association
22 Data Review Validation and Verification ndash Summarized bullet list
All data reviewed by the Project Coordinator and QA Coordinator
Data Analysis QC Checks will includebull Data entry checks by a second personbull Computer entries compared with fieldlab sheetsbull Checks on graphs amp all other data representationsbull Calculation of measures of data quality including completeness
Corrective actionsbull Data entry errors corrected bull Data outside expected range flagged or rejected bull 2nd field sample andor laboratory aliquot taken when possiblebull Data quality problems discussed in draft and final reports
(Data) Validation and Verification Methods ndash EPA Element 23 From Inland QAPP
Validation and Verification Methods will include checks on bull Completion of all fields on data sheets missing data sheetsbull Completeness of sampling runs (eg number of sites visitedsamples taken vs number proposed were all parameters sampledanalyzed)bull Completeness of QC checks (eg number and type of QC checks performed vs numbertype proposed)bull Accuracy and precision compared to data quality objectivesbull Representativeness of samples and resulting data by examining survey metadata for unusual conditions and occurrences that may have impacted the validity of results
Deerfield River Watershed Association ndash Excerpt summarized
23 Validation and Verification Methods
The following simple measures of data quality will be calculated and included in the final report
1) To screen for contamination the average blank concentration hellip will be calculated This average value should be as close as practical to the Reporting Limit listed in Table 4
2) To assess the precision of results the ldquoMean Relative Percent Differencerdquo between field duplicate samples should be calculated The average RPD should be less than or equal to the Estimated Precision listed in Table 4 This simple measure is calculated as follows
RPD formula used hellip
Reconciliation With Data Quality Objectives ndash EPA Element 24MassWWP guide to QAPP development
What to Include bull List who will evaluate your actual data vs your data quality goals bull State how and when this will be done bull Describe the process for determining what to do if goals are not met
Neponset River Watershed Association
D2 Reconciliation with User Requirements - Summarized bulletedbull Following each sampling event and prior to the subsequent event calculations and
determinations for precision completeness and accuracy will be made bull Any corrective action will be implemented noted and initialized by the project manager bull If data quality indicators do not meet the projectrsquos specifications then data may be discarded
may be flagged or re-sampling may occur bull Investigation of problems will take place and corrections will be documented If equipment
failure is found to be the cause calibration and maintenance techniques will be reassessed Field duplicate testing may occur during the next sampling event to ensure confidence in the results
bull Any limitations on the data will be noted bull Any revisions to the project will be submitted to EPA and DEP quality assurance officers for
approval
Assessment and Response Actions - EPA Element 20 From Inland QAPP
Document that the progress and quality of the monitoring program will be continuously assessed to ensure that its objectives are being accomplished
The Monitoring Coordinator will periodically check to see the following bull Monitoring is occurring as planned bull Sufficient written commentary and supporting photographs exist bull Sufficient volunteers are available bull Volunteers have been observed as they sample their sites bull Samplers are collecting in accordance with project schedules bull Data sheets and custody control sheets are being properly completed and signed bull Data are properly interpreted bull Plans for dealing with adverse weather are in place
Assessment and Response Actions - EPA Element 20 From Inland QAPP ndash continued
The Monitoring Coordinator will periodically check to see the following bull Retraining or other corrective action is implemented at the first hint of non compliance with the
QAPP or SOPs bull Labs are adhering to the requirements of their QAPP in terms of work performed accuracy
acceptable holding times timely and understandable results and delivery process bull Data management is being handled properly ie data are entered on a timely basis is
properly backed up is easily accessed and raw data are properly stored in a safe placebull Procedure for developing and reporting the results exists
Assessment and Response Actions - EPA Element 20 From Inland QAPP ndash continued
The Monitoring Coordinator will confer with the QA Officer as necessary to discuss any problems that occur and what corrective actions are needed to maintain program integrity In addition the Monitoring Coordinator and QA Officer will meet at the end of the sampling season to review the draft report and discuss all aspects of the program and identify necessary program modifications for future sampling activities [If the program includes a technical advisory committee the TAC will be included in these discussions] Corrections may include retraining volunteers rewriting sampling instructions replacement of volunteers alteration of sampling schedules sites or methods or other actions deemed necessary All problems discovered and program modifications made will be documented in the final version of the project report If modifications require changes in the Quality Assurance Project Plan these changes will be submitted MassDEP for review
Deerfield River Watershed Association
20 Assessment and Response Actions ndash Summarized bullet list
bull There will be an on-site visit by the Quality Control Officer to observe field sampling and field analysis procedures Generally this will be done near the beginning of the project
bull A written checklist will be used for the assessments maintained by the Project Coordinator and copies will be provided with the data report
bull The Project Coordinator and QC Officer will determine if field work follows the written procedures or if there needs to be corrections by additional training or revising protocols
bull Please refer to Section 22 for additional evaluations and response actions regarding data evaluations
Reports ndash EPA Element 21
Project Task Organization ndash EPA Element 4 Reviewrevise early choices
Distribution List ndash EPA Element 3
Title and Approval Page - EPA Element 1
Table of Contents ndash EPA Element 2
Water quality monitoring quality assurance workshop
Terminology
Study design
QAPP
sampling and analysis plan
standard operating procedures
data quality objectives
Water Quality Monitoring Planning Process
Monitoring program activities
Why do you need (who Gives) a qapp
Slide Number 11
Slide Number 12
Steps to Developing a QAPP
Slide Number 14
Slide Number 15
Slide Number 16
Steps to Developing a QAPP
Slide Number 18
Slide Number 19
Slide Number 20
Slide Number 21
Slide Number 22
Slide Number 23
Slide Number 24
Sources of Information About Massachusetts Waters
Slide Number 26
Slide Number 27
Slide Number 28
Slide Number 29
Slide Number 30
Slide Number 31
Slide Number 32
Slide Number 33
Slide Number 34
Slide Number 35
Slide Number 36
Slide Number 37
Slide Number 38
Slide Number 39
Slide Number 40
Slide Number 41
Slide Number 42
Slide Number 43
Slide Number 44
Slide Number 45
Slide Number 46
MassDEP - Recommended Minimum Sample Number Frequency and Timing for Example Parameters
Slide Number 48
Slide Number 49
Slide Number 50
Slide Number 51
Slide Number 52
MaDep - Recommended Minimum Sample Number Frequency and Timing for Example Parameters
Slide Number 54
Slide Number 55
Slide Number 56
Slide Number 57
Slide Number 58
Slide Number 59
Slide Number 60
Slide Number 61
Slide Number 62
Slide Number 63
Slide Number 64
Slide Number 65
Slide Number 66
Slide Number 67
Slide Number 68
Slide Number 69
Slide Number 70
Slide Number 71
Slide Number 72
Slide Number 73
Slide Number 74
Slide Number 75
Slide Number 76
Precision DQOs Dealing with low-level concentrations
Slide Number 78
Slide Number 79
Slide Number 80
Slide Number 81
Slide Number 82
Documentation and Records ndash EPA Element 9
Slide Number 84
Slide Number 85
Slide Number 86
Slide Number 87
Slide Number 88
Slide Number 89
Slide Number 90
Slide Number 91
Slide Number 92
Slide Number 93
Slide Number 94
Slide Number 95
Slide Number 96
Slide Number 97
Slide Number 98
Slide Number 99
Slide Number 100
Neponset River Watershed Association
B9 Data ManagementThe Project Manager is responsible for overseeing all data management activities Refer also to section D below for additional discussion of data review verification and validation practices
B9-1 Raw DataField data sheets are collected with the samples The sheets are turned into the NepRWA office by the site coordinators The forms are then reviewed for illegible answers errors or questionable values and checked for consistency with the COC and bottle labels as described in Appendix 3l Any questions are referred to the volunteer for clarification NepRWA staff makes corrections by crossing out the errors and writing in the correct answer All corrections must be initialed
B9-2 Data Entry and ValidationOnce the information has undergone a preliminary check it is entered into a Filemaker database The software has been customized to the data sheet Fields within the worksheet have been set-up with limits based on expected results This helps to minimize entry errors Entered data is then checked against the data sheets by another volunteer or staff person
B9-3 Data StorageThe original data sheets are filed into an event file and stored in NepRWArsquos permanent files Electronic copies of data are maintained on a secure Filemaker server Data files are kept in perpetuity along with hard copies of volunteer data sheets All electronic data is backed-up daily on to a password-protected hard drive
Data Review Validation and Verificationndash EPA Element 22
(Data) Validation and Verification Methods ndash EPA Element 23
Deerfield River Watershed Association
22 Data Review Validation and Verification ndash Summarized bullet list
All data reviewed by the Project Coordinator and QA Coordinator
Data Analysis QC Checks will includebull Data entry checks by a second personbull Computer entries compared with fieldlab sheetsbull Checks on graphs amp all other data representationsbull Calculation of measures of data quality including completeness
Corrective actionsbull Data entry errors corrected bull Data outside expected range flagged or rejected bull 2nd field sample andor laboratory aliquot taken when possiblebull Data quality problems discussed in draft and final reports
(Data) Validation and Verification Methods ndash EPA Element 23 From Inland QAPP
Validation and Verification Methods will include checks on bull Completion of all fields on data sheets missing data sheetsbull Completeness of sampling runs (eg number of sites visitedsamples taken vs number proposed were all parameters sampledanalyzed)bull Completeness of QC checks (eg number and type of QC checks performed vs numbertype proposed)bull Accuracy and precision compared to data quality objectivesbull Representativeness of samples and resulting data by examining survey metadata for unusual conditions and occurrences that may have impacted the validity of results
Deerfield River Watershed Association ndash Excerpt summarized
23 Validation and Verification Methods
The following simple measures of data quality will be calculated and included in the final report
1) To screen for contamination the average blank concentration hellip will be calculated This average value should be as close as practical to the Reporting Limit listed in Table 4
2) To assess the precision of results the ldquoMean Relative Percent Differencerdquo between field duplicate samples should be calculated The average RPD should be less than or equal to the Estimated Precision listed in Table 4 This simple measure is calculated as follows
RPD formula used hellip
Reconciliation With Data Quality Objectives ndash EPA Element 24MassWWP guide to QAPP development
What to Include bull List who will evaluate your actual data vs your data quality goals bull State how and when this will be done bull Describe the process for determining what to do if goals are not met
Neponset River Watershed Association
D2 Reconciliation with User Requirements - Summarized bulletedbull Following each sampling event and prior to the subsequent event calculations and
determinations for precision completeness and accuracy will be made bull Any corrective action will be implemented noted and initialized by the project manager bull If data quality indicators do not meet the projectrsquos specifications then data may be discarded
may be flagged or re-sampling may occur bull Investigation of problems will take place and corrections will be documented If equipment
failure is found to be the cause calibration and maintenance techniques will be reassessed Field duplicate testing may occur during the next sampling event to ensure confidence in the results
bull Any limitations on the data will be noted bull Any revisions to the project will be submitted to EPA and DEP quality assurance officers for
approval
Assessment and Response Actions - EPA Element 20 From Inland QAPP
Document that the progress and quality of the monitoring program will be continuously assessed to ensure that its objectives are being accomplished
The Monitoring Coordinator will periodically check to see the following bull Monitoring is occurring as planned bull Sufficient written commentary and supporting photographs exist bull Sufficient volunteers are available bull Volunteers have been observed as they sample their sites bull Samplers are collecting in accordance with project schedules bull Data sheets and custody control sheets are being properly completed and signed bull Data are properly interpreted bull Plans for dealing with adverse weather are in place
Assessment and Response Actions - EPA Element 20 From Inland QAPP ndash continued
The Monitoring Coordinator will periodically check to see the following bull Retraining or other corrective action is implemented at the first hint of non compliance with the
QAPP or SOPs bull Labs are adhering to the requirements of their QAPP in terms of work performed accuracy
acceptable holding times timely and understandable results and delivery process bull Data management is being handled properly ie data are entered on a timely basis is
properly backed up is easily accessed and raw data are properly stored in a safe placebull Procedure for developing and reporting the results exists
Assessment and Response Actions - EPA Element 20 From Inland QAPP ndash continued
The Monitoring Coordinator will confer with the QA Officer as necessary to discuss any problems that occur and what corrective actions are needed to maintain program integrity In addition the Monitoring Coordinator and QA Officer will meet at the end of the sampling season to review the draft report and discuss all aspects of the program and identify necessary program modifications for future sampling activities [If the program includes a technical advisory committee the TAC will be included in these discussions] Corrections may include retraining volunteers rewriting sampling instructions replacement of volunteers alteration of sampling schedules sites or methods or other actions deemed necessary All problems discovered and program modifications made will be documented in the final version of the project report If modifications require changes in the Quality Assurance Project Plan these changes will be submitted MassDEP for review
Deerfield River Watershed Association
20 Assessment and Response Actions ndash Summarized bullet list
bull There will be an on-site visit by the Quality Control Officer to observe field sampling and field analysis procedures Generally this will be done near the beginning of the project
bull A written checklist will be used for the assessments maintained by the Project Coordinator and copies will be provided with the data report
bull The Project Coordinator and QC Officer will determine if field work follows the written procedures or if there needs to be corrections by additional training or revising protocols
bull Please refer to Section 22 for additional evaluations and response actions regarding data evaluations
Reports ndash EPA Element 21
Project Task Organization ndash EPA Element 4 Reviewrevise early choices
Distribution List ndash EPA Element 3
Title and Approval Page - EPA Element 1
Table of Contents ndash EPA Element 2
Water quality monitoring quality assurance workshop
Terminology
Study design
QAPP
sampling and analysis plan
standard operating procedures
data quality objectives
Water Quality Monitoring Planning Process
Monitoring program activities
Why do you need (who Gives) a qapp
Slide Number 11
Slide Number 12
Steps to Developing a QAPP
Slide Number 14
Slide Number 15
Slide Number 16
Steps to Developing a QAPP
Slide Number 18
Slide Number 19
Slide Number 20
Slide Number 21
Slide Number 22
Slide Number 23
Slide Number 24
Sources of Information About Massachusetts Waters
Slide Number 26
Slide Number 27
Slide Number 28
Slide Number 29
Slide Number 30
Slide Number 31
Slide Number 32
Slide Number 33
Slide Number 34
Slide Number 35
Slide Number 36
Slide Number 37
Slide Number 38
Slide Number 39
Slide Number 40
Slide Number 41
Slide Number 42
Slide Number 43
Slide Number 44
Slide Number 45
Slide Number 46
MassDEP - Recommended Minimum Sample Number Frequency and Timing for Example Parameters
Slide Number 48
Slide Number 49
Slide Number 50
Slide Number 51
Slide Number 52
MaDep - Recommended Minimum Sample Number Frequency and Timing for Example Parameters
Slide Number 54
Slide Number 55
Slide Number 56
Slide Number 57
Slide Number 58
Slide Number 59
Slide Number 60
Slide Number 61
Slide Number 62
Slide Number 63
Slide Number 64
Slide Number 65
Slide Number 66
Slide Number 67
Slide Number 68
Slide Number 69
Slide Number 70
Slide Number 71
Slide Number 72
Slide Number 73
Slide Number 74
Slide Number 75
Slide Number 76
Precision DQOs Dealing with low-level concentrations
Slide Number 78
Slide Number 79
Slide Number 80
Slide Number 81
Slide Number 82
Documentation and Records ndash EPA Element 9
Slide Number 84
Slide Number 85
Slide Number 86
Slide Number 87
Slide Number 88
Slide Number 89
Slide Number 90
Slide Number 91
Slide Number 92
Slide Number 93
Slide Number 94
Slide Number 95
Slide Number 96
Slide Number 97
Slide Number 98
Slide Number 99
Slide Number 100
Deerfield River Watershed Association
22 Data Review Validation and Verification ndash Summarized bullet list
All data reviewed by the Project Coordinator and QA Coordinator
Data Analysis QC Checks will includebull Data entry checks by a second personbull Computer entries compared with fieldlab sheetsbull Checks on graphs amp all other data representationsbull Calculation of measures of data quality including completeness
Corrective actionsbull Data entry errors corrected bull Data outside expected range flagged or rejected bull 2nd field sample andor laboratory aliquot taken when possiblebull Data quality problems discussed in draft and final reports
(Data) Validation and Verification Methods ndash EPA Element 23 From Inland QAPP
Validation and Verification Methods will include checks on bull Completion of all fields on data sheets missing data sheetsbull Completeness of sampling runs (eg number of sites visitedsamples taken vs number proposed were all parameters sampledanalyzed)bull Completeness of QC checks (eg number and type of QC checks performed vs numbertype proposed)bull Accuracy and precision compared to data quality objectivesbull Representativeness of samples and resulting data by examining survey metadata for unusual conditions and occurrences that may have impacted the validity of results
Deerfield River Watershed Association ndash Excerpt summarized
23 Validation and Verification Methods
The following simple measures of data quality will be calculated and included in the final report
1) To screen for contamination the average blank concentration hellip will be calculated This average value should be as close as practical to the Reporting Limit listed in Table 4
2) To assess the precision of results the ldquoMean Relative Percent Differencerdquo between field duplicate samples should be calculated The average RPD should be less than or equal to the Estimated Precision listed in Table 4 This simple measure is calculated as follows
RPD formula used hellip
Reconciliation With Data Quality Objectives ndash EPA Element 24MassWWP guide to QAPP development
What to Include bull List who will evaluate your actual data vs your data quality goals bull State how and when this will be done bull Describe the process for determining what to do if goals are not met
Neponset River Watershed Association
D2 Reconciliation with User Requirements - Summarized bulletedbull Following each sampling event and prior to the subsequent event calculations and
determinations for precision completeness and accuracy will be made bull Any corrective action will be implemented noted and initialized by the project manager bull If data quality indicators do not meet the projectrsquos specifications then data may be discarded
may be flagged or re-sampling may occur bull Investigation of problems will take place and corrections will be documented If equipment
failure is found to be the cause calibration and maintenance techniques will be reassessed Field duplicate testing may occur during the next sampling event to ensure confidence in the results
bull Any limitations on the data will be noted bull Any revisions to the project will be submitted to EPA and DEP quality assurance officers for
approval
Assessment and Response Actions - EPA Element 20 From Inland QAPP
Document that the progress and quality of the monitoring program will be continuously assessed to ensure that its objectives are being accomplished
The Monitoring Coordinator will periodically check to see the following bull Monitoring is occurring as planned bull Sufficient written commentary and supporting photographs exist bull Sufficient volunteers are available bull Volunteers have been observed as they sample their sites bull Samplers are collecting in accordance with project schedules bull Data sheets and custody control sheets are being properly completed and signed bull Data are properly interpreted bull Plans for dealing with adverse weather are in place
Assessment and Response Actions - EPA Element 20 From Inland QAPP ndash continued
The Monitoring Coordinator will periodically check to see the following bull Retraining or other corrective action is implemented at the first hint of non compliance with the
QAPP or SOPs bull Labs are adhering to the requirements of their QAPP in terms of work performed accuracy
acceptable holding times timely and understandable results and delivery process bull Data management is being handled properly ie data are entered on a timely basis is
properly backed up is easily accessed and raw data are properly stored in a safe placebull Procedure for developing and reporting the results exists
Assessment and Response Actions - EPA Element 20 From Inland QAPP ndash continued
The Monitoring Coordinator will confer with the QA Officer as necessary to discuss any problems that occur and what corrective actions are needed to maintain program integrity In addition the Monitoring Coordinator and QA Officer will meet at the end of the sampling season to review the draft report and discuss all aspects of the program and identify necessary program modifications for future sampling activities [If the program includes a technical advisory committee the TAC will be included in these discussions] Corrections may include retraining volunteers rewriting sampling instructions replacement of volunteers alteration of sampling schedules sites or methods or other actions deemed necessary All problems discovered and program modifications made will be documented in the final version of the project report If modifications require changes in the Quality Assurance Project Plan these changes will be submitted MassDEP for review
Deerfield River Watershed Association
20 Assessment and Response Actions ndash Summarized bullet list
bull There will be an on-site visit by the Quality Control Officer to observe field sampling and field analysis procedures Generally this will be done near the beginning of the project
bull A written checklist will be used for the assessments maintained by the Project Coordinator and copies will be provided with the data report
bull The Project Coordinator and QC Officer will determine if field work follows the written procedures or if there needs to be corrections by additional training or revising protocols
bull Please refer to Section 22 for additional evaluations and response actions regarding data evaluations
Reports ndash EPA Element 21
Project Task Organization ndash EPA Element 4 Reviewrevise early choices
Distribution List ndash EPA Element 3
Title and Approval Page - EPA Element 1
Table of Contents ndash EPA Element 2
Water quality monitoring quality assurance workshop
Terminology
Study design
QAPP
sampling and analysis plan
standard operating procedures
data quality objectives
Water Quality Monitoring Planning Process
Monitoring program activities
Why do you need (who Gives) a qapp
Slide Number 11
Slide Number 12
Steps to Developing a QAPP
Slide Number 14
Slide Number 15
Slide Number 16
Steps to Developing a QAPP
Slide Number 18
Slide Number 19
Slide Number 20
Slide Number 21
Slide Number 22
Slide Number 23
Slide Number 24
Sources of Information About Massachusetts Waters
Slide Number 26
Slide Number 27
Slide Number 28
Slide Number 29
Slide Number 30
Slide Number 31
Slide Number 32
Slide Number 33
Slide Number 34
Slide Number 35
Slide Number 36
Slide Number 37
Slide Number 38
Slide Number 39
Slide Number 40
Slide Number 41
Slide Number 42
Slide Number 43
Slide Number 44
Slide Number 45
Slide Number 46
MassDEP - Recommended Minimum Sample Number Frequency and Timing for Example Parameters
Slide Number 48
Slide Number 49
Slide Number 50
Slide Number 51
Slide Number 52
MaDep - Recommended Minimum Sample Number Frequency and Timing for Example Parameters
Slide Number 54
Slide Number 55
Slide Number 56
Slide Number 57
Slide Number 58
Slide Number 59
Slide Number 60
Slide Number 61
Slide Number 62
Slide Number 63
Slide Number 64
Slide Number 65
Slide Number 66
Slide Number 67
Slide Number 68
Slide Number 69
Slide Number 70
Slide Number 71
Slide Number 72
Slide Number 73
Slide Number 74
Slide Number 75
Slide Number 76
Precision DQOs Dealing with low-level concentrations
Slide Number 78
Slide Number 79
Slide Number 80
Slide Number 81
Slide Number 82
Documentation and Records ndash EPA Element 9
Slide Number 84
Slide Number 85
Slide Number 86
Slide Number 87
Slide Number 88
Slide Number 89
Slide Number 90
Slide Number 91
Slide Number 92
Slide Number 93
Slide Number 94
Slide Number 95
Slide Number 96
Slide Number 97
Slide Number 98
Slide Number 99
Slide Number 100
Assessment and Response Actions - EPA Element 20 From Inland QAPP ndash continued
The Monitoring Coordinator will confer with the QA Officer as necessary to discuss any problems that occur and what corrective actions are needed to maintain program integrity In addition the Monitoring Coordinator and QA Officer will meet at the end of the sampling season to review the draft report and discuss all aspects of the program and identify necessary program modifications for future sampling activities [If the program includes a technical advisory committee the TAC will be included in these discussions] Corrections may include retraining volunteers rewriting sampling instructions replacement of volunteers alteration of sampling schedules sites or methods or other actions deemed necessary All problems discovered and program modifications made will be documented in the final version of the project report If modifications require changes in the Quality Assurance Project Plan these changes will be submitted MassDEP for review
Deerfield River Watershed Association
20 Assessment and Response Actions ndash Summarized bullet list
bull There will be an on-site visit by the Quality Control Officer to observe field sampling and field analysis procedures Generally this will be done near the beginning of the project
bull A written checklist will be used for the assessments maintained by the Project Coordinator and copies will be provided with the data report
bull The Project Coordinator and QC Officer will determine if field work follows the written procedures or if there needs to be corrections by additional training or revising protocols
bull Please refer to Section 22 for additional evaluations and response actions regarding data evaluations
Reports ndash EPA Element 21
Project Task Organization ndash EPA Element 4 Reviewrevise early choices
Distribution List ndash EPA Element 3
Title and Approval Page - EPA Element 1
Table of Contents ndash EPA Element 2
Water quality monitoring quality assurance workshop
Terminology
Study design
QAPP
sampling and analysis plan
standard operating procedures
data quality objectives
Water Quality Monitoring Planning Process
Monitoring program activities
Why do you need (who Gives) a qapp
Slide Number 11
Slide Number 12
Steps to Developing a QAPP
Slide Number 14
Slide Number 15
Slide Number 16
Steps to Developing a QAPP
Slide Number 18
Slide Number 19
Slide Number 20
Slide Number 21
Slide Number 22
Slide Number 23
Slide Number 24
Sources of Information About Massachusetts Waters
Slide Number 26
Slide Number 27
Slide Number 28
Slide Number 29
Slide Number 30
Slide Number 31
Slide Number 32
Slide Number 33
Slide Number 34
Slide Number 35
Slide Number 36
Slide Number 37
Slide Number 38
Slide Number 39
Slide Number 40
Slide Number 41
Slide Number 42
Slide Number 43
Slide Number 44
Slide Number 45
Slide Number 46
MassDEP - Recommended Minimum Sample Number Frequency and Timing for Example Parameters
Slide Number 48
Slide Number 49
Slide Number 50
Slide Number 51
Slide Number 52
MaDep - Recommended Minimum Sample Number Frequency and Timing for Example Parameters
Slide Number 54
Slide Number 55
Slide Number 56
Slide Number 57
Slide Number 58
Slide Number 59
Slide Number 60
Slide Number 61
Slide Number 62
Slide Number 63
Slide Number 64
Slide Number 65
Slide Number 66
Slide Number 67
Slide Number 68
Slide Number 69
Slide Number 70
Slide Number 71
Slide Number 72
Slide Number 73
Slide Number 74
Slide Number 75
Slide Number 76
Precision DQOs Dealing with low-level concentrations
Slide Number 78
Slide Number 79
Slide Number 80
Slide Number 81
Slide Number 82
Documentation and Records ndash EPA Element 9
Slide Number 84
Slide Number 85
Slide Number 86
Slide Number 87
Slide Number 88
Slide Number 89
Slide Number 90
Slide Number 91
Slide Number 92
Slide Number 93
Slide Number 94
Slide Number 95
Slide Number 96
Slide Number 97
Slide Number 98
Slide Number 99
Slide Number 100
Reports ndash EPA Element 21
Project Task Organization ndash EPA Element 4 Reviewrevise early choices
Distribution List ndash EPA Element 3
Title and Approval Page - EPA Element 1
Table of Contents ndash EPA Element 2
Water quality monitoring quality assurance workshop
Terminology
Study design
QAPP
sampling and analysis plan
standard operating procedures
data quality objectives
Water Quality Monitoring Planning Process
Monitoring program activities
Why do you need (who Gives) a qapp
Slide Number 11
Slide Number 12
Steps to Developing a QAPP
Slide Number 14
Slide Number 15
Slide Number 16
Steps to Developing a QAPP
Slide Number 18
Slide Number 19
Slide Number 20
Slide Number 21
Slide Number 22
Slide Number 23
Slide Number 24
Sources of Information About Massachusetts Waters
Slide Number 26
Slide Number 27
Slide Number 28
Slide Number 29
Slide Number 30
Slide Number 31
Slide Number 32
Slide Number 33
Slide Number 34
Slide Number 35
Slide Number 36
Slide Number 37
Slide Number 38
Slide Number 39
Slide Number 40
Slide Number 41
Slide Number 42
Slide Number 43
Slide Number 44
Slide Number 45
Slide Number 46
MassDEP - Recommended Minimum Sample Number Frequency and Timing for Example Parameters
Slide Number 48
Slide Number 49
Slide Number 50
Slide Number 51
Slide Number 52
MaDep - Recommended Minimum Sample Number Frequency and Timing for Example Parameters
Slide Number 54
Slide Number 55
Slide Number 56
Slide Number 57
Slide Number 58
Slide Number 59
Slide Number 60
Slide Number 61
Slide Number 62
Slide Number 63
Slide Number 64
Slide Number 65
Slide Number 66
Slide Number 67
Slide Number 68
Slide Number 69
Slide Number 70
Slide Number 71
Slide Number 72
Slide Number 73
Slide Number 74
Slide Number 75
Slide Number 76
Precision DQOs Dealing with low-level concentrations