water quality planning on thorp and kimball brooks - 2010 report
TRANSCRIPT
8/8/2019 Water Quality Planning on Thorp and Kimball Brooks - 2010 Report
http://slidepdf.com/reader/full/water-quality-planning-on-thorp-and-kimball-brooks-2010-report 1/41
WATER QUALITY PLANNING ON THORP AND KIMBALL BROOKS
CHARLOTTE AND FERRISBURG, VERMONT
December 28, 2010
MMI #3542-07
Prepared for:
Lewis Creek Association
Charlotte, Vermont
Prepared by:
Milone & MacBroom, Inc.1233 Shelburne Road, Suite 180
South Burlington, Vermont 05403
802.864.1600www.miloneandmacbroom.com
8/8/2019 Water Quality Planning on Thorp and Kimball Brooks - 2010 Report
http://slidepdf.com/reader/full/water-quality-planning-on-thorp-and-kimball-brooks-2010-report 2/41
THORP AND KIMBALL BROOKS PAGE i
DECEMBER 2010
CONTENTS
ACKNOWLEDGEMENTS.......................................................................................................... III EXECUTIVE SUMMARY .......................................................................................................... IV 1.0 INTRODUCTION .............................................................................................................. 1 2.0 FIELD OBSERVATIONS.................................................................................................. 3
2.1 Kimball Brook ........................................................................................................ 3 2.1.1 Low Stream Flow / High Lake Level Observations ................................... 3 2.1.2 Low Stream Flow / Low Lake Level Observations.................................... 7 2.1.3 High Flow / High Lake Level Observations ............................................... 8 2.1.4 High Flow / Low Lake Level Observations................................................ 8 2.1.5 Survey ......................................................................................................... 9 2.1.6 Summary..................................................................................................... 9
2.2 Thorp Brook.......................................................................................................... 10 2.2.1 Low Stream Flow / High Lake Level Observations ................................. 10 2.2.2 Low Stream Flow / Low Lake Level Observations.................................. 14 2.2.3 High Stream Flow / High Lake Level Observations................................. 14 2.2.4 High Stream Flow / Low Lake Level Observations ................................. 15 2.2.5 Survey ....................................................................................................... 15 2.2.6 Summary................................................................................................... 15
3.0 STREAM GAUGING....................................................................................................... 16 3.1 Kimball Brook ...................................................................................................... 16
3.1.1 Gauge Location......................................................................................... 16 3.1.2 Methods..................................................................................................... 18 3.1.3 Results ....................................................................................................... 18
3.2 Thorp Brook.......................................................................................................... 19 3.2.1 Gauge Location......................................................................................... 19 3.2.2 Methods..................................................................................................... 19 3.2.3 Results ....................................................................................................... 21
4.0 EXISTING DATA............................................................................................................ 22 4.1 Kimball Brook ...................................................................................................... 22 4.1.1 Geomorphic............................................................................................... 22
4.1.2 Water Quality............................................................................................ 22 4.1.3 Field-Scale Hydrology.............................................................................. 23
4.2 Thorp Brook.......................................................................................................... 24 4.2.1 Geomorphic............................................................................................... 24 4.2.2 Water Quality............................................................................................ 24

8/8/2019 Water Quality Planning on Thorp and Kimball Brooks - 2010 Report
http://slidepdf.com/reader/full/water-quality-planning-on-thorp-and-kimball-brooks-2010-report 3/41
THORP AND KIMBALL BROOKS PAGE ii
DECEMBER 2010
4.2.3 Field-Scale Hydrology.............................................................................. 25 5.0 DIRECT DRAINAGE ASSESSMENT PLANNING ...................................................... 26
5.1 Monitoring and Study Recommendations ............................................................ 26 5.1.1 Hydrology ................................................................................................. 26 5.1.2 Study of Loading During Floods .............................................................. 27 5.1.3 Continued Lay Monitoring ....................................................................... 28 5.1.4 Windshield Survey.................................................................................... 29 5.1.5 Stream Geomorphic Assessment .............................................................. 29 5.1.6 Update Watershed Delineation ................................................................. 30 5.1.7 Apply Findings of Existing Studies to Direct Drainages.......................... 30
5.2 Implementation Recommendations ...................................................................... 30 5.2.1 Investigate Possible Water Quality Hot Spots .......................................... 30 5.2.2 Investigate Impaired Locations................................................................. 31 5.2.3 Investigation of Field-Scale Runoff Pathways ......................................... 31 5.2.4 Promote Implementation of Agriculture BMPs........................................ 32
5.3 Guiding Principles for Improving Direct Drainages............................................. 32 5.3.1 Naturalize Hydrology................................................................................ 32 5.3.2 Restore Natural Channel Planform........................................................... 33 5.3.3 Naturalize Floodplain Vegetation............................................................. 33
6.0 REFERENCES ................................................................................................................. 34
APPENDIX A: Kimball Brook Site Walk Photos
APPENDIX B: Thorp Brook Site Walk Photos
APPENDIX C: Directions for Reading Staff Gauges
APPENDIX D: Calculating Flow in Circular Conduits
APPENDIX E: Kimball Brook Flow Summary
APPENDIX F: Thorp Brook Flow Summary
APPENDIX G: Phase 1 Data for Thorp and Kimball Brooks (LCA, 2008)
APPENDIX H: NRCS Field-Scale Hydrology Mapping

8/8/2019 Water Quality Planning on Thorp and Kimball Brooks - 2010 Report
http://slidepdf.com/reader/full/water-quality-planning-on-thorp-and-kimball-brooks-2010-report 4/41
THORP AND KIMBALL BROOKS PAGE iii
DECEMBER 2010
ACKNOWLEDGEMENTS
This project was funded by the Vermont Clean and Clear Grant (#2009-RCG-3-04) to
Lewis Creek Association. Marty Illick of the Lewis Creek Association coordinated this
project. Water quality analysis and recommendations were made in conjunction with Bill
Hoadley. The extended project team contributed insight and guidance in project designand implementation. For this we thank Andrea Morgante of Lewis Creek Association,
Neil Kamman of Vermont Department of Environmental Conservation (DEC), Karen
Bates of DEC, Ethan Swift of DEC, Mike Kline of DEC, Gretchen Alexander of DEC,Kevin Behm of Addison County Regional Planning Commission, Kristen Underwood of
South Mountain Research and Consulting, and Trafton Crandall of the Charlotte
Conservation Commission. Richard H. (Bunky) Bernstein assisted with gaugemeasurements. We thank Bunky and all of the other volunteer monitors in the Thorp-
Kimball-Holmes Watershed Group who have generously donated time to improving the
understanding of Thorp, Kimball, and Holmes Brooks.

8/8/2019 Water Quality Planning on Thorp and Kimball Brooks - 2010 Report
http://slidepdf.com/reader/full/water-quality-planning-on-thorp-and-kimball-brooks-2010-report 5/41
THORP AND KIMBALL BROOKS PAGE iv
DECEMBER 2010
EXECUTIVE SUMMARY
Nutrient and sediment loading are well-documented water quality issues for Lake
Champlain. Past and current studies have highlighted hotspots in need of better
management of point and nonpoint sources of pollution. Although progress has been
made, water quality improvement in Lake Champlain and its tributaries remains a stateand local goal.
The Champlain Valley has low topographic relief that is approximately flat approachingthe edge of the lake. The dominant land use in the region is agriculture and soils largely
consist of clay. The near-lake area once dominated by lake-edge floodplain forests and
riparian wetlands now consists of agricultural fields, rural residential areas, and remnantforest and wetland patches. This land use conversion has increased runoff rates by
smoothing the landscape, ditching fields, and increasing impervious surfaces.
The level of impacts associated with altered hydrology near the edge of Lake Champlain
needs further evaluation. Some water quality sampling and other forms of monitoring aretaking place in select locations where local concerns or obvious problems exist.
Although common sense suggests that polluted runoff closer to the lake is a problem, adetailed understanding of loading from the small watersheds draining directly to the edge
of Lake Champlain (i.e., direct drainages) is needed. Resource managers need to know if
there are ways to maintain agricultural productivity while better managing runoff andimproving water quality in streams, bays, and Lake Champlain.
Three general tools are available for investigating direct drainages – data collection, fieldreconnaissance, and critical source area identification. Data collection can allow for a
detailed understanding of water quality and loading, yet sampling and analyses at highfrequency and adequate spatial resolution are often cost prohibitive. Field reconnaissance
is a quick way to know your watershed and observe obvious impacts, yet subtle impacts
or large-scale changes may not be visible from the ground. Critical source areas aremapped locations that contain both a source and a transport mechanism of a pollutant of
concern, and mapping often is performed using hydrology and sediment transport
models, GIS, and field verification. Mapping critical source areas provides a nice
overview of possible areas of concern, yet can miss important locations at smaller scales.The ideal investigation method draws on the positive aspects of data collection, field
reconnaissance, and critical source area identification to maximize understanding.
A case study was performed on Thorp and Kimball Brooks in Charlotte and Ferrisburg,
Vermont to review past data collection, conduct additional field reconnaissance, develop
a plan for continued investigation of local conditions, make managementrecommendations for current water quality improvement, and initiate creation of a
template for investigating direct drainages of Lake Champlain.
Field observations were made during varying combinations of lake water level andstream flow to identify the transition zone between flowing water and water body. On
Kimball Brook the zone was typically located at Town Line Road, yet during high lake

8/8/2019 Water Quality Planning on Thorp and Kimball Brooks - 2010 Report
http://slidepdf.com/reader/full/water-quality-planning-on-thorp-and-kimball-brooks-2010-report 6/41
THORP AND KIMBALL BROOKS PAGE v
DECEMBER 2010
levels and flows the transition to ponded water appears to extend up to the Railroad
Culvert. On Thorp Brook, the lake-stream transition is typically located near theRailroad Culvert, yet the lake may influence approximately halfway between the railroad
and Greenbush Road during high flows.
Staff gauges were installed and rating curves were developed for both streams sovolunteers can quickly estimate flow during future water quality monitoring. Flow
measurements are important to convert concentrations to loads and watershed yields to
gain an understanding the importance of the water quality threat from direct drainagesrelative to other tributaries of the lake.
Analysis of past water quality data for Thorp and Kimball Brooks generally indicates thattotal phosphorus concentrations are high in Kimball and Thorp Brooks for freshwater
streams, but values are typical relative to other rivers and streams in the region. Water
quality monitoring revealed several possible pollution hotspots on Kimball Brook near Vermont Route 7 (K4 and K5) and the tributary to the north of Thorp Brook (T3.5).
Other areas of concern were identified during a stream walk on Kimball Brook:• The co-located cattle/stream crossing under the railroad;
• The north to south farm field flow path that enters Kimball Brook before the
channel turns north towards Town Line Road;
• The flow path draining the barnyard area adjacent to Town Line Road; and
• The field flow paths that enter the tributary of Kimball Brook that flows into the
lake-edge floodplain.
Priority areas to investigate on lower Thorp Brook include:
• The east to west field ditch that flows into Thorp Brook to the east of Greenbush
Drive; and
• Homes Brook and the documented flow paths from farm fields entering the
channel north of Thompson’s Point Road.
Local landowners should be contacted and field investigation should be performed to try
and identify the possible sources of nutrient inputs.
The on-going volunteer monitoring should continue and be adjusted to focus on
characterizing the load and yield of sediment and phosphorus on Kimball and Thorp
Brooks. Kimball Brook sampling should continue at Greenbush Road (K2) and Thorp
Brook sampling should continue at Greenbush Road (T1) and the northern tributary with
high nitrogen (T3). Samples should be collected monthly or when flows permit in the
summer. Staff gauges should be read each time a sample is collected. In addition, daily
readings for several months each season will allow for determination of an annual load or
yield.
Turbid flows from field runoff, field ditches, and road ditches have been observed duringflooding. NRCS mapping illustrates the widespread ditching in the Thorp and Kimball
Brook watersheds. Altered hydrology is the primary impact in direct drainages since
8/8/2019 Water Quality Planning on Thorp and Kimball Brooks - 2010 Report
http://slidepdf.com/reader/full/water-quality-planning-on-thorp-and-kimball-brooks-2010-report 7/41
THORP AND KIMBALL BROOKS PAGE vi
DECEMBER 2010
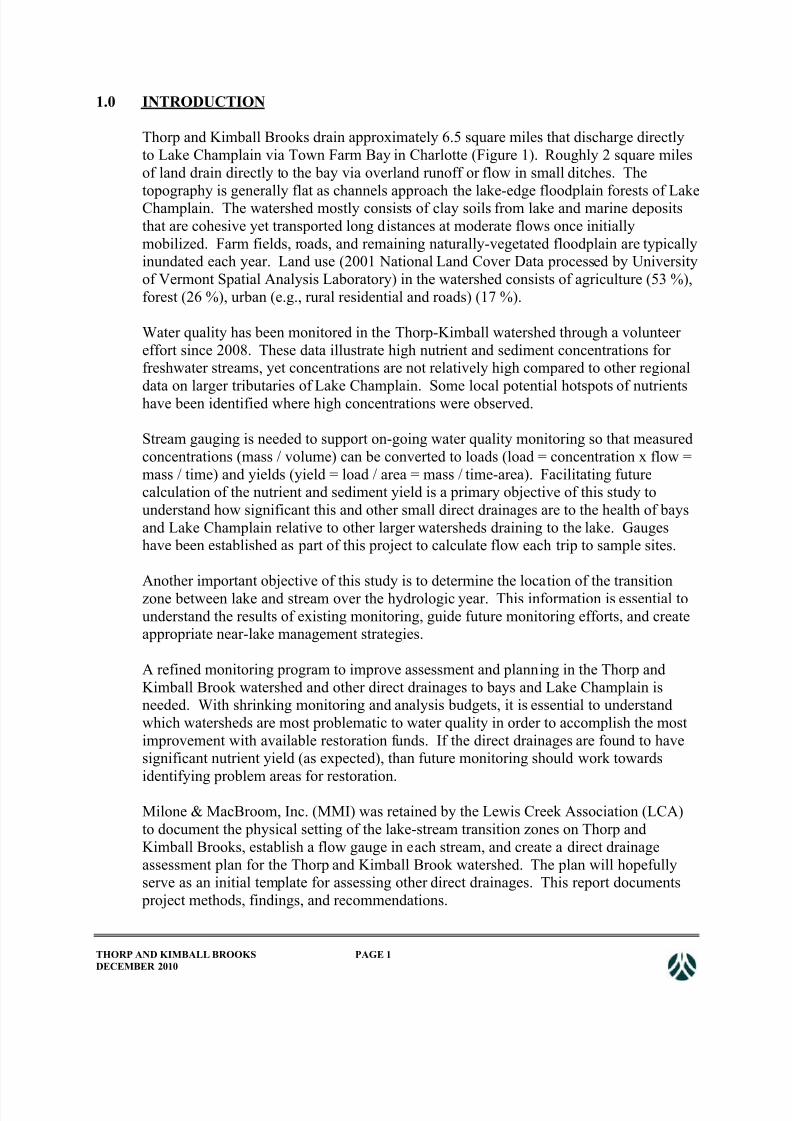
runoff now moves to the lake much faster with less opportunity for sediment deposition
and nutrient uptake on floodplains. Plugging ditches and conversion of select pieces of land back to natural vegetation is desired to naturalize hydrology and improve water
quality. Restoring natural channel pattern and providing space for channels to naturally
move in the floodplain will also improve water quality.
8/8/2019 Water Quality Planning on Thorp and Kimball Brooks - 2010 Report
http://slidepdf.com/reader/full/water-quality-planning-on-thorp-and-kimball-brooks-2010-report 8/41
THORP AND KIMBALL BROOKS PAGE 1
DECEMBER 2010
1.0 INTRODUCTION
Thorp and Kimball Brooks drain approximately 6.5 square miles that discharge directly
to Lake Champlain via Town Farm Bay in Charlotte (Figure 1). Roughly 2 square miles
of land drain directly to the bay via overland runoff or flow in small ditches. The
topography is generally flat as channels approach the lake-edge floodplain forests of LakeChamplain. The watershed mostly consists of clay soils from lake and marine deposits
that are cohesive yet transported long distances at moderate flows once initially
mobilized. Farm fields, roads, and remaining naturally-vegetated floodplain are typicallyinundated each year. Land use (2001 National Land Cover Data processed by University
of Vermont Spatial Analysis Laboratory) in the watershed consists of agriculture (53 %),
forest (26 %), urban (e.g., rural residential and roads) (17 %).
Water quality has been monitored in the Thorp-Kimball watershed through a volunteer
effort since 2008. These data illustrate high nutrient and sediment concentrations for freshwater streams, yet concentrations are not relatively high compared to other regional
data on larger tributaries of Lake Champlain. Some local potential hotspots of nutrientshave been identified where high concentrations were observed.
Stream gauging is needed to support on-going water quality monitoring so that measured
concentrations (mass / volume) can be converted to loads (load = concentration x flow =
mass / time) and yields (yield = load / area = mass / time-area). Facilitating futurecalculation of the nutrient and sediment yield is a primary objective of this study to
understand how significant this and other small direct drainages are to the health of bays
and Lake Champlain relative to other larger watersheds draining to the lake. Gaugeshave been established as part of this project to calculate flow each trip to sample sites.
Another important objective of this study is to determine the location of the transition
zone between lake and stream over the hydrologic year. This information is essential to
understand the results of existing monitoring, guide future monitoring efforts, and createappropriate near-lake management strategies.
A refined monitoring program to improve assessment and planning in the Thorp and
Kimball Brook watershed and other direct drainages to bays and Lake Champlain isneeded. With shrinking monitoring and analysis budgets, it is essential to understand
which watersheds are most problematic to water quality in order to accomplish the most
improvement with available restoration funds. If the direct drainages are found to havesignificant nutrient yield (as expected), than future monitoring should work towards
identifying problem areas for restoration.
Milone & MacBroom, Inc. (MMI) was retained by the Lewis Creek Association (LCA)
to document the physical setting of the lake-stream transition zones on Thorp and
Kimball Brooks, establish a flow gauge in each stream, and create a direct drainage
assessment plan for the Thorp and Kimball Brook watershed. The plan will hopefullyserve as an initial template for assessing other direct drainages. This report documents
project methods, findings, and recommendations.

8/8/2019 Water Quality Planning on Thorp and Kimball Brooks - 2010 Report
http://slidepdf.com/reader/full/water-quality-planning-on-thorp-and-kimball-brooks-2010-report 9/41
THORP AND KIMBALL BROOKS PAGE 2
DECEMBER 2010

8/8/2019 Water Quality Planning on Thorp and Kimball Brooks - 2010 Report
http://slidepdf.com/reader/full/water-quality-planning-on-thorp-and-kimball-brooks-2010-report 10/41
THORP AND KIMBALL BROOKS PAGE 3
DECEMBER 2010
2.0 FIELD OBSERVATIONS
2.1 Kimball Brook
2.1.1 Low Stream Flow / High Lake Level Observations
Kimball Brook was walked by Milone & MacBroom personnel on May 7, 2010.
During the stream walk, lake levels were near seasonal highs (Elevation 98.35
feet NGVD29, USGS 04294500 Lake Champlain at Burlington). Streamcharacteristics were documented with digital photographs, field-based water
quality meters, and high-accuracy GPS (Figure 2). A YSI meter (Model 85,
Yellow Springs, OH) was used to record temperature, dissolved oxygen,conductivity and salinity. Velocity measurements were recorded using a Marsh-
McBirney (Flow-Mate Model 2000, Loveland, CO) portable velocity meter. GPS
points were recorded to locate features and measurements (Trimble GeoXT,Sunnyvale, California).
The stream walk and water quality measurements (Table 1) were started upstream
of Greenbush Road (Point 1) and continued to where the Lake was visible (Figure3, see Appendix A for a photo-documentation of the stream walk). The discharge
was 3.4 cubic feet per second just upstream of Greenbush Road (Point 2). No
tributaries join Kimball Brook between Greenbush Road and the Lake so thedischarge measurement applies downstream until backwatering from the lake
takes place.
At and upstream of Greenbush Road, Kimball Brook has characteristics of a
flowing-water environment (i.e., fluvial) with no signs of backwatering. In thevicinity of Greenbush Road, the stream has riffle-pool bedform with some point
bar development and adjacent river floodplain with recent sediment deposits from
overbank flows (E channel according to Rosgen and Silvey, 1996). The bed isdominated by silt and clay, with gravel and sand at the riffles. Immediately
downstream of Greenbush Road, a large scour pool has formed, most likely due to
erosion associated with jetting flow due to the undersized culvert.
Downstream of Kimball Brook Farm (Points 5-7) dunes and ripples became more
common and channel sinuosity increases. Gravel deposits are almost absent. The
channel remains free-flowing with no signs of backwatering. The lower channelslope through this section contributed to a lower water velocity and deeper water.
The remains of a small laid up stone dam (Point 8) controlled the water surface
elevation in this section. The temperature gradually increased through this sectiondue to the lack of tree canopy.
Downstream of the remnant small stone dam the channel flows into woodlands.
The channel is wider and the velocity lower. Large sand and silt deposits coveredthe stream bed. The channel follows an active cattle crossing under the railroad
that seems to be causing some backwatering in the section upstream. The altered

8/8/2019 Water Quality Planning on Thorp and Kimball Brooks - 2010 Report
http://slidepdf.com/reader/full/water-quality-planning-on-thorp-and-kimball-brooks-2010-report 11/41
THORP AND KIMBALL BROOKS PAGE 4
DECEMBER 2010

8/8/2019 Water Quality Planning on Thorp and Kimball Brooks - 2010 Report
http://slidepdf.com/reader/full/water-quality-planning-on-thorp-and-kimball-brooks-2010-report 12/41
THORP AND KIMBALL BROOKS PAGE 5
DECEMBER 2010
Figure 3a: Kimball Brook upstream of Greenbush Road (Source: MMI, May 7, 2010).
Figure 3b: Kimball Brook at the Lake Champlain floodplain forest (Source: MMI, May 7, 2010).

8/8/2019 Water Quality Planning on Thorp and Kimball Brooks - 2010 Report
http://slidepdf.com/reader/full/water-quality-planning-on-thorp-and-kimball-brooks-2010-report 13/41
THORP AND KIMBALL BROOKS PAGE 6
DECEMBER 2010
channel form in this location is trampled and muddy. Downstream of the cattle
crossing the channel narrows, has lower banks, and is well-connected tofloodplains.
As the channel widened and deepened upstream of the farm on Town Line Road,
the water in the channel became turbid (Point 11). The channel appears to have been historically altered in this location as a berm exists that unnaturally creates a
wide flat channel. The channel approaching Town Line Road is wide, shallow,
has wetland characteristics, and is ponded in locations. The channel form is poorly defined likely due to historic pasturing or maintenance of the channel to
support local farm operations. The channel is currently confined to one side of
pasture, with cattle fencing keeping animals from grazing the low floodplain.Meander scars are visible in the field around the stream that illustrate a greater
sinuosity and lower slope approaching Town Line Road in the past.
Algae clog much of the channel in this area and turbidity is high. Kimball Brook
is ponded upstream of Town Line Road where a culvert and small headwall exist.Signs of water overtopping are evident along the lowest part of the road. The
culvert under the road was full during the site walk, yet no visible signs of movingwater were present – a fully backwatered condition. The temperature continued
to increase through this section with a corresponding decrease in dissolved
oxygen.
Downstream of Town Line Road the channel flowed through a pool that appeared
excavated and full of fine sediment. The channel was not well-defined andflowed overland through a stand of cattails. Water sheeted across a grass wetland
with no distinct channel visible and entered a lake-edge floodplain forest(Thompson and Sorenson, 2005) (Point 11). Silver maple, American elm, green
ash, and red maple dominated the forest. Moving downstream the depth of
ponded water increased and the understory became minimal. The forest wasflooded to lake level. A distinct high water mark was visible on trees, 1.3 feet
above current water level. The standing water was deep and very wide, and the
edge of Lake Champlain was visible downstream (point 13). The temperature
decreased relative to the open pasture section upstream. The dissolved oxygenlevels were low in the standing water amongst the flooded forest.
Dissolved oxygen levels decreased approaching the lake-edge floodplain (Table1) likely due to respiration by the large standing crop of submerged aquatic
vegetation symbolic of high biological oxygen demand. Temperatures reflected
the difference between canopy cover on the stream. Conductivity measurementsdid not vary much during the stream walk and thus did not provide evidence of
the change between the lake and stream environments.
During the site walk, possible impacts to water quality were noted.
• The small pasture adjacent to the channel upstream of Greenbush Road has
disturbed ground, a steep slope, and no buffer.
8/8/2019 Water Quality Planning on Thorp and Kimball Brooks - 2010 Report
http://slidepdf.com/reader/full/water-quality-planning-on-thorp-and-kimball-brooks-2010-report 14/41
THORP AND KIMBALL BROOKS PAGE 7
DECEMBER 2010
• The Town Line Road Culvert is undersized and may be leading to excessive
local erosion.
• The cattle crossing under the railroad has direct input of manure and has a
highly disturbed streambed.
• The farm on Town Line Road contributes agricultural runoff and disturbed
soils to the edge of Lake Champlain.
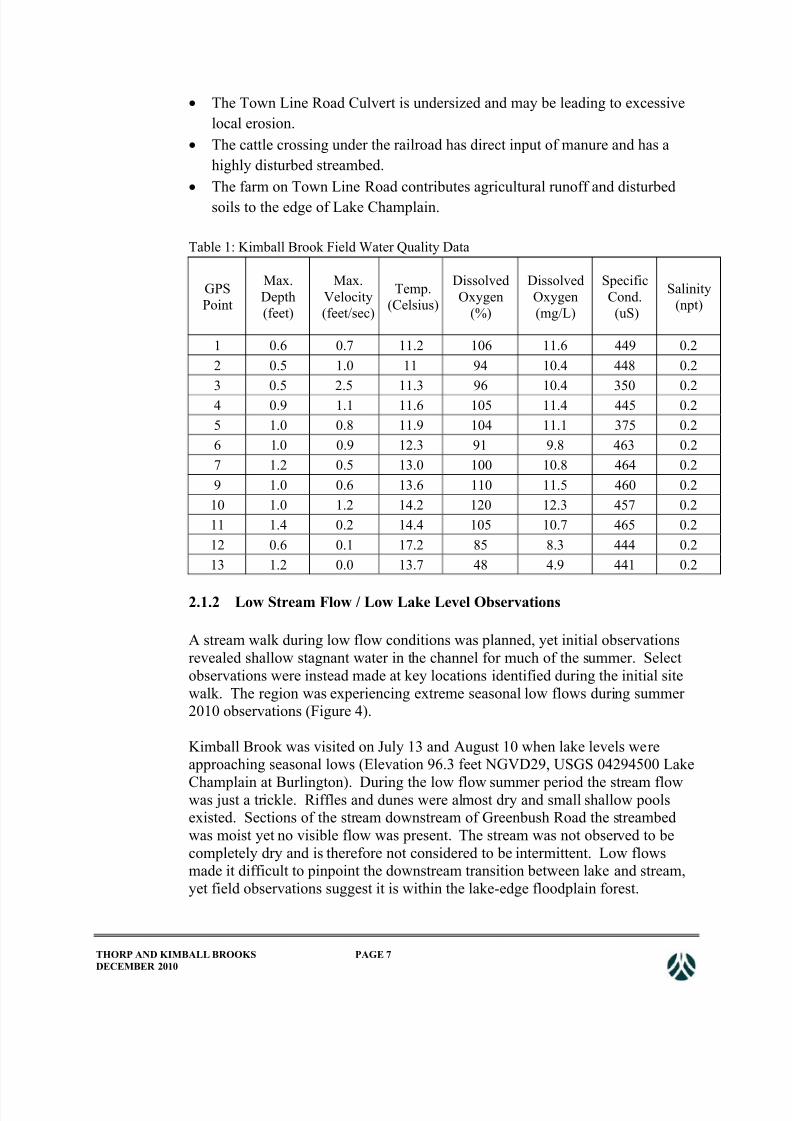
Table 1: Kimball Brook Field Water Quality Data
GPS
Point
Max.
Depth
(feet)
Max.
Velocity
(feet/sec)
Temp.
(Celsius)
Dissolved
Oxygen
(%)
Dissolved
Oxygen
(mg/L)
Specific
Cond.
(uS)
Salinity
(npt)
1 0.6 0.7 11.2 106 11.6 449 0.2
2 0.5 1.0 11 94 10.4 448 0.2
3 0.5 2.5 11.3 96 10.4 350 0.24 0.9 1.1 11.6 105 11.4 445 0.2
5 1.0 0.8 11.9 104 11.1 375 0.2
6 1.0 0.9 12.3 91 9.8 463 0.2
7 1.2 0.5 13.0 100 10.8 464 0.2
9 1.0 0.6 13.6 110 11.5 460 0.2
10 1.0 1.2 14.2 120 12.3 457 0.2
11 1.4 0.2 14.4 105 10.7 465 0.2
12 0.6 0.1 17.2 85 8.3 444 0.2
13 1.2 0.0 13.7 48 4.9 441 0.2
2.1.2 Low Stream Flow / Low Lake Level Observations
A stream walk during low flow conditions was planned, yet initial observations
revealed shallow stagnant water in the channel for much of the summer. Select
observations were instead made at key locations identified during the initial site
walk. The region was experiencing extreme seasonal low flows during summer 2010 observations (Figure 4).
Kimball Brook was visited on July 13 and August 10 when lake levels wereapproaching seasonal lows (Elevation 96.3 feet NGVD29, USGS 04294500 Lake
Champlain at Burlington). During the low flow summer period the stream flowwas just a trickle. Riffles and dunes were almost dry and small shallow poolsexisted. Sections of the stream downstream of Greenbush Road the streambed
was moist yet no visible flow was present. The stream was not observed to be
completely dry and is therefore not considered to be intermittent. Low flowsmade it difficult to pinpoint the downstream transition between lake and stream,
yet field observations suggest it is within the lake-edge floodplain forest.

8/8/2019 Water Quality Planning on Thorp and Kimball Brooks - 2010 Report
http://slidepdf.com/reader/full/water-quality-planning-on-thorp-and-kimball-brooks-2010-report 15/41
THORP AND KIMBALL BROOKS PAGE 8
DECEMBER 2010
Figure 4: Kimball Brook with mostly dry streambed near Kimball Brook Farm manure
pit. (Source: MMI, July 13, 2010).
2.1.3 High Flow / High Lake Level Observations
There were no high flow events observed during high lake levels. These extreme
events would typically occur during spring snow melt rain events and did not
occur during this study period. Field observations suggest that the extremeupstream limit of the lake backwater would be at the Railroad Arch Culvert.
Backwatering would typically be further downstream, most commonly in the
vicinity of Town Line Road.
2.1.4 High Flow / Low Lake Level Observations
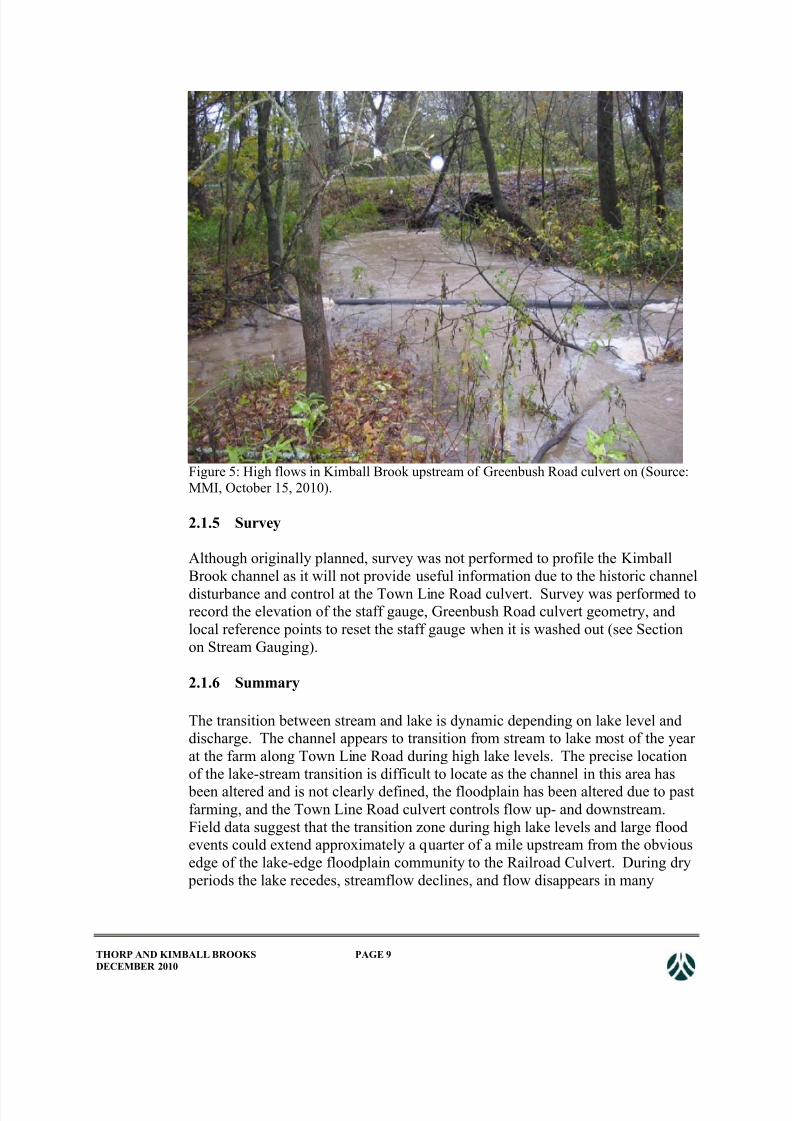
High flows were observed on October 1 and October 15, 2010 (Figure 5). Lake
levels were near the seasonal low (Elevation 95.2 feet NGVD29, USGS 04294500Lake Champlain at Burlington). Both rain events produced approximately
bankfull flows. The precipitation event occurred after an extended dry period.
Water filled the channel and flowed on the floodplain upstream of Greenbush
Road and downstream through the Kimball Brook Farm property. The streamflowed freely without influence of the lake backwater in the vicinity of Greenbush
Road and Kimball Brook Farm.
8/8/2019 Water Quality Planning on Thorp and Kimball Brooks - 2010 Report
http://slidepdf.com/reader/full/water-quality-planning-on-thorp-and-kimball-brooks-2010-report 16/41
THORP AND KIMBALL BROOKS PAGE 9
DECEMBER 2010
Figure 5: High flows in Kimball Brook upstream of Greenbush Road culvert on (Source:
MMI, October 15, 2010).
2.1.5 Survey
Although originally planned, survey was not performed to profile the Kimball
Brook channel as it will not provide useful information due to the historic channel
disturbance and control at the Town Line Road culvert. Survey was performed torecord the elevation of the staff gauge, Greenbush Road culvert geometry, and
local reference points to reset the staff gauge when it is washed out (see Section
on Stream Gauging).
2.1.6 Summary
The transition between stream and lake is dynamic depending on lake level anddischarge. The channel appears to transition from stream to lake most of the year
at the farm along Town Line Road during high lake levels. The precise location
of the lake-stream transition is difficult to locate as the channel in this area has
been altered and is not clearly defined, the floodplain has been altered due to pastfarming, and the Town Line Road culvert controls flow up- and downstream.
Field data suggest that the transition zone during high lake levels and large floodevents could extend approximately a quarter of a mile upstream from the obvious
edge of the lake-edge floodplain community to the Railroad Culvert. During dry
periods the lake recedes, streamflow declines, and flow disappears in many
8/8/2019 Water Quality Planning on Thorp and Kimball Brooks - 2010 Report
http://slidepdf.com/reader/full/water-quality-planning-on-thorp-and-kimball-brooks-2010-report 17/41
THORP AND KIMBALL BROOKS PAGE 10
DECEMBER 2010
locations. The stream-lake transition under these conditions is typically within
the lake-edge floodplain forest.
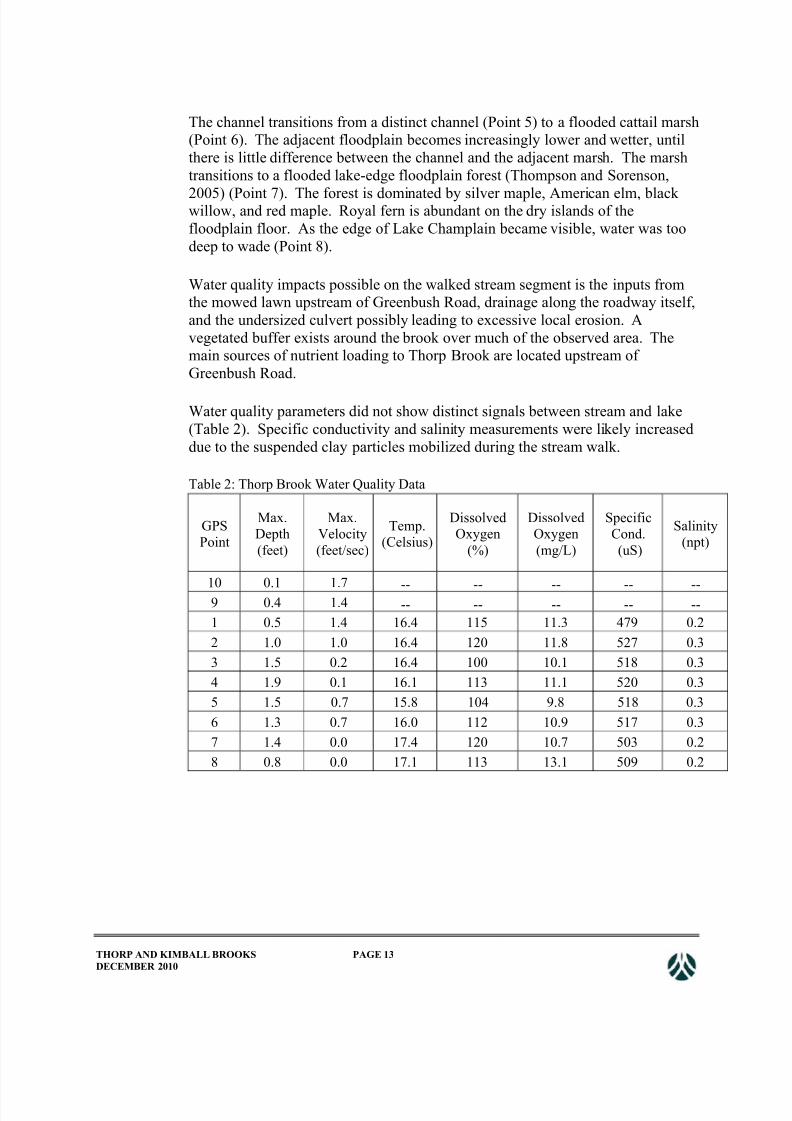
2.2 Thorp Brook
2.2.1 Low Stream Flow / High Lake Level Observations
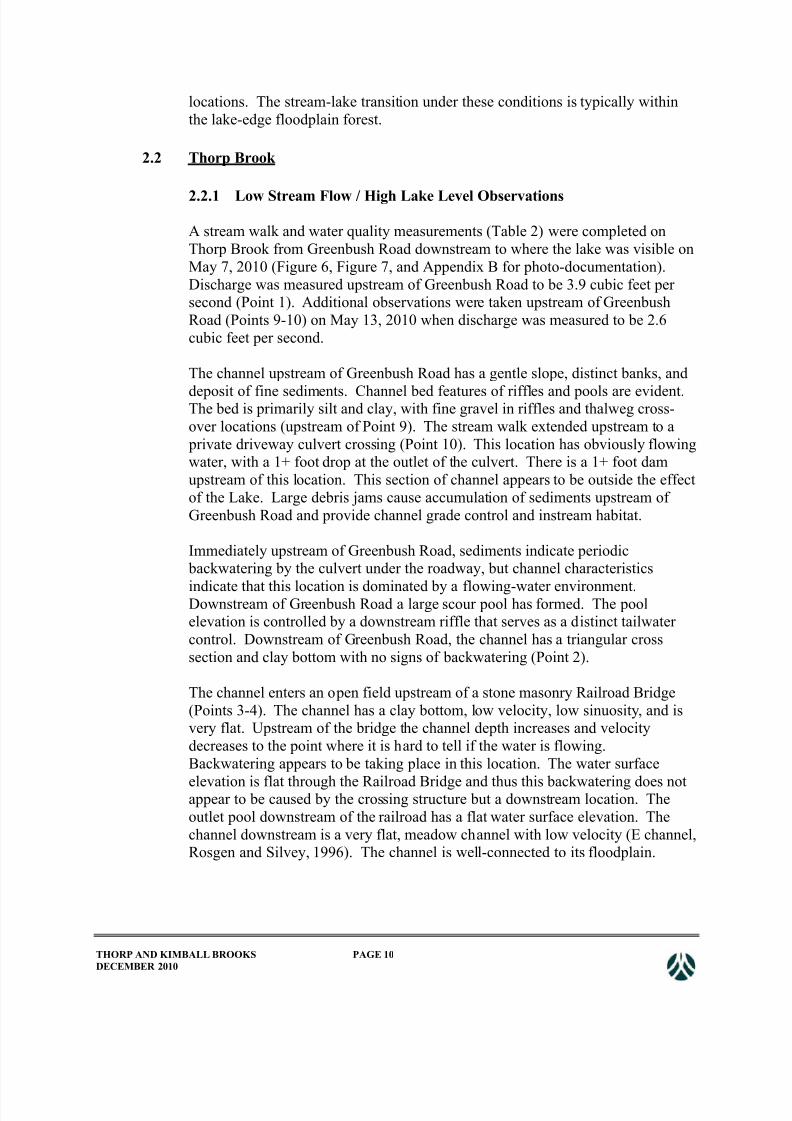
A stream walk and water quality measurements (Table 2) were completed on
Thorp Brook from Greenbush Road downstream to where the lake was visible on
May 7, 2010 (Figure 6, Figure 7, and Appendix B for photo-documentation).
Discharge was measured upstream of Greenbush Road to be 3.9 cubic feet per second (Point 1). Additional observations were taken upstream of Greenbush
Road (Points 9-10) on May 13, 2010 when discharge was measured to be 2.6
cubic feet per second.
The channel upstream of Greenbush Road has a gentle slope, distinct banks, and
deposit of fine sediments. Channel bed features of riffles and pools are evident.The bed is primarily silt and clay, with fine gravel in riffles and thalweg cross-
over locations (upstream of Point 9). The stream walk extended upstream to a
private driveway culvert crossing (Point 10). This location has obviously flowingwater, with a 1+ foot drop at the outlet of the culvert. There is a 1+ foot dam
upstream of this location. This section of channel appears to be outside the effect
of the Lake. Large debris jams cause accumulation of sediments upstream of
Greenbush Road and provide channel grade control and instream habitat.
Immediately upstream of Greenbush Road, sediments indicate periodic backwatering by the culvert under the roadway, but channel characteristics
indicate that this location is dominated by a flowing-water environment.Downstream of Greenbush Road a large scour pool has formed. The poolelevation is controlled by a downstream riffle that serves as a distinct tailwater
control. Downstream of Greenbush Road, the channel has a triangular cross
section and clay bottom with no signs of backwatering (Point 2).
The channel enters an open field upstream of a stone masonry Railroad Bridge
(Points 3-4). The channel has a clay bottom, low velocity, low sinuosity, and isvery flat. Upstream of the bridge the channel depth increases and velocity
decreases to the point where it is hard to tell if the water is flowing.
Backwatering appears to be taking place in this location. The water surface
elevation is flat through the Railroad Bridge and thus this backwatering does notappear to be caused by the crossing structure but a downstream location. The
outlet pool downstream of the railroad has a flat water surface elevation. The
channel downstream is a very flat, meadow channel with low velocity (E channel,Rosgen and Silvey, 1996). The channel is well-connected to its floodplain.
8/8/2019 Water Quality Planning on Thorp and Kimball Brooks - 2010 Report
http://slidepdf.com/reader/full/water-quality-planning-on-thorp-and-kimball-brooks-2010-report 18/41
THORP AND KIMBALL BROOKS PAGE 11
DECEMBER 2010

8/8/2019 Water Quality Planning on Thorp and Kimball Brooks - 2010 Report
http://slidepdf.com/reader/full/water-quality-planning-on-thorp-and-kimball-brooks-2010-report 19/41
THORP AND KIMBALL BROOKS PAGE 12
DECEMBER 2010
Figure 7a: Thorp Brook just downstream of the Greenbush Road Culvert looking downstream
(Source: MMI, May 7, 2010).
Figure 7b: Thorp Brook at beginning of lake influence downstream of the railroad crossing
(Source: MMI, May 7, 2010).
8/8/2019 Water Quality Planning on Thorp and Kimball Brooks - 2010 Report
http://slidepdf.com/reader/full/water-quality-planning-on-thorp-and-kimball-brooks-2010-report 20/41

8/8/2019 Water Quality Planning on Thorp and Kimball Brooks - 2010 Report
http://slidepdf.com/reader/full/water-quality-planning-on-thorp-and-kimball-brooks-2010-report 21/41
THORP AND KIMBALL BROOKS PAGE 14
DECEMBER 2010
2.2.2 Low Stream Flow / Low Lake Level Observations
Flow in Thorp Brook was extremely low during the dry summer of 2010 (Figure
8). The brook was observed on July 13 and August 10 at select locations. Flow
was very low, almost non-existent.
During the summer period thick grasses grew over the banks and emergent
wetland vegetation began to grow in the channel. Although barely moving, the
water was turbid due to suspension of clay particles. The water was clearly not backwatered by the lake at the Greenbush Road culvert and immediate area. The
transition between lake and stream likely exist downstream of the Railroad
Culvert in the vicinity of the lake-edge floodplain forest.
Figure 8: Thorp Brook at low flow on (Source: MMI, July 13, 2010).
2.2.3 High Stream Flow / High Lake Level Observations
There were no high flow events observed during high lake levels. These eventswould typically occur during spring snow melt rain events and did not occur
during this study period. Field observations suggest that lake backwatering would
extend up to and through the Railroad Culvert during high flows. The extremeupstream limit of lake backwatering during large flood events at high lake levels
is likely just downstream of Greenbush Road.

8/8/2019 Water Quality Planning on Thorp and Kimball Brooks - 2010 Report
http://slidepdf.com/reader/full/water-quality-planning-on-thorp-and-kimball-brooks-2010-report 22/41
THORP AND KIMBALL BROOKS PAGE 15
DECEMBER 2010
2.2.4 High Stream Flow / Low Lake Level Observations
High stream flows were observed in Thorp Brook on October 1 and 15, 2010
(Figure 9). Flow was freely flowing downstream in the channel with significant
flow on the floodplain downstream of Greenbush Road. The transition between
lake and stream likely exist downstream of the Railroad Culvert.
Figure 9: High flows at the Thorp Brook staff gauge location, looking downstream(Source: MMI, October 1, 2010).
2.2.5 Survey
Survey to profile the channel was not completed as it will not provide very useful
information as originally anticipated. Survey was performed to record the
elevation of the staff gauge and local reference points to reset the staff gaugewhen it is dislodged (see Stream Gauging Section).
2.2.6 Summary
The channel appears to transition from stream to lake in the vicinity of theRailroad crossing. The lake may have influenced approximately halfway between
the railroad and Greenbush Road (Point 3). The low-gradient channel may allow
lake influence as far back as the Greenbush Road culvert during higher lake levelswhere a riffle exists downstream of the structure.

8/8/2019 Water Quality Planning on Thorp and Kimball Brooks - 2010 Report
http://slidepdf.com/reader/full/water-quality-planning-on-thorp-and-kimball-brooks-2010-report 23/41
THORP AND KIMBALL BROOKS PAGE 16
DECEMBER 2010
3.0 STREAM GAUGING
Staff gauges were placed on Kimball and Thorp Brooks and rating curves were
developed to allow for flow to be calculated during future water quality sampling.
Stream flows are necessary to identify when low and high flows are taking place during
sampling, and are needed to convert parameter concentrations to loads.
The staff gauges are 3.3 feet tall scales mounted on a post driven into the stream bed.
Observers stand on the river bank and record the water level at the gauge in tenths of feet.A detailed description of the measurement techniques and a sample field record form that
would be useful for water quality monitoring have been developed (Appendix C). Gauge
height measurements would then be converted to discharge (cubic feet per second) withthe rating curve (height versus discharge).
3.1 Kimball Brook
3.1.1
Gauge Location
Stream gauging on Kimball Brook was established near Greenbush Road todocument watershed discharge. No significant perennial flow inputs were
observed between Greenbush Road and the Lake. The ideal gauge location is a
few hundred feet downstream of Greenbush Road in the straight, uniform stretchof channel along Kimball Brook Farm. A gauge was initially set up in this
location, but then moved to upstream of the Greenbush Road Culvert due to
difficulty accessing the initial gauge site.
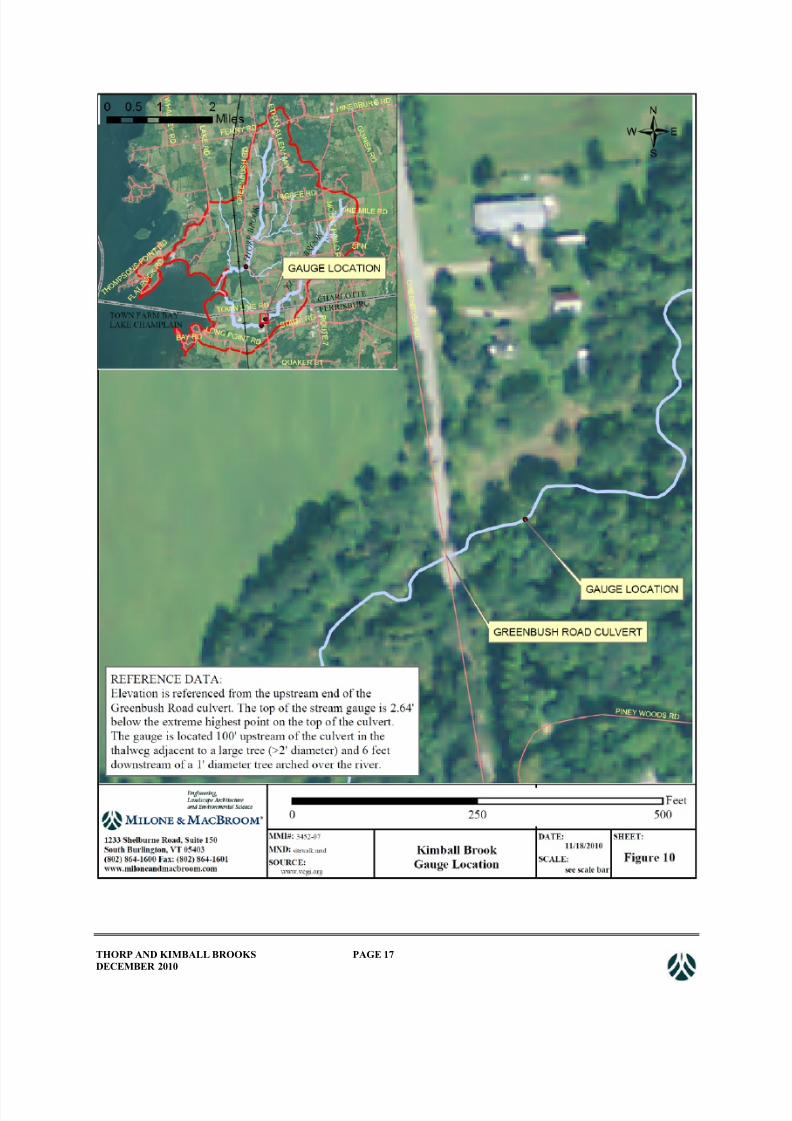
The staff gauge was installed in the stream thalweg 100 feet upstream of the
Greenbush Road Culvert (Figure 10). The backwater from the partiallyundersized culvert and road embankment does not influence flows at the gaugingsite except during large floods when the gauge is submerged. The gauge is
adjacent to a very large tree (diameter > 2 feet) on the left bank (facing
downstream). Survey was performed to document the staff gauge elevation inreference to permanent features so that it may be replaced when dislodged. The
Greenbush Road Culvert (corrugate metal pipe, diameter = 6 feet) was used as a
local survey reference. The highest point on top of the upstream end of theculvert is 2.77’ above the top of the staff gauge and 2.64’ above the top of the
fence post. Therefore, the top of the culvert is equivalent to 6.1’ on the staff
gauge were it to extend that tall.
8/8/2019 Water Quality Planning on Thorp and Kimball Brooks - 2010 Report
http://slidepdf.com/reader/full/water-quality-planning-on-thorp-and-kimball-brooks-2010-report 24/41
THORP AND KIMBALL BROOKS PAGE 17
DECEMBER 2010
8/8/2019 Water Quality Planning on Thorp and Kimball Brooks - 2010 Report
http://slidepdf.com/reader/full/water-quality-planning-on-thorp-and-kimball-brooks-2010-report 25/41
THORP AND KIMBALL BROOKS PAGE 18
DECEMBER 2010
3.1.2 Methods
Instantaneous stage and cross-sectional flow measurements were made upstream
of the Greenbush Road culvert using the velocity-area method at 0.6 times depth
(Leopold et al., 1964). Velocity was also measured in the culvert during high
flows to provide an indirect measurement of discharge when wading is not possible in the channel (Bodhaine, 1982). The indirect discharge measurements
in the culvert followed the procedures provided in the velocity meter user’s
manual (Marsh-McBirney, 1990) (Appendix D).
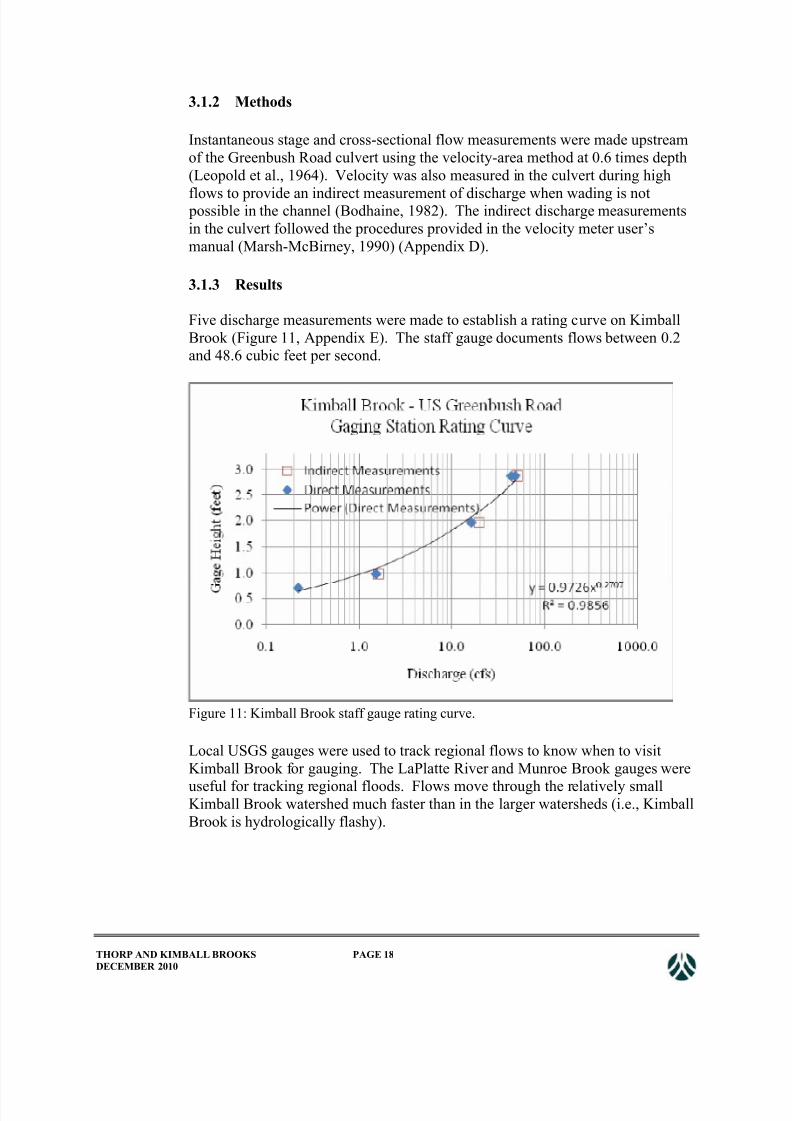
3.1.3 Results
Five discharge measurements were made to establish a rating curve on Kimball
Brook (Figure 11, Appendix E). The staff gauge documents flows between 0.2and 48.6 cubic feet per second.
Figure 11: Kimball Brook staff gauge rating curve.
Local USGS gauges were used to track regional flows to know when to visit
Kimball Brook for gauging. The LaPlatte River and Munroe Brook gauges were
useful for tracking regional floods. Flows move through the relatively smallKimball Brook watershed much faster than in the larger watersheds (i.e., Kimball
Brook is hydrologically flashy).
8/8/2019 Water Quality Planning on Thorp and Kimball Brooks - 2010 Report
http://slidepdf.com/reader/full/water-quality-planning-on-thorp-and-kimball-brooks-2010-report 26/41
THORP AND KIMBALL BROOKS PAGE 19
DECEMBER 2010
3.2 Thorp Brook
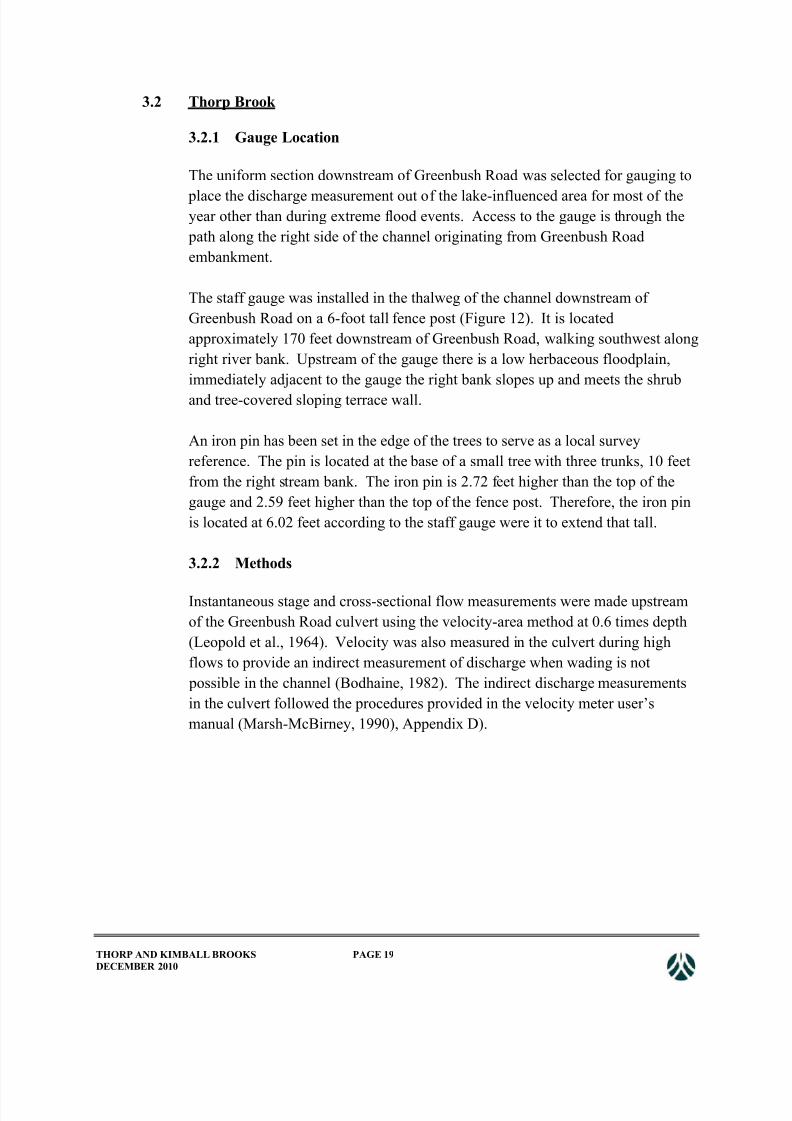
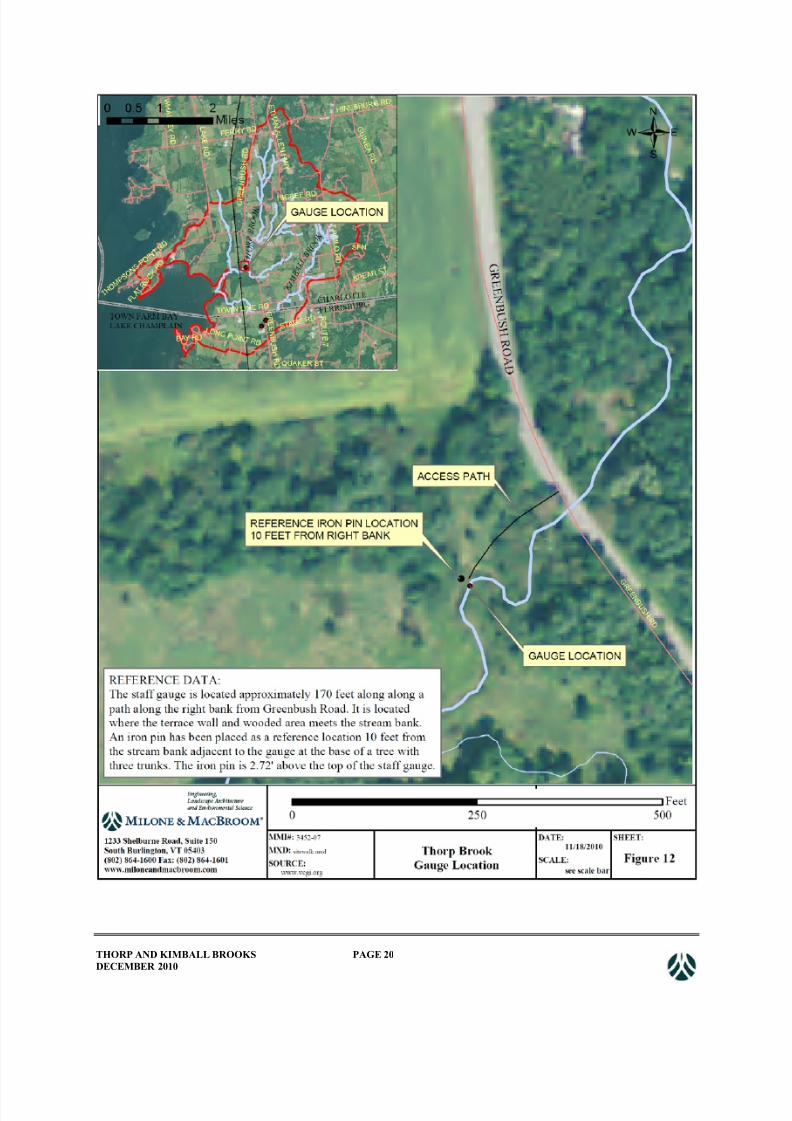
3.2.1 Gauge Location
The uniform section downstream of Greenbush Road was selected for gauging to
place the discharge measurement out of the lake-influenced area for most of theyear other than during extreme flood events. Access to the gauge is through the
path along the right side of the channel originating from Greenbush Road
embankment.
The staff gauge was installed in the thalweg of the channel downstream of
Greenbush Road on a 6-foot tall fence post (Figure 12). It is located
approximately 170 feet downstream of Greenbush Road, walking southwest along
right river bank. Upstream of the gauge there is a low herbaceous floodplain,
immediately adjacent to the gauge the right bank slopes up and meets the shrub
and tree-covered sloping terrace wall.
An iron pin has been set in the edge of the trees to serve as a local survey
reference. The pin is located at the base of a small tree with three trunks, 10 feet
from the right stream bank. The iron pin is 2.72 feet higher than the top of the
gauge and 2.59 feet higher than the top of the fence post. Therefore, the iron pin
is located at 6.02 feet according to the staff gauge were it to extend that tall.
3.2.2 Methods
Instantaneous stage and cross-sectional flow measurements were made upstream
of the Greenbush Road culvert using the velocity-area method at 0.6 times depth
(Leopold et al., 1964). Velocity was also measured in the culvert during high
flows to provide an indirect measurement of discharge when wading is not
possible in the channel (Bodhaine, 1982). The indirect discharge measurements
in the culvert followed the procedures provided in the velocity meter user’s
manual (Marsh-McBirney, 1990), Appendix D).
8/8/2019 Water Quality Planning on Thorp and Kimball Brooks - 2010 Report
http://slidepdf.com/reader/full/water-quality-planning-on-thorp-and-kimball-brooks-2010-report 27/41
THORP AND KIMBALL BROOKS PAGE 20
DECEMBER 2010
8/8/2019 Water Quality Planning on Thorp and Kimball Brooks - 2010 Report
http://slidepdf.com/reader/full/water-quality-planning-on-thorp-and-kimball-brooks-2010-report 28/41
THORP AND KIMBALL BROOKS PAGE 21
DECEMBER 2010
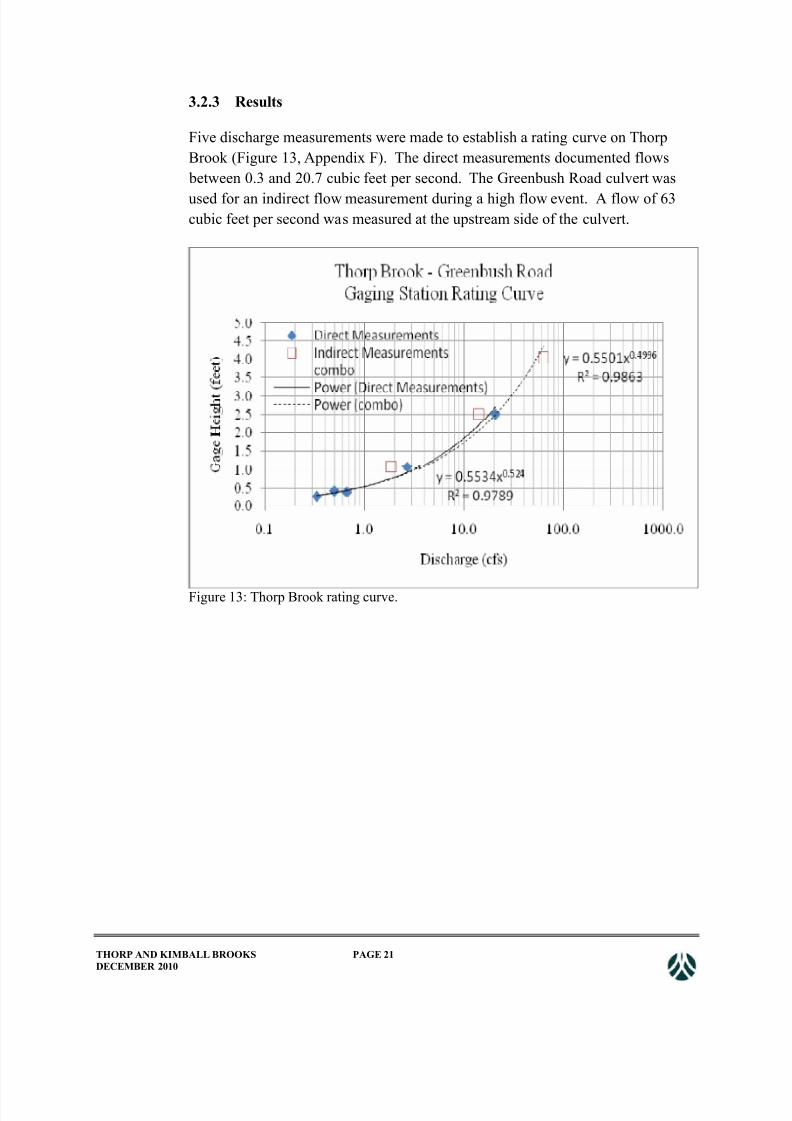
3.2.3 Results
Five discharge measurements were made to establish a rating curve on Thorp
Brook (Figure 13, Appendix F). The direct measurements documented flows
between 0.3 and 20.7 cubic feet per second. The Greenbush Road culvert was
used for an indirect flow measurement during a high flow event. A flow of 63cubic feet per second was measured at the upstream side of the culvert.
Figure 13: Thorp Brook rating curve.
8/8/2019 Water Quality Planning on Thorp and Kimball Brooks - 2010 Report
http://slidepdf.com/reader/full/water-quality-planning-on-thorp-and-kimball-brooks-2010-report 29/41
8/8/2019 Water Quality Planning on Thorp and Kimball Brooks - 2010 Report
http://slidepdf.com/reader/full/water-quality-planning-on-thorp-and-kimball-brooks-2010-report 30/41
THORP AND KIMBALL BROOKS PAGE 23
DECEMBER 2010
during dry periods are taken following storm events when there is enough flow in
the channel to collect water.
Analysis of the water quality data generally indicates that total phosphorus
concentrations are high in Kimball Brook for freshwater streams, but values are
typical relative to other rivers and streams in the region. A local pulse of high
concentration of total phosphorus was measured in 2008 near Vermont Route 7.
The concentrations of nutrients tend to be higher at Town Line Road than at
Greenbush Road (VTDEC, 2010).
Although flow data have not been collected until the current gauging effort, a
review of precipitation records indicated that the nutrient inputs are most likely
linked to uncontrolled farm runoff. Total suspended solids concentration tended
to track phosphorus levels, yet the relationship was inconsistent. Solids and
turbidity levels varied widely.
Sampling has also been performed at three monitoring sites in Town Farm Bay –
near the mouths of Thorp and Kimball Brooks, mid-bay, and at the edge of the
bay on Lake Champlain. Nutrient and chlorophyll concentrations tend to be
higher closer to the mouths of Thorp and Kimball Brooks.
Additional data analysis and findings are available for Kimball Brook water
quality sampling through Lewis Creek Association and Vermont Department of
Environmental Conservation (VTDEC, 2010).
4.1.3 Field-Scale Hydrology
The proximity to Lake Champlain, flat terrain in the lower direct drainage
watersheds, historic channel and floodplain alterations, and current land use
dominated by agricultural fields suggests that field-scale hydrology is an
important water quality consideration. Past and current field observations
indicate that stormwater runoff from farm fields, barnyard areas, and road ditches
enter Kimball Brook in numerous locations.
The Vermont office of the Natural Resources Conservation Service (NRCS)
recently performed a GIS study to approximate the location of the farm field
ditches (Appendix H). The GIS mapping exercise indicates that several flow
paths likely exist on Kimball Brook that could be contributing high sediment and
phosphorus levels previously observed. Several flow paths north and south of
Town Line Road should be confirmed and addressed.

8/8/2019 Water Quality Planning on Thorp and Kimball Brooks - 2010 Report
http://slidepdf.com/reader/full/water-quality-planning-on-thorp-and-kimball-brooks-2010-report 31/41
THORP AND KIMBALL BROOKS PAGE 24
DECEMBER 2010
4.2 Thorp Brook
4.2.1 Geomorphic
The following watershed description was taken from the existing phase 1 stream
geomorphic assessment for Thorp Brook (T8.02-05) (LCA, 2008). “Thorp Brook and its 4 tributaries flow mainly south from the Route 7 and Hinesburg Road area
across East Thompson’s Point Road and Greenbush Road, entering Lake
Champlain in Town Farm Bay. Watershed land use is field and forest with
increasing development. Many areas have little to no woody riparian buffer
vegetation. Total watershed area is 3.8 square miles. One dam with pond is
present along the mainstem with several more on tributaries. Relatively little
straightening is evident, however the channel appears to be migrating, especially
in the downstream reaches. The mainstem flows through 5 culverts with 10 more
on tributaries. Relatively few roads and developments encroached into the
corridor. Some bank erosion was visible in the windshield survey. Invasive
aquatic plants and algae are present in the bay.”
The phase 1 data confirm field observations of a meadow stream dominated by
dune-ripple bed downstream in the vicinity Greenbush Road (Appendix G).
Some well-defined small riffles existing downstream of Greenbush Road. The
primary stressor is land use change near the channel and in the watershed.
A phase 2 assessment was previously performed on a small portion of Thorp
Brook upstream of Albee Road (T8.03). The assessment documented a strong
influence on the channel due to beaver activity. The channel was generally found
to be in “good” condition in terms of geomorphic equilibrium and habitat quality
(LCA, 2008).
4.2.2 Water Quality
Water quality monitoring has been conducted on Thorp Brook since 2008 by local
volunteers to track inputs to Town Farm Bay. Six stations have been monitored
on Thorp Brook – Greenbush Road (T1: 2010, 2009, 2008), East Thompson’s
Point Road (T1.5: 2010, 2009), East Branch (T2: 2010, 2009, 2008), two ontributary to the north (T3: 2010, 2009, 2008 and T3.5: 2010), and a tributary to
the east (TW1). Similar parameters were collected on Thorp and Kimball Brooks.
Analysis of the water quality data generally indicates that total phosphorus
concentrations are high in lower Thorp Brook for freshwater streams, yet typical
of values observed on other streams and rivers in the region (VTDEC, 2010). The
8/8/2019 Water Quality Planning on Thorp and Kimball Brooks - 2010 Report
http://slidepdf.com/reader/full/water-quality-planning-on-thorp-and-kimball-brooks-2010-report 32/41
THORP AND KIMBALL BROOKS PAGE 25
DECEMBER 2010
suggested sources for the increased phosphorus are bank erosion and polluted
farm runoff. Cropland and roadside ditches were observed delivering sediment-
laden runoff to Thorp Brook.
A local hotspot of high total nitrogen concentration was identified in 2010 on the
north tributary that flows into the lake-edge floodplain (T3.5). The sample was
collected during high flows following a large flood in October 2010 near the
outlet of a farm pond. Farm fields are upstream of the sample locations. The
concentration of total nitrogen at station T3.5 is the highest value recorded in the
region.
Although flow data have not been collected until the current gauging effort, a
review of precipitation records indicated that the nutrient inputs are most likely
linked to uncontrolled farm runoff. Total suspended solids concentration tended
to track phosphorus levels, yet the relationship was inconsistent. Solids andturbidity levels varied widely.
Water quality analyses were performed on Holmes Brook during 2010.
Additional data analysis and findings are available for Thorp Brook water quality
sampling through Lewis Creek Association and Vermont Department of
Environmental Conservation (VTDEC, 2010).
4.2.3 Field-Scale Hydrology
The Vermont office of the Natural Resources Conservation Service flow
accumulation GIS study illustrates a few field runoff paths to the northeast of
Greenbush Road (Appendix H). Several flow paths enter the large Thorp Brook
wetland complex that could buffer the stream from water quality impacts. Again,
the fact that the lower portion of the direct drainage watershed is inundated each
year suggests a strong hydrologic connection to Town Farm Bay and Lake
Champlain.
8/8/2019 Water Quality Planning on Thorp and Kimball Brooks - 2010 Report
http://slidepdf.com/reader/full/water-quality-planning-on-thorp-and-kimball-brooks-2010-report 33/41
THORP AND KIMBALL BROOKS PAGE 26
DECEMBER 2010
5.0 DIRECT DRAINAGE ASSESSMENT PLANNING
5.1 Monitoring and Study Recommendations
The field work and existing data review illustrate the water quality threats in the Thorp-
Kimball watershed that directly drains to Lake Champlain via Town Farm Bay. The primary threat is pulses of sediment and nutrient loading associated with local storm
events due to land use change, altered hydrology, and historic channel alteration.
Channel flow, ditch flow, and field runoff are closely linked to Lake Champlain.
5.1.1 Hydrology
The staff gauges should be read each time any field observations are made or a
water quality sample is collected. The rating curve will be used to convert the
gauge reading to a discharge. The flow calculated from the gauge reading can be
transferred to other locations on Thorp and Kimball Brooks by scaling bydrainage area. Adding a flow value to water quality data will allow for separating
samples into flood and low flow collections, and will allow for calculation of
instantaneous mass. Flow measurements will also allow for estimation of where
on the hydrograph a sample is taken (i.e., before or after the peak of the flood).
A long-term daily gauge record is needed to create a time series of daily load that
can be used to estimate monthly, seasonal, or annual load. The gauge should be
read by a volunteer who passes the gauge location for a select month-long or
seasonal period. The gauge readings should span multiple water quality sample
runs. The daily stage rating will be coupled with the water quality samples to
estimate daily, seasonal and annual loads or yields.
The staff gauges must be checked and maintained after spring thaw and large
floods. Any signs of movement should lead to resetting the gauges based on the
local survey reference points.
Lewis Creek Association may want to periodically confirm or update the rating
curve generated as part of this project. In the case of high flow events during
water quality monitoring where the staff gauge is submerged or the gauge cannot be accessed due to floodplain inundation, water quality samplers should measure
the depth of water at the upstream and downstream end of the culvert to make an
indirect measurement of discharge during high flows.

8/8/2019 Water Quality Planning on Thorp and Kimball Brooks - 2010 Report
http://slidepdf.com/reader/full/water-quality-planning-on-thorp-and-kimball-brooks-2010-report 34/41
8/8/2019 Water Quality Planning on Thorp and Kimball Brooks - 2010 Report
http://slidepdf.com/reader/full/water-quality-planning-on-thorp-and-kimball-brooks-2010-report 35/41
THORP AND KIMBALL BROOKS PAGE 28
DECEMBER 2010
throughout a storm, and how this sample relates to other parameters measured
during high-frequency sampling.
The storm loading study would be performed at Town Line Road (K1) on
Kimball Brook if the existing culvert did not restrict flows too much to create
ponding upstream of the road and if the lake level was not too high. If ponding
does exist at Town Line Road, the high-frequency sampling should be conducted
at Greenbush Road (K2).
On Thorp Brook the storm loading study should be conducted downstream of
Greenbush Road (T1) and on the tributary to the north that flows into the lake-
edge floodplain (T3). Sampling is needed in both of these locations to document
the full loading during storms to Town Farm Bay.
High-frequency storm loading characterization is a good project for graduatestudents since they are conducted over short time frames that mesh well with an
academic schedule and tell an informative story about the watershed. Students at
University of Vermont and Green Mountain College should be considered to
assist with implementing the study of storm loading on direct drainages. This
project may be well-suited for the EPSCoR Vermont Streams Project.
5.1.3 Continued Lay Monitoring
The current water quality sampling has been effective to initially characterize the
primary threats in the Kimball and Thorp Brook watershed, yet this monitoring protocol is not adequate to understand the dynamic runoff events and watershed
yield. On-going water quality monitoring should be scaled back to one or two
samples primarily to facilitate calculation of watershed yield. Samples should be
collected monthly or when flows permit in the summer. Kimball Brook sampling
should continue at Greenbush Road (K2) and Thorp Brook sampling should
continue at Greenbush Road (T1) and the northern tributary with high nitrogen
(T3).
Analysis should continue to be performed for total phosphorus, total nitrogen, and
turbidity. Samples should also be collected and filtered to analyze for dissolved
phosphorus as this is the nutrient component that is readily available in Town
Farm Bay to produce algae blooms and impair local recreation. Monitoring
would thus allow for comparing total and dissolved phosphorus loads that could
improve the ability to develop appropriate management strategies.
8/8/2019 Water Quality Planning on Thorp and Kimball Brooks - 2010 Report
http://slidepdf.com/reader/full/water-quality-planning-on-thorp-and-kimball-brooks-2010-report 36/41
THORP AND KIMBALL BROOKS PAGE 29
DECEMBER 2010
Samples in Town Farm Bay should be continued at the outlet of Thorp and
Kimball Brooks, and off of East Thompson’s Point. Dissolved phosphorus should
be added to sampled parameters to understand the threat to recreation due to algae
blooms from excess nutrient loading. Sampling in the bay would also allow for
comparing estimates of loading from the watershed to the loading in the bay to
see if nutrients are originating in the local uplands or from other watersheds such
as Little Otter Creek that circulate into Town Farm Bay.
5.1.4 Windshield Survey
Perform a windshield survey to locate frequently inundated areas that could
potentially be critical source areas of nutrients and document obvious historic
channel and floodplain alterations for restoration. Observations could be
conducted by volunteer monitors or by the Charlotte Conservation Commission.
During moderate and large flood events observed inundated areas could be
sketched on a map and eventually digitized by Lewis Creek Association to
archive findings. The gauges should be read to document stream flow during
inundation area mapping. Areas regularly inundated should be prioritized for
working with landowners to buffer streams and naturalize hydrology. The
windshield survey could also attempt to document altered channel and floodplains
to identify potential restoration sites.
5.1.5 Stream Geomorphic Assessment
Phase 2 stream geomorphic assessment (VTANR, 2009) may be conducted in
Kimball Brook upstream of Town Line Road and on Thorp Brook upstream of the
Railroad Crossing. The channels appear to be mostly fluvial throughout the year
in these locations and thus the protocols would apply. The assessment should be
done during low to moderate flows.
Channels appear to be mostly stable with minimal erosion due to cohesive clay
banks and gentle sloping streams, yet the assessment could expand documentation
of baseline conditions of the channel and floodplains as increased incision is
possible due to land development and the predicted increase in storm size. A
critical element of the assessment would be to locate each stormwater input to the
channel from overland flow paths from farm fields and ditch flow locations.
Other needs of the assessment include confirming the transition between riffle-
pool and dune-ripple stream types, verifying floodplain-channel connections, and
documenting historic alterations of the channel and floodplains.

8/8/2019 Water Quality Planning on Thorp and Kimball Brooks - 2010 Report
http://slidepdf.com/reader/full/water-quality-planning-on-thorp-and-kimball-brooks-2010-report 37/41
THORP AND KIMBALL BROOKS PAGE 30
DECEMBER 2010
5.1.6 Update Watershed Delineation
Previous watershed delineation and mapping of the stream network at the
boundary between the Thorp Brook and Holmes Brook watersheds shows the
western tributary to Thorp Brook extending north beyond the watershed divide.
This flat headwater location where farm fields exist needs to be visited to fine-
tune watershed mapping. Field reconnaissance is also needed to map a drainage
divide between the western edge of the Thorp Brook watershed and the local
areas that directly drain to Town Farm Bay and Lake Champlain.
5.1.7 Apply Findings of Existing Studies to Direct Drainages
Several studies have been performed and are on-going that could be applied to
Lake Champlain direct drainages such as Kimball and Thorp Brooks. The Lake
Champlain Basin Program is sponsoring a critical source area identification
project in the Missisquoi Bay Basin and a road ditch project in the region.
Methods and findings from both of these projects could support efforts to improve
water quality on direct drainages. Improving the quality of road ditch runoff is
important for Kimball and Thorp Brooks. Critical source area identification could
help focus in on problem areas near the lake.
The Vermont Water Quality Division performed a nutrient study in the Rock
River watershed to explore phosphorus yield versus common GIS variables to try
and create a quick method to estimate loading around the watershed.
Other studies exist and a workshop may be beneficial to share lessons learned and
to continue to develop strategies to investigate and improve water quality in direct
drainages of Lake Champlain.
5.2 Implementation Recommendations
5.2.1 Investigate Possible Water Quality Hot Spots
Based on past water quality sampling two sites stand out as possible sources of
impairment – Kimball Brook near Vermont Route 7 (K4 and K5) and the tributaryto the north of Thorp Brook (T3.5). Local landowners should be contacted and
field investigation should be performed to try and identify the possible sources of
nutrient inputs at the potential hot spots. Note that these sites were identified as
areas of concern solely based on concentrations so the relative importance of the
loads relative to other watershed locations is not known.

8/8/2019 Water Quality Planning on Thorp and Kimball Brooks - 2010 Report
http://slidepdf.com/reader/full/water-quality-planning-on-thorp-and-kimball-brooks-2010-report 38/41
THORP AND KIMBALL BROOKS PAGE 31
DECEMBER 2010
5.2.2 Investigate Impaired Locations
During site walks several sites appeared to be impaired or to be possible sources
of nutrients. Local landowners should be contacted and field investigation should
be performed to try and confirm the possible sources of nutrient inputs and
explore project development to improve conditions.
On Kimball Brook the cattle crossing under the railroad needs improvement or to
be moved to a new location to limit physical damage to the channel, excessive
sedimentation, and direct input of manure. This project is a current priority.
Work is needed at the farm on Kimball Brook at Town Line Road to disconnect
the flow paths between the barnyard and farm fields to the channels. Given its
location near the permanent transition from stream to lake, this farm essentially
sits on the edge of Lake Champlain and thus its activities directly influence thelake-edge floodplain and Town Farm Bay. Kimball Brook is highly altered
around this farm and thus restoring the historic channel and floodplain while
excluding cattle would be highly beneficial to water quality. Some cattle were
excluded from the historic floodplain during the stream walk in this area yet it is
unknown for how long.
The small pasture adjacent to the Kimball Brook channel upstream of Greenbush
Road needs a vegetated buffer and runoff controls on the steep slope.
On lower Thorp Brook a vegetated buffer is needed adjacent to the mowed lawnsupstream of Greenbush Road.
5.2.3 Investigation of Field-Scale Runoff Pathways
The NRCS field hydrology study reveals likely flow paths where sediment and
nutrients are delivered to Kimball Brook, Thorp Brook, and tributaries (see
circled areas on Figures 2 and 6). These potential runoff sites should be field
verified with local farmers and efforts should be made to employ best
management practices to separate runoff from farms during floods from the brook
and lake. Priority areas to investigate on lower Kimball Brook include:
• The co-located cattle/stream crossing under the railroad;
• The north to south farm field flow path that enters Kimball Brook before the
channel turns north towards Town Line Road;
• The flow path draining the barnyard area adjacent to Town Line Road; and
8/8/2019 Water Quality Planning on Thorp and Kimball Brooks - 2010 Report
http://slidepdf.com/reader/full/water-quality-planning-on-thorp-and-kimball-brooks-2010-report 39/41
THORP AND KIMBALL BROOKS PAGE 32
DECEMBER 2010
• The field flow paths that enter the tributary of Kimball Brook that flows into
the lake-edge floodplain.
Priority areas to investigate on lower Thorp Brook include:
• The east to west field ditch that flows into Thorp Brook to the east of
Greenbush Road; and
• Holmes Brook and the documented flow paths from farm fields entering the
channel north of Thompson’s Point Road.
5.2.4 Promote Implementation of Agriculture BMPs
Continued effort is needed to work with local farmers in the direct drainages to
implement agriculture best management practices (BMPs) to naturalize land cover
and field hydrology. Land use conversion on regularly inundated areas is a
primary threat to water quality in the bay and lake. Adjusting cropping plan based on field inundation (i.e., changing the wettest areas from corn to hay), cover
cropping, conservation tillage, injection spreading, row cropping, and other
practices should be discussed with farmers to reduce nutrient-rich runoff.
5.3 Guiding Principles for Improving Direct Drainages
5.3.1 Naturalize Hydrology
The hydrology of Thorp Brook, Kimball Brook, and other direct drainages needs
to be naturalized through reverting land cover to natural vegetation or implementation of best management practices that mimic the functions of
vegetation (e.g., absorb and slow runoff). With the pervasive land use conversion
more water is now moving through the drainages at much faster rates than before.
The result is a more rapid movement of nutrients from fields to bay and lake, and
an increase in erosion. This is especially true given the fine clay particles that
once mobilized may be transported downstream, into bays, and out to the lake.
Increased erosion leads to more sedimentation and sediment-associated nutrients.
Naturalizing watershed hydrology to slow the movement of water through the
direct drainages is especially important given the likely increase in the size andfrequency of storms expected in the region (Collins, 2009). Naturalizing
hydrology is also important to retain soil to grow crops on land and limit the
growth of algae in the bays and Lake Champlain.

8/8/2019 Water Quality Planning on Thorp and Kimball Brooks - 2010 Report
http://slidepdf.com/reader/full/water-quality-planning-on-thorp-and-kimball-brooks-2010-report 40/41
THORP AND KIMBALL BROOKS PAGE 33
DECEMBER 2010
5.3.2 Restore Natural Channel Planform
Channel alternation is pervasive in the Thorp and Kimball Brook watersheds.
Many channels have been straightened and moved to the sides of valleys to create
agriculture fields. Small culverts convey channels under roadways. Channels in
the direct drainages generally need more space to reform their sinuosity, decrease
slope, and allow for stable natural channels to form. This will reduce erosion
from bank erosion and channel avulsion.
5.3.3 Naturalize Floodplain Vegetation
Floodplain connection appears to be good in Thorp and Kimball Brooks, and this
should be preserved to limit flood water velocity and reduce erosion in the
channels in direct drainages. Floodplains that are inundated the most should be
reverted to natural vegetation. Ditches should be plugged to rehabilitate overland
flow through natural vegetation. The duration of floodplain inundation should be
explored as this is an important determinant of the biophysical nature of channels
(Shields et al., 2008).
8/8/2019 Water Quality Planning on Thorp and Kimball Brooks - 2010 Report
http://slidepdf.com/reader/full/water-quality-planning-on-thorp-and-kimball-brooks-2010-report 41/41
6.0 REFERENCES
Bodhaine, G., 1982. Measurement of Peak Discharge at Culverts by Indirect Methods
(Techniques of Water-Resources Investigations of the United States Geological Survey,
Chapter A3). U.S. Geological Survey, Reston, VA.
Collins, M. J., 2009. Evidence for Changing Flood Risk in New England since the Late 20thCentury. Journal of The American Water Resources Association 45(2):279-290.
LCA, 2008. Phase 1 & 2 Geomorphic Assessment Report: Direct Drain to Lake Champlain in
Shelburne and Charlotte. Prepared for Lewis Creek Association by Lisa Godfrey andfunded by VT Department of Environmental Conservation, Charlotte, VT.
Leopold, L. B., M. G. Wolman, and J. P. Miller, 1964. Fluvial Processes in Geomorphology,
Dover Publications, Inc., New York.Marsh-McBirney, 1990. Flo-Mate Model 2000 Portable Flowmeter Instruction Manual. Marsh-
McBirney Inc., Frederick, MD.
Rosgen, D. and L. Silvey, 1996. Applied River Morphology, Wildland Hydrology, PagosaSprings, CO.
Shields, F. D., S. Knight, and R. E. Lizotte, 2008. Kondolf Diagram for River Backwater Restoration. In Proceedings of: World Environmental and Water Resources Congress -
Ahupua’A. R. W. Babcock and R. Walton (Editors), Environmental And Water Resources Institute (EWRI) of the American Society of Civil Engineers, Honolulu,
Hawaii
Thompson, E. H. and E. R. Sorenson, 2005. Wetland, Woodland, and Wildland: A Guide to the Natural Communities of Vermont, University Press of New England, Lebanon, NH.
VTANR, 2009. Vermont Stream Geomorphic Assessment Protocol Handbooks: Remote Sensing
and Field Surveys Techniques for Conducting Watershed and Reach Level Assessments(Http://Www.Anr.State.Vt.Us/Dec/Waterq/Rivers/Htm/Rv_Geoassesspro.Htm).
Acquired via the internet May 17, 2007. Vermont Agency of Natural Resources,Department of Environmental Conservation, Division of Water Quality, River
Management Program, Waterbury, VT.
VTDEC, 2010. Thorp and Kimball Brook Water Quality Monitoring Report. Prepared by KarenBates of Vermont Department of Environmental Conservation and Bill Hoadley,
Waterbury, VT.