water quality report nutley water department - amazon web … · 2015 water quality report nutley...
TRANSCRIPT

2015 Water Quality Report Nutley Water Department
Source Water Assessment SummaryA State Review of Potential Contamination Sources Near Your Drinking Water
The New Jersey Department of Environmental Protection (NJDEP) has completed and issued the Source Water Assessment Report and Summary for all public water systems. The Source Water Assessment and related questions can be obtained by logging onto the NJDEP’s source water assessment website at www.state.nj.us/dep/swap or by contacting the NJDEP’s Bureau of Safe Drinking Water at (609) 292-5550. If a system is rated highly susceptible for a contamination category, it does not mean a customer is or will be consuming contaminated water. The rating reflects the potential for contamination of source water., not the existence of contamination. Public water systems are required to monitor for regulated contamiants and to install treatment if any contaminants are detected at frequencies and concentrations above allowable levels. The source water assessments performed on the intakes for each system lists the following susceptibility rated as indicated in the following table.
SuSceptibility RatingS foR paSSaic Valley WateR commiSSion, city of neWaRk WateR, JeRSey city municipal utilitieS autHoRityand noRtH JeRSey diStRict WateR Supply commiSSion-Wanaque noRtH SyStemS SouRceS
Intakes Pathogens Nutrients PesticidesVolatile Organic
CompoundsInorganic
ContaminantsRadionuclides Radon
DisinfectionByproductPrecursors
PVWC4 - Surface Water
4 - High 4 - High1 - Medium
3 - Low4 - Medium 4 - High 4 - Low 4 - Low 4 - High
NJDWSC5 - Surface Water
5 - High 5 - High2 - Medium
3 - Low5 - Medium 5 - High 5 - Low 5 - Low 5 - High
Jersey City MUA1 - Surface Water
1- High 1- Medium 1- Low 1- Medium 1 - Medium 1 - Low 1 - Low 1 - High
Newark1 - Surface Water
1 - High 1 - Low 1 - Low 1 - Low 1 - High 1 - Low 1 - Low 1 - High
Water Quality Data Table - 2015Substances not listed in the following tables were not detected in the treated water supply during the year 2015. The presence of the following analytes in the water does not necessarily indicate that the water poses a health risk.
pRimaRy contaminantS
Contaminant MCLG MCLHIGHEST RESULT AND RANGE OF RESULTS
Typical SourcePVWC NJDWSC JERSEY CITY NEWARK NUTLEY
Turbidity (NTU)
NA TT = 10.53
(0.02 - 0.53)0.28
(0.11 average)0.22
(0.06 - 0.22)0.45
(0.02 - 0.45)NA
Soil runoffNA
TT = percentage of samples <0.03 NTU (min 95% required)
99.97% 100% 100% 97.3% NA
Total Organic Carbon (%) NATT = % removal or
removal ratio
Percent (%) Removal Removal Ratio
NA NA Naturally present in the environment46 - 72(25 - 45 required)
1.0 (RAA)(0.94 - 1.0)
1.25 (Lowest RAA)1.00 - 1.63
micRobiological contaminantS
Contaminant MCLG MCLHIGHEST MONTHLY RESULT
Typical SourcePVWC NJDWSC JERSEY CITY NEWARK NUTLEY
Total Coliform Bacteria (%) 05% of monthly
samples are positive
1 out of 1,933 Total Coliform Positive(November 2015)
1 out of 363 Total Coliform Positive
(July 2015)Naturally present in the environment
inoRganic contaminantS
Contaminant MCLG MCLHIGHEST RESULT AND RANGE OF RESULTS
Typical SourcePVWC NJDWSC JERSEY CITY NEWARK NUTLEY
Arsenic (ppb) 0 5 ND ND ND <0.2 NDErosion of natural deposits; Runoff from orchards;
Runoff from glass and electronic production wastes
Barium (ppm) 2 20.027
(0.16 - 0.027)0.013 0.02 0.00606 ND
Discharge of drilling wastes; Discharge from metal refineries; Erosion of natural deposits
Chromium (ppb) 100 1000.57
(ND - 0.57)ND ND ND ND
Discharge from steel and pulp mills;Erosion of natural deposits
Fluoride (ppm) 4 40.09
(ND - 0.09)ND ND ND 0.066 Erosion of natural deposits
Mercury (ppm) 0.002 0.002 ND ND ND <0.0002 NDErosion of natural deposits;
Discharge from refineries and factories
Nickel (ppm) NA NA1.98
(1.63 - 1.98)ND ND ND ND Erosion of natural deposits
Nitrate (ppm) 10 103.7
(0.89 - 3.7)0.503
0.44(0.16 - 0.44)
<0.5 NDRunoff from fertilizer use, Leaching from septic
tanks, sewage, erosion of natural deposits
Selenium (ppb) 50 500.69
(ND - 0.69)ND ND ND ND
Discharge from petroleum and metal refineries;Erosion of natural deposits; Discharge from mills
SecondaRy contaminantS
Contaminant NJ RULHIGHEST RESULT AND RANGE OF RESULTS
Typical SourcePVWC NJDWSC JERSEY CITY NEWARK NUTLEYResult Achieved Result Achieved Result Achieved Result Achieved Result Achieved
A.B.S./L.A.S. (ppb) 500 ND - 110 Yes 70 Yes ND Yes - - - -
Alkalinity (ppm) NA 45 - 66 NA 41 NA 34 - 64 NA 30.3 NA ND YesA characteristic of water primarily caused by carbonate, bicarbonate,
and hydroxide ions
Aluminum (ppb) 200 11 - 27 Yes 50 Yes ND - 95 Yes 35 Yes ND YesByproduct of water treatment
using aluminum saltsChloride (ppm) 250 124 - 188 Yes 80 Yes 93 - 134 Yes 41.6 Yes ND Yes Erosion of natural deposits
Color (cu) 10 ND Yes 1 Yes 5 - 10 Yes 3 Yes ND YesPresence of manganese and iron, plankton, humus, peat and weeds
Corrosivity Non-Corrosive Non-Corrosive Yes Non-Corrosive Yes - - - - - -Flouride (ppm) 2 ND Yes ND Yes ND Yes 0.066 Yes ND Yes
Hardness [as CaCO3] (ppm) 250 108 - 142 Yes 72 Yes 84 - 113 Yes 57 Yes ND Yes A characteristic of water caused
primarily by salts of calcium and magnesium
Hardness [as CaCO3](grains/gallon)
15 6 - 8 Yes 4 Yes 5 - 7 Yes 3 Yes ND Yes
Iron (ppb) 300 ND Yes 7 Yes ND - 15 Yes 13 Yes <100 Yes
Manganese (ppb) 50 3 - 8 Yes ND YesND - 204
(13 average)Yes 27 Yes 9.1 Yes Sloughing from distribution pipes
Odor (ton) 3 4 - 14 No ND Yes ND - 1C Yes - - ND Yes Algae and plant matter
pH (optimum range)6.5 - 8.5
(optimum average)7.99 - 8.15 Yes 8.34 Yes 6.76 - 7.72 Yes 8.08 Yes ND Yes
Presence of carbonate, bicarbon-ates and carbon dioxide
Sodium (ppm) 50 75 - 281 No* 47 Yes 46 - 79 No* 22.1 Yes ND Yes Natural mineral, road salt
Sulfate (ppm) 250 43 - 89 Yes 11 Yes 12 Yes 11.2 Yes ND YesNaturally present in the environ-
mentTotal Dissolved Solids (ppm) 500 321 - 450 Yes 159 Yes 189 - 344 Yes 127 Yes ND Yes Erosion of natural deposits
Zinc (ppb) 5,000 2 - 5 Yes ND Yes ND - 40 Yes <0.2 Yes ND Yes
SouRce WateR patHogen monitoRing
ContaminantPVWC Source Waters NJDWSC
Source WaterJERSEY CITYSource Water
NEWARKSource Water
NUTLEYSource Water
Typical SourcePassaic River Pompton River
Cryptosporidium (Oocysts/L) 0 - 0.372 0 - 0.78 ND ND ND ND Microbrial pathogens found in surface watersthroughout the United StatesGiardia (Cysts/L) 0 - 0.372 0 - 0.744 0 - 0.1 ND ND ND
Water Quality Chart Definitions • AL: Action Level; the concentration of a contaminant which, if exceeded, triggers
treatment or other requirements which a water system must follow.• CDC: Center for Disease Control• CU: Color Unit• Disinfection Byproduct Precursors: A common source is naturally occurring
organic matter in surface water. Disinfection byproducts are formed when the disinfectants (usually chlorine) used to kill pathogens react with dissolved organic material (for example leaves) present in surface water.
• HAA5: Haloacetic Acids (sum of five compounds)• Inorganic Contaminants: Salts and metals which can be naturally-occurring,
or result from urban storm water runoff, industrial or domestic wastewater dis-charges, oil and gas production, mining, or farming. These contaminants may be present in source water.
• Inorganics: Mineral-based compounds that are both naturally occurring and man-made. Examples include arsenic, asbestos, copper, lead, and nitrate.
• LRAA: Locational running annual average• MCL: Maximum Contaminant Level; the highest level of a contaminant that is
allowed in drinking water. MCLs are set as close to the MCLG as feasible using the best available treatment technology.
• MCLG: Maximum Contaminant Level Goal; the level of a contaminant in drink-ing water. There is convincing evidence that addition of a disinfectant is necessary for control of microbial contaminants.
• Microbial Contaminants/Pathogens: Disease-causing organisms such as bacte-ria and viruses, which may come from sewage treatment plants, septic systems, agricultural livestock operations and wildlife. Common sources are animal and human fecal wastes. These contaminants may be present in source water.
• MPN: Most Probable Number• MRDL: Maximum Residual Disinfectant Level; the highest level of a disinfectant
allowed in drinking water. There is convincing evidence that addition of a disin-fectant is necessary for control of microbial contaminants.
• MRDLG: Maximum Residual Disinfectant Level Goal; the level of a drinking water disinfectant below which there is no known or expected risk to health. (MRDLGs do no reflect the benefits of the use of disinfectants to control micro-bial contamination.)
• NA: Not Applicable• ND: Not Detected
• NJDEP: New Jersey Department of Environmental Protection• NJDWSC: North Jersey District Water Supply Commission• NS: No Standard• NTU: Nephelometric Turbidity Unit• Nutrients: Compounds, minerals and elements that aid growth, that are both
naturally occurring and man-made. Examples include nitrogen and phosphorus.• Organic Contaminants/Volatile Organic Compounds: Compounds includ-
ing synthetic and volatile organic chemicals, which are byproducts of industrial processes and petroleum production and can also come from gas stations, urban stormwater runoff and septic systems. Man-made chemicals used as solvents, degreasers, and gasoline components. Examples include benzene, methyl tertiary butyl ether (MTBE), and vinyl chloride.
• Pesticides (Herbicides, Insecticides, Fungicides, Rodenticides): Man-made chemicals used to control pests, weeds and fungus, which may come froma va-riety of sources such as agriculture, stormwater runoff and residential uses and may be present in source water. Common sources include land application and manufacturing centers of pesticides. Examples include herbicides such as atrazine and insecticides such as chlordane.
• ppb: parts per billion (approximately equal to micrograms per liter)• ppm: parts per million (approximately equal to milligrams per liter)• PWSID: Public Water System Identification• RAA: Running Annual Average• Radioactive Contaminants/Radionuclides: Radioactive substances that are
both naturally occurring and man-made. Examples include radium and uranium.• Radon: Colorless, odorless, cancer-causing gas that occurs naturally in the envi-
ronment.• RUL: Recommended Upper Limit; the highest level of a constituent of drinking
water that is recommended in order to protect aesthetic quality.• RUL Achieved: Yes entry indicates the state reccomended upper limit was not
exceeded. A no entry indicates the state recommended upper limit was exceeded.• TON: Threshold odor number• TTHM: Total Trihalmethanes (sum of four compounds)• TT: Treatment Technique; a required process intended to reduce the level of a
contaminant in drinking water.• Turbidity: A measure of the particulate matter or “cloudiness” of the water. High
turbidity can hinder the effectiveness of disinfectants.
Vulnerable Populations StatementSome people may be more vulnerable to contaminants in drinking water than the general population. Immunocompromised persons such as persons with cancer undergo-ing chemotherapy, persons who have undergone organ transplants, people with HIV/AIDS or other immune system disorders, some elderly, and infants can be particularly at risk from infections. These people should seek advice about drinking water from their health care providers. EPA/CDC guidelines on appropriate means to lessen the risk of infection by Cryptosporidium and other microbial contaminants are available from the Safe Drinking Water Hotline 1-800-426-4791.
CryptosporidiumCryptosporidium is a microbial pathogen found in surface water throughout the United States. Although filtration removes Cryptosporidium, the most commonly-used filtration methods cannot guarantee 100 percent removal. Our monitoring indicates the presence of these organisms in our source water and/or finished water. Current test methods do not allow us to determine if the organisms are dead or if they are capable of causing disease. Ingestion of Cryptosporidium may cause cryptosporidiosis, an abdominal infection. Symptoms of infection include nausea, diarrhea, and abdominal cramps. Most healthy individuals can overcome the disease within a few weeks. However, immuno-compromised people, infants and small children, and the elderly are at greater risk of developing life-threatening illness. We encourage immuno-com-promised individuals to consult their doctor regarding appropriate precautions to take to avoid infection. Cryptosporidium must be ingested to cause disease, and it may be spread through means other than drinking water.
RepoRt commentS•Turbidity has no health effects. However, turbidity can interfere with disinfection and provide a medium
for microbial growth. Turbidity may indicate the presence of disease causing organisms. These organisms include bacteria, viruses, and parasites that can cause symptoms such as nausea, cramps, diarrhea and associated headaches.
•Coliform is bacteria which are naturally present in the environment and are used as an indicator that other potentially harmful bacteria may be present.
•Some people who drink water containing arsenic in excess of the MCL over many years could experience skin damage or problems with their circulatory system and may have an increased risk of getting cancer.
•Some people who drink water containing trihalomethanes in excess of the MCL over many years may experi-ence problems with their liver, kidneys or central nervous sytems and may have an increased risk of cancer.
•We do not add fluoride to your drinking water.•Nitrate in drinking water at levels above 10ppm is a health risk for infants of less than six months of age.
High nitrate levels in drinking water can cause blue baby syndrome. Nitrate levels may rise quickly for short periods of time because of rainfall
•Sulfate is regulated for reason of aesthetic quality only.
HealtH effectS•Sodium: PVWC and Jersey City’s finished water was above NJ’s Secondary Recommended Upper Limit
(RUL) of 50ppm for Sodium in 2015. Possible sources of sodium include roadway salts runoff with a small contribution coming from chemicals used in the treatment process. For healthy individuals, the sodium in-take from water is not important, because a much greater intake of sodium takes place from salt in the diet. However, sodium levels above the recommended upper limit may be a concern to individuals on a sodium restricted diet. If you have any concerns please contact your health care provider.
diSinfection bypRoductS - nutley diStRibution SyStem
Stage 2 Site MCLLocational
RAATypical Source
Haloacetic Acids (HAA5) (ppb)
N-1
80
15.32Byproduct of drinking
water disinfectionN-1A 24.83N-7 37.78N-8 37.30
Total Trihalomethanes (TTHMs) (ppb)
N-1
60
64.33Byproduct of drinking
water disinfectionN-1A 51.78N-7 59.45N-8 64.70
•Stage 2 HAA5 and TTHM compliance is based on the locational running annual average (LRAA) calculated at each monitoring location.
•Monitoring is conducted at four (4) locations throughout the Township of Nutley. This result is the highest locational running annual average in 2015.
lead and coppeR - nutley ReSidential tapS
MCLGAction Level
90th Percentile Typical Source
Copper (ppm) 1.3 1.3 0.091 Corrosion of householdplumbing systemsLead (ppm) 0 15 0.00159
diSinfectant ReSidualS - nutley diStRibution SyStem
Contaminant MRDL MRDLGRunning Annual
AverageTypical Source
Chlorine (ppm) 4.0 4.0 0.976Water additive used to
control microbes.
•Testing completed on August 21, 2014.•Lead and Copper compliance is based on the 90th percentile results. INFANTS AND YOUNG CHILDREN ARE
TYPICALLY MORE VULNERABLE TO LEAD IN DRINKING WATER THAN THE GENERAL POPULATION. INFANTS AND CHILDREN WHO DRINK WATER CONTAINING LEAD IN EXCESS OF THE ACTION.
unRegulated contaminantS foR WHicH epa RequiReS monitoRing
ContaminantLittle Falls WTP Effluent
Average (Range of Results)Chlorate (ppb) 106 (64 - 160)
Chromium, ppb ND (ND - 0.31)
Chromium-6 (ppb) 0.059 (ND - 0.088)
Stontium (ppb) 94 (87 - 100)
Vanadium (ppb) ND (ND - 0.22)
Unregulated contaminants are those for which EPA has not established drinking water standards. The purpose of unregulated contaminant monitoring is to assist the EPA in determining the occurence of unregulated contami-nants in drinking water and whether future regulation is warranted.
additional pVWc tReatment plant monitoRing ReSultS
ContaminantLittle Falls WTP Effluent
Average (Range of Results)Chlorate (ppb) 174 (88 - 373)
Test results presented in this table were collected in 2015 as part of a study to determine the general occurence of chlorate. Currently, there is no drinking water standard for chlorate to compare results to and thus they are presented for informational purposes only. PVWC continues to participate in and support these types of regulatory and research efforts to maintain a positon in leadership in drinking water supply.
tHiRd unRegulated contaminant monitoRing Rule (ucmR3) - nutley
Contaminant Average (Range of Results)Consecutive Connection Max Time in DS
1,1-dichloroethane (ppb) <0.03 (<0.03 - <0.03) ND
1,2,3-trichloropropane (ppb) <0.03 (<0.03 - <0.03) ND
1,3-butadiene (ppb) <0.01 (<0.01 - <0.01) ND
1,4-dioxane (ppb) 0.024 (0.096 - <0.07) ND
Bromochloromethane (ppb) <0.06 (<0.06 - <0.06) ND
Bromomethane (ppb) <0.2 (<0.02 - <0.02) ND
Chlorate (ppb) 145.5 (64 - 200) 144.667 (84 - 180)
Chlorodifluoromethane (ppb) <0.08 (<0.08 - (<0.08) ND
Chloromethane (ppb) <0.2 (<0.2 - <0.2) ND
Chromium (total) (ppb) 0.202 (<0.2 - 0.21) <0.2 (<0.2 - <0.2)
Chromium-6 (ppb) 0.038 (0.032 - 0.047) 0.056 (0.05 - 0.065)
Cobalt (ppb) <1 (<1 - <1) <1 (<1 - <1)
Molybdenum (ppb) <1 (<1 - <1) <1 (<1 - <1)
Perfluorobutane Sulfonic Acid (ppb) <0.09 (<0.09 - <0.09) ND
Perfluoroheptanoic Acid (ppb) <0.01 (<0.01 - <0.01) ND
Perfluorohexane Sulfonic Acid (ppb) <0.03 (<0.03 - <0.03) ND
Perfluorononanoic Acid (ppb) <0.02 (<0.02 - <0.02) ND
Perfluorooctane Sulfonic Acid (ppb) <0.04 (<0.04 - <0.04) ND
Perfluorooctanoic Acid (ppb) <0.02 (<0.02 - <0.02) ND
Strontium (ppb) 105 (88 - 130) 126.667 (110 - 160)
Vanadium (ppb) <0.02 (<0.02 - <0.02) 0.933 (<0.2 - 2.4)
Our water system has sampled for a series of unregulated contaminants. Unregulated contaminants are those that don’t yet have a drinking water standard set by EPA. The purpose of monitoring for these contaminants is to help EPA decide whether the contaminants should have a standard.
impoRtant infoRmation about youR dRinking WateRAvailability of Monitoring Data for Unregulated Contaminants
for the Nutley Water Department
Our water system has sampled for a series of unregulated contaminants. Unregulated contaminants are those that don’t yet have a drinking water standard set by EPA.
The purpose of monitoring for these contaminants is to help EPA decide whether the contaminants should have a standard. As our customers, you have a right to know that these data are available.
If you are interested in examining the results, please contact Mr. Dominic Ferry,Licensed Water and Sewer Operator at (973) 284-4984 or [email protected].
This notice is being sent to you by the Nutley Water Department.
State Water System ID#: NJ 0716001Date Distributed: July 1, 2016
About the Nutley Water Department and the Sources ofYour Drinking WaterThe Nutley Water Department is a division within the Department of Public Works, and operates solely on revenues received for the services rendered. This means tax dollars are not necessary for this utility to function under normal conditions.
Nutley receives the majority of its potable water from the Passaic Valley Water Com-mission (PVWC). Its main facility is the Little Falls Water Treatment Plant in Totowa, NJ. Water is diverted from the Passaic and Pompton Rivers, is treated, filtered and disinfected at the plant. In drought conditions or other emergency, water from the Point View Reservoir in Wayne, NJ can be used to supplement river sources. Treated water is then mixed at PVWC’s main pumping station with treated water from the North Jersey District Water Supply Commission’s Wanaque Reservoir treatment plant. Water is then pumped into underground transmission lines running through Nutley. Nutley has four (4) intake pit areas along this transmission line located at:
CoeymanAvenue•RidgeRoad•CentreStreet•MeachamAvenue
At these intakes, the water goes into our distribution system. The water is then con-veyed into all homes or businesses connected to the system.
The City of Newark serves a small area of Nutley with Pequannock Reservoir Water. This area is located west of Ridge Road and Van Winkle Avenue and bordered by Glenview Road, the Township of Nutley/Bloomfield boundary line and East Passaic Avenue.
The Nutley Water Department is a public community water system and purchases water from the following water systems:
• Passaic Valley Water Commission - PWSID # NJ1605002• North Jersey District Water Supply Commission - Wanaque North System -
PWSID # NJ1613001• Jersey City Municipal Utilities Authority - PWSID # NJ090600• Newark Water Department - PWSID # NJ0714001
Monitoring and Testing of Drinking WaterThe Nutley Water Department routinely monitors for contaminants in your drinking water according to federal and state laws. This report covers the period from January 1, 2015 thru December 31, 2015. As water travels over the land or underground, it can pick up substances or contaminants such as microbes, inorganic and organic chemicals, and radioactive substances. All drinking water including bottled drinking water may be reasonably expected to contain at least small amounts of some constitu-ents. It is very important to remember that the presence of these contaminants does not necessarily pose a health risk.
For the year 2015, Passaic Valley Water Commission (PVWC) did all the required testing of our water supply. The Township of Nutley in 2014 sampled and tested water throughout the township for:
• Chlorine Residuals• Coliforms• Haloacetic Acids • Iron and Manganese• Lead and Copper (tested on August 21, 2014)• Radionuclides (tested by the State in 2001)• Trihalomethanes
2015 Water Quality Report Nutley Water Department
For Additional InformationIf you have any questions about this report or concerning the Nutley Water De-partment, please kindly contact Mr. Dominic Ferry, Licensed Water and Sewer Operator at (973) 284-4984 or [email protected].
Public InputThe Board of Commissioners of the Township of Nutley meet on the first and third Tuesday of every month. For dates and times of these meetings, please call the offices of the Department of Public Works at (973) 284-4959 or log on to the Township of Nutley’s website at www.nutleynj.org.
Health and Educational InformationDrinking water, including bottled water, may reasonably be expected to contain at least small amounts of some contaminants. The presence of contaminants does not necessarily indicate that water poses a health risk. More information about contami-nants and potential health effects can be obtained by calling the Environmental Pro-tection Agency’s (EPA) Safe Drinking Water Hotline 1-800-426-4791.
The sources of drinking water (both tap water and bottled water) include rivers, lakes, streams, ponds, reservoirs, springs, and wells. As water travels over the surface of the land or through the ground, it dissolves naturally occurring minerals and, in some cases, radioactive material, and can pick up substances resulting from the presence of animals or from human activity.
Contaminants that may be present in source water include:• Microbial contaminants, such as viruses and bacteria that may come from
sewage treatment plants, septic systems, agricultural livestock operations, and wildlife.
• Inorganic contaminants, such as salts and metals, which can be naturally oc-curring or result from urban stormwater runoff, industrial, or domestic waste-water discharges, oil and gas production, mining, or farming.
• Pesticides and herbicides, which may come from a variety of sources such as agriculture, urban stormwater runoff, and residential uses.
• Organic chemical contaminants, including synthetic and volatile organic chemicals, which are by-products of industrial processes and petroleum pro-duction, and can also come from gas stations, urban stormwater runoff, and septic systems.
• Radioactive contaminants, which can be naturally occurring or be the result of oil and gas production and mining activities.
In order to insure that tap water is safe to drink, EPA prescribes regulations which limit the amount of certain contaminants in water provided by public water systems. Food and Drug Administration (FDA) regulations establish limits for contaminants in bottled water, which must provide the same protection for public health.
The standards for these contaminants are known as Maximum Contaminant Levels (MCL’s) that are set at very stringent levels. To understand the possible health effects described for many regulated constituents, a person would have to drink 2 liters of water every day at the MCL level for a lifetime to have a one-in-a-million chance of having the described health effect.
Special Considerations Regarding Children, Pregnant Women, NursingMothers, and OthersChildren may receive a slightly higher amount of a contaminant present in the water than do adults, on a body weight basis, because they may drink a greater amount of water per pound of body weight than do adults. For this reason, repro-ductive or developmental effects are used for calculating a drinking water standard, if these effects occur at lower levels than other health effects of concern. If there is insufficient toxicity information for a chemical (for example, lack of data on repro-ductive or developmental effects), an extra uncertainty factor may be incorporated into the calculation of the drinking water standard, thus making the standard more stringent, to account for additional uncertainties regarding these effects. In the cases of lead and nitrate, effects on infants and children are the health endpoints upon which the standards are based.
Additional Information on LeadIf present, elevated levels of lead can cause serious health problems, especially for pregnant women and young children. Lead in drinking water is primarily from materials and components associated with service lines and home plumbing. The Nutley Water Department is responsible for providing high quality drinking water, but cannot control the variety of materials used in plumbing components. When your water has been sitting for several hours, you can minimize the potential for lead exposure by flushing your tap for 30 seconds to two minutes before using water for drinking or cooking. If you are concerned about lead in your water, you may wish to have your water tested. Information on lead in drinking water, testing methods, and steps you can take to minimize exposure is available from the Safe Drinking Water Hotline or at www.epa.gov/safewater/lead.
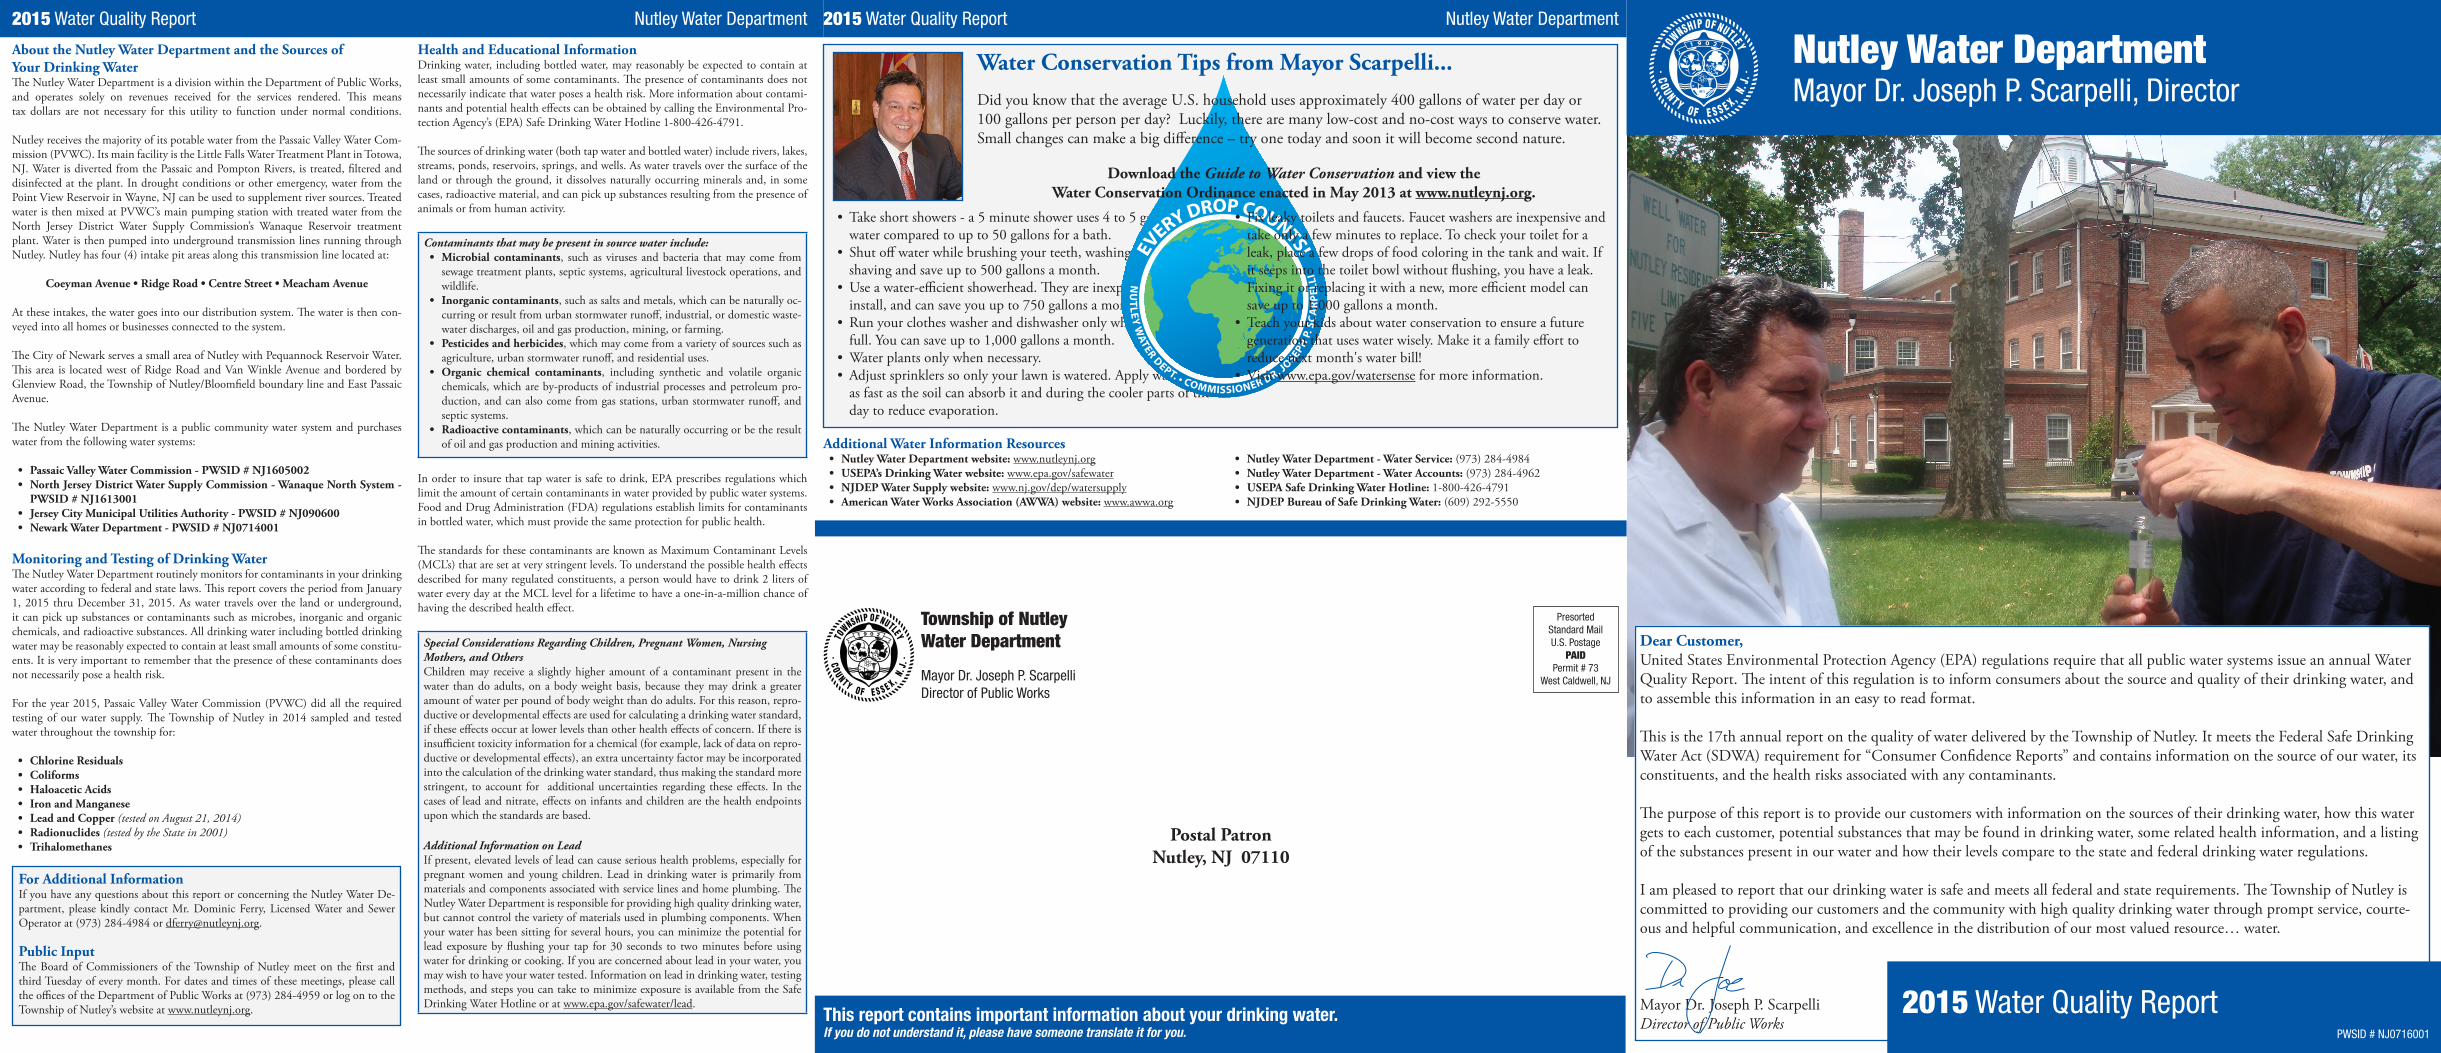
nutley Water departmentMayor Dr. Joseph P. Scarpelli, Director
PresortedStandard MailU.S. Postage
paidPermit # 73
West Caldwell, NJ
Postal PatronNutley, NJ 07110
2015 Water Quality Report Nutley Water Department
Dear Customer,United States Environmental Protection Agency (EPA) regulations require that all public water systems issue an annual Water Quality Report. The intent of this regulation is to inform consumers about the source and quality of their drinking water, and to assemble this information in an easy to read format.
This is the 17th annual report on the quality of water delivered by the Township of Nutley. It meets the Federal Safe Drinking Water Act (SDWA) requirement for “Consumer Confidence Reports” and contains information on the source of our water, its constituents, and the health risks associated with any contaminants.
The purpose of this report is to provide our customers with information on the sources of their drinking water, how this water gets to each customer, potential substances that may be found in drinking water, some related health information, and a listing of the substances present in our water and how their levels compare to the state and federal drinking water regulations.
I am pleased to report that our drinking water is safe and meets all federal and state requirements. The Township of Nutley is committed to providing our customers and the community with high quality drinking water through prompt service, courte-ous and helpful communication, and excellence in the distribution of our most valued resource… water.
Mayor Dr. Joseph P. ScarpelliDirector of Public Works
•Take short showers - a 5 minute shower uses 4 to 5 gallons of water compared to up to 50 gallons for a bath.
• Shut off water while brushing your teeth, washing your hair and shaving and save up to 500 gallons a month.
•Use a water-efficient showerhead. They are inexpensive, easy to install, and can save you up to 750 gallons a month.
•Run your clothes washer and dishwasher only when they are full. You can save up to 1,000 gallons a month.
•Water plants only when necessary.•Adjust sprinklers so only your lawn is watered. Apply water only
as fast as the soil can absorb it and during the cooler parts of the day to reduce evaporation.
This report contains important information about your drinking water.If you do not understand it, please have someone translate it for you.
2015 Water Quality ReportPWSID # NJ0716001
Additional Water Information Resources• Nutley Water Department website: www.nutleynj.org• USEPA’s Drinking Water website: www.epa.gov/safewater• NJDEP Water Supply website: www.nj.gov/dep/watersupply• American Water Works Association (AWWA) website: www.awwa.org
• Nutley Water Department - Water Service: (973) 284-4984• Nutley Water Department - Water Accounts: (973) 284-4962• USEPA Safe Drinking Water Hotline: 1-800-426-4791• NJDEP Bureau of Safe Drinking Water: (609) 292-5550
Mayor Dr. Joseph P. ScarpelliDirector of Public Works
Township of NutleyWater Department
• Fix leaky toilets and faucets. Faucet washers are inexpensive and take only a few minutes to replace. To check your toilet for a leak, place a few drops of food coloring in the tank and wait. If it seeps into the toilet bowl without flushing, you have a leak. Fixing it or replacing it with a new, more efficient model can save up to 1,000 gallons a month.
•Teach your kids about water conservation to ensure a future generation that uses water wisely. Make it a family effort to reduce next month's water bill!
•Visit www.epa.gov/watersense for more information.
Water Conservation Tips from Mayor Scarpelli...Did you know that the average U.S. household uses approximately 400 gallons of water per day or 100 gallons per person per day? Luckily, there are many low-cost and no-cost ways to conserve water. Small changes can make a big difference – try one today and soon it will become second nature.
Download the Guide to Water Conservation and view theWater Conservation Ordinance enacted in May 2013 at www.nutleynj.org.