water quality report · some people with hard water opt to buy a water softener for aesthetic...
TRANSCRIPT

™
Quality. Service. Value.®Este informe contiene información muy importante sobre su agua potable. Tradúzcalo o hable con alguien que lo entienda bien.
2018Water Quality Report
Los ALtos suburbAn

LAS
2 Quality. Service. Value.®LAS
WELCoME
From the Manager
Your WAtEr sYstEM
Your Water SystemInside the Water Quality LaboratoryDWSAPP
2018 tEst rEsuLts
FluorideWater HardnessPossible ContaminantsAbout LeadKey DefinitionsWater Quality Table
MorE InForMAtIon
Resources
Table of Contents
TABLE OF CONTENTS WELCOME YOUR WATER 2018 RESULTS MORE INFO

LAS
3 Quality. Service. Value.®LAS
Since 1931, California Water Service (Cal Water) has been committed to
providing quality, service, and value to our customers. Our highest priority is to
deliver a reliable supply of water that meets all federal and state water quality
standards, any and every time you turn on the tap. This means you don’t have
to wonder whether your water is safe to use and drink; we’re dedicated to
making sure it is.
In 2018, we conducted 428,037 tests on 66,551 water samples for 318
constituents. We are pleased to confirm that we met every primary and
secondary state and federal water quality standard last year.
Ensuring that high-quality water is always available to you means maintaining
and upgrading the infrastructure needed to move water from the source to your
tap, and having expert professionals to assist you with both routine service
needs and after-hours emergencies. Although the costs to obtain, treat, test,
store, and deliver safe water continue to increase across the country, we work
hard to operate efficiently to keep your water affordable — less than a penny
per gallon in almost all of our service areas.
This annual water quality report details any constituents detected in your water
supply in 2018 and shows how your water compares to federal and state water
quality standards. It also highlights other current water quality issues and steps
we take to protect your health and safety.
If you have any questions, you can contact us by phone, online at
www.calwater.com, or in person at our local Customer Center. For important
water service announcements, please visit our web site or watch for information
in your monthly bill, and be sure your contact information is up to date by
visiting ccu.calwater.com.
Sincerely,
Ron Richardson, District Manager, Los Altos Suburban District
[Los Altos Suburban District 949 “B” Street Los Altos, CA 94024 (650) 917-0152]
Welcome
TABLE OF CONTENTS WELCOME YOUR WATER 2018 RESULTS MORE INFO

LAS
4 Quality. Service. Value.®LAS
USING WATER WISELY
As we await more information on the long-term water-use regulations from the State of California, it’s important that we make water-use efficiency a way of life. Using water wisely will ensure that we have enough water in dry years and for generations to come.
Cal Water has a robust water conservation program that includes rebates, kits, and other tools to help our customers save water. Visit www.calwater.com/conservation for details.
Cal Water has provided high-quality water utility services in the Los Altos area since 1931. To meet the needs of our customers in Los Altos and parts of Los Altos Hills, Cupertino, Mountain View, and Sunnyvale, we use a combination of local groundwater and purchased water. Our purchased water, which is treated surface water from the Santa Clara Valley Water District (SCVWD), comes from SCVWD reservoirs and the San Joaquin-Sacramento River Delta.
Our water system includes 297 miles of main, 65 booster pumps, and 46 storage tanks.
Cal Water’s company-wide water quality assurance program includes vigilant monitoring throughout our systems and testing at our state-of-the-art laboratory. Additionally, we proactively maintain and upgrade our facilities to ensure a reliable, high-quality supply.
Your Water System
If you have any questions, suggestions, or concerns, please contact our local Customer Center, either by phone at (650) 917-0152 or through the Contact Us link at www.calwater.com.
TABLE OF CONTENTS WELCOME YOUR WATER 2018 RESULTS MORE INFO

SAMPLED YEAR
53,795 57,312 63,267 66,809 64,618 61,081 62,219 62,325 64,870 66,408 62,271 61,528 62,009 66,551NUMBER OF SAMPLES COLLECTED EACH YEAR
2005 2006 2007 2008 2009 2010 2011 2012 2013 2014 2015 2016 2017 2018
CROSS-CONNECTION CONTROL
To ensure that the high-quality water we deliver is not compromised in the distribution system, Cal Water has a robust cross-connection control program in place. Cross-connection control is critical to ensuring that activities on customers’ properties do not affect the public water supply. Our cross-connection control specialists ensure that all of the existing backflow prevention assemblies are tested annually, assess all non-residential connections, and enforce and manage the installation of new commercial and residential assemblies. Last year, our specialists oversaw installation of 2,243 new assemblies and testing of 39,358 backflow prevention assemblies company-wide.
Our customers are our first line of defense in preventing water system contamination through backflow. A minor home improvement project can create a potentially hazardous situation, so careful adherence to plumbing codes and
standards will ensure the community’s water supply remains safe. Please be sure to utilize the advice or services of a qualified plumbing professional.
Many water use activities involve substances that, if allowed to enter the distribution system, would be aesthetically displeasing or could present health concerns. Some of the most common cross-connections are:
• Garden hoses connected to a hose bib without a simple hose-type vacuum breaker (available at a home improvement store)
• Improperly installed toilet tank fill valves that do not have the required air gap between the valve or refill tube
• Landscape irrigation systems that do not have the proper backflow prevention assembly installed on the supply line
LAS
5 Quality. Service. Value.®LAS
Water professionals collect samples from throughout the water system for testing at our state-of-the-art water quality laboratory, which is certified through the stringent Environmental Laboratory Accreditation Program (ELAP). Scientists, chemists, and microbiologists test the water for 318 constituents with equipment so sensitive it can detect levels as low as one part per trillion. In order to maintain the ELAP certification, all of our scientists must pass blind-study proficiency tests each year for every water quality test performed. Water quality test results are entered into our Laboratory Information Management System (LIMS), a sophisticated software program that enables us to react quickly to changes in water quality and analyze water quality trends in order to plan effectively for future needs.
WATER QUALITY LABORATORYTABLE OF CONTENTS WELCOME YOUR WATER 2018 RESULTS MORE INFO

LAS
6 Quality. Service. Value.®LAS
By the end of 2002, Cal Water had submitted to the Division of Drinking Water (DDW) a Drinking Water Source Assessment and Protection Program (DWSAPP) report for each water source in the water system. The DWSAPP report identifies possible sources of contamination to aid in prioritizing cleanup and pollution prevention efforts.
The water sources in your district are considered most vulnerable to the following activities, for which no associated contaminant has been detected:
• Sewer collection systems• Gas stations• Dry cleaners• Underground storage tanks
(confirmed leaking tanks)
• Chemical/petroleum pipelines• Electrical/electronic manufacturing• Research laboratories• Agricultural drainage• Wells (agricultural)
SCVWD provides treated surface water to the Silicon Valley from three water treatment plants. SCVWD surface water is mainly imported from the South Bay Aqueduct, Lake Del Valle, and San Luis Reservoir, which all draw water from the Sacramento-San Joaquin Delta watershed. SCVWD’s local water sources include Anderson and Calero Reservoirs.
DWSAPP
SCVWD’s source waters are vulnerable to potential contamination from a variety of land-use practices, such as:
• Agricultural and urban runoff• Recreational activities• Livestock grazing
• Residential and industrial development
The imported sources are also vulnerable to:
• Wastewater treatment plant discharges
• Seawater intrusion• Wildland fires in open space areas
In addition, local sources are vulnerable to potential contamination from:
• Commercial stables • Historic mining practices
No contaminant associated with any of these activities has been detected in SCVWD or Los Altos treated water. The water treatment plants provide multiple barriers for physical removal and disinfection of contaminants. For additional information, visit the SCVWD web site at www.valleywater.org.
We encourage customers to join us in our efforts to prevent water pollution and protect our most precious natural resource.
TABLE OF CONTENTS WELCOME YOUR WATER 2018 RESULTS MORE INFO

2005
: 253
2006
: 261
2007
: 258
2008
: 270
2009
: 264
2010
: 264
2011
: 260
2012
: 278
2013
: 280
2014
: 271
2015
: 269
2016
: 326
2017
: 293
2018
: 318
NUMBER OF CONSTITUENTS TESTED ANNUALLY SINCE 2005
SAMPLED YEAR PARAMETER COUNT
LAS
7 Quality. Service. Value.®LAS
State law requires Cal Water to add fluoride to drinking water if public funding is available to pay for it, and it is a practice endorsed by the American Medical Association and the American Dental Association to prevent tooth decay. In this area, low levels of fluoride occur naturally, and Cal Water doesn’t add any to the water supply. Show the table in this report to your dentist to see if he or she recommends giving your children fluoride supplements.
More information about fluoridation, oral health, and related issues can be found on the DDW web site at www.waterboards.ca.gov/drinking_water/certlic/drinkingwater/Fluoridation.html. For general information on water fluoridation, visit us online at www.calwater.com.
2018 Results
FLUORIDE
TABLE OF CONTENTS WELCOME YOUR WATER 2018 RESULTS MORE INFO
LAS
8 Quality. Service. Value.®LAS
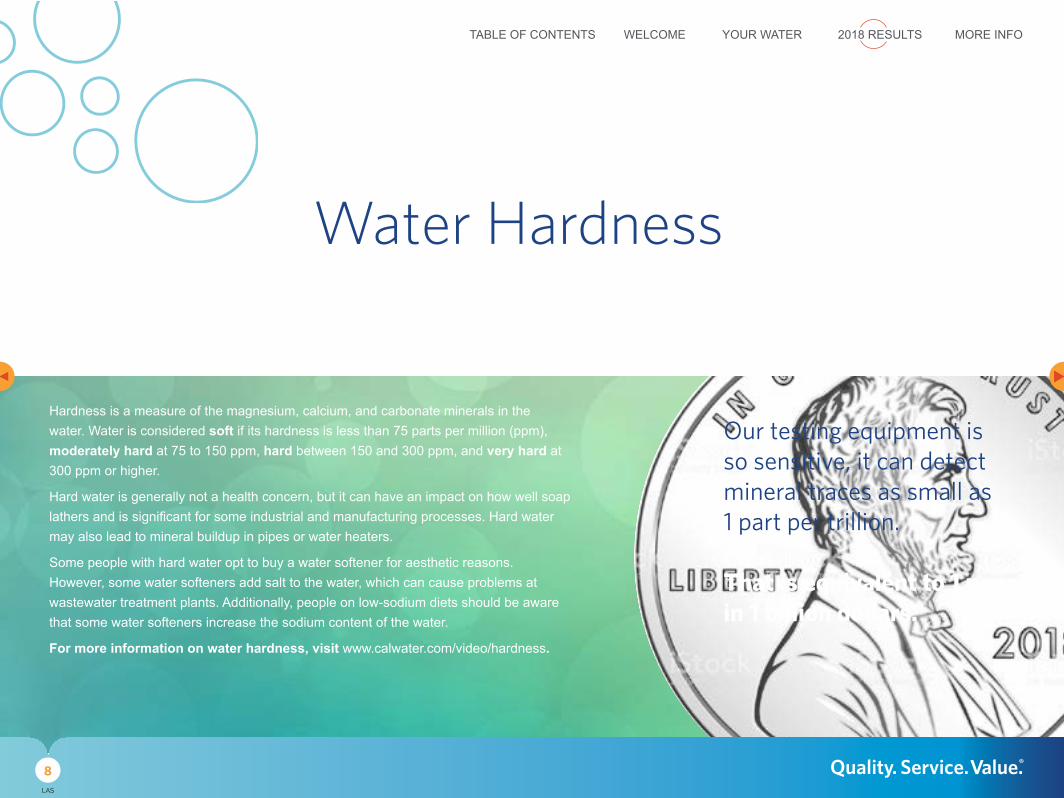
Hardness is a measure of the magnesium, calcium, and carbonate minerals in the water. Water is considered soft if its hardness is less than 75 parts per million (ppm), moderately hard at 75 to 150 ppm, hard between 150 and 300 ppm, and very hard at 300 ppm or higher.
Hard water is generally not a health concern, but it can have an impact on how well soap lathers and is significant for some industrial and manufacturing processes. Hard water may also lead to mineral buildup in pipes or water heaters.
Some people with hard water opt to buy a water softener for aesthetic reasons. However, some water softeners add salt to the water, which can cause problems at wastewater treatment plants. Additionally, people on low-sodium diets should be aware that some water softeners increase the sodium content of the water.
For more information on water hardness, visit www.calwater.com/video/hardness.
Our testing equipment is so sensitive, it can detect mineral traces as small as 1 part per trillion.
That is equivalent to 1 penny in 1 billion dollars.
Water Hardness
TABLE OF CONTENTS WELCOME YOUR WATER 2018 RESULTS MORE INFO

LAS
9 Quality. Service. Value.®LAS
All drinking water, including bottled water, may reasonably be expected to contain at least small amounts of some contaminants. The presence of contaminants does not necessarily indicate that water poses a health risk.
More information about contaminants and potential health effects can be obtained by calling the United States Environmental Protection Agency (EPA) Safe Drinking Water Hotline at (800) 426-4791.
The sources of drinking water (both tap and bottled) include rivers, lakes, streams, ponds, reservoirs, springs, and wells. As water travels over the surface of the land or through the ground, it dissolves naturally occurring minerals and, in some cases, radioactive material, and can pick up substances resulting from the presence of animals or human activity.
CONTAMINANTS THAT MAY BE PRESENT IN SOURCE WATER INCLUDE:
Microbial contaminants, such as viruses and bacteria, which may come from sewage treatment plants, septic systems, agricultural livestock operations, and wildlife.
Inorganic contaminants, such as salts and metals, which can be naturally occurring or result from urban stormwater runoff, industrial or domestic wastewater discharges, oil and gas production, mining, or farming.
Pesticides and herbicides, which may come from a variety of sources such as agriculture, urban stormwater runoff, and residential uses.
Organic chemical contaminants, including synthetic and volatile organic chemicals, which are byproducts of industrial processes and petroleum production, and can also come from gas stations, urban stormwater runoff, agricultural application, and septic systems.
Radioactive contaminants, which can be naturally occurring or the result of oil and gas production and mining activities.
In order to ensure that tap water is safe to drink, the EPA and DDW prescribe regulations that limit the amount of certain contaminants in water provided by public water systems. FDA regulations establish limits for contaminants in bottled water, which must provide the same protection for public health.
Some people may be more vulnerable to contaminants in drinking water than the general population. Immunocompromised people, such as those with cancer undergoing chemotherapy, those who have undergone organ transplants, and those with HIV/AIDS or other immune system disorders; some elderly people; and infants can be particularly at risk from infections. These people should seek advice from their health care providers about drinking water. EPA and Centers for Disease Control and Prevention (CDC) guidelines on appropriate means to lessen the risk of infection by cryptosporidium and other microbial contaminants are available from the Safe Drinking Water Hotline.
Possible ContaminantsTABLE OF CONTENTS WELCOME YOUR WATER 2018 RESULTS MORE INFO

LAS
10 Quality. Service. Value.®LAS
TESTING FOR LEAD IN SCHOOLS
The State of California now requires that all public schools built before 2010 test for lead in their drinking water by July 1, 2019. We are committed to supporting our school districts’ efforts to protect students and ensure that the drinking water at their school sites are below lead limits. We have been working with school districts serving kindergarten through 12th grade to develop sampling plans, test samples, and conduct follow-up monitoring for corrective actions. We have published a summary of local school lead testing from the last year in this year’s Water Quality report. For more information, please see our Testing for Lead in Schools web page.
As the issue of lead in water continues to be top of mind for many Americans, Cal Water wants to assure you about the quality of your water. We are compliant with health and safety codes mandating use of lead-free materials in water system replacements, repairs, and new installations. We have no known lead service lines in our systems. We test and treat (if necessary) water sources to ensure that the water delivered to customer meters meets all water quality standards and is not corrosive toward plumbing materials.
The water we deliver to your home meets lead standards, but what about your home’s plumbing? In California, lead in drinking water comes primarily from materials and components used for in-home plumbing (for example, lead solder used to join copper plumbing, and brass and other lead-containing fixtures).
The lead and copper rule requires us to test water inside a representative number of homes that have plumbing most likely to contain lead and/or lead solder to determine the presence of lead and copper or an action level exceedance (AL). An action level is the concentration of a contaminant which, when exceeded, triggers corrective actions before it becomes a health concern. If action levels are exceeded, either at a customer’s home or system-wide, we work with the customer to investigate the issue and/or implement corrosion control treatment to reduce lead levels.
If present, elevated levels of lead can cause serious health problems, especially for pregnant women and young children. Lead in drinking water is primarily from materials and components associated with service lines and home plumbing. Cal Water is responsible for providing high-quality drinking water to our customers’ meters, but cannot control the variety of materials used in plumbing components. When your water has been sitting for several hours, you can minimize the potential for lead exposure by flushing your tap for 30 seconds to 2 minutes before using water for drinking or cooking.
If you are concerned about lead in your water, you may wish to have your water tested by a lab. More information about lead in drinking water can be found on the Safe Drinking Water Hotline or at www.epa.gov/safewater/lead.
In your system, results from our lead monitoring program, conducted in accordance with the Lead and Copper Rule, were below the action level for the presence of lead.
About LeadTABLE OF CONTENTS WELCOME YOUR WATER 2018 RESULTS MORE INFO

LAS
11 Quality. Service. Value.®LAS
MAXIMUM CONTAMINANT LEVEL (MCL)The highest level of a contaminant that is allowed in drinking water. Primary MCLs protect public health and are set as close to the PHGs (or MCLGs) as are economically and technologically feasible. Secondary MCLs (SMCLs) relate to the odor, taste, and appearance of drinking water.
IN COMPLIANCEDoes not exceed any applicable primary MCL, secondary MCL, or action level, as determined by DDW. For some compounds, compliance is determined by averaging the results for one source over a one-year period.
REGULATORY ACTION LEVEL (AL)The concentration of a contaminant which, if exceeded, triggers treatment or other required action by the water provider.
MAXIMUM CONTAMINANT LEVEL GOAL (MCLG)The level of a contaminant in drinking water below which there is no known or expected risk to health. MCLGs are set by the EPA.
MAXIMUM RESIDUAL DISINFECTANT LEVEL (MRDL)The highest level of a disinfectant allowed in drinking water. There is convincing evidence that addition of a disinfectant is necessary for control of microbial contaminants.
MAXIMUM RESIDUAL DISINFECTANT LEVEL GOAL (MRDLG)The level of a drinking water disinfectant below which there is no known or expected risk to health. MRDLGs do not reflect the benefits of the use of disinfectants to control microbial contaminants.
NOTIFICATION LEVEL (NL)A health-based advisory level for an unregulated contaminant in drinking water. It is used by DDW to provide guidance to drinking water systems.
PRIMARY DRINKING WATER STANDARD (PDWS)MCLs and MRDLs for contaminants that affect health, along with their monitoring, reporting, and water treatment requirements.
PUBLIC HEALTH GOAL (PHG)The level of a contaminant in drinking water below which there is no known or expected risk to health. PHGs are set by the California Environmental Protection Agency’s Office of Environmental Health Hazard Assessment without regard to cost or available detection and treatment technologies.
TREATMENT TECHNIQUE (TT)A required process intended to reduce the level of a contaminant in drinking water.
Key DefinitionsTABLE OF CONTENTS WELCOME YOUR WATER 2018 RESULTS MORE INFO
CAL WATER TESTS YOUR WATER FOR MORE THAN 140 REGULATED CONTAMINANTS AND DOZENS OF UNREGULATED CONTAMINANTS. THIS TABLE LISTS ONLY THOSE CONTAMINANTS THAT WERE DETECTED.In the table, water quality test results are divided into four major sections: “Primary Drinking Water Standards,” “Secondary Drinking Water Standards,” “State Regulated Contaminants with Notification Levels,” and “Unregulated Compounds.” Primary standards protect public health by limiting the levels of certain constituents in drinking water. Secondary standards are set for substances that don’t impact health but could affect the water’s taste, odor, or appearance. Some unregulated substances (hardness and sodium, for example) are included for your information. The State allows us to monitor for some contaminants less than once per year because the concentrations of these contaminants do not change frequently. Some of our data, though representative, are more than one year old.
SUBSTANCE SOURCESDI Byproduct of drinking water disinfectionDK Decay of natural and manmade depositsDS Drinking water disinfectant added for treatmentEF Discharge from electroplating factories, leather
tanneries, wood preservation, chemical synthesis, refractory production, and textile manufacturing facilities
EN Naturally present in the environmentER Erosion of natural depositsFL Water additive that promotes strong teeth;
discharge from fertilizer and aluminum factoriesFR Runoff and leaching from fertilizer use; leaching
from septic tanks and sewageIC Internal corrosion of household plumbing systemsIM Discharge from industrial manufacturersIN Runoff/leaching from insecticide used on cotton
and cattleIO Substances that form ions when in waterIW Industrial wasteMF Discharge from metal factories
OM Naturally occurring organic materialsPG Discharge from petroleum, glass, and metal
refineries; discharge from mines and chemical manufacturers; runoff from livestock lots (feed additive)
PH Inherent characteristic of waterPR Inorganic chemical used in solid rocket
propellant, fireworks, explosives, flares, matches, and a variety of industries; usually gets into drinking water as a result of environmental contamination from historic aerospace or other industrial operations that used or use, store, or dispose of perchlorate and its salts
PT Discharge from petroleum refineriesRL Runoff/leaching from natural depositsSO Soil runoffSW Seawater influenceVA Various natural and manmade sourcesWD Leaching from wood preservatives
UR Unregulated constituents with no source listed and that do not have standardized “source of substance” language
LAS
12 Quality. Service. Value.®LAS
Table IntroductionTABLE OF CONTENTS WELCOME YOUR WATER 2018 RESULTS MORE INFO

LAS
13 Quality. Service. Value.®LAS
2018 Water QualityPrimary Drinking Water Standards Groundwater SCVWD Supply1
Microbiological Year Tested Unit MCL PHG (MCLG) In Compliance Highest Monthly Highest Monthly Source
Total coliform (systems with >40 samples/month) (total coliform rule)
2018 positive samples
5% (0) Yes 0 n/a EN
Radiological Year Tested Unit MCL PHG (MCLG) In Compliance Range Average Range Average Source
Gross alpha particle activity 2010–2018 pCi/L 15 (0) Yes ND–10 1.28 n/a n/a ER
Inorganic Chemicals Year Tested Unit MCL PHG (MCLG) In Compliance Range Average Range Average Source
Antimony 2016–2018 ppb 6 1 Yes ND–2 0.12 n/a n/a PT, FI
Fluoride 2016–2018 ppm 2 1 Yes ND–0.19 0.11 n/a n/a ER, FL
Nickel 2016–2018 ppb 100 12 Yes ND–10 0.54 n/a n/a ER, MF
Nitrate (as nitrogen)2 2018 ppm 10 10 Yes 1.51–8.58 5.74 ND–0.7 ND ER, FR
Perchlorate 2016–2018 ppb 6 1 Yes ND–2.6 0.15 n/a n/a PR
Selenium 2016–2018 ppb 50 30 Yes ND–5.04 1.04 n/a n/a ER, PG
Lead and Copper Year Tested Unit AL PHG (MCLG) In Compliance
Distribution System-Wide
Source90th Percentile Samples > AL
Copper 2016 ppm 1.3 0.3 Yes 0.2 0 of 30 IC, ER, WD
Lead 2016 ppb 15 0.2 Yes ND 0 of 30 IC, ER, IM
Schools that requested lead sampling in 2018: 16
1Santa Clara Valley Water District (SCVWD) supply data reported is from 2018. The years prior to 2018 reflect Cal Water data. Water from SCVWD delivered to our system between January and March 2018 may have been from SFPUC via the SFPUC-SCVWD intertie. To see the water quality data during this time period for purchased surface water, go to sfwater.org/index.aspx?page=634.
2The average nitrate level was 5.74 ppm, with a maximum level of 8.58 ppm. We are closely monitoring the nitrate levels. Nitrate in drinking water at levels above 10 ppm is a health risk for infants of less than six months of age. Such nitrate levels in drinking water can interfere with the capacity of the infant’s blood to carry oxygen, resulting in a serious illness; symptoms include shortness of breath and blueness of the skin. Nitrate levels above 10 ppm may also affect the ability of blood to carry oxygen in other individuals, such as pregnant women and those with certain specific enzyme deficiencies. If you are caring for an infant or you are pregnant, you should seek advice from your health care provider.
TABLE OF CONTENTS WELCOME YOUR WATER 2018 RESULTS MORE INFO

LAS
14 Quality. Service. Value.®LAS
2018 Water Quality(Continued)
Disinfection Byproducts Year Tested Unit MCL PHG (MCLG) In Compliance
Distribution System-Wide
SourceRange Highest Annual Average
Haloacetic acids3 2018 ppb 60 n/a Yes ND–64 19.8 DI
Total trihalomethanes 2018 ppb 80 n/a Yes ND–47.3 45.8 DI
Disinfectants Year Tested Unit MRDL MRDLG In Compliance
Distribution System-Wide
SourceRange Average
Chloramine 2018 ppm 4 4 Yes ND–2.88 1.47 DS
Surface Water—Turbidity and TOC Year Tested Unit MCL PHG (MCLG) In Compliance
Surface Water Only
SourceHighest
Level
Lowest Monthly Percent
Highest Level
Lowest Monthly Percent
Turbidity (surface water requiring filtration)4 2018 NTU TT n/a Yes n/a n/a 0.24 0 SO
Total organic carbon (TOC)5 2018 ppm TT n/a Yes n/a n/a 1.9 1.3 VA
3While your drinking water contained varying levels of HAAs it meets the standard. Compliance with the HAA5 MCL is determined by the locational running annual average (LRAA) of samples collected at each sampling location, each quarter of 2018. Some people who drink water containing HAA5 in excess of the MCL over many years may have an increased risk of getting cancer. We are continuously monitoring the levels to ensure we do not exceed the MCL.
4The turbidity standard for unfiltered supplies is 5 NTU. Turbidity is a measure of the cloudiness of water. We monitor it because it is a good indicator of water quality. High turbidity can hinder the effectiveness of disinfectants.
5TOC has no health effects; however, TOC provides a medium for the formation of disinfection byproducts. These byproducts include trihalomethanes and haloacetic acids. The treatment technique dictates that a removal ratio of 1 or higher must be achieved. Drinking water containing these byproducts in excess of the MCL may lead to adverse health effects such as liver, kidney, or nervous system problems, and may lead to an increased risk of cancer. Concerns regarding disinfection byproducts are based upon exposure over many years.
TABLE OF CONTENTS WELCOME YOUR WATER 2018 RESULTS MORE INFO
LAS
15 Quality. Service. Value.®LAS
2018 Water Quality(Continued)
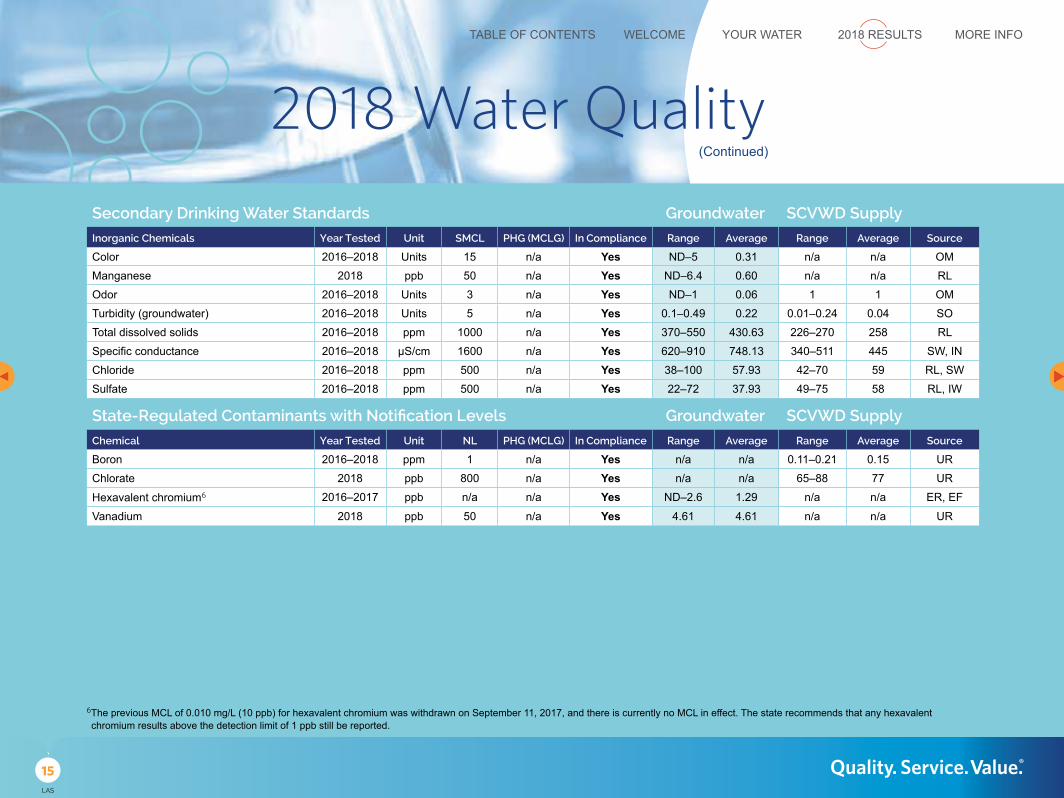
Secondary Drinking Water Standards Groundwater SCVWD Supply
Inorganic Chemicals Year Tested Unit SMCL PHG (MCLG) In Compliance Range Average Range Average Source
Color 2016–2018 Units 15 n/a Yes ND–5 0.31 n/a n/a OM
Manganese 2018 ppb 50 n/a Yes ND–6.4 0.60 n/a n/a RL
Odor 2016–2018 Units 3 n/a Yes ND–1 0.06 1 1 OM
Turbidity (groundwater) 2016–2018 Units 5 n/a Yes 0.1–0.49 0.22 0.01–0.24 0.04 SO
Total dissolved solids 2016–2018 ppm 1000 n/a Yes 370–550 430.63 226–270 258 RL
Specific conductance 2016–2018 µS/cm 1600 n/a Yes 620–910 748.13 340–511 445 SW, IN
Chloride 2016–2018 ppm 500 n/a Yes 38–100 57.93 42–70 59 RL, SW
Sulfate 2016–2018 ppm 500 n/a Yes 22–72 37.93 49–75 58 RL, IW
State-Regulated Contaminants with Notification Levels Groundwater SCVWD Supply
Chemical Year Tested Unit NL PHG (MCLG) In Compliance Range Average Range Average Source
Boron 2016–2018 ppm 1 n/a Yes n/a n/a 0.11–0.21 0.15 UR
Chlorate 2018 ppb 800 n/a Yes n/a n/a 65–88 77 UR
Hexavalent chromium6 2016–2017 ppb n/a n/a Yes ND–2.6 1.29 n/a n/a ER, EF
Vanadium 2018 ppb 50 n/a Yes 4.61 4.61 n/a n/a UR
6The previous MCL of 0.010 mg/L (10 ppb) for hexavalent chromium was withdrawn on September 11, 2017, and there is currently no MCL in effect. The state recommends that any hexavalent chromium results above the detection limit of 1 ppb still be reported.
TABLE OF CONTENTS WELCOME YOUR WATER 2018 RESULTS MORE INFO

LAS
16 Quality. Service. Value.®LAS
2018 Water Quality(Continued)
Unregulated Compounds Groundwater SCVWD Supply
Inorganic Chemicals Year Tested Unit MCL PHG (MCLG) In Compliance Range Average Range Average Source
Calcium 2016–2018 ppm n/a n/a Yes 49–110 85.19 12–24 18 ER
Magnesium 2016–2018 ppm n/a n/a Yes 23–39 27.19 7–14 11 ER
Molybdenum 2018 ppb n/a n/a Yes 0.67 0.67 n/a n/a ER
Strontium 2016–2018 ppb n/a n/a Yes 270–540 415.63 n/a n/a ER
pH 2018 Units n/a n/a Yes 6.9–7.98 7.47 7.7–7.8 7.8 PH
Hardness 2016–2018 ppm n/a n/a Yes 220–410 321.18 58–117 92 ER
Sodium 2016–2018 ppm n/a n/a Yes 26–59 34.13 39–65 49 ER
Chlorate 2016–2018 ppb n/a n/a Yes n/a n/a 65–88 77 ER
Potassium 2016–2018 ppm n/a n/a Yes n/a n/a 1.8–3.4 2.7 ER
Silica 2016–2018 ppm n/a n/a Yes 35 35 10–14 11 ER
Total alkalinity (as CaCO3) 2016–2018 ppm n/a n/a Yes n/a n/a 45–88 68 ER
TABLE OF CONTENTS WELCOME YOUR WATER 2018 RESULTS MORE INFO
LAS
17 Quality. Service. Value.®LAS
Thanks for taking the time to learn more about your water quality! Even more information awaits you at www.calwater.com. Visit our web site to get information about your account, water use history, water rates, and water system.
You will also find water-saving tips and news about water conservation programs and rebates available in your area.
> Conservation resources
> Lead in water
> Water treatment and disinfection
> Protecting the water supply
Thank you.
TABLE OF CONTENTS WELCOME YOUR WATER 2018 RESULTS MORE INFO