water quality studies on the big cypress seminole indian … · 2017. 10. 27. · florida, a major...
TRANSCRIPT

•
•
Comprehensive Project Summary: Water Quality Studies on the Big Cypress Seminole Indian Reservation September 2001
Florida Atlantic University Division of Biological Sciences Dr. John C. Volin, Dr. Dianne Owen
Pennsylvania State University Department of Biology Dr. William A. Dunson
Seminole Tribe of Florida Water Resources Department Mr. Craig Tepper
CONTENTS
Executive Summary
Current Water Quality Studies
1. Nutrient retention by an impounded mixed hardwood wetland receiving highnutrient point-source input from agricultural effluent
2. Water quality variation and nutrient limitation within an intact riparian slough system
3. Modeling water quality in surface waters of the Big Cypress Seminole Indian Reservation
Planned Studies
4. Chemical factors limiting plant growth in historic flow-ways of the Big Cypress Seminole Indian Reservation: The relative roles of [K], [P] and other nutrients.
Contact Information: John Volin, [email protected]; Bill Dunson, [email protected], Craig Tepper, [email protected]

• Executive Summary
•
•
Historically the greater Everglades ecosystem was oligotrophic, and probably a phosphorus-limited system. However, over the last century the Everglades has undergone severe hydrological modifications. The construction of a vast network of canals and levees, and the accompanying urban and agricultural development, have led to dramatic changes in natural hydrology as well as water quality. Like much of southern Florida, a major water quality problem in canals traversing the Big Cypress Seminole Indian Reservation is the high level of phosphorus. "Natural" levels (prior to major anthropogenic influences) are believed to be in the range of 10-50 ppb total phosphorus, yet many canals often attain significantly higher levels. The Big Cypress Reservation is subjected to elevated levels of phosphorus in upstream water sources, and as a result discharges water of lower than desirable quality to Miccosukee lands, WCA3A and the Big Cypress National Preserve.
We have conducted a three part series of water quality studies on the Big Cypress Seminole Indian Reservation. We investigated nutrient retention by a mixed hardwood wetland within a storm water attenuation impoundment constructed in 1994 which receives high-nutrient point-source input from agricultural effluents. We examined water quality variation and nutrient limitation within an intact semi-pristine riparian slough system. We utilized a nine-year water quality database to model water quality in surface waters in canals that traverse the Reservation.
(1) We found that in surface water within the impoundment, high levels of phosphorus inflow were Significantly lowered at interior sites. In addition, under extreme water events, when water exits more rapidly through the impoundment overflow structure, outflow nutrient levels were substantially reduced compared to inflow levels. We utilized chloride ion as a conservative tracer that could be used to estimate whether nutrient retention was controlled primarily by physical processes or by biological/chemical processes. A comparison of relative changes in total phosphorus and chloride ion concentrations provided evidence that biological or chemical processes were the primary mechanism of phosphorus reduction within the impoundment.
(2) We studied an intact riparian slough that received relatively low-nutrient surface water input from nonpoint-sources. Our objective was to establish a baseline of water quality parameters for a forested slough receiving relatively little input from anthropogenic sources. We established eight sampling sites along a north to south gradient, and found that over a course of a late wet and dry season, all eight sites had similarly low nutrient levels. This indicated that water input into the slough did not contain high levels of nutrients and the slough did not Significantly reduce nutrient concentrations beyond these levels. Total phosphorus levels were low throughout the study, but interestingly, potassium concentrations were also extremely low, seven times lower than concentrations found in other open-water oligotrophic sloughs in the sawgrass marsh Everglades. Potassium may therefore be present in growth-limiting concentrations for plants, which could have profound implications for the setting of water quality standards within the region. A future field-scale study is planned to examine the degree to which potassium and/or phosphorus limit plant growth in natural riparian forests .
(3) We asked whether phosphorus in surface water is assimilated during the predominantly north to south flow through the canal system on the Big Cypress Reservation. We modeled changes in the concentrations of phosphorus derived from an
2

•
•
•
existing nine-year database during transit along the west and north feeder and the L-28 interceptor canals that traverse the Reservation. Our objectives were to determine how much phosphorus is removed from the water column and to test whether a conservative tracer could be utilized to identify the processes responsible for phosphorus uptake. Overall we found that phosphorus concentrations decreased substantially as water moved through the Big Cypress canal system. As in the forested wetland impoundment, the behavior of phosphorus was non-conservative and thus consistent with uptake through biological or chemical processes.
These studies add new insights to the paucity of information with regard to water quality within the Big Cypress Region of the Greater Everglades Ecosystem. If phosphorus uptake within this forested wetland system is indeed dependent on other limiting nutrients, this may have profound implications for the setting of water quality standards within this region .
3

•
•
• 4

•
•
•
1. Nutrient retention by an impounded mixed hardwood wetland receiving high-nutrient point-source input from agricultural effluent
Overview:
This study was deSigned to examine the ability of forested wetlands within the Big Cypress Swamp to reduce surface water nutrient levels. Our first objective was to determine whether surface water nutrients in an impounded forested wetland receiving high-nutrient input from point-source agricultural effluent would be assimilated as water flowed through the impoundment. Our second objective was to use a conservative tracer approach that could then estimate whether nutrient retention was controlled primarily by physical processes or by biological/chemical processes. We found that high input levels of phosphorus and nitrogen were significantly lower at interior sites and outflow nutrient levels were substantially reduced. Results also indicated that chloride ion behaved as a conservative tracer within the impounded wetland system, showing no significant change in concentration among inflow, interior and outflow sites, and exhibiting a highly negative correlation with rainfall levels. Comparison of total phosphorus and chloride ion concentrations in surface water pOinted to biological or chemical processes as the primary mechanism of phosphorus reduction within the impoundment.
Approach:
The study site, located entirely within the Big Cypress Seminole Indian Reservation, was an impounded 73 Ha mixed forested wetland with vegetation types representative of the greater Big Cypress Swamp. Four vegetation communities were identified along a hydrological gradient from hydric to mesic: cypress swamp, cypress domes, wet prairie (former pasture), and live oak hammocks. The impoundment received water primarily from agricultural sources and only secondarily from direct preCipitation. Prior to impoundment, the site contained forested communities surrounded by improved pasture and the entire area was open to grazing. In 1994, a berm was constructed to create a stormwater attenuation cell with the intent of lowering water levels on adjacent agricultural land (Figure 1-1). Three pumps were installed on the east side of the impoundment, and were used to drain excess water from adjacent row crops and orange groves during periods of high precipitation. The agricultural effluent flows through the interior of the wetland and drains passively through the soil. During particularly high rainfall events, when water depth reached 1.0 m or more, water also drained through an overflow structure at the south end of the impoundment. As a result, the site experienced dramatic hydrological fluctuations with short hydroperiods and high water levels. This impoundment was designed for storm water detention/attenuation, not for water quality improvement. Thus flow patterns were not optimal for nutrient assimilation.
In 1999, surface water grab samples for subsequent nutrient analysis were collected biweekly during the six-month wet season from June through November when water was present. Sampling sites were located at each of the three inflow pumps, five randomly chosen interior sites and at the overflow structure (Figure 1-1). Consistent with USEPA protocol for field water sampling collection, triplicate water samples were collected below the surface of the water in polyethylene bottles rinsed three times in the sampling area before the analysis sample was collected. During each sampling event, standard water quality measurements were recorded, including: temperature, specific conductance and pH. Samples to be analyzed for total phosphorus (TP) and total Kjeldahl nitrogen (TKN)
5

•
•
•
were acidified with H2S04 to pH < 2.0 while in the field. Samples to be analyzed for metals were acidified with HN03 to pH < 2.0. Samples were transported on ice to the laboratory where they were kept frozen until analysis. TP and TKN samples were digested (Bran Luebbe BD50 Digestion Block) by sulfate reagents using the SM4500-P5 protocol, while metal samples were digested by the nitric acid method using the SM3030E protocol. TP was analyzed photometrically using a Technicon Autoanalyzer II, which provided for a lower detection limit of 0.004mg L-1
. TKN and metals, which included calcium (Ca), chloride (CI), potassium (K), magnesium (Mg), and sodium (Na), were analyzed at the University of Florida Analytical Research Laboratory, using a Kjeldahl photometric procedure (EPA351.2) for TKN, procedure EPA325.2 for CI and EPA200.7 for Ca, K, Mg, and Na. Approximately 30% of all sample analyses were conducted for quality assurance. Weekly rainfall and average weekly nutrient concentrations in rain during the study period were obtained from the nearest South Florida Water Management District (SFWMD) meteorological station (S140) located approximately 26 kilometers to the southeast of the study site.
Results:
Mean values of water quality parameters in rainfall and at surface water sampling sites within the impoundment are shown in Figure 1-2 and summarized in Table 1-1. Although the mean concentrations of the parameters were generally lowest at the interior sites and highest at the inflow sites, none of the parameters, with the exception of TP and TKN, showed a significant difference in mean concentrations across the three sites (p>0.05). Mean TP concentrations were significantly higher at the inflow sampling sites than at interior sites (0.133±0.014 and 0.06±0.004 mg L-1, respectively, p<0.001). Mean TP concentration at the outflow site (0.088±0.008 mg L-1
) was also significantly higher than at the interior sites (p<0.05). There was a substantial, although not Significant, difference in mean TP concentrations between inflow and outflow sites, with inflow TP 66% higher than outflow TP. TKN showed a pattern similar to that of TP, with concentrations lower at the interior site than at the inflow or outflow sites (p<0.05).
Water depth during the sampling period was consistently highest at the inflow site (Figure 1-2). Mean water depths at the inflow and interior sites were Significantly correlated with the 30-day moving average of rainfall (r=0.75 and r=0.82, respectively, p<0.05). Outflow water depth was also highly correlated with rainfall (r=O.65, p<O.1). Correlation of water depth with water quality parameters was determined using data from individual inflow, interior and the outflow sampling sites (Table 1-2). With several notable exceptions, water quality parameters were not significantly correlated with water depth. Correlation of water depth and specific conductivity was significant at the interior site (r=-0.43, p<0.005) and CI was significantly correlated at both inflow and the interior sites (r=-O.52 and r=-0.57, respectively, p<0.005). CI also showed a high correlation with water depth at the outflow site (r=-0.65, p<0.1). TKN also showed significant correlation with depth at the inflow site (r=-0.54, p<0.005).
Daily rainfall during the wet season sampling period averaged 0.72±0.18 cm. Table 1-2 shows the correlation between the 30-day moving average of rainfall and mean water quality parameters at the inflow, interior and outflow sites. The overall pattern of correlation between water quality and rainfall was similar to the pattern seen with water depth. CI showed a highly significant negative correlation with the 30-day moving average of rainfall at both the inflow (r=-0.84, p<0.01) and interior (r=-.92, p<0.001) sites (Figure 1-3). The correlation between rainfall and CI concentrations was less significant
6

•
•
•
at the outflow site (r=-0.65, p< 0.1). TP was not significantly correlated with rainfall (Figure 1-4) or with chloride (Figure 1-4) at any of the sites.
Conclusions:
We found that interior sites of an impounded forested wetland receiving high nutrient input from adjacent agricultural fields had lower surface water nutrient concentrations than either inflow or outflow sampling sites. This reduction was significant for TP and TKN, both of which followed the same general pattern, although TKN was present at relatively low concentrations comparable to many South Florida wetland systems (Duever et a/. 1974; Vaithiyanathan and Richardson, 1998). Outflow TP concentrations were also lower than inflow levels, but not as low as at interior sites. This appears to be the result of the short-circuiting of flow, bypassing the interior when large amounts of water are being actively pumped.
We also used a conservative tracer to estimate whether nutrient reduction was primarily the result of physical processes or of biological/chemical processes. CI was identified as a good candidate for this purpose, as it does not readily take part in redox reactions, nor does it form insoluble salt complexes or absorb onto mineral surfaces (Hem 1989). We found that CI was negatively correlated with water depth and showed a highly significant negative correlation with rainfall, strongly supporting the hypothesis that it behaved conservatively within this system. While the 3.6% reduction in CI from inflow to interior sites was insignificant, TP was reduced significantly by 55%. In contrast to CI, TP showed no correlation with water depth or rainfall. Moreover, TP showed no correlation with CI. Therefore, given the conservative behavior of CI, we attributed TP reduction within the impoundment mainly to non-conservative biological and chemical processes, while physical processes such as dilution and evaporation appeared to have little impact on overall TP concentrations.
Our results show that, with appropriate management, forested wetlands of the Big Cypress Swamp can provide significant nutrient retention and serve as an important tool for restoration of South Florida's wetland systems .
7

•
•
•
Tables and Figures:
Figure 1-1. Location of inflow pumps ( .. ), overflow structure (0) and five interior sites (&) within the forested wetland impoundment
8

K (mg 1'1) Mg (mgI,I) Sp. Condo (p.S em,l) 011 < -, .,. VI 0- -.J 00 CD(Q a N ..., .,. a N ..., .,. VI 0- a a a a a <::;, <::;, <::;, <::;, <::> <::> <::;, a a a a a • .,c Joo-99 :TCD '"' Joo-99 Joo-99 S Ii)
CD ..... '0 I
2- '-" !!l.N Jul-99 Jul-99 III c:.... Dl JuJ-99 -0 III
CD Q.:::::l III
n. '<::::!l c" ~ -0 0 Aug-99 3 0 CD =E Aug-99 Aug-99 8 ::::!.-
~D ::J Q. Sep-99 c: '-"
Sep-99 Sep-99 Sl Dl :r ::J .... 0 CD Oct-99
Oct-99 ::::!. Oct-99 0 ., -.. Nov-99 ~ Nov-99 i ~r/,.L Nov-99 '-"
!l) :::::l
Dec-99 Q. Dec-99 j Dec-99 0
TP(mgP rl) C Ca (mgl,l) :3i 0 0 p a 0 0 Depth (meters) ~ <::> <::> ;; N N N .,. 0- 00 0 VI VI 0 v- a a a 0 a a N Joo-99 Joo-99 0 v. 0 v. 0 - Joo-99 .. Z -'-" ~
Q. -; Jul-99 ~ M~j 'ir tT e!. Jul-99 -0
IT ...... Q. -< c: CD
3 '0 3 Aug-99 :T CD Aug-99
Aug-99 !l) :::::l CII
\0 0- S~99 j \\ ! Sep-99
~ SeP-
99 1 ~ • .,
0<'-99 j =E !l) ....
Oct-99 CD Oct-99 ., ..0 c
Nov-99 J I r Nov-99 !l)
~ Nov-99 s: '< -0
Dec-99 J .~ -,g Dec-99 !l)
Dec-99 ii3 3
TKN(mgl,l) Na(mgl,l) Cl(mgl,l) ~ CD a N ..., .,. - N N ...,
IV ..., .,. VI 0- -.J 00 Cil <::> 0 0 <::;, <::> a VI a VI a a a 0 a a a a :i" Jun-99 Joo-99 Jun-99 ..... 2; :3 ::T
-; III CD Jul-99 A Jul-99 0
Jul-99 0- Q. Z c' CD 3 CII Aug-99
..... Aug-99 Aug-99 CD
Q.
=E ~ Sep-99 1 D' Sep-99 1 .~ Sep-99 i» :::::l Q.
3' Oct-99 1 T Oct-99 1 N Oct-99 -0 0 c Nov-99 1 ~ Nov-99 1 K. 1lI~ Nov-99 :::::l Q. 3
• CD Dec-99 • Dec-99 - Dec-99 j :::::l .....

•
•
•
(a) Inflow r= -0.84 p= 0.0043
1.4
1.2 • 'ef 1.0 ()
;;- 0.8 <S 0.6 ~ 0.4
0.2
0.0
(b) Interior r= -0.92 p= 0.0005
1.4
1.2
S 1.0 ()
:::::" 0.8 ;:s
0.6 1:1
~ 0.4
0.2
0.0
(c) Outflow r= -0.65 p= 0.0577
1.4 r--. 1.2 B 1.0 ~ 0.8 ~ 0.6 ';1 ~ 0.4
0.2 0.0
0 10 20 30 40 50 60 70 80
Chloride (mg r1)
Figure 1-3. Regression analysis of 30-day moving average of rainfall at the 8140 station with chloride in the inflow(a), interior(b) and outflow(c) of the forested wetland impoundment.
10

•
•
•
0.25
_,-... 0.20 '-
/;l/)
E '-" 2 0.15 0 -= 0.. r.n .2 0.10 0..
~ E-< 0.05 II
0.00
0 20
@ • 0 <0 0
• " ••
1&
40
Chloride (mg r1)
o
• fJ. II
III
60
~
o Inflow r=0.05; p=0.794 .Interior r=0.21; p=0.144 • Outflow r=0.01; p=0.982
80
Figure 1-4. Pairwise average TP and CI concentrations for each sampling event at the inflow, interior and outflow sites of the forested wetland impoundment.
11

•
Inflow
Interior
Outflow
Sp. Condo K
(/-lS cm-1) (mg r1)
Ca
(mg r1)
•
Na (mg r1)
Mg
(mg r1)
CI
(mg r1)
TP
(mg r1)
TKN
(mg r1)
•
611 ± 18a 2.48 ± O.l1a 45.40 ± 2.49a 19.44 ± 0.94a 3.97 ± 0.14a 47.30 ± 2.66a 0.130 ± O.OlOa 1.29 ± 0.15a
568 ± 16a 2.46 ± O.lOa 40.86 ± 1.96a 18.95 ± 0.79a 3.88 ± 0.14a 45.58 ± 2.22a 0.060 ± 0.004b 0.99 ± 0.04b
611 ± 24a 2.84 ± 0.20a 48.07 ± 4.428 20.13 ± 1.25a 3.88 ± 0.43a 48.22 ± 4.29a 0.090 ± O.OOlOa 1.38 ± 0.17a
Means within columns with the same letter are not significantly different (p=O.05)
Table 1-1. Comparison of summary statistics (mean±SE) and ANOVA results for water quality parameters within the forested wetland impoundment.
12

•
•
•
{a} Water deQth {b} Rainfall
Multiple R Significant p Multiple R Significant p
Sp. condo INF 0.29 N.S. 0.12 N.S. INT 0.43 0.0034 0.08 N.S. OUT 0.20 N.S. 0.56 N.S.
K INF -0.03 N.S. -0.02 N.S. INT 0.21 N.S. 0.08 N.S. OUT 0.42 N.S. 0.38 N.S.
Ca INF 0.37 N.S. 0.65 N.S. , INT 0.39 N.S. 0.38 N.S.
OUT 0.36 N.S. 0.77 0.0161 Na INF 0.00 N.S. 0.15 N.S.
INT 0.15 N.S. 0.14 N.S. OUT 0.15 N.S. 0.62 N.S.
Mg INF 0.06 N.S. 0.19 N.S. INT 0.20 N.S. -0.05 N.S. OUT -0.14 N.S. 0.36 N.S.
CI INF -0.52 0.0047 -0.84 0.0043 INT -0.57 <0.0001 -0.92 0.0005 OUT -0.74 0.0234 -0.65 N.S.
TP INF -0.16 N.S. 0.02 N.S. INT -0.07 N.S. -0.14 N.S. OUT -0.33 N.S. 0.28 N.S.
TKN INF -0.54 0.0034 -0.31 N.S. INT -0.04 N.S. 0.32 N.S. OUT -0.11 N.S. 0.32 N.S.
N.S.= not significant at p=0.05
Table 1-2. Correlation of water depth and rainfall with water quality parameters in the inflow(INF). interior(INT) and outflow(OUT) of the forested wetland impoundment.
13

•
•
•
2. Water quality variation and nutrient limitation within an intact riparian slough system
Overview:
The present study was designed to examine the spatial and temporal variation in water quality parameters within an intact riparian slough system in the Big Cypress Swamp. The system chosen for this study received low-nutrient surface water input from nonpoint sources. Our first objective was to establish a baseline of water quality parameters for a forested slough receiving relatively little input from anthropogenic sources. Our second objective was to examine the correlations among water quality parameters, as well as the relationship between specific surface water nutrients and abiotic factors, to gain insight into the nutrient interactions and limitations of this system.
Approach:
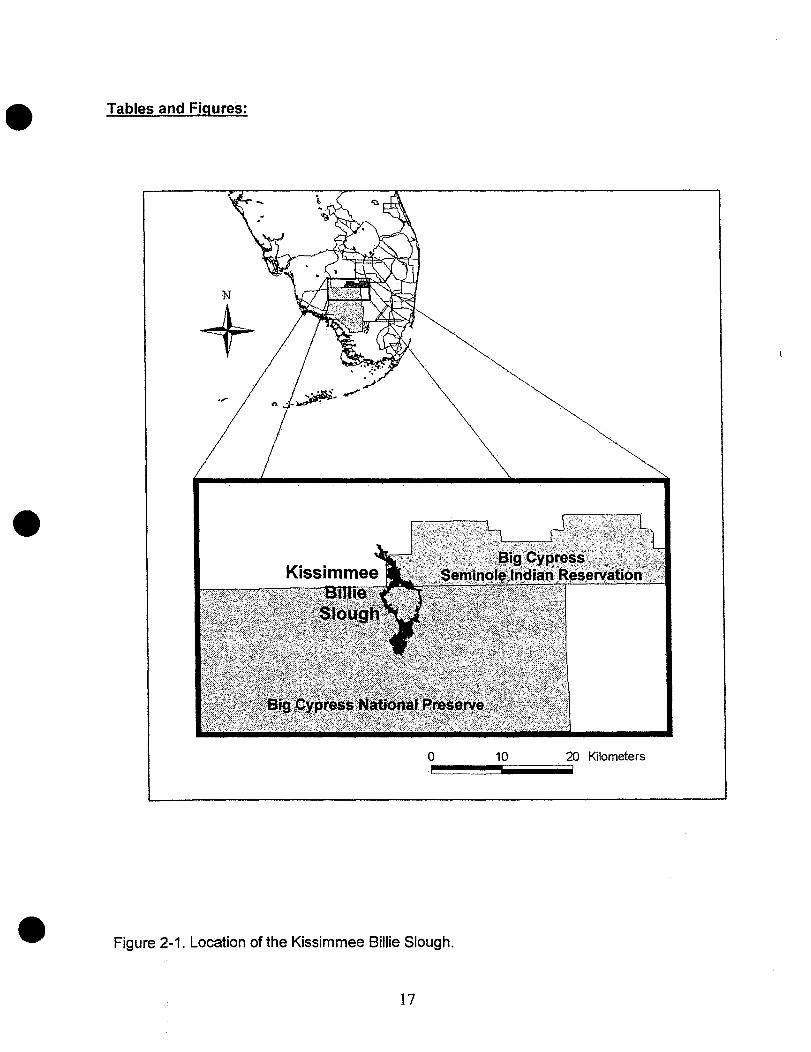
The site of this study was the Kissimmee Billie Slough (KBS), an relatively intact riparian system originating beyond the northwestern border of the Big Cypress Seminole Indian Reservation (BCSIR) and extending southward 4.4 km into the Big Cypress National Preserve (Figure 2-1). It then becomes diffuse south of 1-75 and eventually drains into Mullet Slough, WCA 3A, and finally Everglades National Park. The KBS was chosen for the study because of its remote locale and the likelihood that agricultural influence on its water quality would be minimal. The slough is dominated by bald cypress (Taxodium distichum) with a minor presence of canopy laurel oak (Quercus laurlfolia) and red maple (Acer rubrum) along the edges. The latter two species have dramatically increased their landscape coverage over the last 50 years as a result of drier conditions. In the wettest areas, the slough is dominated by two subcanopy tree species, pop ash (Fraxinus caroliniana) and pond apple (Annona glabra). Vegetation types representative of the Big Cypress Swamp surround the slough. The KBS receives water from precipitation and overland flow from adjacent natural areas as well as indirectly from agricultural areas to the north of the slough. In addition, although much diminished from its historical water regime, the slough still maintained a natural seasonal pattern in that water levels were highest during the wet season and substantially reduced in the dry season.
Surface water grab samples for subsequent nutrient analysis were collected from eight sampling sites chosen along a gradient from north to south within the slough (Figure 2-2). Six weekly samples were collected during 1998 during the late wet season from early November through mid-December. Five weekly samples were collected in 1999 during the dry season from mid-February through mid-March. Handling of samples and analysis of water quality parameters was done according to standard EPA procedures as described in Section 1 of this report. Weekly rainfall amount and average weekly nutrient concentrations in rain during the study period were obtained from the nearest South Florida Water Management District (SFWMD) meteorological station (S140) approximately 28 kilometers east-southeast of the slough. Correlation matrices were calculated across all water quality parameters for the entire sampling period and separately for both the wet and dry season.
Results:
Mean values of water quality parameters in rainfall and at surface water sampling sites
14

•
•
•
within the KBS are summarized in Table 2-1. Mean TKN and TP concentrations were relatively low at 1.027±0.08 mg r1 and 0.024±0.003 mg r1, respectively. Mean K concentrations within the study basin were also very low, at 0.843±0.1 03 mg r1. Daily rainfall averaged 0.42±0.21 cm during the late wet season sampling period and 0.12±0.078 cm during the dry season sampling period. With the exception ofTP, the extremely low concentrations of nutrients in rainfall did not contribute significant inputs to surface water within the study basin. However, TP in rainfall averaged 0.008±0.004 mg L-1
, representing one-third of the TP present in surface water within the KBS.
Concentrations of surface water quality parameters were consistently low throughout the KBS during both the wet and dry season sampling periods (Figure 2-3). Mean levels of all water quality parameters except K, TKN and TP were significantly lower during the late wet season period than during the dry season (p<0.05). Although the mean K concentration was 29% lower in the late wet season period, this difference was not significant (p>0.05) as a result of the considerable variability in the extremely low K concentrations (Figure 2-4). Similarly, mean TKN concentrations were lower in the late wet season period but variability of these measurements allowed for no significant differences to be determined between the late wet and the dry season periods. Mean TP concentration was highest during the wet season. However, TP concentrations in both seasons were highly variable (Figure 2-4), and this difference was therefore not significant (p>0.05).
Average water depth in the KBS, shown in Figure 2-3, was significantly higher during the late wet season period (0.68±0.067 m) than during the dry season period (0.42±0.039 m, p<0.001). Table 2-2 summarizes the correlation between water depth and water quality parameters in the KBS. Specific conductivity and CI concentration were negatively correlated with water depth (p<0.01), consistent with the pattern of seasonal variation seen in these parameters (Figure 2-4). No other water quality parameters showed significant correlation with water depth (p>0.05). Rainfall at the S140 was not significantly correlated with water depth in the KBS (p>0.05), and only TP concentrations, which correlated positively with the 30-day moving average of daily rainfall at the S140, showed a significant correlation with rainfall (r=0.68, p<0.028). (Table 2-2). TP concentrations were not significantly correlated with CI concentrations (r=0.03, p=0.859) (Figure 2-5).
Conclusions:
In the current study, average water quality parameters were at low levels within the KBS, a forested wetland slough receiving relatively little nutrient input from anthropogenic sources. Despite the north to south sampling gradient, low nutrient levels were found at all eight of the sampling sites within the KBS. This indicated that water input into the KBS did not contain high levels of nutrients and the slough did not significantly reduce nutrient concentrations beyond these levels. This suggests that these wetland plants are unable to reduce TP below the mean TP of 24 ppb, which could thus represent a natural minimum for the system. Although water samples were collected late in the wet season, data from the South Florida Water Management District showed that TP concentrations measured throughout the entire wet season in sub-basins immediately north of the KBS had similar TP concentrations (South Florida Water Management District, 1998). Specific conductance and water depth were significantly negatively correlated, owing to changes in concentration that result from physical processes of
15
•
•
•
dilution in the wet season and evaporation in the dry season (Gorham 1961, Likens and Borman 1977, Cole and Fisher 1979). Mean concentrations of water quality parameters, with the exception of K, TKN and TP, were significantly lower in the wet than the dry season, most likely as a result of dilution, although individual sampling sites had no significant correlation to depth and rainfall.
TP levels were highest in the late wet season period, and TP was the only nutrient having a significant positive correlation with rainfall. While TP concentrations were lower than in many wetlands, concentrations were similar to minimally impacted wetlands throughout Southern Florida (Brown 1981, Waller 1982, Brown and Van Peer 1989, Urban et al. 1993, Vaithiyanathan and Richardson 1998). The significant correlation of TP with rainfall cannot be readily explained, but may be due in part to atmospheric deposition of phosphorus released by the seasonal burning of the extensive sugar cane fields in the Everglades Agricultural Area to the northeast of the KBS. Rainfall TP represented 25% of the TP present in surface water, constituting a significant contribution to TP surface water concentrations in the natural slough. The high correlation between TP and rainfall is also consistent with TP mobilization in surface water that flows from the agricultural fields to the north of the slough during the wet season. Mobilization of TP from agricultural fields would typically be associated with a time lag between rainfall events and increased TP concentrations in downstream surface water. However, the sampling schedule used in this study was not adequate to detect this putative time lag. In contrast to the behavior of TP, CI concentrations within the slough were negatively correlated with rainfall and showed a significant negative correlation with water depth, consistent with its role as a conservative tracer in this watershed, as discussed in Section 1 of this report.
Potassium concentrations were extremely low in the KBS during both seasons. By comparison, K concentrations seven times greater than in the KBS have been found in open water oligotrophic sloughs in the sawgrass marsh Everglades where specific conductance ranged from 600-1200 j..lS cm-1 (Vaithiyanathan and Richardson 1998). Furthermore, in this study no significant change in K concentration was observed between the wet and dry seasons, the expected consequence of evaporation during the dry season. This provides additional evidence that K is present at growth-limiting concentrations for plants in the KBS. If K is indeed present at limiting concentrations within this natural slough system, it may have profound implications for the setting of water quality standards within the region. A proposed study to examine the relative roles of K and TP concentrations on forest strand growth is outlined in Section Four of this report .
16
•
•
•
Tables and Figures:
N
+
20 Kilometers ~~~iiiiiiiiiiiiiii_
o 10
Figure 2-1. Location of the Kissimmee Billie Slough.
17

•
•
•
Big Cypress Seminole Indian Reservation
N
+ o 5 10 15 Kilometers
Figure 2-2. Location of water quality sampling sites ~) within the Kissimmee Billie Slough.

• • • (a) Depth'" (b) Specific conductance'" (c) Calcium'"
1.0, 600 50 489 38 0.68 "'" 40
1;( O.S ~ 400 i !fl 30 g 0.5 3 271 C4l
S
~ "8 ';;;' 20 Ci 0.3
8 200 u 0-
if] 10
0.0 0 0 WET DRY WET DRY WET DRY
(d) Sodium'" (e) Chloride'" (f) Magnesium'"
201 50 5
14 40 £' 15 I 4 i 3.2
"'"'
g 10 30 ~3 00
S S Z ;:::: 20 14 ';;;2
5 u ::'E
10
0 0 0
WET DRY WET DRY WET DRY
(a) PotassiumNS (h) TKNNS (j) TpNS
0.040 1.5 1 1.5 1 0.025
1.11 0.030 ,....... ~,
1.0 0.77 0.87 Z 1.0 0.82 '-.. ~
00 00 g 0.020 g g
A.. ::..:: 0.5 ~ 0.5 f-< 0.010
0.0 0.0 0.000 WET DRY WET DRY WET DRY
Figure 2-3. Water quality parameters (mean±SE) for the Kissimmee Billie Slough in the late wet season (Nov-Dec) and the dry season (Jan-Mar). ("'=significantly different at p<O.05, NS=not Significantly different at p=O.05)
19

• 700
-;-; 600
;J.; 500 $. 400 ] 300 8 200 & 100
(a) Specific conductance
.. ' , ...... •
0+1-----,-----,-----.-----,----Nov-98 Dec-98 Jan-99 Feb-99 Mar-99
(d) Magnesium
6
'""' 5 I ! - 4
OIl
S 3 i I • OIl 2 • • • ::E 1 • • •
0 Nov-98 Dec-98 Jan-99 Feb-99 Mar-99
(g) Potassium
2.5
2 ! '""' :.. 1.5 ! bO
! ! S 1
~ 0.5 • • • _. II II 0-
Nov-98 Dec-98 Jan-99 Feb-99 Mar-99
• (b) Depth
1.20
,-.. 1.00
!HH i 0.80
! I, ! S 0.60
"R 0.40 0
Cl 0.20
0.00 +1---..------.--..-----.-Nov-98 Dec-98 Jan-99 Feb-99 Mar-99
(e) Calcium
80
£' 60 I
S 40 I • I • '-"
c3 20 • • • • • • 0
Nov-98 Dec-98 Jan-99 Feb-99 Mar-99
(h) TP
0.12
,-.. 0.1 f :. 0.08
g 0.06 f ~ 0.04
I: ! I[
II: 0.02 II: .: I[ o II: ..
Nov-98 Dec-98 Jan-99 Feb-99 Mar-99
(c) Chloride
60 50
~! ! -;: 40 OIl 30 S • o 20 • • ... 10 • 0
Nov-98 Dec-98 Jan-99 Feb-99 Mar-99
(f) Sodium
40
_'""' 30 I- ! OIl I S 20 '-'
Z 10 ••• • ••• • • 0 Nov-98 Dec-98 Jan-99 Feb-99 Mar-99
(i) TKN
0.12
:::-- 0.1 ! ~ 0.08 8 0.06 '-" ! Z 0.04
I: i I: ~ 0.02 11=
11= .: 11=':' 0 •
Nov-98 Dec-98 Jan-99 Feb-99 Mar-99
Figure 2-4. Sampling event variability (mean±SE) of water quality parameters in the Kissimmee Billie Slough over the sampling period.
20
•

•
0.05 r=O.03;p=O.859 -.,.. ..... 0> 0.04 • E • -II) 2 0.03 • 0
..s:: • c. • ~ 0.02 ..s:: • c. • • • (ij (5 0.01 l- • •
0.00
0 10 20 30 40 50
Chloride mgr1
Figure 2-5. Pairwise averageTP and CI concentrations for each sampling event within the • Kissimmee Billie Slough
21

• •
Sp. Condo K Ca Na Mg CI TP TKN
(JlS cm-1) (mg r1) (mg r1) (mg r1) (mg r1) (mg r1) (mg r1) (mg r1)
(a) Rain N/A 0.03 ± O.Ol a 0.23 ± 0.068 0.67 ± 0.168 0.04 ± 0.028 1.65 ± 0.338 0.008 ± 0.0048 0.07 ± 0.068
(b) KBS 426± 20 0.84 ± O.lOb 33.63±2.46b 11.58±1.28b 2.79±0.24b 29.72 ± 2.36b 0.024 ± 0.003b 1.03 ± 0.08b
Means within columns with the same letter are not significantly different (p=0.001)
Table 2-1. Comparison of summary statistics (mean±SE) and ANOVA results for water quality parameters of rain at S140 and surface water of the Kissimmee Billie Slough.
22
•

•
•
•
{a} Water de~th {b} Rainfall Multiple R Significant p Multiple R Significant p
Sp. condo 0.96 <0.0001 -0.58 N.S.
K -0.01 N.S. -0.26 N.S.
Ca 0.45 N.S. 0.15 N.S.
Na 0.55 N.S. -0.06 N.S.
Mg -0.07 N.S. 0.36 N.S.
CI -0.82 0.0036 -0.18 N.S.
TP 0.18 N.S. 0.69 0.0287
TKN 0.16 N.s. 0.22 N.S.
Rainfall 0.47 N.S.
N.S.= not significant at p=D.D5
Table 2-2. Correlation of (a) water depth and (b) 3D-day moving average of rainfall with water quality parameters in the Kissimmee Billie Slough.
23
•
•
•
3. Modeling the assimilative capacity for phosphorus in surface waters of the Big Cypress Seminole Indian Reservation
Overview:
The Big Cypress Seminole Indian Reservation receives a large amount of phosphorus from adjacent agricultural lands. The aim of this study is to determine whether phosphorus in surface water is assimilated during the predominant north to south flow through the Big Cypress Reservation and to elucidate the underlying mechanisms of phosphorus movement. Our first objective was to examine changes in the concentrations of phosphorus during transit along the west and north feeder and the L-28 interceptor canals that traverse the Reservation. determine how much phosphorus is removed from the water column and. by utilizing a conservative tracer. identify the processes potentially responsible for phosphorus uptake. Our second objective was to examine the spatial and temporal pattern of surface water phosphorus concentrations within the Reservation and determine the relationship of these patterns to biotic and abiotic environmental gradients in order to construct a model of phosphorus movement. To accomplish these objectives. we have utilized water chemical. hydrological. and meteorological data collected from 1980 through 2001 at several locations throughout the Reservation and adjacent lands within the regional watershed. This quantitative model will contribute to our current understanding of phosphorus sources and sinks within the Reservation and guide the formulation of specific hypotheses about the mechanisms of phosphorus movement in wetlands of the Greater Everglades Ecosystem that have evolved in oligotrophic conditions .
Approach:
An initial analysis of water quality on the Big Cypress Seminole Indian Reservation was conducted using an extensive database representing nine years of biweekly surface water sampled at 10 sites within the Reservation from 1990 through 199a. (Figure 3-1). This database included measurements of total phosphorus (TP). total Kjeldahl nitrogen (TKN). calcium (Ca). chloride (CI). sodium (Na). total suspended solids (TSS). pH. specific conductance (SpC) and flow rates. A time series analysis (SAS va.O) of this database was used to identify seasonal patterns in the variation of water quality parameters in the main surface water converyances traversing the Reservation. A predictive model of TP concentrations in surface water leaving the Reservation was developed through multiple regression analysis (SAS va.O) of inflow and outflow TP concentrations. To obtain approximate estimates of TP assimilation from the canal water as it traverses the Reservation. ANOVA analysis of TP and CI concentrations was performed using data from periods of water flow at inflow and outflow sites.
The relationship between surface water quality parameters and rainfall patterns was investigated using daily rain data recorded by the South Florida Water Management District from 1980 through 2000 at seven stations located within the regional watershed at a distance of 75 km or less from the Reservation. Time series analysis was used to develop seasonal and trend models of regional rainfall. The relationship between rainfall and surface water parameters was explored by time series and multiple regression analysiS using the rainfall trend models .
24

•
•
•
To further investigate factors influencing surface water quality on the Reservation we began installation in June, 2000 of a series of 30 digital monitoring wells programmed to record surface and ground water every six hours throughout the Reservation (Figure 3-1). At each digital well location, elevation, depth to bedrock, soil stratigraphy, texture (% sand, silt, clay) and conductivity/permeability of sediment will be determined. In addition, measurements of surface water quality on the Reservation are being expanded to include measurements of potassium and will be conducted at three additional sites within the intact slough systems in the Preserve Area of the Reservation.
Results:
Time series analysis of TP concentrations at the main outflow canal (L-28 Interceptor) and the two inflow canals (the North and West Feeders) from 1990 through 1998 revealed a strong seasonal trend, with TP peaking in July/August (Figure 3-2). This seasonal model of TP concentration was similar to the trend in the 28-day moving average of rainfall (Figure 3-3).Time series analysis showed that optimal correlation (r=0.59, p=0.001) between seasonal TP concentration averaged across all sites and the seasonal model of rainfall was obtained when rainfall was lagged by 30 days (Figure 3-4). In contrast, CI concentrations were inversely correlated with the rainfall trend (r= -0.50, p=0.001) (Figure 3-5).
Regression analysis of inflow and outflow TP from November 1990 through December 1995 was used to develop a quantitative model of outflow TP. When tested against actual data for the period from January 1996 through December 1998, model predictions showed good agreement with outflow TP concentrations (r=0.72, p=0.001) (Figure 3-6) . ANOVA analysis of the difference in inflow and outflow concentrations of phosphorus TP and chloride ion CI showed a significantly greater reduction in outflow TP than in outflow CI (Table 3-1). As shown by a surface spline of average TP concentrations at sampling sites over the nine-year monitoring period, TP levels in surface water generally declined along a north to south gradient within the western portion of the Reservation (Figure 3-7).
Figure 3-8 shows water depths measured by digital monitoring wells from June 2000 through September 2001. Average water depths were significantly greater in the Preserve Area than in the intensively drained northern portion of the Reservation. As expected, the greatest fluctuations in water depth were seen in the forested wetland impoundment described in Section 1 of this report.
Conclusions:
Our analyses of the overall trends in canal water quality showed that TP concentrations entering the Reservation are significantly higher than at outflow pOints. In contrast, CI concentrations do not change significantly as water moves through the canal system. Together with the strong inverse correlation observed between CI and the trend model of regional rainfall, this lack of change in CI concentrations is persuasive evidence that CI behaves as a conservation tracer in this system and is controlled primarily by physical processes such as evaporation and dilution. By comparison, TP concentrations are positively correlated with rainfall trend models and correlations are significantly improved when the rainfall time series is lagged by three to four weeks. Taken as a whole, these findings point to mobilization of soil phosphorus by rainfall as a primary source of phosphorus in surface water entering the Reservation and suggest the decrease in
25

•
•
•
phosphorus that occurs as canal water traverses the Reservation from north to south is mainly the result of biological or chemical processes.
Monitoring and research is currently in progress to characterize the spatial and temporal patterns of phosphorus within the surface water of the Reservation and the larger regional watershed. Additional surface water sampling sites are being installed and measurement of water quality parameters has been expanded to include additional nutrients. Digital water level monitoring wells have also been installed throughout the Reservation. Biotic and abiotic parameters, including soil depth and stratigraphy, elevation, and plant community composition, are being measured at each well site. The spatially explicit database developed from the information being gathered will serve to generate specific hypotheses addressing the mechanisms that control the movement of phosphorus within this system .
26

•
•
•
Tables and Figures:
• Water quality sample sites N
+ A Digital monitoring wells 2 0 2 4 Kilometers - Major canals I i
Figure 3-1. Location of digital monitoring wells and water quality sampling sites on the Big Cypress Seminole Indian Reservation.
27

•
•
•
1.4
'L 1.2 C> E 1 en ::J .... 0 0.8 ..r:::. a. en 0 0.6 ..r:::. a.. ro 0.4 (5 I-
0.2
0
1
~ , C> 0.8 E en ::J .... 0 0.6 ..r:::. a. en 0
..r:::. 0.4 a.. ro (5 I- 0.2
0 0 0 ..- ..- C\I C\I C') C') ...". "8; lO lO <D <D I'- I'- co C1> C1> C1> C1> C1> C1> C1> C1> C1> C1> C1> C1> C1> C1> C1> C1> , I I I I I I I , , I I I I , , I c: '3 c: '3 c: '3 c: '3 c: '3 c: '3 c: '3 c: '3 c: ('0 ..., ('0 ..., ('0 ..., ('0 ..., ('0 ..., ('0 ..., ('0 ..., ('0 ..., ('0 ..., ..., ..., ..., ..., ..., ..., ..., ...,
Figure 3~2. Seasonal models of inflow TP concentrations at (a) the north feeder canal and (b) the west feeder canal from 1990 through 1998 .
28

•
•
•
0.6 0.6
..... 0.5 0.5 . 0)
E en
0.4 0.4 ::::J '-
~ 0 ..c. c c.. .~ en 0 0.3 0.3
..c. en a.. (J)
..c. ro (.) - C 0 0.2 0.2 l-
0.1 0.1
0.0 0
1990 1992 1994 1996
Figure 3-3. Comparison of the seasonal model of average TP concentrations in surface water and the 28-day moving average of rainfall within the regional watershed from 1990 through 1998.
29

•
• ~ 0.3 en 2 o -a 0.2 en o .s:: a.. «i 0.1 (5 I-
0~~~~=4~~~~~=~~~~~4
JAN MAR JUN SEP
0.35
0.3
0.25
0.2
0.15 en Q)
.s:: 0.1 g 0.05
~~""""'o
DEC
Figure 3-4.Comparison of the seasonal model of TP concentrations in the north and west feeder canals with the lagged seasonal model of the 28-day moving average of
• daily rainfall within the regional watershed.
30

•
•
•
100 0.7
0.6 80
~ 0.5 l-
~ C> 60 E 0.4 c (J)
.~
"'0 0.3 f/) ·c 40 (J) 0 .c ::c 0.2 0 (.) c
20 0.1
0 0.0
JAN 90 JAN 94 JAN 98
Figure 3-5. Comparison of seasonal model of average CI concentrations in surface water with 28-day moving average of rainfall.
31

•
•
•
~ , 0> E f/)
2 0 .s:: Q. f/) 0 .s:: 0-ro '0 I-
1
0.8
0.6
0.4
0.2
o Jan-90 Jan-92 Jan-94 Jan-96
Figure 3-6. Comparison of model predictions for outflow TP concentrations at the L-28 Interceptor with actual data for the period from January 1996 through December 1998.
32

•
•
•
~Major Canals 'o~1 Phosphorus, ppb II <20
20-50 50 -100 100 - 200 >200
N
+ o 2 4 Kilometers ~I 111111111111111IIIIIIIIIIIII5iiiiiiiiiiiiiiiiiiiiiiili
Figure 3-7. Surface spline of average total phosphorus concentrations from 1990 through 1998 at surface water monitoring sites in the western portion of the Big Cypress Seminole Indian Reservation .
33

• • e
80
II) 60
Q) impoundment
.s=. 0 40 .S
~ 20 Q) "0 ... 0 2 co ~ -20
-40
0 0 ~ ..-0 0 0 0
co -- -- CD co en ~ ~ 0 ..-2> «) --N 10
0 0
~ ~ ~ ~ 0 ~ ~ ..-
0 0 g 0 0 0 0 0 «) -- «) -- --i:O r-- -- .q- .q-.q-
~ ~ ~ 0 N N
~ ~ t:: -- CD --CD co 2> ~ r--0 0 0 0 ..- 0 0 0
Figure 3-8. Water depths measured at six hour intervals by digital monitoring wells located in an impounded forested wetland (Well A), an intact forested slough (Wells B,C), and a former improved pasture that has been impounded by a berm and managed as a natural wetland system since June 2001 (Wells D,E).
34

•
•
•
TP (ppb) CI (ppm)
Inflow 133±11 44.3±1.3
Outflow 110± 9 41.9±O.9
% Change -17% -5%
Table 3-1. Average concentrations (mean±SE) and percent change in total phosphorus (TP) and chloride (CI) between inflows at the west and north feeder canals and outflow at the L-28 interceptor canal during periods when water was flowing from January 1990 through December 1998 .
35

•
•
4. Chemical factors limiting plant growth in historic flow-ways of the Big Cypress Seminole Indian Reservation: The relative roles of [K], [P] and other nutrients.
Overview:
The greater Everglades ecosystem is believed to have been historically a low nutrient system, primarily limited by phosphorus. Largely as a result of agricultural practices within the Everglades Agriculture Area, phosphorus levels entering the Everglades have greatly impaired water quality, resulting in significant changes in native Everglades flora in the sawgrass marsh habitat. To address this problem, one goal of the Comprehensive Everglades Restoration Plan is to improve water quality by meeting the current standard of 10 - 50 ppb of total phosphorus.
The lowest standard for [P] of 10 ppb is based largely on water quality studies conducted within the sawgrass Everglades and may not be directly applicable to the forested Big Cypress Region of the Greater Everglades ecosystem. In the latter there remains a substantial gap in our knowledge with regard to comprehensive water quality studies combined with plant growth responses to different nutrient levels. Preliminary monitOring of water quality in the semi-pristine Kissimmee Billie Slough on the Big Cypress Reservation indicates that potassium, and not phosphorus, may be limiting plant growth within this watershed. If phosphorus uptake by plants is dependent on other nutrient limitations, this may have profound implications for the setting of water quality standards within the region, and for the design of STA's or water polishing cells .
Approach:
We propose to set up a forest stand-level study within the Kissimmee Billie Slough to determine whether potassium is more limiting to plant growth than phosphorus in this system. Measurement of the ability of forested wetlands to absorb phosphorus as measured by supplemental nutrient experiments in situ will also, for the first time, allow an accurate estimation of the ability of impounded forested wetlands to remove nutrients from polluted water within southern Florida. In addition, the field-scale study will be performed in combination with a smaller-scale controlled mesocosm study, where the isolated effects of specific chemical nutrients can be tested. Finally, we propose to expand our current water quality monitoring in the Kissimmee Billie Slough to include three semi-pristine reference sloughs located east of the Kissimmee Billie Slough within the Reservation. Together with historic water quality data, data collected from this monitoring will provide information on the fate of surface water nutrients within the Reservation. We will also develop collaborative arrangements with appropriate agencies to periodically conduct parallel water quality measurements both downstream (Big Cypress National Preserve) and upstream (Okaloacoochee Slough) from the four Reservation monitoring sites. Continuous monitoring of groundwater levels and rainfall will also help to identify nutrient sources and sinks within the Reservation. This information is essential for improving the quality of surface water as it traverses the Reservation and is discharged into the Everglades, and for setting scientifically appropriate nutrient standards for this outfall.
• The following specific studies will be completed as part of this project:
36

•
•
•
1. Effects of in situ addition of nutrients to cypress forest plots will be conducted in the Kissimmee Billie Slough riparian zone. The experiment will incorporate a completely randomized design where nutrient treatments will include P and K amendments, as well as their interaction. Specifically, there will be replicates of four treatments: a control (no nutrient addition), P addition, K addition and P x K addition. Within the Kissimmee Billie Slough riparian zone, 20 m x 20 m cypress forest plots will be chosen for study. An initial ecological characterization of each vegetation stratum (herbaceous, shrub and canopy layers) will be completed for each plot in the early dry season 2002. Concomitantly with this initial assessment, band dendrometers will be placed on representative dormant cypress trees within each plot in order to monitor tree growth over the course of the study. As a supplement to the band dendrometers, diameter at breast height of all canopy trees will also be measured at the beginning and end of the study. Follow-up characterizations of the herbaceous and shrub layers will continue at periodic intervals over the course of the study. To measure abundance, understory and overstory leaf area index will be determined by the line intercept method using an infrared beam in both the dry and wet seasons. In addition, during the wet season, representative canopy foliage will be sampled from each treatment plot and analyzed for nutrient content.
Taken together, these measurements will allow for a determination of nutrient productivity, or the incremental rate of plant biomass increase per unit nutrient in the plant. This is a rigorous measure of the efficiency of nutrient use in the production of plant biomass, and can be determined for several different nutrients, such as phosphorus or potassium productivity .
2. Together with the stand-level study, it is important to have tightly controlled mesocosm studies that will allow for the assessment of the effects of individual nutrients on plant growth. Although the stand-level study provides a high degree of realism, because of its large scale and natural variation in environment conditions there is less direct control over treatments compared to small-scale studies. On the other hand, the smaller scale study has less realism, but provides a high degree of control and allows for the study of several specific chemical nutrients at the same time. These two types of study are highly synergistic and together provide very clear and reliable information on the effects of nutrients on plant growth.
In our current work, we have identified plant bioindicators of hydrology within the Big Cypress region. We propose to conduct an experiment of the effects of differing nutrients on a suite of bioindicator plant species, such as the liverwort Riccia or cypress seedlings. We will establish mesocosms in a replicated experimental design at Florida Atlantic University in Davie. Experimental treatments will include a control, N addition, P addition and K addition, as well as other nutrients (such as Si, Mn or Fe) deemed to be potentially limiting or to have important interactions within the Big Cypress region. Over the course of this study, plant biomass will be assessed via sequential harvests and relative growth rate will be determined. As with the stand level study, plant nutrients will be analyzed and nutrient productivity will be quantified.
3. Monitoring efforts conducted in this study will address water flow, timing and depth of inundation in addition to water quality. Within the Kissimmee Billie Slough and the three reference sloughs to the east, water quality samples will be taken weekly to biweekly during periods of flow and analyzed for nutrients such as TP, TKN, ortho-P, NOx, CI, Si, K, Na, Ca, and Mg. In addition to the existing digital water wells, rainfall loggers will be installed at each of these four sites to provide continuous rainfall data. Monitoring data
37

•
•
•
will be used, together with surface water quality data collected throughout the Reservation, to create GIS maps illustrating the landscape-level patterns of surface water nutrients and the seasonal and historic fluctuations in these patterns. Spatial analysis of this GIS database will be used to develop predictive landscape models of the fate of nutrients in surface waters traversing the Reservation .
38

•
•
•
Literature Cited
Brown, S. 1981. A comparison of structure, primary productivity and transpirations of cypress ecosystems in Florida. Ecological Monographs 51 :403-427.
Brown, S. and R. van Peer. 1989. Response of pond cypress growth rates to sewage effluent application. Wetlands Ecology and Management 1:13-20.
Cole, J.J. and S.G. Fisher. 1979. Nutrient budgets of a temporary pond system. Hydrobiologia 63:213-222.
Duever, M.J. J.E. Carlson and L.A. Riopelle. 1974. Water budgets and comparative study of virgin Corkscrew Swamp. in H.T. Odum and K.C. Ewel, editors. Cypress wetlands for water management, recycling and conservation. Annual Report to the National Science Foundation and the Rockefeller Foundation. Center for Wetlands, University of Florida, Gainesville, FL.
Gorham, E. 1961. Factors influencing supply of major ions to inland waters, with special reference to the atmosphere. Geological Society of America Bulletin 72:795-840.
Hem, J.D. 1989. Study and interpretation of the chemical characteristics of natural water. United States Geological Survey Water Supply Paper 2254.
Likens, G.E. and F. Borman. 1977. Biogeochemistry of a Forested Ecosystem. SpringerVerlag, N.Y. p.146.
South Florida Water Management District. 1998. Feeder canal basin water quality grab sampling survey. Unpublished report.
Urban, N. H., S.M. Davis and N.G. Aumen. 1983. Fluctuations in sawgrass and cattail densities in Everglades Water Conservation Area 2A under varying nutrient, hydrologic and fire regimes. Aquatic Botany 46:203-223.
Vaithiyanathan, P. and C.J. Richardson. 1998. Biogeochemical characteristics of the Everglades sloughs. Journal of Environmental Quality 27:1439-1450.
Waller, B. 1982. Water quality of Everglades National Park, 1959-77, with reference to the effects of water management. United States Geological Survey Water Resources Investigations 82-34 .
39