water rate and revenue analysis final report (october … · city of paso robles final report water...
TRANSCRIPT

Water Rate andRevenue AnalysisFinal ReportCity of Paso Robles
October 22, 2015
City of Paso RoblesDepartment of Public Works
1000 Spring StreetPaso Robles, CA 93446
Prepared Under the Direction ofRoger Null
11-03-15 CC Agenda Item 2 Page 10 of 49

City of Paso RoblesFinal Report
Water Rate and Revenue Analysis
Table of Contents
1 Introduction.......................................................................................................................................... 1
2 Development of Updated Financial Parameters ................................................................................. 32.1 Current and Projected Customer Accounts and Water Demands ............................................ 32.2 Budgeted/Projected Operating Expense................................................................................... 62.3 Projected Capital Improvement and Debt Service Financing Program .................................... 9
3 Projected Revenue Requirements Using Adopted and Proposed Rates ......................................... 12
4 Current and Proposed Water Rates and Rate Structure .................................................................. 154.1 Development of Proposed Rates ............................................................................................ 15
4.1.1 Fixed Monthly Service Charge Discussion ................................................................ 164.1.2 Development of Proposed Usage Charge ................................................................. 20
4.2 Typical Monthly Bills................................................................................................................ 214.3 Comparison of Monthly Bills with Other Communities ............................................................ 224.4 Summary of Proposed Rates .................................................................................................. 24
Tables
Table 1-1 Current Water Rates ..................................................................................................................... 2Table 2-1 Current Water Accounts ............................................................................................................... 4Table 2-2 Projected New Customers and Water Demands.......................................................................... 5Table 2-3 Budgeted and Projected Operating Expenses ............................................................................. 7Table 2-4 Projected Water Capital Improvement Program......................................................................... 11Table 3-1 Projected Revenue Plan – Proposed Rates ............................................................................... 14Table 4-1 Fixed/Variable Cost Revenue Assessment ................................................................................ 18Table 4-2 Proposed Water Rates ............................................................................................................... 21Table 4-3 Illustrative Water Bill Examples .................................................................................................. 22
Figures Figure 2-1 Annual Water Sales ..................................................................................................................... 9Figure 3-1 Projected Water Operations Fund Performance Without Additional Rate Adjustments ........... 12Figure 4-1 Water Operations Fund Fixed Costs ......................................................................................... 17Figure 4-2 Water Rate Comparison ............................................................................................................ 23
Appendices
Appendix A – Miscellaneous Support Material
October 22, 2015 | i11-03-15 CC Agenda Item 2 Page 11 of 49

City of Paso RoblesFinal Report
Water Rate and Revenue Analysis
1 IntroductionThe City of Paso Robles (City) owns and operates approximately 174 miles of waterlines, 4 storage facilities, and 7 booster stations to distribute drinking water throughout the City. The City’s water supply system includes 20 wells that pump groundwater, Salinas River underflow, and surface water from Lake Nacimiento, with a surface water treatment plant that will soon go into operation.
The City’s Water Operations Fund is used to account for the operation and maintenance of the City’s water supply system, including the water production, transmission, and distribution system. The City’s Water Operations Fund, as reported in the City’s “Comprehensive Annual Financial Report” (CAFR) for Fiscal Year ended June 30, 2014,1
operated at $12.1 million in business type activities and has a projected total annual operating expense of $13 million for Fiscal Year 15/16. Revenues are generated primarily from user fees and facility charges.2 Fiscal Year 2014 revenues wereapproximately $9.6 million per year, falling short of meeting annual revenuerequirements.
In early 2007, a water rate increase was proposed particularly to cover the costs associated with the Nacimiento Water Project. Following much community discussionand delays in adoption, a uniform water rate structure went into effect January 1, 2012, with the last annual water rate adjustment scheduled to go into effect on January 1, 2016.
The City last completed a comprehensive financial evaluation of its water utility rates and fees in 2010 and 2009, respectively.3 Based upon the findings and conclusions from those studies, the City adopted updated water rates and fees to improve the financial position and sustainability of the Water Operations Fund. The adopted rate adjustments were driven primarily by the City’s need to increase its ability to provide treated water to its existing customers and fund a phased approach for the financial obligations and operational requirements of the new Nacimiento water supply and other water system reliability improvements. The Water Operations Fund has begun repaying $69.49 million in revenue bond financing for the 2007 Nacimiento Water Project. This financing package was refinanced in 2015 to obtain some long-term cost savings. The City’s annual debt service associated with this 2015 Series A bond package is approximately $4.1 to $4.2 million.
1 The CAFR, prepared annually, provides a complete understanding of the City’s financial affairs. Each year, the CAFR is audited by an independent certified public accounting firm in accordance with generally accepted auditing standards.
2 Facility charges, also referred to as “connection fees,” are charged to new development to ensure that future customers pay their share of system costs, both to recoup costs invested in the existing system and to finance future facilities needed to support growth.
3 “2010 Uniform Water Rate Study”, January 2010 by Kennedy/Jenks Consultants, and “Water Capacity Charge Study”, January 2009, by HF&H Consultants, Inc.
October 22, 2015 | 111-03-15 CC Agenda Item 2 Page 12 of 49

City of Paso RoblesFinal Report
Water Rate and Revenue Analysis
From the prior financial studies, rates and fees were adopted to fund the projected revenue requirements of the Water Operations Fund. The current water rates are shown in Table 1-1. As shown, water rate adjustments are currently scheduled through January 1, 2016. Following the increase in January 2016, all water customers will pay $4.40/HCF for all water usage.
Table 1-1 Current Water Rates
User Class(All Customers)
Usage Charge $/HCF
Current Eff. January 1, 2016
All Water Usage($/HCF) $4.10 $4.40
“HCF” = hundred cubic feet, or 748 gallons.
The City’s current water rate structure is considered an “all variable uniform” water rate structure. That is to say that monthly water bills are based on actual metered usage by customer and that no fixed monthly service fee or minimum bills, nor a tiered rate structure, is now in place. As such, monthly water bills are based solely on actual metered water usefor all customer types.
While many of the key issues facing the City in prior years remain, new conditions affect the City’s ability to meet the Water Operations Fund financial obligations, which has begun to deplete the Water Operations Fund’s cash on hand. Foremost among the financial concerns of the Water Operations Fund is the need to:
Replace the 90 year old 21st Street Reservoir, a 4 million gallon water storage tank that is a critical element of the City’s water utility, holding one-third of the City’s stored water;
Complete the construction of a 2.4 MGD4 seasonal water treatment plant, andbegin to fund its operation later this year;
Design and construct a 4 MGD capacity water treatment plant suited for year-round operations, currently scheduled for FY 20-21;
Add additional operations staff to support the needed increases in treatment plant capacity, and fund the associated increases in power and chemical consumption;
Schedule for and fund the methodical replacement or rehabilitation of aging waterlines, water wells, and booster stations to maintain the reliability of the water system; and
Meet state mandated reductions in water usage in response to California’s drought, and incorporate the implementation of the drought response program into the City’s water system operating plan and budget.
4 “MGD” means “million gallons per day.”
October 22, 2015 | 211-03-15 CC Agenda Item 2 Page 13 of 49
City of Paso RoblesFinal Report
Water Rate and Revenue Analysis
This 2015 water rate and revenue analysis is intended to consider all these factors andthe current financial position of the Water Operations Fund, and to update projections of the level of future water rates. In addition to the development of updated water revenue requirements, this study also reviews the current water rate structure and changes in projected costs that may affect the City’s water facility charges.
The following sections of this study provide the supporting information for the level and timing of potential water rate adjustments that may be needed to meet the current and projected financial requirements and document these findings for a potential adjustment to the City’s water rates and rate structure over the coming years.
2 Development of Updated Financial Parameters The cornerstone to the development of a utility’s financial projection is the assessment of a utility’s projected customers, usage characteristics, and system costs. Much of this information was provided by the City as an extraction of information from its utility billing system, and supporting cost information from City staff.
To meet the objectives of this water rate analysis, new financial data was obtained and integrated into the financial model, and an updated financial projection was developed using the principles and methods contained in American Water Works (AWWA), M-1Manual, Principles of Water Rates, Fees and Charges and the requirements of Proposition 218 (specifically, California Constitution, Article XIIID, section 6) and California Constitution Article X, section 2.5
The proposed water rates are designed to recover the City’s costs of providing service, stabilize revenues, and promote conservation in a manner that fairly and proportionately allocates costs amongst the City’s water customers.
A discussion of this process and our results from the analysis is provided in the following sub-sections.
2.1 Current and Projected Customer Accounts and Water Demands The City accounts for the customer usage and occupancy activity with its utility billing system. This system records and generates utility bills based on each customer’s water usage. As required by the State Department of Water Resources, the City annually publishes a summary of customer characteristics. The customer account data for Calendar Year (CY) 2014 is shown in Table 2-1. The corresponding usage for CY 2014 was 2,539,431 HCF.
5 In conducting this financial review and providing these financial projections, HDR/Water Consultancy is acting in a role other than that of “Municipal Advisor”, as defined by the Securities and Exchange Commission (SEC). The City should consult with its Financial (Municipal) Advisor and Bond Counsel concerning the issuance, timing and structure of any new debt issue.
October 22, 2015 | 311-03-15 CC Agenda Item 2 Page 14 of 49

City of Paso RoblesFinal Report
Water Rate and Revenue Analysis
Table 2-1 Current Water Accounts
Customer Class Accounts
Single Family Residential 8,785
Multi-Family Residential 406
Commercial / Institutional 824
Industrial 74
Landscape Irrigation 440
Other 97
TOTAL 10,626
Source: City Public Works Department, Water Div., 2014 DWR Water Statistics Report (all meter sizes). CY = calendar yearHCF = hundred cubic feet = 748 gallons
To determine a reasonable level of projected growth for this water study, the City reviewed historic growth patterns and correlated this historical pattern with the most recent projections from the City's General Plan. Proceeding in this way, growth is projected to rise and fall in cyclical patterns much like it has historically. The result is an annualized estimate of new accounts through buildout that correlates well with the General Plan values, and should provide a reasonable basis of planning for the five year planning period. A summary of this growth projection is provided in Appendix A.
Since the City’s water rate structure is directly tied to water usage, growth and water usage projections are an integral element of projecting water utility revenues. The projections derived herein include both the projected increase in water demand from growth, along with reductions in water usage to meet the State mandated reductions in response to the California drought. Revenues associated with growth’s payment of water facility charges are also included as non-operating revenues in the cash flow model as they are an important source of water fund revenues, especially in years of high growth6. A summary of the projected growth and water usage values is show inTable 2-2.
6 Water facility charges are reviewed periodically to evaluate their appropriateness. Based on a review of current information, no changes are proposed at this time.
October 22, 2015 | 411-03-15 CC Agenda Item 2 Page 15 of 49

City of Paso RoblesFinal Report
Water Rate and Revenue Analysis
Table 2-2 Projected New Customers and Water Demands
Fiscal Year(FY)
Annual Growth (EMUs)
Projected Water Demand (HCF)
FY 15-16 112 2,072,455 HCF
FY 16-17 151 2,483,881 HCF
FY 17-18 229 2,555,518 HCF
FY 18-19 306 2,625,792 HCF
FY 19-20 469 2,733,655 HCF
FY 20-21 588 2,868,979 HCF
Notes: Projected demand includes existing customer demands plus anticipated growth. Growth is expressed herein as an increase in “equivalent meter units” (EMUs), where 1 EMU is equivalent to the average usage of a base sized ¾-inch or 5/8-inchwater meter used by a single family residential account.7 Projected water usage is in Hundred Cubic Feet (HCF), where 1 HCF is approximately equal to 748 gallons.
Note that the anticipated pace of growth reflected in Table 2-2 is shown through FY 20-21. Projections of customer accounts and water demand projections were prepared to correlate with the buildout population of 42,499 by the year 2045, as noted in the Land Use Element of the City General Plan, dated March 2014. The tables in this water rate study report denote values through FY 20-21, as this time frame incorporates the projected costs of the 21st Street Reservoir replacement, the upcoming 4 MGD water treatment plant expansion project, and is the end of the five year rate study planning horizon. As previously noted, the projection of customer accounts through 2046 is included in Appendix A.
In addition to the projection of new account growth, a critical review of the historical, current and projected water demands was performed in this 2015 rate study, as water usage dramatically affects system costs and revenues. The water demand projection is based on recent planning data, historical/current water billing and system production data, projections of demand reductions in response to the State mandated 28% reduction in monthly water usage as compared to 2013 through the spring of 2016, and other Best Management Practices derived by the California Urban Water Conservation Council (CUWCC) to achieve a long range conservation goal to reduce per capita water use by 20% by 2020, in accordance with the City’s 2010 Urban Water Management Plan (UWMP).
The implications of these factors have been incorporated in the water demand projections shown in Table 2-2 and provide the basis of planning for the projection of water system costs and revenues derived from the sale of water.
7 An equivalent meter is used to account for the typical demands associated with larger meters. A single family residence = 1 equivalent meter. A commercial project would equate to more than one equivalent meter.
October 22, 2015 | 511-03-15 CC Agenda Item 2 Page 16 of 49

City of Paso RoblesFinal Report
Water Rate and Revenue Analysis
Given that new customer account activity and water demand projections can not be derived as precise values, projections used herein should be considered only as estimates to provide a reasonable projection of near-term customer activity. The City routinely evaluates and reconciles this information as appropriate during its rate andbudget review processes.
2.2 Budgeted/Projected Operating ExpenseCosts associated with the management, administration, and operations of the City’s water utility are accounted for in four Organizational Categories. As discussed further in Section 4, approximately 80% of water system’s current operating costs are fixed, and do not vary with the amount of water used. An additional operational category for miscellaneous expenses has been developed herein to capture additional costs that are now or will be required by the Water Operations Fund. These five expense categories are:
Utility Billing and Cashiering is responsible for the billing, accounting, and administration of the Water Operations Fund;
Water Production and Distribution is responsible for the operation, maintenance, and management of the water system. Historically, virtually all of the operational costs of the water utility have been accounted for in this organization;
Water Treatment Operations is a new organization used to account for water treatment related activities, including the new 2.4 MGD seasonal water treatment plant and the forthcoming 4 MGD year-round water treatment operation;
Water Conservation Operations is responsible for the management, administration, and operations of the City’s water conservation programs, rebates, and community engagement activities; and
Miscellaneous Operating Expenses is an operating expense category created to note other cost obligations of the Water Operations Fund. Some of these cost categories are new items, other are ongoing costs that have been extracted from the other four existing operational organizations to promote additional attention and scrutiny. Each of these cost items will be consolidated within the existing four Water Operations Fund Organizations in future budgetary cycles.
The current Water Operations Fund operating budget and five years of projected water utility costs are shown in Table 2-3. As shown, Water Operations Fund operating expenses are projected to have only inflationary oriented increases (3%/yr. for all costs, except power at 4.5%/yr.) until FY 20-21. At that time, an increase in cost is expected as the City expands the use of high quality/reliable Nacimiento surface water supply to meet current and projected needs. This cost increase has been anticipated and programmed for some time as the City proactively pursued this diversification in its water supply portfolio to improve long-term water supply reliability, lessen the extent of groundwater pumping, and maintain safe levels of reserves during peak, high-demand summertime usage for the community. The timing of this change in costs is associated with thechange in water supply operational approach, and the new 4 MGD Nacimiento water treatment plant begins to supply water to the Paso Robles community.
October 22, 2015 | 611-03-15 CC Agenda Item 2 Page 17 of 49

City of Paso RoblesFinal Report
Water Rate and Revenue Analysis
Table 2-3 Budgeted and Projected Operating Expenses
October 22, 2015 | 711-03-15 CC Agenda Item 2 Page 18 of 49

City of Paso RoblesFinal Report
Water Rate and Revenue Analysis
Operating costs represent only a part of the Water Operations Fund requirements. Another element is the need to plan and fund the annual estimate of existing facility “wear and tear”. The wear and tear of existing facilities requires funding for the renewal and replacement of these assets. A common method of estimating an adequate level of funding for “wear and tear” is to fund an amount equal to or greater than annual depreciation expense. The use of depreciation expense is reflective of the value of the City’s assets (i.e. the City’s investment) and depreciation expense reflects the annual amount of those assets losing their useful life from “wear and tear”. Based on the City’s chart of accounts of system assets, the estimated annual depreciation of water utility assets is approximately $1.3 million, increasing to over $1.8 million/year in FY 20-21.
It should be noted that the level of depreciation funding received much discussion during the development and adoption of the water rates in 2010. Given the poor financial condition of the Water Operations Fund at that time, funding depreciation was generally considered unaffordable in the early years of the five-year rate plan, with the expectation that $750,000 could be funded in FY 14-15 and $1.5 Million per year thereafter.
As discussed in later sections of this study, the Water Operations Fund is still unable to fully fund deprecation at this time, suggesting only a modest funding of $400,000 to$700,000/year through FY 18-19, and increasing to a more cost-based level in the latter years of the study. It is recommended the level of depreciation funding (i.e., capital improvements funded on a “pay-as you-go” basis) be revisited in subsequent revenue evaluations and rate studies. This cost-based recovery approach will be particularly important to retain the life expectancy of the newly constructed water treatment plant andreservoir replacement. Failure to adequately fund for capital replacement will simply lead to deferred capital infrastructure and higher overall operating costs and water losses. Depreciation funding is incorporated in the overall projected revenue requirements in a latter section of this report.
In addition to cost considerations, staff has developed and implemented a number of cost control measures as an element of the City’s annual budgeting and performance evaluations to minimize the impact of future increases. Some examples of the water utility’s cost control measures are:
Meter replacement program to reduce unaccounted-for-water;
Incorporated high level of automation at the treatment plant to minimize staffing requirements;
Cross-training of staff to operate the treatment plant during the peak season, then backfill operations staff during the off season;
Conduct annual efficiency audits at pumping facilities, then rehabilitation to reduce energy consumption (with 20-50% of rehabilitation costs through PG&E rebates);
Perform most maintenance and repair work in-house; and
Joint pursuit of Nacimiento full allocation which, if successful, would add more than +2,500 AFY additional entitlement to Lake Nacimiento water at no additional capital cost.
October 22, 2015 | 811-03-15 CC Agenda Item 2 Page 19 of 49

City of Paso RoblesFinal Report
Water Rate and Revenue Analysis
These and other programs and activities will continue to be implemented to improve operational efficiencies of the City’s water utility.
2.3 Projected Capital Improvement and Debt Service Financing Program Utility systems are by nature capital intensive. The City has completed a variety of studies and design evaluations to plan for the necessary system improvements to maintain the reliability of the water system and meet upcoming regulatory requirements. These documents provided much of the basis of planning for the City’s capital improvement program (CIP) for each utility and other City services.
Foremost among the engineering, planning and operational considerations is the need to replace the City’s 90 year old 21st Street Reservoir and integrate the new Nacimiento surface water supply. While the CIP priorities in the 2010 study focused on the construction of a 4 MGD water treatment facility as the initial priority early action item, the financial picture of the Water Operations Fund has not materialized as planned. This reduced financial position was largely due two factors:
The delay in the adoption and implementation of needed rate adjustments (increases), with final rates not being implemented until January 2012, a year later than proposed in the January 2010 report. Since that time, the City has proceeded with a smaller 2.4 MGD seasonal treatment facility that could be funded with cash reserves. This facility is scheduled to be online in late 2015.
Reduced water sales in response to the current drought (See Figure 2-1).
Figure 2-1 Annual Water Sales
2
2.2
2.4
2.6
2.8
3
3.2
3.4
2006 2008 2010 2012 2014
Met
ered
Sal
es, m
illio
ns H
CF
Annual Water Sales
October 22, 2015 | 911-03-15 CC Agenda Item 2 Page 20 of 49

City of Paso RoblesFinal Report
Water Rate and Revenue Analysis
As directed by the City Council, the next priority water system capital improvement is the replacement of the $8 million 21st Street Reservoir. Unfortunately, the financial position of the Water Operations Fund is still inadequate to borrow the funds necessary to replace this reservoir, and therefore it must be constructed with cash from the available funding sources. While further delays in the replacement of this reservoir are less than desirable, the Water Operations Fund’s financial limitations has required deferral of the reservoir replacement until at least FY 17-18, depending on the actual costs incurred over the next several years, the level of revenues derived from additional rate adjustments, and the pace of new growth in Paso Robles.
The City’s current water system CIP is separated into five basic categories. These are: Water Treatment and Supply Project Improvements, Water yard, Well Improvements, Tank/Booster Station/Metering Project Improvements, and Pipeline Improvements. Consistent with the prior financial planning studies, this updated water system capital improvement program is spread out over the City’s projected buildout period as much as possible to minimize near-term ratepayer impact.
As previously discussed, this water rate analysis is designed to review the rate and revenue requirements for the next five years. This time incorporates the projected costs of the 21St Street Reservoir and the upcoming 4 MGD water treatment plant expansion project. The City’s CIP through FY 20-21 is summarized in Table 2-4. A comprehensive listing of the specific projects included in the City’s long-range CIP is provided inAppendix A.
As shown, the two single largest near-term CIP projects are designed to mitigate the risk of the deteriorated 21st Street Reservoir, and continue to improve water supply reliability with the integration of the Nacimiento water supply.
As previously noted, the City’s Water Operations Fund also has an existing debt obligation associated with the revenue bond financing from the 2007 Nacimiento Water Project. This approximately $180 million dollar regional project was designed to bring water from Lake Nacimiento to the City and other San Luis Obispo County water purveyors. The City’s annual debt service obligation associated with its share of this debt is approximately $4.1 to $4.2 million, a substantial obligation for a water utility currently generating approximately $10 million per year.
October 22, 2015 | 1011-03-15 CC Agenda Item 2 Page 21 of 49

City
of P
aso
Rob
les
Fina
l Rep
ort
Wat
er R
ate
and
Rev
enue
Ana
lysi
s
Tabl
e 2-
4 Pr
ojec
ted
Wat
er C
apita
l Im
prov
emen
t Pro
gram
Oct
ober
22,
201
5 |
1111
-03-
15
CC
Age
nda
Item
2
Pag
e 22
of 4
9

City of Paso RoblesFinal Report
Water Rate and Revenue Analysis
3 Projected Revenue Requirements Using Adopted and Proposed RatesTo assess the financial implications of the Water Operations Fund programs and costs, an annualized revenue plan has been prepared. This plan is developed by integrating water system operating and capital costs with projected growth and water demand criteria.
As expected, the results of the revenue plan indicate that additional revenues are needed to meet the current and projected financial obligations of the Water Operations Fund. The financial condition of the City’s water utility without any further rate adjustment beyond the adopted increase in January 2016 is shown in Figure 3-1.
Figure 3-1 Projected Water Operations Fund Performance Without Additional Rate Adjustments
As shown, without additional increases in water rates, water system operating costs will continue to exceed operating revenue, and worsen in the latter years as the City increases use of high quality surface water supply from Nacimiento, and annual operating needs increase to over $21 million. Moreover, as a result of expenses exceeding revenue, the cash reserves available in the Water Operations Fund approach zero in FY 17-18, and only begins to grow based on non-operating revenues from facility charges, a speculative revenue source based on growth uncertainty.
Even with the optimistic growth projections and associated facility charge revenues and other cost-saving steps, by FY 20-21, the Water Operations Fund would be almost $18million short after replacing the aged 21st Street Reservoir and expanding the water treatment plant. Given this financial condition, it is proposed that the 7.3% rate increase($0.30/HCF) scheduled for January 2016 be supplemented with additional annual adjustments thereafter through January 1, 2021.
October 22, 2015 | 1211-03-15 CC Agenda Item 2 Page 23 of 49

City of Paso RoblesFinal Report
Water Rate and Revenue Analysis
To evaluate the magnitude and timing of needed rate adjustments, a projected revenue requirement (financial plan) was prepared using alternative rates to meet the Water Operations Fund’s financial obligations and strengthen the utility’s position for asustainable positive financial performance. Several cash flow evaluations and alternatives were prepared with City staff to balance financial performance with ratepayer impact.
These alternatives varied the capital improvement program needs and phasing, projected growth scenarios, water consumption levels, rate increase levels/phases, and rate structure elements such as fixed monthly service and water usage charges so that short term cash flow obligations were met and debt service coverage ratios were sustained above the level required by the current bond covenants. The resulting revenue plan using the proposed average rates needed to fund the water system costs is shown in Table 3-1.
As shown, annual rate increases are proposed to raise rate-based revenues to the level needed to improve the water utility’s financial performance, provide greater revenue stability, meet the current Nacimiento debt coverage covenant requirements, and position the water utility to potentially issue new debt in future years. The plan includes:
Development of proposed rates through FY 20-21;
Continuation of the current rate structure regarding the uniform basis of charge for all metered water use, rather than adopting a tiered rate or water budget based rate structure;
Inclusion of a small fixed monthly service charge to supplement the water usage charge to help improve the financial stability of the Water Operations Fund; and
Continuation of the currently adopted Water Facility Charge of $23,500 per equivalent meter unit.
Each of these rate and revenue related items are discussed in the following sections.
A cautionary note is warranted regarding the use and development of the financial planning findings. Since the magnitude of anticipated increases may vary based on unforeseen change in costs, demand conditions, or reserve requirements, additional review of cost components, revenue requirements, and debt issuance needs should be made during the annual budget development and review process. Accordingly the level of the required annual rate increases may differ from the rate and revenue projections derived herein based on those annual findings.
A discussion of the City’s current and proposed rates and rate structure is provided in the following sections.
October 22, 2015 | 1311-03-15 CC Agenda Item 2 Page 24 of 49

City
of P
aso
Rob
les
Fina
l Rep
ort
Wat
er R
ate
and
Rev
enue
Ana
lysi
s
Tabl
e 3-
1 Pr
ojec
ted
Rev
enue
Pla
n –
Prop
osed
Rat
es
Oct
ober
22,
201
5 |
1411
-03-
15
CC
Age
nda
Item
2
Pag
e 25
of 4
9
City of Paso RoblesFinal Report
Water Rate and Revenue Analysis
4 Current and Proposed Water Rates andRate StructureAs noted during the conduct of previous financial planning assessments, the City’s customers have benefitted from a low cost water supply and purposefully minimized capital and operational expenditures in order to minimize water rates. With the implementation of the 2010 water rate and revenue plan, the City began a moreproactive plan for long-term reliability and sustained quality of the City’s water system.
The City's present water rates were last adopted in early 2011 to convert from a fixed monthly service charge plus a uniform variable rate structure to an “all variable uniform” rate. The then-current fixed monthly service charge was $18.00 per account, regardless of the customer category or meter size. This fixed charge was put in place in 2008 to provide a stable fixed revenue stream to pay the City’s debt service obligation for the Nacimiento water supply pipeline project. The variable rate, at that time, was a modest $1.32/HCF.
Through the conduct of the financial planning activity during the 2007 to 2008 period, theCity evaluated a variety of tiered water rate options, as this pricing strategy is one of the Paso Robles Urban Water Management Plan and the California Urban WaterConservation Council’s Best Management Practices used to promote water conservation. However, community input at that time suggested a need for further rate simplicity. As such, the fixed monthly service charge was eliminated, and an all variableuniform rate structure (volume-based rate without tiers) was adopted. Charging for water on this consistent pricing basis is also referred to as a “uniform block rate” structure and has been commonly used throughout California and the United States for many years.While that simplified the rate structure, the key disadvantage is it eliminated the revenue stability provided by the fixed charge component. As the drought continued over time, the call for conservation and mandatory cut-backs in use simply eroded the Water Operations Funds revenues at a greater amount than if a fixed monthly service charge component had been maintained on the rate structure. While conservation and efficient use are important, few utilities have rates in place which are 100% consumption based,and if they do, they generally have strong financial reserves (e.g. rate stabilization reserve) to absorb the financial/revenue variability associated with a 100% consumption based rate structure.
The current water rates were previously shown in Table 1-1. Development of the proposed rates is derived in the following subsections.
4.1 Development of Proposed RatesAn increase in water rates is proposed to continue to improve the financial position of the Water Operations Fund over the next five year planning period. While there are often awide range of rate-related strategies that could be used to generate the needed funds and provide additional financial stability, based on the current needs of the Water Operations Fund and the rate and rate structure discussions from the previous planning efforts, the rate alternatives considered in this 2015 water rate study were narrowed to:
October 22, 2015 | 1511-03-15 CC Agenda Item 2 Page 26 of 49

City of Paso RoblesFinal Report
Water Rate and Revenue Analysis
Supplementing the revenues derived from the all-variable uniform rate structure with some form of a fixed monthly service charge, albeit much less than the $18.00 per account charge that was in place in 2008; or
The continuation of the all variable uniform rate structure currently in place.
This Study evaluates both options. As previously noted, the proposed rates were developed using the principles and methods contained in American Water Works (AWWA), M-1 Manual, Principles of Water Rates, Fees and Charges and the requirements of Proposition 218 (specifically, California Constitution, Article XIIID, section 6) and California Constitution Article X, section 2.
Proposition 218 (California Constitution Article XIII D, section 6(b)) has five substantive requirements applicable to the City’s water service fees:
1. revenues derived from the fee must not exceed the funds required to provide the property related service;
2. revenues derived from the fee must not be used for any purpose other than that for which the fee was imposed;
3. the amount of a fee imposed upon any parcel or person as an incident of property ownership must not exceed the proportional cost of the service attributable to the parcel;
4. the fee may not be imposed for a service, unless the service is actually used by, or immediately available to, the owner of the property subject to the fee; and
5. the fee may not be imposed for general governmental services available to the public at large, likes police, fire, ambulance or library services.
Article X, section 2, of the California Constitution prohibits waste of water and encourages conservation, providing that water conservation “be exercised with a view to the reasonable and beneficial use thereof in the interest of the people and for the public welfare of the State’s water resources, and further precludes the “waste or unreasonable use or unreasonable method of use of water.”
4.1.1 Fixed Monthly Service Charge DiscussionBecause a significant portion of most water system expenses is fixed, the cost of supplying water to a community does not correlate directly with the amount of water supplied. For example, labor, infrastructure maintenance, along with meter reading and billing remain fairly steady regardless of monthly variations in water sales.Consequently, the use of fixed charges to collect a portion of a utility’s fixed costs is avery common practice for water utilities as it provides a stable source of revenue. A fixed charge is a flat monthly charge that is billed, regardless of the amount of volumetric consumption. The fixed charge is billed in addition to the charge per unit of metered water use. This has proven particularly beneficial to communities impacted by the drought and the Governor’s mandatory conservation measures. An assessment of the fixed/variable costs is shown graphically in Figure 4-1 and in the top portion of Table 4-1.
October 22, 2015 | 1611-03-15 CC Agenda Item 2 Page 27 of 49

City of Paso RoblesFinal Report
Water Rate and Revenue Analysis
Figure 4-1 Water Operations Fund Fixed Costs
As shown, approximately 80% of the City’s current operating expenses are fixed. This relationship is not unusual for a water utility. This ratio is expected to reduce to approximately 60% fixed in the latter years as a higher percentage of the water system’s operating costs will be directly tied to the treatment of the Nacimento water supply. Notethat these costs do not include capital expenditures, which are largely considered fixed.
$0.0
$5.0
$10.0
$15.0
$20.0
FY 16/17 FY 20/21
Water Fund Fixed Costs
Variable
Fixed Costs
October 22, 2015 | 1711-03-15 CC Agenda Item 2 Page 28 of 49

City
of P
aso
Rob
les
Fina
l Rep
ort
Wat
er R
ate
and
Rev
enue
Ana
lysi
s
Tabl
e 4-
1 Fi
xed/
Varia
ble
Cos
t Rev
enue
Ass
essm
ent
Oct
ober
22,
201
5 |
1811
-03-
15
CC
Age
nda
Item
2
Pag
e 29
of 4
9

City of Paso RoblesFinal Report
Water Rate and Revenue Analysis
In addition, shown at the bottom of Table 4-1 is the development of a proposed monthly fixed charge. For Paso Robles, an initial fixed charge of $5.00 per account per month is proposed. This fixed charge is designed to cover the current cost of utility billing and administration, a service provided by the water utility that is evenly shared amongst all users. The fixed charge is proposed to increase to $10.00 per account per month over a 5-year period to provide additional fixed cost coverage. Incorporating a fixed charge component back into the City’s water rate structure is more reflective of the manner in which the City incurs costs for this utility and would generate a more dependable base of fixed annual revenue of approximately $645,000 to $1,440,000 over the course of the five year planning period. Even at this level of fixed charge, it is well below the proportion of costs the City incurs on a fixed cost basis. A $5.00 per month service charge would cover only 6% of the water utility’s fixed operating costs. In year five of the proposed rate plan, the $10.00/month fixed service charge would still only recover approximately 12% of the water system operating costs, well below the system’s 60% fixed costs.
While fixed revenue benefits a water utility’s financial stability, some may view it as inhibiting a low volume customer’s ability to reduce their water bill and a disincentive counter to conserve water. It is important to remember that fixed costs are incurred, regardless of the volume of water consumed by a customer. The cost to read a meter, send a bill and process it is a customer-related cost which is relatively fixed by the number of customers. Having a fixed-charge rate component is consistent with the way in which the City incurs costs because even when a customer does not consume any water in a month, the utility still incurs costs associated with being ready to serve that customer.
Adopting a rate structure with a fixed charge starting at $5.00 per account per month enables the City’s water utility to recover a portion of the fixed costs incurred for items such as utility billing and administration, while still promoting conservation and leaving the majority of the customer’s water rate to be recovered via the uniform consumption-based usage charge. This approach is consistent with the “pay for what you use” philosophy and would both meet the needs of the City’s water customers and providesadditional funding for the operational needs of the Water Operations Fund and promotion of water conservation. If the fixed charge is not adopted, the variable charge would need to be increased to recover the $645,000 to $1,440,000 in annual revenue anticipated from the proposed fixed charge.
October 22, 2015 | 1911-03-15 CC Agenda Item 2 Page 30 of 49

City of Paso RoblesFinal Report
Water Rate and Revenue Analysis
4.1.2 Development of Proposed Usage ChargeConsistent with the revenue requirements shown in Table 3-1, usage charges were based on projected metered water usage. Projected water usage was based on:
Historic water usage – Records of metered water use by customer account over the years were examined, to derive usage trends in the years leading up to and after active water conservation. Records show that water usage by customer category has fallen sharply in response to the current drought (water sales declined from 3,305,868 HCF in 2007 to less than 2,540,000 HCF in 2014)8 .
New drought-mandated restrictions in water usage – Forecasted water sales take into account Governor Brown’s mandated water use restrictions and the effects of the City’s Water Conservation and Water Shortage Contingency Plan. Table 2-2 and Table 3-1 includes forecasted water sales through FY 20-21, forecasting lower yet water sales for the current year in response to the drought and the City’s water conservation outreach, with gradual increases over the 5 year planning period.
Projections in new accounts over the five year planning period – Projections of customer accounts and water demand correlate with the buildout population of 42,499 by the year 2045, as noted in the Land Use Element of the City General Plan, dated March 2014. That projection through buildout is included in Appendix A. Of importance to this Study is the pace of growth anticipated in the next 5 years. Rather than predict a straight-line growth from now until buildout, projections herein are based on repeat growth cycles similar in pace to what historically has been the case in Paso Robles. Following historic trends suggests the pace of growth in the next 5 years as listed in Tables 2-2 and 3-1.
The City currently charges $4.10 per HCF for all water used, regardless of the type of customer or the amount of water used in any particular billing cycle. Rates are scheduled to increase to $4.40/HCF beginning January 1, 2016.
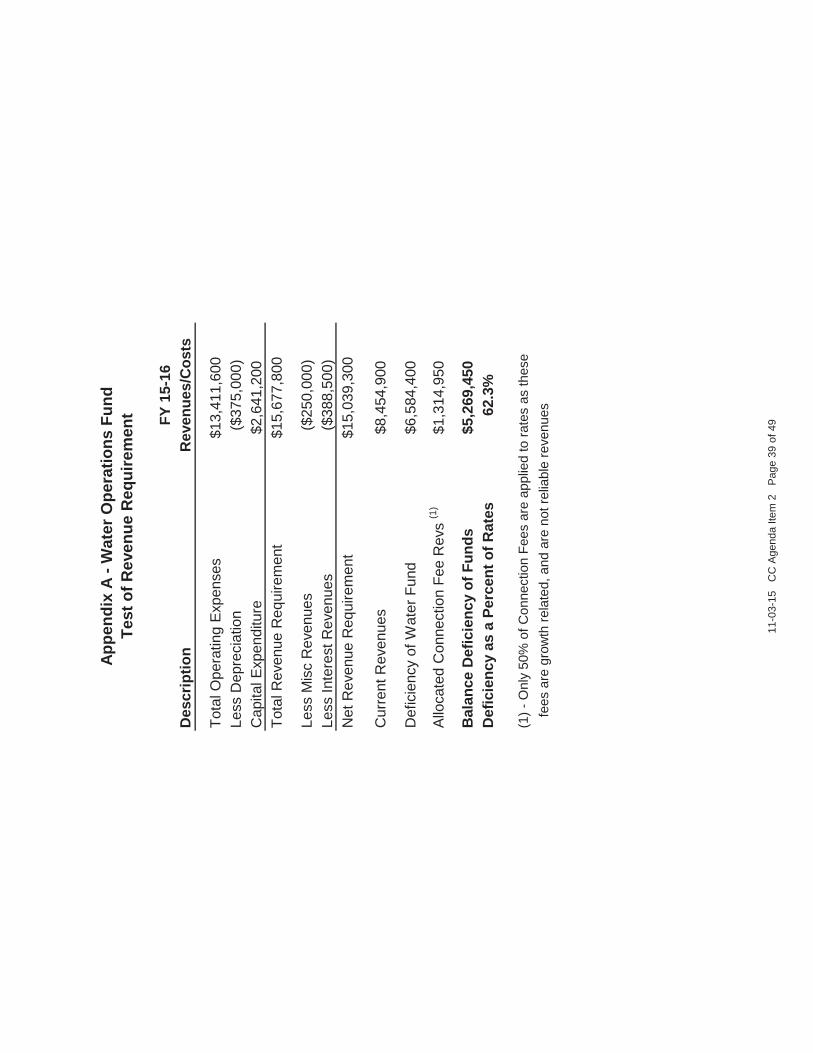
As discussed above and shown in Figure 3-1 and Table 3-1, revenue generated from current usage charges is projected to be insufficient to cover expenses, including debt obligations associated with revenue bond financing of the Nacimiento Water Project and planned capital improvements. This need for additional water utility revenues is further documented in a test of revenue requirements. This FY 15-16 revenue test (shown in Appendix A) documents the shortfall in projected revenues in excess of $5.2 million, suggesting a 62% increase in rates. To generate sufficient revenues to meet this revenue shortfall, an increase in rates is required. The water rates proposed herein are designed to use the Water Operations Fund reserves to maintain a positive fund balance, enabling the City to adopt smaller annual rate increases to minimize the short-term impact on the City’s ratepayers. The proposed rates are scheduled to become effective January 1, 2017, and annually thereafter through 2021, as shown in Table 4-2.
8 City of Paso Robles water statistic reporting by calendar year to California Dept of Water Resources.
October 22, 2015 | 2011-03-15 CC Agenda Item 2 Page 31 of 49

City of Paso RoblesFinal Report
Water Rate and Revenue Analysis
Table 4-2 Proposed Water Rates
User ClassAll Customers
January 1, 2016
(previously adopted
rateincrease)
January 1, 2017
January 1, 2018
January 1, 2019
January 1, 2020
January 1, 2021
All Water Usage ($/HCF) $4.40 $4.83 $5.26 $5.73 $6.14 $6.56
Fixed Charge ($/Account/Month) $0 $5.00 $6.25 $7.50 $8.75 $10.00
Note: Water rate increases to be effective January 1st of each year.
The rates outlined herein are intended to fund the essential water treatment plant,reservoir repair, and other capital needs to serve existing water customers, meet the Water Operations Fund's existing Nacimiento debt service requirements, provide the necessary funds for ongoing system management and operation and continue to improve the financial stability of the Water Operations Fund. To further minimize ratepayer impact, annual increases are suggested to be implemented in January of each year, as this is a seasonal period when water usage is at its lowest.
4.2 Typical Monthly Bills Typical customer bills are often developed to evaluate the impact of a water rate schedule on a utility’s customers. Current typical bills are derived by correlating the current schedule of charges shown in Table 1-1 with the average or typical consumption values for various customer types. Similarly, projected typical bills are calculated by applying the proposed rates to both the water usage charge and adding in the monthly service charge element of the proposed water rate schedule.
Table 4-3 reflects the resulting impact of the proposed rates over the five year planning period. Of course, each customer can affect the change in their individual bill based on a reduction in their monthly water usage. The comparison of typical bills shown herein assumes that there is no change in account-level water usage.
October 22, 2015 | 2111-03-15 CC Agenda Item 2 Page 32 of 49

City of Paso RoblesFinal Report
Water Rate and Revenue Analysis
Table 4-3 Illustrative Water Bill Examples
DescriptionRate as of
January 1, 2016
Typical Bill(January each year)
Proposed RateYear 1(2017)
Proposed RateYear 5(2021)
Single Family (a)
4 HCF (3/4 inch meter)4 X $4.40/HCF = $5.00 +
(4 X $4.83/HCF) =$10.00 +
(4 X $6.56/HCF) =
$17.60 $24.32 $36.24
9 HCF (3/4 inch meter)9 X $4.40/HCF = $5.00 +
(9 X $4.83/HCF) =$10.00 +
(9 X $6.56/HCF) =
$39.60 $48.47 $69.04
14 HCF (3/4 inch meter)14 X $4.40/HCF = $5.00 +
(14 X $4.83/HCF) =$10.00 +
(14 X $6.56/HCF) =
$61.60 $72.62 $101.84
Commercial (b)
15 HCF (3/4 inch meter)15 X $4.40/HCF = $5.00 +
(15 X $4.83/HCF) =$10.00 +
(15 X $6.56/HCF) =
$66.00 $77.45 $108.40
50 HCF (1 inch meter) 50 X $4.40/HCF = $5.00 +
(50 X $4.83/HCF) =$10.00 +
(50 X $6.56/HCF) =
$220.00 $246.50 $338.00
Notes: (a) Where 4 units is the 1st quartile, 9 is the average, and 14 the 75th percentile (3/4” meters).(b) Where 15 units is the average and 60 is the 90th percentile (3/4” & 1” meters).
4.3 Comparison of Monthly Bills with Other CommunitiesIn addition to the development of typical bills for City customers, Figure 4-2 provides a comparison of the City’s current and proposed monthly single-family bill with other local communities in San Luis Obispo County. The comparison is based on a monthly water usage of 5 HCF to represent the lower 25% of the City’s single family customers, and 15HCF to demonstrate the impact for the upper 25% of the single family accounts.
As shown, there is a wide range of charges among the surveyed communities. The City’s current charges are in the low-medium range of the estimated bills. When comparing the proposed future rates in Paso Robles with the other communities’ current rates, the City remains in the medium range for the small water user, and the higher range for the larger water users. Of course, it is reasonable to assume that all of these
October 22, 2015 | 2211-03-15 CC Agenda Item 2 Page 33 of 49

City of Paso RoblesFinal Report
Water Rate and Revenue Analysis
communities will likely increase water rates between now and 2021, suggesting the City should remain in the low to medium range for all customer types throughout the five year planning period. A compilation of the water rates and rate structures for these communities is provided in Appendix A. Note that all of these agencies include a fixed charge component in its current water rate structure.
It should be noted that this rate survey does not provide the full picture of the utility’s position. For example, in addition to water rate increases that are in process or will be proposed, agencies also may have varying water supply program cost, quality, and reliability issues or objectives, and there is often a wide range of variance in local level of service, capital reinvestment, and preventive maintenance considerations. Given the current condition and direction of the City’s water utility and water resource requirements in the County, the City’s water rates are well in line with other local communities.
Figure 4-2 Water Rate Comparison
October 22, 2015 | 2311-03-15 CC Agenda Item 2 Page 34 of 49

City of Paso RoblesFinal Report
Water Rate and Revenue Analysis
4.4 Summary of Proposed RatesThe proposed rates are intended to fund the essential water treatment plant and other capital improvements needed to serve existing water customers, meet the Water Operations Fund's debt service requirements, fund planned capital projects, provide the necessary funds for ongoing system management and operation and return the Water Operations Fund to a desired level of financial stability. With current (FY 15-16) total Water Operations Fund revenues at approximately $11 million and projected operating costs exceeding $21 million in five years, an increase in rates is essential. The proposed rates are designed to meet this revenue shortfall, while minimizing the short-term impact on the City’s customers.
Limited revisions are proposed to the City’s existing rate structure with the inclusion of a nominal level of fixed revenue. This fixed revenue source is proposed to improve the financial stability of the Water Operations Fund during these continued times of economic uncertainty and need for the significant capital improvements and projects identified in the City’s capital improvement program. Since revenues derived from the proposed rates structure are predominately based on customer usage, the City’s water rates should continue to encourage water conservation.
In addition to the rate-related adjustments provided herein, the City should plan for the methodical review of system costs, water demands, and utility rates. Much of this work can be incorporated as an element of the annual budget process as additional information is being developed and evaluated. For future rate studies, the City may wish to also consider:
Modifying the current water usage component of the water rate structure to consider the adoption of tiered rates or budget based rates, as both structures promote additional water conservation and recover the incremental costs of more expensive water in the rate structure;
Reassessing the magnitude of the fixed charge currently proposed;
Using debt financing in lieu of pay as you go for some of the larger capital projects if available and rates are set at a level to support the borrowing and repayment of the debt; and
Developing a new Recycled Water Fund and enterprise or integrating the future recycled water program as an additional water supply element of the Water Operations Fund.
October 22, 2015 | 2411-03-15 CC Agenda Item 2 Page 35 of 49

Appendix A – Miscellaneous Support Material
11-03-15 CC Agenda Item 2 Page 36 of 49

Appe
ndix
A: 2
015
Wat
er S
yste
m G
row
th P
roje
ctio
nsFi
scal
Year
14/1
516
/17
18/1
920
/21
22/2
324
/25
26/2
728
/29
Popu
latio
n Pr
ojec
tion
(a)
32,3
0034
,400
Num
ber o
f EM
U's
per
Yea
r78
112
151
229
306
469
588
588
8412
016
222
154
154
154
1C
umul
ativ
e EM
Us
13,5
8713
,699
13,8
5014
,080
14,3
8514
,854
15,4
4216
,031
16,1
1516
,235
16,3
9816
,619
17,1
6017
,701
18,2
42
Adju
sted
Pop
ulat
ion
Base
d on
EM
U P
ace
of G
row
th30
,556
30,7
0930
,915
31,2
2731
,644
32,2
8533
,089
33,8
9334
,008
34,1
7334
,394
34,6
9735
,436
36,1
7536
,914
Fisc
alYe
ar29
/30
30/3
132
/33
34/3
536
/37
38/3
940
/41
42/4
344
/45
Popu
latio
n Pr
ojec
tion
(a)
37,7
0039
,900
41,9
0042
,499
Num
ber o
f EM
U's
per
Yea
r54
132
932
932
932
932
929
329
329
329
329
387
8787
8787
Cum
ulat
ive
EMU
s18
,783
19,1
1219
,441
19,7
7020
,099
20,4
2820
,721
21,0
1421
,307
21,5
9921
,892
21,9
7922
,066
22,1
5322
,240
22,3
26
Adju
sted
Pop
ulat
ion
Base
d on
EM
U P
ace
of G
row
th37
,653
38,1
0338
,552
39,0
0139
,451
39,9
0040
,300
40,7
0041
,100
41,5
0041
,900
42,0
1842
,137
42,2
5642
,374
42,4
93
(a)S
ourc
e:Ci
tyPl
anni
ngDe
pt,2
014
11-0
3-15
C
C A
gend
a Ite
m 2
P
age
37 o
f 49

Des
crip
tion
FY 2
015-
16FY
201
6-17
FY 2
017-
18FY
201
8-19
FY 2
019-
20FY
202
0-21
Rev
enue
sC
onsu
mpt
ion/
Usa
ge R
even
ues
$8,4
54,9
00$1
0,49
0,20
0$1
0,79
2,80
0$1
1,08
9,60
0$1
1,54
5,10
0$1
2,11
6,60
0Fi
xed
Mon
thly
Ser
vice
Cha
rges
$0$0
$0$0
$0$0
Mis
c. R
even
ues
$250
,000
$250
,000
$250
,000
$250
,000
$250
,000
$250
,000
Tota
l Ope
ratin
g R
even
ues
$8,7
54,9
00$1
0,74
0,20
0$1
1,04
2,80
0$1
1,33
9,60
0$1
1,79
5,10
0$1
2,36
6,60
0
Ope
ratin
g Ex
pens
esU
tility
Bill
ing
and
Adm
inis
tratio
n$6
67,1
00$6
89,5
00$7
16,2
00$7
37,7
00$8
01,5
00$8
25,6
00W
ater
Pro
duct
ion
and
Dis
tribu
tion
$5,1
99,5
30$5
,109
,100
$5,3
08,6
00$5
,521
,600
$5,7
55,4
00$5
,342
,400
Wat
er T
reat
men
t Ope
ratio
ns$1
,082
,100
$1,3
57,9
00$1
,405
,600
$1,4
55,0
00$1
,506
,200
$3,2
06,8
00W
ater
Con
serv
atio
n O
pera
tions
$294
,500
$303
,400
$312
,500
$321
,800
$331
,500
$341
,400
Mis
cella
neou
s C
apita
l$2
62,0
00$1
06,0
90$1
09,2
73$1
12,5
51$1
15,9
27$1
19,4
05G
roun
dwat
er M
anag
emen
t Sus
tain
abili
ty$5
00,0
00$5
00,0
00$5
00,0
00$3
00,0
00$3
00,0
00$3
00,0
00R
egio
nal N
aci C
apita
l Out
lay/
Res
erve
$200
,000
$206
,700
$208
,500
$209
,900
$211
,000
$212
,000
Reg
iona
l Nac
i O&
M C
ost S
hare
$1,0
94,4
00$1
,174
,500
$1,2
16,9
00$1
,260
,800
$1,3
06,4
00$4
,922
,400
Exi
stin
g N
acim
ient
o P
ipel
ine
Deb
t Ser
vice
$4,2
00,0
00$4
,200
,000
$4,2
00,0
00$4
,200
,000
$4,2
00,0
00$4
,200
,000
Dep
reci
atio
n E
xpen
se$3
75,0
00$4
33,5
00$4
75,2
00$6
78,8
00$1
,615
,200
$1,8
61,7
00To
tal O
pera
ting
Expe
nses
$13,
411,
600
$14,
080,
700
$14,
452,
800
$14,
798,
200
$16,
143,
100
$21,
331,
700
Net
Ope
ratin
g R
even
ue($
4,65
6,70
0)($
3,34
0,50
0)($
3,41
0,00
0)($
3,45
8,60
0)($
4,34
8,00
0)($
8,96
5,10
0)
Non
-Ope
ratin
g R
even
ue (E
xpen
se)
Inte
rest
Rev
enue
$388
,500
$260
,100
$214
,800
$26,
700
$99,
300
$6,7
00W
ater
Con
nect
ion
Fee
Rev
enue
s$2
,629
,900
$3,5
48,3
00$5
,385
,100
$7,1
80,2
00$1
1,02
0,70
0$1
3,82
6,70
0To
tal N
on-O
p R
even
ues/
Expe
nses
$3,0
18,4
00$3
,808
,400
$5,5
99,9
00$7
,206
,900
$11,
120,
000
$13,
833,
400
Net
Inco
me
Bef
ore
Cap
ital A
ctiv
ity
($1,
638,
300)
$467
,900
$2,1
89,9
00$3
,748
,300
$6,7
72,0
00$4
,868
,300
Cap
ital E
xpen
ditu
res
$2,6
41,2
00$1
,977
,800
$8,4
62,1
00$1
,326
,300
$9,8
60,5
00$2
2,81
4,30
0
Net
Cha
nge
in F
unds
Ava
il. A
fter C
apita
l Act
ivity
($4,
279,
500)
($1,
509,
900)
($6,
272,
200)
$2,4
22,0
00($
3,08
8,50
0)($
17,9
46,0
00)
Beg
inni
ng C
ash
Bal
ance
$12,
951,
000
$8,6
71,5
00$7
,161
,600
$889
,400
$3,3
11,4
00$2
22,9
00En
ding
Cas
h B
alan
ce$8
,671
,500
$7,1
61,6
00$8
89,4
00$3
,311
,400
$222
,900
($17
,723
,100
)
Deb
t Cov
erag
e R
atio
(Inc
lude
s C
onne
ctio
n Fe
es (N
aci D
ebt))
0.70
1.21
1.63
2.05
3.00
2.60
Deb
t Cov
erag
e R
atio
(Exc
lude
s C
onne
ctio
n Fe
e R
evs)
0.07
0.37
0.35
0.34
0.37
-0.6
9
Des
crip
tion
Pro
pose
d U
sage
Rat
e In
crea
se (A
dopt
ed th
roug
h FY
15-1
6)7.
3%0.
0%0.
0%0.
0%0.
0%0.
0%
Pro
pose
d B
ase
Leve
l Fix
ed R
ate
($/A
ccou
nt/M
onth
)$0
.00
$0.0
0$0
.00
$0.0
0$0
.00
$0.0
0P
ropo
sed
Ave
rage
Usa
ge U
nit R
ate
($/H
CF)
$4.4
0$4
.40
$4.4
0$4
.40
$4.4
0$4
.40
Gro
wth
Bas
ed C
hang
es in
Acc
ount
s/D
eman
dsN
umbe
r of W
ater
Met
ers/
Acc
ount
s10
,639
10,7
5710
,936
11,1
7411
,539
11,9
97N
umbe
r of E
quiv
alen
t Wat
er M
eter
s (C
apac
ity B
asis
)11
,840
11,9
9112
,221
12,5
2612
,995
13,5
83In
crea
se in
Num
ber o
f Equ
ival
ent M
trs/Y
r11
215
122
930
646
958
8
Net
Wat
er C
onsu
mpt
ion/
Sale
s (H
CF)
2,07
2,45
52,
483,
881
2,55
5,51
82,
625,
792
2,73
3,65
52,
868,
979
Net
Wat
er S
ales
/Con
sum
ptio
n (A
cre
Feet
)4,
758
5,70
2
5,
867
6,02
8
6,
276
6,58
6
Not
es: F
ixed
reve
nues
onl
y in
pla
ce fo
r 6 m
onth
s, b
egin
ning
in F
Y 1
6-17
.
Tim
ing
of K
ey C
IP -
21S
t Res
ervo
ir in
FY
17-
18, n
ew W
TP in
FY
20-
21
Dep
reci
atio
n - B
ased
on
orig
inal
cos
ts, d
epre
ciat
ion
for n
ew a
bove
gro
und
asse
ts fu
lly fu
nded
, ful
l pip
elin
e fu
ndin
g be
gins
in F
Y 1
9-20
, 25%
unt
il th
en.
App
endi
x A
- Pr
ojec
ted
Rev
enue
Pla
n W
ithou
t Fur
ther
Rat
e A
djus
tmen
ts
Prop
osed
Rat
es a
nd P
roje
cted
Cha
nges
in A
ccou
nts
and
Wat
er U
sage
11-0
3-15
C
C A
gend
a Ite
m 2
P
age
38 o
f 49
FY 1
5-16
Des
crip
tion
Rev
enue
s/C
osts
Tota
l Ope
ratin
g Ex
pens
es$1
3,41
1,60
0Le
ss D
epre
ciat
ion
($37
5,00
0)C
apita
l Exp
endi
ture
$2,6
41,2
00To
tal R
even
ue R
equi
rem
ent
$15,
677,
800
Less
Mis
c R
even
ues
($25
0,00
0)Le
ss In
tere
st R
even
ues
($38
8,50
0)N
et R
even
ue R
equi
rem
ent
$15,
039,
300
Cur
rent
Rev
enue
s$8
,454
,900
Def
icie
ncy
of W
ater
Fun
d$6
,584
,400
Allo
cate
d C
onne
ctio
n Fe
e R
evs
(1)
$1,3
14,9
50
Bal
ance
Def
icie
ncy
of F
unds
$5,2
69,4
50D
efic
ienc
y as
a P
erce
nt o
f Rat
es62
.3%
(1) -
Onl
y 50
% o
f Con
nect
ion
Fees
are
app
lied
to ra
tes
as th
ese
fe
es a
re g
row
th re
late
d, a
nd a
re n
ot re
liabl
e re
venu
es
Appe
ndix
A -
Wat
er O
pera
tions
Fun
dTe
st o
f Rev
enue
Req
uire
men
t
11-0
3-15
C
C A
gend
a Ite
m 2
P
age
39 o
f 49

PUBLISHED WATER RATES FOR SELECT PROVIDERS IN SAN LUIS OBISPO COUNTYCompiled September 30, 2015
A 111-03-15 CC Agenda Item 2 Page 40 of 49

PUBLISHED WATER RATES FOR SELECT PROVIDERS IN SAN LUIS OBISPO COUNTYCompiled September 30, 2015
A 2
City of San Luis Obispo
Current Water Rates
Effective 7/1/15 The City’s monthly charge per billing unit: (1 unit = 100 cubic feet = 748 gallons)
AllCustomers Inside City Outside City
0 to 8 units $6.92/unit + $0.98/unit Drought Surcharge
$13.84/unit + $1.96/unit Drought Surcharge
9+ units $8.65/unit + $1.23/unit Drought Surcharge
$17.30/unit + $2.46/unit Drought Surcharge
Base fee $7.63 + $0.37 Drought Surcharge $15.26
New rate structure will be reflected on customer water billings after the first complete billing cycle after the July 1st effective date.
A 5% utility users tax is applied to the water portion of the bill.
Atascadero Mutual Water Company
Minimum Rate per Meter Size:
Meter Size Water Rates 5/8 inch meter $ 18.00
3/4 inch meter $ 18.00
1 inch $23.001½ inch $ 30.002 inch $ 46.003 inch $172.004 inch $218.006 inch $344.00HydrantMeter $ 57.00
2,000 gallons will be included in these monthly minimum rates.
11-03-15 CC Agenda Item 2 Page 41 of 49

PUBLISHED WATER RATES FOR SELECT PROVIDERS IN SAN LUIS OBISPO COUNTYCompiled September 30, 2015
A 3
Charges For Water Consumed (includes Drought Rates)
3,000 to 12,000 gallons $2.10 per thousand gallons 13,000 to 25,000 gallons $3.25 per thousand gallons 26,000 to 50,000 gallons (non-SFR) $4.80 per thousand gallons 26,000 to 50,000 gallons (SFR) $5.25 per thousand gallons > 50,000 gallons (non-SFR) $5.50 per thousand gallons 51,000 - 75,000 gallons (SFR) $6.50 per thousand gallons 76,000 to 100,000 gallons (SFR) $8.00 per thousand gallons
> 100,000 gallons (SFR) $10.00 per thousand gallons
Properties in pumping-surcharge areas pay an additional 15%
Mobile Home Parks, Apartment: Number of units X 14.00 per unit (includes 2,000 gallons per unit/month) Motels RV Parks: Number of units x 5.20 per unit (includes 1,000 gallons per unit/month) More than one residence on one meter: $14.00 per house (includes 2,000 gallons per unit/month).
Water Project (NWP) Surcharge
$2.50 per month charged to every meter/service except Fire Lines and accounts on standby.
Standby Service
Meters that qualify for standby service will be charged $10.00 per month (Available after 2 months of no usage. Standby charge starts on the 3rd month.)
City of Pismo Beach
11-03-15 CC Agenda Item 2 Page 42 of 49

PUBLISHED WATER RATES FOR SELECT PROVIDERS IN SAN LUIS OBISPO COUNTYCompiled September 30, 2015
A 4
City of Arroyo Grande
City of Grover Beach
11-03-15 CC Agenda Item 2 Page 43 of 49

PUBLISHED WATER RATES FOR SELECT PROVIDERS IN SAN LUIS OBISPO COUNTYCompiled September 30, 2015
A 5
Cambria Community Services District
Base Plus11-03-15 CC Agenda Item 2 Page 44 of 49

PUBLISHED WATER RATES FOR SELECT PROVIDERS IN SAN LUIS OBISPO COUNTYCompiled September 30, 2015
A 6
City of Morro Bay
Oceano Community Services District
11-03-15 CC Agenda Item 2 Page 45 of 49

PUBLISHED WATER RATES FOR SELECT PROVIDERS IN SAN LUIS OBISPO COUNTYCompiled September 30, 2015
A 7
Nipomo Community Services District
11-03-15 CC Agenda Item 2 Page 46 of 49

Appe
ndix
AW
ater
Fund
Capi
talI
mpr
ovem
entP
rogr
am(C
IP)
Proj
ect
FY20
1516
FY20
1617
FY20
1718
FY20
1819
FY20
1920
FY20
2021
FY20
2122
FY20
2223
FY20
2324
FY20
2425
FY20
2526
FY20
2627
FY20
2728
FY20
2829
FY20
2930
FY20
3031
FY20
3132
FY20
3233
FY20
3334
FY20
3435
FY20
3536
Wat
erTr
eatm
enta
ndSu
pply
1Ph
ase
I2.
4M
GDFa
cilit
y$2
,060
,000
2Ph
ase
IIEx
pand
to4
MGD
$8,6
11,6
00$2
0,69
6,50
0
3Ac
quire
Add'
lNac
iWat
er,a
ndpl
aceh
olde
rfor
6m
gdW
TPca
paci
ty$8
,179
,300
$8,4
24,7
00$1
7,35
4,90
04
Plan
ned
trea
tmen
tpla
ntre
habs
$3,0
25,0
00$3
,721
,000
$2,0
60,0
00$0
$0$0
$8,6
11,6
00$2
0,69
6,50
0$0
$0$0
$0$0
$0$0
$3,0
25,0
00$8
,179
,300
$8,4
24,7
00$1
7,35
4,90
0$0
$0$0
$3,7
21,0
00
Wat
erYa
rd
5Re
plac
eCi
ty's
corp
orat
ion
yard
forp
ublic
wor
ksop
erat
ions
.O
neth
irdof
cost
allo
cate
dto
Wat
erDe
pt$5
,009
,000
6W
ater
Yard
sche
dule
dre
hab
/cod
eco
mpl
ianc
e$5
00,0
00$1
,232
,100
Subt
otal
Wat
erYa
rd=
$0$0
$0$0
$0$0
$0$5
00,0
00$0
$0$0
$5,0
09,0
00$0
$0$0
$0$0
$0$1
,232
,100
$0$0
7An
nual
wel
lreh
abili
tatio
n$2
50,2
90$2
57,7
99$2
65,5
33$2
73,4
99$2
81,7
04$2
90,1
55$2
98,8
59$3
07,8
25$3
17,0
60$3
26,5
72$3
36,3
69$3
46,4
60$3
56,8
54$3
67,5
59$3
78,5
86$3
89,9
44$4
01,6
42$4
13,6
91$4
26,1
02$4
38,8
85$4
52,0
52
8N
eww
elld
rillin
gpr
ogra
m$8
60,9
12$1
,058
,813
$250
,300
$257
,800
$265
,500
$273
,500
$281
,700
$290
,200
$1,1
59,8
00$3
07,8
00$3
17,1
00$3
26,6
00$3
36,4
00$3
46,5
00$3
56,9
00$1
,426
,400
$378
,600
$389
,900
$401
,600
$413
,700
$426
,100
$438
,900
$452
,100
921
stSt
reet
Rese
rvoi
rRep
air/
Repl
acem
ent
$1,3
36,7
34$7
,802
,071
10N
ewM
ain
East
Zone
2.0
MG
Stor
age
$7,9
46,8
89
11W
ater
Tank
sCo
atin
g$3
0,90
0$3
1,80
0$3
2,80
0$3
3,80
0$3
4,80
0$3
5,80
0$3
6,90
0$3
8,00
0$3
9,10
0$4
0,30
0$4
1,50
0$4
2,80
0$4
4,10
0$4
5,40
0$4
6,70
0$4
8,10
0$4
9,60
0$5
1,10
0$5
2,60
0$5
4,20
0$5
5,80
0
12W
ater
Met
ers
ongo
ing
met
erre
plac
emen
tpro
gram
ofth
epr
opos
edm
eter
read
ing
devi
ces
$42,
436
$43,
709
$45,
020
$46,
371
$47,
762
$49,
195
$50,
671
$52,
191
$53,
757
$55,
369
$57,
030
$58,
741
$60,
504
$62,
319
$64,
188
$66,
114
$68,
097
$70,
140
$72,
244
$74,
412
13Ta
nkre
hab
$950
,078
$1,0
69,3
21$1
,134
,442
$1,2
76,8
25$3
0,90
0$1
,411
,000
$7,8
78,6
00$7
8,80
0$8
1,20
0$8
3,60
0$8
6,10
0$1
,038
,700
$91,
300
$94,
100
$96,
900
$1,1
69,2
00$1
02,8
00$1
,240
,300
$109
,000
$112
,300
$115
,700
$1,3
96,0
00$1
22,7
00$8
,073
,300
$130
,200
142nd
St.
and
3rd S
t. be
twee
n O
live
St.
and
Spr
ing
St.
$646
,108
15Hi
ghla
ndPa
rkDr
.$5
48,3
92
1612
th S
t. Zo
ne E
xpan
sion
nea
r 4th
St.
$437
,068
1714
thS
t. an
d21
stS
t.be
twee
n P
ine
St.
and
Riv
ersi
deA
ve$4
10,8
20
1817
th S
t. be
twee
n O
live
St.
and
Spr
ing
St.
$376
,269
199th
St.
betw
een
Oliv
e S
t. an
d S
prin
g S
t.$3
49,8
93
208th
St.
betw
een
Oliv
e S
t. an
d S
prin
g S
t.$3
44,4
00
2119
th S
t. an
d 20
th S
t. be
twee
n Pa
rk S
t. an
d Sp
ring
St.
$252
,113
2226
th S
t. be
twee
n V
ine
St.
and
Spr
ing
St.
$257
,066
235th
St.
and
6th S
t. be
twee
n O
ak S
t. an
d S
prin
g S
t.$2
17,7
10
24Sp
ring
St.n
orth
of36
th S
t.$1
95,8
44
2515
th S
t. an
d R
ailro
ad S
t., e
ast o
f Pin
e St
.$1
68,4
98
26W
estF
airv
iew
Ln.
$76,
989
27Bl
ock
AM
ain
Repl
acem
ent
$300
,000
$309
,000
$318
,270
$327
,818
$337
,653
$761
,151
$783
,985
$807
,505
$831
,730
$856
,682
28O
live
St.a
ndSp
ring
St.b
etw
een
19th
St.
and
36th
St.
$3,0
60,7
35
29Cr
esto
nRd
.,Sa
nte
FeAv
e.an
dSa
nAu
gust
inDr
.$1
,283
,315
30Pa
cific
Ave.
betw
een
Mer
ryHi
llRd
.&O
live
St.
$1,0
77,0
43
31Hi
llcre
stDr
.Bet
wee
n15
thS
t. an
d W
est 1
7th S
t.$5
74,8
43
3212
thSt
.bet
wee
nSp
ring
St.a
ndRi
vers
ide
Ave.
$571
,832
3320
th S
t. be
twee
n O
live
St.
and
Spr
ing
St.
$489
,485
34O
akSt
.bet
wee
n4th
St.
and
7th S
t.$4
35,6
70
3515
th,1
6th,
Filb
ert,
Terr
ace
Hill
$384
,857
36M
erry
Hill
Rd.b
etw
een
12th
St.
and
Hillc
rest
Dr.
$375
,235
3718
th S
t. be
twee
n Fi
lber
t St.
and
Che
stnu
t St.
$314
,982
38Bl
ock
BM
ain
Repl
acem
ent
$1,0
16,0
01$1
,046
,481
$1,0
77,8
75$1
,110
,211
$1,1
43,5
18$1
,177
,823
$1,2
13,1
58$1
,249
,553
$1,2
87,0
39$1
,325
,651
39Th
unde
rbird
wel
lfie
ldto
Sout
hRi
verR
d.Ch
arol
ais
Rd.i
nter
sect
ion
$2,4
77,0
48
40Ai
rpor
tloo
pbe
twee
nTo
wer
25w
ella
ndAe
rote
chCe
nter
Way
41Dr
yCr
eek
Rd.a
ndGo
lden
Hill
Rd.
42Bl
ock
CM
ain
Repl
acem
ent
$2,0
40,1
23
43M
ajor
wat
erut
ility
repa
irse
ason
s$3
,063
,853
$3,3
47,9
55$3
,768
,152
$4,1
17,5
62$3
00,0
00$3
09,0
00$3
18,0
00$9
74,0
00$8
86,0
00$1
,744
,000
$1,7
57,0
00$1
,604
,000
$4,2
30,0
00$1
,873
,000
$2,1
24,0
00$5
,709
,000
$4,1
71,0
00$2
,154
,000
$2,1
35,0
00$5
,471
,000
$1,6
25,0
00$1
,602
,000
$5,4
43,0
00$0
$4,5
17,0
00
Tota
ls=
$2,6
41,2
00$1
,977
,800
$8,4
62,1
00$1
,326
,300
$9,8
60,5
00$2
2,81
4,30
0$3
,002
,900
$3,4
50,5
00$4
,638
,400
$2,2
93,7
00$2
,557
,300
$12,
233,
700
$4,6
30,7
00$7
,845
,700
$10,
801,
900
$14,
397,
900
$19,
497,
200
$3,4
11,7
00$7
,223
,900
$8,5
12,2
00$8
,820
,300
Subt
otal
Wel
lIm
prov
emen
ts=
Tank
,Boo
ster
Stat
ion
and
Met
erin
gPr
ojec
ts
Subt
otal
Tank
and
Boos
terS
tatio
nPr
ojec
ts=
Pipe
line
Impr
ovem
ents
Subt
otal
Wat
erTr
eatm
enta
ndSu
pply
=
Wel
lIm
prov
emen
ts
Subt
otal
Pipe
line
Impr
ovem
ents
=
11-0
3-15
C
C A
gend
a Ite
m 2
P
age
47 o
f 49

Appe
ndix
AW
ater
Fund
Capi
talI
mpr
ovem
entP
rogr
am(C
IP)
Proj
ect
Wat
erTr
eatm
enta
ndSu
pply
1Ph
ase
I2.
4M
GDFa
cilit
y
2Ph
ase
IIEx
pand
to4
MGD
3Ac
quire
Add'
lNac
iWat
er,a
ndpl
aceh
olde
rfor
6m
gdW
TPca
paci
ty4
Plan
ned
trea
tmen
tpla
ntre
habs
Wat
erYa
rd
5Re
plac
eCi
ty's
corp
orat
ion
yard
forp
ublic
wor
ksop
erat
ions
.O
neth
irdof
cost
allo
cate
dto
Wat
erDe
pt
6W
ater
Yard
sche
dule
dre
hab
/cod
eco
mpl
ianc
eSu
btot
alW
ater
Yard
=
7An
nual
wel
lreh
abili
tatio
n
8N
eww
elld
rillin
gpr
ogra
m
921
stSt
reet
Rese
rvoi
rRep
air/
Repl
acem
ent
10N
ewM
ain
East
Zone
2.0
MG
Stor
age
11W
ater
Tank
sCo
atin
g
12W
ater
Met
ers
ongo
ing
met
erre
plac
emen
tpro
gram
ofth
epr
opos
edm
eter
read
ing
devi
ces
13Ta
nkre
hab
142nd
St.
and
3rd S
t. be
twee
n O
live
St.
and
Spr
ing
St.
15Hi
ghla
ndPa
rkDr
.
1612
th S
t. Zo
ne E
xpan
sion
nea
r 4th
St.
1714
thS
t. an
d21
stS
t.be
twee
n P
ine
St.
and
Riv
ersi
deA
ve18
17th
St.
betw
een
Oliv
e S
t. an
d S
prin
g S
t.
199th
St.
betw
een
Oliv
e S
t. an
d S
prin
g S
t.
208th
St.
betw
een
Oliv
e S
t. an
d S
prin
g S
t.
2119
th S
t. an
d 20
th S
t. be
twee
n P
ark
St.
and
Spr
ing
St.
2226
th S
t. be
twee
n V
ine
St.
and
Spr
ing
St.
235th
St.
and
6th S
t. be
twee
n O
ak S
t. an
d S
prin
g S
t.
24Sp
ring
St.n
orth
of36
th S
t.
2515
th S
t. an
d R
ailro
ad S
t., e
ast o
f Pin
e St
.
26W
estF
airv
iew
Ln.
27Bl
ock
AM
ain
Repl
acem
ent
28O
live
St.a
ndSp
ring
St.b
etw
een
19th
St.
and
36th
St.
29Cr
esto
nRd
.,Sa
nte
FeAv
e.an
dSa
nAu
gust
inDr
.
30Pa
cific
Ave.
betw
een
Mer
ryHi
llRd
.&O
live
St.
31Hi
llcre
stDr
.Bet
wee
n15
thS
t. an
d W
est 1
7th S
t.
3212
thSt
.bet
wee
nSp
ring
St.a
ndRi
vers
ide
Ave.
3320
th S
t. be
twee
n O
live
St.
and
Spr
ing
St.
34O
akSt
.bet
wee
n4th
St.
and
7th S
t.
3515
th,1
6th,
Filb
ert,
Terr
ace
Hill
36M
erry
Hill
Rd.b
etw
een
12th
St.
and
Hillc
rest
Dr.
3718
th S
t. be
twee
n Fi
lber
t St.
and
Che
stnu
t St.
38Bl
ock
BM
ain
Repl
acem
ent
39Th
unde
rbird
wel
lfie
ldto
Sout
hRi
verR
d.Ch
arol
ais
Rd.i
nter
sect
ion
40Ai
rpor
tloo
pbe
twee
nTo
wer
25w
ella
ndAe
rote
chCe
nter
Way
41Dr
yCr
eek
Rd.a
ndGo
lden
Hill
Rd.
42Bl
ock
CM
ain
Repl
acem
ent
43M
ajor
wat
erut
ility
repa
irse
ason
s
Tota
ls=
Subt
otal
Wel
lIm
prov
emen
ts=
Tank
,Boo
ster
Stat
ion
and
Met
erin
gPr
ojec
ts
Subt
otal
Tank
and
Boos
terS
tatio
nPr
ojec
ts=
Pipe
line
Impr
ovem
ents
Subt
otal
Wat
erTr
eatm
enta
ndSu
pply
=
Wel
lIm
prov
emen
ts
Subt
otal
Pipe
line
Impr
ovem
ents
=
FY20
3637
FY20
3738
FY20
3839
FY20
3940
FY20
4041
FY20
4142
FY20
4243
FY20
4344
FY20
4445
TOTA
LPR
OJE
CTCO
ST1
$2,0
60,0
00
$29,
308,
000
$33,
959,
000
$4,5
76,0
00$1
1,32
2,00
0$0
$0$0
$0$0
$0$4
,576
,000
$0$0
$76,
649,
000
$5,0
09,0
00
$1,5
15,3
00$3
,247
,000
$0$0
$0$0
$1,5
15,3
00$0
$0$0
$0$8
,256
,000
$465
,613
$479
,582
$493
,969
$508
,788
$524
,052
$539
,773
$555
,966
$572
,645
$589
,825
$11,
908,
000
$1,3
81,5
11$1
,601
,549
$4,9
03,0
00$4
65,6
00$1
,861
,100
$494
,000
$508
,800
$524
,100
$539
,800
$2,1
57,5
00$5
72,6
00$5
89,8
00$1
6,81
1,00
0
$9,1
39,0
00
$7,9
47,0
00
$57,
500
$59,
200
$61,
000
$62,
800
$64,
700
$66,
600
$68,
600
$70,
700
$72,
800
$1,4
70,0
00
$76,
644
$78,
943
$81,
312
$83,
751
$86,
264
$88,
852
$91,
517
$94,
263
$97,
090
$1,9
19,0
00$1
,480
,190
$1,6
65,9
67$7
,577
,000
$134
,100
$1,6
18,3
00$1
42,3
00$1
46,6
00$1
51,0
00$1
,821
,400
$160
,100
$165
,000
$169
,900
$28,
052,
000
$646
,000
$548
,000
$437
,000
$411
,000
$376
,000
$350
,000
$344
,000
$252
,000
$257
,000
$218
,000
$196
,000
$168
,000
$77,
000
$5,6
34,0
00
$3,0
61,0
00
$1,2
83,0
00
$1,0
77,0
00
$575
,000
$572
,000
$489
,000
$436
,000
$385
,000
$375
,000
$315
,000
$11,
647,
000
$5,9
53,1
72$8
,430
,000
$2,1
76,6
40$5
,231
,192
$7,4
08,0
00
$2,2
25,7
67$5
,349
,259
$7,5
75,0
00$2
,101
,327
$2,1
64,3
67$2
,229
,298
$2,2
96,1
76$2
,365
,062
$2,4
36,0
14$2
,509
,094
$2,5
84,3
67$2
,661
,898
$23,
388,
000
$2,3
17,1
76$2
,386
,691
$19,
001,
000
$8,0
54,0
00$4
,482
,000
$4,6
16,0
00$2
,296
,000
$2,3
65,0
00$4
,613
,000
$7,7
40,0
00$4
,810
,000
$8,0
11,0
00$9
5,93
1,00
0
$8,6
53,7
00$7
,961
,400
$5,2
52,3
00$2
,951
,400
$4,5
55,4
00$6
,974
,200
$14,
633,
600
$5,5
47,6
00$8
,770
,700
$225
,699
,000
11-0
3-15
C
C A
gend
a Ite
m 2
P
age
48 o
f 49

Attachment B Water Rate Comparison to Nearby Communities
$
$40
$80
$120
$160
Water Rate Comparisonas of Oct '15
5 HCF 15 HCF
Comparisons are monthly water bills for residential customers with the usage rate shown; Comparative bills based on published information regarding each utility’s rate structure.
11-03-15 CC Agenda Item 2 Page 49 of 49