water requirements of the petroleum refining industry
TRANSCRIPT
Water Requirements of the Petroleum Refining IndustryBy LOUIS E. OTTS, JR.
WATER REQUIREMENTS OF SELECTED INDUSTRIES
GEOLOGICAL SURVEY WATER-SUPPLY PAPER 1330-G
UNITED STATES GOVERNMENT PRINTING OFFICE, WASHINGTON : 1963

UNITED STATES DEPARTMENT OF THE INTERIOR
STEWART L. UDALL, Secretary
GEOLOGICAL SURVEY
Thomas B. Nolan, Director
For sale by the Superintendent of Documents, U.S. Government Printing Office Washington, D.C. 20402

CONTENTS
Page Abstract____________________________________________________ 287Introduction. _____________________________________________________ 287
Purpose and scope_______________________-________________.____ 287How water is used-------_-------------------__-------_----_-_- 290
Quantitative requirements.-____--___-____-_______________-_-_-_-____ 294Published information________________________________________ 294Findings of the survey..._______________________________________ 294
Sources of water___-__-------__-----______-------_-_------- 294Total requirements.________________________________________ 298Cooling-water requirements._____--_-______-__-___-_____--__ 300Requirements for selected operations.________________________ 300
Water-quality requirements_________--___---___-_____-_______-___-__ 309Cooling water.________________________________________________ 311
Published information______________________________________ 311Findings of this survey___________-_____-____-_____________- 312
Boiler-feed water makeup__--___--_--_----_---__----_---___-_-_- 316Published information____________________________-_________ 318Findings of this survey________________--_____-__-_____-___- 318
Process and sanitary water_-________________-___--___-_-__--_-__ 321Factors affecting water use_______________________________________ 325
Availability of water___-_-_--_-_-_-__----_----_----_-_-__------- 326Size ofrefinery_---___---__----_----_----_---------_----_----__ 326Types of processes,.___________________________________________ 326Operating procedures.._____-___________-____________---_----__- 327Quality and physical characteristics of water______________________ 327
Refinery waste water_____________________________________________ 328Future water requirements.----------------------------------------- 329
Location of refineries.--____--_________-_-_---__----_----__-___- 329Growth of industry_______-_________--___-___--___---__------ 331Trends in petroleum refining in the United States.._._-__-________- 335
Summary. ________________________________________________________ 336Quantitative water requirements.----.---------------------..------ 336Qualitative water requirements--____-_--___-______-__--__-_----- 337Trends in water requirements_...________________________________ 337
Selected references____________-___-______-_____-_----_--------_-- 338

IV CONTENTS
ILLUSTKATIONS
PLATE 3. Flowsheet of a hypothetical refinery.__________-..__ In pocketPage
FIGURE 42. Map showing location of refineries surveyed.-_________ 28943. Diagram showing source and use of water intake. _______ 301
44 48. Graphs showing frequency distribution of selected chemi cal constituents in untreated:
44. Water for once-through cooling__________________ 31445. Water for recirculated cooling...________________ 31546. Makeup water for boiler feed-__________-_______ 31947. Process water______--___-----____-_-_---______ 32248. Sanitary and service water_----__--__---___-____ 323
49-51. Graphs showing:49. Demand for major refinery products in the United
States and the free world, 1950-60.___________ 33350. Crude runs by petroleum refineries in the United
States and the free world, 1950-60-___________ 33451. Crude oil runs by refineries and demand for pe
troleum ;products in the United States, 1920- 60,with curves extended to 1966____________ 336
TABLES
TABLE 1. Published total unit water requirements of selected refineries. . _. ______________________________________
2. Published unit water requirements of selected processes..3. Source and amount of water intake of the refineries
4. Total water intake, 1955, by type of cooling system____5. Water requirements and disposition by type of use and
type of refinery, ______________--______--_-_-----_-6. Gross circulating cooling water, 1955, by type of cooling
system and by type of refinery- _________ ___________7. Cooling-water makeup, 1955, by type of cooling system
and by type of refinery..---.----------------------8. Consumptive cooling water, 1955, by type of cooling
system and by type of refinery. _________-___------_9. Water requirements of crude distillation units- ________
10. Water requirements of selected operations.- -----------11. Undesirable effects and methods of correction for common
constituents in water__ _ _______-___________----_-_-12. Quality characteristics of untreated water for all uses.__13. Quality tolerances of cooling water suggested by Ameri
can Water Works Association___________-__--_---_-
Page
295296
298299
302
304
305
306307308
309311
311
CONTENTS V
Page TABLE 14. Quality characteristics of untreated cooling water._____ 313
15. Treatment of makeup water for cooling_______________ 31716. Quality characteristics of untreated boiler-free water
makeup-.-___-____________-_-_____-_-__--___-_.__ 32017. Suggested water-quality tolerances for boiler-feed water_ 32018. Treatment of makeup for boiler-feed water____________ 32119. Quality characteristics of untreated process and sanitary
water.-_._______-______-_____--________--___-_-__ 32420. Treatment of makeup for process water.______________ 32521. Treatment of makeup for sanitary water_______________ 32522. Waste-water treatment...._.____________--_-_-_---__ 32923. Summary of the median of selected quality characteris
tics of untreated water used for various refinery purposes_ ______________________________________ 337


WATER REQUIREMENTS OF SELECTED INDUSTRIES
WATER REQUIREMENTS OF THE PETROLEUM REFININGINDUSTRY
By Louis E. OTTS, JR.1
ABSTRACT
About 3,500 million gallons of water was withdrawn daily in 1955 for use by petroleum refineries in the United States. This was about 3 percent of the esti mated daily withdrawal of industrial water in the United States in 1955.
An average of 468 gallons of water was required to refine a barrel of crude oil, and the median was 95 gallons of water per barrel of crude charge; withdrawals ranged from 6.5 to 3,240 gallons per barrel.
Ninety-one percent of the water requirements of the petroleum refineries sur veyed was for cooling. One-third of the refineries reused their cooling water from 10 to more than 50 times. Only 17 refineries used once-through cooling systems. Refineries with recirculating cooling systems circulated about twice as much cool ing water but needed about 25 times less makeup ; however, they consumed about 24 times more water per barrel of charge than refineries using once-through cool ing systems.
The average noncracking refinery used about 375 gallons of water per barrel of crude, which is less than the 471-gallon average of refineries with cracking facilities. Refineries are composed of various processing units, and the water requirements of such units varied ; median makeup needs ranged from about 125 gallons per barrel for polymerization and alkylation units to 15.5 gallons per barrel for distillation units.
Refinery-owned sources of water supplied 95 percent of the makeup-water re quirements. Surface-water sources provided 86 percent of the makeup-water de mand. Less than 1 percent of the makeup water was obtained from reprocessed municipal sewage.
INTRODUCTION
PURPOSE AND SCOPE
This report presents the results of a survey of water used in the man ufacture of petroleum products from crude oil and is one of a series describing the water requirements of selected industries that are of
i Professor of Civil Engineering, University of Maryland, College Park, Md.
287

288 WATER REQUIREMENTS OF SELECTED INDUSTRIES
national importance. The report is designed to serve the dual purpose of providing basic information for national defense planning and of providing assistance to business and industry. This information will be helpful in planning the location of new refineries and the expansion of existing ones. A knowledge of the water requirements of industry is needed for planning the most effective use of the water resources of specific areas.
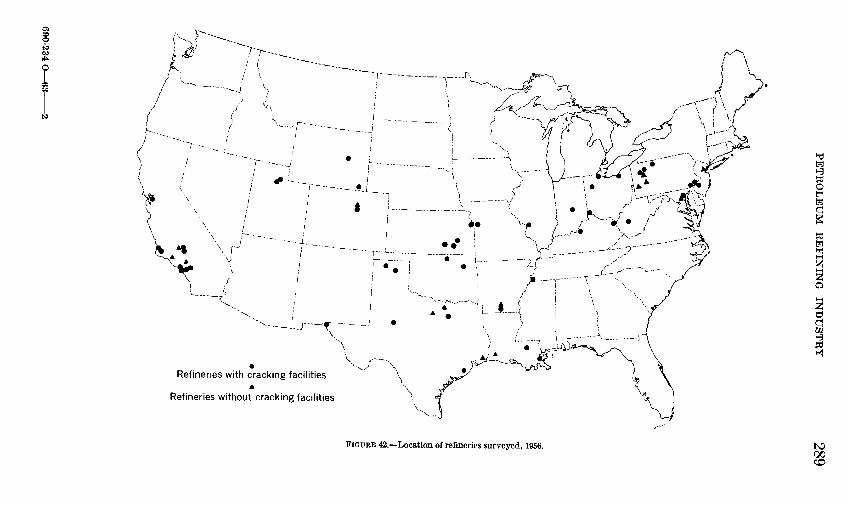
A field survey of 1955 refinery operations was made in the summer and fall of 1956; data for 1955 were collected so that information for an entire year would be available. Sixty-one, or 21 percent, of the re fineries operating in 1955 were visited. They processed 30 percent of the crude oil refined in the country during 1955. Refineries were se lected to give a wide range in size, geographic location, and processes used. (See fig 42.) The refineries surveyed included no natural-gaso line plants, and no attempt was made to obtain information on the water requirements of the other divisions of the oil industry namely, exploration for and production of crude oil, transportation of crude oil or refinery products, and marketing of petroleum products.
Information was obtained on the source of water, the adequacy of the supply, the quality and treatment of the water, and the disposal of waste. Data on the amounts of gross and makeup water required, the amount reused, the amount used consumptively, and the amount of effluent were obtained for the complete refineries and for their compo nent units. Information was obtained on use of water for cooling, boiler feed, processing and sanitary. Information on the crude charge and production of the refineries was also obtained in order to compute unit water use.
Early in 1951, J. K. Searcy (written communication) of the U.S. Geological Survey obtained information on the water intake of 63 petroleum refineries and 29 natural gasoline plants in the United States, but he did not obtain details on the use of water within the re fineries. Information for 48 of the petroleum refineries were incor porated in this report where applicable.
The literature was carefully reviewed to obtain information on the water requirements of the industry and to obtain an understanding of the water-supply problems of the industry. Special acknowledgment is given to the officials and management of the petroleum refineries who permitted the author to visit their refineries and who supplied infor mation on water use at their refineries. The author is indebted to his colleague, O. D. Mussey, who made the survey of the petroleum refin eries in western Pennsylvania.
Refineries with cracking facilitiesA
Refineries without cracking facilities
FIGURE 42. Location of refineries surveyed, 1956. to00

290 WATER REQUIREMENTS OF SELECTED INDUSTRIES
HOW WATER IS USED
The major use of water in a petroleum refinery is for cooling. Rela tively small quantities of water are used for boiler feed, processing, sanitary services, fire protection, and miscellaneous purposes. Simon- sen (1952) noted that a typical 50,000-barrels-per-day refinery gener ates more than 1,000 million Btu. per hr and that about 50 percent of this heat is removed by water. Allowing for other water uses and assuming a 30 °F temperature rise in the cooling water, he estimated the refinery would require about 40,000 gpm (gallons per minute) to remove this amount of heat. This quantity of water would have sup plied the domestic requirements of the city of Toledo, Ohio, in 1952.
In petroleum refining, vapors are reduced to liquids in condensers, and coolers are used to lower the temperature of liquid products to permit safe handling. Water is the normal cooling medium used in these units; however, refineries save both heat and water by cooling high-temperature products with raw charging stocks and other cooler liquid streams.
Water requirements of early refineries were small, and the uses of water were as simple as the refining process. Water was needed only for cooling and for generating sufficient steam for the pumps. In contrast, both the modern refining process and the use of water are varied and complicated. The quantity and the quality of water re quired by the entire refinery and in individual operations are affected by the type of refinery process. The principal processes used are distillation, cracking, polymerization, alkylation, and treating and finishing. Detailed descriptions of petroleum refining and refining equipment can be found in the literature.
A skimming or topping refinery separates crude oil by distillation into gasoline, kerosene, fuel oil, gas oil, and reduced crude. Atmos pheric distillation is generally the first step in refining crude oil. The crude oil is generally warmed by heat exchange with a fluid to be cooled. The use of the crude oil as a cooling medium reduces the amount of cooling water required. The hot oil partially vaporizes as it enters the fractionating tower. The lightest vapors are drawn off at the top of the tower and are condensed as gasoline; other fractions are drawn from the tower as side streams. Water-cooled heat ex changers condense overhead streams and cool tower side streams.
The reduced crude from atmospheric distillation may be further processed by vacuum distillation, by steam distillation, or by a com bination of both to provide lubricating oil fractions or asphalt base stocks. The heavier fractions of the crude oil may be fractionated without danger of decomposition or cracking in these units, as the oil is distilled at temperatures lower than those in atmospheric units.

PETROLEUM REFINING INDUSTRY 291
A vacuum distillation unit consists of a pipe still and a distillation tower operated at a reduced pressure that is maintained by the use of a barometric condenser and steam jets or vacuum pumps. This equipment requires both water and steam. Because the separations ob tained in distillation towers are not perfect, the undesirable fractions in side streams are vaporized and are removed by steam stripping in short, auxiliary towers known as stripping columns. Steam is also used for pumping and heating.
In the manufacture of lubricants, the lubricating-oil base stock is prepared by vacuum distillation or by propane deasphalting. The base stock is then dewaxed by chilling and cold filtering or pressing, or by solvent dewaxing. Water is used for making brine solutions in refrigeration units of lubricating-oil plants. Steam is used for cleaning filter clays, pumping, and heating.
Cracking is the breaking down of large molecules into smaller mole cules. Cracking is an important process, because it not only gives an increase in the gasoline yield to 70 to 85 percent of the charge but also improves the quality of the yield. About 50 percent of the gaso line produced in this country is obtained by cracking. Cracking processes may be thermal or catalytic, and thermal cracking may be either liquid phase or vapor phase. Thermal cracking units operate at temperatures ranging from 800° to 1200°F and at pressures ranging from 600 to 1,000 pounds per square inch. Catalytic cracking units utilize a catalyst to hasten the change in molecular structure of the material being cracked and operate at temperatures and pressures generally lower than those of thermal cracking units.
Polymerization could be considered to be the reverse of cracking, as it is a process that combines two or more molecules to form a larger molecule. The process is used largely to change the byproduct pe troleum gases that are produced in cracking into high-grade motor fuel and aviation fuel. Polymerization can be a thermal or a catalytic process, but thermal polymerization is not used extensively today.
In the alkylation process, complex saturated molecules are formed by the combination of a saturated and an unsaturated molecule. Alky lation can be a thermal, a thermal-catalytic, or a catalytic process, but most commercial applications are catalytic. Alkylate is the product of the process and is the principal component of many high-octane motor fuels and aviation gasolines.
Cracking, polymerization, and alkylation units use water for cool ing and for other heat transfer operations. They use steam for regen erating catalysts, pumping, and heating.
Products must be treated to improve color, odor, or stability or to remove sulfur, gums, or other corrosive substances before the product
292 WATER REQUIREMENTS OF SELECTED INDUSTRIES
is marketable. Caustic treating, acid treating, clay treating, oxidation sweetening, copper sweetening, and solvent extraction are some of the methods used to remove or alter the impurities in light distillates. Water is used for caustic and acid solutions and for product washing. Lubricating oils are treated with acids, by contact with or percolation through clay, or by solvent extraction methods. Both steam and water are used to recover solvents and to clean filter clays in lubricant treat ing operations.
Brines associated with many crude oils should be removed before the oils are distilled to prevent serious corrosion of refining equipment. Brines are generally removed from crude oils by scrubbing with water.
A refinery is composed of a combination of several unit processes, but no two refineries will use exactly the same process. A diagram matic flowsheet of a refinery is shown plate 3. It is not a flowsheet of any specific refinery, nor is it a recommended refinery design. It merely illustrates how several of the more important processes may be utilized by a refinery to provide the products desired. The designa tion of the type of a refinery will be determined by the combinations of processes used.
The manner in which cooling water is used varies with local con ditions. Generally water will be used once in areas where it is plenti ful and cheap. On the other hand, where water is in short supply and its cost is high, makeup water requirements are kept to a minimum by reusing the cooling water many times. One type of reuse system uses water as a coolant for operations with low-temperature demands and then reuses the warmed water to satisfy cooling requirements of higher temperature operations. In the recirculating type of cooling system, water absorbs heat as it flows through condensers and coolers. The heat acquired by the water is removed by evaporative cooling in cool ing towers, spray or cooling ponds, or evaporative condensers, and the cooled water is reused. Most refineries use once-through cooling for some operations and several types of water reuse for other operations.
The conventional recirculating cooling system in a modern petro leum refinery uses cooling towers to transfer the heat absorbed by the water to the atmosphere. The rate at which water is pumped into the cooling tower is known as the gross circulating rate. Evaporation and windage losses occur as water passes through the cooling tower, and some water is drained from the system to prevent excessive mineral concentrations. The water remaining is returned to the cooling sys tem to be reused and is known as recirculated water. A quantity of water equivalent to the evaporation and windage losses and to the withdrawal for mineral concentration control is added to the recircu-

PETROLEUM REFINING INDUSTRY 293
lated water to maintain the gross circulating rate. This replacement is known as makeup water.
The second largest use of water in a refinery is makeup for boiler feed. The chief uses of steam are for stripping, steam distillation, and vacuum distillation. The steam comes in contact with the products in these operations, and generally the steam condensate is so highly contaminated that it cannot be reused for boiler feed or for other pur poses. Steam is also used for process heating, for pumping, and, in some refineries, for generating electric power. The condensate from the condensers and traps of these systems is usually reused as boiler- feed water or as makeup for other water needs.
Smaller amounts of water are generally needed for process opera tions, sanitary and plant services, fire protection, and other uses. The water requirements during a fire will be large, but the average require ments for fire protection during -a year will be negligible. Some re fineries use separate fire-protection systems, whereas others use water from the cooling or other water systems of the refinery to fight fires. The latter method is less desirable, as the increased water needs during a fire must be entirely or partially offset by a decrease in water uses in the refining process. Some refineries also require water for com pany housing, and refineries with dock facilities may supply the water needs of oil tankers.
Water is used both consumptively and nonconsumptively by the petroleum refining industry. Consumptive use is water that is dis charged to the atmosphere or that is incorporated in the products of the process (Am. Water Works Assoc. Task Group, 1953). Evapora tion and windage losses in a cooling tower and the discharge of process steam into the atmosphere are examples o.f consumptive use. The dis charge of once-through cooling water, cooling-tower blowdown, and discharge to waste of the condensate from a steam trap or examples of effluents and not of consumptive uses. The sum of consumptive uses and effluents equals the makeup water.
Makeup water may be new or reused. Water that is used for the first time is new makeup water, whereas water that was used in one process or operation and is being reused in another as makeup is known as reused makeup water. The sum of new makeup water for all refining operations for a day is equivalent to the daily water in take of the refinery.
The gross circulating water is the actual quantity of water circulat ing in a system. It is the same quantity as the makeup water if water is used only once and discharged to waste. If water is recirculated, it is the sum of the makeup and the recirculated water.

294 WATER REQUIREMENTS OF SELECTED INDUSTRIES
QUANTITATIVE REQUIREMENTS
PUBLISHED INFORMATION
Most descriptions of petroleum refining and processing given in the literature do not include data on water requirements. Those that do give such information usually show the total water requirements and do not subdivide the water needs by process or by type of use.
Published water requirements of selected refineries are given in table 1. The wide variation between maximum and minimum water requirements is shown by the four Standard Oil Co. of Ohio refineries reported in the table. One of these refineries that had a once-through water system used 1,870 gallons of water to refine a barrel of crude oil, whereas another that recirculated all cooling water required only 73 gallons per barrel. The possible reduction in water requirements by many refineries is suggested by this example of water conservation.
Another example of water conservation is the reduction in water re quirements of the Baton Rouge refinery of the Esso Standard Oil Co. According to Miller and others (1953), in its early days the Baton Rouge refinery used about 100 gallons of water for each gallon of crude processed. Now, even though more heat and treatment for each gallon of crude are required owing to cracking and other inten sive refining processes, the use of water has been reduced to 23 gallons per gallon of crude.
The literature shows that refinery processes have wide ranges of water requirements. The gallons of water used per barrel of feed stock for selected refinery processes are given in table 2. Processes with large water requirements are deasphalting, coking, reforming, and catalytic cracking.
FINDINGS OF THIS SUB-VET
A typical (median) petroleum refinery of today has a daily capacity of about 16,000 barrels of crude oil. Approximately 22.5 million gal- ons of water circulate daily in the several water systems within the refinery. To maintain this circulation rate the refinery needs a source of water capable of providing 2 mgd (million gallons per day).
SOURCES OF WATER
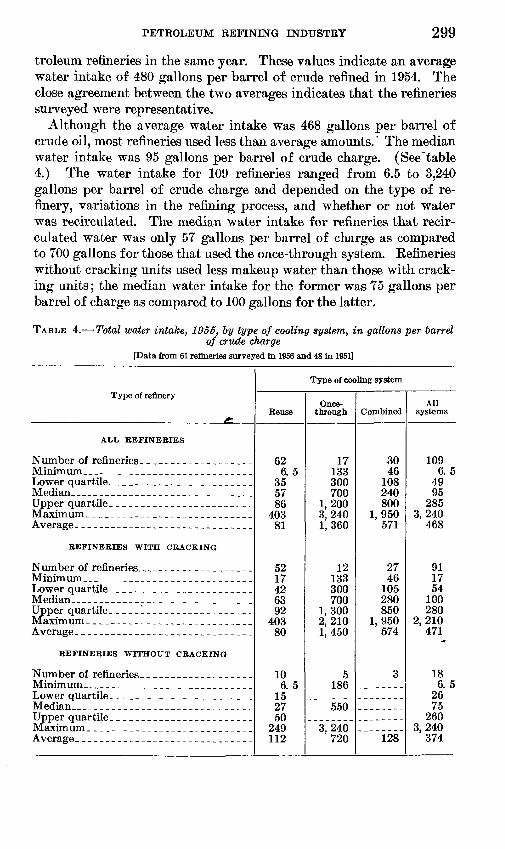
Most of the 61 refineries surveyed obtained water from both sur face sources and wells, although some obtained water from only one source. One refinery used sewage effluent, and nine used saline ground water or saline surface water to supply part of their requirements. About 86 percent of the total daily intake was from surface sources; nearly 14 percent was from wells; and 0.1 percent was sewage effluent. (See table 3.) Company-owned facilities supplied about 95 percent of the daily water intake, and public facilities supplied about 5 percent.

PETROLEUM REFINING INDUSTRY 295
TABLE 1. Published total unit water requirements of selected refineries[Size of refinery is expressed in barrels of crude charge per day. Unit water use is expressed in gallons per
barrel of crude charge except where otherwise noted]
Refinery or product
Lubricating _ _ _ _ __
Do____-_____-____________Do____. _.____.____._.____Do. __._________..__..__._
Skimming and cracking ________Half skimming, half lubricating __ Topping only 25 percent. _ _Oil refining ___ __________ .Complete refinery _ _ _ _Amoco, Yorktown, Virginia _ ___
Sea water (for cooling) _ ___Torrance Refinery, General
Watson Refinery, Richfield Oil Corp. __ __ ____ ___
Wilmington Refinery, Union Oil Co_ __ ___ _ _ ___ _
Fresh water. _ _ ___ _.__
McPherson refinery, National Cooperative Refinery Associa tion __ __ ___ __
Standard Oil Co. of Ohio: Toledo, Ohio, refinery __ __Cleveland, Ohio, refinery____
Latonia, Kentucky, refinery __ Esso Standard Oil Co.:
Baton Rouge, Louisiana, re-
Cooling water. __
DoAviation gasoline _ _ _
Size
Refinery
(')(')(')0)0)0)(')0)(')(')
35, 000
120, 000
114, 000
110, 000
25, 000-28, 000
21, 00044, 000 39, 00015, 000
232, 000
134, 900
Product
(2)(2)(')
Unit use
440540630
1,0201,850
910250 210
3770800
43
3,060
34
44
55420
47-52
1,870311 14473
966
924
982953
3574 7-10
*25
Source of information
Bell (1959).Do.Do.Do.Do.Do.Do. Do.
Jordan (1946).Bell (1959).
Petroleum Processing (1957b).
Do.
Partin (1953).
Do.
Do.Do.
Aeschliman andothers (1957;.
Simonsen (1952).Do. Do.Do.
Standard Oil Co.(1950).
Do.
Do.Do.
Besselievre (1952).German (1943).Youngquist (1942).
1 Data not given in source.8 Average of a number of plants.
3 Gallons per barrel of product.4 Gallons per gallon ot product.

296 WATER REQUIREMENTS OF SELECTED INDUSTRIES
TABLE 2. Published unit water requirements of selected processes[Size of refinery unit is expressed in barrels of crude charge per day. Unit water use expressed in gallons
per barrel of crude charge except where otherwise noted]
Process
ANHYDROUS AMMONIA
Service water. _ _ _ _____
ALKYLATION
Sulfuric acid (Kellogg) : Refinery 1:
Cooling water. __Refinery 2:
Refinery 3:
Cooling water. __ _ _HF: Process (Phillips):
Steam. __ _____ ....
CATALYTIC CRACKING
Thermofor continuous percolation:
Cooling water _ ... _Houdry:
Steam ____ __ _____
Water_ _____________________Fluid:
Cooling water _ --_-___-___Fluid:
Steam ___ __________ ___
Water. ____ ___ __ ___Thermofor:
Steam. _ _ __ _________Water. _____________________
Thermofor: Boiler water to kiln _ _ _ _
Net steam consumed.
CATALYTIC HYDROGENATION
Autofining: Steam. __ ___ _______ _
Cooling water __ ___ _ _____See footnotes at end of table.
Size
(')
(')
0)
(0
(')
0)
0)(')
0)
(0
(')
(')
10, 000
10, 000
2,0002,000
10, 000
10, 000
10, 00010, 000
4,5004,5004,500
3,500
3,500
Unit use
2 12, 800
2 165
374
3 3, 841
3 833 4, 410
3 1113 4, 637
3 1
3 68
22
1,333
3
1,840
6360
12
1,350
91,082
12536
7
4
27
Source of information
Petroleum Processing(1956a).
Do.
Petroleum Processing(1957a).
Do.
Do.Do.
Do.Do.
Oil and Gas Journal(1955a).
Do.
Petroleum Processing(1956c).
Do.
Kimball and Scott(1948).
Do.
Read (1946).Do.
Kimball and Scott(1948).
Do.
Do.Do.
Pfarr (1948).Do.Do.
Oil and Gas Journal(1955b).
Do.

PETROLEUM REFINING INDUSTRY 297
TABLE 2 Published unit water requirements of selected processes Continued
Process
CATALYTIC HYDBOGENATION Con.
Hydrodesulfurization : Standard Oil Co. of Indiana:
Cooling water.Gulf HDS process:
West Texas crude oil, fixed bed : Cooling water __ __
Modified fixed-bed 4 : Cooling water-
Hydrogen treating: Cooling water _____ _
ISOMERIZATION
Catalytic (Phillips Petroleum Co.) :
Water, gross circulatingPentafining (Atlantic Refining) :
Total: Steam __ _ __ __
Pentafiner:
Pentane splitter: Steam ______ _ __
Once-through plant: Steam ___ _ _ ___
Plant recycling hydrocarbon: Steam ___ ___ __Cooling water
CATALYTIC REFORMER
Hydroforming: Cooling water _
Hyperforming: Cooling water _ _ _ _ _ _
Powerforming for octanes: Steam _____ _____
Cooling water _____ __See footnotes at end of table.
Size
8,500
8,500
20, 000
20, 000
20, 00020, 000
10, 000
10, 000
(')
(l)0)
2,000
2,000
1,7831,783
3,7583, 758
4,000
4,000
4,0004,000
10, 00010, 000
1, 100
10, 000
10, 000
Unit use
1
315
1,460
10
3,75020
432
7
82
451,500
2
114
222
092
10
396
802,520
82110
344
1
533
Source of information
Petroleum Processing(1956f).
Do.
McAfee and others(1955).
Do.
Do.Do.
Petroleum Processing(1956e).
Do.
Petroleum Refiner(1956b) and Oil and Gas Journal (1956b).
Do.Do.
Petroleum Processing(1956d).
Do.
Do.Do.
Do.Do.
Nordburg and Arnold(1956).
Do.
Do.Do.
Murphree (1951).Do.
Petroleum Processing(1955).
Petroleum Processing(1957c).
Do.
690-234 O 63 3
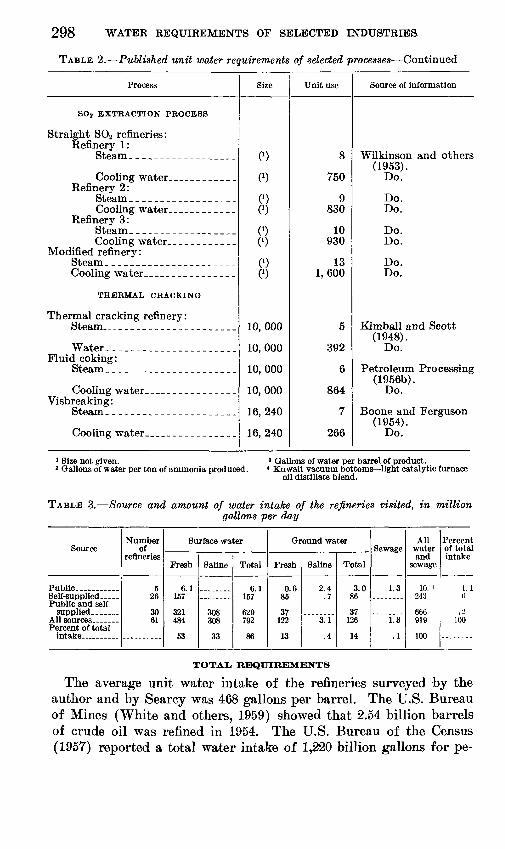
298 WATER REQUIREMENTS OF SELECTED INDUSTRIES
TABLE 2. Published unit water requirements of selected processes Continued
Process Size Unit use Source of information
S02 EXTRACTION PROCESS
Straight SO2 refineries: Refinery 1:
Steam..-. ______________ 0)
Cooling water________Refinery 2:
Steam_.______________Cooling water__________ 0)
Refinery 3:Steam________________Cooling water.___________ 0)
Modified refinery:Steam..._________________ 0)Cooling water______________ 0)
THERMAL CRACKING
Thermal cracking refinery:Steam____-_________..... 10, 000
Water....__________________ 10, 000Fluid coking:
Steam______________________ 10, 000
Cooling water______________ 10, 000Visbreaking:
Steam______________________ 16, 240
Cooling water______________ 16, 240
8
750
9830
10930
131,600
5
392
6
864
7
266
Wilkinson and others (1953).
Do.
Do. Do.
Do. Do.
Do. Do.
Kimball and Scott (1948).
Do.
Petroleum Processing (1956b).
Do.
Boone and Ferguson (1954).
Do.
1 Size not given.2 Gallons of water per ton of ammonia produced.
' Gallons of water per barrel of product. 4 Kuwait vacuum bottoms light catalytic furnace
oil distillate blend.
TABLE 3. Source and amount of water intake of the refineries visited, in milliongallons per day
SourceNumber
of refineries
Surface water
Fresh Saline Total
Ground water
Fresh Saline Total
All water and
Percent of total intake
Public... -_ Self-supplied. Public and self
supplied-.-._-- All sources. Percent of total
intake..._
6.1157
321484
53
308308
33
6.1157
629792
0.685
37122
2.4.7
3.1
.4
3.086
37126
1.3
1.3
.1
10. ' 243
666919
100
100
TOTAL REQUIREMENTS
The average unit water intake of the refineries surveyed by the author and by Searcy was 468 gallons per barrel. The U.S. Bureau of Mines (White and others, 1959) showed that 2.54 billion barrels of crude oil was refined in 1954. The U.S. Bureau of the Census (1957) reported a total water intake of 1,220 billion gallons for pe-
PETROLEUM REFINING INDUSTRY 299
troleum refineries in the same year. These values indicate an average water intake of 480 gallons per barrel of crude refined in 1954. The close agreement between the two averages indicates that the refineries surveyed were representative.
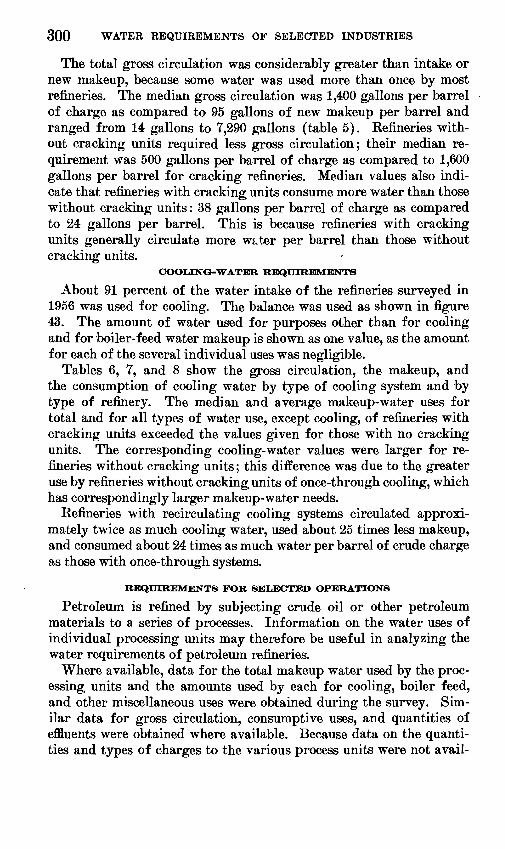
Although the average water intake was 468 gallons per barrel of crude oil, most refineries used less than average amounts.' The median water intake was 95 gallons per barrel of crude charge. (See table 4.) The water intake for 109 refineries ranged from 6.5 to 3,240 gallons per barrel of crude charge and depended on the type of re finery, variations in the refining process, and whether or not water was recirculated. The median water intake for refineries that recir- culated water was only 57 gallons per barrel of charge as compared to 700 gallons for those that used the once-through system. Refineries without cracking units used less makeup water than those with crack ing units; the median water intake for the former was 75 gallons per barrel of charge as compared to 100 gallons for the latter.
TABLE 4. Total water intake, 1955, by type of cooling system, in gallons per barrelof crude charge
[Data from 61 refineries surveyed in 1966 and 48 in 1951]
Type of refinery
rALL REFINERIES
Number of refineries. _ ___ ____.Minimum _ _ _ ______Lower quartile_ ________ _ ___Median ____ ___ __ ____Upper quartile__ ___ __ _ ___Maximum _____ _ __ ___
REFINERIES WITH CRACKING
Number of refineries. __ _____ _ __Minimum _ _____ _______Lower quartile ____ _ ____ ___Median___ ____ __ __Upper quartile __ _ L ____ _______Maximum __ ______ ______ _______Average. _ _ ___________
REFINERIES WITHOUT CRACKING
Number of refineries. _ _ _ _Minimum. _ _ _ _Lower quartile.. _ _ _ _ _______Median ___ __ _ _____Upper quartile___ _ ___ ____Maximum.- _ _ ______Average. .- _ _ _____
Type of cooling system
Reuse
62 6.5
35 57 86
403 81
52 17 42 63 92
403 80
10 6.5
15 27 50
249 112
Once- through
17 133 300 700
1,200 3,240 1,360
12 133 300 700
1,300 2,210 1,450
5 186
550
3,240 720
Combined
30 46
108 240 800
1,950 571
27 46
105 280 850
1,950 574
3
128
All systems
109 6.5
49 95
285 3,240
468
91 17 54
100 280
2,210 471
18 6.5
26 75
260 3,240
374
300 WATER REQUIREMENTS OF SELECTED INDUSTRIES
The total gross circulation was considerably greater than intake or new makeup, because some water was used more than once by most refineries. The median gross circulation was 1,400 gallons per barrel of charge as compared to 95 gallons of new makeup per barrel and ranged from 14 gallons to 7,290 gallons (table 5). Kefineries with out cracking units required less gross circulation; their median re quirement was 500 gallons per barrel of charge as compared to 1,600 gallons per barrel for cracking refineries. Median values also indi cate that refineries with cracking units consume more water than those without cracking units: 38 gallons per barrel of charge as compared to 24 gallons per barrel. This is because refineries with cracking units generally circulate more wi.ter per barrel than those without cracking units.
COOLING-WATER REQUIREMENTS
About 91 percent of the water intake of the refineries surveyed in 1956 was used for cooling. The balance was used as shown in figure 43. The amount of water used for purposes other than for cooling and for boiler-feed water makeup is shown as one value, as the amount for each of the several individual uses was negligible.
Tables 6, 7, and 8 show the gross circulation, the makeup, and the consumption of cooling water by type of cooling system and by type of refinery. The median and average makeup-water uses for total and for all types of water use, except cooling, of refineries with cracking units exceeded the values given for those with no cracking units. The corresponding cooling-water values were larger for re fineries without cracking units; this difference was due to the greater use by refineries without cracking units of once-through cooling, which has correspondingly larger makeup-water needs.
Refineries with recirculating cooling systems circulated approxi mately twice as much cooling water, used about 25 times less makeup, and consumed about 24 times as much water per barrel of crude charge as those with once-through systems.
REQUIREMENTS FOR SELECTED OPERATIONS
Petroleum is refined by subjecting crude oil or other petroleum materials to a series of processes. Information on the water uses of individual processing units may therefore be useful in analyzing the water requirements of petroleum refineries.
Where available, data for the total makeup water used by the proc essing units and the amounts used by each for cooling, boiler feed, and other miscellaneous uses were obtained during the survey. Sim ilar data for gross circulation, consumptive uses, and quantities of effluents were obtained where available. Because data on the quanti ties and types of charges to the various process units were not avail-

\ Ground water ^ 14 percent
Sanitary and other
FIOUEE 43. Source and use of water Intake. CO O

TABLE 5. Water requirements and disposition by type of use and type of refinery, in gallons per barrel of crude charge
COo to
Water requirements and disposition
Gross circulation : Number of refineries _ _ Minimum. . _________Lower quartile _ ______
Upper quartile _ ______
New makeup: Number of refineries __ Minimum. _ ____________Lower quartile _ --__-_
Upper quartile _ ------Maximum. _ _________Average. __ __________
Consumption : Number of refineries __
Lower quartile _ _Median -_ ___________Upper quartile _ ------Maximum __ ____ _.__Averaee __ - - _________
All refineries
Cooling water
61 7.5
750 1,350 1,900 7,220 1,620
61 2.6
25 60
250 3,120
376
61 0
12 25 36 94 28
Boiler- feed
water
61 5.5
20 25 35
483 29
61 0
13 19 26
125 20
61 0 2.5 8.7
20 125 10
Sanitary and
other water
61 0 2.2 8.5
22 166
19
61 0 2.0 8.0
20 79 17
61 0 0 0 .3
13 1.2
Total water
61 14
850 1,400 2,000 7,290 1,670
109 6.5
49 95
285 3,240
468
61 0
24 36 55
304 39
Refineries with cracking units
Cooling water
47 39
1,100 1,550 2,050 7,220 1,660
47 2.6
30 56
175 1,880
374
47 0
18 26 36 94 29
Boiler- feed
water
47 12 22 27 34
141 28
47 0
14 19 25 60 20
47 0 3.4
10 20 34 10
Sanitary and
other water
47 0 3.5
11 25
166 19
47 0 3.0 8.3
17 79 17
47 0 0 0 .8
13 1.2
Total water
47 88
1,200 1,600 2, 100 7,290 1,710
91 17 54
100 280
2,210 471
47 0
27 38 53
304 40
Refineries without cracking units jj
Cooling water
14 7.5
145 400 900
3, 120 644
14 5.4
12 70
400 3,120
418
14 0 .6
9.0 27 52 9.8
Boiler- feed
water
14 5. 5
14 2342
483 44
14 0 6.8
19 31
125. 16
14 0 1.2 2.8
24 125
6.4
Sanitary and
other water
14 0
. 8 3. 1
10 39 11
14 0
. 8 3.0
11 39 11
14 0 0 0 .3
1.4 . 3
"" 5Total 3 water *°
»Hrl
H § 14 w14 H
190 § 500 | 960 3
3, 240 699 o *]18 OB 6.5 H
26 B 75 o
260 U 3, 240 o
374
14 2o 36.0 S
24 g 57 H
125 16

Effluent: Number of refineries __
Lower quartile _ ______Median. _ _ __ _
Maximum ____________Average __ --_______-
61 05.5
23110
3, 120345
61 01.05.0
1712112
61 01.87.2
167917
61 0
2051
2003,120
374
47 05.4
2180
1,860343
47 01. 16. 9
1812112
47 02.88. 8
197917
47 0
2445
1501,940
371
14 1.54.9
38330
3,120407
14 0.7
1.8124811
14 0
. 93.0Q 6
3910
14 4. 69.0
60400
3, 120429
NOTE. The summation of the median, quartile, minimum, maximum and average water-use values for various types of water may not always equal the corresponding total water value. The median water-use value for cooling may be that of one refinery, whereas the median for some other type of water use or for the total may be that of the same or another refinery.
O
CO O CO

304 WATER REQUIREMENTS OF SELECTED INDUSTRIES
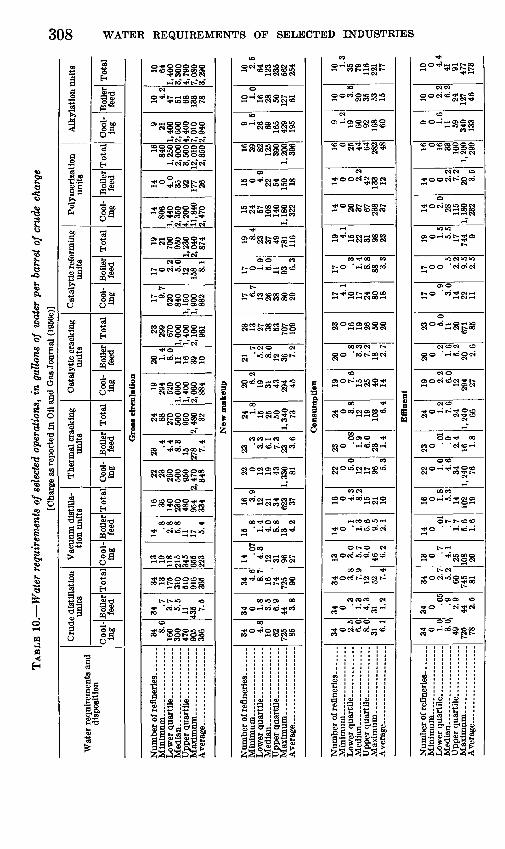
able, total water requirements were divided by the capacities of the process units given in the Oil and Gas Journal (1956c) to obtain the unit water-use values in gallons of water per barrel of capacity.
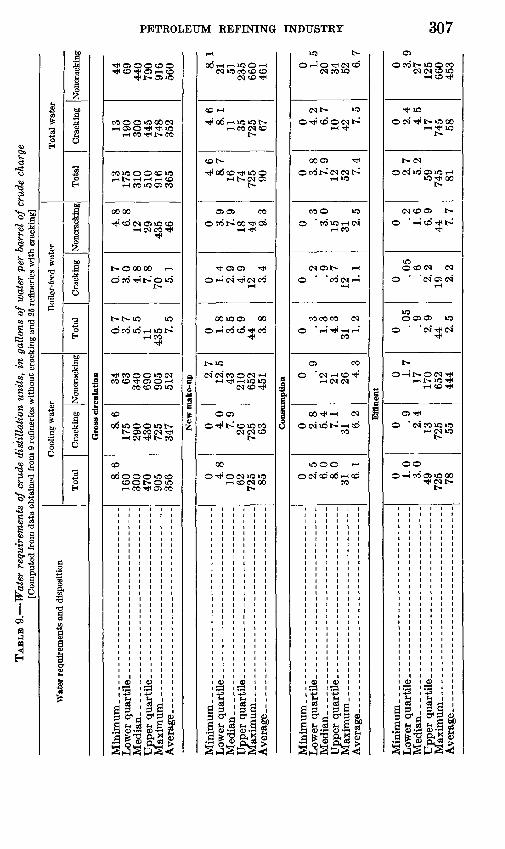
Distillation units, either vacuum or crude, require less makeup and gross circulation per barrel of crude charge than cracking units owing to the much lower temperature in the distillation processes as com pared to the cracking processes. (See tables 9 and 10.) Consump tion of cooling water in distillation units is also less than in cracking units. Similarly, new makeup for and consumption of boiler-feed water by distillation units is less than for cracking units.
TABLE 6. Gross circulating cooling water, 1955, by type of cooling system and type of refinery, in gallons per barrel of crude charge
Type of refinery
ALL REFINERIES
Number of refineries _ ______ _ ___Minimum _________
Upper quartile ___ _ _ ______Maximum _ ________Average __________ ______
REFINERIES WITH CRACKING
Number of refineries . _ ______ ___Minimum _ _____Lower quartile- __ _ _ ___ ___Median _ _ _ _ _____ __ _Upper quartile _ _ _ _ _Maximum _ __ _ _ __ _ _ ______Average
REFINERIES WITHOUT CRACKING
Number of refineries. . _ _
Lower quartile. _____
Upper quartile ______Maximum __ ______Average________ __ _ ______ ___
Type of cooling system
Reuse
30 7. 5
520 1, 200 1.750 7,220 1,700
24 39
880 1,500 2,030 7,220 1,740
67. 5
140
1,030 606
Once through
7 161 410 700
1,290 3, 120
804
2
5 161
520
3, 120 693
Combined
24 189
1,300 1.590 1,900 3,250 1,630
21 819
1,400 1,680 1,980 3,250 1,640
3
Allsystems
61 7.5
750 1,350 1,900 7,220 1,620
47 39
1, 100 1,550 2,050 7,220 1,650
14 7.5
145 400 900
3, 120 64

PETROLEUM REFINING INDUSTRY 305
TABLE 7. Cooling-water makeup, 1955, by type of cooling system and by type of refinery, in gallons per barrel of crude charge
Type of refinery
ALL REFINERIES
Number of refineries.Minimum __ ___ _ ___
Upper quartile _ _ _Maximum _ _ ___ __ ___
REFINERIES WITH CRACKING
Lower quartile __ _ _ _ ___Median _________ __
Maximum _ _ _ _____ ___Average __ _______ ___ __
REFINERIES WITHOUT CRACKING
Minimum. ___ ___
Upper quartile ______ __Maximum ___ _____ ___Average _ _______ __
Type of cooling system
Reuse
30 2. 6
15 3048
178 45
24 2. 6
20 34 52
178 46
6 5. 4
11
31 23
Once through
7 161 370 740
1,500 3, 120
784
2
5 161
520
3, 120 693
Combined
24 25 61
140 500
1,880 511
21 25 68
150 620
1,880 515
3
Allsystems
61 2. 6
25 60
250 3, 120
376
47 2. 6
30 56
175 1,880
374
14 5. 4
12 70
400 3, 120
418
690-234 O 63
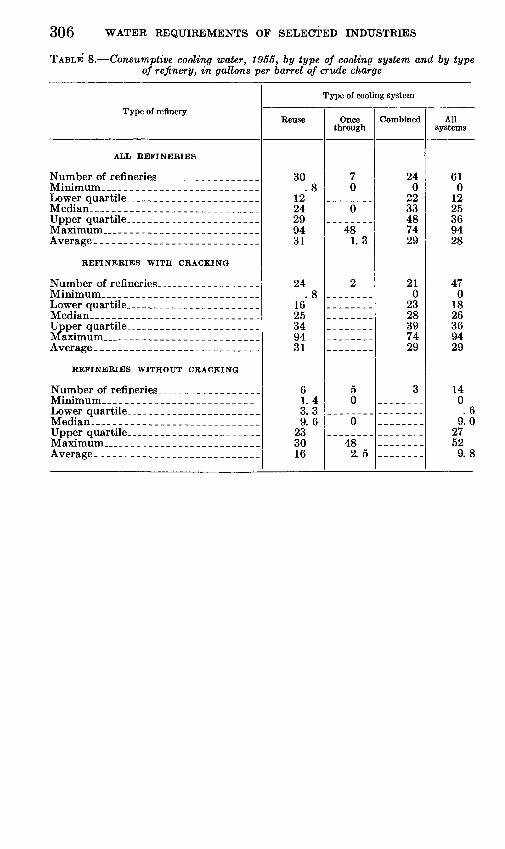
306 WATER REQUIREMENTS OF SELECTED INDUSTRIES
TABLE 8. Consumptive cooling water, 1955, by type of cooling system and by type of refinery, in gallons per barrel of crude charge
Type of refinery
ALL REFINERIES
Number of refineries _ _ _______ _Minimum.. _________ ____
Median __ _ ___ _ ___ _ __ __
Maximum _ _ ____ ___ _ _ _ __Average. ______ ___ ___ _ _____ ____
REFINERIES WITH CRACKING
Number of refineries ____ _ ___ __Minimum _ __________ _ _
Upper quartile __ _____ ___
REFINERIES WITHOUT CRACKING
Number of refineries _ ____ _ ____Minimum ______ __ ___Lower quartile.- _ ___ ___ ______
Upper quartile. ____ _____ ___Maximum _ ______________Average... ___ _____ ___ ___ __ __
Type of cooling system
Reuse
30 .8
12 24 29 94 31
24 .8
16 25 34 94 31
6 1. 4 3. 3 9. 6
23 30 16
Once through
7 0
0
48 1. 3
2
5 0
0
48 2. 5
Combined
24 0
22 33 48 74 29
21 0
23 28 39 74 29
3
All systems
61 0
12 25 36 94 28
47 0
18 26 36 94 29
14 0 .6
9.0 27 52 9.8
TA
BL
E 9
. W
ater
req
uire
men
ts o
f cr
ude
dist
illa
tion
uni
ts,
in g
allo
ns o
f w
ater
per
bar
rel
of c
rude
cha
rge
[Com
pute
d fro
m d
ata
obta
ined
from
9 re
finer
ies
with
out c
rack
ing
and
25 re
finer
ies
with
cra
ckin
g]
Wat
er r
equi
rem
ents
and
dis
posi
tion
Coo
ling
wat
er
Tot
alC
rack
ing
Non
crac
king
Boi
ler-
feed
wat
er
Tot
alC
rack
ing
Non
crac
king
Tot
al w
ater
Tot
alC
rack
ing
Non
crac
king
Gro
ss c
ircu
lati
on
Uppe
r qu
arti
le. ___--_-_----_---_--_--------
Maxi
mum.
----
.---
________--___----
__ __
8.6
160
300
470
905
356
8.6
175
290
430
725
347
34 63 340
690
905
512
0.7
3.7
5. 5
11 435 7.
5
0.7
3.0
4. 8
7.8
70 5. 1
4.8
6.8
12 29 435 46
13 175
310
510
916
365
i oIQft
300
445
748
352
44 fiQ
440
7QO
916
560
o
New
mak
e-up
Lowe
r qu
arti
le_-
_ -__
___-
___-
---
_ __
-
Uppe
r qu
arti
le. ________--_--______---------
Maximum... _
-___
___
- -
----
- -
- __ __
0 4.8
10 62 725 85
0 4.0
7.9
26 725 63
2.7
12. 5
43 210
652
451
0 1. 8
3. 5
6. 9
443.
8
0 1.4
2.9
4.9
12 3.4
0 3.9
7.9
18 449.3
4 6
8. 7
16 74 725 90
4.6
8. 1
11 35 725 67
Q
I
21 5100 K
660
461
Con
sum
ptio
n
Medi
an. __
____
__ __
___
___
__
- ______
0 2.5
6.0
8.0
31 6. 1
0 2.8
5.4
7.1
31 6.2
0 .912 21 26 4.
3
0 .3 1.3
'4.3
311.
2
0 . 2 .9 3. 7
12 1. 1
0 .3 3.0
15 31 2. 5
0 3.8
7 Q
12 52 7.4
0 4.2
6.7
10 427.
5
0 1. £
20 34 52 6.7
Eff
luen
t
Min
imum
__.
__
__
__
____
____
__
____
__
__L
ower
quar
tile
. __
__
__
__
----
-_--
--_
_
____
__
Upper
qua
rtil
e__
-_--
__
___
____
____
____
__
Av
era
ge.-
.---
----
----
- _--
___--
----
----
__
0 1.0
3.0
49 725 78
0 . 9
2.4
13 725 55
0 1.7
17 170
652
444
0 .05
.9 2. 9
442.
5
0 .05
.6 2.2
19 2. 2
0 .2 1.6
6.9
447.7
0 2.7
5.2
59 745 81
0 2.4
4.5
1774
5 58
0 3 Q
27 125
660
453
TAB
LE 1
0.
Wat
er r
equi
rem
ents
of s
elec
ted
oper
atio
ns,
in g
allo
ns o
f w
ater
per
bar
rel
of c
rude
cha
rge
[Cha
rge
as r
epor
ted
in O
il an
d G
as J
ourn
al (
1956
c)]
Wat
er r
equi
rem
ents
and
di
spos
ition
Cru
de d
isti
llat
ion
unit
s
Coo
l
ing
Boi
ler
feed
Tot
al
Vac
uum
dis
tilla
ti
on u
nits
Coo
l
ing
Boi
ler
feed
Tota
l
The
rmal
cra
ckin
g un
its
Coo
l in
gB
oile
r fe
edT
otal
Cat
alyt
ic c
rack
ing
unit
s
Coo
l in
gB
oile
r fe
edT
otal
Cat
alyt
ic r
efor
min
g un
its
Coo
l in
gB
oile
r fe
edT
otal
Pol
ymer
izat
ion
unit
s
Coo
l
ing
Boi
ler
feed
Tota
l
Alk
ylat
ion
unit
s
Coo
l in
gB
oile
r fe
edT
otal
Gro
ss c
ircu
latio
n
34 8.6
160
300
470
905
356
34.7
3.
7 5.
5 11
43
5 7.5
34
13 175
310
510
916
365
13
19
118
215
345
655
223
14 .8
2.
8 5.
8 11
17
5.4
16
36
140
230
4SO
954
334
22
23
260
500
950
2,47
0 i
348
23.4
4.
4 8.
3 15
27
8 7.4
24
88
270
500
950
2,48
0 32
19
294
520
1,00
0 1,
400
2,06
0 88
4
20 1.4
8.0
11
16
39
10
23
299
670
1,00
0 1,
400
2,10
0 96
1
17 9.7
520
840
1,15
0 1,
900
882
17 0 2.2
5.0
12
158 8.
1
19
21
700
950
1,23
0 2,
040
874
14
806
1,44
0 2,
350
4,20
0 11
,840
2,
470
14 0 4.0
35
92
177 26
16
840
1,25
0 2,
000
3,50
0 12
, 010
2,
350
9 21
1,40
0 2,
600
4,40
0 7,
010
2,94
0
10 4.2
47
51
68
133 78
10
64
1,40
0 3,
300
4,79
0 7,
080
3,29
0
New
mak
eup
34 0 4.8
10
62
725 85
34 0 1.8
3.5
6.9
44 3.8
34 4.6
8.7
16
74
725 90
14 .0
7 4.
3 12
31
96
27
15 .8
1.
4 4.
0 8.
8 13
4.2
16 3.9
12
21
34
623 37
22 0 12
19
43
1,33
0 81
23 .3
3.
3 6.
1 7.
3 23
3.6
24 1.8
15
25
50
1,34
0 73
20 6.2
19
31
43
294 45
21 .7
5.
2 8.
0 12
36
7.2
23
13
27
38
53
707
109
17 6.7
13
26
38
80
29
17 0 1.9
5.0
11
93 6.3
19 8.4
23
37
49
781
116
15
24
57
108
140
1,18
0 32
2
15 0 4.9
22
54
150 18
16
39
82
125
390
1,20
0 39
6
9 1.5
26
69
165
429
195
10 1.0
16
28
50
127 61
10 2.5
64
123
235
562
254
Con
sum
ptio
n
Low
er q
uart
ile.
. ...........
Upp
er q
uart
ile _
__
____
34 0 2.5
6.0
8.0
31 6.1
34 0 .3
1.
3 4.
3 31
1.2
34 0 3.8
7.9
12
52 7.4
13 0 3.0
5.7
9.0
46 6.2
14 0 .1
1.
3 5.
6 9.
5 2.
1
16 0 4.3
8.2
15
21
10
22 0 5.0
12
17
96 5.3
23 0 .0
8 1.
9 6.
0 23
1.4
24 0 3.8
12
19
103 6.
4
19 0 7.6
15
25
40
14
20 0 .8
3.
37.
2 18
2.7
23 0 16
19
26
50
20
17 4.1
10
17
24
80
18
17 0 .3
1.
4 8.
8 88
3.3
19 4.1
15
22
31
98
23
14 0 20
37
67
238 37
14 0 0 2.2
42
133 12
16 0 25
44
64
282 48
9 1.2
19
60
92
168 60
10 0 3.5
20
35
53
15
10 1.3
35
79
116
221 77
Eff
luen
t
Min
imum
..
.............
Low
er q
uart
ile .
..........
Upp
er q
uart
ile
.._
__
__
34 0 1.0
3.0
49
725 78
34 0 .0
5 .9
2.
9 44
2.5
34 0 2.7
5.2
60
745 81
13 0 .7
4.
1 25
10
8 20
14 0 .0
1 .7
1.
7 5.
6 1.
6
16 0 1.8
5.3
14
102 19
22 0 1.0
4.6
34
1,24
0 76
23 0 .0
1 .9
2.
4 16
1.8
24 0 1.2
7.6
24
1,24
0 66
19 0 2.2
6.0
12
294 27
20 0 .2
1.
6 5.
2 20
2.6
23 0 5.0
11
20
671 85
17 0 .9
3.
0 14
22
11
17 0 0 .5
2.
2 9.
5 2.
5
19 0 1.5
5.5
17
744 9
14 0 2.0
28
115
1,18
0 23
2
14 0 0 2.2
7.2
20 3.5
16 0 16
33
100
1,20
0 29
9
9 0 1.6
11
59
349
133
10 0 2.2
6.2
24
127 46
10 0 4.4
41
91
477
173
00 ^
» »
H
£> H 3 B H

PETROLEUM REFINING INDUSTRY 309
WATER-QUALITY REQUIREMENTS
The various uses of water within a refinery have different water- quality requirements. For example, in a gulf coast refinery described by Resen (1957) salty water is used for once-through cooling, and high-quality demineralized water is used for high-pressure boilers.
Although water quality is less important than quantity for petro leum refineries, a water of good quality is desirable. Most sources of water provide both sufficient quantities and suitable qualities for all water needs. Most refineries use sources that will yield sufficient water and will satisfy the quality requirements by treatment. In some refineries special equipment is installed to permit low-quality water to be used without treatment for some processes. As cost is the deciding factor in choosing between the treatment of water of poor quality and the installation of special equipment for its use, quality is a problem of economics. Brooke (1954) showed that com plete treating and softening of all cooling water became profitable in less than 4 years and provided many intangible benefits.
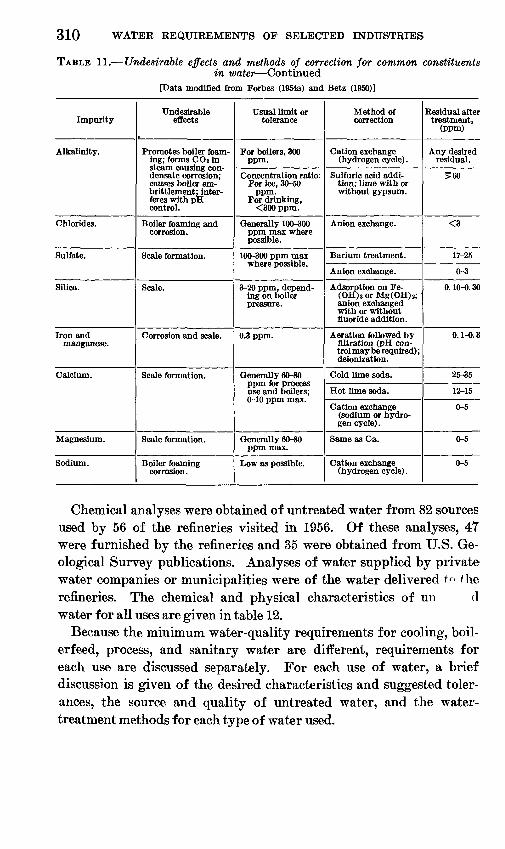
Technical literature contains many references to methods of treat ing the intake water of petroleum refineries (Forbes, 1954a and b; Kelly, 1946). Usual tolerances, undesirable effects, and methods of removal of the undesirable constituents in water as suggested by Forbes (1954a and b) and Betz (1950) are given in table 11.
TABLE 11. Undesirable effects and methods of correction for common constituentsin water
[Data modified from Forbes (1954a) and Betz (1950)]
Impurity
Hydrogen sulfide.
Carbon dioxide.
Oxygen.
Suspended solids.
Oil.
Undesirable effects
Odor, corrosion, and chlorine demand.
Corrosion if alkalinity is low.
Corrosion and pitting.
Impede water flow, retard heat transfer, aid corrosion.
Causes sludges to bake on in form of scale. Causes boiler foaming.
Usual limit or tolerance
<0.5 ppm.
Alkalinity
Carbon dioxide
<0.007 ppm in boilers and economizers.
<5 ppm.
1 ppm (7 ppm max).
Method of correction
Aeration, Chlorina- tion, and Filtration.
Aeration, neutraliza tion with alkalies, and acid treatment of boiler-feed wastes.
Hot deaeration.
Cold vacuum deaera tion.
Sedimentation and filters.
Plus coagulant chemi cals where necessary.
Coalecing followed by skimming.
Absorption with pre formed floe followed by filtration.
Residual after treatment,
(ppm)
<1
5-10
<0.007
0.1-0.3
<5
<1
5
<1
310 WATER REQUIREMENTS OF SELECTED INDUSTRIES
TABLE 11. Undesirable effects and methods of correction for common constituentsin water Continued
[Data modified from Forbes (1954a) and Betz (1950)]
Impurity
Alkalinity.
Chlorides.
Sulfate.
Silica.
Iron and manganese.
Calcium.
Magnesium.
Sodium.
Undesirable effects
Promotes boiler foam ing; forms COz in steam causing con- densate corrosion; causes boiler em- brittlement; inter feres with pH control.
Boiler foaming and corrosion.
Scale formation.
Scale.
Corrosion and scale.
Scale formation.
Scale formation.
Boiler foaming corrosion.
Usual limit or tolerance
For boilers, 300 ppm.
Concentration ratio: For ice, 30-50
ppm. For drinking,
<300 ppm.
Generally 100-300 ppm max where possible.
100-300 ppm max where possible.
3-20 ppm, depend ing on boiler pressure.
0.3 ppm.
Generally 60-80 ppm for process use and boilers; 0-10 ppm max.
Generally 60-80 ppm max.
Low as possible.
Method of correction
Cation exchange (hydrogen cycle) .
Sulfuric acid addi tion; lime with or without gypsum.
Anion exchange.
Barium treatment.
Anion exchange.
Adsorption on Fe- (OH)aorMg(OH) 2 ; anion exchanged with or without fluoride addition.
Aeration followed by filtration (pH con trol may be required) ; deionization.
Cold lime soda.
Hot lime soda.
Cation exchange (sodium or hydro gen cycle) .
Same as Ca.
Cation exchange (hydrogen cycle).
Residual after treatment,
(PPm)
Any desired residual.
^60
<3
17-25
0-3
0. 10-0. 30
0.1-0.3
25-35
12-15
0-5
0-5
0-5
Chemical analyses were obtained of untreated water from 82 sources used by 56 of the refineries visited in 1956. Of these analyses, 47 were furnished by the refineries and 35 were obtained from U.S. Ge ological Survey publications. Analyses of water supplied by private water companies or municipalities were of the water delivered t^ the refineries. The chemical and physical characteristics of un d water for all uses are given in table 12.
Because the minimum water-quality requirements for cooling, boil- erfeed, process, and sanitary water are different, requirements for each use are discussed separately. For each use of water, a brief discussion is given of the desired characteristics and suggested toler ances, the source and quality of untreated water, and the water- treatment methods for each type of water used.

PETROLEUM REFINING INDUSTRY 311
TABLE 12. Quality characteristics of untreated water for all uses[Data expressed in parts per million unless otherwise indicated. These data are based on individual
observations available and are not balanced analyses]
Constituent
Silica (SiOs)
Calcium (Ca)-. . _
Sodium and potassium (Na+K) ....
Sulfate (SOO ~ _ -Chloride (C.)_ Fluoride (F)-_- . __ - .....Nitrate (NO3)-. ___ - _
Hardness as COs: Total
pH__ ....... _ _ _. .
Number of samples
52 38 64 63 34 69 64 75 28 28 50
76 63
1974
Concentration
Minimum
2.4 .00
2.8 .7
1.0 17
.8 1.0 .0 .0
46
10 0
1 6.0
Lower quart ile
6.6 .04
18 4.4 7.8
76 17 15
.0
.4 146
67 0
37.2
Median
12 .10
42 12 19
167 59 28
.1 1.5
265
144 20
5 7.6
Upper quart ile
18 .57
69 25 54
270 152 66
.4 4.5
520
275 56
107.8
Maximum
60 14
220 83
266 484 565
1600 1.2 8.1
3500
850 550
22 9.1
COOLING WATER
Water for cooling, the largest use in refineries, ranges in quality from sea water for once-through systems to high-quality water for circulating systems. In general, cooling water should be of sufficient ly good quality to keep corrosion, scale formation, organic slimes, and deposits of sediment to a minimum. Temperature is a major consideration in the selection of a source, especially where once- through cooling is used. Quality tolerances of water for cooling as suggested by the American Water Works Association are given in table 13.
TABLE 13. Quality tolerances of cooling water suggested by American Water WorksAssociation
[Data modified from Am. Water Works Assoc. (I960)]Limiting
values Constituent or property (ppm)
Hardness as CaCO3________________________________________________ 50Iron (Fe)___._________________________________________________ . 5Manganese (Mn)__________________________________________________ . 5Iron plus manganese__-----_-__--________-_-___-__-_-_---------_-_- . 5Turbidity______________________________________ 50Corrosiveness.____________________________________________________ NoneSlime formation ___________________________________________________ None
PUBIJSHED INFORMATION
In an extensive survey of refinery cooling-water systems, Helwig and McConomy (1957) reported that fouling and corrosion occurred in all cooling-water systems when no treatment was provided. They noted that where dissolved solids, specific conductance, temperatures, and velocities were high, corrosion was accelerated. Their survey in-

312 WATER REQUIREMENTS OF SELECTED INDUSTRIES
dicated that, in general, corrosion increased in circulating-water sys tems if the pH dropped below 7.5, whereas corrosion was mild if the pH was above 8.0. Refineries were actively and effectively com bating fouling and corrosion by chemical treatment, cathodic pro tection, and the use of special construction materials. The most prevalent treatment method^ reported were (a) pH adjustment with sulfuric acid or soda ash, (b) control of slime and algae growth with chlorine and other algicides, and (c) control of corrosion and fouling with polyphosphates, chromates, and silicates. Helwig and McCon- omy also reported on the effectiveness and cost of the various types of chemical treatment.
Miller (1951) also discussed the objectives and techniques of cooling-water treatment. He noted that when open-circulating cooling-water systems were used, treatment problems increased owing to concentration effects.
In coastal areas low-quality water, such as sea water, is used by refineries for cooling. An average use of 128.5 mgd of sea water for most cooling in the Bay way refinery of the Standard Oil Co. (1950) is described in "The Lamp."
The successful utilization of sewage effluent for cooling and for boiler-feed water by the Big Spring refinery of the Cosden Petroleum Corp. is reported by McCormick and Wetzel (1954). Sewage efflu ent created such problems as foaming in boilers and excessive slime growth in cooling systems, but these problems were corrected by modifications of standard treatment procedures. The authors noted that, with the exception of the additional expense due to increased chlorine demand, the cost of treating sewage effluent is only slightly higher than the cost of treating chemically comparable natural water.
FINDINGS OF THIS SURVEY
In the 1956 survey data were obtained on the chemical and physical characteristics of the untreated cooling water used by 68 petroleum refineries. The chemical analysis of one treated sewage effluent as delivered to the refinery was obtained, but no analyses of sea water were included. Several refineries use the same source of water for once-through and circulating cooling systems. The sum of the num ber of analyses of cooling water will not therefore, always be equal to the total number of analyses of water from all sources.
Table 14 shows the chemical and physical characteristics of un treated water that was supplied to the circulating cooling systems of 48 refineries and to the once-through systems of 26 others. Mini mum, lower quartile, median, upper quartile, and maximum values are given for each constituent and characteristic of once-through and circulating water for which there are a sufficient number of samples.
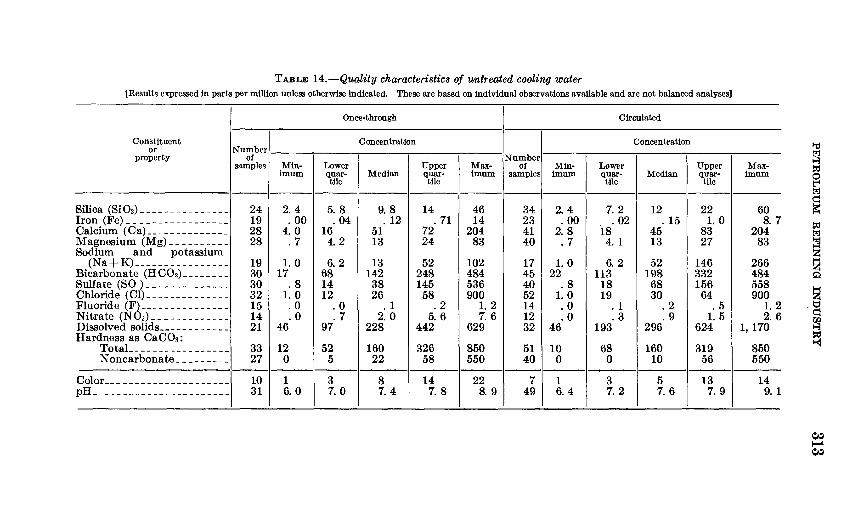
TABLE 14. Quality characteristics of untreated cooling water [Results expressed in parts per million unless otherwise indicated. These are based on individual observations available and are not balanced analyses]
Constituent or
property
Silica (SiOs) Iron (Fe). ------ --------
Magnesium (Mg) __________Sodium and potassium
(Na+K)_____. -____ _.Bicarbonate (HC03) ___--_.Sulfate (SO.) Chloride (01) ___________Fluoride (F)______ _ _ __Nitrate (N03)----_--------
Hardness as CaC03 : Total ____ __ __-_-_
Color_____ __ _ T->HT pH ____________________
Once-through
Number of
samples
24 19 28 28
19 30 30 32 15 14 21
33 27
10 31
Concentration
Min imum
2.4 .00
4.0. 7
1.0 17
. 8 1.0 .0 .0
46
12 0
1 6.0
Lower quar- tile
5.8 .04
16 4.2
6.2 68 14 12
.0
.7 97
52 5
3 7.0
Median
9.8 . 12
51 13
13 142 38 26
. 1 2.0
228
160 22
8 7.4
Upper quar- tile
14 . 71
72 24
52 248 145 58
.2 5.6
442
32658
147.8
Max imum
46 14
204 83
102 484 536 900
1.2 7. 6
629
850 550
22 8. 9
Circulated
Number of
samples
34 23 41 40
17 45 40 52 14 12 32
51 40
7 49
Concentration
Min imum
2.4 .00
2.8.7
1.0 22
.8 1.0 .0 .0
46
10 0
1 6.4
Lower quar- tile
7.2 .02
18 4. 1
6.2 113
18 19
. 1
.3 193
68 0
3 7.2
Median
12 . 15
45 13
52 198
68 30
.2
.9 296
160 10
57.6
Upper quar- tile
22 1.0
83 27
146 332 156
64 .5
1.5 624
319 56
13 7.9
Max imum
60 8.7
204 83
266 484 558 900
1.2 2.6
1,170
850 550
14 9.1
00I 1 00

314 WATER REQUIREMENTS OF SELECTED INDUSTRIES
Additional information on dissolved solids, total hardness, bicarbon- ates, and sulfates is shown in figures 44 and 45.
INDICATED
O Ui C IV\L
30 san
E2
tples
mJ 100 200 300 400 500 6C
SULFATE (SO4), IN PARTS PER MILLION
30 samples
100 200 300 400 500
BICARBONATE (HCO,), IN PARTS PER MILLION
600
33 samples
E3100 200 300 400 500 600 700
TOTAL HARDNESS AS CaCO3 , IN PARTS PER MILLION800
0 200 400 600 800 DISSOLVED SOLIDS, IN PARTS PER MILLION
FIGURE 44. Frequency distribution of selected chemical constituents in untreated waterfor once-through cooling.
Waters used for once-through and for circulating cooling were similar in quality; however, water used for once-through cooling was of slightly higher quality. The use of higher quality water for once- through cooling is not due to higher requirements but is probably due to the availability of better quality water in areas of plentiful supply where recirculation is not necessary.
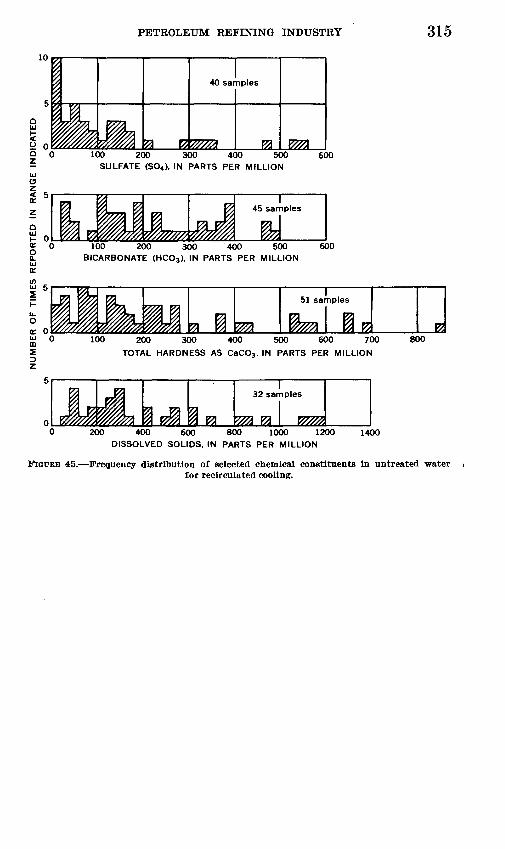
PETROLEUM REFINING INDUSTRY 315
I 5
40 samples
100 200 300 400 500 SULFATE (SO4 ), IN PARTS PER MILLION
600
145 samples
100 200 300 400 500 BICARBONATE (HCO 3 ), IN PARTS PER MILLION
600
<r 0UJffi5
I51 samples
100 200 300 4OO 500 600 700
TOTAL HARDNESS AS CaCO3 , IN PARTS PER MILLION
800
32 samples
200 400 600 800 1000 1200
DISSOLVED SOLIDS, IN PARTS PER MILLION1400
FIGURE 45. Frequency distribution of selected chemical constituents in untreated waterfor recirculated cooling.
316 WATER REQUIREMENTS OF SELECTED INDUSTRIES
Most refinery intake water is treated to provide the desired quality of cooling water. Although water from only 10 of the 39 sources of once-through cooling water was given treatment, which varied from screening to sedimentation and filtration, water from 52 of the 69 sources of circulating water was given some type of treatment. Table 15 shows the methods used for treating once-through and circulating cooling water at the refineries visited.
BOILER-FEED WATER MAKEUP
Large amounts of high-quality water are used by petroleum re fineries to produce low- and high-pressure steam. Untreated water is generally not satisfactory for this use; therefore, careful considera tion is given to the selection and treatment of makeup water for boiler-feed to prevent excessive corrosion, scale formation and em- brittlement.
Experience at a gulf coast industrial plant indicates the importance of high-quality boiler feed. During World War I the plant had three boilerhouses: one on steam, one on standby, and one being cleaned. The boiler-feed water was not treated, and the average on-stream time for a boiler was 2 to 3 weeks. Later the feed water was given internal treatment, and the boilers could be operated for as long as 2 months between cleanings. Modern boilers, which operate on softened and internally treated waters, may never need cleaning and will be opened only for annual inspection (Brooks, 1954).

TABLE 15. Treatment of makeup water for cooling [Figures refer to frequency of use of various types of water treatment. Prior treatment of purchased water is not considered]
Type of treatment
Screening... _. ______
Sedimentation _ _____Filtration.--. ________Softening:
Disinfection and algae control:
Chlorination. _____Organic com-
pounds---------Other_-__-------
Corrosion and scale control:
Chromates. _______
Dianodic_____--_-pH adjustments- _.Other.. _ __ __
Once-through cooling water
Self-supplied
Ground water
Fresh
12
1
2
Saline
1
Surface water
Fresh
81
1 3
2
Saline
4
-
Public supplied
Surface water
Fresh
5
1
1
Total
30 1
1 3
1
3
3
Circulating cooling water
Self-supplied
Ground water
Fresh
4
1
51
12
5 8
6 12
2 15
6
Saline
1
1
Surface water
Fresh
4 4 3
3 1
7
21
2 3
31
Saline
1
Public supplied
Ground water
Fresh
1
1 1 1
1
1 2
2 2
31
Saline
1
1
Surface water
Fresh
4
1
1
1
1
4 1 4
Sewage effluent
1
Total
10
6 5 5
10 3
20
9 13
10 21
327
8

318 WATER REQUIREMENTS OF SELECTED INDUSTRIES
PUBLISHED INFORMATION
There are many textbooks and manuals on industrial water condi tioning (for example: Nordell, 1951; Powell, 1954; Betz, 1950; and the Permutit Co., 1947) that discuss the general problems caused by impurities in boiler-feed water and the treatments used to remove undesirable impurities. The boiler-feed water problems of petroleum refineries, however, are usually individual problems and require specialized treatments for satisfactory solutions.
Eesen (1957) described the solution of a makeup-water problem for high-pressure boilers, at the Port Arthur, Tex., refinery of the Gulf Oil Corp., by the use of special treatment. The surface water used for boiler-feed makeup in the generation of low pressure steam had been treated by coagulation, gravity filtration, and zeolite soften ing. Steam turbines obtained to drive centrifugal compressors and other equipment required the use of high-pressure steam. This steam must be free of silica to prevent the deposition of silica on the tur bines, which causes reduced efficiencies and early maintenance shut downs. The desired high-quality water for the high-pressure boilers was obtained by passing the gravity-filtered makeup water through an ion-exchange demineralization unit, which lowers the mineral con tent to less than 6 ppm of dissolved solids and the silica content to less than .01 ppm.
McCormick and Wetzell (1954) described the use of sewage effluent instead of hard ground water for boiler-feed water makeup. In early 1944 the refinery was using water with hardness ranging from 700 to 1,300 ppm. Scaling was a serious problem in boilers and in other heat exchange equipment, and water treatment experts could not provide a practical solvent for the scale. In July 1944, Cosden contracted for use of the sewage effluent from the city of Big Spring, Tex. At first the effluent used for boiler-feed water makeup was treated by the hot-lime process, anthracite filtration, and internal phosphate treatment in the boiler drums. This treatment was not entirely satisfactory as foaming and priming resulted. McCormick and Wetzel reported, however, that satisfactory operation was at tained by changing to a hot-phosphate treatment in an external treater followed by the injection of a foam suppressing agent into the boiler drum.
FINDINGS OF THIS SURVEY
Chemical analyses of the untreated makeup waters for boiler feed used by the refineries surveyed were obtained where possible. Anal yses were obtained of water from 55 sources: 40 were company wells or surface water, 14 were public supplies, and 1 was sewage effluent. Two samples from company wells could be classified as slightly to
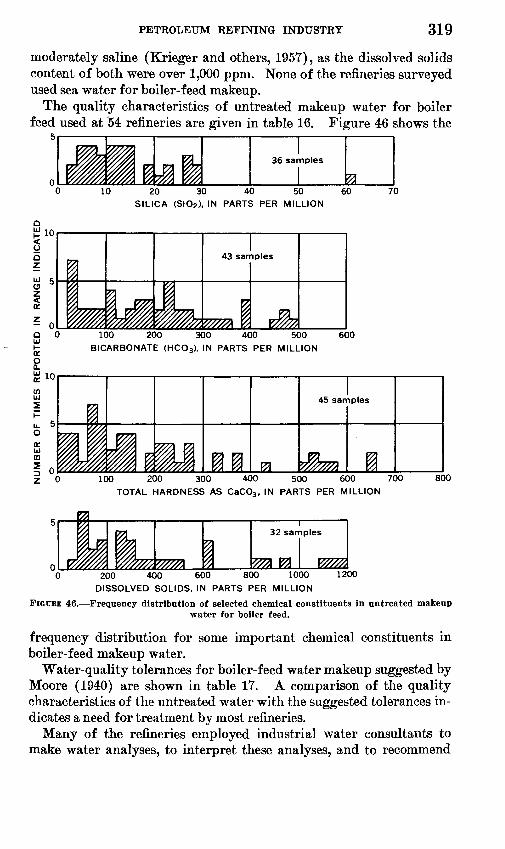
PETROLEUM REFINING INDUSTRY 319
moderately saline (Krieger and others, 1957), as the dissolved solids content of both were over 1,000 ppm. None of the refineries surveyed used sea water for boiler-feed makeup.
The quality characteristics of untreated makeup water for boiler feed used at 54 refineries are given in table 16. Figure 46 shows the
5
36 samples
10 20 30 40 50 SILICA (SiO2 ), IN PARTS PER MILLION
60 70
0 100 200 300 400 500BICARBONATE (HCO 3), IN PARTS PER MILLION
600
45 samples
100 200 300 400 500 600 700 TOTAL HARDNESS AS CaCO3 , IN PARTS PER MILLION
800
^^1
32 samples
12000 200 400 600 800 1000 DISSOLVED SOLIDS, IN PARTS PER MILLION
FiotJEB 46. Frequency distribution of selected chemical constituents in untreated makeupwater for boiler feed.
frequency distribution for some important chemical constituents in boiler-feed makeup water.
Water-quality tolerances for boiler-feed water makeup suggested by Moore (1940) are shown in table 17. A comparison of the quality characteristics of the untreated water with the suggested tolerances in dicates a need for treatment by most refineries.
Many of the refineries employed industrial water consultants to make water analyses, to interpret these analyses, and to recommend

320 WATER REQUIREMENTS OF SELECTED INDUSTRIES
TABLE 16. Quality characteristics of untreated boiler-feed makeup water [Results expressed in parts per million unless otherwise indicated. These are based on individual observa
tions available and are not balanced analyses]
Constituent or property
Silica (SiOj). ..... ...............Iron (Fe).. - __ __.__..__
Sodium and potassium (Na+K)-___
Sulfate (S)*... - _-.- Chloride (Cl). ....___.____ ...........
Nitrate (NO3). .....................
Hardness as CaCOs: Total.......... ..............
DH.._ _ _.
Number of samples
36 24 43 43 21 49 45 54 15 15 33
55 44
1051
Concentration
Minimum
2.4 .00
2.8 .7
1.0 22
.8 1.0 .0 .0
46
10 0
16.4
Lower quartile
6.9 .03
18 4.1 6.0
86 18 18
.1
.7 151
66 0
37.2
Median
12 .10
39 14 24
186 62 33
.2 1.5
286
142 14
5 7.6
Upper quartile
19 .58
68 25 69
270 148 74
.5 4.0
622
272 52
147.8
Maximum
60 7.2
173 56
266 484 558 465
1.2 7.6
1170
644 416
22 9.1
TABLE 17. water-quality tolerance for boiler-feed water [Data from Moore (1940)]
ConstituentSuggested water-quality tolerance (ppm.) at pressure (psi)
indicated
Oxygen consumed _ __ _Dissolved oxygen 1Hydrogen sulfide (H2S)Total hardness as CaCO3 _____ Aluminum oxide (AljOs)- --Silica (SiOi)__________. ______Bicarbonate (HCO3) 1 ______ _Carbonate (CO3)__ ____ _ _Hydroxide (OH)______ ___ __Total solids 3 __ ___ _ _ ___
Color... _____ _____ _______pH value (minimum) ___Turbidity... _ _ _ ______Sulfate-carbonate ratio 4
(Na,SO4 :Na,CO3)__ -
0-150
151. 4
2 580
54050
20050
500-3, 000
808. 0
20
1:1
150-250
10. 14
2 340
. 52030
10040
500-2, 500
408.4
10
2:1
250-400
4.0
010
.0555
4030
100-1, 500
59.05
8:1
>400
3.0
02 .01
10
201550
29. 61
3:1
1 Limits applicable only to feed water entering boiler, not to original water supply.2 Except when odor in live steam would be objectionable.3 Depends on design of boiler.4 American Society of Mechanical Engineer standards.
treatment of the boiler-feed water. In other refineries consideration of problems of water quality and treatment ranged from giving no thought to the problems to assigning several full-time staff members to the work.
Of the 137 sources of makeup water for boiler feed, 3 received no treatment by the refinery; 2 were municipal supplies and 1 was a company well. External treatment of makeup water for boiler feed, either by the lime-soda or by the zeolite process, was the most common method (table 18). Internal treatment with chemicals for scale and corrosion control was second in frequency of use.
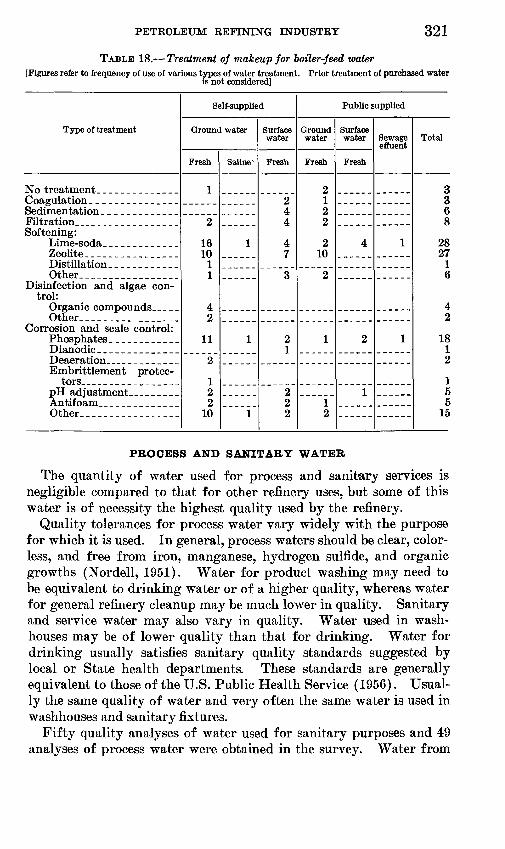
PETROLEUM REFINING INDUSTRY 321
TABLE 18. Treatment of makeup for boiler-feed water[Figures refer to frequency of use of various types of water treatment. Prior treatment of purchased water
is not considered]
Type of treatment
No treatment. _ _ _ _ _ _Coagulation. ____ _ _____ _Sedimentation. _______Filtration.. _____ _ ___ _Softening:
Lime-soda. _ ___ _ _Zeolite. ________Distillation _ ___ _____Other _ ___ ___ _ ___
Disinfection and algae con trol:
Organic compounds, _____ Other _ ____ ____ _ __
Corrosion and scale control: Phosphates __ ___ _ _Dianodic___ ____ ___ _Deaeration __ _ _Embrittlement protec
tors __ _pH adjustment. ___ _ _Antifoam. __ _ ____Other. _ __ ____ __ _
Self-supplied
Ground water
Fresh
1
2
16 10
1 1
4 2
11
2
1 2 2
10
Saline
1
1
1
Surface water
Fresh
24 4
4 7
3
2 1
2 2 2
Public supplied
Ground water
Fresh
2 1 2 2
2 10
2
1
1 2
Surface water
Fresh
4
2
1
Sewage effuent
1
1
Total
3 368
28 27
1 6
4 2
18 1 2
1 5 5
15
PROCESS AND SANITARY WATER
The quantity of water used for process and sanitary services is negligible compared to that for other refinery uses, but some of this water is of necessity the highest quality used by the refinery.
Quality tolerances for process water vary widely with the purpose for which it is used. In general, process waters should be clear, color less, and free from iron, manganese, hydrogen sulfide, and organic growths (Nordell, 1951). Water for product washing may need to be equivalent to drinking water or of a higher quality, whereas water for general refinery cleanup may be much lower in quality. Sanitary and service water may also vary in quality. Water used in wash- houses may be of lower quality than that for drinking. Water for drinking usually satisfies sanitary quality standards suggested by local or State health departments. These standards are generally equivalent to those of the U.S. Public Health Service (1956). Usual ly the same quality of water and very often the same water is used in washhouses and sanitary fixtures.
Fifty quality analyses of water used for sanitary purposes and 49 analyses of process water were obtained in the survey. Water from
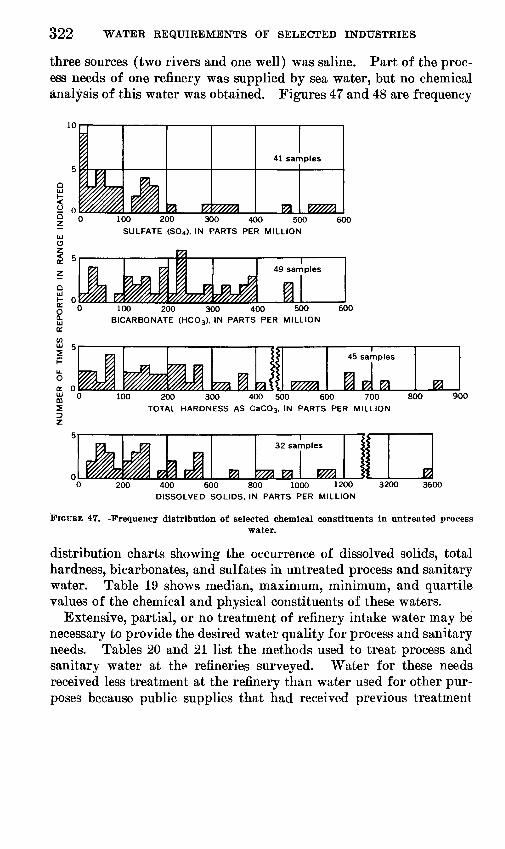
322 WATER REQUIREMENTS OF SELECTED INDUSTRIES
three sources (two rivers and one well) was saline. Part of the proc ess needs of one refinery was supplied by sea water, but no chemical analysis of this water was obtained. Figures 47 and 48 are frequency
10
01 0UJ CD5D Z
41 samples
155 V////A100 200 300 400 500
SULFATE (SO4), IN PARTS PER MILLION600
100 200 300 400 500 600 BICARBONATE (HCO 3), IN PARTS PER MILLION
5553
45 samples
J100 200 300 400 500 600 700 800
TOTAL HARDNESS AS CaCO 3, IN PARTS PER MILLION
900
32 samples
200 400 600 800 1000 1200 DISSOLVED SOLIDS, IN PARTS PER MILLION
3200 3600
FIGURE 47. Frequency distribution of selected chemical constituents in untreated processwater.
distribution charts showing the occurrence of dissolved solids, total hardness, bicarbonates, and sulf ates in untreated process and sanitary water. Table 19 shows median, maximum, minimum, and quartile values of the chemical and physical constituents of these waters.
Extensive, partial, or no treatment of refinery intake water may be necessary to provide the desired water quality for process and sanitary needs. Tables 20 and 21 list the methods used to treat process and sanitary water at the refineries surveyed. Water for these needs received less treatment at the refinery than water used for other pur poses because public supplies that had received previous treatment

PETROLEUM REFINING INDUSTRY 32315
10
O 0
h-"O
39 samples
100 200 300 400 500 600
SULFATE (SO4), IN PARTS PER MILLION
42 samples
0 100 200 300 400 500 600
BICARBONATE (HCO3 ), IN PARTS PER MILLION
46 samples
100 200 300 400 500 600
TOTAL HARDNESS AS CaCO3 , IN PARTS PER MILLION
700
33 samples
200 400 600 800 1000
DISSOLVED SOLIDS, IN PARTS PER MILLION
1200
FIGURE 48. Frequency distribution of selected chemical constituents in un treated sanitary and service water.
were the source of process water for a quarter of the refineries and the source of sanitary water for half of the refineries. Process water from only 18 of the 58 sources and sanitary water from only 13 of the 65 sources received treatment at the refinery. Several refineries had multiple sources of water; the low-quality needs were supplied from sources receiving no treatment, and the high-quality needs were ob tained from sources receiving previous treatment.
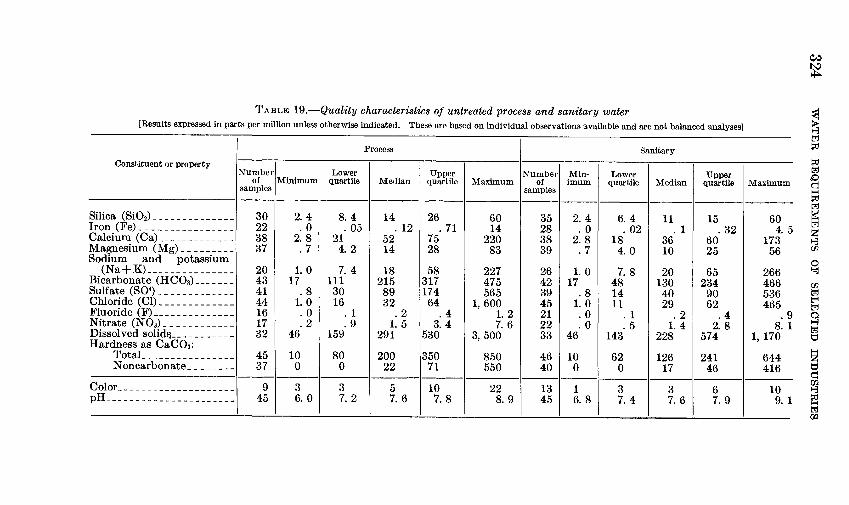
324W
AT
ER
R
EQ
UIR
EM
EN
TS
O
F
SE
LE
CT
ED
IN
DU
ST
RIE
S
IIssC3 OB
^3
SSC3
&<
5-^ .a-S
a<S
o
?? S
C3 So-os
"d1-1
s«
g
« 3
r^
'§H
is
>,(SIScoCO2PH
aw03
s|&&
t> o-i 30)
^
« E
H
siaaS
|<3
M
|«1
g
g
a|C9
S
|sago*
_C9 3§
&=§^^M
1-3 o1
a3a§x
f-a
§ ° Sg
«
g aOS "33 J
lO
OS
i-H
O *
CO CO
C
OC
OC
OIO
'O
OO
^ CO
CO
1>
1C
CO CO
CO CO
I>
TJ( i-H
i-H
C3
^ lO
^
^H
CO
^^H
~
(MCO
^* 0
0
lO
' O 1C
lO
-^O
lM
' C? Tt<
,-H CO
! ' CO
C3
CO CO
OS CO
1>-
^
(M
lO
<M
TH
<M
T^
1-1 'c
OO
O
OO
OS
' ,-i G
O
CO
I>,-H
CO
^H
(M CO
Tt«
M
(M
(M i-l
,-H
(M
^H
(M <* O
O
G
O
^H
iO
CO
' G
O -^
I>
GO
* i-H
'
' CO
(MO
,-H
^^ CIS GO
!>
CD
G
O C
D C
D C
D
(M
'(M
' i-il>
°i-<
'
'cO
O
O
lOG
OO
OO
S
CO (M
OS lO
i-l (M CO
C
OO
CO
(M CO
CO
(M *
CO Tt< (N
(M CO
*
*
(MC
O
CO i-( (M
GO
(M
I>C
OO
O
iC
iOC
^l C
^^iO
CO
lO
G
OiO
i-T co"
i-i
CO
'lO
GO
G
Or^
^l
1 'C
OO
O
i 1
C^l
!> C
^l >-O i^
!> CO
CO
*-O
!>
CO i-l
lO
CO
(Mi-l (M
lO
*
'(M-*
O
OlO
OS
IM
'i-ii-
l O
(Mi-l
lO i '
i-l i-l GO
CO
OS
O (M
(M
(M
(M
Tt<
0
(M
-*
i-l OS
OC) " ,-H
^5
I> i-( O
CO
' ' O
s O
O(M
i-H
CO i-l
1C
GO
1-1 1-1
^<
OG
OI>
O
G
O O
O (M
C^l
C^
i*^ t^* i*^
CO
CD
^5
CO C
^l CO CO
C
^l ^f ^
* ^^ i 1 i~H CO
^* CO
a'SCO
Ho
c5 a
M1
W
^2" 03
C3^
vS_
^3
G-
__^ ^3
^
2
g
o a *c
--26
og
g ° §_ ^
x_
xfij
Q ^ d "T
" O
Q
^
QJ
^. O
O
O
s^x S S
S o3 *^ -*^ "C *C ~£* 'X
^ E^ ^
O
Cj
^
k^lT
d r
^
o3 'i^
Q
O
fcn tW
j^,
^AoS
^^slolisw
i-H
^H
OS
CO
I>
CO
CO
I>^
CO
I>00
^H
CO
CO 1CO
S
<MO
(5 (N
GO
ot-^
,-H
COiC
t^(M
cot^o
CO
CO
OS lO
fcnooM
0
a

PETROLEUM REFINING INDUSTRY 325
TABLE 20. Treatment of makeup for process water[Figures refer to frequency of use of various types of water treatment. Prior treatment of purchased water
is not considered]
Type of treatment
Coagulation _ __. _--_____
Softening:
Other. _ _-_.. _ _____Disinfection and algae con-
Corrosion and scale control:
pH adjustment __ _____Other_-----_-__----_-_
Self-supplied
Ground water
Fresh
17
1
1 1
1
2 1 1 1
Saline
1
Surface water
Fresh
4 1 1 1 3
1
1
Saline
3
Public supplied
Ground water
Fresh
2
1
1 1 1
1
I
Surface water
Fresh
10
11
Total
37 1 2 1 6
2 2 2
1
3 1 1 3
TABLE 21. Treatment of makeup for sanitary water[Figures refer to frequency of use of various types of water treatment. Prior treatment of purchased water
is not considered]
Type of treatment
No treatment _______Coagulation _ _ _ __Sedimentation. _ _ _ _Filtration. ___ ______Softening:
Lime-ash. _ _____Zeolite _ . _Other...........
Disinfection and algae control:
Corrosion and scale control :
Deaeration__ ___Other _ _ __ __
Self-supplied
Ground water
Fresh
17
1
3 2 1
5
1 1
Saline
1
Surface w ater
Fresh
1 1 2 2
2
Saline
1
1
Public supplied
Ground water
Fresh
32
1
1
Saline
1
Surface water
Fresh
1
1
Total
53 2 2 4
3 3 1
9
1 1
FACTORS AFFECTING WATER USE
The results of the current survey were studied to find an explanation for the wide variation in water use. The effect of availability of water, size of refinery, operating procedures, type of process, and tem perature and quality of the water upon the water use was investigated.

326 WATER REQUIREMENTS OF SELECTED INDUSTRIES
AVAILABILITY OF WATER
Location seems to affect water use, but its effect is actually due to the variation of availability of water. The unit makeup-water re quirements of the refineries surveyed varied with the runoff of the area in which the refinery was located. The water uses of refineries in arid areas in which the runoff was 1 inch or less were compared with the uses in areas in which the runoff was more than 10 inches.
The makeup-water requirements of 20 refineries in high-runoff areas exceeded 100 gallons per barrel of charge, whereas only 4 refineries in arid locations had makeup requirements this high. The median make up-water use in arid locations was about 75 gallons per barrel of charge, whereas the median for high-runoff areas was about 250 gallons per barrel.
SIZE OF REFINERY
Analyses of the data indicate that the unit makeup-water require ments of the refineries surveyed were not directly affected by size. Even though the large refineries had greater makeup-water require ments than smaller refineries, the greater requirements were due to fac tors other than size.
Five refineries with capacities of more than 100,000 barrels per day were visited during the 1956 survey, and each was located in an area with an abundant supply of water. Four of the five refineries required more than average amounts of makeup water, owing to the large pro portion of once-through cooling water used. Therefore, the greater amounts of makeup water used were due to the favorable water situa tions at the refinery locations rather than to their sizes.
There was a negligible difference in the average makeup-water needs of refineries with capacities between 10,000 and 100,000 barrels per day and those with capacities less than 10,000 barrels. The average make up requirements of both size groups were less than those of refineries with capacities in excess of 100,000.
The negligible effect of size on water requirements is further illus trated by the small variation in the average unit gross circulating- water needs among the three size groups.
TYPES OF PROCESSES
The type of refinery and processing units and the operating proce dures affect the water requirements. The water requirements of refin eries with cracking units were considerably larger than the require ments of those without cracking units. Table 5 shows that the median gross circulating-water requirements and the makeup-water require ments for refineries with cracking facilities were 1,600 and 100 gallons
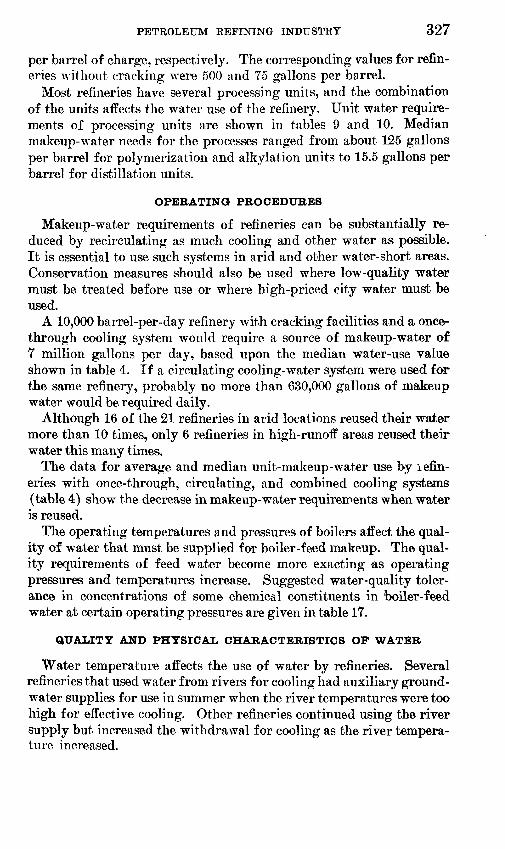
PETROLEUM REFINING INDUSTRY 327
per barrel of charge, respectively. The corresponding values for refin eries without cracking were 500 and 75 gallons per barrel.
Most refineries have several processing units, and the combination of the units affects the water use of the refinery. Unit water require ments of processing units are shown in tables 9 and 10. Median makeup-water needs for the processes ranged from about 125 gallons per barrel for polymerization and alkylation units to 15.5 gallons per barrel for distillation units.
OPERATING PROCEDURES
Makeup-water requirements of refineries can be substantially re duced by recirculating as much cooling and other water as possible. It is essential to use such systems in arid and other water-short areas. Conservation measures should also be used where low-quality water must be treated before use or where high-priced city water must be used.
A 10,000 barrel-per-day refinery with cracking facilities and a once- through cooling system would require a source of makeup-water of 7 million gallons per day, based upon the median water-use value shown in table 4. If a circulating cooling-water system were used for the same refinery, probably no more than 630,000 gallons of makeup water would be required daily.
Although 16 of the 21 refineries in arid locations reused their water more than 10 times, only 6 refineries in high-runoff areas reused their water this many times.
The data for average and median unit-makeup-water use by lefin- eries with once-through, circulating, and combined cooling systems (table 4) show the decrease in makeup-water requirements when water is reused.
The operating temperatures and pressures of boilers affect the qual ity of water that must be supplied for boiler-feed makeup. The qual ity requirements of feed water become more exacting as operating pressures and temperatures increase. Suggested water-quality toler ance in concentrations of some chemical constituents in boiler-feed water at certain operating pressures are given in table 17.
QUALITY AND PHYSICAL CHARACTERISTICS OF WATER
Water temperature affects the use of water by refineries. Several refineries that used water from rivers for cooling had auxiliary ground- water supplies for use in summer when the river temperatures were too high for effective cooling. Other refineries continued using the river supply but increased the withdrawal for cooling as the river tempera ture increased.
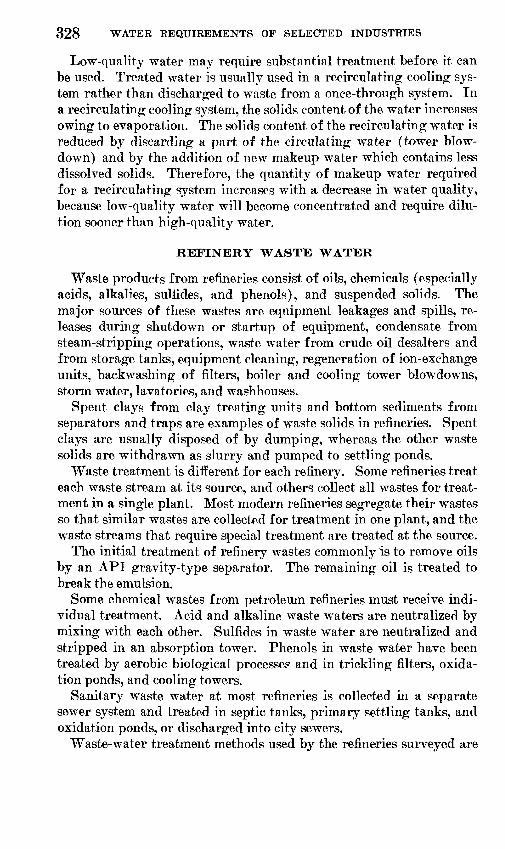
328 WATER REQUIREMENTS OF SELECTED INDUSTRIES
Low-quality water may require substantial treatment before it can be used. Treated water is usually used in a recirculating cooling sys tem rather than discharged to waste from a once-through system. In a recirculating cooling system, the solids content of the water increases owing to evaporation. The solids content of the recirculating water is reduced by discarding a part of the circulating water (tower blow- down) and by the addition of new makeup water which contains less dissolved solids. Therefore, the quantity of makeup water required for a recirculating system increases with a decrease in water quality, because low-quality water will become concentrated and require dilu tion sooner than high-quality water.
REFINERY WASTE WATER
Waste products from refineries consist of oils, chemicals (especially acids, alkalies, sulfides, and phenols), and suspended solids. The major sources of these wastes are equipment leakages and spills, re leases during shutdown or startup of equipment, condensate from steam-stripping operations, waste water from crude oil desalters and from storage tanks, equipment cleaning, regeneration of ion-exchange units, backwashing of filters, boiler and cooling tower blowdowns, storm water, lavatories, and washhouses.
Spent clays from clay treating units and bottom sediments from separators and traps are examples of waste solids in refineries. Spent clays are usually disposed of by dumping, whereas the other waste solids are withdrawn as slurry and pumped to settling ponds.
Waste treatment is different for each refinery. Some refineries treat each waste stream at its source, and others collect all wastes for treat ment in a single plant. Most modern refineries segregate their wastes so that similar wastes are collected for treatment in one plant, and the waste streams that require special treatment are treated at the source.
The initial treatment of refinery wastes commonly is to remove oils by an API gravity-type separator. The remaining oil is treated to break the emulsion.
Some chemical wastes from petroleum refineries must receive indi vidual treatment. Acid and alkaline waste waters are neutralized by mixing with each other. Sulfides in waste water are neutralized and stripped in an absorption tower. Phenols in waste water have been treated by aerobic biological processes and in trickling niters, oxida tion ponds, and cooling towers.
Sanitary waste water at most refineries is collected in a separate sewer system and treated in septic tanks, primary settling tanks, and oxidation ponds, or discharged into city sewers.
Waste-water treatment methods used by the refineries surveyed are
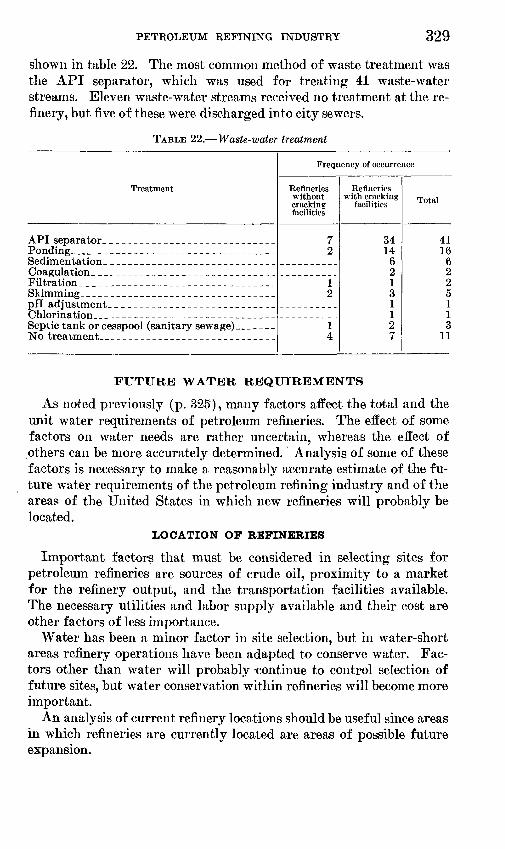
PETROLEUM REFINING INDUSTRY 329
shown in table 22. The most common method of waste treatment was the API separator, which was used for treating 41 waste-water streams. Eleven waste-water streams received no treatment at the re finery, but five of these were discharged into city sewers.
TABLE 22. Waste-water treatment
Treatment
API separator _ _ _ _ _Ponding __ __ . __ ___Sedimentation ___ _ _ _ _ __Coagulation __ __ __ ___Filtration _____Skimming _ _pH adjustment. _ - _Chlorination__ __ ____Septic tank or cesspool (sanitary sewage) _No treatment..- _ __ _ _ _
Frequency of occurrence
Refineries without cracking facilities
7 2
1 2
14
Refineries with cracking
facilities
34 14
6 2 I 3 1 1 2 7
Total
41 16 6 2 2 5 1 I 3
11
FUTURE WATER REQUIREMENTS
As noted previously (p. 325), many factors affect the total and the unit water requirements of petroleum refineries. The effect of some factors on water needs are rather uncertain, whereas the effect of others can be more accurately determined. Analysis of some of these factors is necessary to make a reasonably accurate estimate of the fu ture water requirements of the petroleum refining industry and of the areas of the United States in which new refineries will probably be located.
LOCATION OF REFINERIES
Important factors that must be considered in selecting sites for petroleum refineries are sources of crude oil, proximity to a market for the refinery output, and the transportation facilities available. The necessary utilities and labor supply available and their cost are other factors of less importance.
Water has been a minor factor in site selection, but in water-short areas refinery operations have been adapted to conserve water. Fac tors other than water will probably -continue to control selection of future sites, but water conservation within refineries will become more important.
An analysis of current refinery locations should be useful since areas in which refineries are currently located are areas of possible future expansion.
330 WATER REQUIREMENTS OF SELECTED INDUSTRIES
There were 294 operating refineries in the United States with an average total operating capacity of 8,380,801 barrels per day in 1955 (Kirby, 1956). These refineries were scattered through 37 States from coast to coast. Approximately three-fourths of the operating refiner ies 90 percent of the national capacity were located within the 12 States of Texas, California, Louisiana, Pennsylvania, Illinois, Indi ana, New Jersey, Ohio, Oklahoma, Kansas, Michigan, and Wyoming. One-fourth of the total operating capacity was located in Texas, and the refining capacity of Texas combined with that of California and Louisiana accounted for more than one-half of the operating capacity of the Nation.
The tidewater location, the nearness to a crude-oil supply, and the cheap and abundant supply of natural gas available for fuel are fac tors that make the gulf coast areas of Texas and Louisiana an excellent location for petroleum refineries and account for the large number of refineries located in this area. Most of the crude oil used by the re fineries in this area is transported by pipelines from inland Texas and Louisiana oil fields, and the major part of the refinery output is trans ported by tanker to east coast markets. Reuse of water is the general practice in this area. Some industrial plants are using sea water suc cessfully for cooling, and air-cooled heat exchangers are also used to supplement water cooling.
East coast refineries are usually market oriented and are located near large population centers, such as Philadelphia, New York City, and Boston. The larger refineries are at tidewater, because most of the crude-oil supply is delivered by tankers from South America, the Middle East, or the gulf coast. Reuse of cooling water is not as general in this area. Many east coast refineries have long used sea water for cooling; several new tidewater refineries are using sea water for cooling.
Although California is the second largest crude-producing State in the Nation, it does not produce sufficient crude oil to meet all west coast demands, and crude from Canada, South America, Sumatra, and the Middle East is imported to supply the deficit. Most west coast refineries are located near such population centers as Los An geles, San Francisco, and the Puget Sound area, because these centers provide a large market for the refinery output. The Los Angeles area is one of the few places in the country that has all the important conditions for a favorable refinery location namely, a large source of crude, a large market for refined products, and excellent transpor tation facilities. An additional condition favoring the area for re finery location is the natural gas that is available for use as fuel. The

PETROLEUM REFINING INDUSTRY 331
single deterrent to refinery expansion in this area is the water short age. Refineries in the Puget Sound area are connected to Canadian oil fields by pipeline, and expansion in this area to supply the west coast demands is probable. In addition to these tidewater refineries, supply-oriented refineries are located in or near oil fields in the Cen tral Valley of California.
Conservation of water is essential in the water-short Los Angeles area, and therefore most refineries recirculate cooling water. Recir- culation of cooling water is also a common practice in refineries in the Central Valley area. Sea water has been used for cooling by refineries in the Los Angeles and San Francisco areas.
Most midwestern refineries are located near markets and are sup plied primarily from midcontinent oil fields. Some refineries located on navigable rivers and in the Great Lakes area use water transpor tation, but pipelines are used extensively by most refineries in the Mid west to transport crude oil to the refinery and finished products to market. Large refining centers in this area are Chicago, Kansas City, and St. Louis.
Many refineries in this area are located adjacent to large rivers or lakes and have sufficient water to use once-through cooling systems. Other parts of this area have water-shortage problems, and refineries reduce their water requirements by recirculating cooling water.
Possible refinery locations have been increased manyfold with the advent of the transcontinental pipeline. The source of crude supply can be extended from the oil field to any point along or to the terminus of a pipeline, and refinery markets can be expanded to include any territory connected to the refinery by a pipeline.
Pipelines will possibly affect the selection of future refinery loca tions by allowing more consideration to be given to water availability. Eefineries could be located in areas with favorable water supplies, and pipelines could carry crude supplies to refineries and deliver finished petroleum products to market areas.
GROWTH OF INDUSTRY
The petroleum refining industry began in 1854 when Samuel W. Kier constructed a small refinery in Pittsburgh, Pa. The refinery distilled 5 barrels of crude oil per day and produced a cheap illuminat ing oil similar to coal oil. The expansion of the industry was limited by the small supply of crude oil that could be reclaimed from creeks, springs, and salt wells in the Oil Creek area of Pennsylvania.
The first oil well in the United States was successfully completed by Colonel Edwin L. Drake in Titusville, Pa., on August 27, 1859. Thereafter, many additional wells were drilled in the area, and many

332 WATER REQUIREMENTS OF SELECTED INDUSTRIES
refineries were constructed to keep pace with the rapidly increasing oil production.
Early refining operations were very simple, because the refineries were operated mainly to obtain illuminating oil (kerosene) by simple distillation. In these early refineries the lighter and more volatile gasoline and the heavy residue remaining after the kerosene was ob tained were considered worthless and were either discarded or burned. This residue was soon being used as fuel, and poor quality lubricants were manufactured from crude oil as early as 1865. The quality of lubricants and other products continued to improve as refining meth ods improved. The advent of the automobile in the early 1900's created a demand for gasoline and lubricating oils which soon exceeded the quantities that could be supplied by simple distillation and forced the development of secondary operations.
The Burton cracking process was introduced in 1913; it is a thermal cracking process for converting high-boiling fractions of petroleum into hydrocarbons of low boiling points for use as gasoline. This was the first commercial cracking process to be operated successfully in the United States (Kraemer, 1941). Many new refining processes such as catalytic cracking, polymerization, alkylation, and reforming have been developed and are used by refineries to meet the continuing de mand for more and better gasoline for automobiles.
Thus, in just slightly over 100 years the petroleum industry has grown from a simple beginning to one of the largest industries in the world which ranks with transportation, public utilities, and agricul ture. Refining has grown from Kier's single 5-barrel-per-day refinery to an industry consisting of 294 refineries processing an average of 7,480,000 barrels of crude oil per day in 1955. Large modern refineries have increased in complexity and size to include single refineries capa ble of producing about 3,850 gallons of motor gasoline, 900 gallons of home heating oil, 300 quarts of motor oil, and hundreds of other products in 1 minute.
Increased water requirements have accompanied the growth of the refining industry. As the number, size, and complexity of refineries increased, the total water requirements of the industry increased. Al though total water needs have increased, the unit water requirements have decreased as the industry grew. This decrease was caused by improved water-conservation practices that generally accompany ad ditional water needs resulting from refinery growth. Estimates of the future growth of the petroleum refining industry should serve as a guide for making a reasonably accurate appraisal of the future water requirements.

PETROLEUM REFINING INDUSTRY 333
Figure 49 traces the increases in demand for major petroleum prod ucts in the United States and in the free world from 1950 through 1960 and indicates the percentage distribution of the total demand between the United States and the free world.
Hill, Hammer, and Winger (1957) noted that demand for major refinery products in the free world increased at an average annual rate of 6.3 percent during the 1920-56, and the demand accelerated in the post-World War II period to an average of 7.9 percent per year. The annual rate of increase was about 6 percent in both of these periods in the United States.
At the end of World War II the demand for refinery products was 2.588 million barrels per year for the free world, including 1,792 mil lion barrels per year in the United States. The demand in the United
CO
1958 1960
100
1950 1952 1954 1956 1958 1960
FIGURE 49. Demand for major refinery products in the United States and the free world by (A) quantity and (B) percent, 1950-60.

334 WATER REQUIREMENTS OF SELECTED INDUSTRIES
States increased to 2,634 million barrels per year in 1955 and to 3,042 million barrels in 1960. The free-world demand increased at a faster rate to 4,329 million barrels in 1955.
The quantities and percentages of crude runs to refineries in the United States and the free world from 1950 through 1960 are shown in figurfe 50. Annual percentage increases in crude charges to refineries in the United States approximately paralleled the yearly increases in demand for major refinery products in the period 1950 through 1960. Average increases in yearly rates of crude runs to refineries in the free world slightly exceeded the average percentage increase
1950 1952 1954 1956 1958 1960
100
1950 1952 1954 1956 1958 1960
FIGURE 50. Crude runs to petroleum refineries in the United States and the free world by (A) quantity and (B) percent, 1950-60.

PETROLEUM REFINING INDUSTRY 335
in demand for refinery products during the same period. Crude runs to refineries in the United States amounted to 1,730 million barrels per year in 1946 and increased to 2,730 million barrels in 1955 and to 2,953 million barrels in 1960. Crude runs to free world refineries were 2,475 million barrels in 1946, 4,945 million barrels in 1955, and 6,528 million barrels in 1960.
TRENDS IN PETROLEUM REFINING IN THE UNITED STATES
The President's Materials Policy Commission (1952) estimated that the 1975 consumption of petroleum products in the United States would amount to about 5 billion barrels per year, or 13.7 million barrels per day. This would be an average increase in domestic demand of about 3 percent per year between 1950 and 1975. On this basis, the domestic demand for 1966 would amount to 10.4 million barrels per day.
Hill, Hammer, and Winger (1957) noted a slackening in the rate of growth in demand for petroleum products in the United States and to a lesser degree in the free world; however, these authors predict that the domestic demand for petroleum products in the United States will increase at an annual rate of 5 percent between 1956 and 1966 and provide a domestic demand of 14.3 million barrels per day by 1966.
An increase in the demand for petroleum products in the United States at an average rate of 2.0 to 2.5 percent per year from 1960 to 1965 is estimated by Jameson (1960). He assumed that the total de mand for crude oil would increase by only 1.0 to 1.5 percent per year for the same period. The lower rate of demand for crude will be due to part of the demand for petroleum products being satisfied by in creased production of natural-gas liquids and increased yield of addi tional lighter products from a barrel of crude oil.
Figure 51 shows the total domestic demand for petroleum prod ucts and the crude oil runs to refineries in the United States from 1920 through 1960. Since 1946 the domestic demand has grown at an average rate of 5 percent per year, and refinery runs have increased at 4 percent per year. Assuming the same annual rates of growth, I have extended the curves to show the probable demand and crude runs in 1966. This extension indicates a probable domestic demand of 4,746 million barrels per year, or 13.0 million barrels per day in 1966. This value is somewhat higher than the demand of 10.4 million barrels per day calculated for 1966 from data published by the Presi dent's Materials Policy Commission (1952) but lower than the 14.3 million barrels per day estimated for 1966 by Hill, Hammer, and Winger (1957).
The extension of the crude-run curve indicates probable runs of
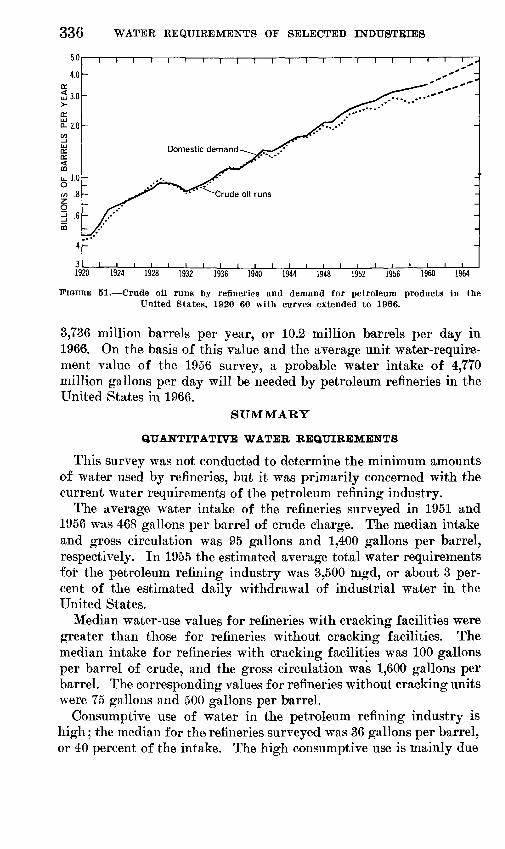
336 WATER REQUIREMENTS OF SELECTED INDUSTRIES
j3.0
a-2.0
u.1.0 O</> .8
i i r T i i i i i r i i i i
Domestic demand
"Crude oil runs
i ' ' i i ' i ' i i I I I I I ' ' '1920 1924 1928 1932 1936 1940 1944 1948 1952 1956 1960 1964
FIGURE 51. Crude oil runs by refineries and demand for petroleum products in the United States, 1920-60 with curves extended to 1966.
3,736 million barrels per year, or 10.2 million barrels per day in 1966. On the basis of this value and the average unit water-require ment value of the 1956 survey, a probable water intake of 4,770 million gallons per day will be needed by petroleum refineries in the United States in 1966.
SUMMARY
QUANTITATIVE WATER REQUIREMENTS
This survey was not conducted to determine the minimum amounts of water used by refineries, but it was primarily concerned with the current water requirements of the petroleum refining industry.
The average water intake of the refineries surveyed in 1951 and 1956 was 468 gallons per barrel of crude charge. The median intake and gross circulation was 95 gallons and 1,400 gallons per barrel, respectively. In 1955 the estimated average total water requirements for the petroleum refining industry was 3,500 mgd, or about 3 per cent of the estimated daily withdrawal of industrial water in the United States.
Median water-use values for refineries with cracking facilities were greater than those for refineries without cracking facilities. The median intake for refineries with cracking facilities was 100 gallons per barrel of crude, and the gross circulation was 1,600 gallons per barrel. The corresponding values for refineries without cracking units were 75 gallons and 500 gallons per barrel.
Consumptive use of water in the petroleum refining industry is high; the median for the refineries surveyed was 36 gallons per barrel, or 40 percent of the intake. The high consumptive use is mainly due

PETROLEUM REFINING INDUSTRY 337
to the accumulative evaporation and to windage losses in cooling towers.
QUALITATIVE WATER REQUIREMENTS
Water of good quality is desirable for the petroleum refining in dustry; however, the quantity available is of more importance than the quality. The quality needed will differ with the use within the refinery, but most refineries provide the necessary quality by treatment.
Median values of selected chemical constituents and physical char acteristics of untreated once-through and recirculated water used for cooling, boiler feed makeup, process operations, and sanitary purposes are summarized in table 23.
Water used for once-through cooling by the refineries surveyed was of slightly higher quality than that used for circulating cool ing. The use of higher quality water for once-through cooling was probably not due to higher quality requirements but resulted from the favorable water situation at the refinery location. Petroleum re fineries used large amounts of high-quality water to produce steam. Untreated water was generally not satisfactory for this use, and care ful selection and treatment of makeup for boiler-feed water was necessary to prevent scale formation, excessive corrosion, and embrittlement.
TABLE 23. Summary of the median of selected quality characteristics of untreated water used for various refinery purposes
[Results expressed in parts per million unless otherwise indicated. These data are based on individual observations available and are not balanced analyses]
Constituent or property
Silica (SiO2). _...__Iron (Fe)__ ___ ____Calcium (Ca)Magnesium (Mg) __ Sulfate (SOO --Total hardness as
CaCO3 ---------
Color__-___________pH__ ___________
Cooling water oiice-through
9.8. 12
5113 38
160
87.4
Circulated
12.15
4513 68
160
57.6
Boiler-feed makeup
12. 10
3914 62
142
57. 6
Process operations
14. 12
5214 89
200
57.6
Sanitary purposes
11.10
3610 40
126
37.6
TRENDS IN WATER REQUIREMENTS
The petroleum-refining industry is a relatively new industry that is accustomed to change. The industry is quick to adopt new refining methods and equipment that increase the operating efficiency of the refinery. There is a tendency for petroleum refineries to reuse an increasing amount of water, especially cooling water, with a resulting

338 WATER REQUIREMENTS OF SELECTED INDUSTRIES
decrease in refinery intake. This decrease, however, is accompanied by an increase in consumptive use and a decrease in waste-water dis charge. Some refineries are using air cooling to further conserve water where only limited temperature reductions are required.
SELECTED REFERENCES
Aeschliman, P. D., Selm, R. P., and Ward, John, 1957, Study of a Kansas oil refinery waste problem, in Transactions of the seventh annual conference on sanitary engineering: Kansas Univ. Eng. and Architecture Bull. 40, p. 5-13, Lawrence, Kans.
American Petroleum Institute, 1953 (5th ed.), 1958 (6th ed.), Waste water containing oil, v. 1 of Manual on disposal of refinery wastes: New York, Am. Petroleum Inst., Div. Refining.
1951 (2d ed.), 1953 (4th ed.), Chemical wastes, v. 3 of Manual ondisposal of refinery wastes: New York, Am. Petroleum Inst., Div. Refining.
American Water Works Association, Inc., 1950, Water quality and treatment,2d ed.: New York, Am. Water Works Assoc., 451 p.
American Water Works Association Task Group, 1953, Water conservation inindustry: Am. Water Works Assoc. Jour., v. 45, no. 12, p. 1249-1260.
Arnold, Ralph, and Kemnitzer, Wm. J., 1931, Petroleum in the United Statesand possessions: New York, Harper Bros., p. 79.
Bell, H. S., 1959, American petroleum refinery: Princeton, N.J., D. Van NostandCo., 538 p.
Besselievre, E. B., 1952, Industrial waste treatment, 2d ed.: New York, McGraw-Hill Book Co., 391 p.
Betz, W. H. and L. D., 1950, Betz handbook of industrial water conditioning:Philadelphia, W. H. and L. D. Betz, 200 p., 141 figs.
Boone, M. G., and Ferguson, D. F., 1954, Visbreaking still the basic process forfuel reduction: Oil and Gas Jour., v. 52, no. 46, p. 166-168.
Brooke, Maxey, 1954, Economics of softening cooling water: Petroleum Refiner,v. 33, no. 10, p. 145-146.
Brooks, W. B., 1954, Sea water as an industrial coolant: Petroleum Refiner,v. 33, no. 10.
Coqueron, F. G., and Pogue, J. E., 1956, Investment patterns in the worldpetroleum industry: New York, The Chase Manhattan Bank, 55 p.
Forbes, M. C., 1954a, Water supply and quality, pt. 1 of Water problems andtheir solutions: Petroleum Refiner, v. 33, no. 4, p. 122-126.
1954b, Water analysis interpretation, pt. 2 of Water problems <>irsolutions: Petroleum Refiner, v. 33, no. 6, p. 169-171.
Gorman, Arthur E., 1943, Administrative policies of the Water Division officeof War Utilities: Am. Water Works Assoc. Jour., v. 35, no. 7, p. 846-852.
Helwig, J. D., and McConomy, H. F., 1957, How 31 refineries condition cooling- water systems: The Oil and Gas Jour., v. 55, no. 48, p. 101-106.
Hengstebeck, R. J., 1959, Petroleum processing principles and applications:New York, McGraw-Hill Book Co., 348 p.
Hill, K. E., Hammar, H. D., and Winder, J. G.. 1957, Future growth of theworld petroleum industry : New York, Chase Manhattan Bank, 44 p.
Janieson, M. S., Jr., 1960, A review and forecast of U.S. demand for crude oil:Washington, D.C., Indep. Petroleum Assoc. of Am., 4 p.
Jordan. H. E., 1946, Industrial requirements for water: Am. Water WorksAssoc. Jour., v. 38, no. 1, p. 65-68.

PETROLEUM REFINING INDUSTRY 339
Kelly, R. W., 1946, Water treatment in refineries: Petroleum Refiner, v. 25,no. 8, p. 143-144.
Kimball, T. B., and Scott, J. A., 1948, Refinery tools for producing high-octanegasoline: Proceedings, 13th Midyear Mtg. of Am. Petroleum Institute'sDiv. Refining, v. 28M, p. 121-132.
Kirby, J. G., 1956, Petroleum, refineries, including cracking plants in the UnitedStates, January 1, 1956: U.S. Bur. Mines Inf. Circ. 7761, 12 p., 10 tables.
Kraemer, A. J., 1941, Developments in petroleum refining technology in theUnited States: U.S. Bur. Mines Inf. Circ. 7172.
Krieger, R. A., Hatchett, J. L., and Poole, J. L., 1957, Preliminary survey of thesaline-water resources of the United States: U.S. Geol. Survey Water-SupplyPaper 1374,172 p.
Lohr, E. W., and Love, S. K., 1954a, States east of the Mississippi River, pt. 1 ofThe industrial utility of public water supplies in the United States, 1952:U.S. Geol. Survey Water-Supply Paper 1299,639 p.
1954b, States west of the Mississippi River, pt. 2 of The industrial utilityof public water supplies in the United States, 1952: U.S. Geol. SurveyWater-Supply Paper 1300, 461 p.
MacKichan, K. A., 1957, Estimated use of water in the United States, 1955:U.S. Geol. Survey Circ. 398,18 p.
McAfee, Jerry, Montgomery, C. W., Summers, C. R., Jr., Hirsch, J. H., and Home,W. A., 1955, The Gulf HDS process for upgrading crudes and residues: NewYork, Am. Petroleum Inst. Proc., Sec. 3 of Refining, v. 35, p. 312-323.
McCormick, E. G., and Wetzel, O. K., Jr., 1954, Water supply from sewageeffluent: Petroleum Refiner, v. 33, no. 11, p. 165-167.
Mekler, Valentine, Schutte, A., and Whipple, T. T., 1953, Continuous-cokingprocess shows ability to handle heavy feed stocks: Oil and Gas Jour., v. 52,no. 28, p. 201-203.
Miller, Durando, 1951, Objectives and techniques of cooling-water treatment:Oil and Gas Jour., v. 50, no. 6, p. 139,141,144-150.
Miller, J. E., Entriken, P. P., and Geiser, F. J., 1953, Conservation of water inpetroleum and petrochemical industries, in Proceedings of the SecondAnnual Symposium on Water Conservation and Industrial Development,November 19-20, 1952: Louisiana State Univ. and Agr. and Mech. Coll.,Eng. Expt. Sta. Bull. 38, p. 46-53.
Moore, E. W., 1940, Progress report of the committee on quality tolerances ofwater for industrial uses: New England Water Works Assoc. Jour., v. 54,no. 2, p. 261-274.
Murphree, E. V., 1951, Fluid hydrof orming: The Hague, Third World PetroleumCongress Proc., Section IV, Oil processes involving chemical conversions,p. 215-224.
Nelson, W. L., 1949, Petroleum refinery engineering 3d ed.: New York, McGraw-Hill Book Co., Inc., 715 p.
Norburg, W. S., and Arnold, R. C., 1956, Higher octanes by the isomate processin 1956 annual refinery review: World Petroleum, v. 27, no. 8, 68-73.
Nordell, Eskel, 1951, Water treatment for industrial and other uses: New York,Reinhold Publishing Corp., 523 p.
Oil and Gas Journal, 1955a, HF alkylation Phillips: v. 53, no. 46, p. 166-167. 1955b, Autofining: v. 53, no. 46, p. 170-171. 1956a, Catalytic reforming and feed desulfurization: v. 54, no. 46, p. 159. 1956b, Normal butane catalytic isomerization: v. 54, no 46, p. 182. 1956c, Report on United States operating refineries: v. 54, no. 46, p.
215-237.

340 WATER REQUIREMENTS OF SELECTED INDUSTRIES
Partin, J. L., 1953, Water conservation a byproduct of industrial waste con trol : Sewage and Industrial Wastes, v. 25, no. 9, p. 1050-1059.
Permutit Company, The, 1949, Water conditioning handbook: New York, The Permutit Co., 462 p.
Petroleum Processing, 1955, Hyperforming; v. 10, no. 8, p. 1194-1195. 1956a, Anhydrous ammonia: v. 11, no. 1, p. 87-89. 1956b, Coke and lighter products: v. 11, no. 3, p. 135-137. 1956c, Lube oil improvement by Thermofor continuous percolation: v. 11,
no. 7, p. 137-139. 1956d, Isomerization of normal paraffins: v. 11, no. 10, p. 101-103. 1956e, Hydrogen treating: v. 11, no. 11, p. 130. 1956f, Hydrodesulfurization: v. 11, no. 11, p. 131. 1957a, Sulfuric acid alkylation: v. 12, no. 4, p. 107-109. 1957b, Amoco's latest built for high yields: v. 12, no. 5, p. 216-219. 1957c, Powerforming for octanes : v. 12, no. 6, p. 117-119.Petroleum Refiner, 1956a, SBK catalytic reforming: v. 35, no. 9, p. 214 and 253. 1956b, Catalytic isomerization : v. 35, no. 9, p. 253.Pfarr, J. S., 1948, Refinery tools for producing high-octane gasoline discussion:
Proceedings 13th Midyear Mtg. of Am. Petroleum Institute's Div. Refining,v. 28M, p. 133-136.
Pichler, H., Chervenak, M., Johnson, C. A., Sze, M. C., and Campagnolo, J.F.,1957, The "H-oil" process: Oil and Gas Jour. v. 55, no. 39, p. 109-111, 113.
Powell, S. T., 1954, Water conditioning for industry: New York, McGraw-HillBook Co., 548 p.
President's Materials Policy Commission, 1952, Projection of 1975 materials de mand, in Resources for freedom, v. 2, The outlook for key commodities:Washington, U.S. Govt. Printing Office, p. 129.
Read, Davis, 1946, A fluid-catalytic cracking unit for the smaller refiner:Petroleum Refiner, v. 25, no. 5, p. 119-122.
Resen, Larry, 1957, How Gulf purifies its boiler water: Oil and Gas Jour., v.55, no. 6, p. 106-110.
Rook, C. G., Jr., 1946, Boiler-water conditioning at Talco Refinery: PetroleumRefiner, v. 25, no. 12, p. 129.
Shreve, R. N., 1956, The chemical process industries: New York, McGraw-HillBook Co., 1004 p.
Simonsen, R. N., 1952, How four oil refineries use water: Sewage and Indus.Wastes, v. 24, no. 11.
Standard Oil Co. (New Jersey), 3950, Water for oil: New York, The Lamp, v. 32,no. 1, p. 24-26.
U.S. Bureau of the Census, 1957, Industrial water use: U.S. Bur. Census Bull.MC-209 Supp. (1954 Census of Manufactures separate), 51 p.
U.S. Public Health Service, 1956, Public Health Service drinking water stand ards : Public Health Repts., v. 61, no. 11, p. 371-384, 1946; reissued March1956 as Repr. 2697, 14 p.
Unzelman, G. H., and Wolf, C. J., 1957, Refining process glossary (descriptions ofprocesses) ; Petroleum Processing, v. 12, no. 5, p. 97-148.
White, A. G., Coumbe, A. T., Colby, D. S., and Seeley, E. M., 1959, Crude petroleumand petroleum products in Minerals Yearbook, 1958, v. 2, Fuels: U.S. Bur.of Mines, p. 313-430.
Wilkinson, W. F., Ghublikian, J. R., and Obergfell, P., 1953, The SO2 extractionprocess for aroinatics recovery: Chem. Eng. Prog., v. 49, no. 5, p. 257-262.
Youngquist, C. V., 1942, Water and war production: Ohio Eng. Expt. Sta. News,v. 14, no. 4, p. 21-24.
o