water residuals management graves.pdf
TRANSCRIPT
Water Residuals Management
October 2014
Presented byMichael F. Graves, PE – CP&Y
Co-AuthorsLarry L. Hare, PE – Oklahoma City
J. Dustin Segraves – Oklahoma City
• Project Background• Thickening and Dewatering• Hefner WTP Evaluation
– Develop Your Goals– Know Your Residuals– Review Your Process– Consider Operating Options
Discussion Topics
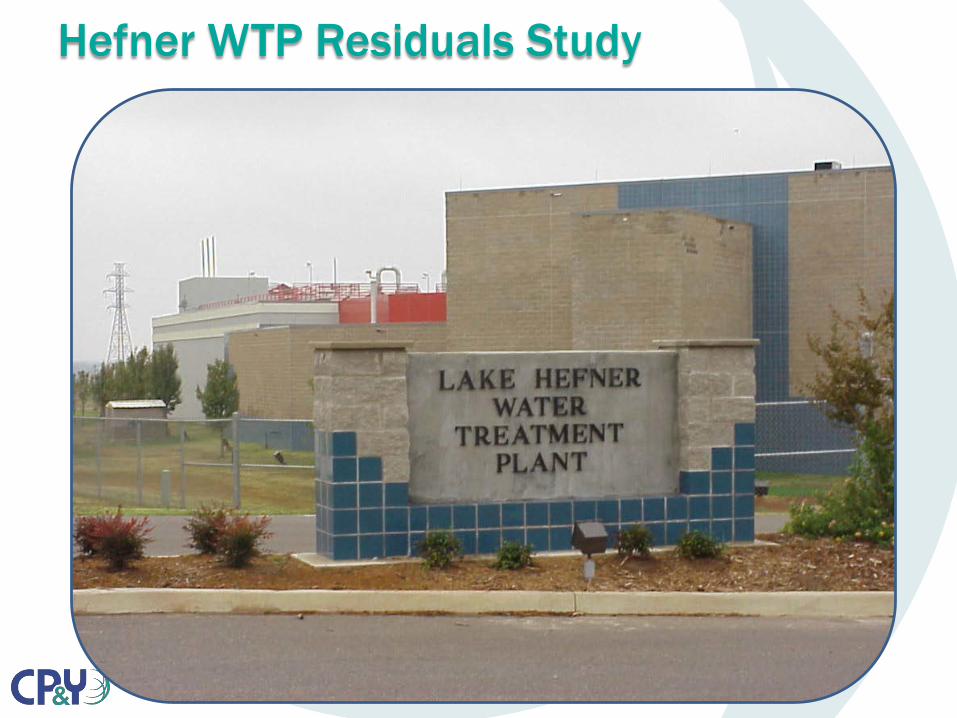
Hefner WTP Residuals Study
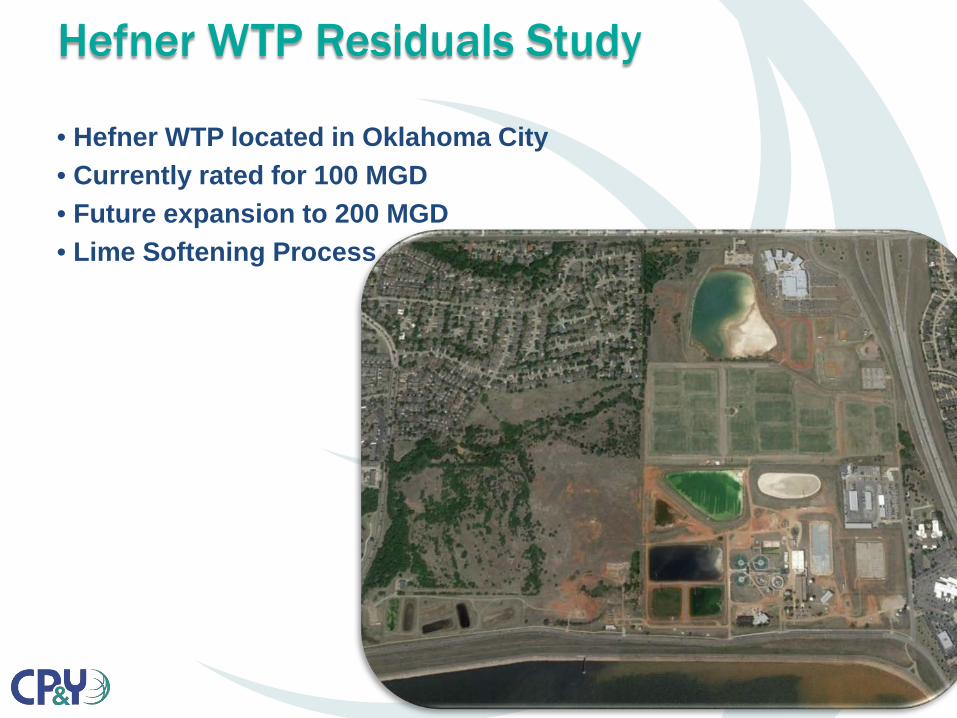
Hefner WTP Residuals Study
• Hefner WTP located in Oklahoma City• Currently rated for 100 MGD• Future expansion to 200 MGD• Lime Softening Process
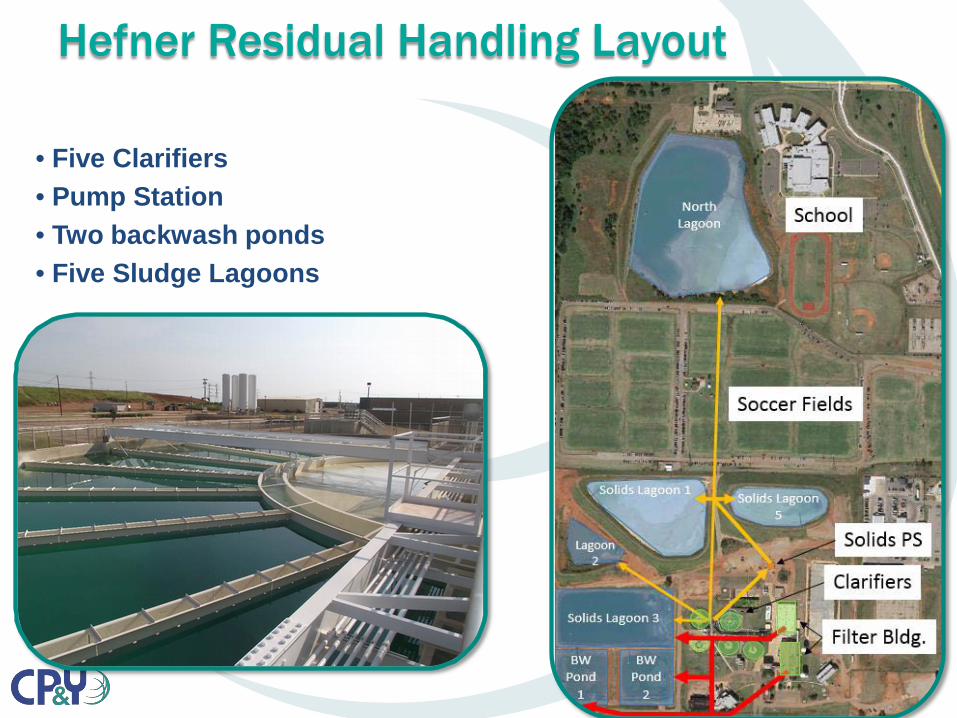
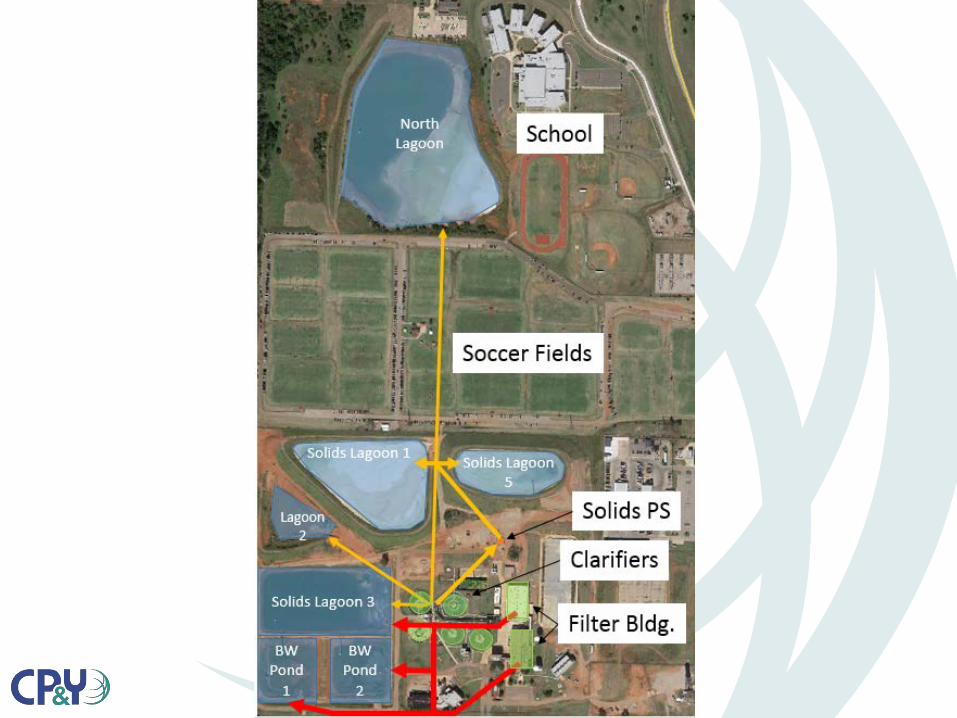
Hefner Residual Handling Layout
• Five Clarifiers• Pump Station • Two backwash ponds• Five Sludge Lagoons
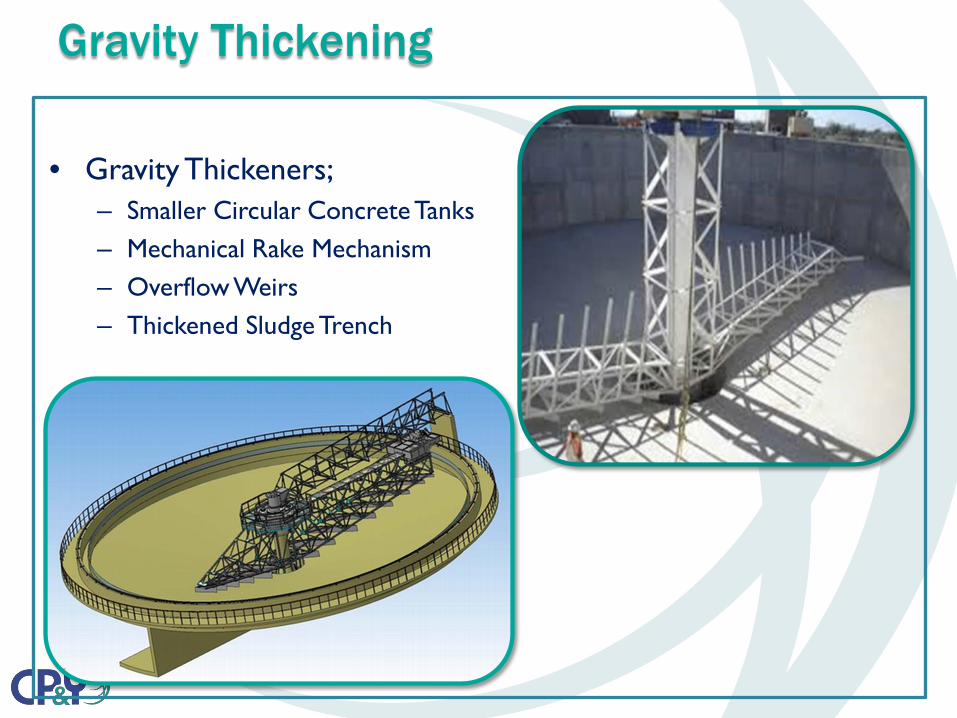
• Gravity Thickeners;– Smaller Circular Concrete Tanks– Mechanical Rake Mechanism– Overflow Weirs– Thickened Sludge Trench
Gravity Thickening
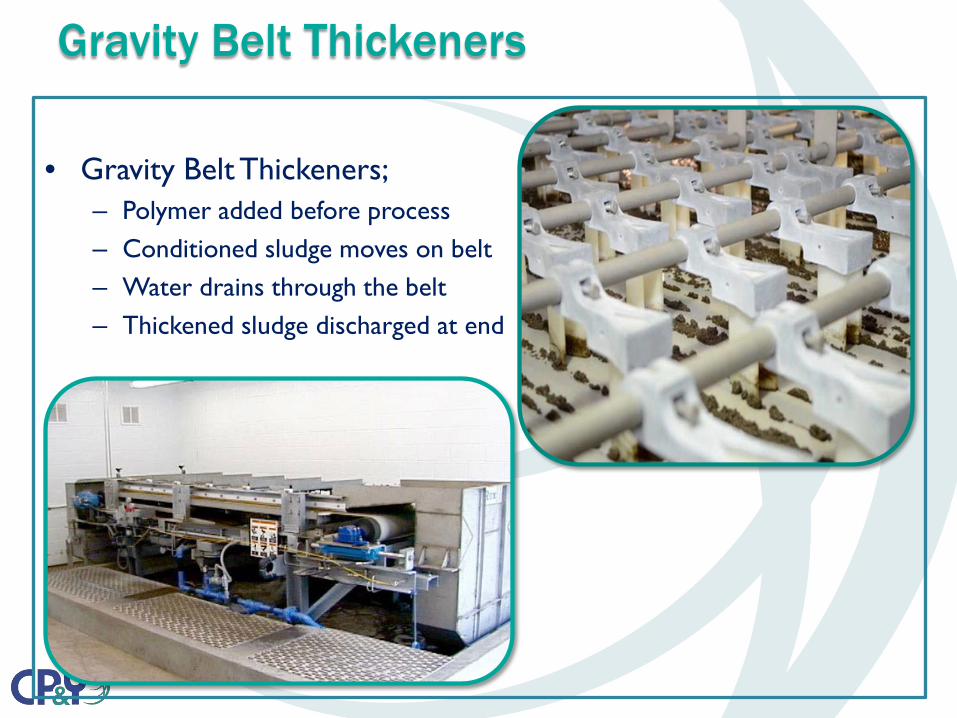
• Gravity Belt Thickeners;– Polymer added before process– Conditioned sludge moves on belt– Water drains through the belt– Thickened sludge discharged at end
Gravity Belt Thickeners
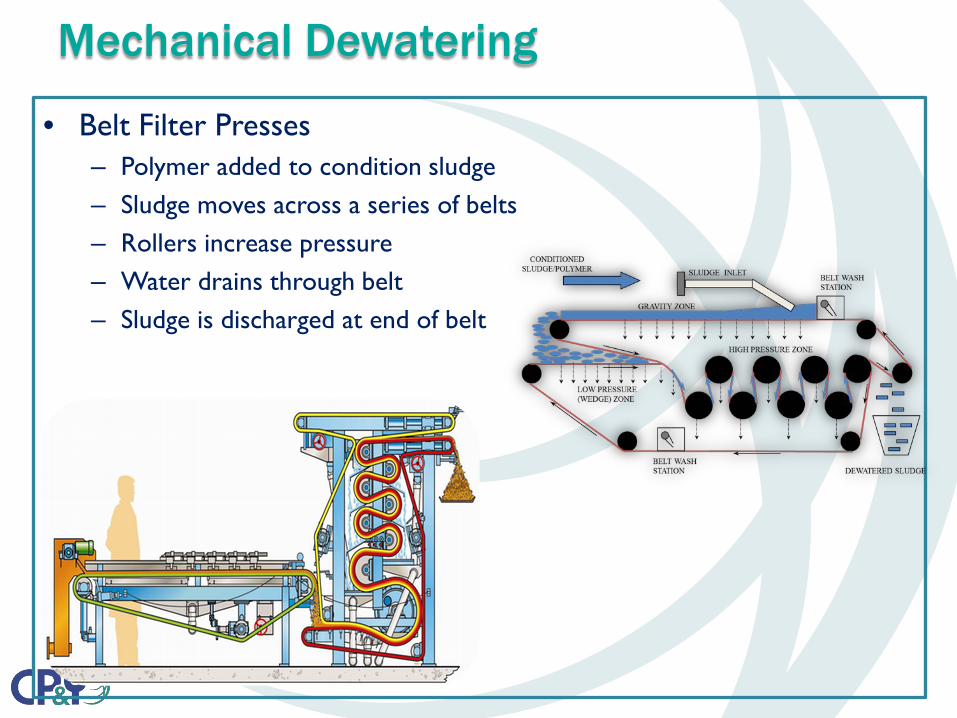
• Belt Filter Presses– Polymer added to condition sludge– Sludge moves across a series of belts– Rollers increase pressure– Water drains through belt– Sludge is discharged at end of belt
Mechanical Dewatering
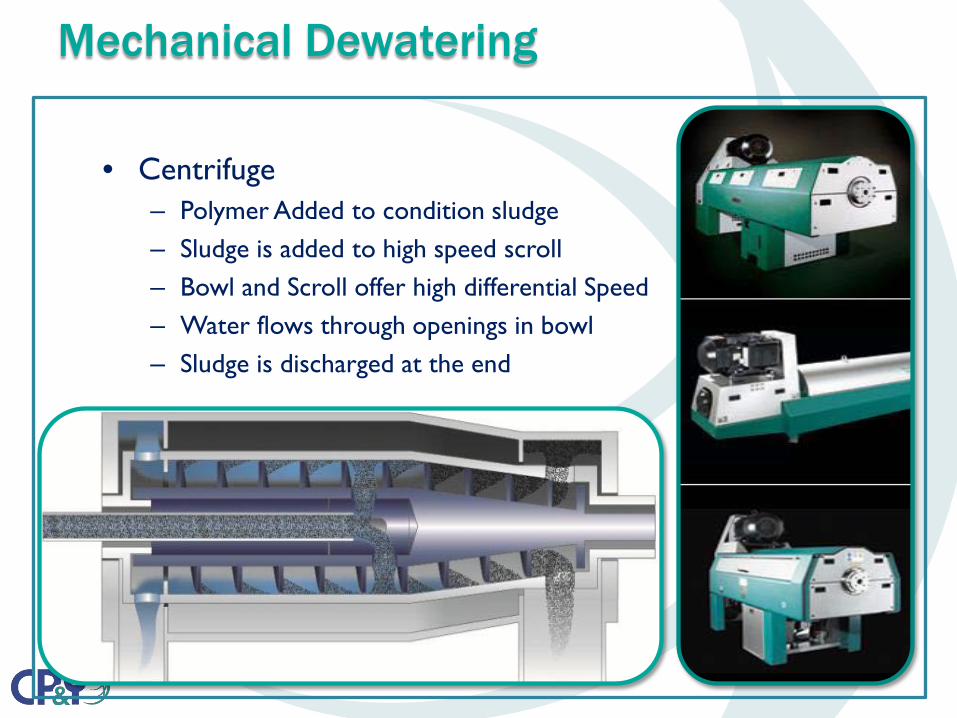
• Centrifuge– Polymer Added to condition sludge– Sludge is added to high speed scroll– Bowl and Scroll offer high differential Speed– Water flows through openings in bowl– Sludge is discharged at the end
Mechanical Dewatering
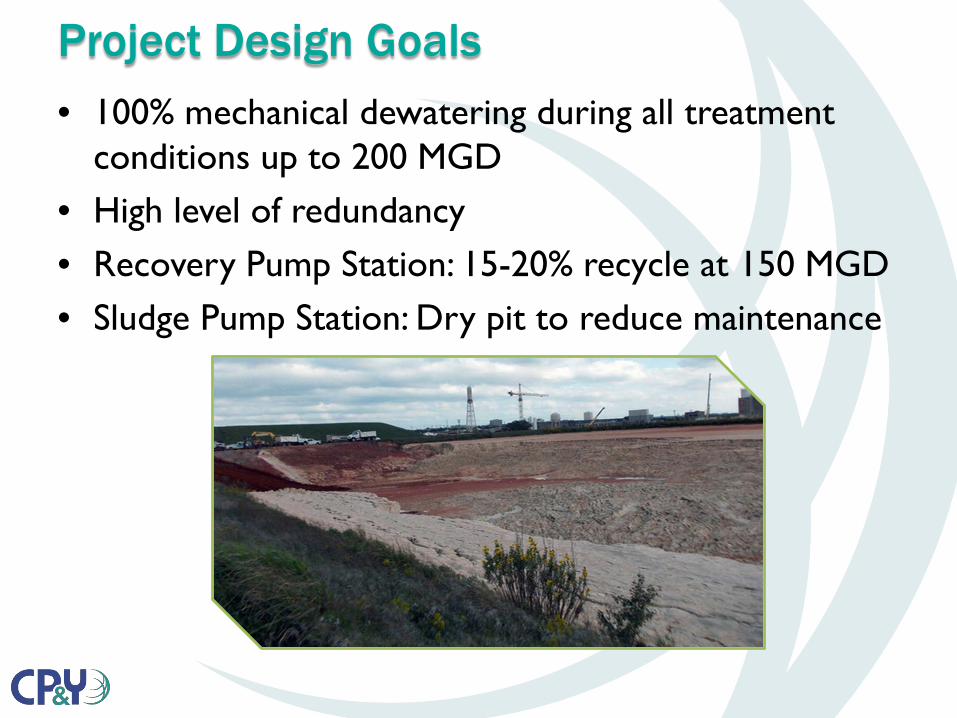
• 100% mechanical dewatering during all treatment conditions up to 200 MGD
• High level of redundancy• Recovery Pump Station: 15-20% recycle at 150 MGD• Sludge Pump Station: Dry pit to reduce maintenance
Project Design Goals
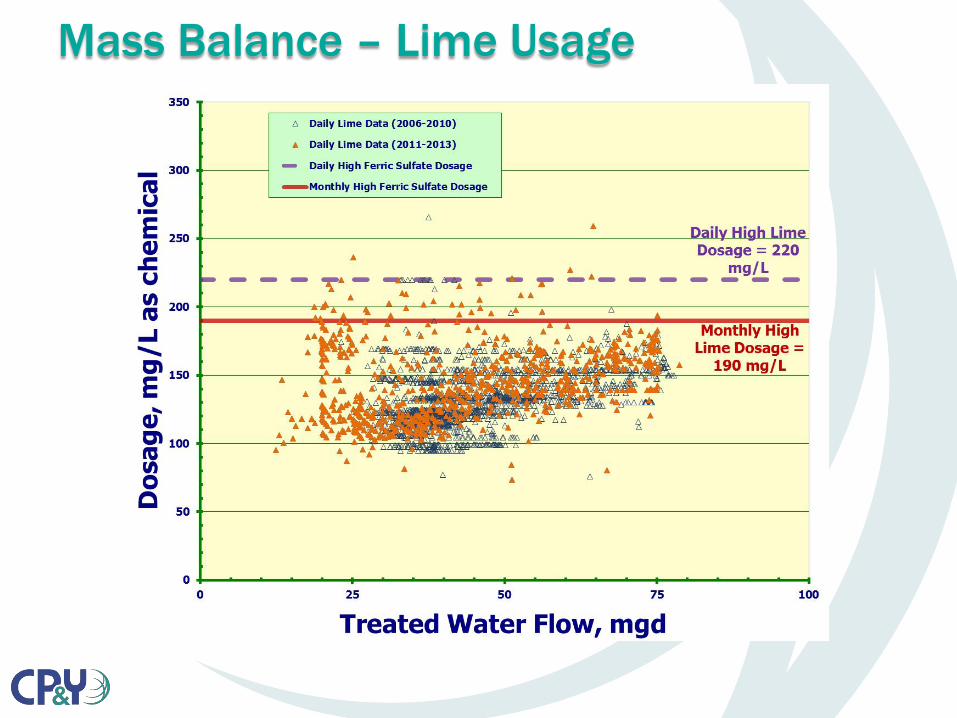
Mass Balance – Lime Usage

Mass Balance – Hardness Removal
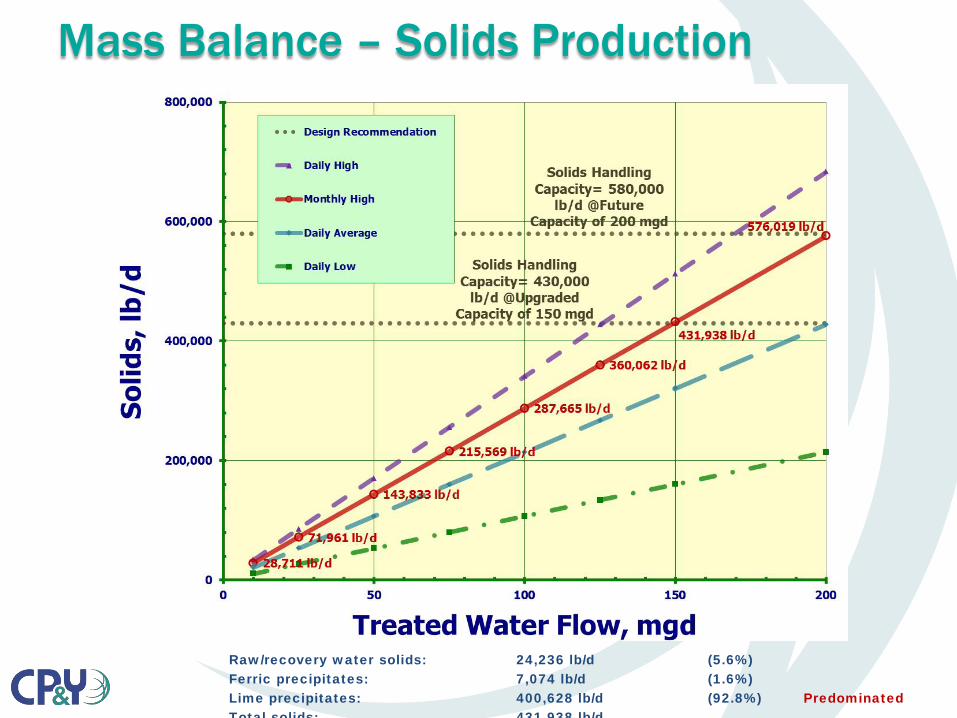
Mass Balance – Solids Production
Raw/recovery water solids: 24,236 lb/d (5.6%)Ferric precipitates: 7,074 lb/d (1.6%)Lime precipitates: 400,628 lb/d (92.8%) PredominatedTotal solids: 431 938 lb/d
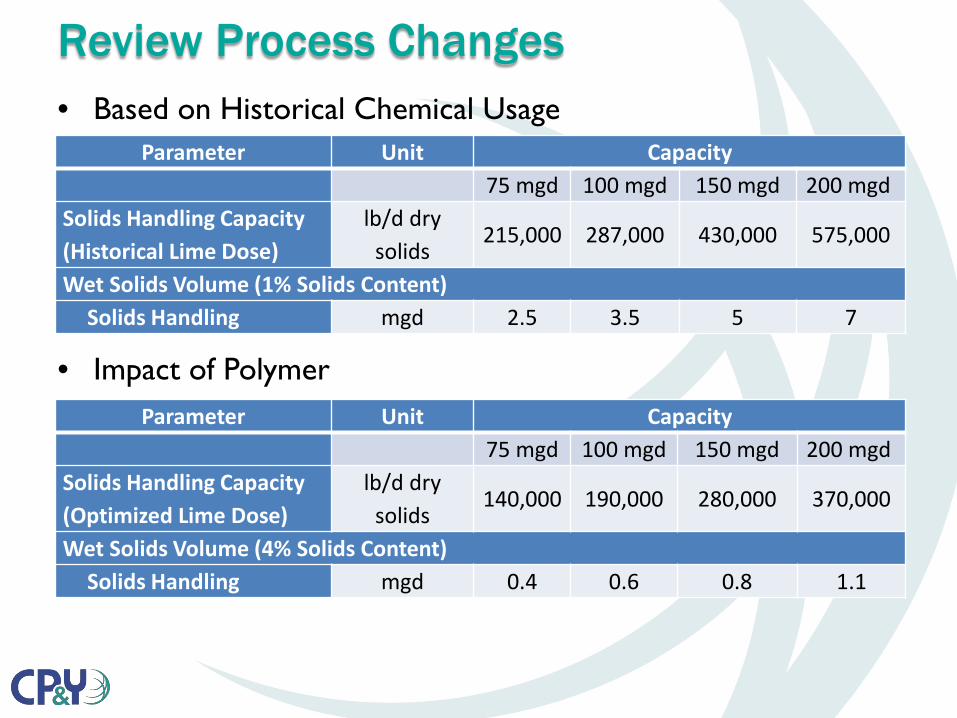
Review Process Changes• Based on Historical Chemical Usage
• Impact of PolymerParameter Unit Capacity
75 mgd 100 mgd 150 mgd 200 mgdSolids Handling Capacity (Optimized Lime Dose)
lb/d dry solids
140,000 190,000 280,000 370,000
Wet Solids Volume (4% Solids Content)Solids Handling mgd 0.4 0.6 0.8 1.1
Parameter Unit Capacity75 mgd 100 mgd 150 mgd 200 mgd
Solids Handling Capacity (Historical Lime Dose)
lb/d dry solids
215,000 287,000 430,000 575,000
Wet Solids Volume (1% Solids Content)Solids Handling mgd 2.5 3.5 5 7
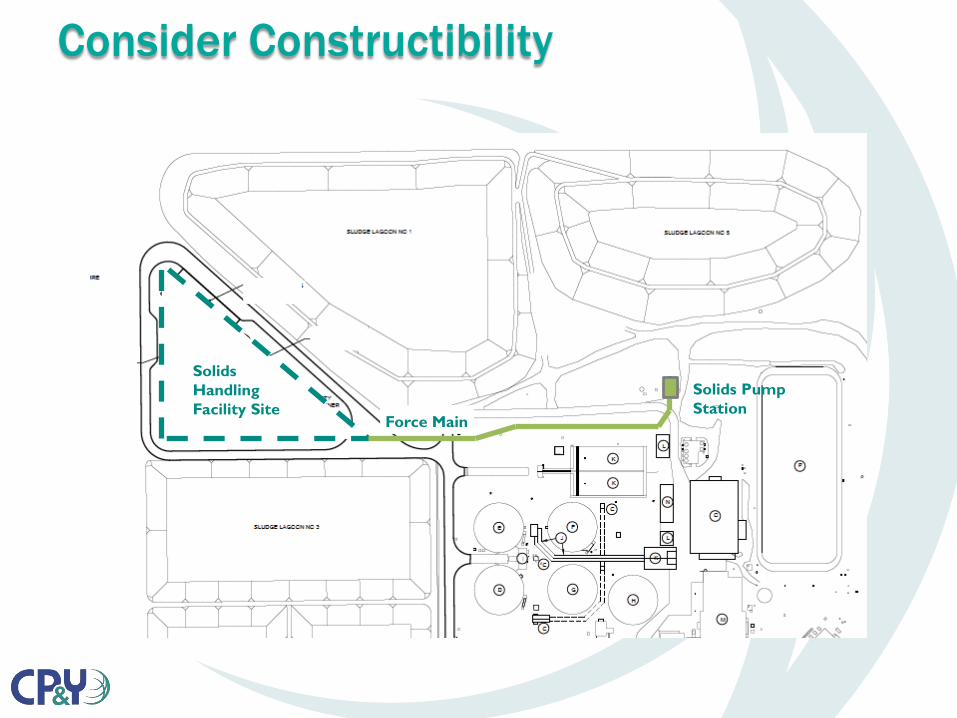
Consider Constructibility
Solids Pump Station
Force Main
Solids Handling Facility Site

Proposed Process
Clarifiers Flow / Solids Meters Solids Pump Station
ThickenersBalancing Tanks
Mechanical Dewatering
Solids Storage Hauling and Disposal

Consider How You Want to Load the TrucksDirect Loading Advantages Stacking Pad Advantages
Minimize stacking of product. Allows for Operational Flexibility. More storageavailable.
Reduces storage of the product on-site. Single story building.
Eliminates handling the product multiple times.
Less dependent on truck hauling schedules.
Small Footprint

Belt Filter Press 24/7 with Stacking Pad
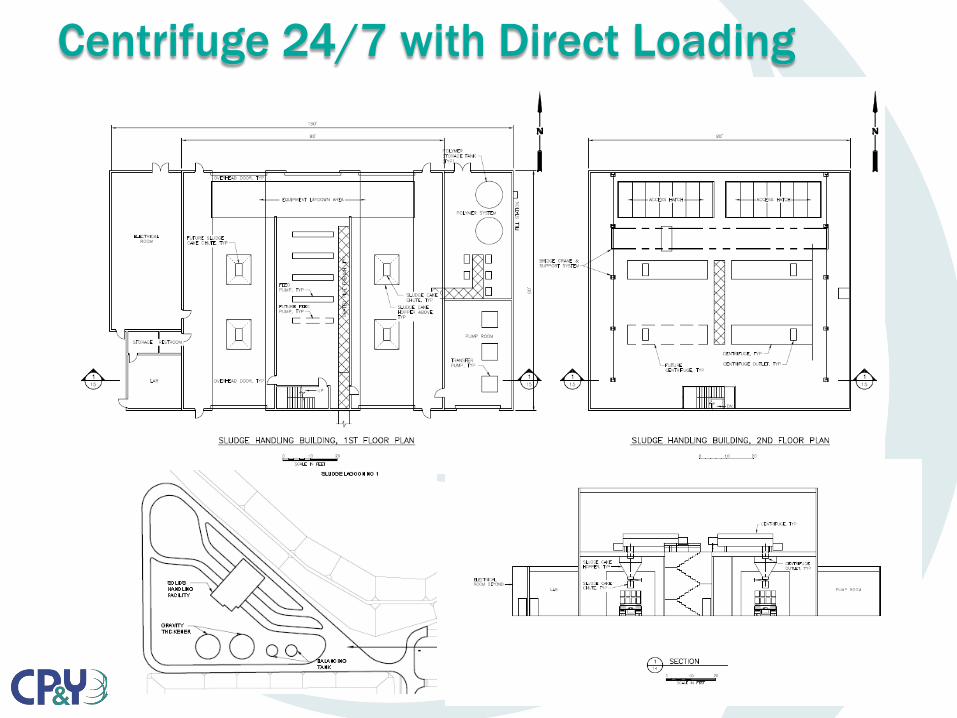
Centrifuge 24/7 with Direct Loading

1. Base Scenario2. High Lime - Historical Lime Dosages
– 190 mg/L of Lime– Mechanical Dewatering to 200 MGD
3. Low Lime – Considers Polymer Usage– 110 mg/L of Lime– Mechanical Dewatering to 200 MGD
4. Hybrid – Partial Use of Lagoons to Save Capital– 110 mg/L of Lime– Partial Mechanical Dewatering to 80 MGD. – Over 80 MGD, solids flow to lagoons.
Scenarios

Base Scenario
ItemOperation with Polymer
(Lime Dosage = 110 mg/L)Operation without Polymer(Lime Dosage = 190 mg/L)
Capital Cost $14,570,000 $14,570,00030-year
Dewatering, Hauling, and
Disposal
$118,090,000 $136,480,000
Total 30-Year Cumulative Value
$132,660,000 $151,050,000
30-Year Net Present Value
$72,900,000 $82,200,000
Base Scenario Costs
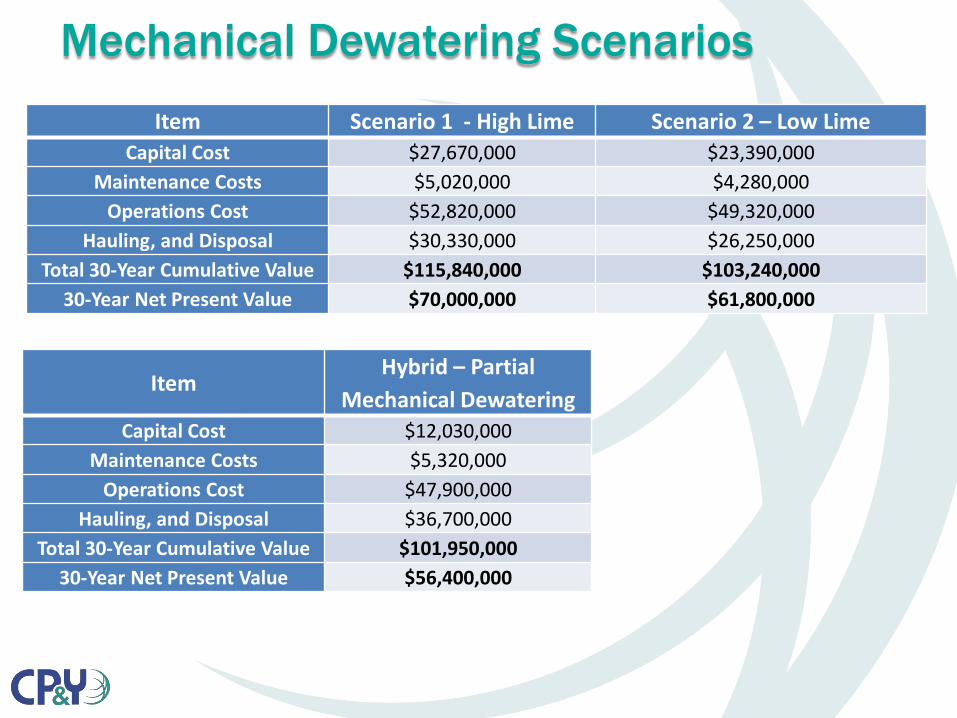
Mechanical Dewatering ScenariosItem Scenario 1 - High Lime Scenario 2 – Low Lime
Capital Cost $27,670,000 $23,390,000Maintenance Costs $5,020,000 $4,280,000
Operations Cost $52,820,000 $49,320,000Hauling, and Disposal $30,330,000 $26,250,000
Total 30-Year Cumulative Value $115,840,000 $103,240,00030-Year Net Present Value $70,000,000 $61,800,000
ItemHybrid – Partial
Mechanical DewateringCapital Cost $12,030,000
Maintenance Costs $5,320,000Operations Cost $47,900,000
Hauling, and Disposal $36,700,000Total 30-Year Cumulative Value $101,950,000
30-Year Net Present Value $56,400,000

• Consider the entire plant treatment process in evaluating residuals
• Design Goals - The cheapest solution may not be the best for a utility
Take Aways
Questions & Answers