water resources in nakamtenga, burkina faso
TRANSCRIPT
WATER RESOURCES IN NAKAMTENGA,
BURKINA FASO
QUALITY, QUANTITY AND RISKS
Gustav Isaksson
Niklas Andersson
Supervisor: Bo Olofsson
MJ153x Degree Project in Energy and Environment, First Cycle
A Minor Field Study Stockholm 2014

KTH, SE-100 44 Stockholm. Phone: +46 8 790 6561. Fax: +46 8 790 8192. E-mail: [email protected]
www.kth.se/student/utlandsstudier/examensarbete/mfs
This study has been carried out within the framework of the Minor Field Studies Scholarship Programme, MFS, which is funded by the Swedish International Development Cooperation Agency, Sida. The MFS Scholarship Programme offers Swedish university students an opportunity to carry out two months’ field work, usually the student’s final degree project, in a country in Africa, Asia or Latin America. The results of the work are presented in an MFS report which is also the student’s Bachelor or Master of Science Thesis. Minor Field Studies are primarily conducted within subject areas of importance from a development perspective and in a country where Swedish international cooperation is ongoing. The main purpose of the MFS Programme is to enhance Swedish university students’ knowledge and understanding of these countries and their problems and opportunities. MFS should provide the student with initial experience of conditions in such a country. The overall goals are to widen the Swedish human resources cadre for engagement in international development cooperation as well as to promote scientific exchange between universities, research institutes and similar authorities as well as NGOs in developing countries and in Sweden. The International Relations Office at KTH the Royal Institute of Technology, Stockholm, Sweden, administers the MFS Programme within engineering and applied natural sciences. Erika Svensson Programme Officer MFS Programme, KTH International Relations Office

III
Acknowledgement We would like to thank Mr. Bo Olofsson, professor in environmental geology, KTH, for his
work as supervisor. We would also like to thank Mrs. Stina Berge, Mr. Lennart Karlsson and
Mrs. Eva Karlsson on Yennenga Progress for a very fruitful cooperation and support during
the stay in Nakamtenga.
A big thanks to the inhabitants of Nakamtenga for their great hospitality and for being helpful.
Especially Compaoré Aloïse (our interpreter) and the village committee;
Zomodo Zoundou Adama, president CVD Nakamtenga
Ilboudo Adama, conseiller municipal Nakamtenga
Birba Salam Joёl, délégué du Comité Debase
Compaoré Boukaré, responsable des jeunes du village
Birba Roger, responsable du sport
Compaoré Sotissi, Centre de l’Esprit Ouvert.
We also want to show our appreciation towards Mr. Moussa Sougoti at the University of
Ouagadougou whose guidance and kindness helped and motivated us. Finally, thanks to our
families for being supportive during the field study.

IV
Abstract Nakamtenga is situated in Burkina Faso, one of the poorest countries in the world suffering
from lack of potable water and food security, leading to starvation and illnesses such as
diarrhea. The purpose and goal of the field study was consequently to analyze the water
situation in Nakamtenga so that the results and conclusions drawn from it could help to
improve the water situation. It was done by investigating the water quality, quantity, risks of
contamination and how the water is handled. At the time of observation Nakamtenga had
seven functioning wells; two open dug wells and five closed pumps. The water quality
analyses indicate that the quality is generally good, with exception of the open wells, of which
the water has significant amounts of coliforms. The phosphate levels are above 0.6 mg/l in six
of the wells, which indicate that the water may be affected by human activities.
The most significant threat to the water quality is the handling of the water, which is
inappropriate in many ways. Placing of funnels in spill water from the wells, not covering the
containers used to store water and placing fetching materials in the dirt are examples of
improper handling. Other risks of contamination are lacks in the construction of the wells,
latrines placed near the wells and use of pesticides/herbicides. Another major problem is that
the pumps break too often; there is water but the inhabitants cannot reach it. It is important to
take in consideration that the mapping was made during the dry season. Since conditions are
very different during the rainy season it is recommended to do further studies during this
period, or at least, being attentive to indications of changes in water quality and supply.
To improve the water situation several measures can be taken. Education concerning the
handling of the water (hygiene and sanitation) is one of the most important. Actions should
also be taken to improve the water quality in the open wells. Reducing contamination risks is
possible at all wells since deficiencies and flaws occur everywhere. Moreover the
documentation and organization of water related issues is insufficient. Improving this work
could significantly improve the water situation in the village.
Keywords Burkina Faso, water quality, Nakamtenga, water handling, wells, contamination risks.

V
Summary in Swedish (sammanfattning) Byn Nakamtenga ligger i Burkina Faso, ett av världens fattigaste länder. Befolkningen lider
av brist på drickbart vatten och mat, vilket leder till svält och diverse sjukdomar såsom diarré.
Syftet och målet med fältstudien var således att kartlägga vattensituationen i Nakamtenga så
att resultaten och slutsatserna kan användas till att förbättra vattensituationen. Kartläggningen
gjordes genom att undersöka vattenkvalitet, vattentillgångar, kontaminationsrisker samt
vattenhantering. Då studien utfördes fanns sju fungerande pumpar i byn; två öppna grävda
brunnar och fem slutna borrade brunnar. Vattenkvalitetstesterna indikerar att kvaliteten
generellt är bra, med undantag för de öppna brunnarna där mängden koliformer är stor. I sex
av brunnarna var fosfathalterna över 0,6 mg/l, vilket indikerar att vattnet kan vara påverkat av
mänsklig aktivitet.
Det största hotet mot vattenkvaliteten är hanteringen av vattnet, vilken är olämplig på flera
sätt. Exempel på bristande hantering är att trattarna som används vid pumparna placeras i
spillvattnet vid brunnarna, att lerkrukorna som vattnet förvaras i inte täcks över samt att
upphämtningsmaterial placeras i smutsen. Andra kontaminationsrisker är brister i brunnarnas
konstruktion, latriner placerade nära brunnarna och användning av bekämpningsmedel.
Pumpar som går sönder för ofta är ett huvudproblem; det finns vatten men invånarna kan inte
nå det. Det är viktigt att beakta att kartläggningen gjordes under torrperioden. Eftersom
förhållandena skiljer sig påtagligt mellan torr- och regnperioden rekommenderas att fler tester
och observationer görs under regnperioden, eller åtminstone att man är uppmärksam på
eventuella förändringar i vattenkvalitet och vattentillgång.
Flera åtgärder kan vidtas för att förbättra vattensituationen. En av de viktigaste är utbildning
om vattenhantering (hygien och sanitet). Åtgärder bör också vidtas för att förbättra
vattenkvaliteten i de öppna brunnarna. Förbättringar kan ske vid alla brunnar, eftersom brister
finns överallt. Vidare är dokumentationen och organisationen kring vattenrelaterade frågor
otillräcklig. Genom att förbättra dessa kan vattensituationen förbättras avsevärt.

VI
Summary in French (sommaire) Nakamtenga est situé à Burkina Faso, un pays parmi les plus pauvre pays dans le monde qui
souffre de manque de l’eau potable et sécurité alimentaire, provoquant famine et maladies
comme colique. L’objectif et but de cette étude de lieu est par conséquence de cartographier
la situation de l’eau a Nakamtenga en sorte que les résultats et conclusions peut contribue á
l’amélioration de cette situation. Lequel a été fait par des études de qualité, quantité, risque de
contamination et comment l’eau est manie. Quand l’étude a été fait Nakamtenga a eu sept
source de l’eau qui a été utilisable ; deux puits et cinq forages. L’analyse de l’eau indique que
la qualité est bien en général, avec l’exception des puits qui a eu une grande quantité de
bactéries. Le niveau de phosphate est plus que 0.6 mg/l dans six sources, une indication que
l’eau peut être contaminée.
La plus grand menace pour la qualité de l’eau est le traitement, qui est pauvre dans plusieurs
manières. Placement d’entonnoirs dans l’eau qui a été déverse à côté de les forages, des
canaries qui n’est sont pas couvrit et placement de les matériaux utilisé pour faire sortir l’eau
dans le poussier sont exemples de traitement incorrect. Autre risques de contamination sont
forages qui sont mal construit, latrines place trop proche de sources de l’eau et l’utilisation de
herbicides et pesticides. Forages qui se gâte trop est un problème majeur ; il y a du l’eau mais
les habitants ne réussit pas de le faire sortir. C’est important de considéré que l’étude était fait
pendant la saison sèche. Comme les conditions sont très diffèrent pendant la saison de pluie la
recommandation est de faire plusieurs études pendant cette période, ou au moins, être attentif
sur indications de changement de qualité et quantité du l’eau.
Pour améliorer la situation de l’eau il y a plusieurs actions qui peut être faites. Education
concernant le traitement de l’eau (l’hygiène et l’assainissement) est une de les plus
importants. Actions devrait être faites pour améliore la qualité du l’eau dans les puits.
Réductions de la risque de contamination est possible á tous les forages et puits comme il y a
déficiences et défauts partout. En plus la documentation et l’organization des questions liée á
l’eau est insuffisante.

VII
Table of contents
Acknowledgement .................................................................................................................... III
Abstract .................................................................................................................................... IV
Keywords ................................................................................................................................. IV
Summary in Swedish (sammanfattning) ................................................................................... V
Summary in French (sommaire) ............................................................................................... VI
Table of tables .......................................................................................................................... IX
Table of figures ........................................................................................................................ IX
Introduction ................................................................................................................................ 1
Purpose and goals ....................................................................................................................... 1
Methods ...................................................................................................................................... 1
Field sampling ........................................................................................................................ 2
Water quality analyses ............................................................................................................ 2
Field observations ................................................................................................................... 3
Interviews ............................................................................................................................... 4
Calculations of results ............................................................................................................ 4
Results ........................................................................................................................................ 6
The study area ......................................................................................................................... 7
The quarters ............................................................................................................................ 8
Water resources ...................................................................................................................... 9
Geological and hydrological information ............................................................................. 11
Water resource information .................................................................................................. 11
The Foot Pump ..................................................................................................................... 15
The Ropandin Pump ............................................................................................................. 21
The Soulgo Pump ................................................................................................................. 26
The School Pump.................................................................................................................. 31
The Center Pump .................................................................................................................. 36
The Yipala Well .................................................................................................................... 41
The Road Well ...................................................................................................................... 47
The Yaorgẽ Pump ................................................................................................................. 52
The Park Pump ..................................................................................................................... 55
Water quality tests ................................................................................................................ 58
The water taps run by the state ............................................................................................. 59
From source to mouth ........................................................................................................... 61
Step one: by the well ......................................................................................................... 61
Step two: transportation .................................................................................................... 63

VIII
Step three: at home ............................................................................................................ 63
Step four: consuming the water ........................................................................................ 64
Clay pot tests ........................................................................................................................ 64
The inhabitants' primary water resources ............................................................................. 66
Overall picture ...................................................................................................................... 67
The water supply ............................................................................................................... 67
Pump types ........................................................................................................................ 68
Construction ...................................................................................................................... 68
Organization ...................................................................................................................... 69
Sociography ...................................................................................................................... 69
Other significant observations .......................................................................................... 70
Discussion ................................................................................................................................ 71
Geographic position and climate .......................................................................................... 71
Soil type and runoff water .................................................................................................... 71
Contamination risks .............................................................................................................. 72
Water quality ........................................................................................................................ 73
Culture and tradition ............................................................................................................. 74
Water supply and consumption ............................................................................................ 74
Pump types ........................................................................................................................... 75
Advantages and future challenges ........................................................................................ 76
Measures ............................................................................................................................... 76
Sources of error .................................................................................................................... 77
Water quality analyses ...................................................................................................... 77
Calculations ....................................................................................................................... 77
Observations ..................................................................................................................... 77
Interviews .......................................................................................................................... 78
Suggestions of Measures .......................................................................................................... 78
Handling ............................................................................................................................... 78
At the well ......................................................................................................................... 78
Transportation ................................................................................................................... 79
At home ............................................................................................................................. 79
The consumption ............................................................................................................... 79
Construction.......................................................................................................................... 79
Information ........................................................................................................................... 79
Organization ......................................................................................................................... 80
Secure the quality and amount of water ............................................................................... 80
Further actions ...................................................................................................................... 80

IX
Conclusions .............................................................................................................................. 81
Appendix 1 - explanation of water quality factors ................................................................... 84
Appendix 2 - interviews ........................................................................................................... 87
Appendix 3 - interviewees ........................................................................................................ 92
Appendix 4 - inspection forms ................................................................................................. 93
Appendix 5 - taps run by the state .......................................................................................... 104
Appendix 6 - examples of construction .................................................................................. 105
Appendix 7 - test kits and analysis limits ............................................................................... 106
Table of tables TABLE 1. WATER QUALITY INDICATORS FOR THE FOOT PUMP ...........................................................19 TABLE 2. WATER QUALITY INDICATORS FOR THE ROPANDIN PUMP .................................................25 TABLE 3. WATER QUALITY INDICATORS FOR THE SOULGO PUMP ......................................................30 TABLE 4. WATER QUALITY INDICATORS FOR THE SCHOOL PUMP ......................................................35 TABLE 5. WATER QUALITY INDICATORS FOR THE CENTER PUMP ......................................................39 TABLE 6. WATER QUALITY INDICATORS FOR THE YIPALA WELL .......................................................45 TABLE 7. WATER QUALITY INDICATORS FOR THE ROAD WELL ..........................................................51 TABLE 8. RESULTS FROM WATER QUALITY ANALYSES .........................................................................58 TABLE 9. INTERPRETATION OF THE WATER QUALITY ANALYSES ......................................................58 TABLE 10. RESULTS FROM THE WATER QUALITY ANALYSIS FOR THE WATER TAP RUN BY THE
STATE ..........................................................................................................................................................60 TABLE 11. E. COLI AND COLIFORM TESTS IN CLAY POTS.......................................................................65 TABLE 12. THE AMOUNT OF VISITORS TO EVERY WATER RESOURCE PER DAY .............................67 TABLE 13. HOW OFTEN THE PUMPS BREAK ...............................................................................................68 TABLE 14. THE CONCENTRATION OF CACO3 AND THE CORRESPONDING HARDNESS ....................84 TABLE 15. THE INTERVIEWEES ......................................................................................................................92
Table of figures FIGURE 1. A BACTERIA TEST SHOWING NINE COLIFORM COLONIES ................................................... 2 FIGURE 2. THE PHOSPHATE COLORIMETER ................................................................................................ 3 FIGURE 3. BURKINA FASO AND ITS SURROUNDING COUNTRIES, WITH NAKAMTENGA MARKED
BY THE ARROW. ......................................................................................................................................... 6 FIGURE 4. A MAP OF THE STUDY AREA, WHERE NORTH IS STRAIGHT UPWARDS. ........................... 7 FIGURE 5. ALL THE QUARTERS IN NAKAMTENGA WITH NUMBER OF INHABITANTS ..................... 8 FIGURE 6. THE BOREHOLES AND DUG WELLS IN NAKAMTENGA. ........................................................ 9 FIGURE 7. THE DIFFERENT WATER SOURCES DURING THE RAINY SEASON. ....................................10 FIGURE 8. THE SOIL BESIDE THE SCHOOL PUMP ......................................................................................11 FIGURE 9. THE DIFFERENT TYPES OF RISKS CONSIDERED ....................................................................12 FIGURE 10. A CRACK IN AN OPEN WELL .....................................................................................................14 FIGURE 11. THE FOOT PUMP ...........................................................................................................................15 FIGURE 12. RISK SOURCES IN THE PROXIMITY OF THE FOOT PUMP. ..................................................16 FIGURE 13. A CLOSE-UP OF THE FOOT PUMP .............................................................................................17 FIGURE 14. VISITORS AND WATER-UPTAKE, THE FOOT PUMP ..............................................................18 FIGURE 15. GENDER DISTRIBUTION, THE FOOT PUMP ............................................................................18 FIGURE 16. TIME OF VISITS, THE FOOT PUMP ............................................................................................18 FIGURE 17. THE ROPANDIN PUMP .................................................................................................................21 FIGURE 18. RISK SOURCES IN THE PROXIMITY OF THE ROPANDIN PUMP. ........................................22 FIGURE 19. CLOSE-UP OF THE ROPANDIN PUMP .......................................................................................23 FIGURE 20. VISITORS AND WATER-UPTAKE, THE ROPANDIN PUMP ....................................................24 FIGURE 21. GENDER DISTRIBUTION, THE ROPANDIN PUMP ..................................................................24 FIGURE 22. TIME OF VISITS, THE ROPANDIN PUMP ..................................................................................24

X
FIGURE 23. THE SOULGO PUMP......................................................................................................................26 FIGURE 24. RISK SOURCES IN THE PROXIMITY OF THE SOULGO PUMP. .............................................27 FIGURE 25. CLOSE-UP OF THE SOULGO PUMP ...........................................................................................28 FIGURE 26. VISITORS AND WATER-UPTAKE, THE SOULGO PUMP ........................................................29 FIGURE 27. GENDER DISTRIBUTION, THE SOULGO PUMP .......................................................................29 FIGURE 28. TIME OF VISITS, THE SOULGO PUMP ......................................................................................29 FIGURE 29. THE SCHOOL PUMP ......................................................................................................................31 FIGURE 30. RISK SOURCES IN THE PROXIMITY OF THE SCHOOL PUMP. .............................................32 FIGURE 31. CLOSE-UP OF THE SCHOOL PUMP ............................................................................................33 FIGURE 32. VISITORS AND WATER-UPTAKE, THE SCHOOL PUMP ........................................................34 FIGURE 33. GENDER DISTRIBUTION, THE SOULGO PUMP .......................................................................34 FIGURE 34. TIME OF VISITS, THE SCHOOL PUMP .......................................................................................34 FIGURE 35. THE CENTER PUMP ......................................................................................................................36 FIGURE 36. RISK SOURCES IN THE PROXIMITY OF THE YIPALA WELL. .............................................37 FIGURE 37. CLOSE-UP OF THE CENTER PUMP ............................................................................................38 FIGURE 38. THE YIPALA WELL .......................................................................................................................41 FIGURE 39. RISK SOURCES IN THE PROXIMITY OF THE YIPALA WELL. ..............................................42 FIGURE 40. CLOSE-UP OF THE YIPALA WELL .............................................................................................43 FIGURE 41. VISITORS AND WATER-UPTAKE, THE YIPALA WELL .........................................................44 FIGURE 42. GENDER DISTRIBUTION, THE YIPALA WELL ........................................................................44 FIGURE 43. TIME OF VISITS, THE YIPALA WELL ........................................................................................44 FIGURE 44. THE ROAD WELL ..........................................................................................................................47 FIGURE 45. RISK SOURCES IN THE PROXIMITY OF THE ROAD WELL. .................................................48 FIGURE 46. CLOSE-UP OF THE ROAD WELL ................................................................................................49 FIGURE 47. VISITORS AND WATER-UPTAKE, THE ROAD WELL .............................................................50 FIGURE 48. GENDER DISTRIBUTION, THE ROAD WELL ...........................................................................50 FIGURE 49. TIME OF VISITS, THE ROAD WELL ...........................................................................................50
FIGURE 50. THE YAORGẽ PUMP .....................................................................................................................52
FIGURE 51. RISK SOURCES IN THE PROXIMITY OF THE YAORGẽ PUMP.............................................53
FIGURE 52. CLOSE-UP OF THE YAORGẽ PUMP ...........................................................................................54 FIGURE 53. THE PARK PUMP ...........................................................................................................................55 FIGURE 54. RISK SOURCES IN THE PROXIMITY OF THE PARK PUMP ...................................................56 FIGURE 55. CLOSE-UP OF THE PARK PUMP .................................................................................................57 FIGURE 56. THE WATER TAPS MARKED WITH ARROWS .........................................................................60 FIGURE 57. A FUNNEL AT THE SOULGO PUMP ...........................................................................................61 FIGURE 58. A CONTAINER IS FILLED IN ROPANDIN .................................................................................61 FIGURE 59. IMPROPER HANDLING BY THE SOULGO PUMP ....................................................................62 FIGURE 60. A ROPE BEING TEARED AGAINST THE EDGE ........................................................................63 FIGURE 61. A WOMAN SHOWING HER BICYCLE WITH CONTAINERS ..................................................63 FIGURE 62. CONTAINERS STORED IN THE DIRT AMONG THE ANIMALS .............................................63 FIGURE 63. OPEN CLAY POTS. ........................................................................................................................64 FIGURE 64. FETCHING MATERIAL IN THE DIRT .........................................................................................64 FIGURE 65. AN OPEN PLASTIC BOTTLE PLACED ON THE GROUND. .....................................................64 FIGURE 66. CONSUMING THE WATER ..........................................................................................................64 FIGURE 67. THE WELLS WHICH THE INHABITANTS VISIT PRIMARILY ...............................................66 FIGURE 68. CHILDREN USING THE SOULGO PUMP. ..................................................................................70 FIGURE 69. WASTE DISPOSAL AREA. ............................................................................................................70
FIGURE 70. DEFORESTATION. .........................................................................................................................70
FIGURE 71. THE FIRST WATER TAP RUN BY THE STATE ......................................................................104
FIGURE 72. THE SECOND WATER TAP RUN BY THE STATE .................................................................104
FIGURE 73. CLOSE-UP OF A WATER TAP ....................................................................................................104
FIGURE 74. THE BROKEN DRAINAGE CHANNEL AT THE FOOT PUMP (1) .........................................105
FIGURE 75. INSUFFICIENT DRAINAGE CHANNEL AT THE SOULGO PUMP .......................................105
FIGURE 76. WELL-CONSTRUCTED DRAINAGE CHANNEL AT THE ROPANDIN PUMP ....................105
FIGURE 77. DRAINAGE CHANNEL IN NEED OF CLEANING AT THE SOULGO PUMP ......................105
FIGURE 78. THE BROKEN DRAINAGE CHANNEL AT THE FOOT PUMP (2) .........................................105
FIGURE 79. A BROKEN WALL BY THE FOOT PUMP ................................................................................105

1
Introduction Maintaining a safe and reliable water asset is one of the main concerns in the world today.
According to the Red Cross, more than 780 million people do not have access to clean water.
Because of this, about 4 000 children under the age of five die every day (Röda Korset, n.d.).
Clean water is a necessity for development. Burkina Faso is one of the poorest nations in the
world, placed 183 of 187 in UNDP´s Human Development Index 2012 (UNDP, 2013). The
average temperature is 32 degrees Celsius in April (Holmertz, 2012) and it has about 18
million inhabitants (Rundquist, n.d.).
The place of the field study is Nakamtenga, a village with a bit more than 1000 inhabitants,
located about 40 km outside the capital Ouagadougou. The inhabitants have problems with
malfunctioning pumps and water resources that do not suffice all year round. The first step
towards solving the water problem is to gather information about the different water resources
in the village. With this information, further actions can be taken to secure the water supply
for the inhabitants. This may result in an enhanced life quality for the population.
The study will focus on the fact that there is not a relevant and adequate description of the
status of water sources and pumps in Nakamtenga. Why such a report has not been done
before can have many reasons. Burkina Faso does not have a well-organized system for
dealing with water issues, at least not a well-functioning water agency which exists in many
other nations. Since a report does not exist, it is hard to deal with the water problem in a
correct way. It is difficult to move forwards and make decisions without the basic data.
Without such data, the best decisions might not be made to reach a long-term sustainable
solution of the issues at hand.
Another issue is the fact that there is little knowledge of the opinions and thoughts of the
inhabitants. Problems concerning the water situation can have reasons which are closely
related to attitudes and needs of the locals. To reach a long-term sustainable solution it is
preferable to include all stakeholders and take their opinions in consideration.
Purpose and goals The purpose is to map the water situation in Nakamtenga, Burkina Faso, by investigating
quality, quantity, contamination risks and how the water is handled by the population. The
results will be used to determine existing problems and suggest possible measures to improve
the water situation. The goal is that the report shall be used as a source of information for
further actions with the aim of securing access to water of good quality and quantity in
Nakamtenga.
Methods The methods used were both quantitative (tests of coliforms and chemicals) and qualitative
(interviews). The quantitative analyses were done using test kits optimized for usage in the
field. Information has been gathered from well-known organizations to the greatest extent
possible. Several different sources have been used for gathering data in the field to reduce the
risk of obtaining misleading data. This was important since paperwork from earlier pump
repairs and such does not exist.

2
Field sampling
150 ml of water was collected from each water source in acid-washed containers. The pumps
were rinsed with a significant amount of water before the samples were taken. The tap water
was running for 30 seconds and the sieve from the tap was removed before the sample was
collected. The samples were immediately transported to the laboratory for analysis, due to the
fact that they would be heated otherwise, preventing the bacteria from growing. Therefore the
tests for bacteria were done first.
Water quality analyses
The following chemicals and quality aspects were analyzed in every water sample;
E. coli and coliform bacteria
Electric conductivity
pH
Temperature
Hardness (CaCO3)
Chloride ions
Nitrate ions
Phosphate ions
Arsenic
Tests of bacteria were done by adding 1 ml of water to plates with nutrients. The results were
observed after 24 hours and 48 hours, respectively. The number of colonies, their colour, and
possible gas bubbles surrounding the colonies were observed. An example of what a bacteria
test could look like is shown in Figure 1. The dots represent colonies of coliforms.
Figure 1. A bacteria test showing nine coliform colonies
Conductivity, pH and temperature were measured with electronic instruments which had been
calibrated beforehand. Temperature was measured with two instruments and the mean value
was calculated. For the hardness and chloride analyses, volumetric titration was used to
determine the amount of CaCO3 and Cl- ions in the water samples, respectively. Either 5 ml or
50 ml of water sample was needed for every test, depending on whether a high range measure

3
or a low range measure was to be done. In this case, high range tests were performed (Hanna
Instruments, n.d. a); (Hanna Instruments, n.d. b).
The amount of nitrate ions in every sample was analyzed by adding a nitrate reagent to 10 ml
of water sample. The mixture was added to a color comparator cube to determine the quantity
of NO3- (Hanna Instruments, n.d. c). Phosphate ions were quantified by using the Ascorbic
Acid method. Firstly, a colorimeter was calibrated using the water sample. Secondly, a
phosphate reagent was added to the sample before it was inserted into the colorimeter. The
result could be read off the colorimeter after three minutes (see Figure 2) (Hanna Instruments,
n.d. d).
Figure 2. The phosphate colorimeter
The arsenic analysis was a color comparative test. Two reagents were added to either 9.6 ml
or 50 ml of water sample depending on whether the test was high range or low range. A low
range test was performed in this case, which means that 50 ml of water was required. The
addition of reagent causes a reaction which produces gases. The gases react with a test strip
that may change color. After swirling a total of three times the color of the test strip was
compared with a specific color chart (Hach, n.d.). For a complete list of test kits used and
their analysis limits see Appendix 7.
Field observations
For each water source, a day (05:30-18:30) was spent observing the people collecting the
water. Between 11:30 and 13:30 no observations were done. The number of containers that
each individual brought was noted. Furthermore, the time at which they arrived, their means
of transport, their gender and their age (adult or child) were written down. A person was
considered an adult if he or she looked like being 18 years old or older. The observations were
done on different weekdays for the different wells, but since most people visit the same well
at about the same time each day the results would probably not differ significantly if the
observations were done on other days.
A visit to every quarter in Nakamtenga was needed for studying how the inhabitants store
their water and the material used for collecting it. During the stay a lot of observations and
talks occurred. Even though not planned they gave important information. Another important
aspect observed was the soil type, which was decided by examining the ground. No digging
was made though.

4
The construction of the wells and risk factors regarding the construction were also observed.
All observations of the construction were done the same day to be able to get an as fair
judgement as possible. Furthermore, they were done about a week before the end of the field
study (May 22), to get as up-to-date information as possible. The construction was separated
into several factors which were judged inspired by a template by WHO. If a factor was
fulfilled it was given one point. The total score is an indicator of the risk of contamination.
The sheet is available in Appendix 4. For every well there is also information regarding the
land usage, geography and topography.
The open wells have visible water surfaces which allows the depth to be measured. It was
done by using a long rope (about 25 metres long) with a heavy stone attached to it. The rope
was marked when the stone reached the surface and when it reached the bottom. The distance
between the markings was the water depth. The distance between the stone and the first
marking shows on which depth the water surface lies. It was not possible to measure the depth
of the closed wells, but it could be calculated for the wells which had metal pipes since the
pipe is divided into several smaller pipes, each with a length of 3 m. Hence, the depth could
be calculated if the number of pipes in the well was given. Consequently it was possible to
calculate the number of smaller pipes if one knew the depth of the well.
Interviews
Interviews were done with both the locals and experts on the area of study. The interviews
with the locals were done by visiting each quarter and using the same questionnaire every
time. An interpreter was used who participated at all interviews. The names of the participants
were noted but often only a few answered. The interviews were done not only to get
information but also to make the inhabitants feel involved. Another reason was to hear how
they answered the questions and who answered. It gave a picture of whether or not people
think water is interesting and also gave impressions on knowledge and attitudes.
The questions were open-ended which means that no certain alternatives of answers were
given beforehand. The reason for the latter was that the answers were assumed to differ
slightly between the quarters. Two interviews were done each day for a total of three days.
The questionnaire was focused on the inhabitants' wishes for the future and how they handled
the water after it was collected. The questionnaire and its answers are available in Appendix
2, and the interviewees are listed in Table 15 in Appendix 3.
Calculations of results
Darcy's law was used for calculating how long time it would theoretically take for a
contaminant in water to flow between a latrine and a well. The equation is illustrated in
Equation 1.
Equation 1. Darcy's law
where the positive direction is downwards. vd is the Darcy flow rate (m/s), K is the hydraulic
conductivity (m/s), dH is the vertical distance between the two places considered, and dL is
the horizontal distance between the two places (m) (Knutsson, et al., 2002). To calculate the
flow rate of the contaminant, vp, vd has to be divided by the kinematic porosity, called "n", for
the soil. See Equation 2.
Equation 2. Calculation of a contaminant's flow rate

5
(Knutsson, et al., 2002). To calculate the time "t" it takes for the contaminant to flow the
decided distance, the distance is divided by vp, according to Equation 4. The distance "s" is
calculated by using Pythagoras' theorem, see Equation 3.
Equation 3. Pythagoras' theorem applied for dH and dL
Equation 4. Calculation of the duration of flow for a water particle
When deciding the hardness level of the water, for example if it was "hard" or "medium hard"
it had to be recalculated from mg CaCO3/l to mg Ca/l according to Equation 5. It was done
using the molar masses for the chemicals. The molar mass for CaCO3 is 100.0869 g/mole and
the molar mass for Ca is 40.078 g/mole (Nationalencyklopedin, n.d.). By dividing the molar
mass for CaCO3 by the molar mass for Ca gives
Equation 5. The ratio of the molar masses of CaCO3 and Ca
This means that for a certain hardness level in mg CaCO3 /l the amount has to be divided by
2.5 to be obtained in mg Ca/l.
Some calculations also had to be done when deciding the mean water consumption per
individual in Nakamtenga. Firstly, an assumption had to be made that everyone goes to the
same well every day. Hence, it was possible to calculate the amount of water each quarter
consumes per day. Given the number of inhabitants in Nakamtenga, it was possible to
calculate the mean consumption. The latter was done by dividing the amount of water by the
number of inhabitants.

6
Results Burkina Faso is a West-African, landlocked nation surrounded by Mali, Niger, Benin, Togo,
Ghana and Ivory Coast. Figure 3 shows Burkina Faso and parts of the surrounding countries.
Nakamtenga is marked by the arrow.
Figure 3. Burkina Faso and its surrounding countries, with Nakamtenga marked by the arrow. (Map data: Google, US Dept. of State Geographer. Image Landsat. Data SIO, NOAA, U.S. Navy,
NGA, GEBCO, 2014)

7
The study area
Figure 4. A map of the study area, where north is straight upwards. (Map data: Google,
CNES/Astrium, 2014)
Figure 4 is a picture of the study area. Nakamtenga is situated 5 km outside Ziniaré and about
40 km from the capital Ouagadougou (Google, CNES/Astrium, 2014). The map is covering
about 3380 m from east to west and about 3600 m from north to south, giving it a surface area
of about 12,17 km2 (Google, CNES/Astrium, 2014). The same applies to Figures 5 to 7 since
they are based on Figure 4.

8
The quarters
Nakamtenga consists of six quarters called Tangzougou, Yilim Toogin, Nayiri, Yaorgẽ,
Ropandin and Yipala. Yipala is situated on both sides of the road. Hence, it is sometimes
necessary to refer to only one of the sides. This will be done by naming them West and East
Yipala, respectively. The locations of the different quarters are illustrated in Figure 5. The
number of residents in each quarter is also given. The blue figures do not cover the whole
quarters, but they show where the quarters are located.
Figure 5. All the quarters in Nakamtenga with number of inhabitants. (Map data: Google,
CNES/Astrium, 2014)
500 m

9
Water resources
The water situation differs significantly between the dry and the wet season. The differences
between the water sources are illustrated in Figures 6 and 7. During the dry season the water
is found in closed boreholes and open dug wells. When the rainy season starts, the landscape
changes drastically and water is also found in ponds and rivers. The boreholes and dug wells
are pointed out with arrows.
Figure 6. The boreholes and dug wells in Nakamtenga. (Map data: Google, CNES/Astrium, 2014)
Arrow 10 is pointing towards the town Ziniaré, where people occasionally go to buy water.
To be able to separate the wells from each other they have been named and sorted in
numerical order as follows.
1. The Foot Pump 2. The Ropandin Pump
3. The Soulgo Pump 4. The School Pump
500 m
1. The Foot Pump 6. The Yipala Well
2. The Ropandin Pump 7. The Road Well
3. The Soulgo Pump 8. The Yaorgẽ Pump
4. The School Pump 9. The Park Pump
5. The Center Pump 10. Ziniaré

10
5. The Center Pump 6. The Yipala Well
7. The Road Well 8. The Yaorgẽ Pump
9. The Park Pump 10. Ziniaré
The names which include the word "well" are open wells and the rest are closed wells with
pumps. The rainy season allows more water resources to be utilized. One of those resources is
a pond that can hold 10 000 m3 of water (La Direction Régionale de l’Economie et de la
Planification du Plateau Central, 2011). It is located in the north in Figure 7. Arrow 11
represents an open well which only holds water during the wet season. It collapsed 2013. The
thin arrows mark ponds and the blue line symbolizes a river.
Figure 7. The different water sources during the rainy season. (Map data: Google, CNES/Astrium,
2014)
500 m
Ponds
Pumps and wells
Water during the rainy season

11
Geological and hydrological information
The mean annual precipitation in Ziniaré municipality between 2001 and 2012 was 732 mm
(La Direction Régionale de l’Economie et de la Planification du Plateau Central, 2011). The
dominating rock type is porphyric granite with biotite and amphibole (brgm, 2003). The soils
consist to a great extent of fine-grained sand and silt. A thin layer of gravel overlays the sand
and silt locally. The soil next to the School Pump is shown in Figure 8. The topography is
very flat with only a few hills.
Figure 8. The soil beside the School Pump
According to Comité Nong-Taaba, there are three main soil types in Nakamtenga; Boolé,
Zegdga and Bisri. The Boolé covers 3/5 of the surface area of Nakamtenga. Sorghum and rice
are generally cultivated on the Boolé. Further, the Zegdga covers 1/5 and the Bisri covers 1/5
of the land. Zegdga exists mainly by the quarters Nayiri and Yipala, and it is suitable for
cultivating millet, peas, peanuts, corn and sorghum. The Bisri is predominantly in Yaorgẽ and
it is frequently used for cultivating millet, peas and peanuts (Comité de Développement du
Monde Rural Nongtaaba, 2004)
Water resource information
Since the study took place during the dry season in Burkina Faso, all ponds and rivers were
dried out. Consequently, only the boreholes and wells could be analyzed. Not all of those
resources were operational either. The Park Pump and the Yaorgẽ Pump were not functioning
at the time of the study. During the field study the Foot Pump broke, making it impossible to
do two tests of bacteria. Animals stroll everywhere and are not counted as the closest
contamination source and visitors to wells are considered children when believed to be less
than 18 years old.
The presentation of the data obtained on each resource follows the same pattern. It starts with
a picture of the resource (Figures 11, 17, 23, 29, 35, 38, 44, 50 and 53) followed by a map
with land use and risk sources (Figures 12, 18, 24, 30, 36, 39, 45, 51 and 54). Thereafter a
closeup of the pump/well is presented (Figures 13, 19, 25, 31, 37, 40, 46, 52 and 55). The
statistics which follows is divided into three parts; visitors and water uptake (Figures 14, 20,
26, 32, 41 and 47), gender distribution (Figures 15, 21, 27, 33, 42 and 48) and number of
visitors per time period (Figures 16, 22, 28, 34, 43 and 49). The results of the water quality

12
tests are then presented in Tables 1 - 7. Finally a section with further comments is included.
The data obtained on each resource follows after an explanation of bacterial and construction
classification and the risk sources included in the maps.
Bacterial and construction classification
The number of coliform colonies varied a lot among the tests. To make the results lucid the
tests were classified in one of three classes depending on the amount of coliforms spotted.
Class 1 means that the tests do not show any presence of E. coli. There can be a small amount
of other coliforms but not in a quantity that would cause any harm when drinking the water.
The water is therefore of good quality with respect to coliforms and there should be no
problem drinking it. Class 2 includes the samples which had small amounts of E. coli.
Included in the class are also the samples that had small amounts of E. coli but large
quantities of coliforms. It is uncertain what types of coliforms that are present and their health
effects. The vagueness in the tests leads to difficulties in judging whether or not some of the
coliforms are E. coli instead. Hence, the consumption should be done with caution and
measures for minimizing the risks of contamination should be considered. The samples
classified as Class 3 are samples where the presence of E. coli is clear and other coliforms are
in great number. The water may be a health risk and measures are strongly recommended to
prevent illnesses.
The wells were classified in a similar manner regarding the construction. For each criteria
fulfilled in the contamination risk template the well was given one point. After summing up
the total score the well was placed in one of three different risk levels; Low (0-3), Medium (4-
6) or High (7-10), where 10 was the maximum score. 0-3 means that the well is decently
constructed and the risk of contamination due to deficiencies in the construction is low. There
might be some flaws but they are not of the significance that actions must be taken. 4-6 means
that there are enough deficiencies to risk contamination of the water. Consequently the risk is
judged to be Medium. The contamination risk is not imminent but actions to decrease it
should be considered. 7-10 means that construction is so deficient that the risk of
contamination is high. Contamination might not only be a risk but a fact and actions are
strongly recommended.
Risk sources Different sources of risks that can cause contamination in the wells are illustrated in the
information about each well, with different colours and designs. The illustrations are shown in
Figure 9.
Figure 9. The different types of risks considered
Latrines are assumed to exist in every house complex, but spotted latrines are marked with
red squares. Latrines are risks since they store faeces with bacteria which can cause diarrhea.
If the latrines are not completely sealed the bacteria can leach into the groundwater and to

13
wells. If the water has raised levels of nitrate this might indicate fecal presence or that the
latrine nearby the well leaches contaminants to the well.
Animal keeping has been considered a risk for the same reason as for latrines. Keeping
animals in a certain area means that the faeces are concentrated to a particular place. The
hazard is whether or not leaching to the groundwater occurs. Different animals have different
amounts of coliforms in their faeces. Sheep have about 16,000,000 coliforms in one gram
faeces, and pigs have 3,300,000. Chickens have 1,300,000 and humans have an average
amount of 13,000,000 (CAWST, 2013).
Tomato fields mean a potential source of chemical contaminants. It is common to use both
herbicides and pesticides during the cultivation and there are many different brands of
pesticides for this purpose to buy in the local store. There might be a lack of knowledge
concerning how to use the products, and since a majority of the population does not know
how to read and write it might be difficult to understand the instructions.
Millet cultivation does not usually require adding of herbicides and pesticides, but it does
require fertilization (Zomodo Zoundou, et al., 2014). Fertilizers can leach into the
groundwater or flow with the surface runoff to the wells. This can affect the nitrate and
phosphate levels in the water. Even though the usage of pesticides and herbicides is rare it
happens. Therefore millet fields have to be considered a possible contamination source even
concerning chemicals.
Rice fields are a quite recent phenomenon in Nakamtenga. The cultivation of rice demands a
lot of water and a special type of farming. Cultivation also means using chemicals to protect
from epidemics and pests. Since the product is new and people do not have experience the
risk is bigger for a misuse of the chemicals. Rice fields are known to demand chemicals so the
presence of this near a water source can mean that the water is contaminated.
The usage of herbicides and pesticides in Nakamtenga is most frequent in rice fields and
tomato fields but can also occur on the grain fields (Zomodo Zoundou, et al., 2014). Several
different pesticides are troublesome to get rid of, since they do not disintegrate easily in the
groundwater. Consequently, pesticides can contaminate the groundwater for decades after
they are used (Knutsson, et al., 2002).
Housing in the proximity of the wells has been considered a risk on account of the fact that
the presence of humans mean presence of excrete and garbage. Latrines are not always used
and there is no existing waste handling. The runoff water brings with it deposits from the
houses which threaten the water quality.
Leaching is also a problem next to roads and streets. As an illustration, about 10,000 tonnes of
tyre threads are worn down along the roads in Sweden each year. In the tyres there are highly
aromatic oils including polycyclic aromatic hydrocarbons (PAH). Some PAHs are
carcinogenic and are mostly stable in the environment. In lakes and ponds the PAHs may be
enriched in the food chain (Swedish National Chemicals Inspectorate, 2003). The presence of
a road means that dangerous goods can be transported there. In case of accidents the water
quality can be seriously threatened.
Animals are grazing everywhere in Nakamtenga, including just beside the wells. This risk
factor has therefore not been included in the maps. Animals being able to reach the wells is
included in the valuation of the contamination risk being mentioned in the construction
paragraph for each well. The construction of the pump and the well is very important since it
may affect whether or not the water in the well becomes contaminated. Cracks in the well
apron and inadequate drainage of spill water are two of several factors that must be

14
considered (World Health Organization, 2012). Figure 10 shows a crack inside well 11 in
Figure 7.
Figure 10. A crack in an open well
Inadequate drainage of spill water is a risk since pools may act as an entrance for
contaminants. Therefore, the construction has been analyzed for every water resource, giving
each construction a point representing the risk level. This simplifies the understanding of how
well constructed the wells are and also allows comparison between the sources. The altitude
and soil type is also included since they affect the path of the runoff water and how fast
contaminated water infiltrates and reaches the boreholes. For more information regarding
coliforms, nitrates and other chemicals, see Appendix 1. Figures 74 - 79 in Appendix 6 show
more examples of constructions affecting the risk level.

15
The Foot Pump
Figure 11. The Foot Pump
Year of construction: 1994
Date of last repair: March 2014
Pump brand: Verne
Quarter: Yipala
Coordinates: Latitude 12.609470˚
Longitude -1.256320˚
Depth to the bottom: 51 m
Dates
Observation 14/04/2014
Quality test 10/04/2014
Coliform test 1 10/04/2014
Coliform test 2 Not possible
16
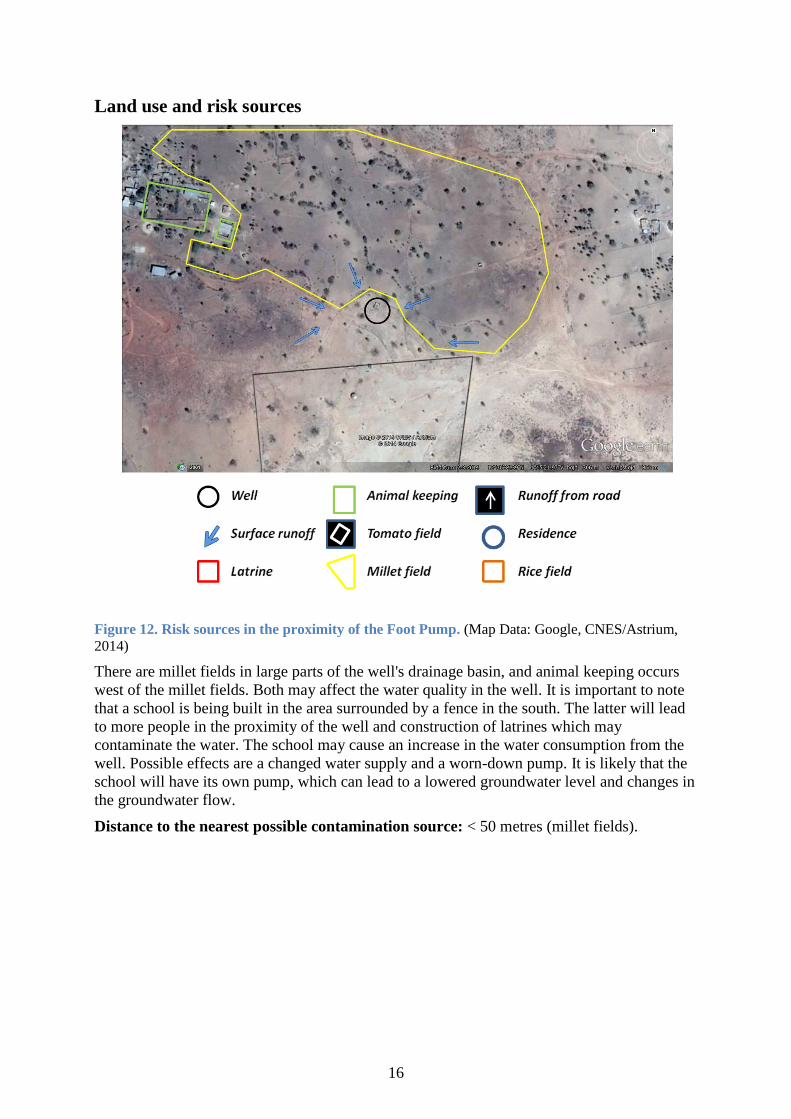
Land use and risk sources
Figure 12. Risk sources in the proximity of the Foot Pump. (Map Data: Google, CNES/Astrium,
2014)
There are millet fields in large parts of the well's drainage basin, and animal keeping occurs
west of the millet fields. Both may affect the water quality in the well. It is important to note
that a school is being built in the area surrounded by a fence in the south. The latter will lead
to more people in the proximity of the well and construction of latrines which may
contaminate the water. The school may cause an increase in the water consumption from the
well. Possible effects are a changed water supply and a worn-down pump. It is likely that the
school will have its own pump, which can lead to a lowered groundwater level and changes in
the groundwater flow.
Distance to the nearest possible contamination source: < 50 metres (millet fields).
17
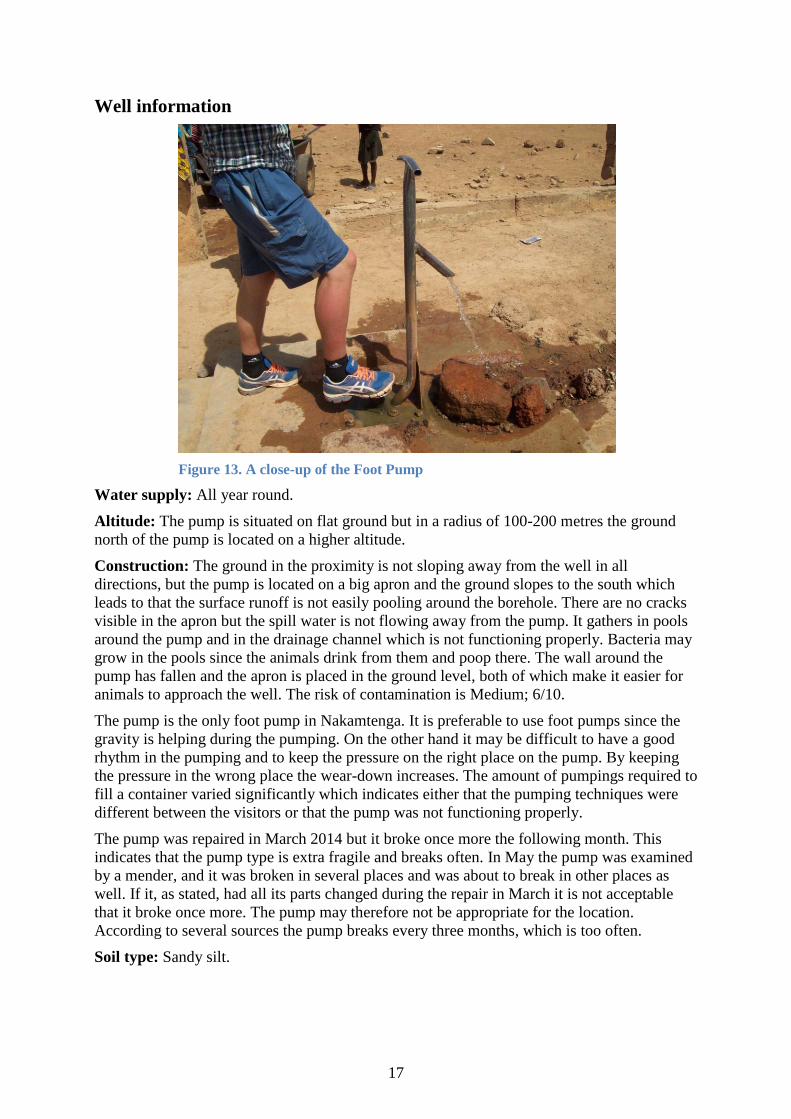
Well information
Figure 13. A close-up of the Foot Pump
Water supply: All year round.
Altitude: The pump is situated on flat ground but in a radius of 100-200 metres the ground
north of the pump is located on a higher altitude.
Construction: The ground in the proximity is not sloping away from the well in all
directions, but the pump is located on a big apron and the ground slopes to the south which
leads to that the surface runoff is not easily pooling around the borehole. There are no cracks
visible in the apron but the spill water is not flowing away from the pump. It gathers in pools
around the pump and in the drainage channel which is not functioning properly. Bacteria may
grow in the pools since the animals drink from them and poop there. The wall around the
pump has fallen and the apron is placed in the ground level, both of which make it easier for
animals to approach the well. The risk of contamination is Medium; 6/10.
The pump is the only foot pump in Nakamtenga. It is preferable to use foot pumps since the
gravity is helping during the pumping. On the other hand it may be difficult to have a good
rhythm in the pumping and to keep the pressure on the right place on the pump. By keeping
the pressure in the wrong place the wear-down increases. The amount of pumpings required to
fill a container varied significantly which indicates either that the pumping techniques were
different between the visitors or that the pump was not functioning properly.
The pump was repaired in March 2014 but it broke once more the following month. This
indicates that the pump type is extra fragile and breaks often. In May the pump was examined
by a mender, and it was broken in several places and was about to break in other places as
well. If it, as stated, had all its parts changed during the repair in March it is not acceptable
that it broke once more. The pump may therefore not be appropriate for the location.
According to several sources the pump breaks every three months, which is too often.
Soil type: Sandy silt.

18
Water consumption
Water-uptake per day
2045 liters
Visitors
26
From
Tangzougou (15 visitors,
1390 l)
Tiebe (11 visitors, 655 l)
Means of transport
2 donkeys with carts and
22 bicycles
Gender statistics
Of the 26 visitors there
were 15 women, 7 men and
4 children (3 girls and 1
boy). In other words there
were 58 % women, 27 %
men and 15 % children.
Figure 15 shows the
percentage of men, women
and children who visited the
well.
Time aspects
It took approximately 2
minutes and 10 seconds to
fill a 20-liter container. On
one occasion it was needed
95 pumpings which means
that the output was about 2.1
dl each pumping. The
amount of pumpings could
reach 120, which signifies
that the pumping technique
is crucial for how long time
it takes to fill a container.
Most of the visitors pumped
during the coldest times of
the day, which is logical
since most of the visitors had
quite a distance to the well. There is no shadow near the pump.
0
2
4
6
8
10
05:30-08:30 08:30-11:30 13:00-16:00 16:00-18:30
Number of visitors per time period
0
20
40
60
80
100
120
Visitors Water-uptake
Visitors and water-uptake per quarter (%)
Tiebe
Tangzougou
Figure 15. Gender distribution, the Foot Pump
Figure 16. Time of visits, the Foot Pump
Figure 14. Visitors and water-uptake, the Foot Pump

19
Water quality
Table 1. Water quality indicators
for the Foot Pump
The values in Table 1 are below the health-based
guideline values set by WHO. The phosphate level
is above 0.6 mg/l. The water hardness is medium
hard, and the coliform test resulted in Class 2
which may be caused by animals strolling around
the pump. Another reason may be the animal
keeping west of the pump (World Health
Organization, 2012).
Further comments
Of the different quarters in Nakamtenga the well is most important to Tangzougou but almost
half of the visitors come from the neighbouring village Tiebe. When the pump is broken the
inhabitants of Tangzougou go to Nabitenga, located about two kilometres away from the Foot
Pump. The ratio of men/women equals the ratio of boys/girls, which indicates that the gender
roles are defined very early among the visitors. Furthermore the women collected more water
per person than the men.
The pump broke a few days after the date of observation (April 14). The pressure in the tubes
could not be built up. A month later it was still not repaired, but in late May a repair-man
came and troubleshot the pump. Last time it was repaired, in March 2014, it cost relatively
much money and most of the parts were exchanged. Joseph Ilboudo paid for the repair
(Karlsson, 2014 a). Mr. Ilboudo owns his own pump, and therefore he has not much incentive
to pay for it once more except the fact that he has an unspoken responsibility as a leading
figure in the area.
The fact that only one person paid the repair and not many people is unusual. The reason is
possibly the fact that no specific quarter is responsible for the pump. Inhabitants of
Tangzougou use it a lot though, but it is located relatively far away from their homes. The
unusual way of paying the repair may also be caused by the fact that the inhabitants have
alternative places for fetching water. Since the pump is the only one of its kind in
Nakamtenga it is relevant to investigate whether or not it breaks more often than other pump
types. If it does, it is probably the pump type and not the water quality that causes the
malfunctions.
The animal keeping and the use of pesticides and herbicides are thought to be the most
significant risk sources for the water, except the constant risk of not having a functional
pump. It is important to note that the new school will need water. It may be worth considering
if the school's owners and the visitors to the pump can cooperate regarding repairs and
possibly financing of a new pump. In this way the water supply can be secured for both the
inhabitants and the school. The School Pump is shared by the school and some of the quarters
pH 7.15
Conductivity 0.33 mS/cm
Hardness 168 mg/l
Nitrate <44.3 mg/l
Phosphate 0.82 mg/l
Chloride 40 mg/l
Arsenic Not detectable
Coliforms Class 2
Temperature 34.6C

20
which means that it is possible. If a new pump is constructed by the school it would be useful
to examine the groundwater level and the water flow into the well. This information is
relevant to the Foot Pump and the Center Pump.

21
The Ropandin Pump
Figure 17. The Ropandin Pump
Year of construction: 2005
Date of last repair: April 2014
Pump brand: India mark II deep well hand pump1
Quarter: Ropandin
Coordinates: Latitude 12.597260˚
Longitude -1.254490˚
Depth to bottom: 45 m
1 The pump has no label, but it is very likely an India Mark II.
Dates
Observation 21/04/2014
Quality test 27/04/2014
Coliform test 1 27/04/2014
Coliform test 2 01/05/2014

22
Land use and risk factors
Figure 18. Risk sources in the proximity of the Ropandin Pump. (Map Data: Google,
CNES/Astrium, 2014)
The well is surrounded by millet fields. Housing is also marked in Figure 18. The house
complexes located northeast of the well may affect the water through the surface runoff, but
the two other complexes are not likely to do so since they are located on a slightly lower
altitude.
Distance to the nearest possible contamination source: < 50 m (millet fields)

23
Well information
Figure 19. Close-up of the Ropandin Pump
Water supply: All year round
Altitude: The pump is placed on almost the same altitude as its surroundings, but the ground
is tilting down very slightly towards the southwest.
Construction: The ground in the proximity of the well is not tilting so that water flows away
from the well. The apron and the wall around the well are in good condition though. The wall
prevents animals from reaching the pump. No cracks are visible in the concrete. Furthermore,
the drainage channel is in good condition, which means that no water is gathering in pools
near the pump or around the apron. The risk of contamination is therefore Low (2/10).
The pump is recently repaired and it is functioning properly. Prior to the repair one had to
pump for about 30 minutes before the water started flowing. Many parts were probably
replaced during the repair since it cost 50 400 CFA (Ouédraogo, 2014). According to the
inhabitants of Ropandin the pump breaks about 3 times per year. Another problem is that the
pump is heavy to use, which makes pumping more difficult for the children. Consequently,
the children are not pumping correctly which leads to the pump being worn-down faster.
Soil type: Sandy silt.
24
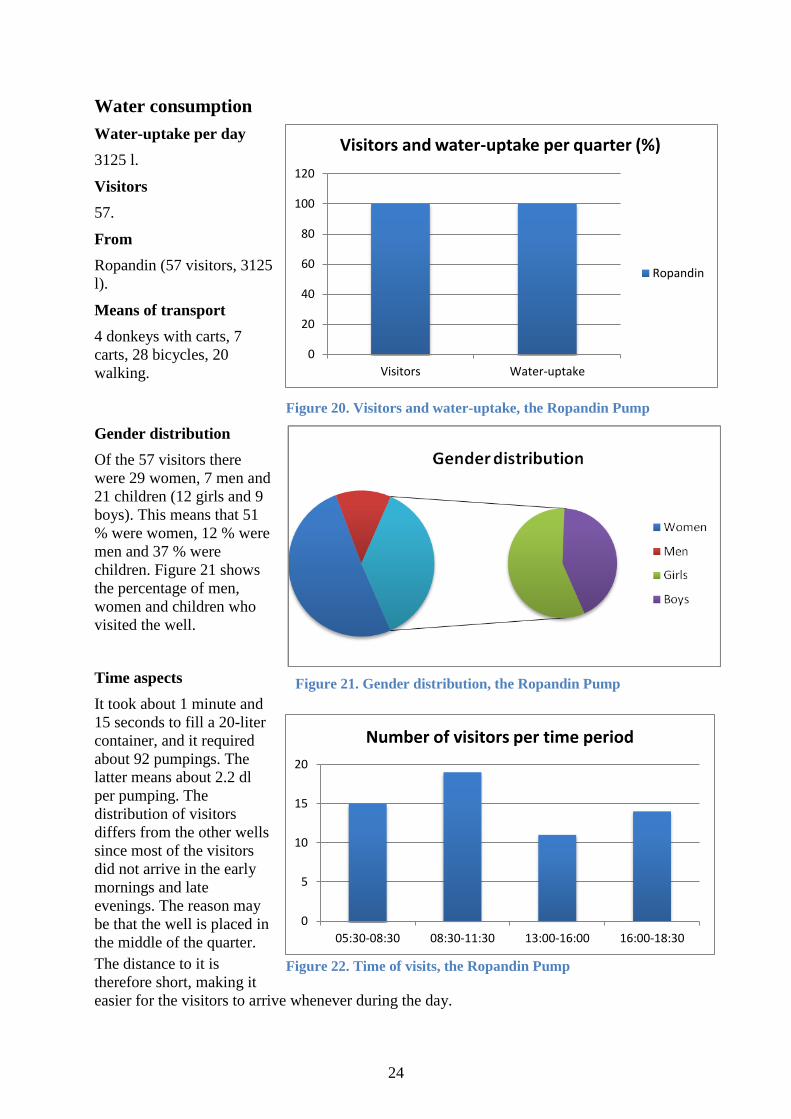
Water consumption
Water-uptake per day
3125 l.
Visitors
57.
From
Ropandin (57 visitors, 3125
l).
Means of transport
4 donkeys with carts, 7
carts, 28 bicycles, 20
walking.
Gender distribution
Of the 57 visitors there
were 29 women, 7 men and
21 children (12 girls and 9
boys). This means that 51
% were women, 12 % were
men and 37 % were
children. Figure 21 shows
the percentage of men,
women and children who
visited the well.
Time aspects
It took about 1 minute and
15 seconds to fill a 20-liter
container, and it required
about 92 pumpings. The
latter means about 2.2 dl
per pumping. The
distribution of visitors
differs from the other wells
since most of the visitors
did not arrive in the early
mornings and late
evenings. The reason may
be that the well is placed in
the middle of the quarter.
The distance to it is
therefore short, making it
easier for the visitors to arrive whenever during the day.
0
5
10
15
20
05:30-08:30 08:30-11:30 13:00-16:00 16:00-18:30
Number of visitors per time period
0
20
40
60
80
100
120
Visitors Water-uptake
Visitors and water-uptake per quarter (%)
Ropandin
Figure 20. Visitors and water-uptake, the Ropandin Pump
Figure 21. Gender distribution, the Ropandin Pump
Figure 22. Time of visits, the Ropandin Pump

25
Water quality
Table 2. Water quality indicators
for the Ropandin Pump
The water has the highest hardness value in all of
Nakamtenga. The nitrate level is also relatively
high, and it may also exceed the health-based
guideline value. The phosphate value is above 0.6
mg/l, which indicates that the water can be
contaminated. Furthermore, the coliform tests did
not show any presence of coliforms. See Table 2.
Further comments
The location of the well is preferable since the distance to it is short for the inhabitants of
Ropandin. Only Ropandin use it due to the fact that it is located far from the other quarters.
What is negative about the location is that many children come and use it. The percentage of
children visiting is the highest compared to the other wells. Many children cannot pump in the
best manner since they do not have the reach and strength required. Instead their pumping
motion is a couple of decimetres long which wears down the pump.
There are quite many positive aspects about the pump, for example the function, the location
and the organization. There is also water all year round and the water flow is relatively high.
The location makes it clear that the inhabitants of Ropandin are responsible for the repair.
Also, every inhabitant has an interest in having it functioning. The high nitrate and phosphate
levels indicate that the water might be affected by human activity.
Last time the pump broke, every pair paid 1 500 CFA. This means that 35 couples paid to be
able to collect a total of 50 400 CFA. 239 people live in Ropandin, so it is not unlikely that at
least 35 couples live in the quarter. Ropandin was one of few quarters which mentioned that
they want another well except a new pond. The reason for the latter could be that it is heavy to
pump the existing pump but also that it is the quarter with the most inhabitants. The large
number of inhabitants means queues by the well. The reason can also be that they see that a
new well can help them with their farming.
pH 7.12
Conductivity 0.63 mS/cm
Hardness 253.5 mg/l
Nitrate 44.3-88.6 mg/l
Phosphate 0.99 mg/l
Chloride < 30 mg/l
Arsenic Not detectable
Coliforms Class 1
Temperature 32.8C

26
The Soulgo Pump
Figure 23. The Soulgo Pump
Year of construction: 1987
Date of last repair: April 2014
Pump brand: ABI
Quarter: Yaorgẽ/Soulgo
Coordinates: Latitude 12.591420˚
Longitude -1.261590˚
Depth to bottom: 42 m
Water depth: Unknown
Pipe diameter: 2 cm Dates
Observation 02/05/2014
Quality test 24/04/2014
Coliform test 1 26/04/2014
Coliform test 2 01/05/2014

27
Land use and risk factors
Figure 24. Risk sources in the proximity of the Soulgo Pump. (Map Data: Google, CNES/Astrium,
2014)
There are both rice and millet fields in the proximity of the well. There is also a small field to
the west where tomatoes are cultivated. The surface runoff is directed northbound. Many
animals, including donkeys, cows and bulls pass the well on a daily basis.
Distance to the nearest possible contamination source: < 50 m (millet and rice fields)

28
Well information
Figure 25. Close-up of the Soulgo Pump
Water supply: All year round, but the visitors from Nakamtenga are only able to reach the
pump during the dry season.
Altitude: The pump is located on flat ground locally but in the closest 100 metres the ground
is sloping slightly. There are millet fields in a higher altitude and rice fields in a lower
altitude.
Construction: The ground and the apron are tilting away from the well in all directions. No
cracks are visible in the concrete and the pump is functioning properly. There are flaws in the
construction, mainly since water pools around the apron due to the fact that the drainage
channel is not connected to the pump in a correct manner. Therefore the water flows in other
directions as well. It had been repaired shortly before the time of observation (May 2, 2014).
In general it is repaired 2-3 times per year.
Animals can reach the pump and drink from the spill water since there are no walls
surrounding the well. The ABI pump requires lubrication to function and therefore oil
residues may contaminate the water, causing inappropriate taste and health effects. The risk of
contamination is classified as Medium (6/10).
Soil type: Sandy silt
29
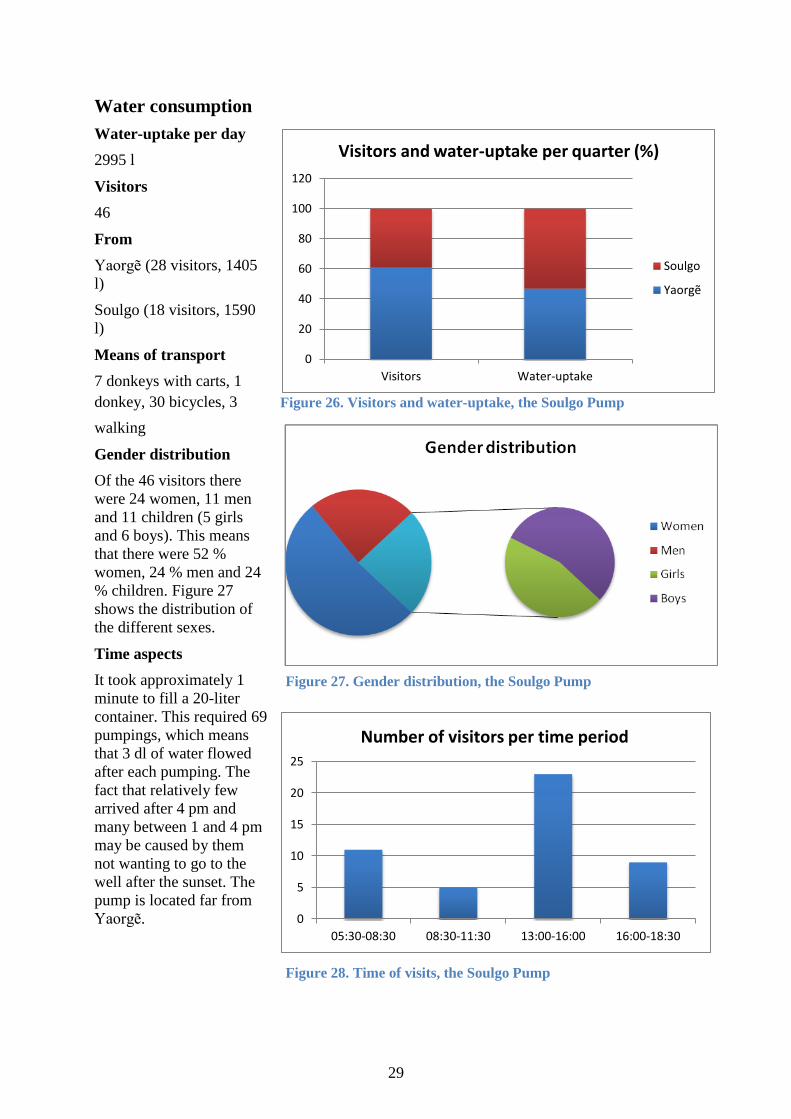
Water consumption
Water-uptake per day
2995 l
Visitors
46
From
Yaorgẽ (28 visitors, 1405
l)
Soulgo (18 visitors, 1590
l)
Means of transport
7 donkeys with carts, 1
donkey, 30 bicycles, 3
walking
Gender distribution
Of the 46 visitors there
were 24 women, 11 men
and 11 children (5 girls
and 6 boys). This means
that there were 52 %
women, 24 % men and 24
% children. Figure 27
shows the distribution of
the different sexes.
Time aspects
It took approximately 1
minute to fill a 20-liter
container. This required 69
pumpings, which means
that 3 dl of water flowed
after each pumping. The
fact that relatively few
arrived after 4 pm and
many between 1 and 4 pm
may be caused by them
not wanting to go to the
well after the sunset. The
pump is located far from
Yaorgẽ.
0
5
10
15
20
25
05:30-08:30 08:30-11:30 13:00-16:00 16:00-18:30
Number of visitors per time period
0
20
40
60
80
100
120
Visitors Water-uptake
Visitors and water-uptake per quarter (%)
Soulgo
Yaorgẽ
Figure 26. Visitors and water-uptake, the Soulgo Pump
Figure 28. Time of visits, the Soulgo Pump
Figure 27. Gender distribution, the Soulgo Pump

30
Water quality
Table 3. Water quality indicators
for the Soulgo Pump
The water quality tests do not show levels above
the guideline values except for phosphate (see
Table 3). The phosphate value shows that the
sample may have been contaminated. The well has
the second highest hardness in Nakamtenga. The
latter is possibly the reason why the visitors think
the water is not useful for laundry.
The fact that neither of the two coliform tests
showed presence of bacteria indicate that the
stomach ache which a local complained about is
probably caused by inappropriate handling of the
water or other chemicals not shown in the tests.
Hence, it is recommended that further tests are
done to see what is causing the effects on flavour
and health.
Further comments
The well is situated close to a river and a pump of the same brand was constructed about 120
m from it. This indicates that the water supply is sufficient and the interviewees say the same.
A problem though is that the water is stated to taste like oil and potash, and that it is not
suitable for laundry. The taste of oil is likely to be caused by the lubrication oil which is
required in the pump. The latter is supported by the observations and the interviews done
when the pump was repaired.
The quality tests show no signs of coliforms or chemicals other than phosphate. Hence, more
tests should be done to decide if there are high amounts of herbicides, pesticides or other
chemicals. This is particularly important since a visitor complained about stomach ache. The
position of the well makes it theoretically possible for contaminants from Yaorgẽ and
Ropandin to reach it.
An important observation concerning the handling is that all visitors used the same funnel to
fill their containers. When the funnel was not used it was occasionally placed in the spill
water on the ground where goats, donkeys, cows, dogs and sheep drank. Another important
notification is that a child and its mother drank directly from the funnel after it had been
placed in the spill water.
pH 6.85
Conductivity 0.38 mS/cm
Hardness 186 mg/l
Nitrate <44.3 mg/l
Phosphate 0.89 mg/l
Chloride < 30 mg/l
Arsenic Not detectable
Coliforms Class 1
Temperature 32.9C

31
The School Pump
Figure 29. The School Pump
Year of construction: 1991
Date of last repair: October 2013
Pump brand: India mark II deep well hand pump
Quarter: Yilim Toogin
Coordinates: Latitude 12.604500˚
Longitude -1.270951˚
Depth to bottom: 57 m
Dates
Observation 18/04/2014
Quality test 26/04/2014
Coliform test 1 26/04/2014
Coliform test 2 01/05/2014

32
Land use and risk factors
Figure 30. Risk sources in the proximity of the School Pump. (Map Data: Google, CNES/Astrium,
2014)
The pump is located beside a school, of which the latrines are about 50 m from the well. The
buildings which are not included in the blue ring were supposed to be homes for the teachers
but they are not used. The distance to the road is less than 100 m, and the surface runoff from
the road, the latrines and the millet fields are directed towards the well. Furthermore, Yilim
Toogin is situated northwest of the well. East of the well the ground is not used for cultivation
or such since there is no soil layer, but plain rock.
Distance to the nearest possible contamination source: < 50 m (millet field)

33
Well information
Figure 31. Close-up of the School Pump
Water supply: All year round, but the well has temporarily run out of water when the water-
uptake was substantial.
Altitude: The pump is located in a lower altitude than the rest in a radius of 100 m, which
means that there is a slight risk that water gathers in pools close to it.
Construction: The well apron is large, thick and there are no cracks in it. The pump is
surrounded by a wall which prevents animals from reaching the pump. There is a drainage
channel which leads to a construction that allows animals to drink. The latter is recommended
not to have on wells near schools (Westerblom, 2014). This means that the pump was either
built before this recommendation or that the constructors were unaware of it. The drainage
channel is in need of cleaning.
Neither the ground nor the concrete is tilting so that water flows away from the pump in all
directions. Since the pump is located slightly below the area around it there is a risk that water
pools nearby. The whole pump was changed in 2013, and now it is an India mark II deep well
hand pump, a pump type that is used in other places in Nakamtenga as well. It is not clear
why this pump type was chosen, but the reason could have been the price and the amount of
spare parts available nearby.
According to the interviews the pump breaks about twice every year, and if the pump has not
been used for a while it takes a minute for the water to pour after a person has started
pumping. The reason for the latter may be that there is a hole in a pipe. The hole, if existing,
would decrease the pump's efficiency. The risk of contamination is Low (3/10).
Soil type: Gravelly silt in the closest 10 metres, but farther away from the well there is sandy
silt.
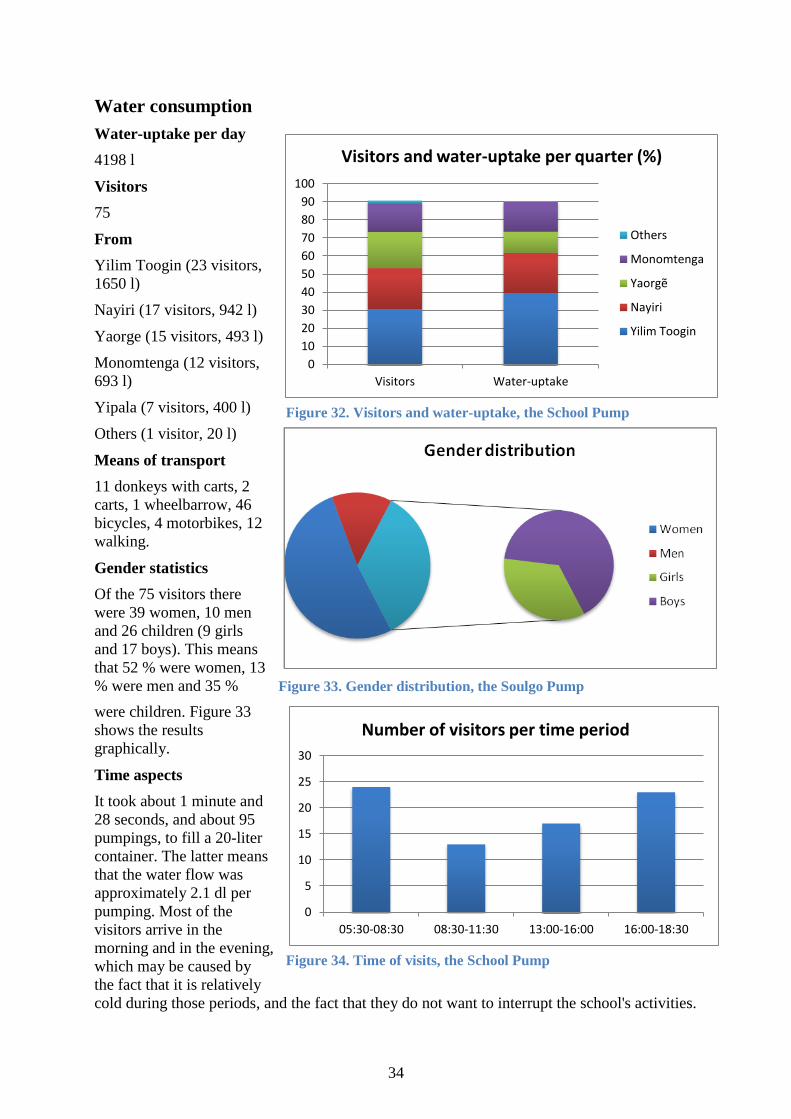
34
Water consumption
Water-uptake per day
4198 l
Visitors
75
From
Yilim Toogin (23 visitors,
1650 l)
Nayiri (17 visitors, 942 l)
Yaorge (15 visitors, 493 l)
Monomtenga (12 visitors,
693 l)
Yipala (7 visitors, 400 l)
Others (1 visitor, 20 l)
Means of transport
11 donkeys with carts, 2
carts, 1 wheelbarrow, 46
bicycles, 4 motorbikes, 12
walking.
Gender statistics
Of the 75 visitors there
were 39 women, 10 men
and 26 children (9 girls
and 17 boys). This means
that 52 % were women, 13
% were men and 35 %
were children. Figure 33
shows the results
graphically.
Time aspects
It took about 1 minute and
28 seconds, and about 95
pumpings, to fill a 20-liter
container. The latter means
that the water flow was
approximately 2.1 dl per
pumping. Most of the
visitors arrive in the
morning and in the evening,
which may be caused by
the fact that it is relatively
cold during those periods, and the fact that they do not want to interrupt the school's activities.
0
5
10
15
20
25
30
05:30-08:30 08:30-11:30 13:00-16:00 16:00-18:30
Number of visitors per time period
0
10
20
30
40
50
60
70
80
90
100
Visitors Water-uptake
Visitors and water-uptake per quarter (%)
Others
Monomtenga
Yaorgẽ
Nayiri
Yilim Toogin
Figure 32. Visitors and water-uptake, the School Pump
Figure 33. Gender distribution, the Soulgo Pump
Figure 34. Time of visits, the School Pump

35
Water quality
Table 4. Water quality indicators
for the School Pump
The water is medium hard and the phosphate level
is above 0.6 mg/l. Despite the proximity to the
latrines the nitrate level is below the health-based
guideline value. The coliform test did not show
presence of bacteria. Hence, the water quality is
considered very good. The results of the water
quality analysis are shown in Table 4.
Further comments
The most significant contamination risks are the latrines. The coliform tests indicated that no
contamination from the latrines occurs, and thus it indicates that the latrines are well
constructed and that the residence time in the soil is sufficient. Since the ground tilts in the
direction of the well there is a risk that inappropriate substances gather by the well, especially
during the rainy season. The road functions as a drainage divider, which means that Nayiri is
not likely to affect the water in the well. On the other hand, Yilim Toogin is placed on the
same side of the road as the well and on a higher altitude, which could lead to contaminants
from Yilim Toogin reaching the well via the surface runoff.
Since the school paid for the change of pump and since it is placed beside the school, the
school has precedence to the pump. This means that other visitors do not have the same access
to the pump as they want. The observations were made during a day when the school was
closed, which means that the amount of water collected and when it is collected might be
different otherwise. A possible difference could be that the collection increases during the day
when the school is open. At the same time it is probable that the other visitors would come
during the mornings and evenings instead of the mid-day. When the observations were made
people arrived from almost all the quarters in Nakamtenga. Hence, the pump is very important
since it provides water to many people.
pH 7.21
Conductivity 0.29 mS/cm
Hardness 106.5 mg/l
Nitrate < 44.3 mg/l
Phosphate 0.78 mg/l
Chloride < 30 mg/l
Arsenic Not detectable
Coliforms Class 1
Temperature 36.2C

36
The Center Pump
Figure 35. The Center Pump
Year of construction: 1988
Date of last repair: 2013
Pump manufacturer: Unknown. Produced in Nigeria.
Quarter: Yipala
Coordinates: Latitude 12.610120˚
Longitude -1.258103˚
Depth to bottom: 60-70 m
Dates
Observation Not possible
Quality test 12/04/2014
Coliform test 1 12/04/2014
Coliform test 2 21/05/2014

37
Land use and risk sources
Figure 36. Risk sources in the proximity of the Yipala Well. (Map Data: Google, CNES/Astrium,
2014)
The well is located approximately 20 metres from a stable in which animals are kept.
Buildings with latrines are situated not far from the well. The animal keeping is so close that
it is considered the most significant risk source. There are also millet fields around the well,
which is located in a small hollow to where the water flows, gather in pools and infiltrates.
Distance to the closest possible contamination source: < 50 metres (animal keeping)

38
Well information
Figure 37. Close-up of the Center Pump
Water supply: All year round.
Altitude: The well is placed is a small hollow to which the water flows.
Construction: In 2013 the well dried out and the reason was that a new tap had been opened;
allowing many more people to use the pump. Since the pump is electric the inhabitants
preferred using the Center Pump instead of their own pumps. Eventually the well dried out
and the pump broke. After that, the tap was closed and the well is now used for the closest
buildings and for the activities run by Yennenga Progress. The top of the borehole is placed
inside a house which makes it relatively well protected from animals and weather. Thus, the
durability is increased. There is a risk of contamination since runoff water gathers in the
hollow just outside the pump house. The contamination risk is Low (3/10).
Soil type: Sandy silt.

39
Water consumption
Since the water is transported in pipes and a water meter is non-existing it has been
impossible to calculate the exact water consumption. By using the number of consumers, both
animals and humans, it is possible to get a somewhat correct picture of the consumption. The
pump is providing water to:
A pre-school and a primary school, including the cooking
A restaurant school
A sewing school with laundry room.
A workshop
A four-bed guesthouse
A conference building
Three houses
Animals
Teachers who collect water, but not during school time
A swimming pool
Irrigation
Given that about 280 people consume water from the well besides the fact that much water is
used to irrigate etc., the consumption would clearly be the largest among all the water sources
during the dry season. The fact that the well dried out due to large water consumption shows
that the flow into the well is limited. It also shows that if the pumps are functioning and the
water is used in an appropriate way there is a lot of water available.
Water quality
Table 5. Water quality indicators
for the Center Pump
The water is soft and all the values except the one
for phosphate are below the guideline values. The
coliform test showed presence of a few coliform
colonies and no E. coli colonies. Table 5 shows the
results of the water quality analysis. Since the
water can be consumed without any problem by
people not living in Burkina Faso normally, the
quality is considered good. Furthermore, the people
living in the area think it tastes good.
Further comments
The pump is functioning well and the water quality with respect to bacteria and most of the
tested chemicals is good. An indication that the quality is good is the fact that people from
outside Burkina Faso can drink the water without getting ill. The good quality is a sign that
the residence time in the ground is enough at least during the dry season. The well shows that
pH 6.9
Conductivity 0.25 mS/cm
Hardness 81 mg/l
Nitrate < 44.3 mg/l
Phosphate 1.13 mg/l
Chloride < 30 mg/l
Arsenic Not detectable
Coliforms Class 1
Temperature 38.5C

40
it is possible to collect much water if the equipment is good and it is taken care of. This fact is
important to the future water supply in Nakamtenga. An interesting observation would be to
investigate how the large consumption affects the wells located nearby. Until now there are no
signs showing the latter, but further studies would be interesting.
The water quality tests which show presence of bacteria also show possible weaknesses and
risks. The most significant risk is considered to be the pump breaking or that the well dries
out. Contamination is also a risk but despite water pooling outside the pump house the water
seems to be of good quality. The high phosphate level could be a cause of the animal keeping
just beside the pump house. The amount of nitrate is small though, which is an indicator that
the animal faeces are not affecting the water. Maybe the soil type and the infiltration rate are
favorable.
The water quality may also be affected by the storage in the water tower. The storage allows
the sun to heat up the water and hence either killing the bacteria or causing them to grow even
more, depending on the temperature. It is important not to let the water store to long in the
tower, and since it is transported in pipes it is key that the pipes are whole and of good
quality.

41
The Yipala Well
Figure 38. The Yipala Well
Year of construction: 1976
Date of last repair: April 2014
Quarter: East Yipala
Coordinates: Latitude 12.608875˚
Longitude -1.260633˚
Depth to bottom: 17.26 m
Water depth: 3.80 m
Diameter: 1.25 m
Dates
Observation 25/04/2014
Quality test 26/04/2014
Coliform test 1 26/04/2014
Coliform test 2 21/05/2014

42
Land use and risk factors
Figure 39. Risk sources in the proximity of the Yipala Well. (Map Data: Google, CNES/Astrium,
2014)
There are many risk sources close to the well (see Figure 39). It is situated just beside a school
and several houses. Furthermore, two latrines are built within a radius of about 50 metres
from the well. Millet fields cover most of the nearby area.
Distance to the nearest possible contamination source: < 50 m (millet fields and latrines)

43
Well information
Figure 40. Close-up of the Yipala Well
Water supply: June to April. The well can run out of water during May. Only the first 3 or 4
people that arrive in the morning can collect water during this period.
Altitude: The well is in the same altitude as its surroundings.
Construction: The wall and apron was repaired at the time of the field study. The new
construction is robust and the apron is now tilting so that water flows away from the well.
There is also a drainage channel that ends in the nearest pond. The wall was raised which
prevents children and animals from falling down the well. Moreover, two poles were placed
on top of the wall, making it possible to construct a roof and a device that allows all of the
visitors to use the same bucket. A problem if such is installed can be that only one person at a
time can use the well, but on the other hand they decrease the risk of contaminating the water
and give shadow to the visitors.
The most significant risk in the construction is the lack of obstacles, for example a fence that
will keep the animals away. The risk of contamination is Low (3/10). The few criteria fulfilled
are mainly related to the proximity to several risks of contamination rather than the
construction.
Soil type: Sand within a 10 meter radius, but further away it is sandy silt.
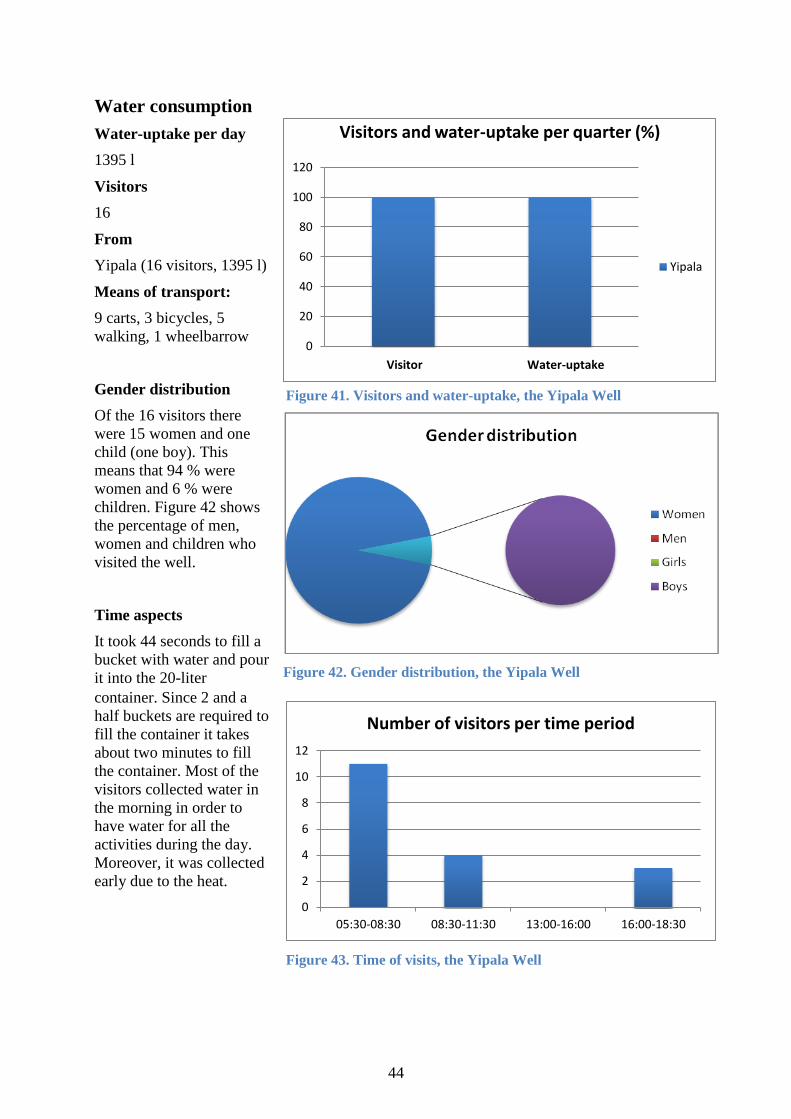
44
Water consumption
Water-uptake per day
1395 l
Visitors
16
From
Yipala (16 visitors, 1395 l)
Means of transport:
9 carts, 3 bicycles, 5
walking, 1 wheelbarrow
Gender distribution
Of the 16 visitors there
were 15 women and one
child (one boy). This
means that 94 % were
women and 6 % were
children. Figure 42 shows
the percentage of men,
women and children who
visited the well.
Time aspects
It took 44 seconds to fill a
bucket with water and pour
it into the 20-liter
container. Since 2 and a
half buckets are required to
fill the container it takes
about two minutes to fill
the container. Most of the
visitors collected water in
the morning in order to
have water for all the
activities during the day.
Moreover, it was collected
early due to the heat.
0
2
4
6
8
10
12
05:30-08:30 08:30-11:30 13:00-16:00 16:00-18:30
Number of visitors per time period
0
20
40
60
80
100
120
Visitor Water-uptake
Visitors and water-uptake per quarter (%)
Yipala
Figure 43. Time of visits, the Yipala Well
Figure 42. Gender distribution, the Yipala Well
Figure 41. Visitors and water-uptake, the Yipala Well

45
Water quality
Table 6. Water quality indicators
for the Yipala Well
The water is medium hard, and the nitrate level is
one of the highest in Nakamtenga. The latter is
possibly caused by leaching from the latrines
situated nearby. Moreover, the coliform test shows
a clear presence of E. coli. Possible reasons are
dirty materials used to collect the water, animal
faeces or human faeces. The results of the water
quality analysis are presented in Table 6. The water
should be consumed with caution and should be
avoided by infants. The locals may have gotten
used to the water quality and therefore not getting
ill, but purification should still be considered. To
get rid of the bacteria further examination is
suggested, since the source of contamination is not
certain.
Further comments
All of the visitors originated from East Yipala and the cause is that the well is in East Yipala
and there are other wells closer to the rest of the quarters. Noteworthy facts are the high
percentage of women coming to the well, and that some avoid going there since they are
aware of the inappropriate handling of the material used to collect water. The water sample
had the largest amount of bacteria, a fact that is not surprising since the well is placed close to
several risk sources including latrines. A positive observation is that the visitors get their
water the same day as it is going to be consumed instead of the night before. This prevents the
bacteria from growing even more. What is the most significant risk source is not certain, but
for actions it is recommended to start by using clean material, which will imply whether or
not the latrines are contaminating the water.
Equation 1 (Darcy's law) is used to calculate the theoretical time for water to flow between
the Yipala well and the latrine positioned closest to it, see Figure 39. The horizontal distance
between the well and the latrine is 34 m (Google, CNES/Astrium, 2014). The depth to the
bottom of the well from the ground level is 17.3 metres. Thus, dL = 34 m and dH = 17.3 m.
Assuming that the soil is a silt gives n = 0.05 and K = 4.6 10-6
m/s (Olofsson, 2014 a).
Equation 1 gives:
vd 2.34 10-6
m/s.
Consequently, inserting vd into Equation 2 gives:
vp 4.68 10-5
m/s.
The distance "s" is calculated using Equation 3.
s 38.15 m.
pH 7.38
Conductivity 0.32 mS/cm
Hardness 117 mg/l
Nitrate 44.3-88.6 mg/l
Phosphate 0.50 mg/l
Chloride < 30 mg/l
Arsenic Not detectable
Coliforms Class 3
Temperature 34.7C

46
Ultimately, the time it takes theoretically for a contaminant to flow with the water between
the latrine and the well is calculated with Equation 4. After converting the answer from
seconds to days, the result is:
t 9.4 days.
For the water to become free from bacteria the duration of stay for the water in the ground
should be 75 days or more. After 14 days the amount of bacteria has started to decrease
(Olofsson, 2014 b). Given that t = 75 days the horizontal distance between the latrine and the
well should be approximately 270 m. For t = 14 days the distance equals 50 m. These
calculations are based on the worst case scenario since it is assumed that the soil is saturated,
giving a shorter residence time. According to the WHO a minimum distance of 30 metres is
recommended between a latrine a water source if information on the geological and
hydrological conditions in the area considered is absent (World Health Organization, n.d.).
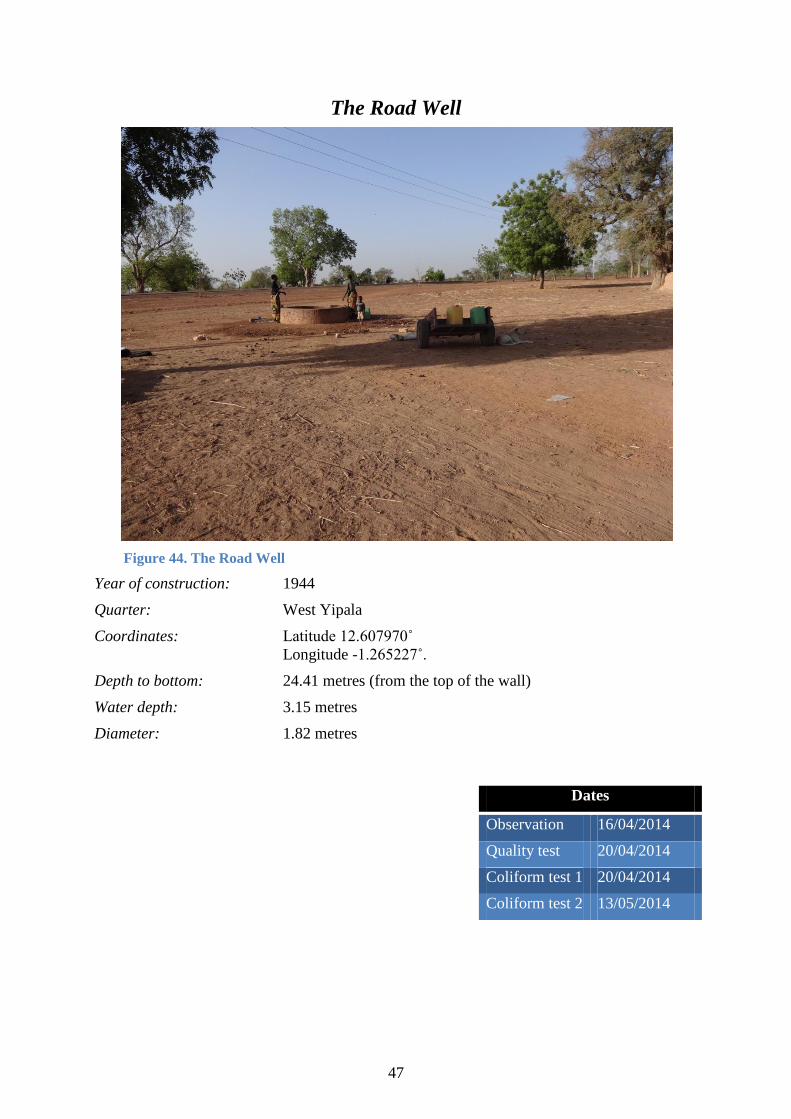
47
The Road Well
Figure 44. The Road Well
Year of construction: 1944
Quarter: West Yipala
Coordinates: Latitude 12.607970˚
Longitude -1.265227˚.
Depth to bottom: 24.41 metres (from the top of the wall)
Water depth: 3.15 metres
Diameter: 1.82 metres
Dates
Observation 16/04/2014
Quality test 20/04/2014
Coliform test 1 20/04/2014
Coliform test 2 13/05/2014
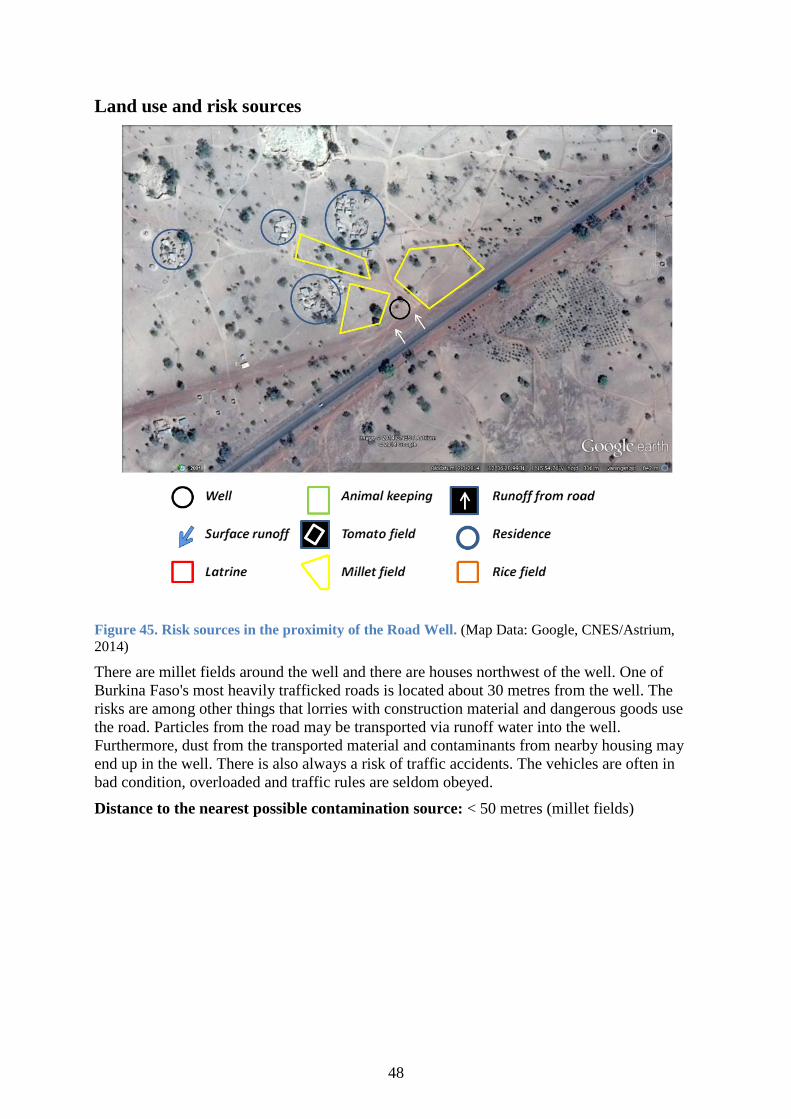
48
Land use and risk sources
Figure 45. Risk sources in the proximity of the Road Well. (Map Data: Google, CNES/Astrium,
2014)
There are millet fields around the well and there are houses northwest of the well. One of
Burkina Faso's most heavily trafficked roads is located about 30 metres from the well. The
risks are among other things that lorries with construction material and dangerous goods use
the road. Particles from the road may be transported via runoff water into the well.
Furthermore, dust from the transported material and contaminants from nearby housing may
end up in the well. There is also always a risk of traffic accidents. The vehicles are often in
bad condition, overloaded and traffic rules are seldom obeyed.
Distance to the nearest possible contamination source: < 50 metres (millet fields)

49
Well information
Figure 46. Close-up of the Road Well
Water supply: All year round.
Altitude: The well is located on flat ground.
Construction: The ground is not tilting away from the well just beside it. It is completely flat,
therefore possibly allowing surface water to flow to the well. Every day the spill water gathers
in small pools around the well. Besides the fact that the water in the well may become
contaminated, the materials used for collecting the water become dirty when placed in the
pools. There is no drainage channel and no fence or wall to keep the animals away. Animals
drink the spill water and their faeces are everywhere.
The parapet is as high as an adult's knees, which leads to a risk that children and animals fall
into the well. During the field study a sheep fell into the well, but luckily it was lifted up
alive. The low height of the parapet also leads to an inappropriate lifting technique when
collecting the water. The ropes are often unwillingly worn down against the edge of the
parapet, which also causes the edge to be worn down. The result is that rope and well material
end up in the water. According to the interviews the well has not been rinsed, cleaned or
repaired during the well's whole existence, i.e. in 70 years. Since the flow into the well is
acceptable and the parapet is intact it is likely that maintenance has yet occurred. The risk of
contamination is classified as High (7/10).
Soil type: Sandy silt.

50
Water consumption
Water-uptake per day
2725 l
Visitors
39
From
Yipala (21 visitors, 1880 l)
Nayiri (13 visitors, 565 l)
People passing by (3
visitors, 40 l)
Tangzougou (1 visitor, 20 l)
Yilim Toogin (1 visitor,
220 l)
Means of transport
8 donkeys with carts, 8
carts, 6 bicycles, 1
motorbike, 1 wheelbarrow,
11 walking, 4 unknown
Gender statistics
Of the 39 visitors there
were 31 women, 3 men
and 5 children (3 girls and
2 boys). This means that
there were 79 % women, 8
% men and 13 % children.
Figure 48 shows the
percentage of men, women
and children who visited
the well.
Time aspects
It took about 1.5 minutes to
fill a rubber bag and empty
it into a container. About 2
and a half rubber bags was
needed to fill a 20-liter
container. This means that
the bag can hold 8 l and that
it took about 3.75 minutes
to fill a 20-liter container.
0
5
10
15
20
25
30
05:30-08:30 08:30-11:30 13:00-16:00 16:00-18:30
Number of visitors per time period
0
20
40
60
80
100
120
Visitors Water-uptake
Visitors and water-uptake per quarter (%)
Yilim Toogin
Tangzougou
People passing by
Nayiri
Yipala
Figure 47. Visitors and water-uptake, the Road Well
Figure 48. Gender distribution, the Road Well
Figure 49. Time of visits, the Road Well

51
Water quality
Table 7. Water quality indicators
for the Road Well
The water is soft and the amount of chemicals was
below the guideline values except phosphate. The
water is Class 3 though, which means that
consumption should be made with caution. A
primary measure would be to investigate the
handling of the materials used to collect water. In
case better handling does not improve the water
quality other measures ought to be taken.
Purification should be considered. Table 7 shows
the results of the water quality analysis.
Further comments
The Road Well is one of the most reliable water sources in Nakamtenga. It has provided the
village with water all year round for 70 years. Even though the supply is good, the quality
ought to be improved. Moreover, it takes relatively long time to fill the 20-liter containers.
The fact that a tap owned by the state is located just beside the well is important, since it
shows that most of the visitors still go to the Road Well instead. The well is important for
especially two quarters but it also provides water to people from other quarters thanks to its
central position and sufficient water supply. Hence, it would be a good investment to make
sure that the quality is good.
pH 7.34
Conductivity 0.21 mS/cm
Hardness 48 mg/l
Nitrate < 44.3 mg/l
Phosphate 1.31 mg/l
Chloride < 30 mg/l
Arsenic Not detectable
Coliforms Class 3
Temperature 34.7C

52
The Yaorgẽ Pump
Figure 50. The Yaorgẽ Pump
Year of construction: 1987
Date of last repair: Unknown
Pump brand: ABI
Quarter: Yaorgẽ
Coordinates: Latitude 12.590978˚
Longitude -1.262622˚
Dates
Observation 08/04/2014
Quality test Not possible
Coliform test 1 Not possible
Coliform test 2 Not possible

53
Land use and risk factors
Figure 51. Risk sources in the proximity of the Yaorgẽ Pump. (Map Data: Google,
CNES/Astrium, 2014)
The most considerable risk is leaching of chemicals such as pesticides and herbicides from the
tomato field northeast of the pump. Leaching from the rice and millet fields may also occur.
There is a pond a few metres northwest of the pump, during the rainy season. It is possible
that the water from the tomato field ends up in the pond and infiltrates and reaches the well,
causing contamination.
Distance to the closest possible contamination source: < 50 m (tomato field)

54
Well information
Figure 52. Close-up of the Yaorgẽ Pump
Water supply: All year round
Altitude: It is positioned in the same altitude as the rest of the ground to the west, but to the
east there is an elevation of about 1 m within 30 m from the well. Further away it is flat.
Construction: The construction is good since spill water and surface runoff flows away from
the well. The problem is that the pipes in the borehole are broken. Furthermore, spare parts
have been taken from this pump to repair the Soulgo Pump, since the Soulgo Pump was not as
broken as the Yaorgẽ Pump. The pump handle and pipes from the borehole have been
removed from this pump. Hence, it would require relatively much money to repair the pump.
As long as the visitors can go to the Soulgo Pump instead without having to queue for a
considerable amount of time, this pump will probably not be repaired. If the pump is fixed the
risk of contamination is Medium (4/10). No cracks are visible and fence and drainage channel
are non-existent.
Soil type: Sandy silt
Further comments
In case the water supply is sufficient for use on the rice fields etc. during the dry season, it can
be worth repairing it.

55
The Park Pump
Figure 53. The Park Pump
Year of construction: 1981
Date of last repair: Unknown
Pump brand: India mark II deep well hand pump
Quarter: Yipala
Coordinates: Latitude 12.602233˚
Longitude -1.273731˚
Dates
Observation 08/04/2014
Quality test Not possible
Coliform test 1 Not possible
Coliform test 2 Not possible

56
Land use and risk factors
Figure 54. Risk sources in the proximity of the Park Pump. (Map Data: Google, CNES/Astrium,
2014)
The well is positioned close to an animal park, and the most significant contamination risk is
considered to be the road which is 10-15 m from the well. The surface runoff does not pool by
the pump since it either ends up in the pond northeast of the pump, or in the ditch between the
road and the pump.
Distance to the nearest possible contamination source: < 50 m (the road)

57
Well information
Figure 55. Close-up of the Park Pump
Altitude: The area is flat.
Construction: The pump is not functioning and has not been in a relatively long time. It risks
breaking even more due to the erosion of the soil in the ditch between the well and the road
(see Figure 53). The risk of contamination is considered as Low (1/10), but the effects of the
erosion make the pump special. Making the construction more stable is considered difficult
and expensive since the erosion is significant.
Soil type: Sandy silt
Further comments
The Park Pump was the first to be built in Nakamtenga. It is broken and will probably not be
repaired. Since the erosion of the soil has made the construction less stable, nobody wants to
invest in a repair. Another reason why it probably will not be repaired is the fact that it is
positioned far from the nearest quarter. Those who live closest to the pump are currently using
the School Pump instead.

58
Water quality tests
To get a good overview of the results, all have been summarized in Table 8.
Table 8. Results from water quality analyses
pH Conductivity
(mS/cm)
Hardness
(mg
CaCO3/l)
Nitrate
(mg/l)
Phosphate
(mg/l)
Chloride
(mg/l)
Arsenic
(mg/l)
E. coli
(Class
1-3)
Construction
(1-10)
The
Foot
Pump
7.15
0.33
168
0-44.3
0.82
40
n.d.
2
6
The
Ropandin
Pump
7.12
0.63
253.5
44.3-
88.6
0.99
< 30
n.d.
1
2
The
Soulgo
Pump
6.85
0.38
186
0-44.3
0.89
< 30
n.d.
1
6
The
School
Pump
7.21
0.29
106.5
0-44.3
0.78
< 30
n.d.
1
3
The
Center
Pump
6.9
0.25
81
0-44.3
1.13
< 30
n.d.
1
3
The
Yipala
Well
7.38
0.32
117
44.3-
88.6
0.50
< 30
n.d.
3
3
The
Road
Well
7.34
0.21
48
0-44.3
1.31
< 30
n.d.
3
7
The
Yaorgẽ
Pump
-
-
-
-
-
-
-
-
4
The
Park
Pump
-
-
-
-
-
-
-
-
1
By using Table 8 and the guideline values presented in Appendix 1 an interpretation of the
results can be made. It is illustrated in Table 9. Cells with green colour and happy faces show
that the values are below the guideline values and that the water is not likely to be
contaminated. The yellow cells with neutral faces mean that the values may be above the
guideline values or that the water may be contaminated, whereas the red cells with sad faces
symbolize values above the guideline values or that the water is likely to be contaminated.
Table 9. Interpretation of the water quality analyses

59
1 2 3 4 5 6 7 8 9
The Foot
Pump
The Ropandin
Pump
The Soulgo
Pump
The School
Pump
The Center
Pump
The Yipala
Well
The Road
Well
The Yaorgẽ
Pump
The Park
Pump
The water taps run by the state
In Nakamtenga there are two water taps run by the state. They are marked with arrows in
Figure 56, and shown in Figures 71 - 73 in Appendix 5. The results from the water quality test
are available in Table 10. By the pumps there are staff to whom the visitors pay for the water.
It costs 10 CFA to fill a 20-liter container and 15 CFA to fill a 25-liter container. The stations
opened in late May 2014.
1. pH 2. Conductivity (mS/cm) 3. Hardness (mg CaCO3/l)
4. Nitrate (mg/l) 5. Phosphate (mg/l) 6. Chloride (mg/l)
7. Arsenic (mg/l) 8. E-coli (class 1-3) 9. Construction (1-10)
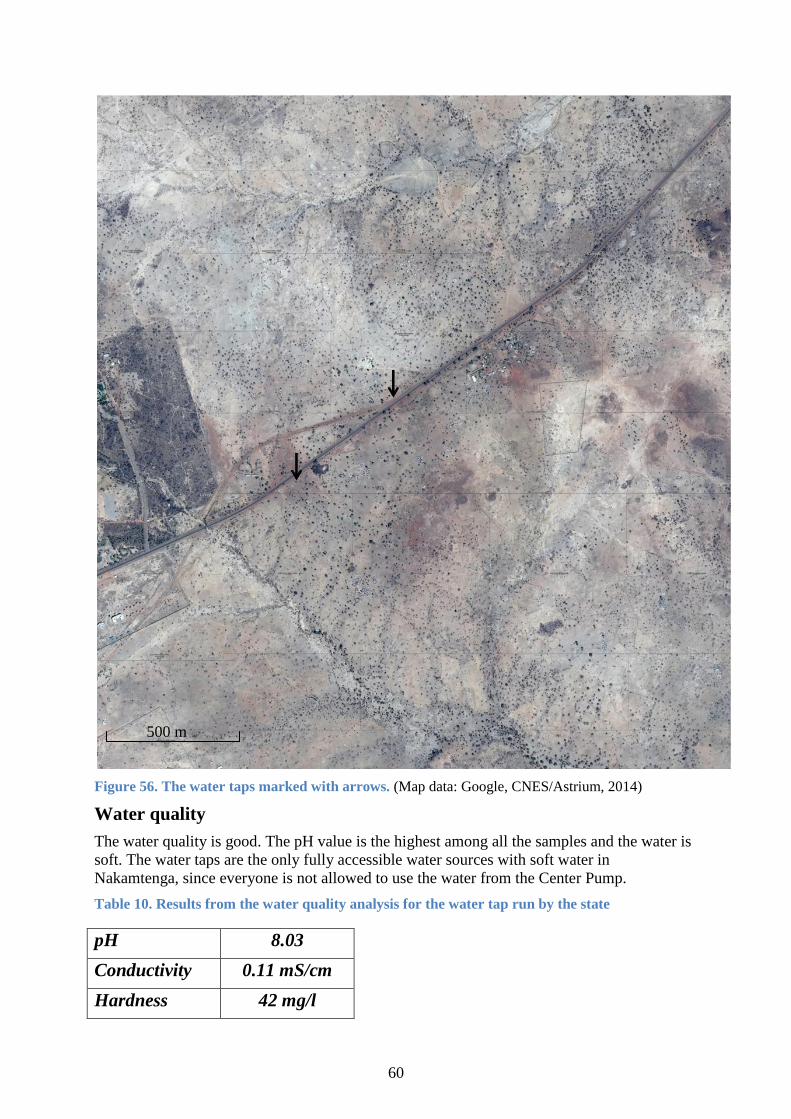
60
Figure 56. The water taps marked with arrows. (Map data: Google, CNES/Astrium, 2014)
Water quality
The water quality is good. The pH value is the highest among all the samples and the water is
soft. The water taps are the only fully accessible water sources with soft water in
Nakamtenga, since everyone is not allowed to use the water from the Center Pump.
Table 10. Results from the water quality analysis for the water tap run by the state
pH 8.03
Conductivity 0.11 mS/cm
Hardness 42 mg/l
500 m

61
From source to mouth
Safe drinking water is not only about the water quality in the well. The way the water is
collected and handled is also of great relevance. Before the water is consumed, it has been
exposed to several risks of contamination. It is therefore important to study not only the
quality of water in the well, but also how it is handled. This process is named "From source to
mouth". The handling is divided into four different steps; by the well, the transportation, the
storage at home and finally, the consumption.
Step one: by the well
The water is to a great extent collected in the mornings and/or in the evenings. The collectors
bring plastic containers (usually 20 l) in which the water is transported. For the pumps, there
are two different techniques to fill the containers without causing spill. Either the tap is placed
inside the container or a funnel is used (see Figures 57 and 58, respectively).
Figure 57. A funnel at the Soulgo Pump
Since there are no fences around the pumps there is a risk of contamination from animals.
This includes both direct contact with the tap and contamination of the containers. The
contamination of the tap is extra serious when no funnel is used. The use of a funnel is good
since it diminishes spill water. The handling of the funnel is often inappropriate, though.
There is only one funnel by each pump and it is often dirty. The visitors drink directly from it
and place it in bad locations, for example in pools of spill water where animals drink (see
Figure 59). The events shown in Figure 59 are examples of improper handling of the water.
Another risk factor is that the containers are often placed in the dirt next to the wells.
Nitrate < 44.3 mg/l
Phosphate 0.23 mg/l
Chloride < 30 mg/l
Arsenic Not detectable
Coliforms Class 1
Temperature 32.5C
Figure 58. A container is filled in Ropandin

62
Figure 59. Improper handling at the Soulgo Pump
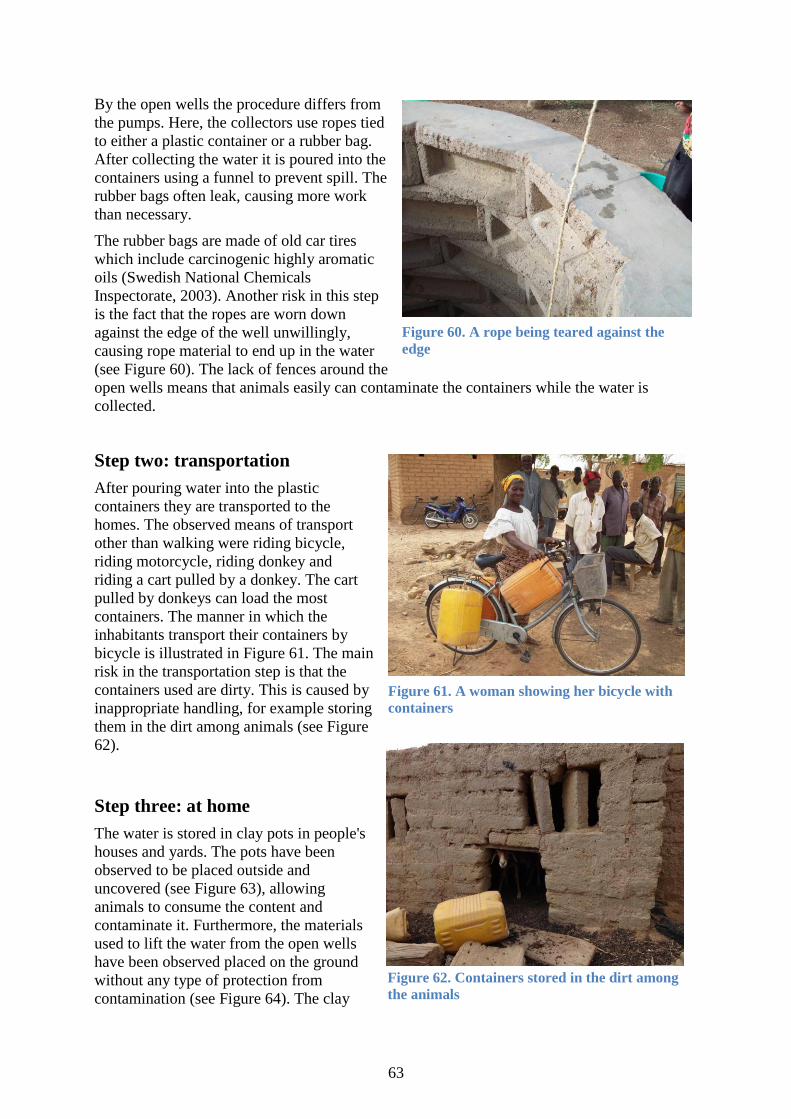
63
By the open wells the procedure differs from
the pumps. Here, the collectors use ropes tied
to either a plastic container or a rubber bag.
After collecting the water it is poured into the
containers using a funnel to prevent spill. The
rubber bags often leak, causing more work
than necessary.
The rubber bags are made of old car tires
which include carcinogenic highly aromatic
oils (Swedish National Chemicals
Inspectorate, 2003). Another risk in this step
is the fact that the ropes are worn down
against the edge of the well unwillingly,
causing rope material to end up in the water
(see Figure 60). The lack of fences around the
open wells means that animals easily can contaminate the containers while the water is
collected.
Step two: transportation
After pouring water into the plastic
containers they are transported to the
homes. The observed means of transport
other than walking were riding bicycle,
riding motorcycle, riding donkey and
riding a cart pulled by a donkey. The cart
pulled by donkeys can load the most
containers. The manner in which the
inhabitants transport their containers by
bicycle is illustrated in Figure 61. The main
risk in the transportation step is that the
containers used are dirty. This is caused by
inappropriate handling, for example storing
them in the dirt among animals (see Figure
62).
Step three: at home
The water is stored in clay pots in people's
houses and yards. The pots have been
observed to be placed outside and
uncovered (see Figure 63), allowing
animals to consume the content and
contaminate it. Furthermore, the materials
used to lift the water from the open wells
have been observed placed on the ground
without any type of protection from
contamination (see Figure 64). The clay
Figure 61. A woman showing her bicycle with
containers
Figure 62. Containers stored in the dirt among
the animals
Figure 60. A rope being teared against the
edge
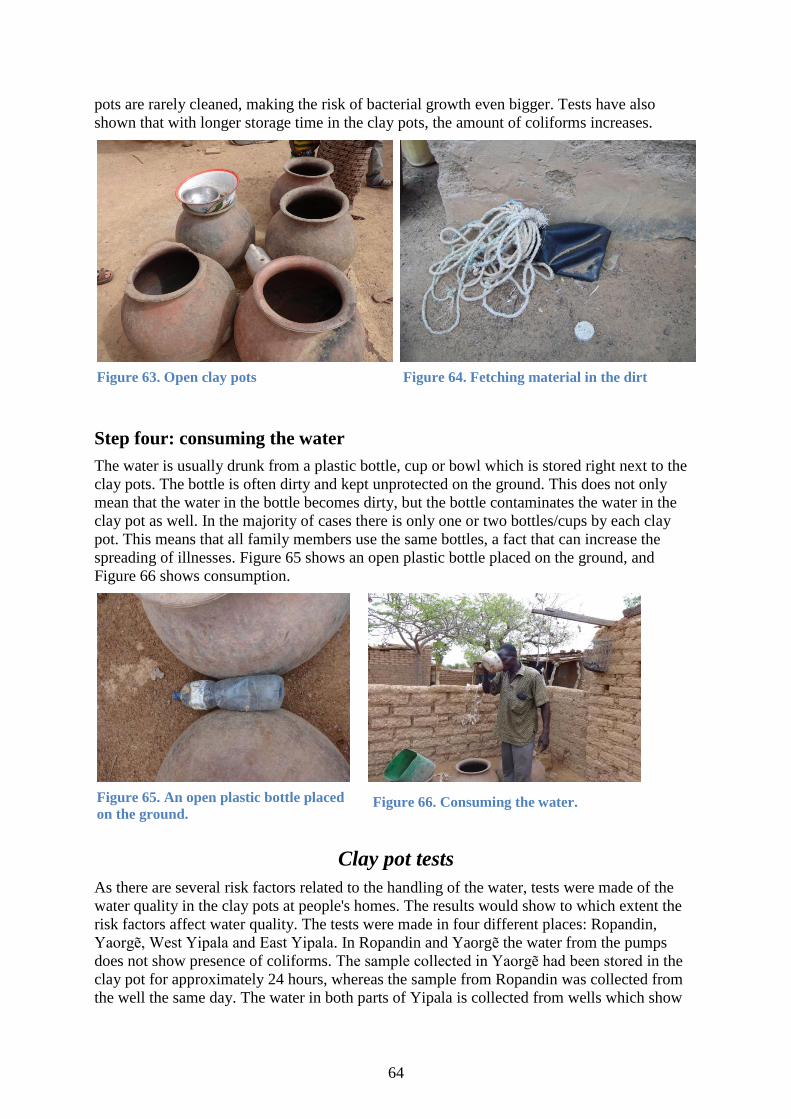
64
pots are rarely cleaned, making the risk of bacterial growth even bigger. Tests have also
shown that with longer storage time in the clay pots, the amount of coliforms increases.
Step four: consuming the water
The water is usually drunk from a plastic bottle, cup or bowl which is stored right next to the
clay pots. The bottle is often dirty and kept unprotected on the ground. This does not only
mean that the water in the bottle becomes dirty, but the bottle contaminates the water in the
clay pot as well. In the majority of cases there is only one or two bottles/cups by each clay
pot. This means that all family members use the same bottles, a fact that can increase the
spreading of illnesses. Figure 65 shows an open plastic bottle placed on the ground, and
Figure 66 shows consumption.
Clay pot tests
As there are several risk factors related to the handling of the water, tests were made of the
water quality in the clay pots at people's homes. The results would show to which extent the
risk factors affect water quality. The tests were made in four different places: Ropandin,
Yaorgẽ, West Yipala and East Yipala. In Ropandin and Yaorgẽ the water from the pumps
does not show presence of coliforms. The sample collected in Yaorgẽ had been stored in the
clay pot for approximately 24 hours, whereas the sample from Ropandin was collected from
the well the same day. The water in both parts of Yipala is collected from wells which show
Figure 63. Open clay pots Figure 64. Fetching material in the dirt
Figure 65. An open plastic bottle placed
on the ground. Figure 58. Consuming the water Figure 66. Consuming the water.
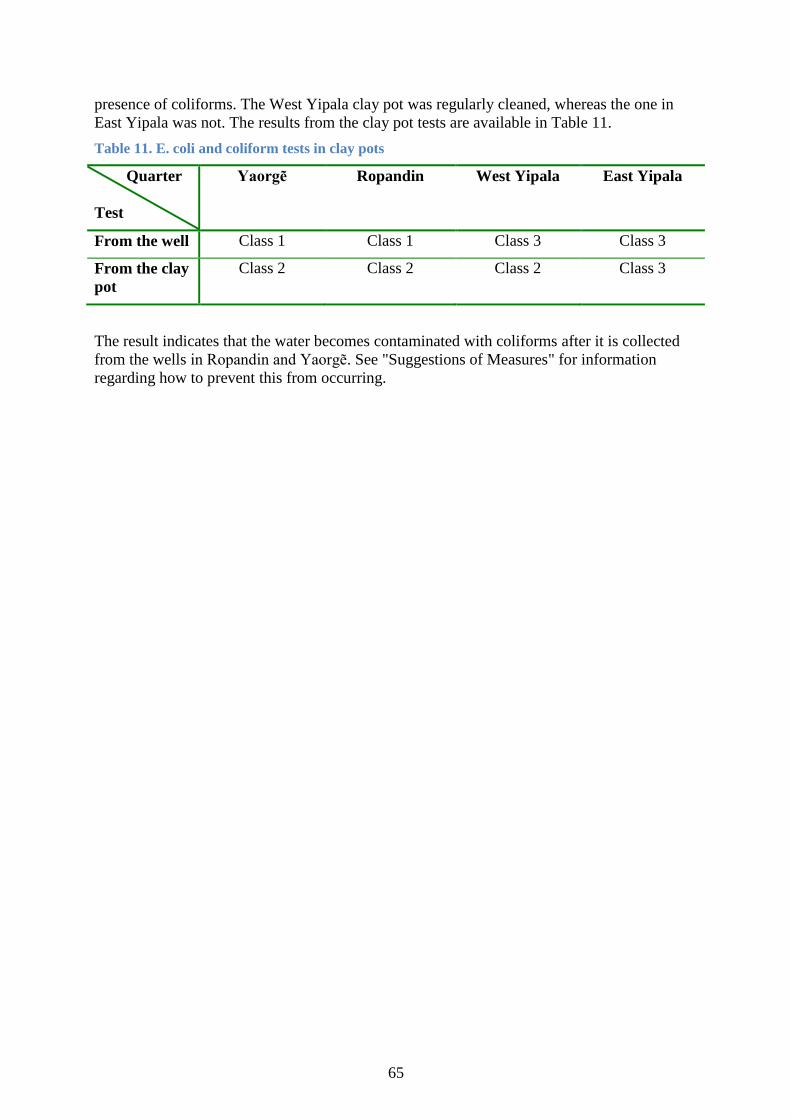
65
presence of coliforms. The West Yipala clay pot was regularly cleaned, whereas the one in
East Yipala was not. The results from the clay pot tests are available in Table 11.
Table 11. E. coli and coliform tests in clay pots
Quarter
Test
Yaorgẽ Ropandin West Yipala East Yipala
From the well Class 1 Class 1 Class 3 Class 3
From the clay
pot
Class 2 Class 2 Class 2 Class 3
The result indicates that the water becomes contaminated with coliforms after it is collected
from the wells in Ropandin and Yaorgẽ. See "Suggestions of Measures" for information
regarding how to prevent this from occurring.
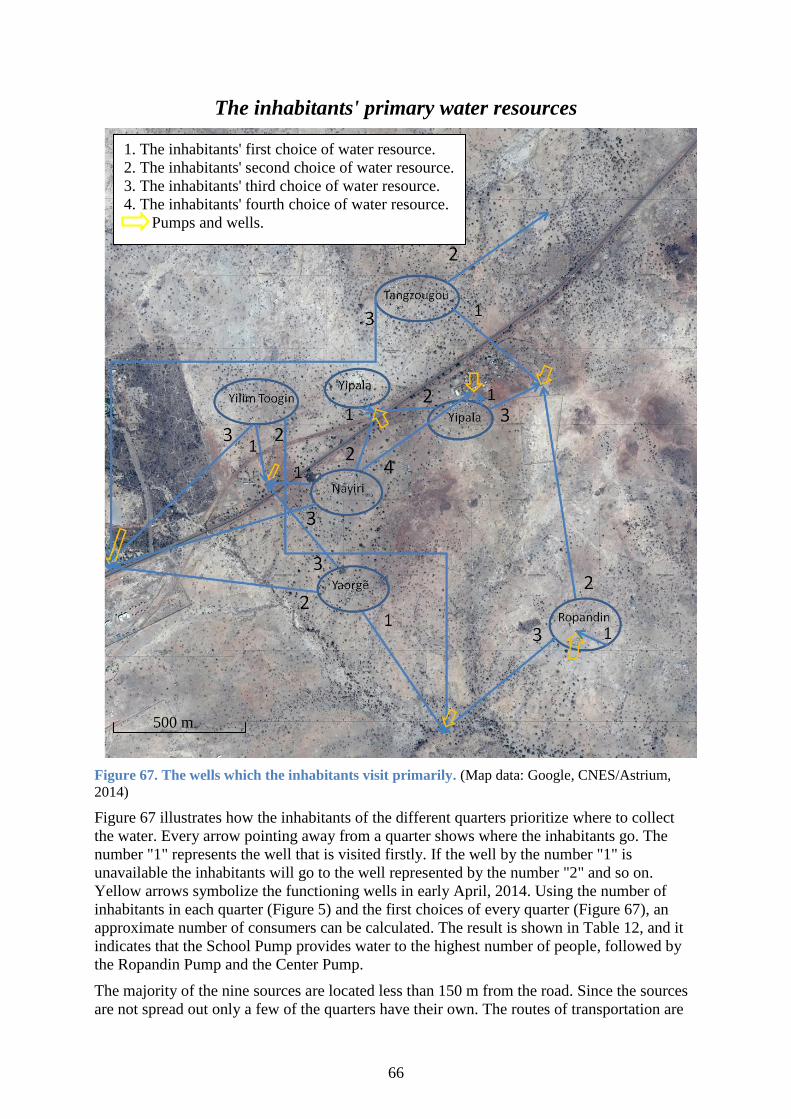
66
The inhabitants' primary water resources
Figure 67. The wells which the inhabitants visit primarily. (Map data: Google, CNES/Astrium,
2014)
Figure 67 illustrates how the inhabitants of the different quarters prioritize where to collect
the water. Every arrow pointing away from a quarter shows where the inhabitants go. The
number "1" represents the well that is visited firstly. If the well by the number "1" is
unavailable the inhabitants will go to the well represented by the number "2" and so on.
Yellow arrows symbolize the functioning wells in early April, 2014. Using the number of
inhabitants in each quarter (Figure 5) and the first choices of every quarter (Figure 67), an
approximate number of consumers can be calculated. The result is shown in Table 12, and it
indicates that the School Pump provides water to the highest number of people, followed by
the Ropandin Pump and the Center Pump.
The majority of the nine sources are located less than 150 m from the road. Since the sources
are not spread out only a few of the quarters have their own. The routes of transportation are
500 m
1. The inhabitants' first choice of water resource.
2. The inhabitants' second choice of water resource.
3. The inhabitants' third choice of water resource.
4. The inhabitants' fourth choice of water resource.
Pumps and wells.

67
therefore quite long. They have to go even longer if the water lacks or if some of the sources
are unavailable. Several inhabitants mean that they have gone numerous kilometres to collect
water during specific time periods. This is not unusual since some of the quarters have a water
tap in Ziniaré as a complement if the primary pump/well is not available. There are no people
responsible for each pump, and a possible reason could be the fact that some of the water
sources do not have a specific owner. East Yipala and Ropandin are exceptions where the
wells are located in the quarters. An option is therefore to place a possible new pump in one
of the other quarters in order to shorten the transports.
Inhabitants from Yaorgẽ need to go the furthest during the wet season when it is impossible to
reach the Soulgo Pump. For that reason it would be appropriate to place a new well there. The
distance between Yilim Toogin and its closest well is relatively long and the inhabitants share
the pump with a school. The latter makes Yilim Toogin an appropriate place for a new pump
as well if needed.
Table 12. The amount of visitors to every water resource per day
Well The consumers' origin
primarily
Approximate number of
consumers from
Nakamtenga
The Yipala Well East Yipala 119
The Foot Pump Tangzougou 187
The Center Pump All of Nakamtenga 200 + animals
The Ropandin Pump Ropandin 239
The Soulgo Pump Yaorgẽ 145
The Road Well West Yipala 109
The School Pump Nayiri and Yilim Toogin 283 + school children
Overall picture
The water supply
Using the information given for each pump regarding how much water every quarter collects
every day, it is possible to calculate the mean consumption for the inhabitants. The total
amount of water collected during one day is about 13 485 litres and there are 1082 people
living in Nakamtenga. Hence the mean consumption is about 12.5 litres per person and day.
By examining the statistics further it is possible to see that 64.3 % of the visitors to the wells
were women, 21.7 % were children and 14 % were men. It is important to note that if the
amount of water collected is considered instead, the men collect less. It takes about twice as
long time to fill a 20-liter plastic container from the open wells than from the closed wells.
The time can vary notably depending on the pump and the visitor.
There are nine water sources that can be utilized in Nakamtenga in the dry season. Two are
open dug wells and seven are closed pumps. In May 2014 only four of the seven pumps (57
%) were working. Furthermore, two of the pumps (Yaorgẽ and Soulgo) cannot be reached
from Nakamtenga during the wet season. Hence, only five of the nine water sources can be
used during the rainy season. The water supply is mostly sufficient since only the Yipala Well
has temporarily dried out during the dry season. In the wet season on the other hand, there are
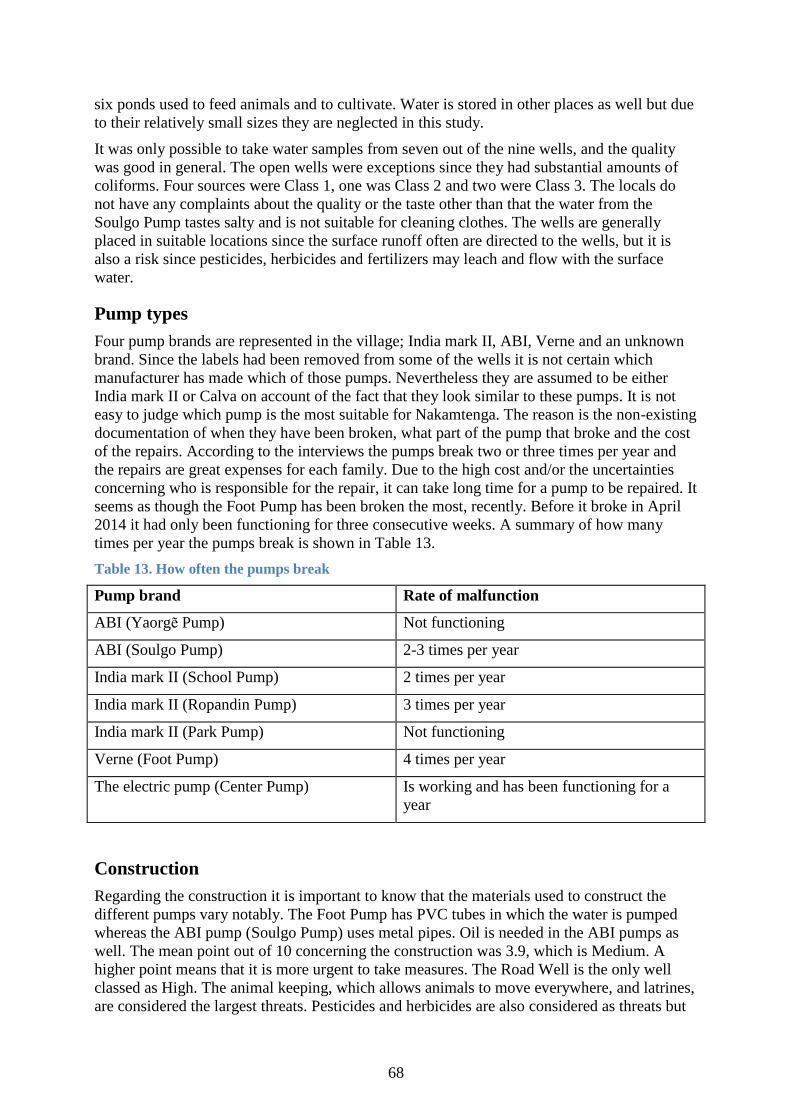
68
six ponds used to feed animals and to cultivate. Water is stored in other places as well but due
to their relatively small sizes they are neglected in this study.
It was only possible to take water samples from seven out of the nine wells, and the quality
was good in general. The open wells were exceptions since they had substantial amounts of
coliforms. Four sources were Class 1, one was Class 2 and two were Class 3. The locals do
not have any complaints about the quality or the taste other than that the water from the
Soulgo Pump tastes salty and is not suitable for cleaning clothes. The wells are generally
placed in suitable locations since the surface runoff often are directed to the wells, but it is
also a risk since pesticides, herbicides and fertilizers may leach and flow with the surface
water.
Pump types
Four pump brands are represented in the village; India mark II, ABI, Verne and an unknown
brand. Since the labels had been removed from some of the wells it is not certain which
manufacturer has made which of those pumps. Nevertheless they are assumed to be either
India mark II or Calva on account of the fact that they look similar to these pumps. It is not
easy to judge which pump is the most suitable for Nakamtenga. The reason is the non-existing
documentation of when they have been broken, what part of the pump that broke and the cost
of the repairs. According to the interviews the pumps break two or three times per year and
the repairs are great expenses for each family. Due to the high cost and/or the uncertainties
concerning who is responsible for the repair, it can take long time for a pump to be repaired. It
seems as though the Foot Pump has been broken the most, recently. Before it broke in April
2014 it had only been functioning for three consecutive weeks. A summary of how many
times per year the pumps break is shown in Table 13.
Table 13. How often the pumps break
Pump brand Rate of malfunction
ABI (Yaorgẽ Pump) Not functioning
ABI (Soulgo Pump) 2-3 times per year
India mark II (School Pump) 2 times per year
India mark II (Ropandin Pump) 3 times per year
India mark II (Park Pump) Not functioning
Verne (Foot Pump) 4 times per year
The electric pump (Center Pump) Is working and has been functioning for a
year
Construction
Regarding the construction it is important to know that the materials used to construct the
different pumps vary notably. The Foot Pump has PVC tubes in which the water is pumped
whereas the ABI pump (Soulgo Pump) uses metal pipes. Oil is needed in the ABI pumps as
well. The mean point out of 10 concerning the construction was 3.9, which is Medium. A
higher point means that it is more urgent to take measures. The Road Well is the only well
classed as High. The animal keeping, which allows animals to move everywhere, and latrines,
are considered the largest threats. Pesticides and herbicides are also considered as threats but

69
more tests ought to be done to be able to draw any conclusions. There is no protection from
the sun by any of the wells. This may have led to that most of the water is collected during the
mornings and evenings. Another reason why they arrive in the colder periods of the day may
be that the distances to the wells are long.
Organization
In Nakamtenga there is not a structured organization for handling the water situation. For
example, the quarters use different methods for collecting money for repairs. One method
used was that each man in the neighbourhood paid 500 and each woman 300 CFA. In other
situations a specific amount had to be paid by each couple or by each family. If a pump
breaks, the money is collected by a committed person who people trust. The quarters hire
different repair-men and no documentation of the repairs occurs. Both make comparisons of
prices difficult. Furthermore, the knowledge of prices of repairs is lacking which makes it
hard to know which pump is the least expensive to repair.
Sociography
In April 2014 the CVD (Comité Villageois de Développement) was responsible for a
population count in Nakamtenga. The last population count done in 2006 showed that there
were 812 inhabitants in the village (Karlsson, 2014 b). In 2014 this number had risen to 1082.
This means an increase in population with 3.65 % each year.
According to observations at site and also interviews it is the females who collect most of the
water. The role of the female according to the Mossi tradition is very limited. The females
have little power. They cannot own anything and do not have a right of vote or influence in
the deciding group of the society. If the women are not married they do not have any legal
protection and can be left or thrown out (Comité de Développement du Monde Rural
Nongtaaba, 2004).
The decision structures are a mix of modern and traditional structures. The inhabitants vote
for representatives in the parliament and in the commune. There is also a Comité Villageois
which is more traditional but still functions as a group of representatives of the village. The
village has a traditional leader to whom people ask for advice. The leader also has certain
responsibilities. The structures in the village are important to know about if a new system of
water organization is to be formed. When forming a structure for better handling the water
situation it is essential to consider the existing decision structures and traditions and develop
the water organization in collaboration with them. It is very important that the inhabitants feel
involved and that they can affect the situation. Since water supply is a central issue for
Nakamtenga, having a good organization concerning this is of great significance to all
involved stakeholders.
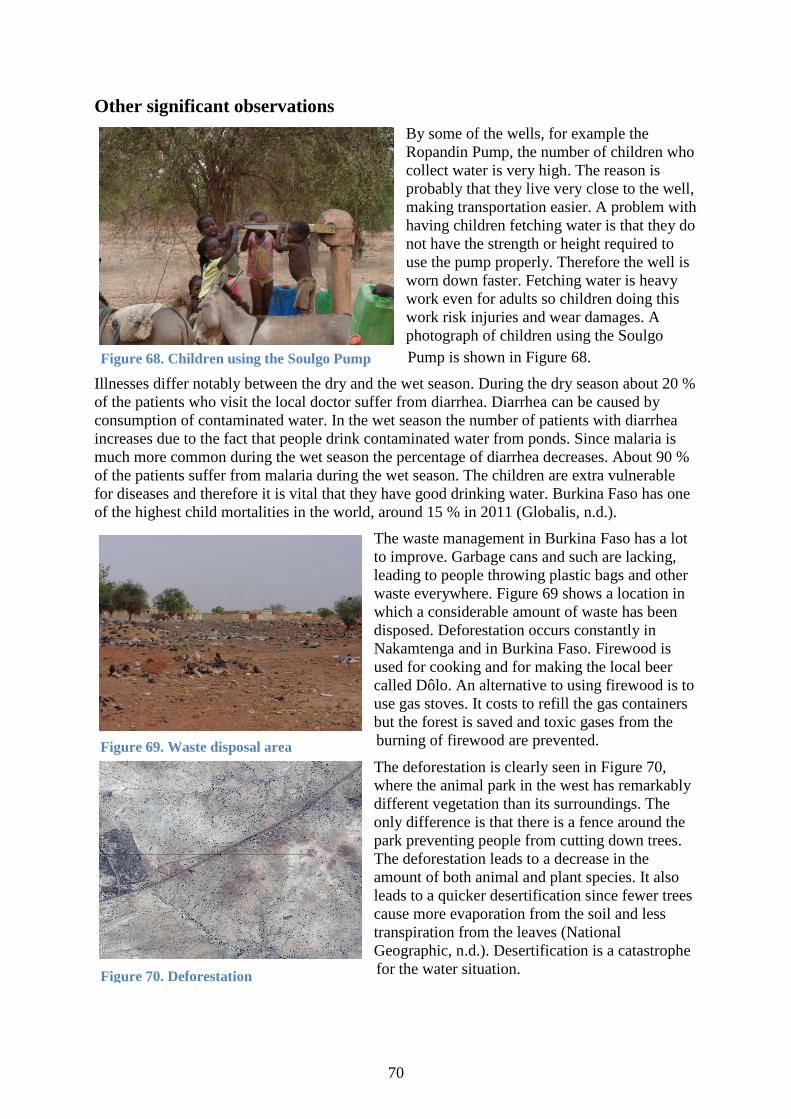
70
Other significant observations
By some of the wells, for example the
Ropandin Pump, the number of children who
collect water is very high. The reason is
probably that they live very close to the well,
making transportation easier. A problem with
having children fetching water is that they do
not have the strength or height required to
use the pump properly. Therefore the well is
worn down faster. Fetching water is heavy
work even for adults so children doing this
work risk injuries and wear damages. A
photograph of children using the Soulgo
Pump is shown in Figure 68.
Illnesses differ notably between the dry and the wet season. During the dry season about 20 %
of the patients who visit the local doctor suffer from diarrhea. Diarrhea can be caused by
consumption of contaminated water. In the wet season the number of patients with diarrhea
increases due to the fact that people drink contaminated water from ponds. Since malaria is
much more common during the wet season the percentage of diarrhea decreases. About 90 %
of the patients suffer from malaria during the wet season. The children are extra vulnerable
for diseases and therefore it is vital that they have good drinking water. Burkina Faso has one
of the highest child mortalities in the world, around 15 % in 2011 (Globalis, n.d.).
The waste management in Burkina Faso has a lot
to improve. Garbage cans and such are lacking,
leading to people throwing plastic bags and other
waste everywhere. Figure 69 shows a location in
which a considerable amount of waste has been
disposed. Deforestation occurs constantly in
Nakamtenga and in Burkina Faso. Firewood is
used for cooking and for making the local beer
called Dôlo. An alternative to using firewood is to
use gas stoves. It costs to refill the gas containers
but the forest is saved and toxic gases from the
burning of firewood are prevented.
The deforestation is clearly seen in Figure 70,
where the animal park in the west has remarkably
different vegetation than its surroundings. The
only difference is that there is a fence around the
park preventing people from cutting down trees.
The deforestation leads to a decrease in the
amount of both animal and plant species. It also
leads to a quicker desertification since fewer trees
cause more evaporation from the soil and less
transpiration from the leaves (National
Geographic, n.d.). Desertification is a catastrophe
for the water situation.
Figure 69. Waste disposal area
Figure 70. Deforestation
Figur 59. Children using the Soulgo Pump Figure 68. Children using the Soulgo Pump

71
Discussion
Geographic position and climate
The position of Nakamtenga in Burkina Faso and the world means conditions which give
challenges in many ways. The warm climate makes evaporation very big and the rainfall is
concentrated to a short period of the year. Even though the village is desert-like during the dry
season, the annual precipitation is actually higher than in countries with a humid climate.
Since the rainfall is concentrated to the period June-September a lot of water falls during a
short time. This in combination with the soil types mean a lot of runoff water. Water that
brings with it soil, waste and faeces. This means that water in the ponds will be dirty,
endangering the health of animals and people consuming it. The limited period with rainfall
also means that the groundwater reservoirs and ponds will not be refilled during a period of
about 7-8 months. When the ponds and wells are empty of water, no refill is to expect until
the next rain period.
If a pond should keep water throughout the whole dry season it has to have very big
dimensions. The ponds existing in Nakamtenga (10 000 m3 at the most) dry out already in
December which means that it rests 4-5 months with no pond water for animals and
cultivation. To lengthen the existence of water in a pond with 4-5 months is a lot. Such a
construction demands big resources both financially and technically, resources which do not
exist in the village or commune. Even though a pond which holds water all year round is one
of the inhabitants' top wishes, it will be hard to realize this project. An interesting idea would
be underground ponds but those as well are investments of great cost and mean technical
challenges.
Nakamtenga's position does not only mean difficulties but also advantages. Nakamtenga does
not have the problems of the north with arsenic and the geology is good for aquifers. The
short distance to Ziniaré and Ouagadougou has helped the town to have water taps run by the
state. Another interesting and hopeful fact is that Nakamtenga only about 50 years ago had a
much richer plant and animal life. This means that the geographic position can hold a
completely different vegetation and local climate, even though deforestation and climate
change endangers both the water supply and the human presence if the present development
continues.
Soil type and runoff water
The soil type is important because it affects the residence time and amount of runoff water.
The three soil types in Nakamtenga have different properties but concerning infiltration speed
and residence time they are assumed to differ insignificantly. The study is too limited to do
exact research of each soil type and their properties but some facts and assumptions are used
to give a hint of the situation. Exactly where the different soil types exist is not mapped. The
mapping has focused on establishing the soil type next to each well. The soil types in
combination with intense rainfalls lead to a lot of runoff water and soil erosion. Due to this it
is even more important to find a good waste management system.
During the dry season the soil is very hard which does not only cause the rare rainfalls to form
runoff water but also makes farming difficult. To diminish the damages of the runoff water
and to better use the precipitation are two of the big challenges for Nakamtenga. Water can be
lead off to dams to decrease evaporation but it still brings much dirt with it. An idea would be
to filter the runoff water before reaching the dams but no further research concerning this has
been done. Since the topography in Nakamtenga is relatively flat it is sometimes hard to

72
decide the direction of the runoff water. In the maps this has been done to the greatest extent
possible. The large amount of runoff water has made it relatively easy to find the water sheds.
To receive more detailed information studies have to be done during the rainy season as well.
This applies to the entire mapping since many parametres can change depending on season.
For example much more rain during the rainy season causes the groundwater level to rise by
several metres, leading to different infiltration and transportation processes in the ground that
affects the parametres analyzed. Furthermore the fresh water rainfall can improve the water
quality, but at the same time the water quality can be worse due to increased contaminated
runoff water. During the rainy season access to water for cultivation and animals will not lack
as during the dry season but access to safe water for household purposes can still be a
problem.
Contamination risks
When studying the water situation it is significant to find the existing and potential risks and
how to avoid them. It is also relevant to analyze which risk is the greatest at the moment and
evaluate whether or not actions must be taken. What threatens the water quality and water
supply in Nakamtenga the most? At the moment the biggest threats seem to be broken pumps
and the handling of the water. The frequency of pumps breaking is high and affects the whole
village. People have to work hard to fetch water and financing repairs of the pumps is
difficult. This does not only endanger the health of the population but also increases the
burden for women and makes further development in other areas impossible. Concerning the
contamination risks the handling is found to pose the greatest risk for the drinking water
quality at the moment. Risk sources as latrines, weaknesses in well construction and
pesticides have been found but the handling is still judged to be the biggest problem.
Fortunately it is also the cheapest to deal with. Construction risks and moving latrines demand
much more resources to fix.
The fact that animals graze everywhere cannot only be a problem for water quality but have
social effects as well. The Peul has herded their animals for ages and most people leave their
animals to stroll freely. This means that the whole Peul system and attitudes towards having
free strolling animals have to change to erase this risk factor. To avoid interfering with the
Peul it might be preferable to focus on improving construction of wells to minimize this risk.
Building or repairing fences so that animals are kept away and having proper water channels
so that the animals drink as far as possible from the apron area are suggestions of measures.
Many of the sources lack fences but in general the constructions are quite good. Only a few
reach risk levels higher than Low. This is judged to be reliable and is strengthened by the fact
that WHO use a similar system to analyze contamination risks. Even though all wells can be
improved, this is not to be priority number one but can be recommended if the risk is very
high.
Since it is difficult to state to what extent the lacks in the construction affects water quality
and since the actions for minimizing those risks can be expensive and comparatively
complicated it might be better to start with other measures. The rice fields are considered to
be greater risks right now since farming rice is a new phenomenon in Nakamtenga. This
might be to exaggerate but since the education level is so low and there are many examples of
overuse in other regions it is not improbable that overuse occurs in Nakamtenga as well. Even
though there might have been some education following with the rice project it might not be
enough. When there is great need of food, people do not want to take the risk that the crops
are destroyed and consequently use more chemicals. There is sometimes the
misunderstanding that more is always better and this can have negative consequences for the
73
water quality. Rice cultivation might be a very good idea but it is very important that it is
done in a proper way.
Waste management is a question for the whole country. The lack of it in combination with a
lot of runoff water threatens not only the water quality but also animals, vegetation and the
direct health of the population. There is a need of a waste management system, but to start
with it is important with education concerning why taking care of the nature is important. The
attitude towards garbage and throwing waste everywhere ought to change.
A lot of the risks concerning both hygiene and waste are related to the low education level.
The inhabitants do not know the risks they expose themselves to. If they do not understand the
risks, then why should they make an effort and change their habits? Education concerning
water handling and hygiene is therefore strongly recommended.
Water quality
When studying the overview of the water quality of the wells it is clear that a lot of the test
results point towards a relatively good water quality in the village. There are no signs of
arsenic and most of the bacteria tests were Class 1. Even though it is easy to get the
impression that the water quality is good it is important not to forget the few red marks on the
overview and also reflect concerning the yellow ones. Almost all of the indicator values of
phosphate exceed 0.6 mg/l which implies contamination. Since phosphate levels were high
even on the wells with no coliforms the high levels might indicate that the phosphate has
geological origin. The phosphate levels might also be high due to the free strolling animals
but fortunately the coliforms have not survived until the faeces reach the water sources.
Another possible but less likely explanation is that test results are misleading due to the
uncertainties related to field kit tests and the extreme climate. The phosphate levels should be
reflected upon with consciousness and are therefore marked yellow in the overview but it is
also important to clarify that a high phosphate level is not dangerous in itself; it is only an
indicator that the well might be contaminated. The guideline value for nitrate is 50 mg/l and
two of the samples (with levels between 44.3 mg/l and 88.6 mg/l) might exceed this value.
The reasons why the open wells are contaminated to a greater extent than the closed pump
wells may be several. No lids lead to no protection from dirt and animals. Moreover, buckets
and ropes which are kept on the ground will contaminate the well water when tossed into it.
The open wells are the oldest and might not have been cleaned since they were built, which is
70 years ago for the Road Well. Since they are more reachable for contaminants cleaning
might be of greater importance at the open wells. The bacterial presence and the high nitrate
levels in some wells can have natural causes but since high bacterial levels were found in the
open wells it can be a sign that filth and animals enter the sources and that the material used to
get the water is dirty. The use of pesticides and herbicides is unknown since water tests have
been limited to other chemicals. This fact should not be disregarded so further analyses of the
water is recommended, especially for the wells near rice and tomato fields.
The observations concerning the handling of the water show that there is great need of
education. Several inappropriate actions and ignorance of risks were observed. When test
results at the well and in the clay pots showed very different results it was clear that the
handling has to change if the risk of illnesses should decrease. To show the big difference in
for example the bacterial tests of the water in the Soulgo pump and the water in a clay pot in
Yaorgẽ might be good for education purposes since it clearly shows a big difference in
quality.
The results from the clay pot tests also indicate that the number of coliform colonies decreases
when cleaning of the pots is done regularly. That the quality in the clay pot in West Yipala

74
was even better than the quality in the Road Well is due to the fact that the tests were made
with different water samples. The essence of the clay pot tests were to see if there is a
difference between water quality in the wells and water quality in the clay pots, and whether
cleaning the clay pots had an effect. Both these turned out to be true which means that
handling affects water quality and can be improved by quite simple measures.
Illnesses are a problem in the village but it has not been possible during this study to find
exact statistics and correlations between poor water quality in wells and illnesses. Since
diarrhea is a problem in the village and especially dangerous for small children it is of great
relevance to assure a good water quality in the wells and a good handling of the water. It is
also an economic issue since medication is expensive but good handling is free. A problem
according to healthcare personnel is that people become ill due to bad hygiene and by
drinking dirty water from ponds but when they return from the hospital they continue to make
the same mistakes. Shortly said they have not learned their lesson or not really understood
why they became ill. This further proves the importance of education concerning hygiene and
sanitation. It can be a challenge to make people change their habits so therefore understanding
why and noticing the positive effects of better water handling and hygiene is important.
Culture and tradition
It is clear that culture and tradition also affects the water situation. An overwhelming majority
of the collectors are women and children. Collecting water is seen as a job for females and it
can even be embarrassing for men to do it. This is a shame since it can be hard for children
and women to maneuver the pumps. If the men would fetch water to a greater extent it could
both lessen the weardown of pumps and lead to a faster development for the village since the
water fetching would be more efficient. Sometimes the work females do can even be
considered no work at all, just a necessity to be done. If water collecting and handling was
looked upon as an important work for everyone, including that the men understood the
importance and hard work fetching water is, progress might be faster. Especially since it is the
men who traditionally make the decisions. An interesting example is a man who once stopped
by a pump with a container and complained loudly over how hard it was to pump. Next to him
stood a woman with 10 containers who did not complain at all. The scene illustrates that there
is a lack of knowledge among the men concerning water and the hard work the women do.
This is further illustrated by the man during the interviews who said that everyone go and
fetch water but when he was asked where they store the water he had to ask the women.
Another cultural aspect is that people are not used to save money and plan in a long-term,
facts that complicate collecting and saving money for damaged pumps. As in many other
countries there is also a tradition concerning alcohol consumtion., The local beer, Dôlo, is
produced and consumed in the village. Dôlo drinking is a tradition but the preparation
requires a lot of resources and water and it also has negative social effects. A smaller
consumption would both save trees and facilitate a more sustainable social and economical
development.
Water supply and consumption
Almost all wells have water all year round so access to drinking water should not be a
problem since the water assets are good. In fact it is not the presence of water that is the
problem but that the inhabitants cannot reach it. Pumps are broken or inexisting and pumping
and transport is too time demanding for getting enough water to satisfy the needs. Insufficient
inflow can also be a problem. The big lack of water which is often mentioned as the problem
is rather a consequence due to difficulties of reaching the water. The lack of water is instead a
reality considering the ponds. Pond water can be given to animals and used for cultivation

75
which can help securing the food supply. This is probably why the top wish of all quarters
during the interviews was a pond. By leading runoff water to ponds evaporation can decrease
but as already mentioned, constructing a pond which holds water all year round is difficult.
Therefore utilization of the persistent groundwater resources might be an idea.
The successful increase of water outtake at the center compared to other water sources
indicates that there are good conditions for using groundwater for more than just household
purposes. If this is realized in more places it will have big effects on the entire village,
improving the standard of life and making way for development also in other areas than food
and water security. Water is a necessity which means that a secure access to safe drinking
water is the base of a society. Without water the development on other areas is impossible.
Therefore securing water for the inhabitants should be a priority. The time aspect is also
relevant. Fetching and pumping water is hard work and very time consuming. Time which
could be spent on other things such as taking care of children or education.
Pump types
Concerning pump types it is hard to make many conclusions. It is certainly preferable to have
easily maneuvered pumps which last long and are easy and not too expensive to repair. The
investment cost cannot be too big either, especially if the inhabitants themselves shall finance
it. Since the documentation lacks, knowing how often different pump types break relies on
interviews with inhabitants. Sometimes the answers are very dependent on how the question
is asked and there is also a risk of exaggeration. There are also several pump types and since
the study concerns few pumps it is hard to statistically assure patterns of how often different
pump types break and what technologies are insufficient. The observations have given some
important conclusions though. It is preferable to use PVC pipes instead of iron since the water
wears down the iron pipes. Moreover, even if PVC is to be more expensive to purchase, it
should be more economical in a long term perspective.
The current status and reputation of the Foot Pump implies that this type of pump is unreliable
and very expensive to repair. Consequently, avoiding more investments in this pump type is
recommended. Both the ABI and the India mark II deep well hand pump required a lot of
strength to use, and the India mark II deep well hand pumps are slightly worse. The ABI has
the disadvantage of needing oil, which might be the case in India mark II as well but it is
more commonly a demand for the ABIs. This means more need of service and a larger risk of
oil contaminating the water. Pumps needing oil should therefore be avoided. Considering
ergonomics no further analysis has been done.
In May 2014 the state's water taps opened, which means that there are two more places for
collecting water. This is very positive since access to water increases in the village and people
do not have to go 5 km to Ziniaré to buy water. The water is of good quality and can be
fetched quickly and without much effort. Even if using those means less work and receiving
water of good quality it is doubtful that a lot of people will start using them. Since the water at
the taps costs money many people prefer fetching the water by themselves. Either they do not
have money at all or they have it but prefer to spend it on other things. Since the income is so
low it might be of greater interest to spend it on something they cannot do themselves.
An interesting thought is that it is the women who fetch the water but the men who are in
charge of the economy. It is less likely that the men will spend the money on something they
view as work for women instead of their own expenses. During the interviews the inhabitants
were positive to the water taps but they saw it as a complement to the wells rather than a first
choice option. During the few days observations of the water taps were possible this seems to
be correct since there was no rush to the taps. People still fetched water at the Road Well for

76
example, right next to a water tap. It seems like in the present time the water taps cannot
replace a free well. The taps are situated far from many inhabitants and they will not solve the
problems concerning cultivation and feeding animals either since this would be not only way
too expensive but also practically difficult.
Advantages and future challenges
During the study an approach has been not only to focus on the problems but also to find
positive factors and promising tendencies in the village. One of the most important things
noticed is the interest and commitment the inhabitants show for the water situation. They
know that water is essential for development and health. Consequently they are eager to know
more and to improve the situation. This is fundamental for the sustainability and success of all
actions towards a more reliable and safe water situation in the area. For example it increases
the chances of having successful education programs concerning water handling. Another
positive observation is that more and more people have latrines or are on their way to build
them. This is a success for the hygiene and it also diminishes faeces in runoff water. It is
important though that the latrines are not placed close to the wells. The work and ambition of
the Comité Villageois is also promising for the future.
The mapping is done of the present situation but the challenges of the future are also of
significance. The increased population (3.65 % per year) means more water outlet, and
climate change and deforestation might have big effects on precipitation and water access.
The development of the climate and what effect it will have on precipitation can be the
deciding factor of what Nakamtenga will look like in 50 years. It is important to note that the
water ended in the Center Well last year which demonstrates that the inflow is limited and
consequently there are limits of the water outlet. Water outlet has to be spread out through the
village so that one aquifer is not overused. The resources should be used efficiently and water
should preferably be accessible in all quarters.
Measures
For a start it is hard to demand too much since the economic resources are limited in the
village. Even if the inhabitants want to invest it might not be possible. Behaviour change is
free but not always possible or at least problematic. For example, the waste management is
not something that can be changed totally by the individual, but by the commune. If a facility
that can handle the plastic bags used for drinking water in non-existing, there is often not
another option than discarding them. The reality in which people live makes it impossible to
erase all risks. The climate is suitable for bacteria and the poorly developed housing and life
standards endorse contamination risks.
The actions recommended are not written in prioritization order but a key to success seems to
be knowledge. People must know about the risks and handle the water in a better way. Small
measures can have large effects. In the list of actions mentioned not all of them are essential
but they are still recommendations that can help decrease risks. Furthermore it is important
that the test results are presented to the population in the right way. People should not be
scared but understand the seriousness in the fact that water is contaminated in the wells and if
not, it can become contaminated after inappropriate handling. Pictures have proven to be very
efficient so it is recommended that they are used to a great extent. Discussion forums can play
a fundamental role because only giving results might not be enough. Discussing actions and
why results are important and what they mean has to be done so people understand why they
should change their behaviour.

77
How to better organize the water system is an important question. There is a need of someone
taking responsibility for documentation and maintenance of pumps. The villagers can
organize themselves in different ways but it is important that they reflect and find the most
suitable way to do it. Each quarter could as an example have a person responsible for the
water. The latter would work well in Ropandin since they have their own pump. In other parts
of the village this will be complicated since which quarter each water source belongs to and
who fetches water there is more varying. With a central organization this problem would not
occur. Another advantage with a central organization is that everyone is supported and the
cost for repairs and administration per capita diminishes. Exactly how the organization should
look like is hard to decide but it should not be too complicated to find a solution. An idea is to
make the CVD responsible, since it is an already existing well-functioning structure in the
village. The collaboration with the CVD during the mapping showed that this solution has the
potential to function very well in Nakamtenga.
Sources of error
Water quality analyses
Different types of measurements have different sources of error. As an illustration, the
conductivity was measured on water with temperatures above 30 degrees Celsius. When
comparing the values with the guidelines it ought to be 20 degrees Celsius. The conductivity
measurements have been done on water samples of which the temperatures have not differed
significantly. Comparisons between the different measurements are therefore possible.
Due to the fact that the bacterial analyses have been done in the field, an incubator have not
been possible to use. Consequently the temperatures have differed a bit during the
incubations. Preferred temperature for bacterial growth is 37 degrees Celsius, but since the air
temperature has changed between approximately 34 and 39 degrees it has not been far from
the optimal one. There is also some uncertainty considering the reading of bacterial tests.
Colours are not always very clear and to decide whether coliforms are E. coli or not can be
hard.
The usage of field kits in the field means uncertainties and some of the materials used were
not very exact or practical to use. For example, the reading of nitrate was done by deciding
the tint of the water and after that multiplying the already wide ranged result with a number. If
higher levels than 10 were observed the multiplication meant that the nitrate levels were either
below the guideline values or above them. Another factor which might have had a slight
impact on the results is that tests were done different days with different temperatures and
with different times since last rainfall. Therefore temperature is written in all test results.
Calculations
By using Darcy's law for calculating how long it may take for contaminants to reach a water
resource, an amount of assumptions had to be made. It was not possible to determine the exact
hydraulic conductivity or the kinematic porosity in the soil. The latter makes the margin of
error significant. Furthermore, the soil structure below the ground surface in the area
considered is unknown. The time may be even shorter than calculated, or longer.
Observations
The observations on the collection of water from the wells have been made for a day at each
well. To be able to get more statistically secure results, the observations should take place for
a longer period of time. But since the inhabitants of Nakamtenga usually collect water from

78
the same well every day at about the same time, the result is considered as good. Furthermore,
the presence of observers may have affected where people went.
The amount of liters collected from each well is not an exact number. It is derived from the
number of plastic containers that were filled. It was assumed that every container was
completely filled. In addition, some were drinking directly from the well, and that amount was
not noted. The time spent filling a container can vary a lot depending on who is pumping. To
avoid great variations several observations were done. Regarding whether or not an individual
was considered an adult or a child, assumptions were made by observation instead of asking
everyone of their age. In other words, it was observed in a subjective manner.
The flat topography makes hydrological investigations more difficult, since it is hard to see
the direction of the surface runoff. Finally, the form used to judge the construction of each
well is optimized for open wells and hand pumps, which means that the electric pump is not
judged separately.
Interviews
Due to the local culture, the men were in a majority during the interviews. Even if there were
many women they did not say much. A problem is the fact that the women are the ones who
usually collect the water. Consequently, the answers may have differed if the women would
have answered to a greater extent. An example is the fact that most of the quarters answered
that all of the inhabitants collect water, not only the women. Everything was translated during
the interviews, which is a source of error since there is always a risk of misinterpreting and
misunderstanding.
For interviews in general the layout of the questionnaire is important. Having open-ended or
closed questions may give different answers. The questionnaire in this study had open-ended
questions. As an example, there is a risk that the interviewees answer the questions in a way
that they think the interviewer wants them to answer. By having an oral interview there is also
a risk that the interviewees are affected by how the interviewer expresses himself. Since
documentation is missing, questions concerning for example how often pumps break are
dependent on interviewees. Their time perception might be inadequate which must be kept in
mind while analyzing results.
Suggestions of Measures The results of the mapping motivate a range of actions connected to the water situation. The
following measures are to be seen as recommendations rather than a to-do-list. The situation
can still be sustainable even though all measures are not taken. It is impossible to eradicate all
the risks but it is preferable to do what is possible to decrease risk levels. Even the small
simple changes can mean a big difference. The order of the measures are not the order of
priority, even though to some extent the most urgent and actual actions have been written
first. For more information and motivation of why the measures are important it is
recommended to study the result and discussion parts of the report. To facilitate for the reader
the measures have been divided into different subtitles.
Handling
At the well
Use a personal funnel which is proper
Pump the right way to prevent weardown of the pump

79
Avoid wearing down the rope
Transportation
Clean the plastic containers used for transport regularly
At home
Keep the ropes and bags/buckets in a clean safe place above the ground. It is important
that they are kept out of reach for animals
Cover the clay pots
Clean the clay pots regularly
The consumption
Store the bottles and cups in a clean place out of reach for animals
Clean the bottles regularly
Use one bottle per family member in case of illnesses
Consume the water within a reasonable time span
Construction
Avoid placing latrines upstream the wells
Make sure the parapets are high enough to prevent animals from falling down the well
Clean and/or repair the spill water channels which are insufficient
Cover the open wells when not used
Make sure that the walls surrounding the wells are functioning so that animals are
excluded from the apron area
Clean the bottom of the open wells
Build a fetching device at the open wells. This makes contamination less probable
since only one bucket is used and kept clean at the well. It is also easier to get the
water. The Yipala Well has rarely many visitors simultaneously, which makes it
suitable for this type of device.
Make sure that there is somewhere to rest in the shadow at each well. A roof over or
next to the well can be very useful for water fetchers.
Evaluate the possibilities of investing in new pumps
Information
Educate the population about hygiene and water handling
o Educate women primarily due to the fact that they are the primary water
collectors
o Make sanitation and hygiene issues obligatory in the school's education
program

80
o Use a lot of pictures during the education program since this has proven to
have a good effect
Inform about how to use herbicides and pesticides to prevent excess usage
Educate the population about the hazards of cutting down trees
Organization
Exactly how the organization concerning water is to be structured has to be discussed with the
CVD but there are advantages of having someone responsible for documentation and
maintenance of the water sources. In this way information will be accessible and comparisons
can be made between pump types. It is also possible to find better ways of financing repairs of
pumps.
Appoint someone in charge of documentation and maintenance of wells
Educate one or two of the inhabitants on how to repair the pumps alternatively
coordinate the choice of a repair-man, so that the cost is minimized and the risk of
getting different prices at different occasions is reduced
Secure the quality and amount of water
Use purification methods to clean contaminated water. An example is the SODIS
(Solar Water Disinfection) method. Contaminated water is kept in PET-bottles in the
sun for six hours. The high temperature (at least 40°C) in combination with UV rays
will kill bacteria (SODIS, n.d.).
Clean the boreholes if the water lacks. If the capacity of the well decreases over time
the reasons may be chemical deposits or that the fractures are filled with pebbles and
such. There are four measures that can be taken. They are, blasting, rinsing under high
pressure, making the borehole deeper or drilling a new well (Socialstyrelsen, 2006).
Clean the open wells. If the amount of water is insufficient the reason can be that the
sand in the bottom must be replaced or refilled. The sand may also need to be cleaned
(Socialstyrelsen, 2006).
Plant trees around the ponds. The trees keep the wind calm, reducing evaporation.
Their roots keep the soil in place and reduce erosion.
Avoid using pesticides and herbicides upstream the wells.
Further actions
Examine the water quality during the wet season
Check for other chemicals i.e. pesticides and herbicides
Perform water quality tests regularly
Be attentive to changes in quantity and taste as well as eventual diarrhea breakouts.
These are indications of impaired water quality and access.
Investigate further the environmental, social and economic aspects of Dôlo
preparation. This will give more arguments and can motivate a decrease in production
and consumption which in the end is advantageous for the water situation.
Further investigate groundwater levels and possible water outlet. Results of those
investigations might mean great development possibilities for the entire village.

81
Investigate possibilities and difficulties with installing solar driven electrical pumps.
Build more latrines so that faeces do not spread freely.
Conclusions By studying the results the following conclusions are drawn:
The water supply is sufficient for household needs. The problem is that the inhabitants
cannot get hold of it to the extent needed.
The water quality in the wells is good with exception of the open wells. The high
levels of E. coli and coliforms in the clay pots show that water handling is
inappropriate. The handling of water is the greatest contamination risk and should
improve to decrease risks of illnesses.
There is a great need of education concerning hygiene and sanitation.
The pumps break too often. Two-three times per year is not acceptable, since the
repairs are expensive for the inhabitants.
Documentation and organization of water related issues is insufficient and will be of
good use if progress is to be made.
Measures ought to be taken to improve the water quality in the open wells.
Reducing contamination risks is possible at all wells since deficiencies and flaws
appear everywhere.

82
References
brgm Carte Geologique du Burkina Faso à 1 200 000 - Ouagadougou [Geological map]. -
Ouagadougou : Ministere des Mines des Carrères et de l'Énergie, 2003. - French.
CAWST Introduction to Drinking Water Quality Testing [Report] : Manual. - Calgary :
CAWST, the Centre for Affordable Water and Sanitation Technology, 2013. - p. 7.10.
Comité de Développement du Monde Rural Nongtaaba Situation de reference du village
de Nakamtenga [Report]. - Ziniaré : Comité de Développement du Monde Rural Nongtaaba,
2004. - French.
From Anna-Lena Konduktivitet - elektrisk ledningsförmåga [Online] // Sveriges
Lantbruksuniversitet. - March 9, 2014. - May 20, 2014. -
http://www.slu.se/sv/institutioner/vatten-miljo/laboratorier/vattenkemiska-
laboratoriet/vattenkemiska-analysmetoder/konduktivitet-elektrisk-ledningsformaga/. -
Swedish.
Globalis Burkina Faso [Online] // Globalis. - n.d.. - June 17, 2014. -
http://www.globalis.se/Laender/Burkina-
Faso/%28show%29/indicators/%28indicator%29/121/%28country2%29. - Swedish.
Google, CNES/Astrium, 2014 Google Earth. Picture date 2-3-2014.
Google, US Dept of State Geographer. Image Landsat. Data SIO, NOAA, U.S. Navy,
NGA, GEBCO, 2014 Google Earth. Picture date 10-4-2014.
Hach EZ Arsenic High Range Test Kit [Online] // Hach. - n.d.. - May 24, 2014. -
www.hach.com/asset-get.download.jsa?id=11421753000.
Hanna Instruments HI 3812 Hardness Test Kit [Online] // Hanna instruments. - n.d. a. -
May 24, 2014. - http://hannainst.com/manuals/3812.pdf.
Hanna Instruments HI 3815 Chloride Test Kit [Online] // Hanna Instruments. - n.d. b. - May
24, 2014. - http://hannainst.com/manuals/3815.pdf.
Hanna Instruments HI 3874 Nitrate Test Kit [Online] // Hanna Instruments. - n.d. c. - May
24, 2014. - www.hannainst.com/manuals/manhi_3874.pdf.
Hanna Instruments HI 713 Checker®HC Handheld Colorimeter - Phosphate Low Range
[Online] // Hanna Instruments. - n.d. d. - May 24, 2014. -
http://hannainst.com/manuals/ist713_03_13.pdf.
Holmertz Gert Klimat [Online] // Landguiden. - 2012. - October 12, 2013. -
http://www.landguiden.se/Lander/Afrika/BurkinaFaso/Klimat. - Swedish.
Karlsson Lennart [Interview]. - Nakamtenga : [s.n.], 13 April 2014 a.
Karlsson Lennart [Interview]. - Nakamtenga : [s.n.], May 4, 2014 b.
Knutsson Gert and Morfeldt Carl-Olof Grundvatten - teori och tillämpning [Book]. -
Stockholm : AB Svensk Byggtjänst, 2002. - 3 : pp. 76, 82, 83, 85, 88, 89, 91, 94, 97. -
Swedish.
La Direction Régionale de l’Economie et de la Planification du Plateau Central Plan
Communal De Développement 2012-2016 [Report] : Development plan. - [s.l.] : Ministere de
l'Administration Territoriale de la De centralisation et de la Securite, 2011. - pp. 8, 10.
Livsmedelsverket Livsmedelsverkets råd om enskild dricksvattenförsörjning [Online] //
Livsmedelsverket. - December 19, 2013. - June 10, 2014. -

83
http://www.slv.se/upload/dokument/livsmedelskontroll/livsmedelsverkets_rad_om_enskild%2
0dricksvattenforsorjning.pdf. - Swedish. p. 10.
National Geographic Deforestation [Online] // National Geographic. - n.d.. - June 4, 2014. -
http://environment.nationalgeographic.com/environment/global-warming/deforestation-
overview/.
Nationalencyklopedin Periodiska systemet [Online] // Nationalencyklopedin. - n.d.. - May
25, 2014. - http://www.ne.se/static/useful/samlingar/periodiska_systemet.jsp. - Swedish.
Olofsson Bo Grundvatten i jord [Performance]. - KTH ; Stockholm : [s.n.], February 3, 2014
a.
Olofsson Bo Grundvattenprospektering [Performance]. - KTH ; Stockholm : [s.n.], February
17, 2014 b.
Ouédraogo Zidik [Interview]. - Nakamtenga : [s.n.], 21 April 2014.
Rundquist Franz-Michael A. Burkina Faso [Online] // Nationalencyklopedin. - n.d.. - May
24, 2014. - http://www.ne.se/burkina-faso. - Swedish.
Röda Korset Vatten ger liv [En ligne] // Röda Korset. - n.d.. - 1 November 2013. -
http://www.redcross.se/teman/rent-vatten/. - Swedish.
Socialstyrelsen Dricksvatten från enskilda brunnar och mindre vattenanläggningar [Report] :
Handbook. - [s.l.] : Socialstyrelsen, 2006. - pp. 48, 49, 53, 67, 69. - Swedish. - ISBN 91-
85482-73-0.
SODIS SODIS - Safe drinking water in 6 hours [Online] // SODIS Safe drinking water for
all. - n.d.. - June 04, 2014. - http://www.sodis.ch/index_EN.
Swedish National Chemicals Inspectorate HA oils in automotive tyres - prospects of a
national ban [Report]. - Stockholm : Swedish National Chemicals Inspectorate, 2003. - pp. 19,
20. - No 5/03.
UNDP Burkina Faso [Report]. - [s.l.] : UNDP, 2013. - p. 2.
Westerblom Julianna [Interview]. - Ouagadougou : [s.n.], May 9, 2014.
World Health Organization [Online] // World Health Organization. - n.d.. - June 16, 2014. -
http://www.google.se/url?sa=t&rct=j&q=&esrc=s&source=web&cd=7&cad=rja&uact=8&sqi
=2&ved=0CDcQFjAG&url=http%3A%2F%2Fwww.who.int%2Fwater_sanitation_health%2F
hygiene%2Femergencies%2Ffs3_4.pdf&ei=kq2QU6K4CMas0QWKoYCYCQ&usg=AFQjC
NFncgCH7c0iCvTbduFtSYBbMxdNuQ&bv. - p. 18.
World Health Organization Guidelines for Drinking-water Quality - fourth edition
[Report]. - [s.l.] : World Health Organization, 2011. - pp. 178, 196, 223, 225, 226, 230, 240,
241, 315, 316, 345. - ISBN 978 92 4 154815 1.
World Health Organization Rapid Assessment of Drinking-water Quality - a handbook for
implementation [Report] : Handbook. - [s.l.] : World Health Organization, 2012. - pp. 57, 60,
117. - ISBN 978 92 4 150468 3.
Zomodo Zoundou Adama [et al.] [Interview]. - Nakamtenga : [s.n.], May 3, 2014.

84
Appendix 1 - explanation of water quality factors pH is a measure of the concentration of hydrogen ions in the water sample. In other words, it
is a measure of how acidic the water is. A low pH value (below 7) means that the water is
acidified. A low pH value can originate from atmospheric deposits of pollution such as
sulphates and nitrates. Additionally, high precipitation, coarse soil, short circulation time for
the water and hard-weathered rock are possible causes for acidified water. Whereas if the rock
is easily weathered and contains a significant amount of HCO3- ions the water is less likely to
be acetic (Knutsson, et al., 2002).
The pH value can differ significantly through time, depending on factors such as groundwater
level. The groundwater level changes during the year depending on weather factors such as
rain and melting of snow. Acidified water can cause corrosion on water pipes. To prevent the
water from becoming acidified, a method is to add lime upstream the well or to add it directly
to the groundwater. (Knutsson, et al., 2002). pH is not listed in the WHO guidelines (World
Health Organization, 2011).
The electric conductivity shows the amount of dissolved ions (salts) in the water sample.
Dissolved ions are important for the wildlife since it controls osmosis. The conductivity also
affects how other chemical substances appear in the water (From, 2014). High conductivity
increases the rate of corrosion (Socialstyrelsen, 2006).
The hardness, i.e. the amount of calcium and magnesium in the water, can cause problems
regarding laundry. Furthermore, a low hardness can cause corrosion in the pipes. The
hardness varies a lot depending on the type of rock and soil. If the water hardness is low, for
example in areas with less limestone, the water can corrode the pipes. Another problem arises
in areas with more limestone and with mafic igneous rocks including the basalt, diabase and
the gabbro. In those areas it is necessary to add a lot of detergent to get the clothes clean. In
addition, magnesium and calcium can deposit in boilers (Knutsson, et al., 2002). Table 14
shows different amounts of calcium carbonate and the corresponding hardness levels.
There are no guidelines regarding health problems caused by different hardness levels. With a
minimum calcium ion concentration between 100 and 300 mg/l, the water starts to taste salty.
The concentration depends on the anion with which the calcium ion forms the salt. Above
calcium ion concentrations of about 200 mg/l different deposits occur in the distribution
pipes. Hardness is not the only factor causing deposits, though. Other factors such as pH also
affects whether or not deposits occur. On the other hand, with calcium ion concentrations of
less than 100 mg/l, the risk for corrosion in the distribution pipes increases (World Health
Organization, 2011).
Table 14. The concentration of CaCO3 and the corresponding hardness (Knutsson, et al., 2002).
Hardness mg CaCO3/l
Very soft 0-37.5
Soft 37.5-87.5
Medium hard 87.5-175
Hard 175-375
Very hard >375

85
Nitrate ions can be found in groundwater after deposits from the atmosphere. Moreover,
mineralization of organic nitrogen is a possible source of risen amounts. Fertilization, leakage
from sewage pipes and leakage from manure piles are other sources. Intense rain may cause
the fertilizers to leach below the depth of the plant roots. To prevent high amounts of nitrate it
is important to prevent surface water from leaking to the well. It is also important to place the
well upstream sources of contamination, for example agriculture, if it is possible (Knutsson, et
al., 2002).
The guideline value for nitrate is 50 mg/l. The value is based on illnesses for bottle-fed
babies. Therefore, the amount of nitrate in water drunk by adults and youth could be higher
(World Health Organization, 2011).
Phosphates are nutrients for plants and it is found in fertilizers, manure and in sewage water
(Socialstyrelsen, 2006). Furthermore, the quantity of phosphate ions depends on the local
geology (Livsmedelsverket, 2013). If phosphates end up in surface water, for example in
lakes, the lakes can bloom and become over-nourished. High amounts of phosphates can lead
to an increase in the amount of cyanobacteria, which can be poisonous to humans. To
decrease the risk of having cyanobacteria it is important not to have excess amounts of
fertilizers and manure near the water resource (World Health Organization, 2011). Phosphate
is not listed in the WHO guidelines, but if there is more than 0.6 mg/l there is a risk that the
water is contaminated (Livsmedelsverket, 2013).
Chloride ions in water have several possible origins. One is the precipitation. Salt from the
ocean simplifies the condensation of water. The ions also are soluble in water which causes
them to transport to the ground with the rain. This is called wet deposit. Salt can also deposit
on trees and other plants. When the rain falls the ions are dissolved and transported to the
ground (Knutsson, et al., 2002).
In areas located close to shore, high amounts of chloride can be caused by salt water intrusion.
This is not the case in Burkina Faso since it is landlocked. Other sources of chloride are
trapped water in deep fractures and anthropogenic sources. If the water use exceeds the water
formation in the well, or if the area has very limited groundwater resources, the salt water
from deep cracks can move upwards. The anthropogenic sources can be garbage deposits and
leakage from sewage pipes. High amounts of chloride can cause the water to taste like salt,
but can also cause corrosion in pipes. Pipe corrosion may cause metals to release into the
water (Knutsson, et al., 2002).
There are no health-based guidelines for chloride ions, but high concentrations cause the
water to taste like salt. When concentrations of potassium, sodium and calcium chloride
exceed 200 or 300 mg/l the salty taste will appear (World Health Organization, 2011).
Arsenic is naturally occurring in the rock and in the water. The concentration of arsenic in
groundwater is often less than 2 g/l. High amounts of arsenic can be measured near deposits
of volcanic rocks and sulfide minerals. Illnesses caused by arsenic ingestion are skin cancer,
bladder cancer and lung cancer. The health-based guideline value is 0.01 mg/l (World Health
Organization, 2011).
E. coli, or Escherichia coli, is bacteria that live in the intestines of animals and humans. It is
not dangerous when present in the intestines. If the bacteria somehow enter another part of the
body, for example when eating, it can generate serious illnesses, such as meningitis and
different types of infections. Infections can spread via eating or drinking contaminated food
and water, or via person to person (World Health Organization, 2011).
The temperature affects how well the bacteria are growing. High temperature causes an
increase in bacterial growth. Furthermore, high water temperature may worsen problems

86
concerning taste, smell and corrosion (World Health Organization, 2011). The temperature
was measured owing to the fact that it affects other factors such as pH and conductivity.
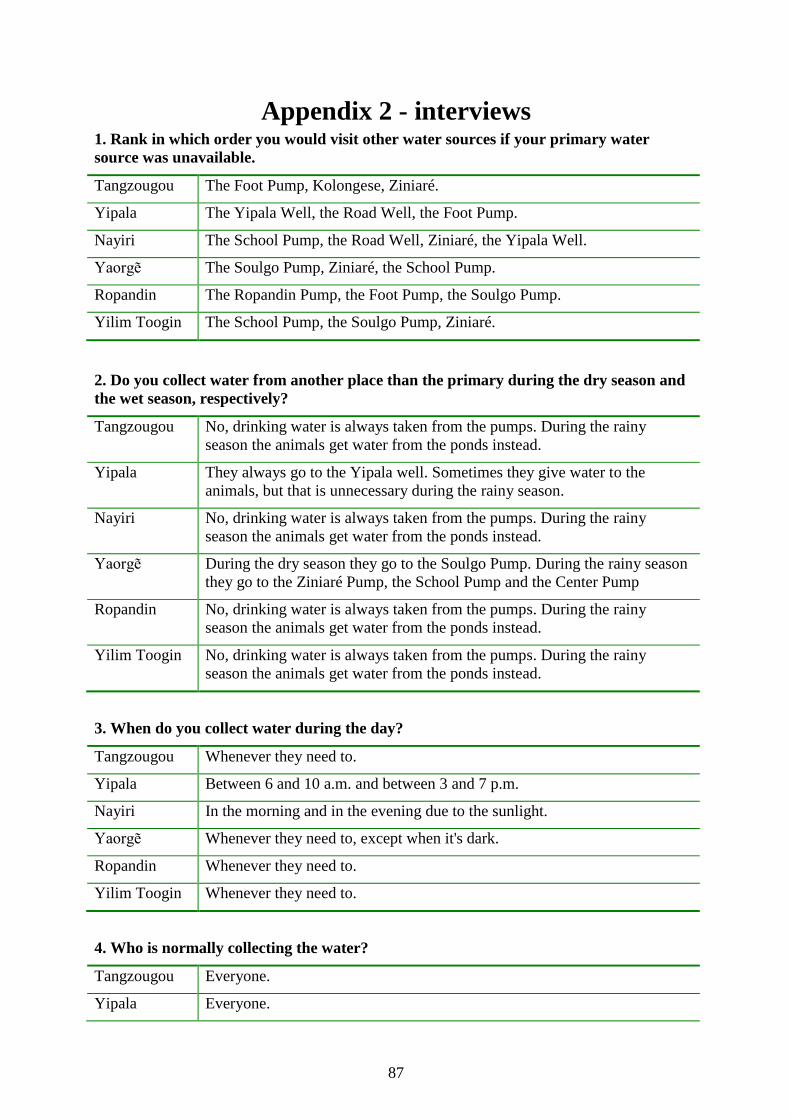
87
Appendix 2 - interviews 1. Rank in which order you would visit other water sources if your primary water
source was unavailable.
Tangzougou The Foot Pump, Kolongese, Ziniaré.
Yipala The Yipala Well, the Road Well, the Foot Pump.
Nayiri The School Pump, the Road Well, Ziniaré, the Yipala Well.
Yaorgẽ The Soulgo Pump, Ziniaré, the School Pump.
Ropandin The Ropandin Pump, the Foot Pump, the Soulgo Pump.
Yilim Toogin The School Pump, the Soulgo Pump, Ziniaré.
2. Do you collect water from another place than the primary during the dry season and
the wet season, respectively?
Tangzougou No, drinking water is always taken from the pumps. During the rainy
season the animals get water from the ponds instead.
Yipala They always go to the Yipala well. Sometimes they give water to the
animals, but that is unnecessary during the rainy season.
Nayiri No, drinking water is always taken from the pumps. During the rainy
season the animals get water from the ponds instead.
Yaorgẽ During the dry season they go to the Soulgo Pump. During the rainy season
they go to the Ziniaré Pump, the School Pump and the Center Pump
Ropandin No, drinking water is always taken from the pumps. During the rainy
season the animals get water from the ponds instead.
Yilim Toogin No, drinking water is always taken from the pumps. During the rainy
season the animals get water from the ponds instead.
3. When do you collect water during the day?
Tangzougou Whenever they need to.
Yipala Between 6 and 10 a.m. and between 3 and 7 p.m.
Nayiri In the morning and in the evening due to the sunlight.
Yaorgẽ Whenever they need to, except when it's dark.
Ropandin Whenever they need to.
Yilim Toogin Whenever they need to.
4. Who is normally collecting the water?
Tangzougou Everyone.
Yipala Everyone.

88
Nayiri Everyone, but the children did it this morning.
Yaorgẽ The women do a lot of work that includes having access to water.
Consequently, they often collect water. Men and children help when
needed.
Ropandin Everyone but mostly women.
Yilim Toogin The one who needs water collects it.
5. What do you do with the water when you come home?
Tangzougou Store in clay pots.
Yipala Store in clay pots.
Nayiri Store in clay pots. If the clay pots are broken they store in plastic
containers.
Yaorgẽ Store in clay pots.
Ropandin Store in covered clay pots or leave the containers in the houses.
Yilim Toogin Store in a clay pots and cover them.
6. What do you think about the water situation in general?
Tangzougou It's problematic. The pumps are often broken.
Yipala The amount of water is insufficient. In April/May there is a lack of water
which leads to that only three or four people can use the well.
Nayiri Problematic. We don’t have a pond and lack water. The school has
precedence to the School pump. There is always water in the Road well but
sometimes it ends at the Center well. In those cases you have to wait 1-2
hours before there is water again.
Yaorgẽ Look at all the dirty children! We have problems, the water is not even
enough for cleaning the children's clothes.
Ropandin The problem is that the pump breaks easily. In that case, we collect money.
It costs 25 000 CFA only to get the mender to come. The sum often ends up
being bigger.
Yilim Toogin Difficult because we lack water.
7. Does the water taste good? Is the water of good quality?
Tangzougou Yes
Yipala Yes
Nayiri Yes
Yaorgẽ No, it does not taste good. The water from their nearest forage (Soulgo) has
a salty flavour.
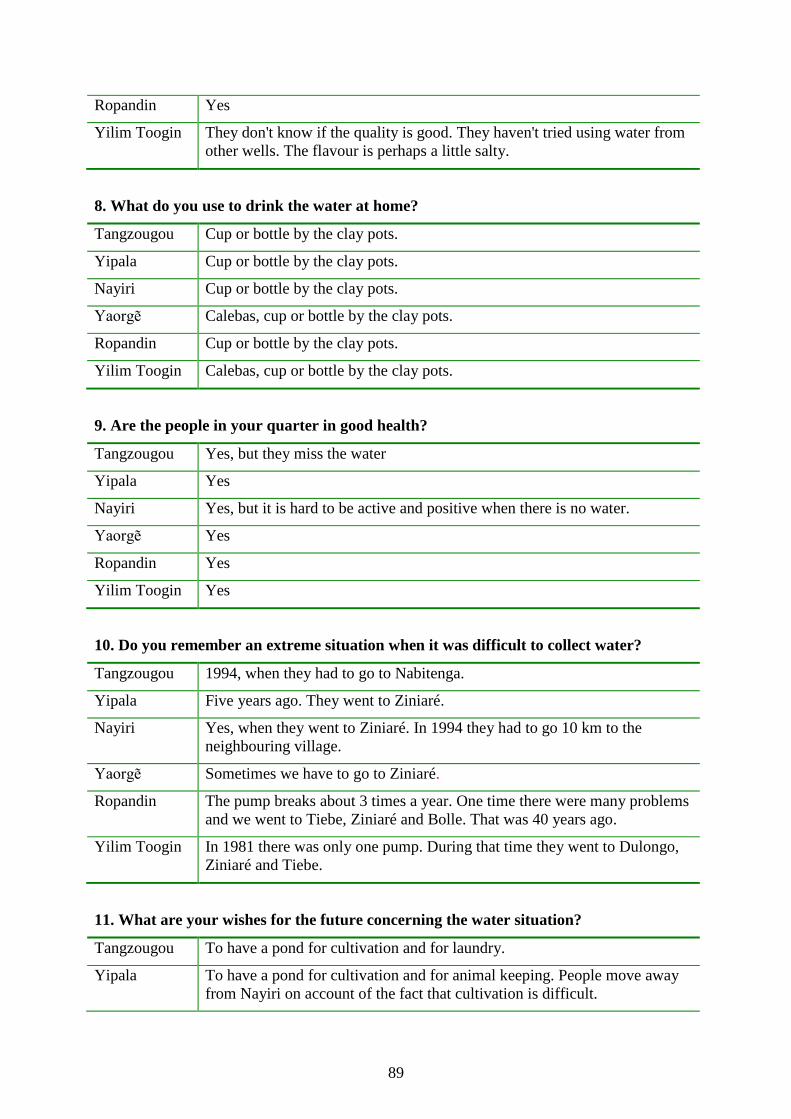
89
Ropandin Yes
Yilim Toogin They don't know if the quality is good. They haven't tried using water from
other wells. The flavour is perhaps a little salty.
8. What do you use to drink the water at home?
Tangzougou Cup or bottle by the clay pots.
Yipala Cup or bottle by the clay pots.
Nayiri Cup or bottle by the clay pots.
Yaorgẽ Calebas, cup or bottle by the clay pots.
Ropandin Cup or bottle by the clay pots.
Yilim Toogin Calebas, cup or bottle by the clay pots.
9. Are the people in your quarter in good health?
Tangzougou Yes, but they miss the water
Yipala Yes
Nayiri Yes, but it is hard to be active and positive when there is no water.
Yaorgẽ Yes
Ropandin Yes
Yilim Toogin Yes
10. Do you remember an extreme situation when it was difficult to collect water?
Tangzougou 1994, when they had to go to Nabitenga.
Yipala Five years ago. They went to Ziniaré.
Nayiri Yes, when they went to Ziniaré. In 1994 they had to go 10 km to the
neighbouring village.
Yaorgẽ Sometimes we have to go to Ziniaré.
Ropandin The pump breaks about 3 times a year. One time there were many problems
and we went to Tiebe, Ziniaré and Bolle. That was 40 years ago.
Yilim Toogin In 1981 there was only one pump. During that time they went to Dulongo,
Ziniaré and Tiebe.
11. What are your wishes for the future concerning the water situation?
Tangzougou To have a pond for cultivation and for laundry.
Yipala To have a pond for cultivation and for animal keeping. People move away
from Nayiri on account of the fact that cultivation is difficult.

90
Nayiri To have a pond for cultivation and for animal keeping.
Yaorgẽ To have a pond for cultivation and for animal keeping. They also want a
pump since they have been told that water is accessible in the ground next
to a certain tree in the area.
Ropandin To have a pond for cultivation and for animal keeping.
Yilim Toogin To have a pond for cultivation and for animal keeping.
12. What are your thoughts about the new water tap stations built by the state? Would
you prefer going there instead of going to the same well as you usually do?
Tangzougou It is a good idea. They want their own pump because they do not always
have money to buy water.
Yipala It is a good idea, but they will go to both their ordinary well and the new
pump station due to the fact that there might be queues at the pump station.
Nayiri It is a good idea, but they will go to both their ordinary well and the new
pump station due to the fact that there might be queues at the pump station.
Yaorgẽ It is a good idea but only as a complement. They prefer their ordinary pump
owing to the fact that it is free of charge. It is good that both options exist.
Ropandin A water tap run by the state is a good idea if we get it to our quarter. We
will use both our pump and the water tap. If we don’t have money we can
still go to the pump and if the pump is broken we can go to the water tap.
Yilim Toogin A good idea. We will both buy water and pump water ourselves. We don’t
have a well in Yilim Toogin so if we have to choose it doesn’t matter, we
only want water.
13. Is there any more information regarding the water situation that you would like to
share with us?
Tangzougou The pond dries out in December and they want to be able to cultivate more.
Yipala 3-4 ponds are wished for.
Nayiri The inhabitants are pleased that the authors are in Nakamtenga. They want
diguettes.
Yaorgẽ Wish that the authors work will give knowledge. Need a pond so that the
youth can get work. We can do more things if we have water, water is our
biggest issue. They wonder if the authors have contacts that can help them
improve the situation.
Ropandin They want a pond or a new drilled well.
Yilim Toogin They want a pond.
14. Do you have any information concerning your nearest well, for example when it was
built?

91
Tangzougou No
Yipala No
Nayiri No
Yaorgẽ The Soulgo pump is repaired 2-3 times a year. To finance this we gathered
money, each man paid 500 and each woman 300 CFA.
Ropandin It was constructed the September 24, 2005. Joseph Ilboudo might have
documents about it. The well never dries out.
Yilim Toogin It was constructed in 1991 (the School Pump). The well is 57 metres deep
and it has never dried out. The pump breaks approximately two times a
year.

92
Appendix 3 - interviewees Table 15. The interviewees
Yilim
Toogin
Tangzougou Yipala Nayiri Yaorgẽ Ropandin
Zomodo
Ablase
Zomodo
Issaka
Lenglege
Kadik
Sawadogo
Bibat
Compaoré
Yabizengo
Sawadogo
Azeta
Zongrana
Mamounata
Zomodo
Adama
Ouédraogo
Dieudonné
Ouédraogo
Hamidou
Birba Emile
Compaoré
Pierre
Birba
Mohamma
Compaoré
Pascal
Ouédraogo
Diena
Ouédraogo
Jean-Pierre
Ouédraogo
Leonard
Compaoré
Alain
Ouédraogo
Issa
Quasego
Bernadette
Bikinga
Alizette
Tiendrebeogo
Suzanne
Ouédraogo
Asan
Kabre
Rasmata
Sawadogo
Colette
Ouédraogo
Albertine
Compaoré
Pierre
Compaoré
Jean
Compaoré
Bernard
Compaoré
Benoa
Compaoré
Robert
Compaoré
Boukaré.
Compaoré
Patrice
Compaoré
Rodrige
Sabaramba
Naoli.
Ouédraogo
Marianne
Compaoré
Irene
Ilboudo
Adama
Ilboudo
Augustin
Compaoré
Etienne
Ilboudo
Tasere
Sawadogo
Mariane
Sawadogo
Sabine
Sawadogo
Marie
Ilboudo
Alexi
Ilboudo
Sofie
Tapsoba
Zonabo
Bilba
Tomas
Bilba Joel
Bilba
Ruben
Roamba
Zidoné
Sawadogo
Pauline
Bogma
Marie
Demsili
Samuel
Bilba
Francois
Kontebego
Abibo.
Compaoré
Salif
Ouédraogo
Salfo
Zongo
Boukaré
Ilboudo
Issa
Ouédraogo
Zidik
Ilboudo
Issa
Compaoré
Boukaré

93
Appendix 4 - inspection forms Inspection form (World Health Organization, 2012)
Well:
Date: 22 May 2014
Observers: Gustav Isaksson and Niklas Andersson
1. There is a latrine less than 10 m from the well
2. Sources of faecal contamination exists within the runoff area of the well
3. There are contamination sources (risk factors) closer than 50 m from the well
(agriculture, housing or roads).
4. The well is positioned on low altitude so that runoff water pools there
5. Drainage water collects within 2 m of the borehole due to insufficient
drainage
6. There is no drainage channel or the existing one is broken or needs to be
cleaned.
7. The well apron is smaller than 2 m in diameter.
8. There are cracks in the well apron.
9. There is no wall around the well or the existing one is broken or insufficient
10. Spill water pools in the apron area next to the pump alternatively the
parapet around the open well is lower than 70 cm
0-3 Low 4-6 Medium 7-10 High
Comments:

94
Motivation of the criteria
1. There is a latrine less than 10 m from the well.
A latrine is a source of faecal contamination which can cause diarrhea and other illnesses. If
the residence time is not long enough for the bacteria to die before the water reaches the well
it can be contaminated. With longer distance from the contamination source to the well, the
risk decreases. Runoff water can bring excrete to the well.
2. Sources of faecal contamination exist within the runoff area of the well.
Faecal contaminants can be flushed with the runoff water and reach the well.
3. There are contamination sources (risk factors) closer than 50 m from the well (agriculture,
housing or roads).
With short distance to the well, the risk is higher of contamination. 50 m corresponds to a
residence time of about 14 days when counting on a worst case scenario in Nakamtenga.
4. The well is positioned on low altitude so that runoff water pools there.
Runoff water brings with it all types of contaminants left in nature. In Burkina Faso there are
no garbage cans so a lot of garbage is discarded in the nature. Furthermore animal faeces can
end up in runoff water. When this water reaches the well it can contaminate the water.
Bacterial growth increase when water pools and the pools attract animals. Pools can also
contaminate containers and water fetching materials.
5. Drainage water collects within 2 m of the borehole due to insufficient drainage.
Attracts animals and increases the risk that contaminated water will flow back to the well.
6. There is no drainage channel or the existing one is broken or needs to be cleaned.
It becomes dirty close to the well. Spill water might flow back to the well more easily.
7. The well apron is smaller than 2 m in diameter.
Construction breaks easier and infiltration of spill water to the well might increase.
8. There are cracks in the well apron.
Contaminated water might reach the well.
9. There is no wall around the well or the existing one is broken or insufficient.
Animals can come close and break or contaminate the well and the containers. Animals close
to a well mean excrete close to the well.
10. Spill water pools in the apron area next to the pump alternatively the parapet around the
open well is lower than 70 cm.
The first criterion is for pumps and the second is for open wells. Spill water can flow back
into the well which might contaminate the well water. If the parapet is low the risk that
animals fall down is bigger. It is also easier for other contaminants to enter. A low parapet
promotes a technique of fetching water that makes ropes break and fall into the water.

95
Well: The Foot Pump
Date: 22 May 2014
Observers: Gustav Isaksson and Niklas Andersson
1. There is a latrine less than 10 m from the well
2. Sources of faecal contamination exists within the runoff area of the well
3. There are contamination sources (risk factors) closer than 50 m from the well
(agriculture, housing or roads).
4. The well is positioned on low altitude so that runoff water pools there
5. Drainage water collects within 2 m of the borehole due to insufficient
drainage
6. There is no drainage channel or the existing one is broken or needs to be
cleaned.
7. The well apron is smaller than 2 m in diameter.
8. There are cracks in the well apron.
9. There is no wall around the well or the existing one is broken or insufficient
10. Spill water pools in the apron area next to the pump alternatively the
parapet around the open well is lower than 70 cm
0-3 Low 4-6 Medium 7-10 High
Comments:

96
Well: The Ropandin Pump
Date: 22 May 2014
Observers: Gustav Isaksson and Niklas Andersson
1. There is a latrine less than 10 m from the well
2. Sources of faecal contamination exists within the runoff area of the well
3. There are contamination sources (risk factors) closer than 50 m from the well
(agriculture, housing or roads).
4. The well is positioned on low altitude so that runoff water pools there
5. Drainage water collects within 2 m of the borehole due to insufficient
drainage
6. There is no drainage channel or the existing one is broken or needs to be
cleaned.
7. The well apron is smaller than 2 m in diameter.
8. There are cracks in the well apron.
9. There is no wall around the well or the existing one is broken or insufficient
10. Spill water pools in the apron area next to the pump alternatively the
parapet around the open well is lower than 70 cm
0-3 Low 4-6 Medium 7-10 High
Comments:

97
Well: The Soulgo Pump
Date: 22 May 2014
Observers: Gustav Isaksson and Niklas Andersson
1. There is a latrine less than 10 m from the well
2. Sources of faecal contamination exists within the runoff area of the well
3. There are contamination sources (risk factors) closer than 50 m from the well
(agriculture, housing or roads).
4. The well is positioned on low altitude so that runoff water pools there
5. Drainage water collects within 2 m of the borehole due to insufficient
drainage
6. There is no drainage channel or the existing one is broken or needs to be
cleaned.
7. The well apron is smaller than 2 m in diameter.
8. There are cracks in the well apron.
9. There is no wall around the well or the existing one is broken or insufficient
10. Spill water pools in the apron area next to the pump alternatively the
parapet around the open well is lower than 70 cm
0-3 Low 4-6 Medium 7-10 High
Comments:

98
Well: The School Pump
Date: 22 May 2014
Observers: Gustav Isaksson and Niklas Andersson
1. There is a latrine less than 10 m from the well
2. Sources of faecal contamination exists within the runoff area of the well
3. There are contamination sources (risk factors) closer than 50 m from the well
(agriculture, housing or roads).
4. The well is positioned on low altitude so that runoff water pools there
5. Drainage water collects within 2 m of the borehole due to insufficient
drainage
6. There is no drainage channel or the existing one is broken or needs to be
cleaned.
7. The well apron is smaller than 2 m in diameter.
8. There are cracks in the well apron.
9. There is no wall around the well or the existing one is broken or insufficient
10. Spill water pools in the apron area next to the pump alternatively the
parapet around the open well is lower than 70 cm
0-3 Low 4-6 Medium 7-10 High
Comments:

99
Well: The Center Pump
Date: 22 May 2014
Observers: Gustav Isaksson and Niklas Andersson
1. There is a latrine less than 10 m from the well
2. Sources of faecal contamination exists within the runoff area of the well
3. There are contamination sources (risk factors) closer than 50 m from the well
(agriculture, housing or roads).
4. The well is positioned on low altitude so that runoff water pools there
5. Drainage water collects within 2 m of the borehole due to insufficient
drainage
6. There is no drainage channel or the existing one is broken or needs to be
cleaned.
7. The well apron is smaller than 2 m in diameter.
8. There are cracks in the well apron.
9. There is no wall around the well or the existing one is broken or insufficient
10. Spill water pools in the apron area next to the pump alternatively the
parapet around the open well is lower than 70 cm
0-3 Low 4-6 Medium 7-10 High
Comments:

100
Well: The Yipala Well
Date: 22 May 2014
Observers: Gustav Isaksson and Niklas Andersson
1. There is a latrine less than 10 m from the well
2. Sources of faecal contamination exists within the runoff area of the well
3. There are contamination sources (risk factors) closer than 50 m from the well
(agriculture, housing or roads).
4. The well is positioned on low altitude so that runoff water pools there
5. Drainage water collects within 2 m of the borehole due to insufficient
drainage
6. There is no drainage channel or the existing one is broken or needs to be
cleaned.
7. The well apron is smaller than 2 m in diameter.
8. There are cracks in the well apron.
9. There is no wall around the well or the existing one is broken or insufficient
10. Spill water pools in the apron area next to the pump alternatively the
parapet around the open well is lower than 70 cm
0-3 Low 4-6 Medium 7-10 High
Comments:

101
Well: The Road Well
Date: 22 May 2014
Observers: Gustav Isaksson and Niklas Andersson
1. There is a latrine less than 10 m from the well
2. Sources of faecal contamination exists within the runoff area of the well
3. There are contamination sources (risk factors) closer than 50 m from the well
(agriculture, housing or roads).
4. The well is positioned on low altitude so that runoff water pools there
5. Drainage water collects within 2 m of the borehole due to insufficient
drainage
6. There is no drainage channel or the existing one is broken or needs to be
cleaned.
7. The well apron is smaller than 2 m in diameter.
8. There are cracks in the well apron.
9. There is no wall around the well or the existing one is broken or insufficient
10. Spill water pools in the apron area next to the pump alternatively the
parapet around the open well is lower than 70 cm
0-3 Low 4-6 Medium 7-10 High
Comments:

102
Well: The Yaorgẽ Pump
Date: 22 May 2014
Observers: Gustav Isaksson and Niklas Andersson
1. There is a latrine less than 10 m from the well
2. Sources of faecal contamination exists within the runoff area of the well
3. There are contamination sources (risk factors) closer than 50 m from the well
(agriculture, housing or roads).
4. The well is positioned on low altitude so that runoff water pools there
5. Drainage water collects within 2 m of the borehole due to insufficient
drainage
6. There is no drainage channel or the existing one is broken or needs to be
cleaned.
7. The well apron is smaller than 2 m in diameter.
8. There are cracks in the well apron.
9. There is no wall around the well or the existing one is broken or insufficient
10. Spill water pools in the apron area next to the pump alternatively the
parapet around the open well is lower than 70 cm
0-3 Low 4-6 Medium 7-10 High
Comments:

103
Well: The Park Pump
Date: 22 May 2014
Observers: Gustav Isaksson and Niklas Andersson
1. There is a latrine less than 10 m from the well
2. Sources of faecal contamination exists within the runoff area of the well
3. There are contamination sources (risk factors) closer than 50 m from the well
(agriculture, housing or roads).
4. The well is positioned on low altitude so that runoff water pools there
5. Drainage water collects within 2 m of the borehole due to insufficient
drainage
6. There is no drainage channel or the existing one is broken or needs to be
cleaned.
7. The well apron is smaller than 2 m in diameter.
8. There are cracks in the well apron.
9. There is no wall around the well or the existing one is broken or insufficient
10. Spill water pools in the apron area next to the pump alternatively the
parapet around the open well is lower than 70 cm
0-3 Low 4-6 Medium 7-10 High
Comments:

104
Appendix 5 - taps run by the state
Figure 71. The first water tap run by the
state Figure 72. The second water tap run by the
state
Figure 73. Close-up of a water tap

105
Appendix 6 - examples of construction
Figure 77. Drainage channel in need of
cleaning at the Soulgo Pump
Figure 75. Insufficient drainage
channel at the Soulgo Pump
Figure 79. A broken wall by the Foot Pump
Figure 74. The broken drainage channel at
the Foot Pump (1)
Figure 78. The broken drainage channel at
the Foot Pump (2)
Figure 76. Well-constructed drainage
channel at the Ropandin Pump

106
Appendix 7 - test kits and analysis limits 3M™ Petrifilm™ E.coli/Coliform Count Plates (3M)
Compact Dry EC (Hyserve)
HI 98312 DiST®6 EC/TDS/Temperature Tester high range measurement (Hanna
Instruments)
HI 98128 pHep®5 pH/Temperature Tester 0.01 pH resolution (Hanna Instruments)
HI 3812 Hardness Test Kit (Hanna Instruments)
HI 3815 Chloride Test Kit (Hanna Instruments)
HI 3874 Nitrate Test Kit (Hanna Instruments)
HI 713 Checker®HC Handheld Colorimeter - Phosphate Low Range (Hanna
Instruments)
EZ Arsenic High Range Test Kit (Hach)
Analysis limits
Hardness: Values below 30 mg/l were not detectable.
Nitrate: Values below 44.3 mg/l were not detectable.
Chloride: Values below 30 mg/l were not detectable.
Arsenic: Values below 0.01 mg/l were not detectable.