water resources research in northwest china - springer978-94-017-8017-9/1.pdf · jianhua xu the...
TRANSCRIPT

Water Resources Research in Northwest China

Yaning ChenEditor
Water Resources Research in Northwest China
1 3

ISBN 978-94-017-8016-2 ISBN 978-94-017-8017-9 (eBook)DOI 10.1007/978-94-017-8017-9Springer Dordrecht Heidelberg New York London
Library of Congress Control Number: 2014930889
© Springer Science+Business Media Dordrecht 2014This work is subject to copyright. All rights are reserved by the Publisher, whether the whole or part of the material is concerned, specifically the rights of translation, reprinting, reuse of illustrations, recitation, broadcasting, reproduction on microfilms or in any other physical way, and transmission or information storage and retrieval, electronic adaptation, computer software, or by similar or dissimilar methodology now known or hereafter developed. Exempted from this legal reservation are brief excerpts in connection with reviews or scholarly analysis or material supplied specifically for the purpose of being entered and executed on a computer system, for exclusive use by the purchaser of the work. Duplication of this publication or parts thereof is permitted only under the provisions of the Copyright Law of the Publisher’s location, in its current version, and permission for use must always be obtained from Springer. Permissions for use may be obtained through RightsLink at the Copyright Clearance Center. Violations are liable to prosecution under the respective Copyright Law.The use of general descriptive names, registered names, trademarks, service marks, etc. in this publication does not imply, even in the absence of a specific statement, that such names are exempt from the relevant protective laws and regulations and therefore free for general use.While the advice and information in this book are believed to be true and accurate at the date of publication, neither the authors nor the editors nor the publisher can accept any legal responsibility for any errors or omissions that may be made. The publisher makes no warranty, express or implied, with respect to the material contained herein.
Printed on acid-free paper
Springer is part of Springer Science+Business Media (www.springer.com)
EditorYaning ChenXinjiang Institute of Ecology and GeographyChinese Academy of SciencesXinjiangPeople’s Republic of China

v
Preface
With the increasing concern of global environmental and ecological degradation, there has been an urgent need to investigate the related water cycle changes. De-signed for both academic and business sectors, this book examines the major issues in water resources research in Northwest China, approximately one fourth of the nation’s entire land area and one of the world’s largest arid regions. The arid region of Northwest China is characterized by its extremely vulnerable water resources and associated ecological environment. The large alpine snow and ice cover has contributed to the development of numerous inland streams, forming a unique land-scape characterized by mountain-oasis-desert ecosystems. Water, largely originated from the mountain areas, has been a most critical factor to drive the energy and mass circulation in this region, which responds sensitively to the global climate change. This book focuses on some possible impacts of climate change on hydrol-ogy and water resources in the arid region of Northwest China. The contributing authors for this book include Yaning Chen, Weihong Li, Zongxue Xu, Zhongqin Li, Jianhua Xu, Xianwei Wang, Yanjun Shen, Zhi Li and Huaijun Wang, all of whom are active researchers in water resources research in arid and cold environments.
This book comprises 11 chapters discussing various aspects in water resources research. Specifically, the book begins with an introductory chapter (Chap. 1) dis-cussing the physical geography and socioeconomic aspects in Northwest China. Chaps. 2-7 discuss the climate system and hydrologic system changes, some im-plications of these changes in relation to potential evapotranspiration, the hydro-logical cycle, and the spatiotemporal variations of the snow cover and glaciers through remote sensing, geographic information systems, and statistical analysis. Chaps. 8 and 9 focus on the model description and experimental design to interpret the hydro-climatic process, emphasizing the integration of water, climate, and land ecosystems through field observations and computer-based simulations. Chaps. 10 examines some extreme hydrological events and presents a study using the histori-cal trend method to investigate the spatial and temporal variability of changing tem-perature and precipitation extremes in the hyper-arid region of Northwest China. And the Chap. 11 of this book discusses some possible strategies for sustainable watershed management. We believe that the lessons from this study area can be useful for other arid areas in the world.

vi Preface
The research reported in this book has been supported by the National Basic Research Program of China (973 Program: 2010CB951003). The Editor is grateful to all of those who contributed papers and revised their papers one or more times and those who reviewed papers according to our requests and timelines. The book project would not have been completed without the help and assistance from several staff members at Springer, especially Margaret Deignan and Takeesha Moerland-Torpey. Acknowledges are due to Dr. Xiaojun Yang for his help in many ways.
Urumqi, Xingjiang, China Yaning Chen15 July 2013
vii
Contents
1 Exordium .................................................................................................. 1Yaning Chen
2 Climate System in Northwest China ...................................................... 51Yaning Chen, Baofu Li and Changchun Xu
3 Hydrologic System in Northwest China ................................................. 109Yaning Chen, Baofu Li, Zhongsheng Chen and Yuting Fan
4 Response of Runoff to Climate Change ................................................. 145Yaning Chen, Zhongsheng Chen, Baofu Li and Qihu Li
5 Glacier Change and Its Impact on Water Resources ............................ 193Zhongqin Li, Meiping Sun and Puyu Wang
6 Spatiotemporal Variation of Snow Cover from Space in Northern Xinjiang .................................................................................... 247Xianwei Wang, Hongjie Xie and Tiangang Liang
7 Change of Potential Evapotranspiration and Its Implications to Water Cycle .......................................................................................... 267Zhi Li, Yanjun Shen, Yaning Chen and Weihong Li
8 The Nonlinear Hydro-climatic Process: A Case Study of the Tarim Headwaters, NW China ..................................................... 289Jianhua Xu, Yaning Chen and Weihong Li
9 Climate Change Scenarios and the Impact on Runoff ......................... 311Zhaofei Liu and Zongxue Xu

viii Contents
10 Changes in Extreme Hydrological Events ............................................. 359Huaijun Wang, Yaning Chen and Guili Sun
11 Water Resource Management ................................................................. 405Yaning Chen, Yanjun Shen and Weihong Li
Index ................................................................................................................ 441
ix
Contributors
Yaning Chen State Key Laboratory of Desert and Oasis Ecology, Xinjiang Institute of Ecology and Geography, Chinese Academy of Sciences, Urumqi, Xinjiang, China
Zhongsheng Chen State Key Laboratory of Desert and Oasis Ecology, Xinjiang Institute of Ecology and Geography, Chinese Academy of Sciences, Urumqi, Xinjiang, China
Yuting Fan State Key Laboratory of Desert and Oasis Ecology, Xinjiang Institute of Ecology and Geography, Chinese Academy of Sciences, Urumqi, Xinjiang, China
Baofu Li State Key Laboratory of Desert and Oasis Ecology, Xinjiang Institute of Ecology and Geography, Chinese Academy of Sciences, Urumqi, Xinjiang, China
Qihu Li College of Geomatics, Xi’an University of Science and Technology, Xi’an, China
Weihong Li State Key Laboratory of Desert and Oasis Ecology, Xinjiang Institute of Ecology and Geography, Chinese Academy of Sciences, Urumqi, Xinjiang, China
Zhi Li State Key Laboratory of Desert and Oasis Ecology, Xinjiang Institute of Ecology and Geography, Chinese Academy of Sciences, Urumqi, China
Zhongqin Li State Key Laboratory of Cryospheric Sciences/Tianshan Glaciological Station, Cold and Arid Regions Environmental and Engineering Research Institute, Chinese Academy of Sciences, Lanzhou, China
Tiangang Liang College of Pastoral Agriculture Science and Technology, Lanzhou University, Lanzhou, China
Zhaofei Liu Institute of Geographic Sciences and Natural Resources Research, Chinese Academy of Sciences, Beijing, China
Key Laboratory of Water and Sediment Sciences, Ministry of Education, College of Water Sciences, Beijing Normal University, Beijing, China
Yanjun Shen Key Laboratory of Agricultural Water Resources, Center for Agricultural Resources Research, Chinese Academy of Sciences, Shijiazhuang, China
x Contributors
Guili Sun College of Forestry and Horticulture, Xinjiang Agricultural University, Urumqi, China
Meiping Sun College of Geography and Environment Sciences, Northwest Normal University, Lanzhou, China
Huaijun Wang State Key Laboratory of Desert and Oasis Ecology, Xinjiang Institute of Ecology and Geography, Chinese Academy of Sciences, Urumqi, China
Puyu Wang State Key Laboratory of Cryospheric Sciences/Tianshan Glaciological Station, Cold and Arid Regions Environmental and Engineering Research Institute, Chinese Academy of Sciences, Lanzhou, China
Xianwei Wang Center of Integrated Geographic Information Analysis, School of Geography and Planning, and Guangdong Key Laboratory for Urbanization and Geo-simulation, Sun Yat-sen University, Guangzhou, China
Hongjie Xie Laboratory for Remote Sensing and Geoinformatics, Department of Geological Science, University of Texas at San Antonio, San Antonio, TX, USA
Changchun Xu Key Laboratory of Oasis Ecology, School of Resources and Environmental Science, Xinjiang University, Urumqi, China
Jianhua Xu The Research Center for East-West Cooperation in China, The Key Lab of GIScience of the Education Ministry PRC, East China Normal University, Shanghai, China
Zongxue Xu Key Laboratory of Water and Sediment Sciences, Ministry of Education, College of Water Sciences, Beijing Normal University, Beijing, China
xi
List of Figures
Fig. 1.1 The geomorphologic setting and zoning of the arid region in Northwestern China .......................................................................... 2
Fig. 1.2 Annual precipitation contour map for the arid Northwest region ..... 9
Fig. 2.1 Trends in temperature during 1960–2010 ......................................... 59Fig. 2.2 Time series of temperature and its linear trend in ANC from
1960 to 2010...................................................................................... 60Fig. 2.3 The temperature trends at the meteorological stations in the three
landscapes for the period 1960–2010 ................................................ 60Fig. 2.4 The temperature trends in different landscapes for period
a1960–1989 and b 1990–2010 .......................................................... 61Fig. 2.5 Time series of temperature of snowmelt period and its linear
trend for a entire northwest China, b southern Tianshan Mountains, c northern Kunlun Mountains, and d northern Qilian Mountains from 1960 to 2010 ........................................................... 62
Fig. 2.6 The date of maxima daily temperature (9 day moving mean) in every decade over Aksu River and Yarkand River ............................ 63
Fig. 2.7 The weather and hydrological stations of rivers in the arid region of northwest China ............................................................................ 64
Fig. 2.8 Temperature anomalies trends in typical river areas in the arid region of Northwest China ................................................................ 65
Fig. 2.9 Seasonal temperature trends in the arid region of Northwest China ................................................................................................. 67
Fig. 2.10 Temperature trends by decade in the arid region of northwest China ................................................................................................. 69
Fig. 2.11 Distribution of Mann–Kendall trends of air temperature: a annual, b spring, c summer, d autumn, e winter ............................ 71
Fig. 2.12 Regional trends of air temperature at basin scale: a annual, b spring, c summer, d autumn, e winter ............................................ 72
Fig. 2.13 a Minimum temperature distribution and b trend variation Z in the arid region of Northwest China ................................................... 72
Fig. 2.14 a Maximum temperature distribution and b trend variation Z in the arid region of Northwest China ................................................... 73

xii List of Figures
Fig. 2.15 Relationship between the trends in temperature and elevation, latitude and longitude ........................................................................ 73
Fig. 2.16 Cumulative sum (CUSUM) charts for annual and seasonal air temperature ........................................................................................ 75
Fig. 2.17 Temperature step changes in a mountains, b oasis, c desert landscapes ......................................................................................... 76
Fig. 2.18 The seasonal importance of temperature changes in different periods (1981–2010, 1984–1995) ..................................................... 77
Fig. 2.19 The Siberian High Intensity and the winter temperature in the arid region of northwest China .......................................................... 78
Fig. 2.20 The winter temperature in the arid region of northwest China and the yearly carbon dioxide emission in China .................................... 79
Fig. 2.21 Relationships between proportional changes of a annual Siberian High Index (SHI), CDE and winter temperature for the arid region of northwest China, b relationships between proportional changes of CDE and annual temperature for the arid region of northwest China ................................................................................ 79
Fig. 2.22 Wavelet time-frequency distribution ( left) and variance ( right) of temperature in the four headstreams of Tarim river basin a Aksu River, b Yarkant River, c Hotan River, d Kaidu River ..................... 82
Fig. 2.23 Relations between simulated and measured values of temperature ........................................................................................ 84
Fig. 2.24 Temperature variations in each river area in different periods .......... 84Fig. 2.25 Trends in precipitation during 1960–2010 ........................................ 86Fig. 2.26 The precipitation trend of each meteorological station during the
period 1960 to 2010 .......................................................................... 86Fig. 2.27 The precipitation trend of each the meteorological station during
the periods a 1960–1986, and b 1987–2010 ..................................... 87Fig. 2.28 Time series of precipitation of the snowmelt period and its
linear trend for a entire northwest China, b southern Tianshan Mountains, c northern Kunlun Mountains, d northern Qilian Mountains.......................................................................................... 88
Fig. 2.29 Precipitation anomalies trends in typical river areas of the arid region of Northwest China ................................................................ 89
Fig. 2.30 Precipitation changes of each river in different periods in the arid region of China .................................................................................. 90
Fig. 2.31 Seasonal precipitation trends (1960–2010) in the arid region of northwest China ................................................................................ 92
Fig. 2.32 Precipitation trends (1960–2010) in different decades in the arid region of northwest China ................................................................. 94
Fig. 2.33 Distribution of Mann–Kendall trends of annual and seasonal precipitation, a annual, b spring, c summer, d autumn, e winter ...... 96
Fig. 2.34 Regional trends of precipitation at basin scale a annual, b spring, c summer, d autumn, e winter ........................................................... 97
xiiiList of Figures
Fig. 2.35 a Relationships between the trends in precipitation and elevation, b latitude, c longitude ������������������������������������������������������������������������ 97
Fig. 2.36 Cumulative sum (CUSUM) charts for annual and seasonal precipitation �������������������������������������������������������������������������������������� 98
Fig. 2.37 Step change of precipitation in a mountains, b oasis, c desert areas �������������������������������������������������������������������������������������������������� 99
Fig. 2.38 Wavelet time-frequency distribution ( left) and variance ( right) of precipitation in the four headstreams of the Tarim River Basin a Aksu River; b Yarkant River; c Hotan River; d Kaidu River �������� 101
Fig. 2.39 Relations between simulated and measured values of precipitation �������������������������������������������������������������������������������������� 102
Fig. 2.40 Runoff variations of each river in different periods in the arid region ������������������������������������������������������������������������������������������������ 102
Fig. 2.41 Reconstructed a AMT of Jinghe, b ANP at Wusu in northern Xinjiang ��������������������������������������������������������������������������������������������� 104
Fig. 3.1 a Distribution of meteorological station and hydrological station; b hydrological basin and drainage basin ������������������������������������������� 112
Fig. 3.2 Spatial distribution of annual trends for runoff ��������������������������������� 114Fig. 3.3 The hydrological stations of rivers in the arid region of
northwest China �������������������������������������������������������������������������������� 115Fig. 3.4 Runoff anomalies trends in typical river areas of the arid region
of northwest China (Li et al� 2012) ��������������������������������������������������� 116Fig. 3.5 Runoff variations of each river in different periods (before
1990 and after 1990) in the arid region of northwest China (Li et al� 2012) ����������������������������������������������������������������������������������� 117
Fig. 3.6 The changes of runoff (m3/s) in Aksu river (a), Kaidu river (b), Yarkand river (c), and Hotan river (d) in Xinjiang ��������������������������� 117
Fig. 3.7 The wavelet approximations for annual runoff in the Hotan River at different time scales� a The diagram of lnC(r) versus ln(r)� b The correlation exponent ( d) versus embedding dimension ( m) ��� 118
Fig. 3.8 Step change point of runoff in Aksu river (a), Kaidu river (b), Yarkand river (c), and Hotan river (d) ���������������������������������������������� 120
Fig. 3.9 The time-frequency distribution of wavelet coefficient and variance for temperature, precipitation and runoff in Aksu River, respectively (form top to bottom) ������������������������������������������������������ 121
Fig. 3.10 The time-frequency distribution of wavelet coefficient and variance for temperature, precipitation and runoff in Yarkand River, respectively (form top to bottom) ������������������������������������������� 122
Fig. 3.11 The time-frequency distribution of wavelet coefficient and variance for temperature, precipitation and runoff in Hotan River, respectively (form top to bottom) ������������������������������������������� 124
Fig. 3.12 The time-frequency distribution of wavelet coefficient and variance for temperature, precipitation and runoff in Kaidu River, respectively (form top to bottom) ������������������������������������������� 125

xiv List of Figures
Fig. 3.13 Variation of annual baseflow and baseflow index for the four headstreams of the Tarim River� a Aksu River� b Hotan River� c Yakand River� d Kaidu River ��������������������������������������������������������� 130
Fig. 3.14 Baseflow separation at the four headstreams of the Tarim River for typical dry and wet years� a1 Aksu River in a dry year 1986 with SBFI = 12�7 %� a2 Aksu River in a wet year 1996 with SBFI = 12�5 %� b1 Hotan River in a dry year 1985 with annual SBFI = 8�0 %� b2 Hotan River in a wet year 1987 with SBFI = 10�8 %� c1 Yakand River in a dry year 1978 with SBFI = 13�0 %� c2 Yakand River in a wet year 2007 with SBFI = 21�5 %� d1 Kaidu River in a dry year 1980 with SBFI = 30�0 %� d2 Kaidu River in a wet year 1981 with SBFI = 37�0 % ������������������������������������������������������������������������������������ 131
Fig. 3.15 Location map of the Tizinafu River and water sampling locations referred to in this paper ��������������������������������������������������������������������� 132
Fig. 3.16 Projections of Akesu river annual runoff and climate factor of wavelet coefficients in Aksu river (a), Yarkand River (b), Hotan River (c), and Kaidu river (d) ����������������������������������������������������������� 136
Fig. 3.17 The typical river runoff variation under different scenarios ������������� 138Fig. 3.18 The change trends of annual mean temperature and annual
precipitation in the Kaidukongque River Basin under different scenarios �������������������������������������������������������������������������������������������� 140
Fig. 4.1 Correlation between a annual runoff and precipitation, and b annual runoff and temperature at basin scale ��������������������������������� 147
Fig. 4.2 The temperature departure of Aksu River (a), Yarkand River (b), Hotan River (c), Kaidu River (d), Shule River (e), and Shiyang River (f) ��������������������������������������������������������������������������������������������� 148
Fig. 4.3 The precipitation departure percentage of Aksu River (a), Yarkand River (b), Hotan River (c), Kaidu River (d), Shule River (e), and Shiyang River (f) �������������������������������������������������������� 149
Fig. 4.4 The runoff departure of Aksu River (a), Yarkand River (b), Hotan River (c), Kaidu River (d), Shule River (e), and Shiyang River (f) ��������������������������������������������������������������������������������������������� 150
Fig. 4.5 The cycle of (a1, b1, c1, d1, e1, f1) precipitation, (a2, b2, c2, d2, e2, f2) temperature and (a3, b3, c3, d3, e3, f3) runoff� a Aksu River� b Yarkand River� c Hotan River� d Kaidu River� e Shule River� f Heihe River� g Shiyang River ����������������������������������������������� 153
Fig. 4.6 Linear fitting of streamflow and precipitation (a1, b1, c1, d1, e1, f1), temperature (a2, b2, c2, d2, e2, f2) of the Aksu River Basin ���� 155
Fig. 4.7 The change trend of the streamflow of the Yarkand River and Hotan River under different time scales�������������������������������������������� 157
Fig. 4.8 Snow percentage in Tarim River Baisn, south slope of Tianshan and north slope of Kunlun Mountains ����������������������������������������������� 165
Fig. 4.9 Relationship between precipitation, snow cover and runoff in Aksu River ���������������������������������������������������������������������������������������� 166

xvList of Figures
Fig. 4.10 Time series of precipitation, snow cover (above 4,200 m) and runoff in Aksu River�������������������������������������������������������������������������� 167
Fig. 4.11 The distribution of meteorological and hydrological stations in the ARNC ������������������������������������������������������������������������������������������ 169
Fig. 4.12 Changes of the summer FLH for many years in four typical regions ����������������������������������������������������������������������������������������������� 171
Fig. 4.13 Summer runoff changes for many years in four typical regions ������� 172Fig. 4.14 The linear regression between the summer runoff and FLH in
four typical regions ��������������������������������������������������������������������������� 174Fig. 4.15 The elastic coefficient and proportion of glacial meltwater runoff
in four typical regions ����������������������������������������������������������������������� 176Fig. 4.16 Runoff before and after step changes in some typical rivers�
a Aksu River� b Kaidu River� c Shule River� d Heihe River ������������� 181Fig. 4.17 a The relationship between cumulative precipitation and
cumulative runoff, b the measured runoff and simulation runoff change during 1994–2010 ����������������������������������������������������������������� 184
Fig. 4.18 Relationships between proportional changes of precipitation and runoff in Kaidu River ������������������������������������������������������������������������ 185
Fig. 4.19 Sensitivity coefficients of annual runoff to the temperature ������������� 186Fig. 4.20 Sensitivity coefficients of annual runoff to the precipitation and
the change rates of annual runoff caused by the precipitation ���������� 187
Fig. 5.1 Map of Urumqi River source region, showing locations of Urumqi Glacier No�1, hydrological and meteorological stations ����� 196
Fig. 5.2 Annual average air temperature and precipitation and their fitting curves for 1959–2008 ������������������������������������������������������������������������ 201
Fig. 5.3 Terminus retreat distance history since 1962 based on directly field measurements ��������������������������������������������������������������������������� 203
Fig. 5.4 a Annual cumulative mass balance and b annual equilibrium line altitude of Urumqi Glacier No�1 during 1959–2008 ������������������������� 204
Fig. 5.5 Interannual changes of glacier runoff, glacier storage, precipitation and evaporation of Urumqi Glacier No�1 from1959 to 2008 ����������������������������������������������������������������������������������������������� 205
Fig. 5.6 Interannual change of glacier runoff and discharge at Glacier No�1 gauging station and the glacier runoff contribution to river discharge during 1959–2008 ������������������������������������������������������������� 206
Fig. 5.7 Monthly distribution of a average air temperature, precipitation and b discharges of Glacier No�1 and Empty Cirque gauging stations over the period 1959–2008 �������������������������������������������������� 207
Fig. 5.8 Fitting charts between a discharge of Glacier No�1 gauging station and air temperature b discharge of Empty Cirque gauging station and precipitation �������������������������������������������������������������������� 207
Fig. 5.9 Time series of modeled and observed discharge for a Glacier No�1 and b Zongkong and gauging stations, of which the daily discharge at the two stations are listed from May to September each year �������������������������������������������������������������������������������������������� 210

xvi List of Figures
Fig. 5.10 Histogram of the residual of a temperature and b precipitation ....... 211Fig. 5.11 Variations of a, b temperature and c, d precipitation derived
from downscaling from RegCM3 under SRES A1B scenario for 2041–2060 relative to 2000–2008 ..................................................... 212
Fig. 5.12 Annual discharge cycle of a Glacier No.1 and b Zongkong catchments simulated by HBV for current climate (2000–2008) and future climate (2041–2060) for three stages of glaciations ........ 213
Fig. 5.13 Spatial characteristics of glacier variations in Xinjiang, North Western China ................................................................................... 221
Fig. 5.14 Sketch map showing the study area and distribution of glaciers ...... 229Fig. 5.15 Example of the glacier outlines extraction from ASTER images
and topographic maps. Red glacier outlines are of 2003 and blue outlines of 1956 ................................................................................. 231
Fig. 5.16 Distribution of glacial number and area with different aspects in 2003/2004.......................................................................................... 232
Fig. 5.17 Glacier area, number and area loss by glacier size class for 1956–2003 in the middle Qilian Mountain Region, including the Heihe River Basin and the Beidahe River Basin .............................. 233
Fig. 5.18 Relative changes in glacier area of different sizes in the middle Qilian Mountain Region from 1956 to 2003. Mean values of glacier area change ( horizontal line) together with standard deviation (vertical bars) are given for four area classes (in km2: 0.01–0.1, 0.1–0.5, 0.5–1.0, 1.0–5.0, > 0.0 ........................................ 234
Fig. 6.1 Predicted spectral reflectance of dry snow surface under clear sky at the Summit station (72.5794 N, 38.5042 W) of Greenland. Snow density is 250.0 kg m−3, and snow grain radiuses are 50, 100, 200 and 500 µm from top to bottom, respectively. Finer snow grain size has higher reflectance particularly in the near and mid infrared wavelength range. Detailed model and theory description are documented by Flanner and Zender (2006). The three dashed lines from left to right are the wavelength positions of MODIS band 4, band 6 and band 7, respectively, and the width of the line is proportional to the width of wavelength range ... 249
Fig. 6.2 Terra/Aqua MODIS standard snow cover products. Aqua MODIS snow cover product’s names begin with MYD ................... 252
Fig. 6.3 Test areas showing elevation distribution on central Tianshan Mountains, indicating by the white polygon. The shaded area on the inset map is the northern Xinjiang, China, with black dots for climate stations of snow depth measurements. The Ili River basin is at the north foot of Central Tianshan Mountains. The Taklamakan Desert is in the south .................................................... 256
Fig. 6.4 Comparison of MODIS mean snow covered duration/days (SCD) and in situ observations of mean SCD at 20 climate stations with ascending order of elevation ( right scale, m) in Northern Xinjiang, China, from 2001 to 2005. The mean
xviiList of Figures
agreement is the average Agreements defined in Eq. (6.3) for all 20 stations in the four hydrologic year from 2001–2002 to 2004–2005 ........................................................................................ 258
Fig. 6.5 Spatial distribution of mean snow covered duration/days (SCD) on the Central Tianshan Mountains within the six hydrologic years from 2000 to 2006 ................................................................... 259
Fig. 6.6 Spatial distribution of SCD anomaly map in each hydrological year on the Central Tianshan Mountains. The mean SCD map of the 6 years was used as a basis. The white area represents the minimum snow cover or perennial snow in August of each year ..... 260
Fig. 6.7 Variation of snow cover index (SCI) on the Central Tianshan Mountains within the six hydrologic years from 2000 to 2006 ........ 261
Fig. 6.8 Spatial distribution of snow cover onset dates (SCOD) and end dates (SCED) maps on the Central Tianshan Mountains in the fall and spring seasons of 2004 and 2005, respectively. The white area represents the minimum snow cover or perennial snow in August of each year ........................................................................... 262
Fig. 7.1 Location of the arid region of northwest China ................................ 269Fig. 7.2 Change of pan evaporation (Epan) from 1958 to 2001 ....................... 271Fig. 7.3 Trends in annual Epan for the meteorological stations in the
Northwest China from 1958 to 2001 ................................................. 271Fig. 7.4 Temporal changes of meteorological factors .................................... 272Fig. 7.5 Comparison of annual pan evaporation and potential
evapotranspiration from 1958 to 2001 .............................................. 274Fig. 7.6 Change in ET0 in the arid region of Northwest China from 1958
to 2010............................................................................................... 275Fig. 7.7 Trends in ET0 in four seasons (DJF, MAM, JJA, SON) from
1958 to 2010...................................................................................... 276Fig. 7.8 Trends significance in annual ET0 for the meteorological stations
in the Northwest China during the periods (a) 1958–1993, and (b) 1994–2010 ................................................................................... 276
Fig. 7.9 Trends in annual ET0 for the meteorological stations in the Northwest China during the periods (a) 1958–1993, and (b) 1994–2010 ......................................................................................... 277
Fig. 7.10 Spatial distribution of climate factors (Ta, DTR, P and RH) trends identified by Mann–Kendall test in northwest China in 1958–2010. a Trend of Ta in 1958–2010, b Trend of DTR in 1958–2010, c Trend of P in 1958–2010, d Trend of RH in 1958–2010 ......................................................................................... 279
Fig. 7.11 Spatial distribution of climate factors (SD and WS) trends identified by Mann–Kendall test in northwest China for the two periods: 1958–1993, 1994–2010. a Trend of SD in 1958–1993, b Trend of SD in 1994–2010, c Trend of WS in 1958–1993, d Trend of WS in 1994–2010 ............................................................ 280
xviii List of Figures
Fig. 7.12 Concept of the complementary relationship...................................... 282
Fig. 8.1 Location of study area ....................................................................... 292Fig. 8.2 A plot of ln C(r) versus ln (r) ............................................................ 299Fig. 8.3 The correlation exponent (d) versus embedding dimension (m)....... 299Fig. 8.4 The nonlinear variation patterns for AR in the Yarkand River at
the different time scales .................................................................... 301Fig. 8.5 The nonlinear variation patterns for AAT in the Yarkand River
Basin at the different time scales ...................................................... 302Fig. 8.6 The nonlinear variation patterns for AP in the Yarkand River
Basin at the different time scales ...................................................... 302Fig. 8.7 The nonlinear variation patterns of AAT, AP and AR in the Kaidu
River at different time scales............................................................. 304Fig. 8.8 Simulated results for AR by BPANN and MLR at the different
time scales ......................................................................................... 307
Fig. 9.1 Location of the Tarim River Basin in China, meteorological stations and the selected NCEP Reanalysis grids used in this study ... 316
Fig. 9.2 Example of ranking 25 GCMs based on BS statistics (GCM IDs could be found in Table 9.1) ............................................................. 319
Fig. 9.3 Spatial distributions of annual temperature of the TRB, both a observed; and b simulated by ECHO_G ........................................... 321
Fig. 9.4 Empirical cumulative probabilities of observed and modeled monthly mean temperature for the TRB ........................................... 322
Fig. 9.5 Boxplots of ensemble PDF-based skill scores of monthly mean air temperature over all grids in the study area ................................. 323
Fig. 9.6 NCEP and GCM monthly precipitation distribution over TRB ........ 326Fig. 9.7 Cumulative empirical probabilities of observed and modeled
monthly precipitation ........................................................................ 327Fig. 9.8 Boxplots of ensemble PDF-based skill scores of monthly mean
precipitation over all grids of study region ....................................... 328Fig. 9.9 MSLP gradients over the Tarim River basin ( gray grids mean
covering observed stations) ............................................................... 331Fig. 9.10 BIC with different numbers of hidden states (a is for the wet
season model; b is for the dry season model) ................................... 335Fig. 9.11 Relative errors between modeled and observed annual
precipitation for each station in the model calibration and validation (‘cali’ and ‘vali’ mean in the calibration and validation; gray box indicate median values at the level of 0.95) ..... 336
Fig. 9.12 Modeled and observed monthly precipitation for both model calibration and validation ����������������������������������������������������������������� 337
Fig. 9.13 Distributions of modeled and observed wet spell length, dry spell length and wet-day precipitation amount in the model calibration and validation (The distributions were fit based on the Gamma distribution; a, c, e describe wsl, dsl and wpa in calibration respectively; while b, d, f was same as that but for validation) ........ 339

xixList of Figures
Fig. 9.14 Box plots of both inter-annual correlation coefficients for each observed station and spatial correlation coefficients for each month in the model calibration and validation (‘cali’ and ‘vali’ mean in the calibration and validation; gray box indicate median values at the level of 0.95) ................................................................ 340
Fig. 9.15 Interval plots of two skill scores for wet spell length, dry spell length and wet-day precipitation amount of each station in the model calibration and validation (a and b were for Sscore in the calibration and validation respectively; while c and d were the same as that but for BS) .................................................................... 341
Fig. 9.16 Model bias for precipitation and temperature (a, b describe bias of mean and percentile values for temperature, respectively; c, d are the same as that but for precipitation. “–ca” and “–va” mean calibration and validation respectively; “–c”, “–e”, “–g” mean predictors of CSIRO30, ECHAM5 and GFDL21 respectively; “tx”, “tn” mean maximum and minimum air temperatures respectively; “tn5”, “tx95”, “p95” mean 5th value of minimum air temperature, 95th value of maximum air temperature and wpa, respectively) ............................................................................. 345
Fig. 9.17 Boxplots for precipitation, maximum and minimum air temperatures based on skill scores (a, b describe air temperature; c, d describe precipitation. “–ca” and “–va” mean calibration and validation respectively; “–c”, “–e”, “–g” mean predictors of CSIRO30, ECHAM5 and GFDL21 respectively; “tx”, “tn” mean maximum and minimum air temperatures respectively; “tn5”, “tx95”, “p95” mean 5th value of minimum air temperature, 95th value of maximum air temperature and wpa, respectively) .............. 345
Fig. 9.18 Changes of mean values for precipitation, maximum and minimum air temperature projected by statistical downscaling models (a, b, c describe changes of maximum and minimum air temperatures, precipitation, respectively; “46” and “81” represent periods of 2046–2065 and 2081–2100, respectively; “-c”, “-e”, “-g” mean predictors of CSIRO30, ECHAM5 and GFDL21, respectively; “a1b”, “a2” and “b1” represent SRES A1B, A2, and B1, respectively. The following is the same) ............. 346
Fig. 9.19 The headwater catchment of the TRB ............................................... 348Fig. 9.20 Mean monthly hydrographs for calibration and validation periods
in headwater catchment of the TRB. (“a” and “b” describe hydrographs for calibration and validation periods, respectively) .... 351
Fig. 9.21 Monthly, seasonal and annual runoff changes under climate change scenarios in the future (a and b describe periods of 2046–2065 and 2081–2100, respectively) ...................................... 352
Fig. 9.22 Spatial distribution for runoff changes in the HC during the period of 2046–2065 ....................................................................... 353

xx List of Figures
Fig. 9.23 Spatial distribution for evapotranspiration changes in the HC during the period of 2046–2065 ...................................................... 355
Fig. 10.1 Location of the arid region and meteorological stations ................. 362Fig. 10.2 Spatial patterns of trends per decade during 1960–2010 in
the arid region of China of cold extremes (FD0, ID0, TN10p, TX10p, TNn and TXn); Upward-pointing ( downward pointing) triangles indicate increasing (decreasing) trends ............................ 365
Fig. 10.3 Regional annual and seasonal trends for temperature indices; The dot line is the 95 % confidence level for Mann–Kendall test ( a, b annual change, c, d seasonal change) ..................................... 366
Fig. 10.4 Spatial patterns of trends per decade during 1960–2010 in the arid region of China of the seasonal occurrence of cold nights (TN10p) ........................................................................................... 368
Fig. 10.5 The probability distribution of FD0, ID0, TX10p and TN10p, respectively ..................................................................................... 369
Fig. 10.6 Power spectrum of ID0 and TX10 (surrounded by the black line in Figure is significant at 0.05 level. The red-alignment is the high energy spectrum) ..................................................................... 369
Fig. 10.7 Spatial patterns of trends per decade during 1960–2010 in the arid region of China of the warm extremes ..................................... 370
Fig. 10.8 Spatial patterns of trends per decade during 1960–2010 in the arid region of China of but for the seasonal TN90p........................ 371
Fig. 10.9 Probability function of warm extremes (TX10p and TN90p, respectively) .................................................................................... 371
Fig. 10.10 Spatial patterns of trends per decade during 1960–2010 in the arid region of China of but for the annual and seasonal diurnal temperature range (DTR) ................................................................ 372
Fig. 10.11 Spatial distribution of trends ( left column, a1–a4) and trend magnitudes ( right column, b1–b4) of precipitation extremes ......... 374
Fig. 10.12 Seasonal spatial trends ( left column, a1–a2) and trend magnitudes for RX1day ( right column, b1–a2) .............................. 374
Fig. 10.13 Regional trends of precipitation extremes ....................................... 375Fig. 10.14 Location and topography of the research area ................................ 380Fig. 10.15 Inter-annual spatial distribution of extreme hydrological events
in Xinjiang (abscissa for the month/month; ordinate for the frequency of disaster/times) ............................................................ 382
Fig. 10.16 The frequency change in various types of extreme hydrological events .............................................................................................. 384
Fig. 10.17 Decadal changes of extreme hydrological events in Xinjiang ........ 385Fig. 10.18 Concentration degree decadal change from 1901 to 2010 in
Xinjiang ........................................................................................... 386Fig. 10.19 The spatial distribution of extreme hydrological events ................. 387Fig. 10.20 The spatial distribution of extreme hydrological events in
Xinjiang ........................................................................................... 388
xxiList of Figures
Fig. 10.21 Distribution of the river system in the Tarim River Basin .............. 391Fig. 10.22 Change relation of temperature, precipitation and extreme
hydrological events in Xinjiang ...................................................... 394Fig. 10.23 Relationship between hydrological extremes and regional
climate ............................................................................................. 395Fig. 10.24 Wavelet coherence of the hydrological extremes and regional
climate ............................................................................................. 396Fig. 10.25 Distribution probability of Tarim River ( a Aksu River,
b Yarkand River, c Hotan River, d Kaidu River) ............................ 397
Fig. 11.1 The variations of crops irrigated area in northwestern arid region ............................................................................................... 422
Fig. 11.2 Spatial distribution of crop acreage in the Northwestern Arid Region of China and its change (1989–2010) ................................. 423
Fig. 11.3 IWR compared with actual diverted in Kuqa County ..................... 428Fig. 11.4 a The spatial distribution of irrigation water demand in the
arid region of northwestern China in 2010, and b Its change compared to 1989 ............................................................................ 429
Fig. 11.5 The intra-annual variation of irrigation water demand in different sub-regions a South Xinjiang, b North Xinjiang, c Heixi Corridor in the northwestern arid region (1989–2010) ...... 430
Fig. 11.6 Inter annual variation of irrigation water requirement for different crops and different sub-regions in the northwestern arid region of China ......................................................................... 431
Fig. 11.7 Changes of crop growing area in the three typical basins ............... 432Fig. 11.8 Typical watershed years average monthly runoff, irrigation
water demand and the change of the irrigation water supply and demand in May ................................................................................ 434
Fig. 11.9 The spatial distribution of water level ............................................. 435

xxiii
List of Tables
Table 1.1 Northwest arid area’s population composition in 2011 .................. 28Table 1.2 The main ethnic groups in Xinjiang population growth from
1991 to 2011 (Unit: 104) ................................................................. 30Table 1.3 The Hexi Corridor land desertification: degree and distribution
characteristics (104 hm2) ................................................................. 32
Table 2.1 The rivers and weather stations information in the arid region of Northwest China ........................................................................ 64
Table 2.2 Temperature trends and tests in different typical river areas in the arid region of northwest China ................................................. 66
Table 2.3 The annual and seasonal trend in temperature over different regions ............................................................................................ 68
Table 2.4 Results of Mann–Kendall test for annual and seasonal precipitation and temperature ......................................................... 70
Table 2.5 The relationship between seasonal temperature trends and longitude, latitude and elevation .................................................... 74
Table 2.6 The correlation coefficients between the winter temperature in the entire region (the Arid Region of Northwest China), mountains, oases and certain factors that may affect the temperature ..................................................................................... 77
Table 2.7 The statistical characteristics of Siberian High Index, CDE, annual temperature and winter temperature for different period .... 80
Table 2.8 Precipitation trends and tests in typical river areas of the arid region of Northwest China ............................................................. 90
Table 2.9 The annual and seasonal trend in precipitation over different regions ............................................................................................ 93
Table 2.10 The relationship between seasonal precipitation trends and elevation, longitude, latitude and atmospheric circulation ............. 93
Table 2.11 Results of Mann–Kendall test for annual and seasonal precipitation and temperature ......................................................... 95
Table 2.12 Precipitation trends and tests in typical river areas of the arid region of northwest China .............................................................. 100
Table 2.13 Extreme temperature (T) and precipitation (P) .............................. 105
xxiv List of Tables
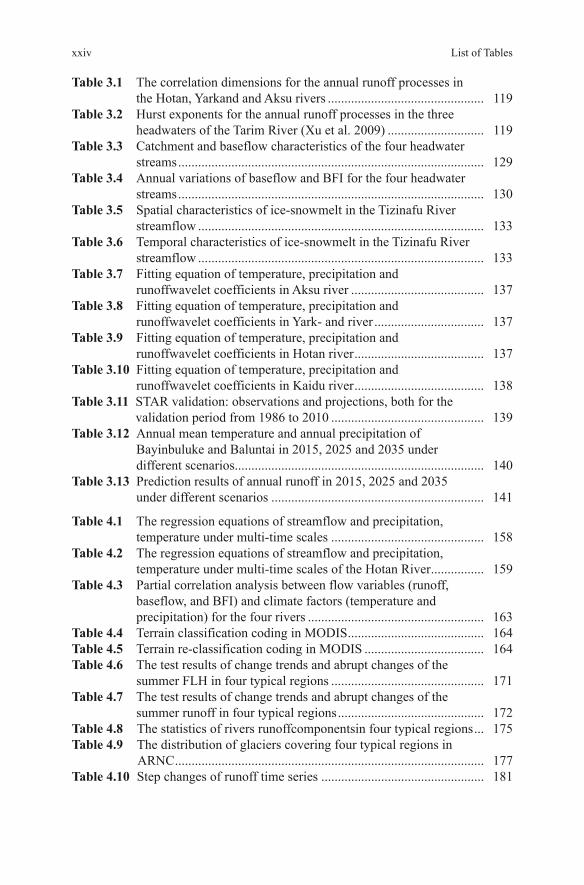
Table 3.1 The correlation dimensions for the annual runoff processes in the Hotan, Yarkand and Aksu rivers ............................................... 119
Table 3.2 Hurst exponents for the annual runoff processes in the three headwaters of the Tarim River (Xu et al. 2009) ............................. 119
Table 3.3 Catchment and baseflow characteristics of the four headwater streams ............................................................................................ 129
Table 3.4 Annual variations of baseflow and BFI for the four headwater streams ............................................................................................ 130
Table 3.5 Spatial characteristics of ice-snowmelt in the Tizinafu River streamflow ...................................................................................... 133
Table 3.6 Temporal characteristics of ice-snowmelt in the Tizinafu River streamflow ...................................................................................... 133
Table 3.7 Fitting equation of temperature, precipitation and runoffwavelet coefficients in Aksu river ........................................ 137
Table 3.8 Fitting equation of temperature, precipitation and runoffwavelet coefficients in Yark- and river ................................. 137
Table 3.9 Fitting equation of temperature, precipitation and runoffwavelet coefficients in Hotan river ....................................... 137
Table 3.10 Fitting equation of temperature, precipitation and runoffwavelet coefficients in Kaidu river ....................................... 138
Table 3.11 STAR validation: observations and projections, both for the validation period from 1986 to 2010 .............................................. 139
Table 3.12 Annual mean temperature and annual precipitation of Bayinbuluke and Baluntai in 2015, 2025 and 2035 under different scenarios ........................................................................... 140
Table 3.13 Prediction results of annual runoff in 2015, 2025 and 2035 under different scenarios ................................................................ 141
Table 4.1 The regression equations of streamflow and precipitation, temperature under multi-time scales .............................................. 158
Table 4.2 The regression equations of streamflow and precipitation, temperature under multi-time scales of the Hotan River ................ 159
Table 4.3 Partial correlation analysis between flow variables (runoff, baseflow, and BFI) and climate factors (temperature and precipitation) for the four rivers ..................................................... 163
Table 4.4 Terrain classification coding in MODIS ......................................... 164Table 4.5 Terrain re-classification coding in MODIS .................................... 164Table 4.6 The test results of change trends and abrupt changes of the
summer FLH in four typical regions .............................................. 171Table 4.7 The test results of change trends and abrupt changes of the
summer runoff in four typical regions ............................................ 172Table 4.8 The statistics of rivers runoffcomponentsin four typical regions ... 175Table 4.9 The distribution of glaciers covering four typical regions in
ARNC ............................................................................................. 177Table 4.10 Step changes of runoff time series ................................................. 181

xxvList of Tables
Table 4.11 Runoff changes caused by climate change and human activities ... 182Table 4.12 Sensitivity analysis of runoff to different climate senarioals in
the headwater of Tarim River ......................................................... 189
Table 5.1 Main geographical and hydrometeorological features of the two catchments ............................................................................... 197
Table 5.2 Statistically significant coefficients for monthly temperature, precipitation and discharge and year of abrupt change for 1959–2008 ...................................................................................... 201
Table 5.3 Glacier area change since 1962 ...................................................... 202Table 5.4 Regression analysis of the dependence of discharge on air
temperature and precipitation in the ablation period at the two tested sites ...................................................................................... 208
Table 5.5 Changes in precipitation, temperature, glacier mass balance, glacier runoff and river discharge for the periods 1959–1993 and 1994–2008 ............................................................................... 208
Table 5.6 Sensitive parameters and the optimal values of HBV for the two investigated areas .................................................................... 209
Table 5.7 Efficiency criterions of modeling performance for the two investigated areas [R2 is from Eq. (5.2), RE is from Eq. (5.3) ....... 210
Table 5.8 Parameters of the statistical relationship between the observed and projected data .......................................................................... 211
Table 5.9 Mean change in future discharge (2041–2060) under A1B emission scenarios relative to the present discharge (2000–2008) for three glaciations stages and for two catchments ............ 214
Table 5.10 The investigated glaciers ................................................................ 219Table 5.11 Information of remote sensing images ........................................... 220Table 5.12 Glacier area changes between 1956 and 2003 in the middle
Qilian Mountain Region ................................................................. 233Table 5.13 Comparison of glacier changes in the eastern, middle and
western Qilian Mountain Region ................................................... 235
Table 7.1 Climate trends of meteorological factors (/10a) ............................. 278Table 7.2 Annual complete correlation coefficients between ET0 and
climate factors ................................................................................ 281
Table 8.1 The correlation dimensions for AR in the Tarim headwaters ......... 300Table 8.2 Hurst exponents for AR in the Tarim headwaters .......................... 300Table 8.3 Basic parameters of the BPANN for hydro-climatic process in
the Kaidu River at different time scales ......................................... 305Table 8.4 MLREs for hydro-climatic process in the Kaidu River at
different time scales ....................................................................... 305Table 8.5 Comparison between BPANN and MLR model in the Kaidu
River at different time scales .......................................................... 308
Table 9.1 Climate models data description .................................................... 317

xxvi List of Tables
Table 9.2 Model performance for monthly mean air temperature ............... 320Table 9.3 Model performance for precipitation ........................................... 325Table 9.4 Comparison of Scores for monthly MSLP, mean temperature
and precipitation ........................................................................... 329Table 9.5 NCEP/NCAR candidate predictors .............................................. 330Table 9.6 Statistics of mean and percentile values for dry spell length,
wet spell length and wet-day precipitation amount in the calibration and validation periods ................................................ 338
Table 9.7 Explained variances of each predictor and SDSM and NHMM selected predictors .......................................................... 343
Table 9.8 Model performance on monthly runoff in calibration and validation periods ......................................................................... 350
Table 10.1 Definitions of 15 temperature indices and 9 indices used in this study, all the indices are calculated by RClimDEX .............. 363
Table 10.2 Percentage of stations showing significant annual trends for each index ..................................................................................... 367
Table 10.3 Proportion of individual stations where the trend in one index if of greater magnitudes than the trend in a second ..................... 368
Table 10.4 Relationship between climate extremes (unit/decade), elevation (m) and mean climate (unit/decade) (the coefficient is the linear slope between two variables; slope significant are marked in bold) ............................................................................ 376
Table 10.5 Trends of temperature and precipitation extremes from this study and other works (Trends significant are marked in bold) ... 378
Table 10.6 The concentration degree of extreme hydrological events in Xinjiang ........................................................................................ 379
Table 10.7 The concentration index of extreme hydrological events in Xinjiang ........................................................................................ 383
Table 10.8 Monotonic trend test for temperature, precipitation and extreme hydrological events in Xinjiang ..................................... 394
Table 10.9 Two-viable Wilcoxon testing the correlation among temperature, precipitation and runoff in Yarkant River................ 398
Table 10.10 The change of the 0 °C level high of the flood peak discharge above 4,000 m3/s .......................................................................... 398
Table 10.11 Winter precipitation and cumulative depth of snowpack anomaly before snowmelt occurred (Unit: %) ............................. 399
Table 10.12 Winter temperature anomaly and spring temperature extreme change before snowmelt occurred (°C, °C/d, respectively) .......... 400
Table 11.1 Water resources in arid areas of Northwest China ........................ 407Table 11.2 Glacier meltwater and their recharge proportions to rivers in
the northwest arid area ................................................................. 412Table 11.3 Water resources in arid areas of Northwest China ........................ 417Table 11.4 The crop coefficient of the major crops at each growth stage
in some sites in northwestern arid area ......................................... 426

xxviiList of Tables
Table 11.5 The irrigation efficiency in the study region during past 20 years ................................................................................................ 426
Table 11.6 Annual average crop water demand and its trend test (1989–2010, Unit: mm/y) .......................................................................... 427
Table 11.7 Typical basin runoff characteristics and irrigation water demand (0.1 billion · m3/y) .............................................................. 433