water supply ppt
DESCRIPTION
briefTRANSCRIPT

WATER SUPPLY PROJECT
INTRODUCTIONWater is absolutely necessary for life. Water
is essential not only for survival of human beings, but also for plants & animals & all other living beings. Water is extremely useful to man in providing him with luxurious & comforts, in addition to fulfilling his basic necessities of life. However many of our villages are still suffering from adequate amenities specially the water supply. Besides providing water for drinking purpose it is also essential to supply water treated confirming to the requirements of potable water .

NECESSITY:
Yellur village is located at 11 km from Belgaum city. The village is not provided with proper and sustained water supply. Presently water is supplied through mini water supply scheme by bore wells. This system has been found to be insufficient due to increase population, dearth of available water and lack of proper management. This water must be treated properly; there is chances of water contamination due to presences of high fluoride and nitrate contents.

In order to ensure the availability of sufficient quantity of good quality of water, it becomes almost imperative in this present scenario of acute water storage, to plan & build suitable water supply scheme, which many provide potable water to meet the demand & requirement. Hence proper planning is necessary in this formulation & implementation of water supply scheme.
The growing population, unreliable monsoon & wasteful usage pattern has lead to wide spread scarcity of water. Hence it is being realized that mammoth efforts are needed to maximize the use of natural resources.
The existing water supply is not sufficient to meet the basic needs of the people and hence people are more dependent on the ground water resources. This inconvenience of water can be avoided by constructing an efficient water supply scheme for the above said village.

SOURCES:Rainfall is the main source of water for
the village. The average rainfall is about 860.72 mm; there is an existing water supply scheme as well as mini water supply scheme with 21 bore wells and 8 open wells.

POPULATION FORECASTING:
Population:- The number of human beings residing in a certain area at any particular time.
Population density:- Number of persons per unit area.
The water supply project is not designed for present population, but it is made to accommodate the future population at the end of 2 or 3 decades.

POPULATION FORECAST
There are mainly 3 methods of population forecasting and they are as follows :
1. Arithmetical increase method2. Geometrical increase method3. Incremental increase method

This is the simplest method. Generally gives lower results. In this method,the increase in population from decade to decade is assumed constant.
It is analogous to simple interest method.
Pn = Po+nX
Pn=future population at the end of n decade
Po = present population,
X =Average population increase /decade
AIRTHMETICAL INCREASE METHOD:-
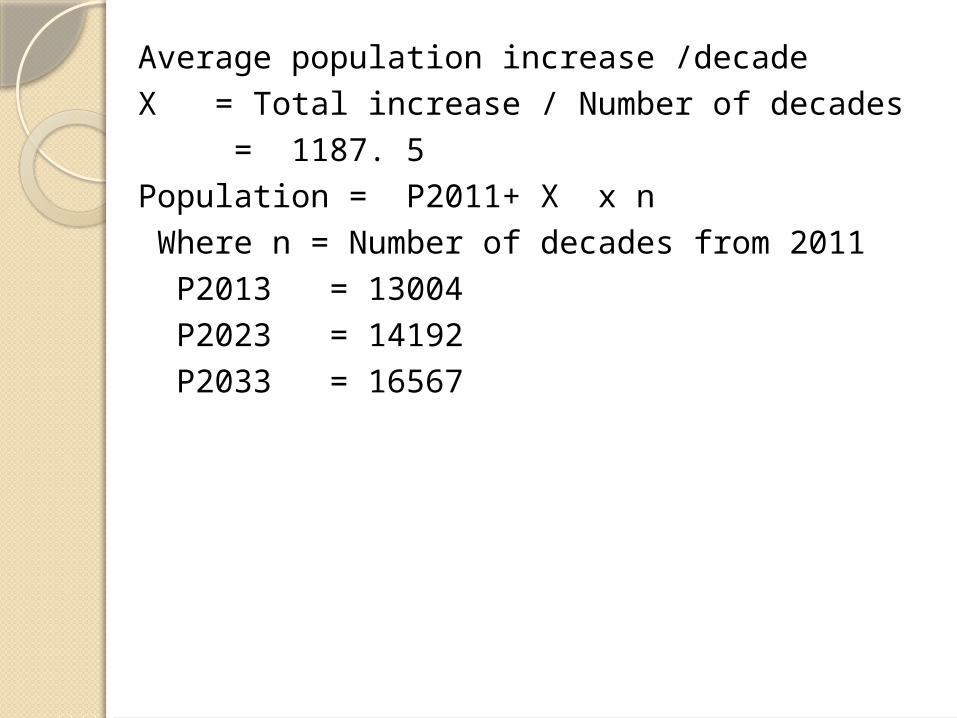
Average population increase /decadeX = Total increase / Number of decades = 1187. 5Population = P2011+ X x n Where n = Number of decades from 2011 P2013 = 13004 P2023 = 14192 P2033 = 16567
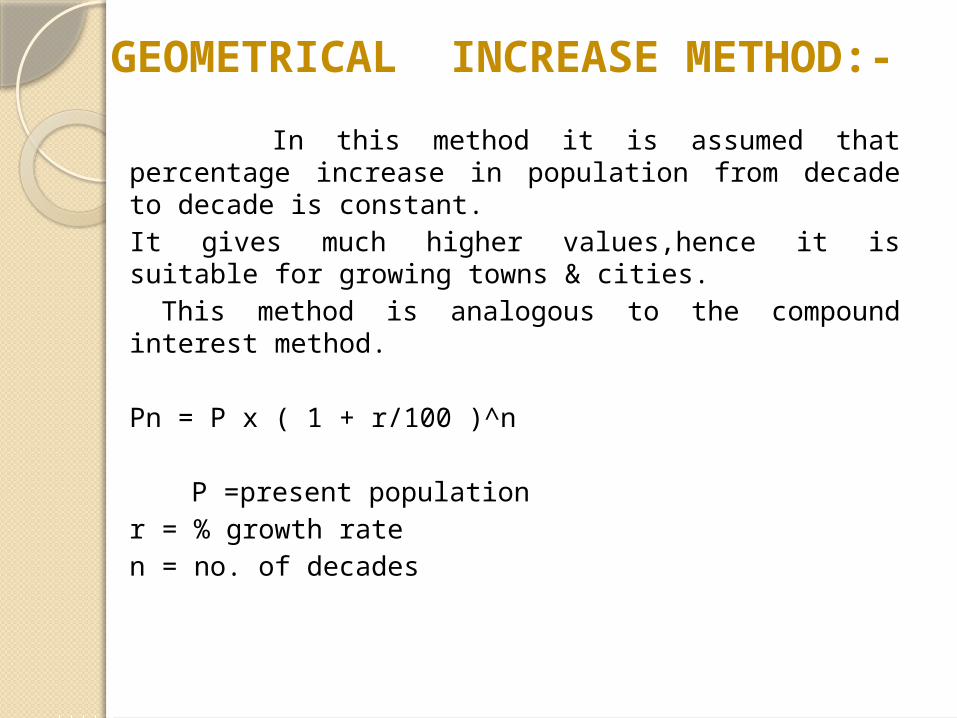
GEOMETRICAL INCREASE METHOD:-
In this method it is assumed that percentage increase in population from decade to decade is constant.It gives much higher values,hence it is suitable for growing towns & cities. This method is analogous to the compound interest method.
Pn = P x ( 1 + r/100 )^n
P =present populationr = % growth rate n = no. of decades

Geometric mean of growth rate-
r=t√r1+r2+r3+….+rn (%)
r=11.13%
Population = P2011 x ( 1 + r/100 ) n
Where n=Number of decades from 2011
P2013 =13039 P2023 =14192 P2033 =1610

INCREMENTAL INCREASE METHOD:-
It combines both the airtmetic and geometrical average method.
In this method decade growth rate is not assumed to be constant .
The increment in increase for each decade is found from these.
An average increment of the increases is found.
Pn=P+nX+{ n(n+1)/2 }Y
P- Present populationX-average increase per decade
Y-Net incremental increase
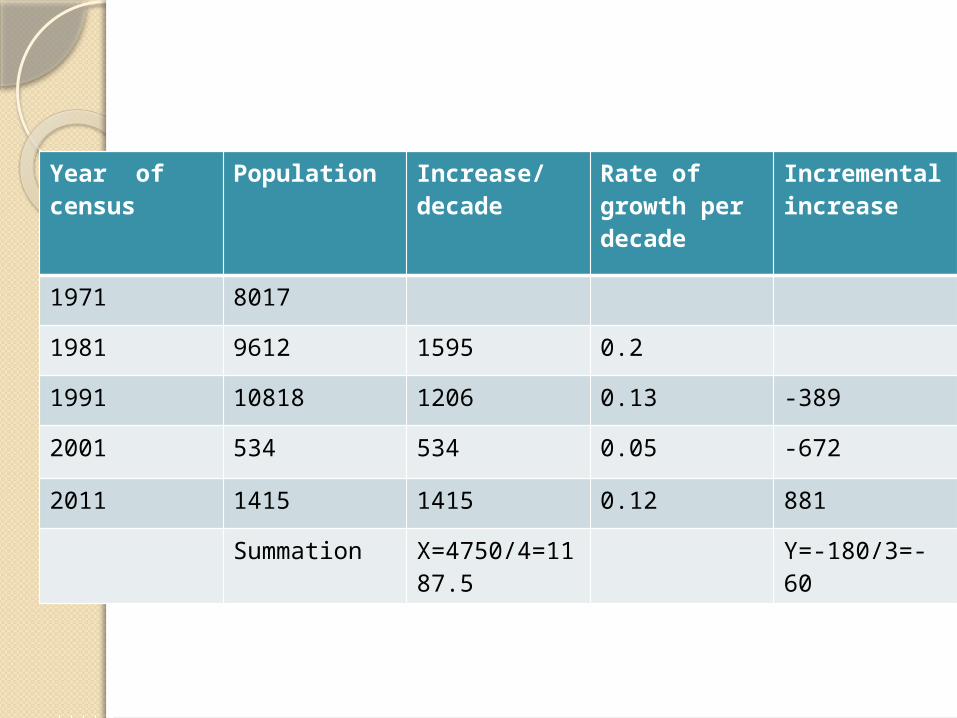
Year of census
Population Increase/decade
Rate of growth per decade
Incremental increase
1971 8017
1981 9612 1595 0.2
1991 10818 1206 0.13 -389
2001 534 534 0.05 -672
2011 1415 1415 0.12 881
Summation X=4750/4=1187.5
Y=-180/3=-60

WATER DEMAND:A small quantity of water is required per
capita under normal condition but demand for other purpose will naturally depend on the standard of living and degree of culture.
The various demands are as follows: 1. Domestic Purpose.2. Civil or Public Purpose.3. Losses and wastes.
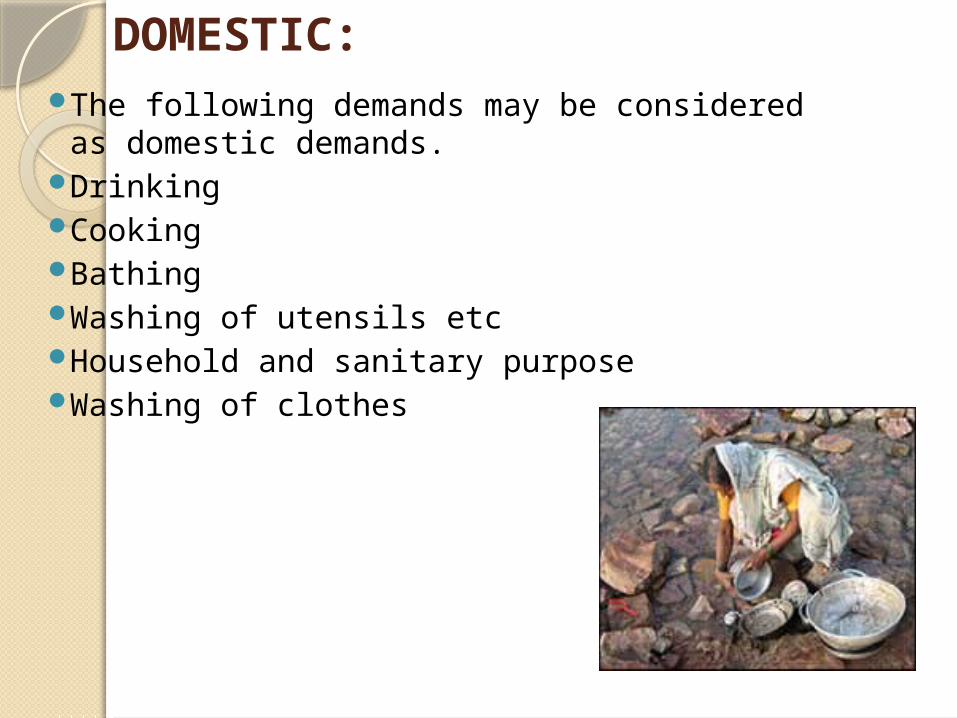
DOMESTIC: The following demands may be considered
as domestic demands.DrinkingCookingBathingWashing of utensils etcHousehold and sanitary purposeWashing of clothes
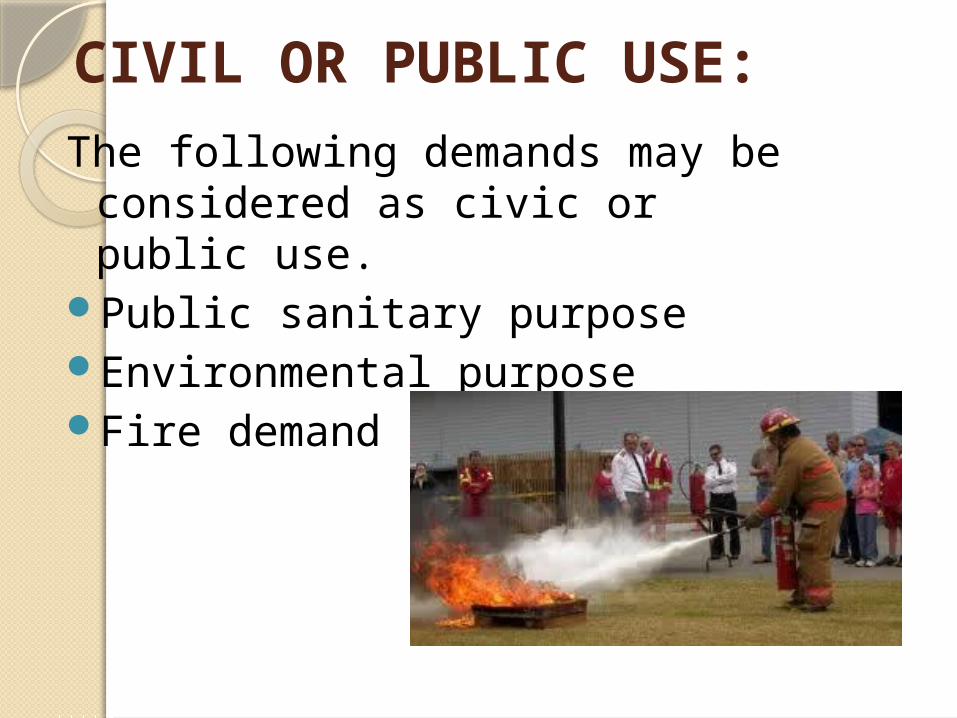
CIVIL OR PUBLIC USE:
The following demands may be considered as civic or public use.
Public sanitary purposeEnvironmental purposeFire demand

LOSSES AND WASTES : It is due to the careless use, leakage of pipelines, valves, fittings and unauthorized.
Water connection is taken about 20% of total water.
Karnataka rural water supply & sanitation agency has recommended a water demand for rural area as below:
70 LPCD: FOR SURFACE WATER SOURCE.50 LPCD: FOR GROUND WATER SOURCE

INTAKE, JACKWELL STRUCTURES FOR SURFACE WATER :
When surface water is decided to be the technology option, it calls for specific structures for the drawl and transmission. The normal unit is jack well and raw water rising main. In addition to the above, the settling tanks, slow sand filters, clear water sump are the other structures required.

JACK WELL : This is a structure constructed over suction well or suction sump for pumping raw water from the surface source to treatment units. Normally, the size of the sump shall be equal to 30 minutes of pumping capacity. Jack well with pump house is generally constructed with R.C.C as per site condition.

OVERHEAD STORAGE TANK: Overhead tanks are placed on the highest point of the proposed site location to avoid pumping and make use of available elevation in order to enable water supply under the action of gravity. Here R.C.C tank structure is been proposed.

ECONOMICAL SECTION OF RISING MAIN :
For a given discharge , if smaller diameter of pipes are selected the velocity of flow increases resulting in higher frictional loss and hence increases the total pumping head, which requires increased HP of pump effecting in net increase of cost.
If the diameter of the pipe selected is large then the pumping cost reduces but the initial cost of pipe increases.
For the most economical condition we must choose such a pipe size whose pumping and initial costs will make the total annual expenditure minimum. Such size is called ‘economical size of the pipe’.
The optimum velocity for most economical sizes of pipes is likely to be about 1m/sec.

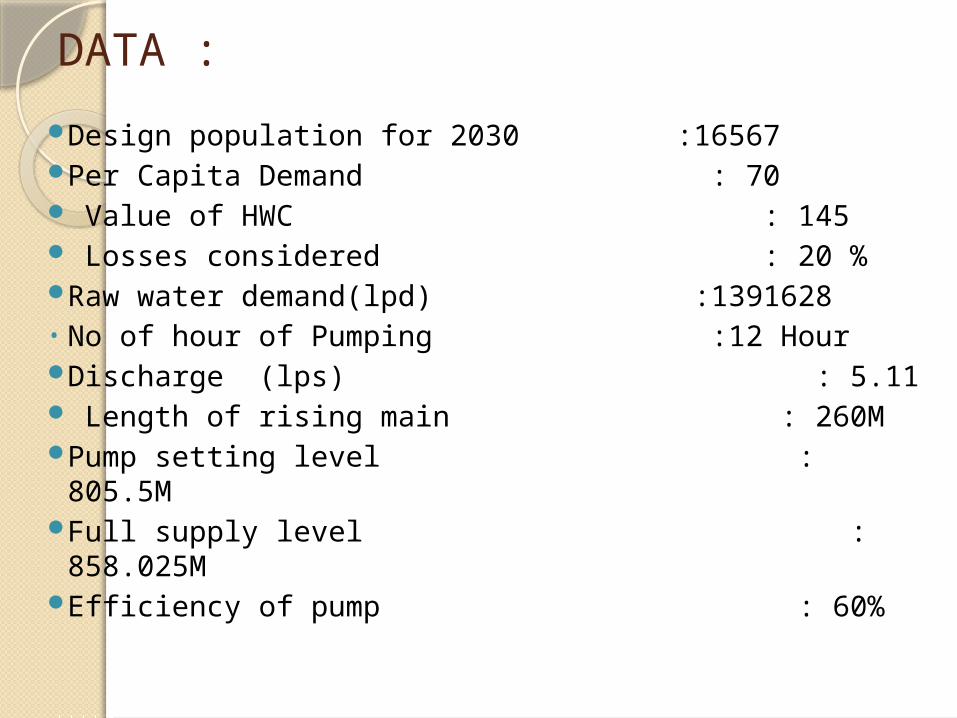
DATA : Design population for 2030 :16567Per Capita Demand : 70 Value of HWC : 145 Losses considered : 20 %Raw water demand(lpd) :1391628• No of hour of Pumping :12 HourDischarge (lps) : 5.11 Length of rising main : 260MPump setting level : 805.5MFull supply level : 858.025MEfficiency of pump : 60%
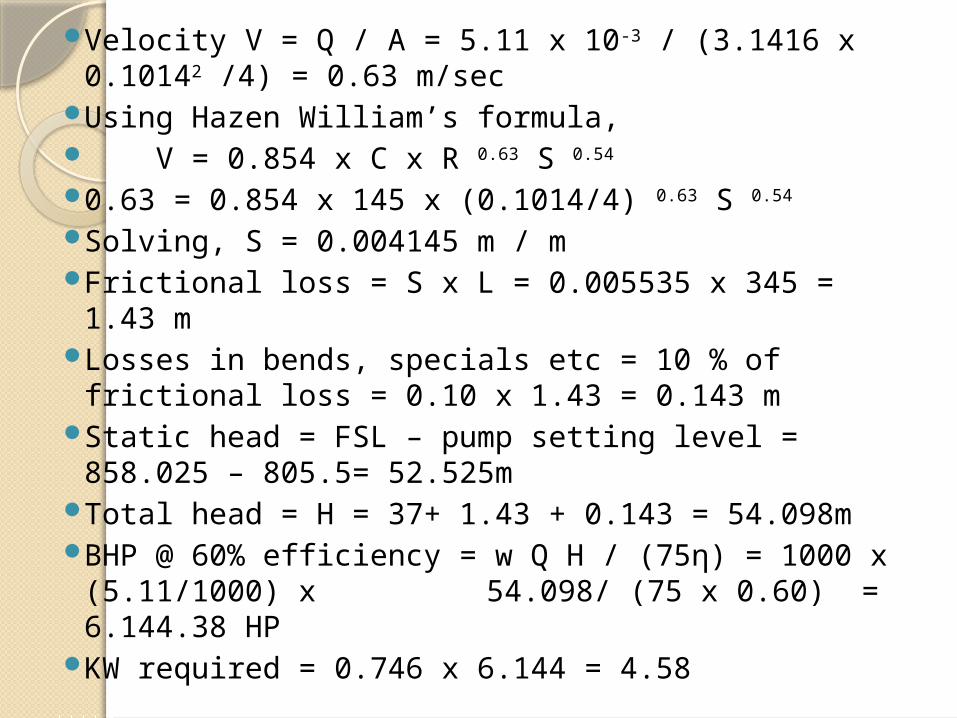
Velocity V = Q / A = 5.11 x 10⁻³ / (3.1416 x 0.10142 /4) = 0.63 m/sec
Using Hazen William’s formula, V = 0.854 x C x R 0.63 S 0.54
0.63 = 0.854 x 145 x (0.1014/4) 0.63 S 0.54
Solving, S = 0.004145 m / mFrictional loss = S x L = 0.005535 x 345 = 1.43 mLosses in bends, specials etc = 10 % of frictional
loss = 0.10 x 1.43 = 0.143 mStatic head = FSL – pump setting level = 858.025 –
805.5= 52.525mTotal head = H = 37+ 1.43 + 0.143 = 54.098mBHP @ 60% efficiency = w Q H / (75η) = 1000 x
(5.11/1000) x 54.098/ (75 x 0.60) = 6.144.38 HP
KW required = 0.746 x 6.144 = 4.58

Cost of pumping machinery @ 4000/BHP = 4000 x 4.58 = 18320 Annual electricity charges = KW x pumping hrs x 365 x energy
charges = 3.27 x 12 x 365 x 3.20 = 45804.32
M&R depreciation charges = 7.5% of cost of pumping machinery = (7.5/100) x 17522.80
= 13142.10 Total O & M charges = 45804.32 + `13142.10 = 58946.42 Capitalized value of O&M Cc = CR [1-(1+r)-n]/r Taking r =7 .5 % and n=10 years, Cc = CR [1-(1+0.075)-10]/0.075 = CR x 6.864 = 58946.42 x 6.864
= 404608.2Where, CR is annual energy charges
CC is capitalized energy charges Cost of pipe in /m length = 170 Total cost of pipes = 345x 170 = 58650 Grand total capitalized cost = 58650 + 404608.2 + 45804.32 =
480781.1 Selection of the pipe diameter shall be based on the grand total
of capitalized cost for 10 years.
WATER HAMMER DESIGN FOR RISING MAIN
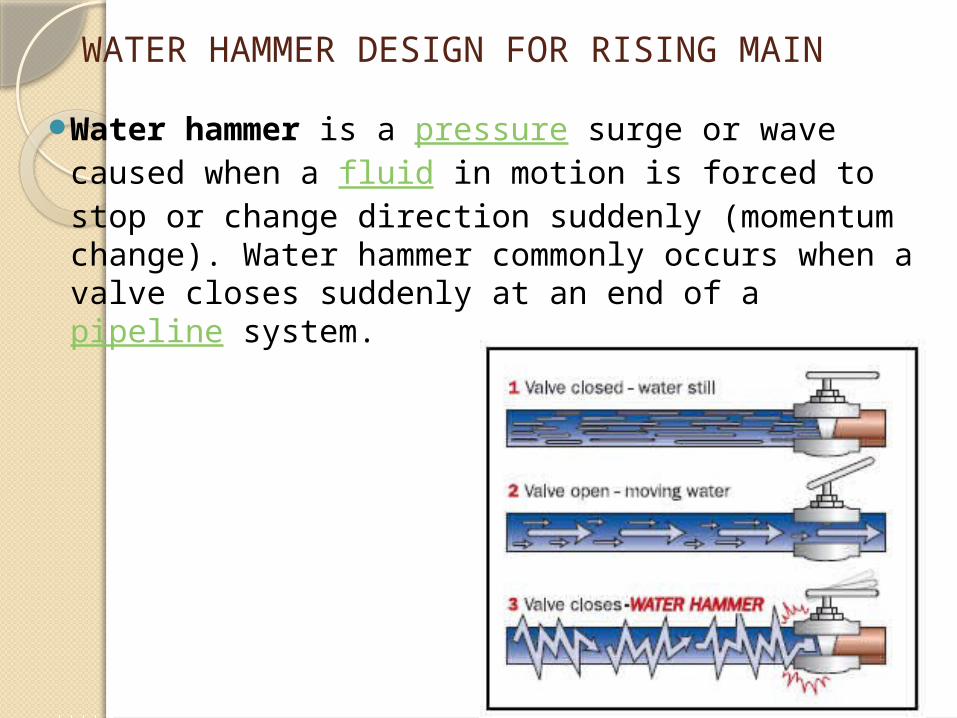
Water hammer is a pressure surge or wave caused when a fluid in motion is forced to stop or change direction suddenly (momentum change). Water hammer commonly occurs when a valve closes suddenly at an end of a pipeline system.
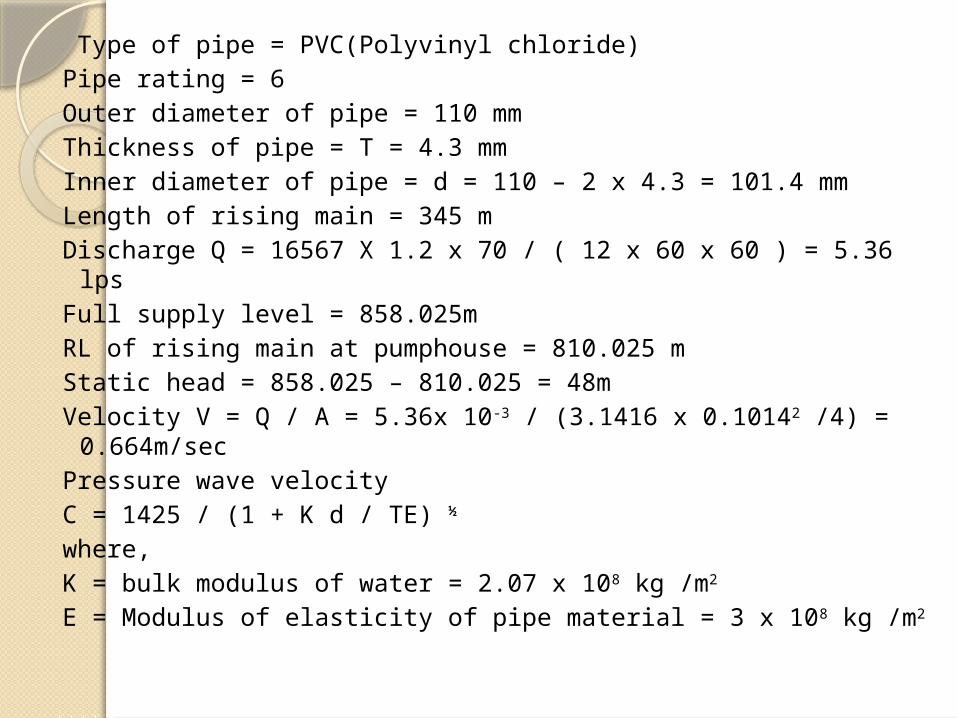
Type of pipe = PVC(Polyvinyl chloride)Pipe rating = 6 Outer diameter of pipe = 110 mmThickness of pipe = T = 4.3 mmInner diameter of pipe = d = 110 – 2 x 4.3 = 101.4 mmLength of rising main = 345 mDischarge Q = 16567 X 1.2 x 70 / ( 12 x 60 x 60 ) = 5.36 lpsFull supply level = 858.025mRL of rising main at pumphouse = 810.025 mStatic head = 858.025 – 810.025 = 48mVelocity V = Q / A = 5.36x 10⁻³ / (3.1416 x 0.10142 /4) =
0.664m/secPressure wave velocity C = 1425 / (1 + K d / TE) ½ where, K = bulk modulus of water = 2.07 x 10⁸ kg /m2
E = Modulus of elasticity of pipe material = 3 x 10⁸ kg /m2
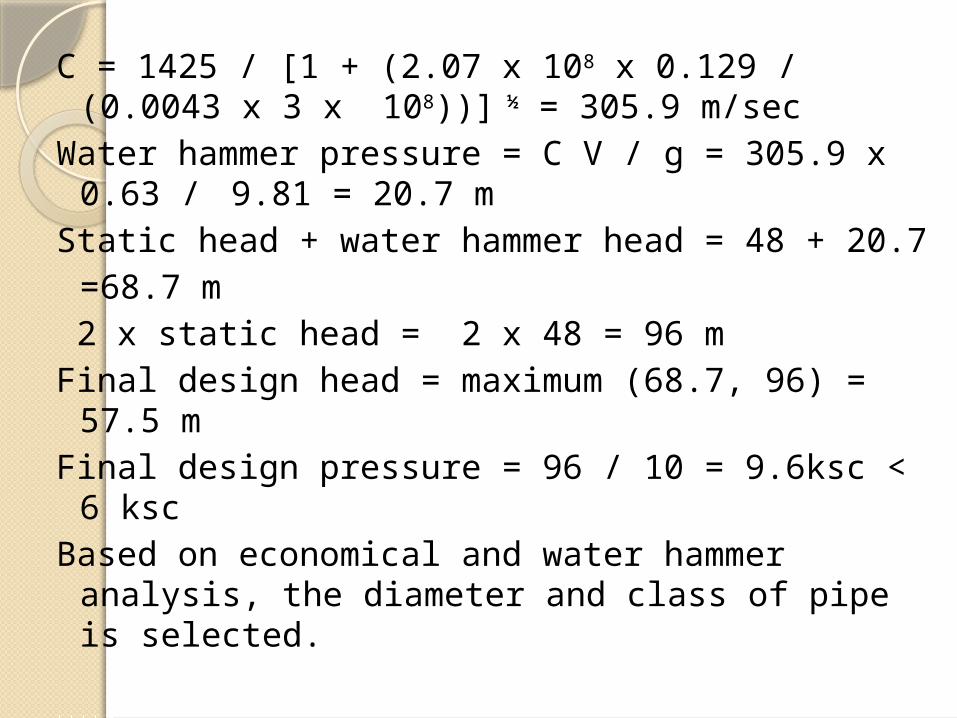
C = 1425 / [1 + (2.07 x 108 x 0.129 / (0.0043 x 3 x 108))] ½ = 305.9 m/sec
Water hammer pressure = C V / g = 305.9 x 0.63 / 9.81 = 20.7 m
Static head + water hammer head = 48 + 20.7 =68.7 m
2 x static head = 2 x 48 = 96 mFinal design head = maximum (68.7, 96) = 57.5
mFinal design pressure = 96 / 10 = 9.6ksc < 6 kscBased on economical and water hammer analysis,
the diameter and class of pipe is selected.

WATER TREATMENT :
The main aim of water treatment is to produce and maintain water that is hygienically safe, aesthetically attractive and palatable, in an economical manner. Though the treatment of water would achieve the desired quality, the evaluation of its quality should not be to the end of treatment facilities but should be extended to the point of consumer use.

Raw water tank :The pumped water from jack well
through rising main is stored in raw water tank.
The detention period in this tank is usually more as compared to other tanks viz. Sedimentation, filtration & pure water tank.

DESIGN OF RAW WATER TANK :Population forecasted for year 2033= 16567 Total quantity of water required = 16567x1.2x70 = 1391628
lpcd A raw water storage tank of 4 hrs. detention periods proposed
to be provided (assumed)Water quantity required for 2033 = 1.391 Mld Capacity of tank= ( 1.391 x 4 )/ 24= 231.833 m3
Provide water depth =3 mt Plan area of tank required = 231.833/3 = 77.278 m2
Assume a ratio L:B=3:1 3B x B =77.278B =5 .075mtL=15 .225mt Provide free board 0.5 mt hence D = 3.5 mt

SEDIMENTATION TANKSedimentation is the separation
from water by gravitational settling of suspended particles that are heavier than water. It is one of the most commonly used unit operation in the flow sheet of conventional water treatment.

Filtration Tank:To remove impurities that have
remained after sedimentation. Water is filtered through beds of fine granular materials such as sand. This process is called “FILTRATION”.
There are two types of filters. Slow sand filters Rapid sand filters

Slow sand filters : In slow sand filters the rate of filtration through
sand filters may be 1/20th or less of the rate of filtration through rapid sand filters.
The effect of slow sand filter is to remove turbidity by straining and to remove bacteria by biological action.
Slow sand filtration is one of the most effective, simple and least expensive water treatment processes and is therefore particularly suitable for rural areas. In this method, water slowly passes through a bed of fine sand at a very slow rate (100-300 liters. /sq.m/hr). Slow sand filters remove turbidity and also certain micro organisms.
Monitoring and Operation Requirements :
A slow sand filter must be cleaned when the fine sand becomes clogged, which is measured by the head loss. The length of time between cleanings can range from several weeks to a year, depending on the raw water quality.
The operator cleans the filter by scraping off the top layer of the filter bed. The filtered water quality is poor during this time and should not be used. In climates subject to below-freezing temperatures, slow sand filters usually must be housed.

Pure water Tank:
It shall be constructed to store clear treated water the water is then supplied to chlorination tank.
CHLORINATION TANK:
The chlorination tank shall be installed to mix pure water with the requisite amount of bleaching powder as to cause disinfection.
Contact period of more than half an hour is desired in chlorination tank. Normal dose of chlorine to be taken is 0.3 ppm for a contact period of half an hour.
Normally chlorine content in bleaching powder is 30%.
LAYOUT AND METHOD OF DISTRIBUTION
The main object of this distribution system is to develop adequate water pressure at the consumer’s taps the water may be forced into the distribution in the following ways
1. Gravitational system2. Pumping system3. Combined gravity and pumping
system

Diameter of pipes used in lanes is as follows:Main line: 110 mm dia PVC pipes.Sub lanes: 75mm dia PVC pipes.Sub-sub lanes: 75mm dia PVC pipe
For one day 24 Hr
Losses 1.1
Per capita supply 70 Lpcd
Total population 16567 No
Supply hour 4 Hr
Total length of pipe 7801.335 m

THANK YOU…