water supply the source of the state’s water supply is ...water supply plan provides a framework...
TRANSCRIPT

Water Supply
Page 1- Updated 8/2017
Environmental Trends Report
NJDEP, Division of Science, Research, and Environmental Health
http://www.nj.gov/dep/dsr/trends/
The source of the State’s water supply is either from surface waters (streams, rivers, and reservoirs) or from the ground (confined and unconfined aquifers). In New Jersey, nearly 75% of all withdrawals come from a surface-water source. The remaining withdrawals are distributed among confined and unconfined aquifers (Figure 1). State-wide production from domestic wells totals about 3% of total withdrawals. Confirmation of the aquifer source for any domestic well is extremely difficult to determine due to the large number of wells and limited data available. For this analysis all domestic wells are assumed to come from unconfined aquifers4. Withdrawals from surface water and groundwater sources have fluctuated between 1990 and 2015 (Figure 1). While no significant change is present for total groundwater withdrawals, a significant reduction is present among withdrawals from surface water sources (Kendall tau Correlation, tau = -0.440, p < 0.01). Withdrawals from domestic wells have increased by 1% on average each year since 1990.
The NJDEP’s data indicates that statewide total annual water withdrawals have declined since 1990 (Kendall Tau correlation, tau = -0.415, p < 0.01). In particular, two use groups, agriculture/irrigation and commercial/industrial/mining, show a steady decrease in withdrawals since 1990 (Kendall Tau correlations, tau = -0.502, p < 0.001 and tau = -0.692, p < 0.001, respectively) (Figure 2). Water withdrawals
Water Supply
Background
Annual water withdrawals in New Jersey have averaged close to three-quarters of a trillion gallons over the last five years. This water comes from aquifers or surface water sources including rivers and reservoirs. The water is used for a variety of purposes including potable drinking water; agriculture and irrigation; industry, including commercial use and mining operations; and power generation. Sustainable water supply is a key factor in the potential development and redevelopment of the State. Despite statewide average precipitation of 45 inches per year,1 New Jersey must plan its water use carefully to prevent regional shortages and avoid ecological impacts associated with a depleted resource. New Jersey has a formal water supply planning process. The New Jersey Statewide Water Supply Plan provides a framework to guide the management, conservation, and development of the State's water resources. It balances the demand for potable, industrial, recreational, and ecological uses to ensure that a safe and adequate water supply will be available into the foreseeable future, including during drought. The Plan and its periodic revision are mandated by the 1981 Water Supply Management Act.2 The first plan was released in 1982 and the first major revision in 1996. A draft update of the New Jersey Statewide Water Supply Plan was released on May 1, 2017.
Trends The population of New Jersey grew by almost 330,000 individuals, or 3.9%, over the 10-year period between 2006 and 2015 and is expected to grow by nearly 10% over the next two decades.3 This population growth and associated population shifts place an additional demand on the State’s water resources and water-supply infrastructure, particularly in geographic areas that have not previously experienced high water demand.
Data for the following assessments are drawn from the New Jersey Water Transfer Model Withdrawal, Use, and Return Data Summaries.4 The associated databases contain measured and estimated monthly withdrawal, use and return volumes at the municipal and watershed scales. Data reported for 2014 and 2015 are provisional.
Figure 1. Source of water withdrawals for the period 1990 – 2015. Domestic wells are in large part located in un-confined aquifer units. Surface water withdrawals include hydropower. Data for 2014 and 2015 are provisional.

Water Supply
Page 2- Updated 8/2017
Environmental Trends Report
NJDEP, Division of Science, Research, and Environmental Health
http://www.nj.gov/dep/dsr/trends/
for power generation and potable supply have not changed over this 26-year period, but a review of the data over the past 10 years shows general annual reductions in each (Kendall Tau correlations, tau = -0.733, p < 0.01 and tau = -0.511, p < 0.05, respectively). The recent reductions in withdrawals for power generation are due in part to reduced electricity production at coal burning and hydroelectric power plants.
Regional changes in water withdrawals from 2004 to 2013 are illustrated in Figure 3. The largest changes were for those watersheds where withdrawals decreased between 5% and 50%. That range of decrease occurred in 29% of the watersheds. Twenty-six percent of the watersheds experienced minor changes (between -5% and +5%) in withdrawals while 25% percent of the watersheds saw withdrawals increase between 5% and 50%. A cluster of rather large increases is present in the agricultural areas of southern New Jersey. It should be noted though that percent changes can be quite large when withdrawals in 2004 were nonexistent or low and were present, or substantially greater, in 2013. For example, the largest percent (70,658%) change occurred in the part of the lower Passaic River, Passaic County where withdrawals in 2004 were 25.0 million gallons and in 2013 withdrawals totaled 17,717 million gallons. Large withdrawals closer to the 17 billion gallons seen in 2013 are typical for this basin since 1990 but withdrawals were minimal from 2003 through 2006, perhaps due to intermittent production at a hydropower generating site.
Figure 2. Annual withdrawals per year (1990 - 2015) by group. Data for 2014 and 2015 are provisional.
Figure 3. Percent Change in Water Withdrawals in New Jersey HUC14 Watersheds from 2004 to 2013.

Water Supply
Page 3 - Updated 8/2017
Environmental Trends Report
NJDEP, Division of Science, Research, and Environmental Health
http://www.nj.gov/dep/dsr/trends/
Total annual water usage shows a declining trend since 1990 (Kendall Tau correlation, tau = -0.563, p < 0.01). Potable supply usage shows no significant trend over the 26-year period but does show a decrease over the period from 2006 to 2015 (Kendall Tau correlation, tau = -0.511, p < 0.05) (Figure 4). Excluding water used for power generation, about eighty percent of total use has gone to potable supply over the past ten years (Figure 5). Potable supply has a number of users, mainly domestic consumers but some water is also directed to industrial and commercial users.5
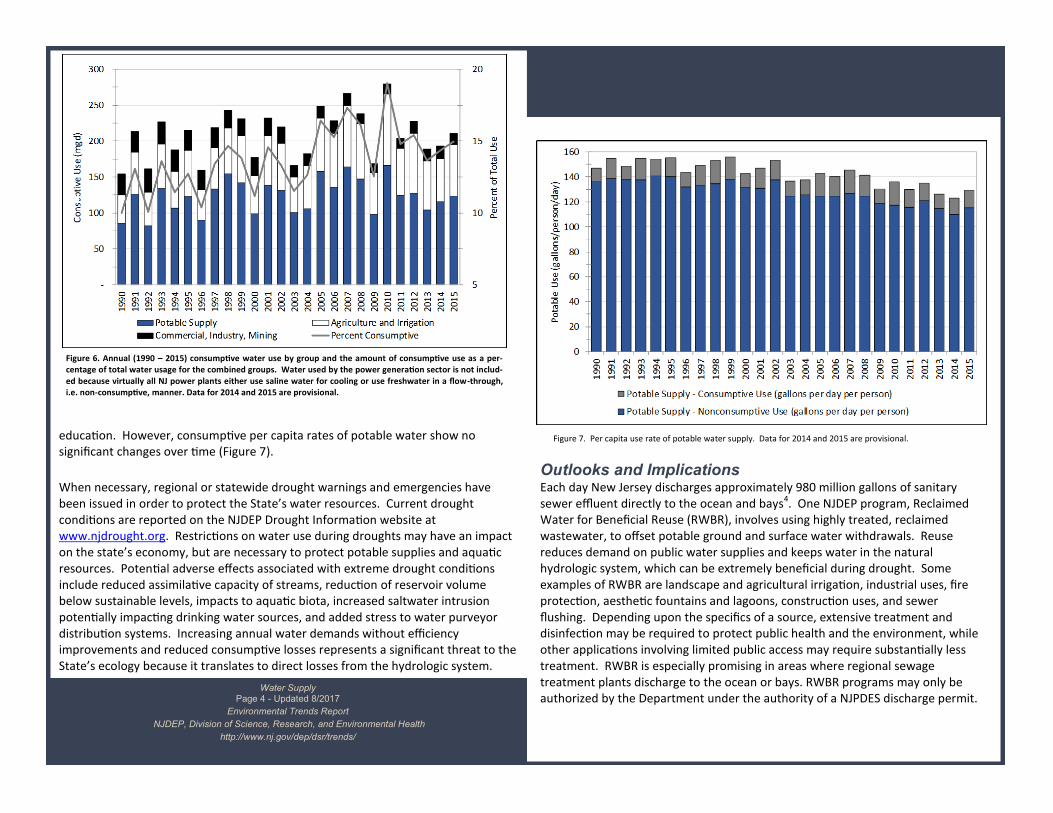
Consumptive use (a.k.a. consumptive loss) describes water that is lost via evaporation and transpiration and is otherwise unavailable for reuse within the basin from which the withdrawal took place. The amount of consumptive use depends on the specific user and the season but is typically greatest as a percentage of total use for agricultural and irrigational purposes. Excluding water used for power generation, over half of the consumptive use is associated with potable supply (Figure 6). No significant trend in total consumptive use was observed for the period 1990 to 2015 or the more recent 10-year period (Figure 6). Although, consumptive use as a percentage of the total annual use has ranged from 9.9 to 19.0% over the 26-year period (Figure 6) and showed a slight increasing trend (Kendall Tau Correlation, tau = 0.446, p < 0.01), there has been no significant trend evident over the past 10 years. Consumptive use from agriculture and irrigation purposes ranged from 30.4 to 71.6% of total agricultural and irrigation use and has
steadily increased over the 26-year period (Kendall Tau Correlation, tau = 0.711, p < 0.001), but shows no significant trend over the past 10 years. An explanation for the long term increase in consumptive use for agriculture and irrigation may be in part, due to changing summer irrigation practices and shifting agricultural crops.6
Over the 26-year period, consumptive losses associated with potable water supply have accounted for 51 to 64 percent of total consumptive losses with no significant trend over that time. Potable water supply consumptive losses ranged from 7.1 to 13.8 percent of total potable water use and shows no appreciable change over time. Total per capita
potable usage has declined (Kendall Tau Correlation, tau = -0.662, p < 0.001) due in large part to plumbing code changes, increasing water efficiencies, and
Figure 4. Annual potable supply use (million gallons per day, mgd) for the period 1990 – 2015. Data for 2014 and 2015 are provisional.
Figure 5. Pie charts showing the average annual use (million gallons per day, mgd) for the 10-year period 2006 – 2015 (top) and the average annual consump-tive use (million gallons per day, mgd) for the same period (bottom). Water used by the power generation sector is not included because virtually all NJ power plants either use saline water for cooling or use freshwater in a flow-through, i.e. non-consumptive, manner. Data for 2014 and 2015 are provisional.
Water Supply
Page 4 - Updated 8/2017
Environmental Trends Report
NJDEP, Division of Science, Research, and Environmental Health
http://www.nj.gov/dep/dsr/trends/
education. However, consumptive per capita rates of potable water show no significant changes over time (Figure 7). When necessary, regional or statewide drought warnings and emergencies have been issued in order to protect the State’s water resources. Current drought conditions are reported on the NJDEP Drought Information website at www.njdrought.org. Restrictions on water use during droughts may have an impact on the state’s economy, but are necessary to protect potable supplies and aquatic resources. Potential adverse effects associated with extreme drought conditions include reduced assimilative capacity of streams, reduction of reservoir volume below sustainable levels, impacts to aquatic biota, increased saltwater intrusion potentially impacting drinking water sources, and added stress to water purveyor distribution systems. Increasing annual water demands without efficiency improvements and reduced consumptive losses represents a significant threat to the State’s ecology because it translates to direct losses from the hydrologic system.
Figure 6. Annual (1990 – 2015) consumptive water use by group and the amount of consumptive use as a per-centage of total water usage for the combined groups. Water used by the power generation sector is not includ-ed because virtually all NJ power plants either use saline water for cooling or use freshwater in a flow-through, i.e. non-consumptive, manner. Data for 2014 and 2015 are provisional.
Outlooks and Implications Each day New Jersey discharges approximately 980 million gallons of sanitary sewer effluent directly to the ocean and bays4. One NJDEP program, Reclaimed Water for Beneficial Reuse (RWBR), involves using highly treated, reclaimed wastewater, to offset potable ground and surface water withdrawals. Reuse reduces demand on public water supplies and keeps water in the natural hydrologic system, which can be extremely beneficial during drought. Some examples of RWBR are landscape and agricultural irrigation, industrial uses, fire protection, aesthetic fountains and lagoons, construction uses, and sewer flushing. Depending upon the specifics of a source, extensive treatment and disinfection may be required to protect public health and the environment, while other applications involving limited public access may require substantially less treatment. RWBR is especially promising in areas where regional sewage treatment plants discharge to the ocean or bays. RWBR programs may only be authorized by the Department under the authority of a NJPDES discharge permit.
Figure 7. Per capita use rate of potable water supply. Data for 2014 and 2015 are provisional.

Water Supply
Page 5 - Updated 8/2017
Environmental Trends Report
NJDEP, Division of Science, Research, and Environmental Health
http://www.nj.gov/dep/dsr/trends/
Regionally, some areas (for example, the Northeast drought region and the lower Cape May peninsula) currently face water supply challenges, which will require continued scrutiny and innovative water management strategies moving forward. Overall statewide, sufficient water supplies exist to meet demands – both current and as projected– provided efforts to increase efficiency, reduce consumptive water loss (from outdoor water use/landscape irrigation), and adequately maintain/enhance interconnections between water systems and other related infrastructure are instituted
More Information
Data summarized for this chapter were provided by the Department of Environmental Protection, Division of Water Supply and Geoscience. Visit their website at http://www.njgeology.org/ for additional information and data sources.
References
1New Jersey Office of the State Climatologist, available at http://climate.rutgers.edu/stateclim_v1/nclimdiv/ 2N.J.S.A. 58:1A-1 et. seq. 3New Jersey Department of Labor and Workforce Development. 2014. Population and Labor Force Projections for New Jersey: 2014 to 2034. Table 1. Available online at http://lwd.state.nj.us/labor/lpa/dmograph/lfproj/sptab1.htm 4New Jersey Geological and Water Survey. DGS10-3 New Jersey Water Transfer Model Withdrawal, Use, and Return Data Summaries. Updated June 2015. Available at http://www.nj.gov/dep/njgs/geodata/dgs10-3.htm.
5Hoffman, J.L. and S.E. Lieberman. 2000. New Jersey Water Withdrawals 1990-1996. New Jersey Geological Survey Open-File Report OFR 00-1. Available online at www.state.nj.us/dep/njgs/pricelst/ofreport/ofr00-1.pdf.
6Personal Communication with Steve Domber, New Jersey Geological and Water Survey. January 27, 2017.