water utility benchmarking: measurement,...
TRANSCRIPT
“Leadership in Infrastructure Policy” www.purc.ufl.edu1
Sanford V. BergDistinguished Service Professor—Economics
Director of Water Studies, PURC
(With assistance from Rui Cunha Marques)
Water Utility Benchmarking: Measurement, Methodologies, and Performance Incentives

“Leadership in Infrastructure Policy” www.purc.ufl.edu2
Some Thoughts
Spare us from cowardice that shrinks from new truths;
Spare us from laziness that is content with half-truths; and
Spare us from arrogance in thinking that we know all truth.

“Leadership in Infrastructure Policy” www.purc.ufl.edu3
Public Utility Research Center
Research Expanding the body of knowledge in public utility regulation, market reform, and infrastructure operations (e.g. benchmarking studies of Peru, Uganda, Brazil and Central America)
Education Teaching the principles and practices that support effective utility policy and regulation (e.g. PURC/World Bank International Training Program on Utility Regulation and Strategy, January 2010)
Service Engaging in outreach activities that provide ongoing professional development and promote improved regulatory policy and infrastructure management (30 in-country trainings and university collaborations)

“Leadership in Infrastructure Policy” www.purc.ufl.edu4
The Body of Knowledge on Infrastructure Regulation is divided into seven main sections. Chapter I introduces the general concepts presented in the Body of Knowledge.
www.regulationbodyofknowledge.orgNarratives summarize key topics
Additional Resources: Glossary in Spanish and four other languages
Frequently Asked Questions, including
•Social pricing to promote access
•Management and regulation of State-owned Enterprises
500 PDFs as References
Self-paced Quizzes (for capacity building and classrooms)

“Leadership in Infrastructure Policy” www.purc.ufl.edu5
Context for Managers and Regulators
Significant change is a continuing condition: the future holds more unknowns than it does certainties.
Task: develop fresh perspectives and knowledge about the future, trusting the wisdom of the past.
Civil Society demands performance improvements (e.g. Unaccounted for water).
(Mark Jamison and Araceli Castaneda, 2009)
“Leadership in Infrastructure Policy” www.purc.ufl.edu6
1. Next practices, not best practices
Best practice is about imitation (following in someone else’s footsteps). A focus on next practice is needed when we are going into areas where no one has gone before.
Implication: Consider Metric Benchmarking
Heifetz, Grashow, and Linsky. 2009.“Leadership in a (Permanent) Crisis.” Harvard Business Review
“Leadership in Infrastructure Policy” www.purc.ufl.edu7
2. Focus on Why rather than on What When we ask ourselves “What should we
do next?” we emphasize practice. But the practice needs a foundation, basic principles, and values.
Ask “Why have certain practices been successful or unsuccessful?” so that we analyze our underlying priorities and our context.
We learn, keep what is important, and discard what holds us back.
Collins, 2009. How the Mighty Fall and Why Some Companies Never Give in
“Leadership in Infrastructure Policy” www.purc.ufl.edu8
3. Leadership vs. Leading
A leader provides direction (when the right direction is already known).
Leadership mobilizes people to tackle difficult and often ambiguous problems and circumstances.
Decision-makers currently face uncertainty and ambiguity. They need to exercise leadership.
(Heifetz, Ronald A. 1994. Leadership Without Easy Answers, p. 15)

“Leadership in Infrastructure Policy” www.purc.ufl.edu9
Benchmarking: Can an Index Capture Complexity?
A single index of utility performance will be neither comprehensive nor fully diagnostic.
• Physician can have information on a patient’s temperature, pulse, height and weight.
• Patient is in trouble: dangerous fever and/or is significantly overweight.
• Blood tests provide more detailed information• Diagnosing and treating mental health issues would
require other diagnostics and treatments . . . Still, temperature and weight provide useful information.

“Leadership in Infrastructure Policy” www.purc.ufl.edu10
Issues
5 How should prices be set?
1 Why do regulators and managers benchmark?
2 What are the available techniques?
3 Identifying strong and weak performance
4 Providing incentives
6 Concluding remarks

“Leadership in Infrastructure Policy” www.purc.ufl.edu11
Why do regulators and managers benchmark?
“Leadership in Infrastructure Policy” www.purc.ufl.edu12
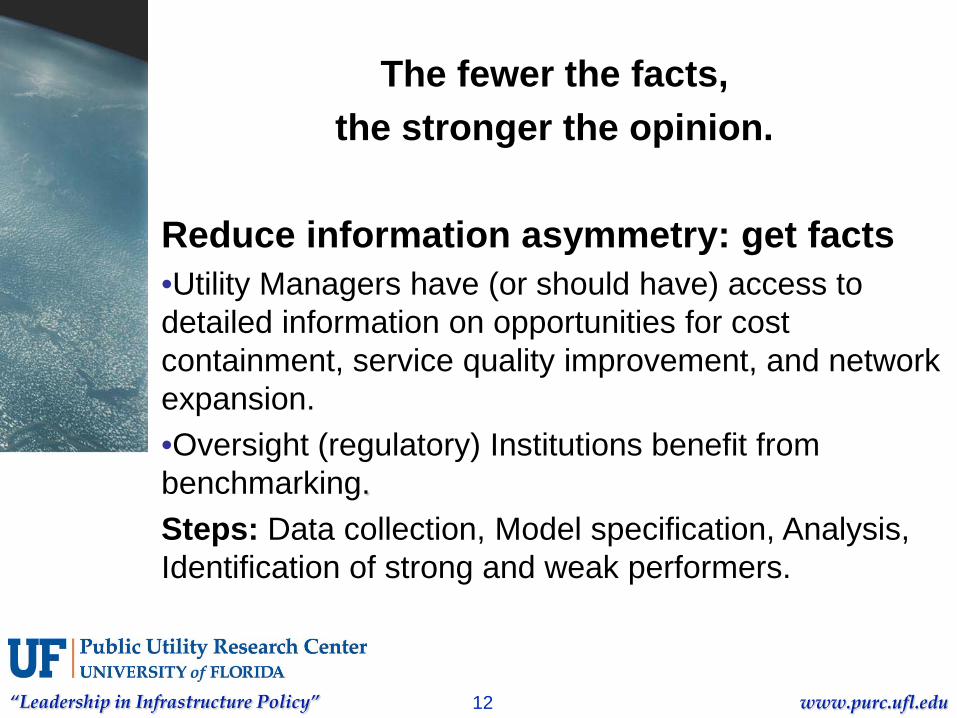
The fewer the facts, the stronger the opinion.
Reduce information asymmetry: get facts •Utility Managers have (or should have) access to detailed information on opportunities for cost containment, service quality improvement, and network expansion.•Oversight (regulatory) Institutions benefit from benchmarking.Steps: Data collection, Model specification, Analysis, Identification of strong and weak performers.
“Leadership in Infrastructure Policy” www.purc.ufl.edu13
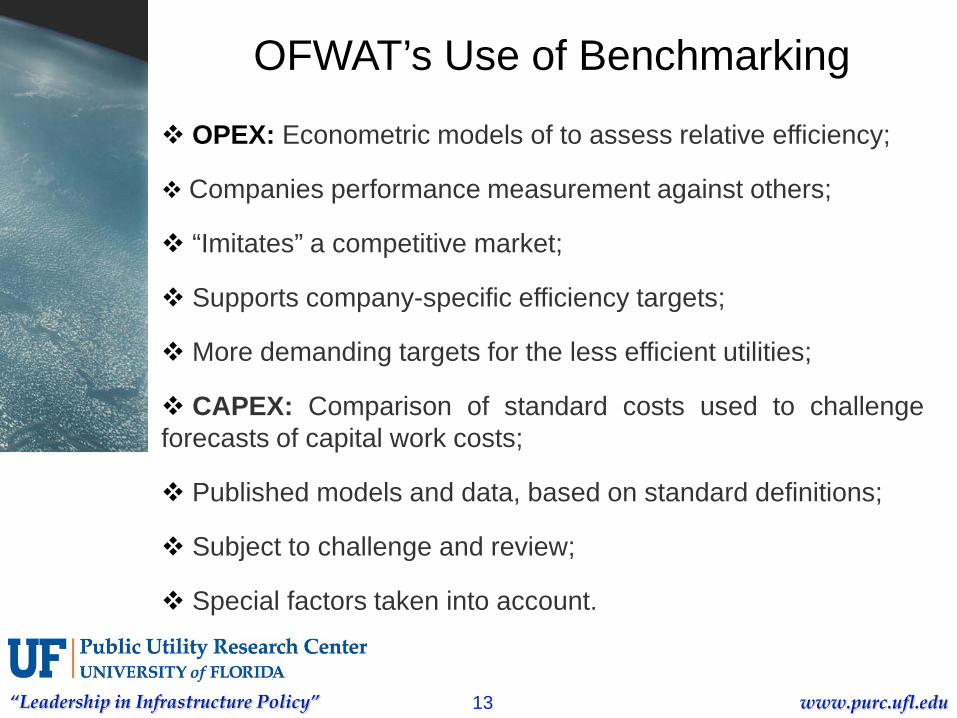
OFWAT’s Use of Benchmarking
OPEX: Econometric models of to assess relative efficiency;
Companies performance measurement against others;
“Imitates” a competitive market;
Supports company-specific efficiency targets;
More demanding targets for the less efficient utilities;
CAPEX: Comparison of standard costs used to challengeforecasts of capital work costs;
Published models and data, based on standard definitions;
Subject to challenge and review;
Special factors taken into account.

“Leadership in Infrastructure Policy” www.purc.ufl.edu14
Cost Example: Ofwat Water Service Model (Y = Opex*)
Y: Operating expenditures (less “exceptional items”,
rates, third party services, abstraction charges, pumping costs)
Ln Y = 3.57 + 0.471 Ln X1 + 0.468 Ln X2
- 1.575 Ln X3
X1 = water delivered in Ml/dayX2 = length of main in kmX3 = proportion of water delivered to measured non-
households (Chaplin, United Utilities)
“Leadership in Infrastructure Policy” www.purc.ufl.edu15
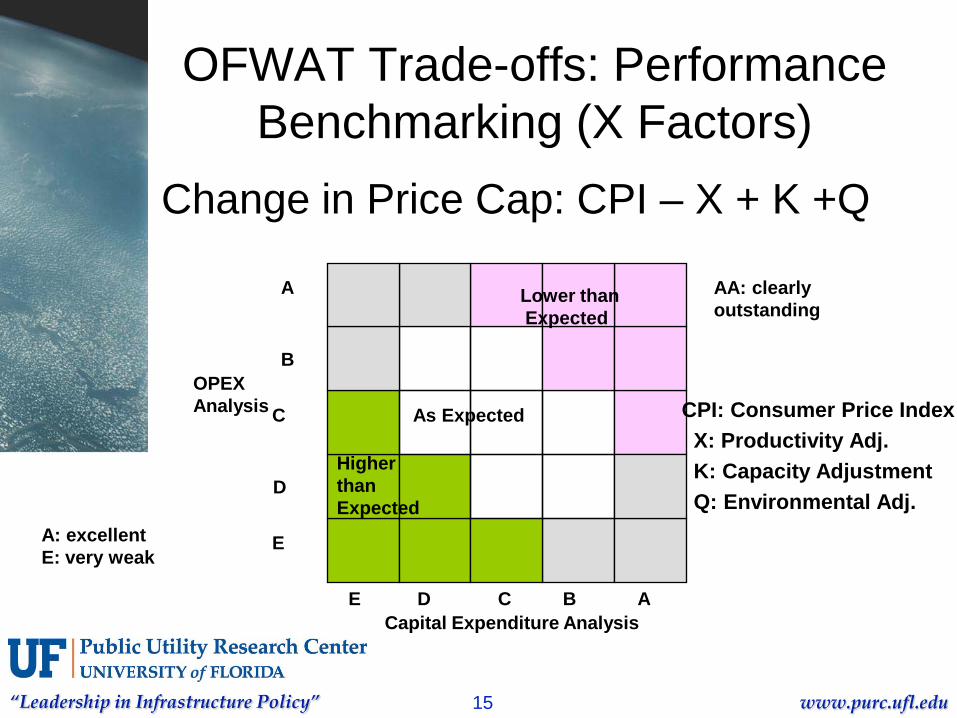
OFWAT Trade-offs: Performance Benchmarking (X Factors)
Change in Price Cap: CPI – X + K +Q
Capital Expenditure Analysis
OPEXAnalysis
E D C B A
A
B
C
D
E
Lower thanExpected
Higher thanExpected
As Expected
A: excellentE: very weak
AA: clearlyoutstanding
CPI: Consumer Price IndexX: Productivity Adj.K: Capacity AdjustmentQ: Environmental Adj.

“Leadership in Infrastructure Policy” www.purc.ufl.edu16
Projections vs. Actual OPEX
2,000
2,200
2,400
2,600
2,800
3,000
3,200
3,400
3,600
3,800
4,000
1989
1990
1991
1992
1993
1994
1995
1996
1997
1998
1999
2000
2001
2002
2003
2004
2005
2006
2007
2008
2009
2010
Financial year to 31 March
1999 projection by companies
1994 final determination
Actual total operating
expenditure
Ministers' assumptions in
19892004
projection by companies
2004 final determination
1999 final determination
“Leadership in Infrastructure Policy” www.purc.ufl.edu17
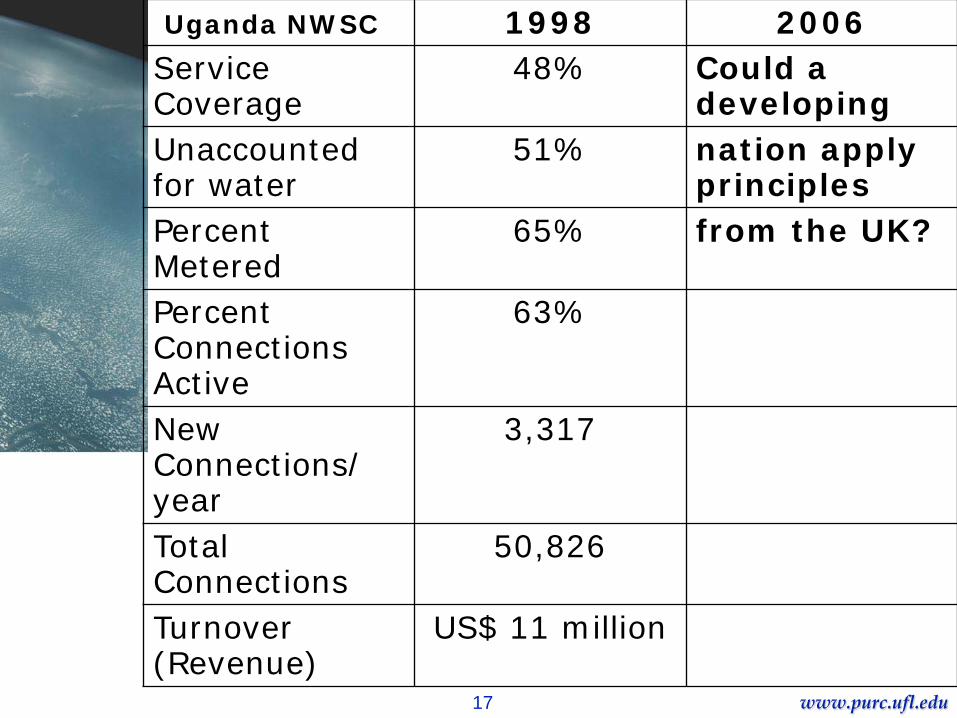
Uganda NWSC 1998 2006Service Coverage
48% Could a developing
Unaccounted for water
51% nation apply principles
Percent Metered
65% from the UK?
Percent Connections Active
63%
New Connections/ year
3,317
Total Connections
50,826
Turnover (Revenue)
US$ 11 million
“Leadership in Infrastructure Policy” www.purc.ufl.edu18
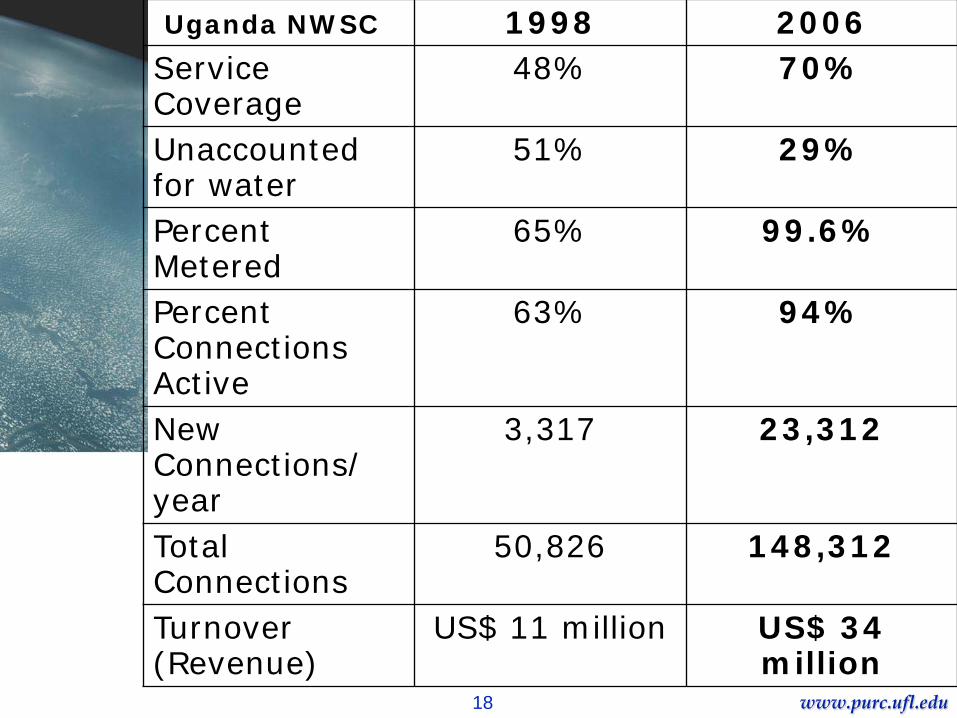
Uganda NWSC 1998 2006Service Coverage
48% 70%
Unaccounted for water
51% 29%
Percent Metered
65% 99.6%
Percent Connections Active
63% 94%
New Connections/ year
3,317 23,312
Total Connections
50,826 148,312
Turnover (Revenue)
US$ 11 million US$ 34 million

“Leadership in Infrastructure Policy” www.purc.ufl.edu19
Incentives Based on BenchmarkingUnderstanding past and current performanceEstablishing open communication between
workers, managers & executivesDeveloping achievable goals & sound strategiesIncreasing accountability for workers &
managersDesigning incentives & rewards to encourage
efficiency (bonuses of 50% if targets met)Reviewing progress and readjusting strategies“Using internal incentive contracts to improve water utility performance: the case of Uganda’s NWSC,” by Mugisha, Berg, & Muhairwe, Water Policy, 2007.
“Leadership in Infrastructure Policy” www.purc.ufl.edu20
Okay, Benchmarking can Improve Performance.
What are the available techniques?
“Leadership in Infrastructure Policy” www.purc.ufl.edu21
Rui Cunha Marques
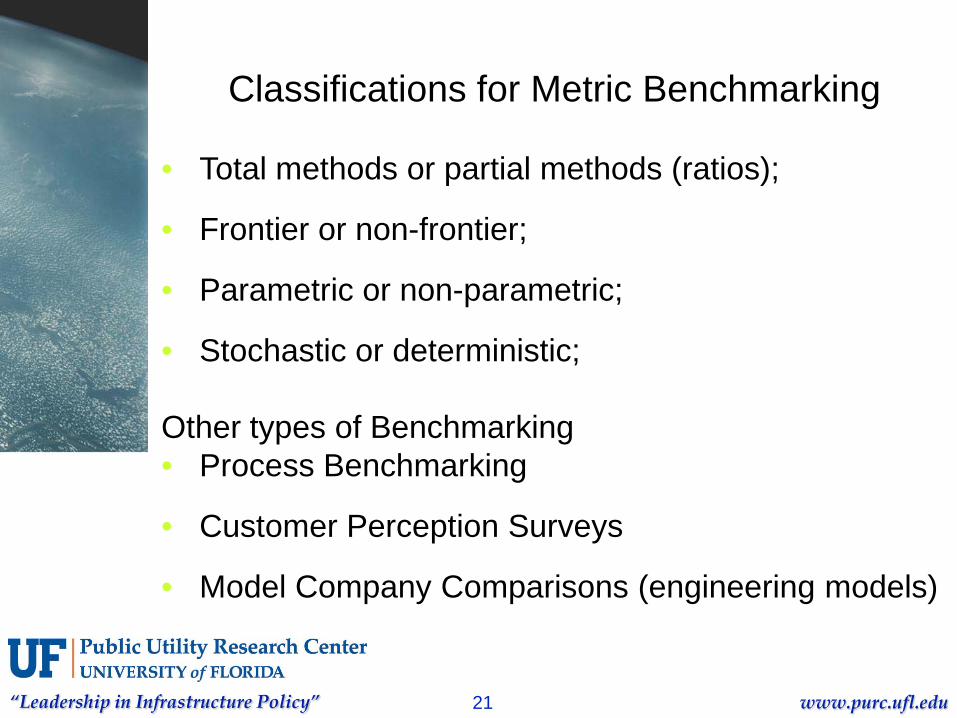
Classifications for Metric Benchmarking
• Total methods or partial methods (ratios);
• Frontier or non-frontier;
• Parametric or non-parametric;
• Stochastic or deterministic;
Other types of Benchmarking• Process Benchmarking
• Customer Perception Surveys
• Model Company Comparisons (engineering models)
“Leadership in Infrastructure Policy” www.purc.ufl.edu22
Rui Cunha Marques
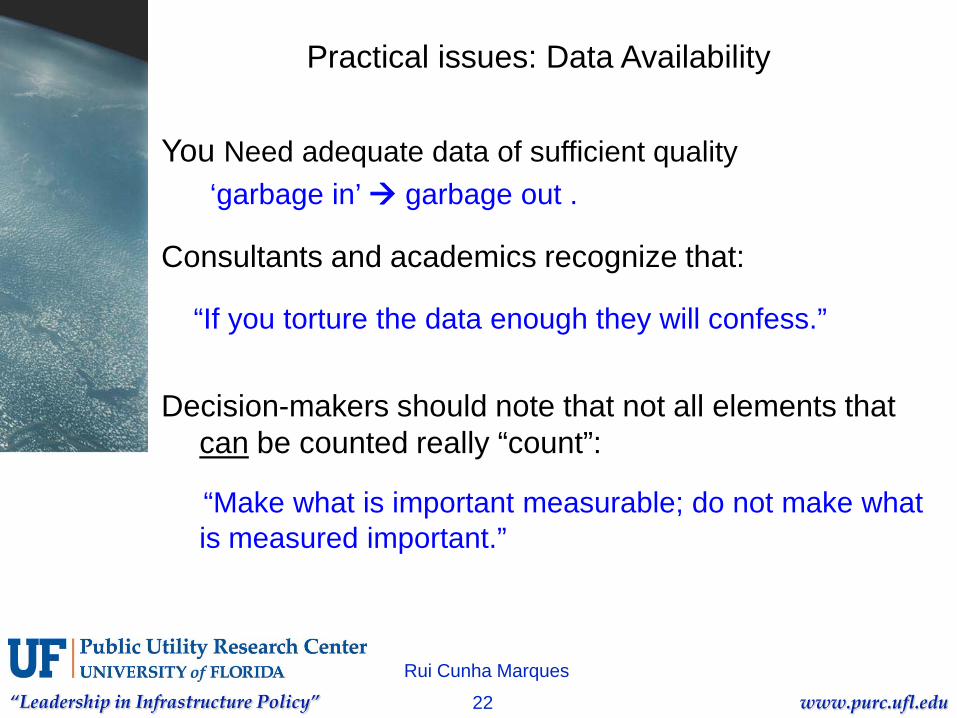
You Need adequate data of sufficient quality ‘garbage in’ garbage out .
Consultants and academics recognize that:
“If you torture the data enough they will confess.”
Decision-makers should note that not all elements that can be counted really “count”:
“Make what is important measurable; do not make what is measured important.”
Practical issues: Data Availability
“Leadership in Infrastructure Policy” www.purc.ufl.edu23
Rui Cunha Marques
Identifying strong and weak performance:
Data from PURC Case

“Leadership in Infrastructure Policy” www.purc.ufl.edu24
Rui Cunha Marques
You have collected data: twenty water distribution utilities.
1. Rankings: Identify the three best and the three worst performing firms.
2. Rationale: Explain why you placed these firms in these categories.
3. Robustness: How would you determine whether your rankings (or performance scores) are robust?
Find a partner and examine the data
“Leadership in Infrastructure Policy” www.purc.ufl.edu25
Rui Cunha Marques
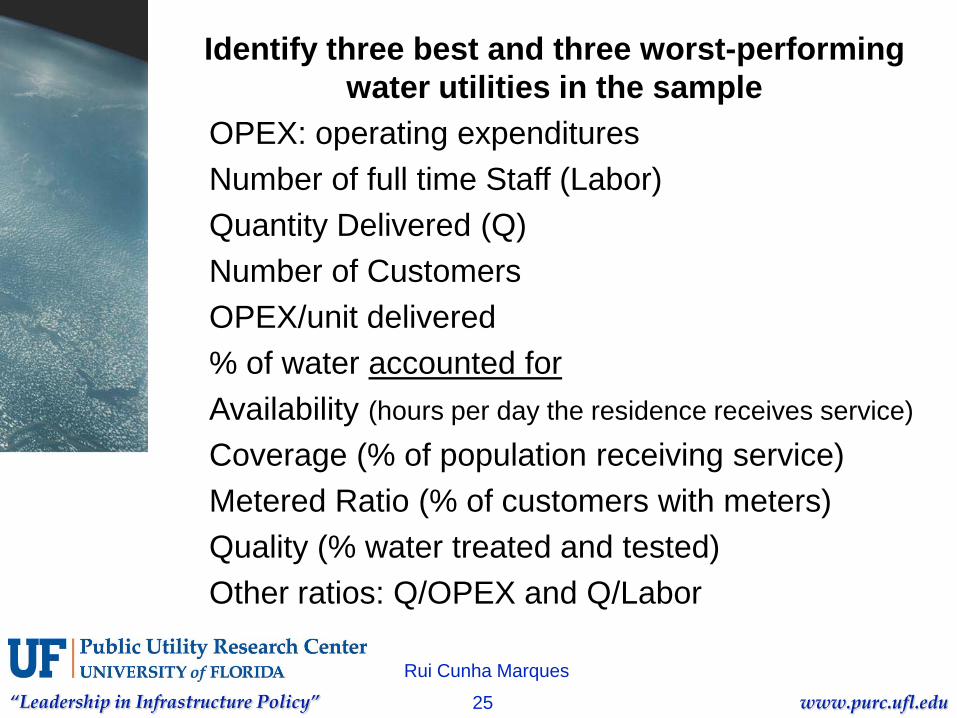
Identify three best and three worst-performing water utilities in the sample
OPEX: operating expendituresNumber of full time Staff (Labor)Quantity Delivered (Q)Number of CustomersOPEX/unit delivered% of water accounted forAvailability (hours per day the residence receives service)
Coverage (% of population receiving service)Metered Ratio (% of customers with meters)Quality (% water treated and tested)Other ratios: Q/OPEX and Q/Labor

“Leadership in Infrastructure Policy” www.purc.ufl.edu26
Votes Strong, Weak1 112 123 134 145 156 167 178 189 1910 20
“Leadership in Infrastructure Policy” www.purc.ufl.edu27
Providing incentives

“Leadership in Infrastructure Policy” www.purc.ufl.edu28
Rankings:Many benefits:Very useful. They are effective in calling attention
of stakeholders to issues!... Sunshine Regulatino (“name and shame”)Consequences for tariff-setting (carrot and stick
approach).
Several shortcomings:Selection of performance measures (often partial
ones);Weighting the indicators;Dealing with bad and missing data;Reliability; Stability (over time).

“Leadership in Infrastructure Policy” www.purc.ufl.edu29
Rui Cunha MarquesRui Cunha Marques
Robustness of rankings:
Empirical rules: Minimum and maximum scores; The same trend; Comparable means, standard deviations, and
other distributional properties; Stability over time; Correlation with intuitive partial measures.
Statistical tests: Spearman and Pearson tests Kendall Tau when there are ties

“Leadership in Infrastructure Policy” www.purc.ufl.edu30
Importance of regulatory processesutilizing performance incentives:
Advantages:Offering strong incentives towards efficiency and
innovation;Fostering the sharing and transparency of
information;Problems: Omitted explanatory factors? Does the methodology affect the results? Confidence in the underlying Data? Is there trust among stakeholders?

“Leadership in Infrastructure Policy” www.purc.ufl.edu31
Once we can rank performance,
How should prices be set?

“Leadership in Infrastructure Policy” www.purc.ufl.edu32
Rui Cunha Marques
Problems of price cap regulation when comparedwith rate-of-return (attention to quality);
The regulatory review period (incentive versusrisk);
X Factor for whole the sector or individual firm(depending on the activity regulated?)
How can each firm get close to the frontier? Whatis a reasonable target?
The annual target should reflect gradual (notinstantaneous) attainment (e.g. trying to attain thefourth quartile (75%);
“Leadership in Infrastructure Policy” www.purc.ufl.edu33
Rui Cunha Marques
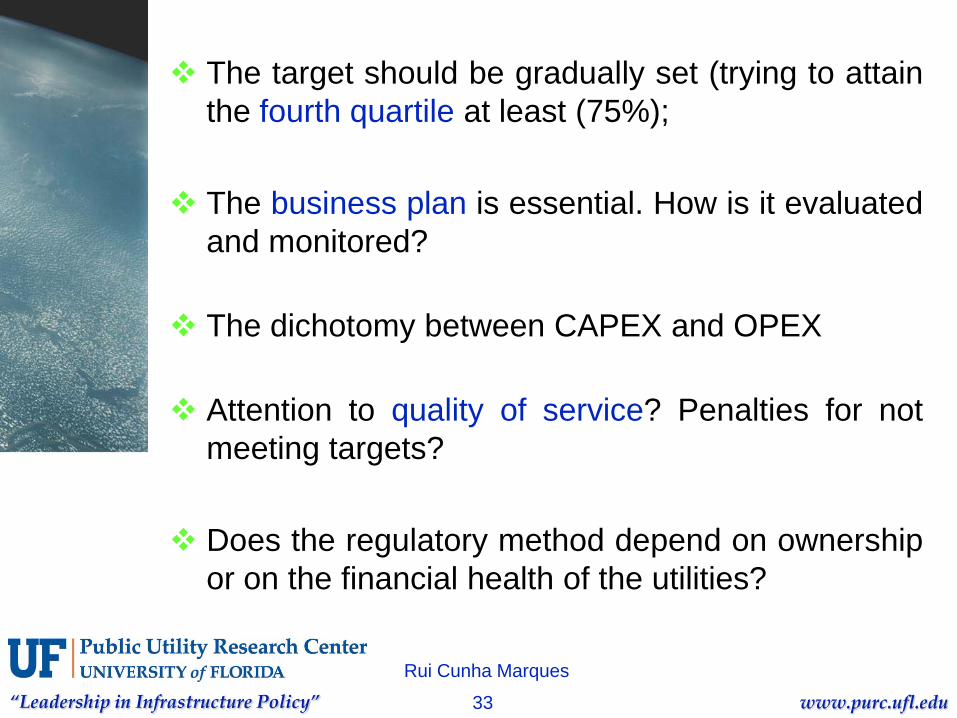
The target should be gradually set (trying to attainthe fourth quartile at least (75%);
The business plan is essential. How is it evaluatedand monitored?
The dichotomy between CAPEX and OPEX
Attention to quality of service? Penalties for notmeeting targets?
Does the regulatory method depend on ownershipor on the financial health of the utilities?
“Leadership in Infrastructure Policy” www.purc.ufl.edu34
Rui Cunha Marques
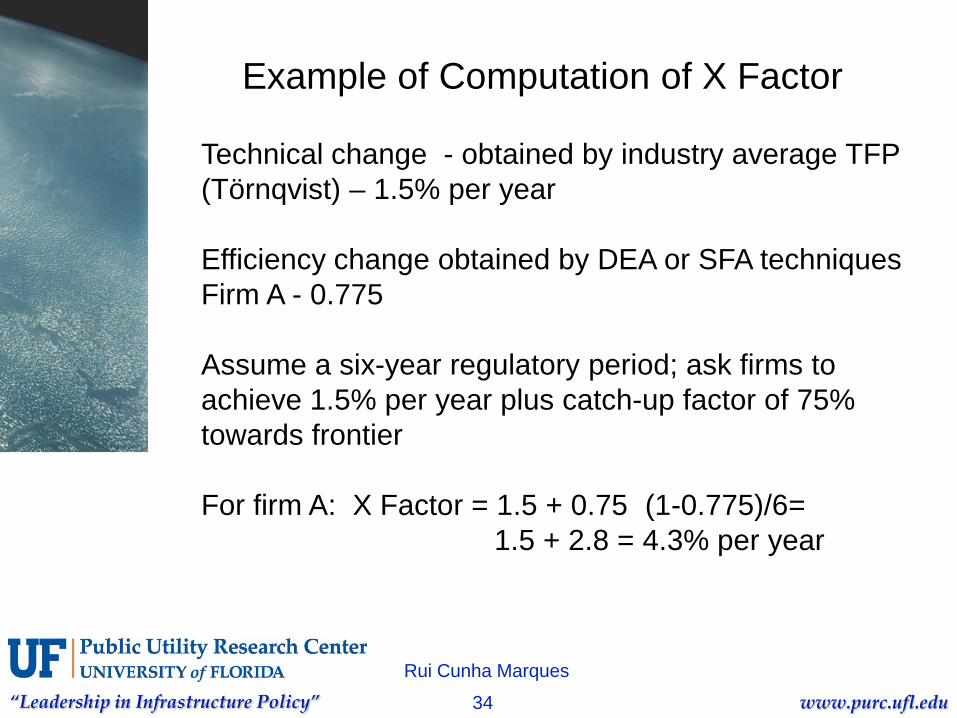
Example of Computation of X Factor
Technical change - obtained by industry average TFP (Törnqvist) – 1.5% per year
Efficiency change obtained by DEA or SFA techniquesFirm A - 0.775
Assume a six-year regulatory period; ask firms to achieve 1.5% per year plus catch-up factor of 75% towards frontier
For firm A: X Factor = 1.5 + 0.75 (1-0.775)/6= 1.5 + 2.8 = 4.3% per year

“Leadership in Infrastructure Policy” www.purc.ufl.edu35
Rui Cunha Marques
Concluding remarks
“Leadership in Infrastructure Policy” www.purc.ufl.edu36
Benchmarking is Part of the Tool-kit for Regulators and Managers
The application of the techniques summarized here can improve service quality, expand networks, and optimize operations.
Any benchmarking study will have limitations, but sound studies can be used to place the burden of proof on other parties who might argue that the analysis is incomplete or incorrect.
Over time, data availability will improve and studies will be strengthened as professionals gain experience with these quantitative techniques.

“Leadership in Infrastructure Policy” www.purc.ufl.edu37
Improving Health: “Do No Harm”Benchmarking specialists produce and
critique studies that utilize various methodologies.
Rankings can be manipulated by choice of variables, model specification, sample size, time frame, and outliers.
Results can be misinterpreted & misused. High stakes are high, relative and
absolute performance comparisons affect careers
“Leadership in Infrastructure Policy” www.purc.ufl.edu38
Summing Up
Rankings can serve as catalysts for better stewardship of water and other resources.
If regulators cannot identify historical trends, determine today’s baseline performance, and quantify relative performance across utilities, then as an Indian regulator said, they may as well be writing “pretty poetry”.

“Leadership in Infrastructure Policy” www.purc.ufl.edu39
Conflict Resolution Matrix
Conflict OverFacts
Conflict OverDistribution ofGains & Costs
Conflict OverWhat is important
Conflict OverJurisdiction or
Authority
AddressedBy ResearchAnd Negotiation
Addressed By Research
Addressed byEngagingPeople withAdaptive Challengesin ResearchAnd Dialogue
TechnicalWork
AdaptiveWork
(From Mark Jamison)
“Leadership in Infrastructure Policy” www.purc.ufl.edu40
Informal Survey
1. Authority: Is the regulatory agency used to help resolve key issues or is it by-passed? Are you in the middle of “turf wars”?
2. Facts: Has benchmarking been used to improve sector performance? Are contracts and targets based on reality?
3. Values: Does the regulatory agency help clarify how the targets reflect goals or stated political objectives?
4. Special Interests: Have regulatory decisions been inconsistent due to the influence of special interests? Are prices too low or too high? Costs?
“Leadership in Infrastructure Policy” www.purc.ufl.edu41
Technical Appendix
• Practical Issues (inputs, outputs, explanatory factors)
• Global Productivity Measures• DEA and SFA
Rui Cunha Marques
“Leadership in Infrastructure Policy” www.purc.ufl.edu42
Rui Cunha Marques
Regulatory benchmarking has benefits:
Encourages the operators to be efficient (bothregarding the OPEX and CAPEX);
Assures a “fair” recovery of the costs and enabling a“fair” rate of return on investment;
Improves information sharing and transparency;
However, conduct studies with care:
Method cannot be subjective nor discretionary;
“Leadership in Infrastructure Policy” www.purc.ufl.edu43
Rui Cunha Marques
Technical Issues
Heterogeneity problems (comparing “apples with oranges”);
Not all the kind of costs are known or included in the analysis (e.g. water resource availability in the future);
The differences between the costs of the different peers might be due to inefficiency, to measurement errors, or to historical factors beyond current management’s control;
The X Factor, based on differences of efficiency between regulated firms, might not capture all the explanatory factors.
“Leadership in Infrastructure Policy” www.purc.ufl.edu44
Rui Cunha Marques
Better simple models with robust analysis and consistency checks
than complex models with superficial analyses
Model specification:
OPEX/CAPEX/TOPEX models; Physical or monetary units; The degrees of freedom; Production/cost models; Panel data/cross sectional data; Number of comparators/international comparators; Adjusting for environment; Outliers; Quality versus economical issues;
Practical issues: Model Specification

“Leadership in Infrastructure Policy” www.purc.ufl.edu45
Rui Cunha Marques
Practical issues: Inputs
What are the inputs of the network utilities? OPEX Operating Expenditures
CAPEX Capital Expenditures (annual outlays on investments)
CAPITAL ASSETS (cumulative investment less economic depreciation)
or
TOPEX (Total Costs)
Is this disaggregation enough? Or should it be divided intostaff and other OPEX, recognizing outsourcing and otherfactors?
Using just OPEX presents problems!... But, how should Capital be measured?
“Leadership in Infrastructure Policy” www.purc.ufl.edu46
Rui Cunha Marques
Practical issues: Measuring Capital Assets or CAPEX
In physical units, as in network length?
Other assets ? What about the quality or age of assets?
Might rural utilities be penalized if density ignored?
But isn’t the task easier in monetary units?
Book value, market value or replacement value?
What about the historical subsidies and stranded costs: how are they taken into account?
“Leadership in Infrastructure Policy” www.purc.ufl.edu47
Rui Cunha Marques
Practical issues: Outputs
The most used outputs are:
Volume of energy/water/… delivered (sold);
Number of customers (connections).
What is the importance of the percentage of industrialcustomers?
What features of rural utilities influence costs?
Why not consider the network length or the capacity ofnetwork length available to the customers?
Is there data on quality of output? What about ‘bad’ outputs(environmental damages)? What about financial or resourcesustainability?
“Leadership in Infrastructure Policy” www.purc.ufl.edu48
Rui Cunha Marques
Practical issues: Explanatory FactorsEXAMPLES from the water sector:
Weather; Assets’ age; % of non-residential customers; Water source; Availability of water resources and its quality; Topography; Peak factor; Customer density; Kind of soil; Local regulations and environment policies; Ownership; Regulation, …
They influence efficiency significantly. A particular variablemay not be statistically significant but it can influence softly theutilities efficiency or, in particular, a single utility’s ranking canbe dramatically affected.
“Leadership in Infrastructure Policy” www.purc.ufl.edu49
Rui Cunha Marques
Practical Issues: External Factors
Thus, efficiency is influenced by a set of external factors notcontrolled by the utility managers, such as:
Market structure factors (scale, scope and density economies);
Historical factors (past investments interfere with CAPEX/OPEX …);
Social factors (% of industrial customers, bigger customers,consuming habits, peak factor/density economies, GDP,…);
Environmental factors (weather, …);
Regulatory factors (regulation, prices policies, taxes, demandpolicies, …);
Local factors (topography, availability of resources, …).
“Leadership in Infrastructure Policy” www.purc.ufl.edu50
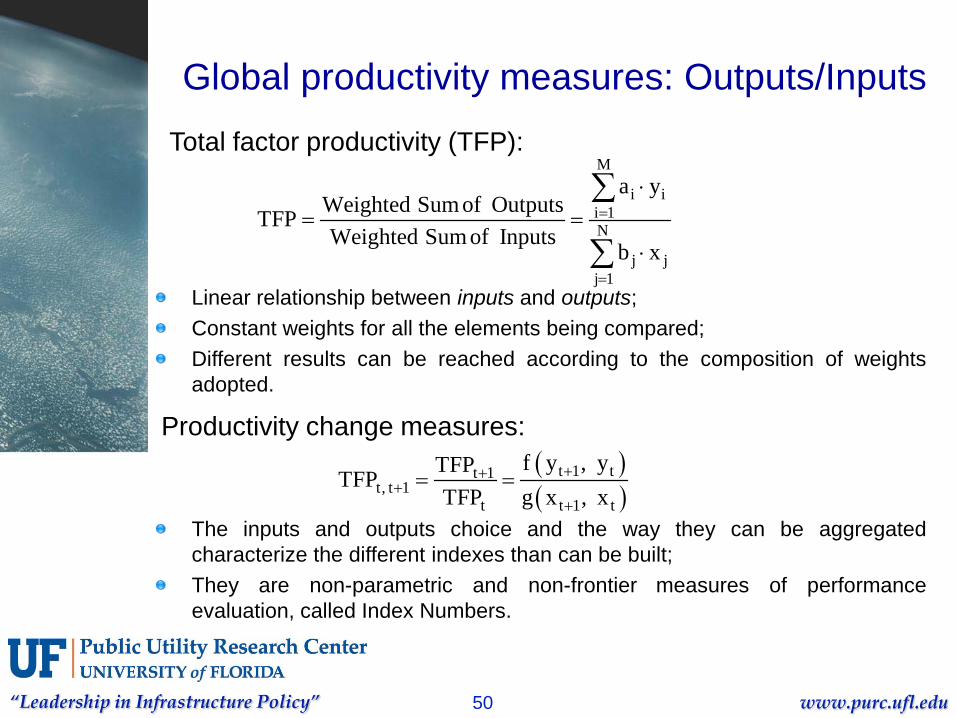
Global productivity measures: Outputs/Inputs
M
i ii 1N
j jj 1
a yWeighted Sum of OutputsTFPWeighted Sum of Inputs
b x
=
=
⋅= =
⋅
∑
∑
Total factor productivity (TFP):
( )( )
t 1 tt 1t, t 1
t t 1 t
f y , yTFPTFPTFP g x , x
+++
+= =
Productivity change measures:
Linear relationship between inputs and outputs;Constant weights for all the elements being compared;Different results can be reached according to the composition of weightsadopted.
The inputs and outputs choice and the way they can be aggregatedcharacterize the different indexes than can be built;They are non-parametric and non-frontier measures of performanceevaluation, called Index Numbers.

“Leadership in Infrastructure Policy” www.purc.ufl.edu51
The concept of efficiency is different from that of productivity;
Productivity is the ratio between the products (outputs) and the factors(inputs) used.Efficiency analysis involves establishing a standard and determininghow close the firm comes to meeting that standard. The operation atdifferent scales or distinct operational environments leads to differentproductivities.
•
Definitions
Efficiency
generally Static
Productivity
Dynamic
Y (Output)Fp2
c Fp1d
b a
X (Input)

“Leadership in Infrastructure Policy” www.purc.ufl.edu52
Out
put
Input
C
A
E
FD
B
Efficient Frontierx
xyy
C
C ⋅=
A’
A’’
A can raise the number of output produced and consume the same quantity of input, until A’ (Output orientation);A can reduce the consume of input, for the same level of production of output, until A’’ (Input orientation);Segment A’A’’ represents the possibilities that A has to improve.
Efficiencya
Effic
ienc
y
DEA Technique with 1 Input and 1 Output:Data Envelopment Analysis (DEA)
“Leadership in Infrastructure Policy” www.purc.ufl.edu53
Inpu
t 2/ O
utpu
t
Input1 / Output
C
A
G
F
B
Efficiency
Efficient frontier
E
D
C’
Radial contraction of Inputs
Effic
ienc
y
Target of C
Real FrontierEfficiency overestimation
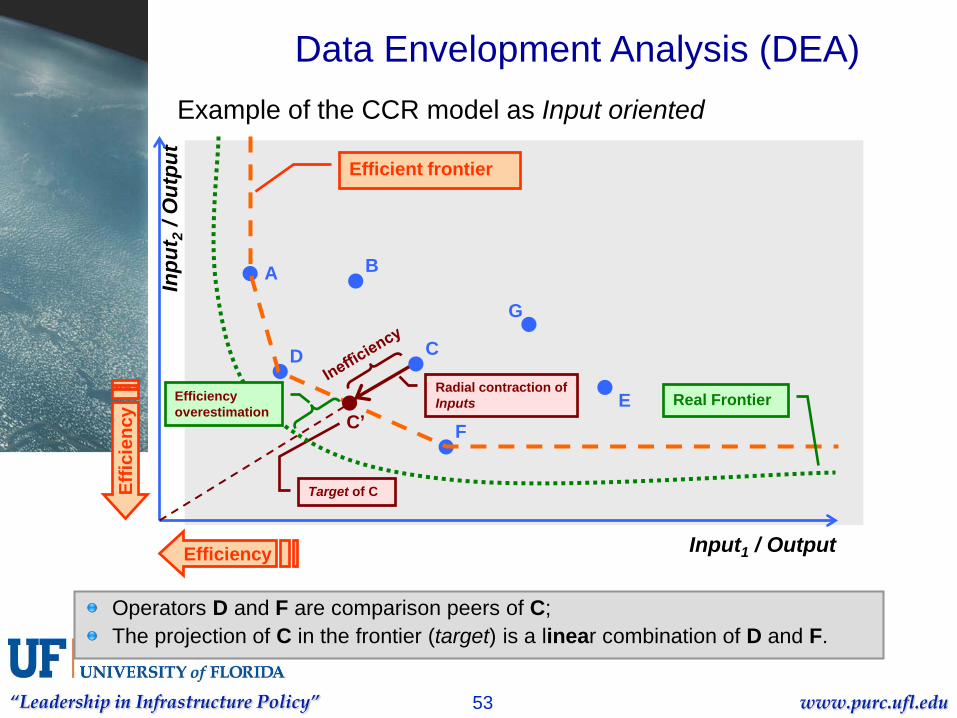
Operators D and F are comparison peers of C;The projection of C in the frontier (target) is a linear combination of D and F.
Example of the CCR model as Input oriented
Data Envelopment Analysis (DEA)

“Leadership in Infrastructure Policy” www.purc.ufl.edu54
Stochastic frontiers (SFA)Characterization:
An alternative methodology involving the estimation of parameters
The determination of the frontier is based on the maximum likelihood method;
Differs from other methodologies by separating the statistical error term fromthe inefficiency term.
SFA
Inefficiency
Error
( ) iinii vu,yfc ++β=
Input
“Leadership in Infrastructure Policy” www.purc.ufl.edu55
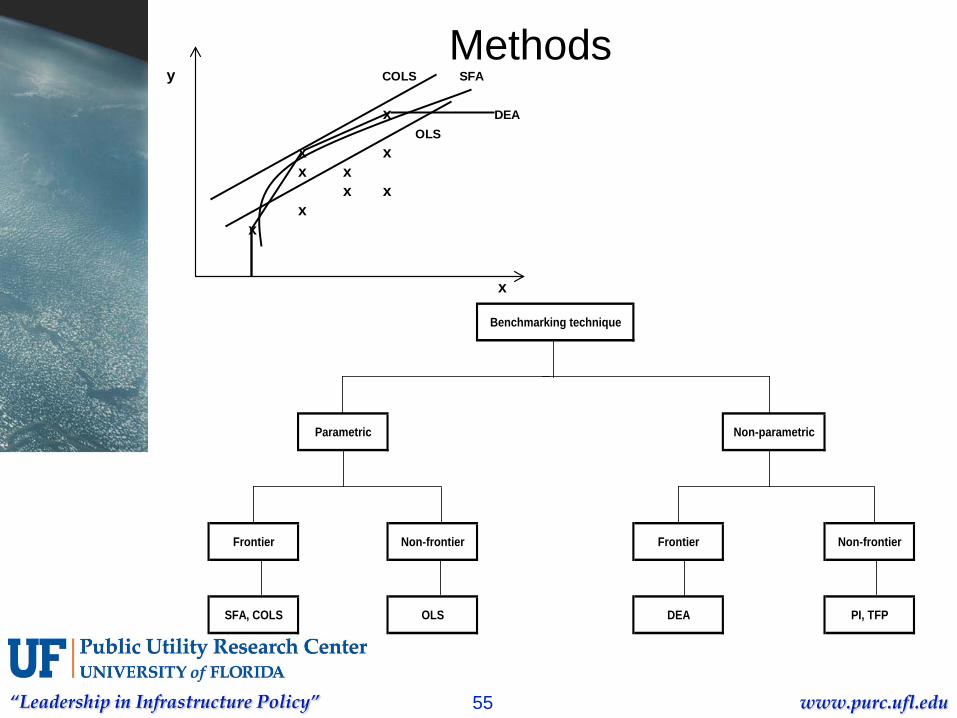
Methodsy COLS SFA
x DEA
x xx x
x xx
x
x
OLS
Benchmarking technique
Parametric Non-parametric
Frontier Non-frontier Frontier Non-frontier
SFA, COLS OLS DEA PI, TFP
“Leadership in Infrastructure Policy” www.purc.ufl.edu56
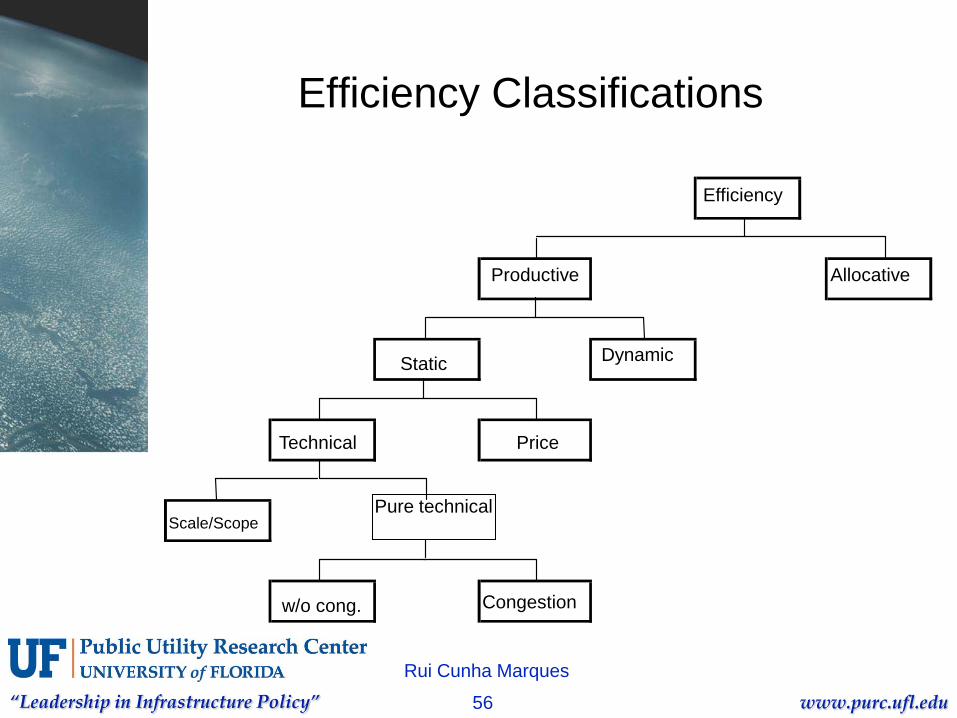
Efficiency Classifications
Rui Cunha Marques
Efficiency
Productive Allocative
Static Dynamic
Technical Price
Scale/ScopePure technical
w/o cong. Congestion
“Leadership in Infrastructure Policy” www.purc.ufl.edu57
Rui Cunha Marques
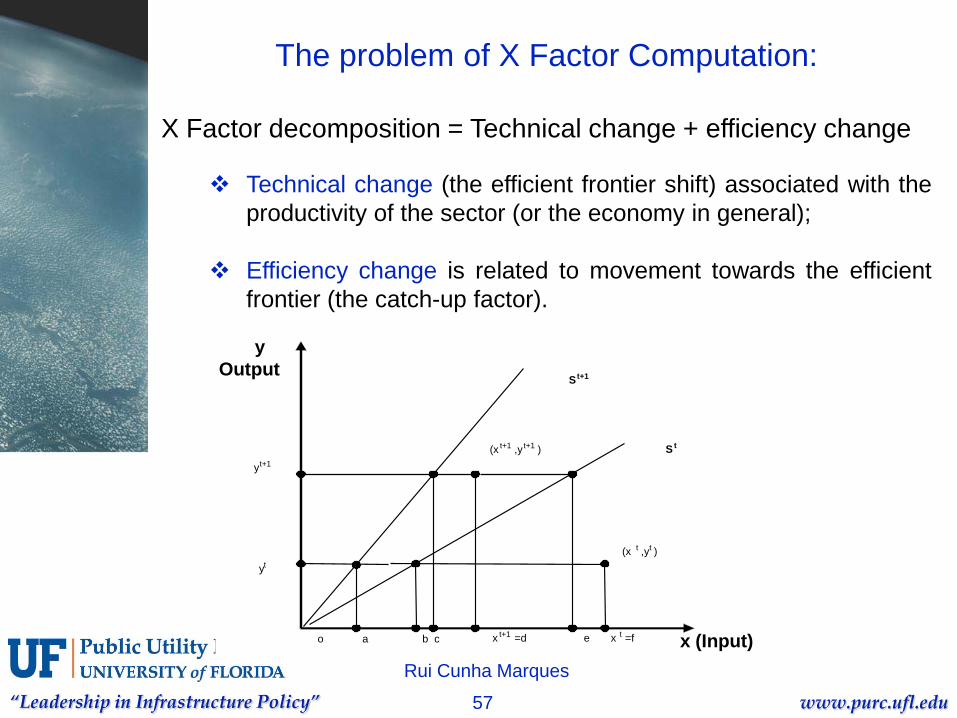
The problem of X Factor Computation:
X Factor decomposition = Technical change + efficiency change
Technical change (the efficient frontier shift) associated with theproductivity of the sector (or the economy in general);
Efficiency change is related to movement towards the efficientfrontier (the catch-up factor).
y Output
St+1
(x t+1 ,yt+1 ) St
yt+1
(x t ,yt )yt
o a b c x t+1 =d e x t =f x (Input)
“Leadership in Infrastructure Policy” www.purc.ufl.edu58
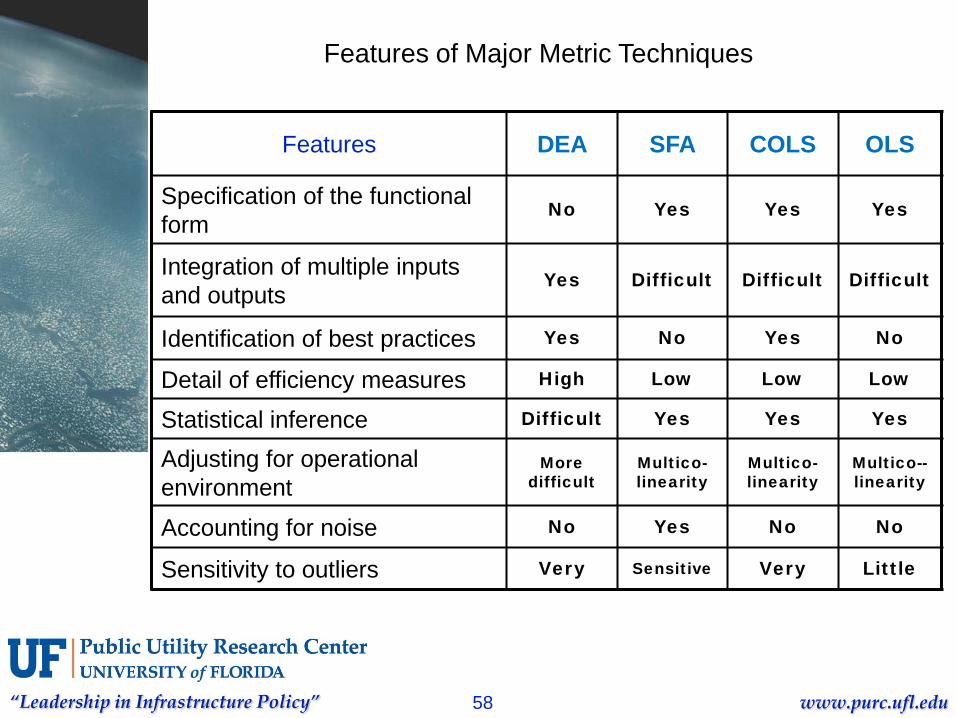
Features DEA SFA COLS OLS
Specification of the functional form
No Yes Yes Yes
Integration of multiple inputs and outputs
Yes Difficult Difficult Difficult
Identification of best practices Yes No Yes No
Detail of efficiency measures High Low Low Low
Statistical inference Difficult Yes Yes Yes
Adjusting for operational environment
More difficult
Multico-linearity
Multico-linearity
Multico--linearity
Accounting for noise No Yes No No
Sensitivity to outliers Very Sensitive Very Little
Features of Major Metric Techniques