water vapor depletion in the dmt continuous-flow...
TRANSCRIPT

Aerosol Science and Technology, 45:604–615, 2011Copyright C© American Association for Aerosol ResearchISSN: 0278-6826 print / 1521-7388 onlineDOI: 10.1080/02786826.2010.551146
Water Vapor Depletion in the DMT Continuous-Flow CCNChamber: Effects on Supersaturation and Droplet Growth
Terry L. Lathem1 and Athanasios Nenes1,2
1School of Earth and Atmospheric Sciences, Georgia Institute of Technology, Atlanta, Georgia, USA2School of Chemical and Biomolecular Engineering, Georgia Institute of Technology, Atlanta, Georgia,USA
The continuous-flow streamwise thermal-gradient cloud con-densation nuclei counter (CFSTGC) is a commercially available in-strument that is widely used for laboratory and field measurementsof cloud condensation nuclei (CCN). All studies to date assume thatthe supersaturation profile generated in its growth chamber is notinfluenced by the condensation of water vapor upon the growingCCN. The validity of this assumption, however, has never beensystematically explored. This work examines when water vapordepletion from CCN can have an important impact on supersatu-ration, measured CCN concentration, and droplet growth. A fullycoupled numerical flow model of the instrument is used to simulatethe water vapor supersaturation, temperature, velocity profiles,and CCN growth in the CFSTGC for a wide range of operationand CCN concentrations. Laboratory CCN activation experimentsof polydisperse calibration aerosol (with a DMT CFSTGC oper-ated in constant flow mode) are used to evaluate the simulations.The simulations and laboratory experiments are then generalizedusing a scaling analysis of the conditions that lead to supersat-uration depletion. We find that CCN concentrations below 5000cm−3 (regardless of their activation kinetics or instrument operat-ing conditions) do not decrease supersaturation and outlet dropletdiameter by more than 10%. For larger CCN concentrations, asimple correction can be applied that addresses both the depres-sion in supersaturation and droplet size.
1. INTRODUCTIONThe continuous-flow streamwise thermal gradient cloud con-
densation nuclei (CCN) chamber (CFSTGC; Roberts and Nenes2005) and its commercialization by Droplet Measurement Tech-
Received 19 September 2010; accepted 20 December 2010.We would like to thank R. Moore and A. Asa-Awuku for their
comments that improved the manuscript. We acknowledge fundingfrom NSF CAREER, NOAA, an NSF Graduate Student Fellowshipand a Georgia Institute of Technology Presidential Scholarship.
Address correspondence to Athanasios Nenes, Schools of Earth& Atmospheric Sciences and Chemical & Biomolecular Engineering,Georgia Institute of Technology, Atlanta, GA 30332, USA. E-mail:[email protected]
nologies (DMT; Lance et al. 2006; Rose et al. 2008) have en-abled large strides in understanding and parameterizing the CCNactivity of atmospheric aerosol. This is in large part due to theflexibility and fast time response of the instrument, which al-lows its use in a number of configurations to complement aerosoland cloud studies. Used as a “counter” in constant flow mode(Roberts and Nenes 2005; Lance et al. 2006; Rose et al. 2008) oras a “spectrometer” in scanning flow mode (Moore and Nenes2009), it provides the total concentration of CCN as a functionof supersaturation. When coupled with a differential mobil-ity analyzer (DMA) operated in voltage-stepping (Lance 2007;Petters et al. 2009; Rose et al. 2010) or voltage-scanning mode(Moore et al. 2010), size-resolved CCN measurements enablethe parameterization of composition impacts on cloud dropletformation (Rose et al. 2010; Petters et al. 2009; Petters andKreidenweis 2007; Wex et al. 2007; Padro et al. 2007; Lance2007; Asa-Awuku et al. 2010), the characterization of chemicalaging and mixing state of aerosol (Roberts et al. 2010; Cubisonet al. 2008; Kuwata et al. 2008; Lance 2007), and provide in-sight on the molar volume and surfactant characteristics of thewater-soluble carbonaceous aerosol fraction (Padro et al. 2007;Engelhart et al. 2008; Asa-Awuku et al. 2009, 2010).
The CFSTGC has also been used to study the activation ki-netics of ambient CCN, using the final activated CCN drop sizeat the end of the growth column as the metric of CCN growthrate. One approach, threshold droplet growth analysis (TDGA;Engelhart et al. 2008; Sorooshian et al. 2008; Bougiatiotiet al. 2009; Asa-Awuku et al. 2009; Lance et al. 2009; Murphyet al. 2009) uses a “reference” critical supersaturation–dropletsize curve to define the minimum size of droplets that are pro-duced from rapidly activating CCN (such as ammonium sulfateand sodium chloride). If ambient CCN produce droplets thatlie below the reference curve (i.e., produce smaller dropletsthan the reference at a given supersaturation), the ambi-ent CCN are then said to exhibit slower activation kinet-ics than the reference. If kinetic delays are detected, thenknowledge of the aerosol size distribution and hygroscopic-ity can then be combined with a numerical model of the
604
Downloaded By: [Georgia Technology Library] At: 19:07 6 February 2011
SUPERSATURATION DEPLETION IN THE CFSTGC 605
instrument to parameterize the slow activation kinetics in termsof a water vapor uptake coefficient (Asa-Awuku et al. 2009) or adissolution timescale (Chuang 2006). When size-resolved CCNmeasurements are carried out, the observed droplet distributionat the exit of the chamber can be inverted (using an instrumentmodel) to provide distributions of kinetic parameters (Ruehlet al. 2008, 2009), which provides particularly powerful insighton the kinetic heterogeneity of atmospheric CCN.
A basic assumption in all studies using the CFSTGC is thatthe water vapor field in the growth chamber is not affected bythe condensation of water onto the growing CCN. While this isgenerally a good assumption when the concentration of CCN islow (e.g., when size-resolved CCN experiments using a DMAare carried out), the extent of these depletion effects at higherCCN concentrations has not been systematically quantified todate. This is especially important for CCN studies in pollutedenvironments (or other conditions of high CCN). Water vapordepletion effects can also affect the final activated droplet size,which can bias studies of activation kinetics carried out withthe CFSTGC. This study aims at understanding and quantify-ing water vapor depletion effects on supersaturation and dropletgrowth in the CFSTGC, using a comprehensive combination ofinstrument theoretical analysis and laboratory activation exper-iments.
2. THEORY OF WATER VAPOR DEPLETION EFFECTSWe first proceed with a simple scaling analysis to determine
when water vapor depletion in the instrument can impact super-saturation and droplet size at the exit of the chamber. For this,we first determine the “zero CCN” limit of supersaturation anddroplet growth (corresponding to very small CCN concentra-tions flowing through the instrument). The perturbation aboutthe “zero CCN” limit is then determined as a function of cham-ber CCN concentration (and other relevant variables, such asflow rate and streamwise temperature gradient) to express de-pletion effects. In the analysis, we assume that air flows with atotal rate Q through the growth chamber of radius R and walltemperature gradient G. We also assume that supersaturationdepletion is primarily from condensational loss of water vaporto the CCN; the release of latent heat has a second-order impacton supersaturation (numerical simulations in section 3 confirmthis).
2.1. Depletion Effects on SupersaturationThe saturation ratio, S = P/Ps , of a fluid “material point”
flowing along the centerline of the chamber (P and Ps are thepartial and saturation pressure of water, respectively) can changeover time as follows:
dS
dt= d
dt
(P
Ps
)= 1
Ps
dP
dt− P
P 2s
dPs
dt= 1
Ps
[dP
dt− S
dPs
dt
],
[1]
where d/dt denotes the material (or Lagrangian) derivative ofa material point property. Equation (1) expresses the change insaturation ratio from fluctuations in water vapor concentration(P) and temperature (Ps). From the chain rule,
dPs
dt= dPs
dT
dT
dz
dz
dt,
assuming dT/dz = G, dz/dt is the average flow velocity∼Q/πR2 (Roberts and Nenes 2005), and dPs/dT = �HvPs/
RgT2 from the Clausius–Clapeyron equation (where T is the
temperature and �Hv , Rg are the enthalpy of evaporation andspecific gas constant for water, respectively), we obtain
dPs
dt= �HvPs
RgT 2G
Q
πR2. [2]
Substitution of Equation (2) into Equation (1) gives
dS
dt= 1
Ps
[dP
dt− �HvPs
RgT 2G
Q
πR2S
]. [3]
Here, dP/dt can be expressed as the sum of water vapor supplyfrom transport,
.S, and condensational loss,
.C, from the activated
CCN:
dS
dt= 1
Ps
[.S − .
C − �HvPs
RgT 2G
Q
πR2S
]. [4]
When the concentration of CCN, N, approaches zero, then.C → 0; assuming that the flow field is also developed, dS/dt ≈0 and Equation (4) becomes
.S = �HvPs
RgT 2G
Q
πR2So, [5]
where So denotes the maximum (or “effective”) saturation ratioin the instrument for “zero CCN” conditions (determined frominstrument calibration; section 4).
Here,.S is controlled by the transport of water vapor from the
chamber walls, and it should not depend on N . Hence, Equation(5) can be substituted into Equation (4) to give the generalsupersaturation depletion equation:
dS
dt= �HvGQ
πR2RgT 2(So − S) −
.C
Ps
. [6]
If S along a streamline is assumed to be in a dynamical steadystate, dS/dt ≈ 0. With this and expressing the saturation ratio interms of supersaturation (S = s + 1 and So = so + 1), Equation(6) becomes
s = so − πR2RgT2
�HvGQPs
.C. [7]
Downloaded By: [Georgia Technology Library] At: 19:07 6 February 2011

606 T. L. LATHEM AND A. NENES
Equation (7) expresses the supersaturation depletion (in thedeveloped flow region of the chamber) from the condensationalgrowth of activated CCN.
2.2. Depletion Effects on Droplet Size at the Exit of theGrowth Chamber
The average size of activated CCN, Dp, at the exit of thegrowth chamber (which is experimentally measured in the op-tical particle counter of the CFSTGC) is taken as the charac-teristic diameter for expressing droplet size reduction in ouranalysis. The Dp can be obtained from the integration of thedroplet growth equation (Seinfeld and Pandis 2006) over theparticle residence time in the instrument (Roberts and Nenes2005):
D2p = D2
c + 2∫
τ
�s(t)dt, [8]
where Dc, τ are the characteristic critical wet diameter andthe residence time of the CCN in the instrument, respectively;s(t) denotes the streamwise supersaturation profile that particlesare exposed to while flowing in the growth chamber, and �
is a growth parameter that depends on the droplet size and thewater vapor mass transfer coefficient (Seinfeld and Pandis 2006;Nenes and Seinfeld 2003).
Assuming Equation (7) applies at every point in the axialdirection, it can be introduced into Equation (8) to give
D2p = D2
c + 2∫
τ
�so(t)dt − 2∫
τ
�πR2RgT
2
�HvGQPs
.Cdt, [9]
where so(t) denotes the supersaturation profile at “zeroCCN” concentration (corresponding to the instrument “steady-state” supersaturation; Roberts and Nenes 2005; Lance et al.2006).
The average droplet size at “zero CCN” concentration,Dpo = (D2
c +2∫τ�sodt)1/2, is given by Equation (9) for
.C → 0.
When higher concentrations of CCN flow in the chamber, watervapor depletion leads to a lower s, hence lower Dp than Dpo:
D2p = D2
po − 2∫
τ
�πR2RgT
2
�HvGQPs
.Cdt. [10]
2.3. Simplified Expressions for Condensation Effects ons and Dp
Equations (7) and (10) give the impact of CCN growth onsupersaturation and droplet size at the exit of the growth cham-ber; more convenient forms can be derived if
.C is explicitly
written in terms of Dp, N, and �. Assuming that the dropletsformed can be divided into n classes of concentration N i andwet diameter Dpi (that increases in the streamwise direction),
.C
can be expressed at a given point in the flow chamber as
.C = dP
dt= R∗Tρw
Mw
d
dt
[π
6
∑n
NiD3pi
]
= π
2
R∗Tρw
Mw
∑n
NiD2pi
dDpi
dt, [11]
where R∗, Mw, and ρw are the universal gas constant, the mo-lar mass and density of liquid water, respectively. From thedroplet growth equation (Roberts and Nenes 2005), dDpi/dt =�s/Dpi ; with this and the definition of average droplet sizeDp = (1/N)
∑n NiDpi , Equation (11) becomes
.C = π
2
R∗Tρw
Mw
�NDps. [12]
Combination of Equations (12) and (7) eventually gives
s
so
= 1
1 + �2 �NDp
, [13]
where � = (π2R2RgR∗T 3ρw)/(�HvGQPsMw). Applying the
binomial expansion up to first order, (1+x)−1 ≈ 1−x, Equation(13) is approximated by
s
so
≈ 1 − �
2�NDp. [14]
To express the depression in instrument (i.e., maximum) su-persaturation, Equation (14) should be applied in the vicinityof the supersaturation entry length (Lance et al. 2006), whereall the CCN have activated but experienced the least amountof growth. Further downwind in the chamber, Equation (14)still applies but predicts increasingly larger supersaturation de-pletion because Dp increases by condensation of water vapor.In fact, Equation (14) suggests that supersaturation decreasesdownwind of its maximum value as
ds
dz∼ so
�
2�N
dDp
dz.
Simplification of the droplet size depression equation resultsfrom the combination of Equations (12) and (10):
D2p = D2
po −∫
τ
��2NDpsdt = D2po − ��2N
∫τ
Dpsdt.
[15]Defining the column-average droplet size,
¯Dp =∫τDpsdt∫τsdt
,
Downloaded By: [Georgia Technology Library] At: 19:07 6 February 2011
SUPERSATURATION DEPLETION IN THE CFSTGC 607
then∫τDpsdt = ¯Dp
∫τsdt and Equation (15) becomes
D2p = D2
po − ��2N ¯Dp
∫τ
sdt ≈ D2po − �
2�N ¯DpD2
p, [16]
where D2p ≈ 2
∫τ�sdt (a valid approximation for CCN that
exhibit considerable growth beyond their critical wet diameter,i.e., D2
c � 2∫τ�sdt ; Nenes and Seinfeld 2003).
Manipulation of Equation (16) gives
Dp
Dpo
=(
1 + �
2�N ¯Dp
)−1/2
≈ 1 − �
4�N ¯Dp, [17]
where the truncated expansion
(1 + x)−1/2 ≈ 1 − x
2
is used.Equations (14) and (17) are remarkably similar. Both ex-
pressions would exhibit identical dependence on N, �, and �
(hence imply that s/so ≈ Dp/Dpo) if ¯Dp ∼ 2Dp. Numericalsimulations (section 3) and experimental observations (section4) suggest that this is often the case.
3. INSTRUMENT AND DROPLET GROWTH MODELSThe CFSTGC instrument model (Roberts and Nenes 2005;
Lance et al. 2006) numerically integrates the Navier–Stokesequations and the heat and water vapor conservation equations topredict the velocity, pressure, water vapor supersaturation, andtemperature fields in the instrument. The model has been shownto successfully simulate instrument behavior over a wide rangeof operating conditions (Lance et al. 2006; Rose et al. 2008).Inputs to the model are total volumetric flow rate (Q), sheath-to-aerosol flow ratio, pressure (P), and the inner wall streamwisetemperature gradient (G) between the exit and entrance of thecolumn. The simulated supersaturation, velocity, and tempera-ture profiles are used to compute the activation and growth ofCCN (with a user-defined size distribution and composition) asthey flow through the chamber. Integration of the CCN growthequations is accomplished with the LSODE (Livermore Solverfor ordinary differential equations) solver (Hindmarsh 1983).The loss of water vapor from the gas phase onto the growingCCN and associated latent heat is then allowed to affect thegas phase water vapor and heat balances (Nenes et al. 2001;Roberts and Nenes 2005). For more details about the modelingframework, the solution algorithm, and the instrument charac-teristics, refer to Roberts and Nenes (2005) and Lance et al.(2006).
To study supersaturation depletion effects, we vary the tem-perature gradient, total flow rate, pressure, aerosol concentra-tion, size distribution characteristics, and water vapor uptakecoefficient for the combinations of these parameters given in
TABLE 1Operating conditions and aerosol characteristics considered in
the CFSTGC instrument simulations
Property Values considered
Instrument conditionsP (mb) 1000, 750, 500G (K m−1) 6, 8, 11, 16∗
Q (L min−1) 0.5, 1.0Aerosol properties
Dg (nm) 40, 100σ g 1.6Na (cm−3) 1, 5 × 10², 103, 5 × 10³, 104,
2 × 10⁴, 3 × 10⁴, 5 × 10⁴
αc 1.0, 0.06, 0.01
∗Inlet–outlet temperaure difference of 3, 4, 5.5, and 8 K, respec-
tively.
Table 1. The flow field in the growth chamber is discretizedonto 100 grid points in the streamwise direction and 100 gridpoints in the radial direction. The temperature of the air (bothsheath and aerosol flows) entering the column is 293 K, and thesheath-to-aerosol ratio in the growth chamber is 10:1. Aerosolflows through the instrument that follows a single lognormalmode of (NH4)2SO4 aerosol with a geometric mean dry diam-eter, Dg, of 0.04–0.1 µm, geometric standard deviation, σ g, of1.6, and number concentration, Na, between 1 and 2 × 104 cm−3.The size distribution is discretized onto 50 bins equally spacedin log size between 20 nm and 1 µm. The water vapor uptakecoefficient, αc, (used in � to express differences in activationkinetics of the CCN) was varied between 0.01 and 1.0, whichrepresents the range of activation kinetics observed to date incarbonaceous and atmospheric aerosol (Ruehl et al. 2008, 2009;Asa-Awuku et al. 2009). A total of over 1100 simulations werecompleted.
Figure 1 presents a typical example of the effects of CCNon instrument supersaturation and temperature. Shown are pre-dicted centerline supersaturation and temperature profiles in theCFSTGC for different levels of aerosol concentration. Chamberconditions correspond to Q = 0.5 L min−1, wall temperaturegradient 16 K m−1 (i.e., a 8 K difference between the entryand exit of the growth chamber), and 1000 mb chamber pres-sure. Aerosol is assumed to be composed of (NH4)2SO4, withDg = 100 nm, σ g = 0.16, and αc = 1. The thickness of thetemperature profile line represents the variability of the quantityacross simulations, arising from latent heat released by the watervapor condensing upon the growing droplets. The temperatureprofile is largely unaffected by the aerosol up to concentra-tions of 104 cm−3 (maximum temperature increase of 0.07 K),with a negligible impact on the streamwise temperature gradi-ent and supersaturation (less than 2% relative change comparedto “zero CCN” conditions). The supersaturation profile for the
Downloaded By: [Georgia Technology Library] At: 19:07 6 February 2011
608 T. L. LATHEM AND A. NENES
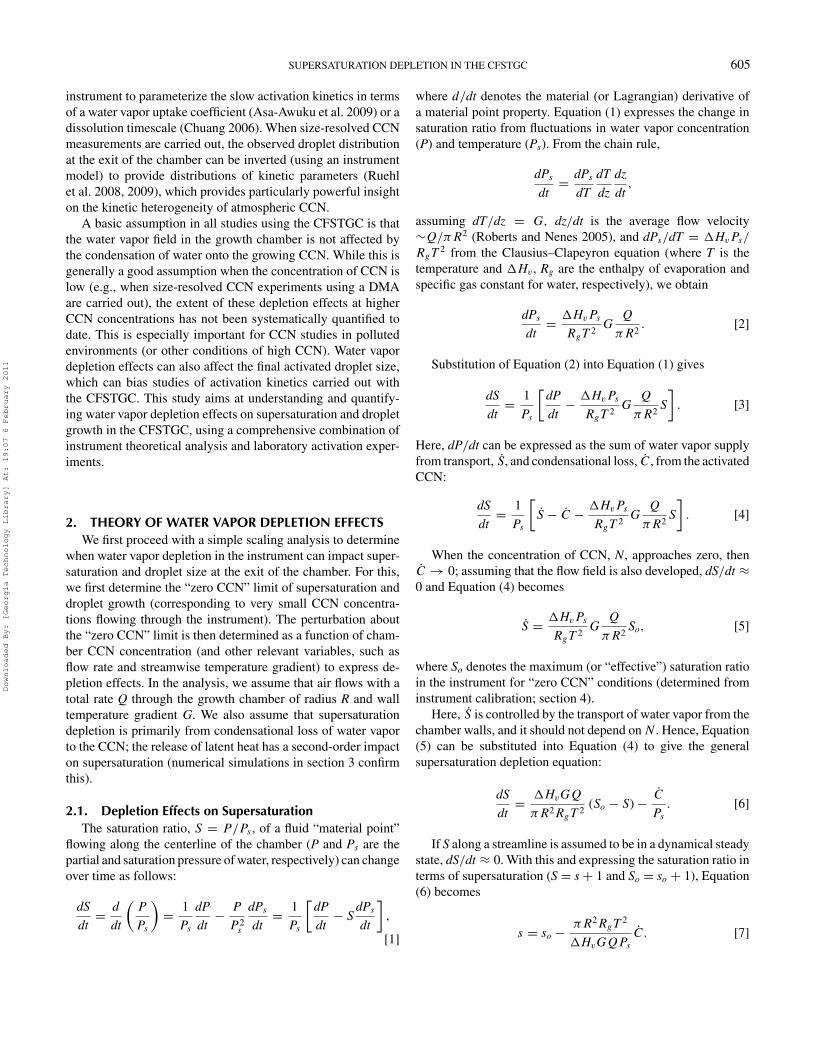
FIG. 1. Predicted centerline temperature (black line) and supersaturation(symbols) profiles in the CFSTGC for different levels of aerosol flowing throughthe instrument. Chamber conditions correspond to Q = 0.5 L min−1, wall tem-perature gradient 16 K m−1, and 1000 mb chamber pressure. Aerosol is com-posed of (NH4)2SO4 and follows a lognormal distribution with 100 nm modaldiameter and 0.16 geometric standard deviation. Here, αc is assumed unity.The thickness of the temperature profile line represents the variability across allsimulations.
lowest aerosol concentration (1 cm−3) corresponds to the “zeroCCN” solution; supersaturation develops after passing of itscharacteristic entry length (Lance et al. 2006), reaches a max-imum value (∼0.33%), and slowly decays from the effects ofincreasing the absolute temperature in the streamwise direction(Roberts and Nenes 2005). Increasing the CCN concentrationabove 1000 cm−3 begins to impact the supersaturation profile.Consistent with the scaling analysis of section 2, both maximumsupersaturation and its decay are equally affected. However, thelocation of the maximum in the instrument is not affected, sothat the length of chamber available for growth is unaffected bythe CCN concentration level.
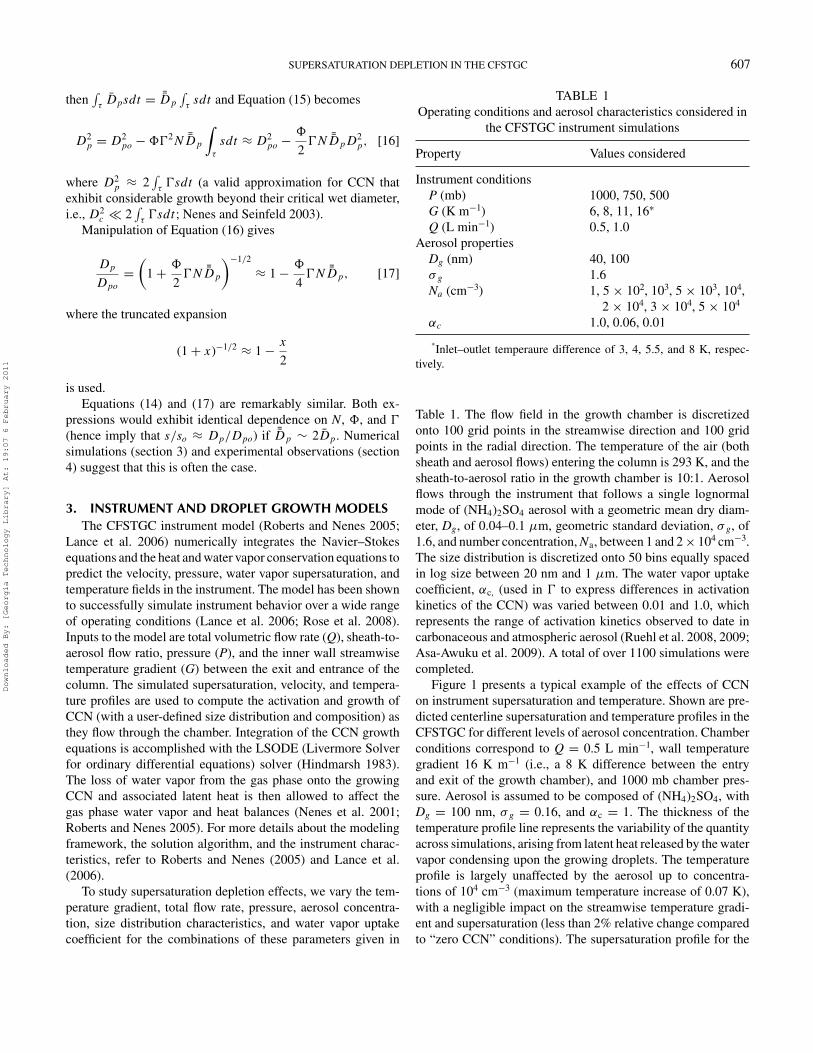
A change in supersaturation is expected to induce a changein the size of droplets exiting the column. This is shown in Fig-ure 2, which presents the predicted centerline average dropletdiameter as a function of distance from the chamber inlet forthe simulations of Figure 1. Clearly, the “zero CCN” simulationprovides the largest droplet sizes; increasing CCN concentra-tions depresses droplet size by more than 30% at the exit ofthe chamber. Also shown in the inset graph is the droplet rela-tive dispersion (defined as the width of the droplet distributionnormalized by the average diameter); it decreases in the flowdirection, consistent with the diffusional narrowing expectedfor the droplets during their residence in the chamber. Despitethe variation of average droplet diameter and relative dispersionwith CCN concentration, the former tends to be uniquely corre-lated. This suggests that the droplet size distribution is stronglylinked to the level of supersaturation that eventually develops inthe CFSTGC (regardless of depletion effects).
FIG. 2. Predicted centerline average droplet diameter and relative dispersion(inset graph) in the CFSTGC for different levels of aerosol flowing throughthe instrument. Chamber and aerosol characteristics are identical to those ofFigure 1.
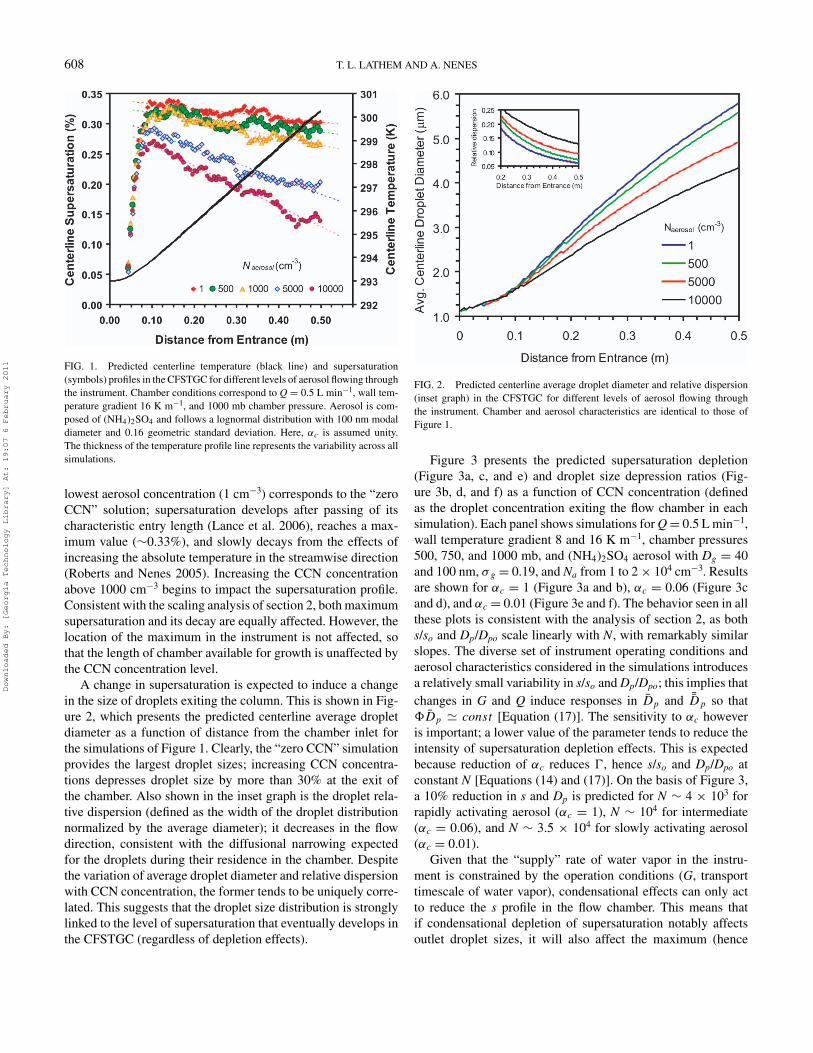
Figure 3 presents the predicted supersaturation depletion(Figure 3a, c, and e) and droplet size depression ratios (Fig-ure 3b, d, and f) as a function of CCN concentration (definedas the droplet concentration exiting the flow chamber in eachsimulation). Each panel shows simulations for Q = 0.5 L min−1,wall temperature gradient 8 and 16 K m−1, chamber pressures500, 750, and 1000 mb, and (NH4)2SO4 aerosol with Dg = 40and 100 nm, σ g = 0.19, and Na from 1 to 2 × 104 cm−3. Resultsare shown for αc = 1 (Figure 3a and b), αc = 0.06 (Figure 3cand d), and αc = 0.01 (Figure 3e and f). The behavior seen in allthese plots is consistent with the analysis of section 2, as boths/so and Dp/Dpo scale linearly with N, with remarkably similarslopes. The diverse set of instrument operating conditions andaerosol characteristics considered in the simulations introducesa relatively small variability in s/so and Dp/Dpo; this implies thatchanges in G and Q induce responses in Dp and ¯Dp so that�Dp � const [Equation (17)]. The sensitivity to αc howeveris important; a lower value of the parameter tends to reduce theintensity of supersaturation depletion effects. This is expectedbecause reduction of αc reduces �, hence s/so and Dp/Dpo atconstant N [Equations (14) and (17)]. On the basis of Figure 3,a 10% reduction in s and Dp is predicted for N ∼ 4 × 10³ forrapidly activating aerosol (αc = 1), N ∼ 104 for intermediate(αc = 0.06), and N ∼ 3.5 × 10⁴ for slowly activating aerosol(αc = 0.01).
Given that the “supply” rate of water vapor in the instru-ment is constrained by the operation conditions (G, transporttimescale of water vapor), condensational effects can only actto reduce the s profile in the flow chamber. This means thatif condensational depletion of supersaturation notably affectsoutlet droplet sizes, it will also affect the maximum (hence
Downloaded By: [Georgia Technology Library] At: 19:07 6 February 2011

SUPERSATURATION DEPLETION IN THE CFSTGC 609
FIG. 3. Predicted supersaturation depletion (a, c, and e) and droplet size depression ratios (b, d, and f) as a function of CCN concentration (defined as the dropletconcentration exiting the flow chamber). Results are shown for (a, b) αc = 1, (c, d) αc = 0.06, and (e, f) αc = 0.01. Each panel shows simulations for Q = 0.5 Lmin−1, wall temperature gradient 8 and 16 K m−1, chamber pressure 500, 750, and 1000 mb, and (NH4)2SO4 aerosol following a lognormal distribution with 40and 100 nm modal diameter, 0.19 geometric standard deviation, and total concentration from 1 to 2 × 104 cm−3.
effective) supersaturation in the instrument. The simulations(Figure 3) and theoretical analysis strongly support this. Fur-thermore, while the presence of water vapor depletion may af-fect the shape of the supersaturation profile somewhat (Figure1), the strongest effect on outlet droplet size arises from thereduction in effective supersaturation (i.e., the magnitude of the
maximum). This is clearly shown in Figure 4, which shows theaverage droplet diameter predicted at the exit of growth cham-ber versus supersaturation (with depletion effects considered)for the range of Q, αc, Na, and Dg presented in Table 1. If watervapor depletion significantly affected the shape of the super-saturation profile in the instrument, it would also change the
Downloaded By: [Georgia Technology Library] At: 19:07 6 February 2011

610 T. L. LATHEM AND A. NENES
FIG. 4. Predicted average droplet diameter at the exit of growth chamber versus supersaturation (with depletion effects considered) for (a) Q = 0.5 L min−1, αc
= 1; (b) Q = 0.5 L min−1, αc = 0.06; (c) Q = 1.0 L min−1, αc = 0.06; and (d) Q = 0.5 L min−1, αc = 0.01. Triangles denote simulations that correspond to “zeroCCN” conditions (defined as aerosol concentration below 500 cm−3).
relationship between s and Dp (keeping Q, ac, and Dg constant).However, this is not the case, as simulations corresponding to“zero CCN” conditions (Na < 500 cm−3; filled triangles) followthe same s versus Dp relationship as for simulations with highNa.
4. EXPERIMENTAL DETERMINATION OF DEPLETIONEFFECTS
To experimentally determine supersaturation depletion andoutlet droplet size depression, we carry out two types of ex-periments: a “standard” instrument calibration [such as thosedescribed in Lance et al. (2006) and Rose et al. (2008)] to de-termine the supersaturation. We then proceed with polydisperseCCN activation experiments to quantify the effects of watervapor depletion on supersaturation and droplet size. In all ex-periments, we use (NH4)2SO4 aerosol, generated by atomizationof an aqueous solution of the salt.
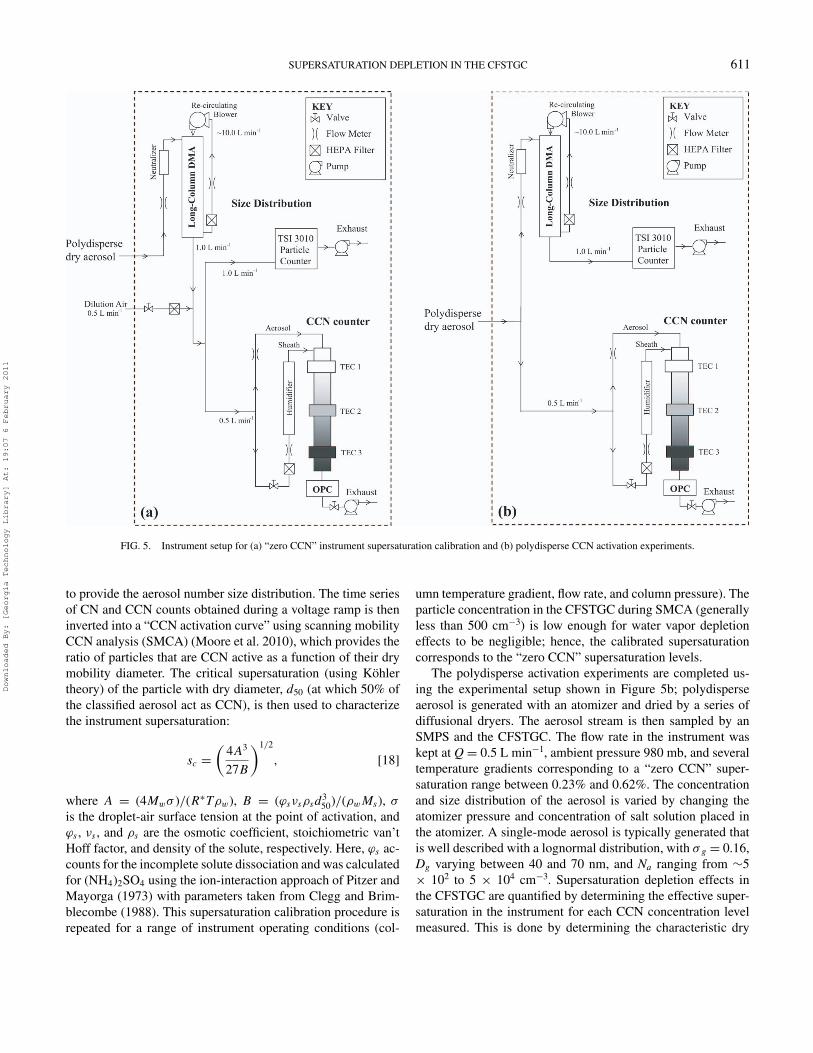
The instrumentation setup used to determine the “zero CCN”supersaturation level in the instrument is shown in Figure 5a.Polydisperse dry aerosol is charge neutralized using a Po-210neutralizer and introduced into a DMA (TSI 3081L) for sizeclassification by electrical mobility. The classified aerosol isthen split between a condensation particle counter (CPC, TSI3010) for measurement of total aerosol (condensation nuclei)concentration and a DMT CFSTGC (serial number 002) to mea-sure CCN concentrations. In order to maintain a sample flowrate of 1 L min−1 through the DMA, filtered air is supplied to theclassified aerosol stream or to the CPC stream (the latter beingpreferable in cases where low aerosol concentrations limit thecounting statistics in the CFSTGC). In this study, the aerosolclassification is operated as in a scanning mobility particle sizer(SMPS; Wang and Flagan 1989), where the voltage applied tothe DMA is exponentially scanned over time. The TSI AerosolInstrument Manager control software is used to scan the voltage,manage data acquisition in the CPC, and carry out the inversion
Downloaded By: [Georgia Technology Library] At: 19:07 6 February 2011
SUPERSATURATION DEPLETION IN THE CFSTGC 611
FIG. 5. Instrument setup for (a) “zero CCN” instrument supersaturation calibration and (b) polydisperse CCN activation experiments.
to provide the aerosol number size distribution. The time seriesof CN and CCN counts obtained during a voltage ramp is theninverted into a “CCN activation curve” using scanning mobilityCCN analysis (SMCA) (Moore et al. 2010), which provides theratio of particles that are CCN active as a function of their drymobility diameter. The critical supersaturation (using Kohlertheory) of the particle with dry diameter, d50 (at which 50% ofthe classified aerosol act as CCN), is then used to characterizethe instrument supersaturation:
sc =(
4A3
27B
)1/2
, [18]
where A = (4Mwσ )/(R∗Tρw), B = (ϕsνsρsd350)/(ρwMs), σ
is the droplet-air surface tension at the point of activation, andϕs , νs , and ρs are the osmotic coefficient, stoichiometric van’tHoff factor, and density of the solute, respectively. Here, ϕs ac-counts for the incomplete solute dissociation and was calculatedfor (NH4)2SO4 using the ion-interaction approach of Pitzer andMayorga (1973) with parameters taken from Clegg and Brim-blecombe (1988). This supersaturation calibration procedure isrepeated for a range of instrument operating conditions (col-
umn temperature gradient, flow rate, and column pressure). Theparticle concentration in the CFSTGC during SMCA (generallyless than 500 cm−3) is low enough for water vapor depletioneffects to be negligible; hence, the calibrated supersaturationcorresponds to the “zero CCN” supersaturation levels.
The polydisperse activation experiments are completed us-ing the experimental setup shown in Figure 5b; polydisperseaerosol is generated with an atomizer and dried by a series ofdiffusional dryers. The aerosol stream is then sampled by anSMPS and the CFSTGC. The flow rate in the instrument waskept at Q = 0.5 L min−1, ambient pressure 980 mb, and severaltemperature gradients corresponding to a “zero CCN” super-saturation range between 0.23% and 0.62%. The concentrationand size distribution of the aerosol is varied by changing theatomizer pressure and concentration of salt solution placed inthe atomizer. A single-mode aerosol is typically generated thatis well described with a lognormal distribution, with σ g = 0.16,Dg varying between 40 and 70 nm, and Na ranging from ∼5× 10² to 5 × 104 cm−3. Supersaturation depletion effects inthe CFSTGC are quantified by determining the effective super-saturation in the instrument for each CCN concentration levelmeasured. This is done by determining the characteristic dry
Downloaded By: [Georgia Technology Library] At: 19:07 6 February 2011

612 T. L. LATHEM AND A. NENES
FIG. 6. Measured CFSTGC responses to increasing levels of CCN in the flow chamber. Instrument operation was kept at Q = 0.5 L min−1, chamber pressure980 mb, and (NH4)2SO4 aerosol following a lognormal distribution with 40 and 70 nm modal diameter, 0.2 geometric standard deviation, and total concentrationfrom 1 to ∼3 × 104 cm−3. (a) Droplet size depression ratios as a function of CCN concentration. (b) Predicted versus measured droplet size depression ratiosas a function of CCN concentration for Q = 0.5 L min−1, P = 980 mb, and so = 0.62% (αc = 1.0 is assumed in the simulations). (c) Measured supersaturationdepletion as a function of CCN concentration. (d) Average droplet size measured at the optical particle counter versus instrument supersaturation (consideringdepletion effects). Triangles denote simulations that correspond to “zero CCN” conditions (defined as CCN concentration below 500 cm−3).
size, d∗, for which integration of the SMPS size distribution(from d∗ to the highest resolved diameter, ∼300 nm) matchesthe average CCN concentration observed during the SMPS scan.The d∗ is then used to characterize the instrument supersatura-tion, s [through application of Equation (18)], from which s/so
is calculated. Droplet growth depletion is quantified by calcu-lating the average droplet size measured by the instrument OPCas a function of the total CCN concentration, normalized withthe “zero CCN” droplet size (also determined from polydis-perse activation experiments, under conditions of low particleconcentration, less than 500 cm−3).
Results of the polydisperse activation experiments are pre-sented in Figure 6. Figure 6a presents measured droplet sizedepression ratios, Dp/Dpo, as a function of CCN concentration.All the activation experiments conducted collapse onto a narrowband that follows a linear trend; the slope of Dp/Dpo versus N(−2.53 × 10⁻⁵ cm3) is close to the numerical predictions foraerosol with αc = 1.0 (−1.90 × 10⁻⁵ cm3; Figure 3b). Whenmeasured droplet depression ratio is placed against predictions(Figure 6b), an excellent agreement can be obtained; even ex-trapolation of the simulations to higher CCN concentrations fitsthe experimental data well.
Downloaded By: [Georgia Technology Library] At: 19:07 6 February 2011

SUPERSATURATION DEPLETION IN THE CFSTGC 613
FIG. 7. s/so versus Dp/Dpo for (a) all the simulations presented in Figure3 and (b) the experiments presented in Figure 6a. Dashed lines correspond to±10% deviation from the diagonal.
Figure 6c presents the supersaturation depletion as a functionof CCN concentration in the instrument. Consistent with simu-lations, the activation experiments collapse onto a narrow bandthat follows a linear trend; the slope of s/so versus N (−1.94 ×10⁻⁵ cm3) is close to the numerical predictions for aerosol withαc = 1.0 (−2.01 × 10⁻⁵ cm3; Figure 3a). Finally, the averagedroplet diameter measured by the instrument OPC versus super-saturation (with depletion effects considered) is shown in Figure6d. In agreement with simulations (Figure 4), the relationshipbetween s and Dp is not affected by the level of CCN in theinstrument, as “zero CCN” observations (i.e., Na < 500 cm−3;
filled triangles) follow the same curve as for measurements athigh CCN concentration.
All the evidence presented above strongly suggests that thetheoretical analysis presented in sections 2 and 3 is a realisticrepresentation of water vapor depletion effects in the CFSTGC.Against initial expectations, the coupling of supersaturation,CCN number, and outlet droplet size gives rise to a remarkablysimple relationship between supersaturation and droplet sizedepletion. This is shown in Figure 7, which presents s/so versusDp/Dpo from the simulations (Figure 7a) and the observations(Figure 7b). For the wide range of conditions considered, s/so ≈Dp/Dpo to within 10%.
The analysis presented does not consider the effect of coinci-dence errors for measurements of CCN at high concentrations;for the instrumentation used, a maximum coincidence error of10% can occur for concentrations up to 6000 cm−3 (DMT 2005).The consistency between the theoretical analysis and instrumentobservations suggests that coincidence errors, if present, consti-tute a secondary effect on the observed instrument response.
5. CONCLUSIONSAll published studies with the CFSTGC assume that the su-
persaturation generated in the instrument is not influenced bythe condensation of water vapor upon the growing CCN. Thisstudy evaluates this assumption and examines the conditionsfor which depletion effects become important for supersatu-ration, measured CCN concentration, and droplet growth. Ananalysis is carried out with a fully coupled numerical modeland laboratory CCN activation experiments using a commercialinstrument.
We find that condensational depletion of water vapor doesnot impact supersaturation and droplet size by more than 10%(which is comparable to the supersaturation uncertainty quotedfor the CFSTGC (Rose et al. 2008)) if the CCN are present atconcentrations below 5000 cm−3. If the CCN exhibit slower ac-tivation kinetics than (NH4)2SO4 aerosol, higher concentrationscan be present in the instrument before depletion effects becomeimportant. Remarkably, depletion effects do not significantly al-ter the shape of the supersaturation distribution in the instrumentgrowth chamber, so that the relationship between instrument su-persaturation and outlet droplet size does not change (regardlessof the extent of supersaturation depletion). The above suggeststhat the majority of atmospherically relevant CCN measure-ments with the DMT CFSTGC may not be substantially affectedby supersaturation depletion. However, high CCN concentra-tions can occur with enough frequency (especially if samplingpolydisperse CCN in polluted environments, or in laboratoryexperiments with high particulate loads) that a methodologyneeds to be developed to address the issue.
There are a number of approaches that can be used to elim-inate biases from supersaturation depletion. One approach is toavoid depletion effects all together by maintaining a low concen-tration of CCN in the instrument during laboratory calibrations
Downloaded By: [Georgia Technology Library] At: 19:07 6 February 2011
614 T. L. LATHEM AND A. NENES
and atmospheric sampling. Low concentrations of CCN can beachieved in situ by either performing size-resolved CCN mea-surements (e.g., SMCA) or through controlled dilution of thesample stream with filtered air before entering the CFSTGC.Another approach is to account for depletion biases using therelationship of s/so versus CCN presented in this article; the ef-fective supersaturation then corresponds to the measured CCNlevel and droplet size—and is equivalent to measurements car-ried out under “zero CCN conditions.” The degree of correctionis sensitive to the activation kinetics of the ambient aerosol, butan analysis with the instrument model (such as carried out inthis article) can largely account for this uncertainty. Supportedby the available body of evidence (e.g., Bougiatioti et al. 2009;Lance et al. 2009; Ruehl et al. 2008, 2009), rapid activation ki-netics (i.e., αc comparable to that of (NH4)2SO4 aerosol ∼0.1)can be assumed a priori when the aerosol is aged, sampled froma humid environment, or contains large amounts of soluble ma-terial.
The analysis carried out here can be extended to the differentoperation modes and implementations of the CFSTGC design(e.g., Ruehl et al. 2008; Moore et al. 2010) or any other CCNinstrument design (such as those analyzed by Nenes et al. 2001).Regardless of the method used to measure CCN concentrations,this study shows that supersaturation depletion effects need to becarefully understood for unambiguous measurements of CCNactivity and droplet activation kinetics.
REFERENCESAsa-Awuku, A., Engelhart, G., Lee, B., Pandis, S., and Nenes, A. (2009).
Relating CCN Activity, Volatility, and Droplet Growth Kinetics ofβ-Caryophyllene Secondary Organic Aerosol. Atoms. Chem. Phys.,9:218–597.
Asa-Awuku, A., Nenes, A., Gao, S., Flagan, R., and Seinfeld, J. (2010). Water-Soluble SOA from Alkene Ozonolysis: Composition and Droplet ActivationKinetics Inferences from Analysis of CCN Activity. Atmos. Chem. Phys.,10:1585–1597.
Bougiatioti, A., Fountoukis, C., Kalivitis, N., Pandis, S., Nenes, A., andMihalopoulos, N. (2009). Cloud Condensation Nuclei Measurements inthe Marine Boundary Layer of the Eastern Mediterranean: CCN Closureand Droplet Growth Kinetics. Atmos. Chem. Phys., 9:7053–7066.
Chuang, P. Y. (2006). Sensitivity of Cloud Condensation Nuclei ActivationProcesses to Kinetic Parameters. J. Geoph. Res., 111:D09201.
Clegg, S. L., and Brimblecombe, P. (1988). Equilibrium Partial Pressures ofStrong acids over Concentrated Saline Solutions—I. HNO3. Atmos. Envi-ron., 22:91–100.
Cubison, M., Ervens, B., Feingold, G., Docherty, K., Ulbrich, I., Shields, L.,Prather, K., Hering, S., and Jimenez, J. (2008). The Influence of ChemicalComposition and Mixing State of Los Angeles Urban Aerosol on CCNNumber and Cloud Properties. Atmos. Chem. Phys., 8:5649–5667.
Droplet Measurement Technologies (DMT). (2005). Cloud Condensation Nu-clei Counter Operator Manual, Rev. A. Droplet Measurement Technologies,Boulder, CO.
Engelhart, G., Asa-Awuku, A., Nenes, A., and Pandis, S. N. (2008). CCNActivity and Droplet Growth Kinetics of Fresh and Aged MonoterpeneSecondary Organic Aerosol. Atmos. Chem. Phys., 8:3937–3949.
Hindmarsh, A. (1983). ODEPACK: A Systematized Collection of ODE Solvers,in Scientific Computing, Stepleman, R. S., ed. North-Holland, Amsterdam,pp. 55–64.
Kuwata, M., Kondo, Y., Miyazaki, Y., Komazaki, Y., Kim, J. H., Yum, S. S.,Tanimoto, H., and Matsueda, H. (2008). Cloud Condensation Nuclei Activityat Jeju Island, Korea in Spring 2005. Atmos. Chem. Phys., 8:2933–2948.
Lance, S. (2007). Quantifying Compositional Impacts of Ambient Aerosol onCloud Droplet Formation. Ph.D. thesis, Georgia Institute of Technology,Atlanta, GA.
Lance, S., Medina, J., Smith, J., and Nenes, A. (2006). Mapping the Opera-tion of the DMT Continuous Flow CCN Counter. Aerosol Sci. Technol.,40:242–254.
Lance, S., Nenes, A., Mazzoleni, C., Dubey, M., Gates, H., Varutbangkul, V.,Rissman, T. A., Murphy, S. M., Sorooshian, A., Brechtel, F., Flagan, R.,Seinfeld, J., Feingold, G., and Jonsson, H. (2009). CCN Activity, Closureand Droplet Growth Kinetics of Houston Aerosol During the Gulf of MexicoAtmospheric Composition and Climate Study (GoMACCS). J. Geophys.Res., (D00F15):114.
Moore, R., and Nenes, A. (2009). Scanning Flow CCN Analysis—A Method forFast Measurements of CCN Spectra. Aerosol Sci. Technol., 43:1192–1207.
Moore, R., Nenes, A., and Medina, J. (2010). Scanning Mobility CCNAnalysis—A Method for Fast Measurements of Size Resolved CCN Distri-butions and Activation Kinetics. Aeros. Sci. Technol., 44:861–871.
Murphy, S. M., Agrawal, H., Sorooshian, A., Padro, L. T., Gates, H., Hersey,S., Welch, W. A., Jung, H., Miller, J. W., Cocker, D. R., Nenes, A., Jonsson,H., Flagan, R. C., and Seinfeld, J. H. (2009). Comprehensive Simultane-ous Shipboard and Airborne Characterization of Exhaust from a ModernContainer Ship at Sea. Env.Sci.Tech., 43:4626–4640.
Nenes, A., Chuang, P., Flagan, R., and Seinfeld, J. (2001). A Theoretical Anal-ysis of Cloud Condensation Nucleus (CCN) Instruments. J. Geophys. Res.,106:3449–3474.
Nenes, A., and Seinfeld, J. H. (2003). Parameterization of Cloud DropletFormation in Global Climate Models. J. Geophys. Res., 108(D7). doi:10.1029/2002JD002911.
Padro, L., Asa-Awuku, A., Morrison, R., and Nenes, A. (2007). InferringThermodynamic Properties from CCN Activation Experiments: Single-Component and Binary Aerosols. Atmos. Chem. Phys., 7:5263–5274.
Petters, M., Carrico, C., Kreidenweis, S., Prenni, A., DeMott, P., J. C., Jr.,and Moosmuller, H. (2009). Cloud Condensation Nucleation Activity ofBiomass Burning Aerosol. J. Geophys. Res., 114:D22205.
Petters, M., and Kreidenweis, S. (2007). A Single Parameter Representation ofHygroscopic Growth and CCN Activity. Atmos. Chem. Phys., 7:1961–1971.
Pitzer, K., and Mayorga, G. (1973). Thermodynamics of Electrolytes. II. Activ-ity and Osmotic Coefficients for Strong Electrolytes with One or Both IonsUnivalent. J. Phys. Chem., 77:2300–2308.
Roberts, G., and Nenes, A. (2005). A Continuous-Flow Streamwise Thermal-Gradient CCN Chamber for Atmospheric Measurements. Aerosol Sci. Tech-nol., 39:206–221.
Roberts, G. C., Day, D. A., Russell, L. M., Dunlea, E. J., Jimenez, J. L.,Tomlinson, J. M., Collins, D. R., Shinozuka, Y., and Clarke, A. D. (2010).Characterization of Particle Cloud Droplet Activity and Composition in theFree Troposphere and the Boundary Layer During INTEX-B. Atmos. Chem.Phys., 10:6627–6644.
Rose, D., Gunthe, S., Mikhailov, E., Frank, G., Dusek, U., Andreae, M.,and Poschl, U. (2008). Calibration and Measurement Uncertainties of aContinuous-Flow Cloud Condensation Nuclei Counter (DMT-CCNC): CCNActivation of Ammonium Sulfate and Sodium Chloride Aerosol Particles inTheory and Experiment. Atmos. Chem. Phys., 8:1153–1179.
Rose, D., Nowak, A., Achtert, P., Wiedensohler, A., Hu, M., Shao, M., Zhang,Y., Andreae, M., and Poschl, U. (2010). Cloud Condensation Nuclei inPolluted Air and Biomass Burning Smoke near the Mega-City Guangzhou,China—Part 1: Size-Resolved Measurements and Implications for the Mod-eling of Aerosol Particle Hygroscopicity and CCN Activity. Atmos. Chem.Phys., 10:3365–3383.
Ruehl, C., Chuang, P., and Nenes, A. (2009). Distinct CCN Activation KineticsAbove the Marine Boundary Layer Along the California Coast. Geophys.Res. Lett., 36:L15814.
Downloaded By: [Georgia Technology Library] At: 19:07 6 February 2011

SUPERSATURATION DEPLETION IN THE CFSTGC 615
Ruehl, C., Chang, P., and Nenes, A. (2008). How Quickly do CloudDroplets Form on Atmospheric Particles? Atmos. Chem. Phys., 8:1043–1055.
Seinfeld, J., and Pandis, S. (2006). Atmospheric Chemistry and Physics:From Air Pollution to Climate Change, 2nd ed. John Wiley,New York.
Sorooshian, A., Murphy, S. M., Hersey, S., Gates, H., Padro, L. T., Nenes,A., Brechtel, F. J., Jonsson, H., Flagan, R. C., and Seinfeld, J. H. (2008).
Comprehensive Airborne Characterization of Aerosol from a Major BovineSource. Atmos. Chem. Phys., 8:3937–3949.
Wang, S., and Flagan, R. (1989). Scanning Electrical Mobility Spectrometer. J.Aerosol Sci., 20:1485–1488.
Wex, H., Hennig, T., Salma, I., Ocskay, R., Kiselev, A., Henning, S., Massling,A., Wiedensohler, A., and Stratmann, F. (2007). Hygroscopic Growth andMeasured and Modeled Critical Supersaturations of an Atmospheric HULISSample. Geophys. Res. Lett. 34, L02818 doi: 10.102/2006GL028260.
Downloaded By: [Georgia Technology Library] At: 19:07 6 February 2011