water withdrawals, use, discharge, and trends in florida, 1995
TRANSCRIPT
U.S. GEOLOGICAL SURVEYWater-Resources Investigations Report 99-4002
Prepared in cooperation with theFLORIDA DEPARTMENT OFENVIRONMENTAL PROTECTION
Water Withdrawals, Use, Discharge,and Trends in Florida, 1995
U.S. GEOLOGICAL SURVEYWater-Resources Investigations Report 99-4002
Water Withdrawals, Use, Discharge, and Trends in Florida, 1995
By RICHARD L. MARELLA
Tallahassee, Florida1999
Prepared in cooperation with the
FLORIDA DEPARTMENT OF ENVIRONMENTAL PROTECTION
U.S. DEPARTMENT OF THE INTERIOR
BRUCE BABBITT, Secretary
U.S. GEOLOGICAL SURVEY
Charles G. Groat, Director
For additional information write to: Copies of this report can be purchased from:
U.S. Geological SurveyBranch of Information ServicesBox 25286Federal CenterDenver, CO 80225-0286
The use of firm, trade, and brand names in this report is for identification purposes only and does not constituteendorsement by the U.S. Geological Survey.
District ChiefU.S. Geological Survey, WRDSuite 3015227 North Bronough StreetTallahassee, FL 32301
Contents iii
CONTENTS
Abstract.................................................................................................................................................................................. 1Introduction ........................................................................................................................................................................... 2
Purpose and Scope....................................................................................................................................................... 2Previous Investigations................................................................................................................................................ 3Data Sources and Limitations...................................................................................................................................... 4Acknowledgments ....................................................................................................................................................... 6
Water Withdrawals and Use................................................................................................................................................... 7Water Source and Use Category .................................................................................................................................. 10
Public Supply..................................................................................................................................................... 13Domestic Self-Supplied..................................................................................................................................... 17Commercial-Industrial Self-Supplied................................................................................................................ 19Agricultural Self-Supplied (Irrigation and Nonirrigation) ................................................................................ 22Recreational Irrigation....................................................................................................................................... 26Power Generation .............................................................................................................................................. 28
Water Management District......................................................................................................................................... 31Water Consumption and Discharges ..................................................................................................................................... 34
Domestic Wastewater .................................................................................................................................................. 34Industrial Wastewater .................................................................................................................................................. 36
Water Withdrawal Trends, 1970-95....................................................................................................................................... 38Selected References ............................................................................................................................................................... 41Water-Use Bibliography for Florida...................................................................................................................................... 44
Florida.......................................................................................................................................................................... 44Northwest Florida Water Management District ........................................................................................................... 44St. Johns River Water Management District................................................................................................................ 45South Florida Water Management District .................................................................................................................. 45Southwest Florida Water Management District........................................................................................................... 45Suwannee River Water Management District .............................................................................................................. 46Additional Water-Use Reports or Papers ..................................................................................................................... 46
Appendix I ............................................................................................................................................................................. 50Appendix II............................................................................................................................................................................ 76
FIGURES
1. Graph showing historical and projected population of Florida, 1950-2020............................................................ 22. Map showing counties and water management districts in Florida ........................................................................ 3
3-5. Graphs showing:3. Total water withdrawals in Florida by source, 1995 ............................................................................................... 74. Average daily freshwater withdrawals by month in Florida, 1995.......................................................................... 85. Fresh ground- and surface-water withdrawals in Florida by cataegory, 1995......................................................... 86. Map showing approximate areal extent over which principal aquifers in Florida are the primary source
of ground water and quantity of ground-water withdrawals in 1995 ...................................................................... 107. Map showing general location of hydrologic units in Florida and fresh ground- and surface-water
withdrawals within these units in 1995 ................................................................................................................... 123-5. Graphs showing:
8. Public-supply ground-water withdrawals in Florida by principal aquifer, 1995..................................................... 139. Average daily public-supply freshwater withdrawals by month in Florida, 1995................................................... 13
10. Public-supply water use in Florida, 1995 ................................................................................................................ 1511. Historical public supply average daily per capita use in Florida, 1950-95 ............................................................. 15
iv Contents
12. Historical public-supply freshwater withdrawals in Florida by source, 1950-95 ................................................... 17
13. Domestic self-supplied ground-water withdrawals in Florida by principal aquifer, 1995 ..................................... 19
14. Historical domestic self-supplied freshwater withdrawals in Florida, 1950-95 ..................................................... 19
15. Commercial-industrial self-supplied ground-water withdrawals in Florida by principal aquifer, 1995................. 21
16. Average daily commercial-industrial self-supplied freshwater withdrawals by month in Florida, 1995 ............... 21
17. Commercial-industrial self-supplied freshwater use in Florida by major industrial type, 1995............................. 21
18. Historical commercial-industrial self-supplied freshwater withdrawals in Florida by source, 1950-95 ................ 22
19. Agricultural self-supplied ground-water withdrawals in Florida by principal aquifer, 1995 ................................. 22
20. Average daily agricultural self-supplied freshwater withdrawals by month in Florida, 1995 ................................ 24
21. Agricultural self-supplied freshwater use in Florida by major crop type, 1995 ..................................................... 24
22. Historical agricultural acreage for selected crops in Florida, 1970-95 ................................................................... 24
23. Historical agricultural self-supplied freshwater withdrawals in Florida by source, 1950-95................................. 26
24. Recreational irrigation ground-water withdrawals in Florida by principal aquifer, 1995 ...................................... 26
25. Average daily recreational irrigation freshwater withdrawals by month in Florida, 1995 ..................................... 28
26. Historical recreational irrigation freshwater withdrawals in Florida by source, 1950-95 ...................................... 28
27. Average daily power generation freshwater withdrawals by month in Florida, 1995 ............................................ 30
28. Historical power generation water withdrawals in Florida by source, 1950-95 ..................................................... 30
29. Population and population served by public supply by water management district, 1995..................................... 31
30. Freshwater withdrawals by water management district, 1995................................................................................ 31
31. Fresh and saline water withdrawals by water management district, 1995.............................................................. 33
32. Historical freshwater withdrawals by water management district, 1975-95........................................................... 33
33. Historical fresh ground-water withdrawals by water management district, 1975-95 ............................................. 33
34. Historical fresh surface-water withdrawals by water management district, 1975-95............................................. 33
35. Freshwater withdrawals and estimated water consumption in Florida by category, 1995 ..................................... 34
36. Treated domestic and industrial wastewater discharges in Florida by disposal method, 1995............................... 36
37. Historical treated domestic and industrial wastewater discharges in Florida, 1985-95.......................................... 36
38. Historical fresh and saline water withdrawals in Florida, 1950-95 ........................................................................ 38
39. Historical freshwater withdrawals in Florida by source, 1950-95 .......................................................................... 38
TABLES
1. Total water withdrawals in Florida by category, 1995 ........................................................................................... 7
2. Total water withdrawals in Florida by county, 1995 .............................................................................................. 9
3. Total ground-water withdrawals by principal aquifer in Florida by county, 1995 ................................................. 11
4. Public-supplied population, water use, withdrawals, transfers, and treated water in Florida by county, 1995...... 14
5. Estimated public supply water use (deliveries), and per capita use in Florida by county, 1995 ............................ 16
6. Domestic self-supplied population and water withdrawals in Florida by county, 1995......................................... 18
7. Commercial-industrial self-supplied water withdrawals in Florida by county, 1995............................................. 20
8. Agricultural self-supplied water withdrawals in Florida by county, 1995 ............................................................. 23
9. Acres irrigated, irrigation system type, and water use by crop and type in Florida, 1995 ..................................... 25
10. Recreational irrigation water withdrawals in Florida by county, 1995 .................................................................. 27
11. Power generation water withdrawals in Florida by county, 1995 .......................................................................... 29
12. Water withdrawals by category in Florida by water management district, 1995 ................................................... 32
13. Estimated freshwater consumed by category in Florida, 1995............................................................................... 34
14. Treated domestic and industrial wastewater discharge and number or systems in Florida by county, 1995 ......... 35
15. Treated domestic and industrial wastewater discharge by disposal method in Florida by county, 1995 ............... 37
16. Historical freshwater withdrawals in Florida by category, 1970-95....................................................................... 39
Contents v
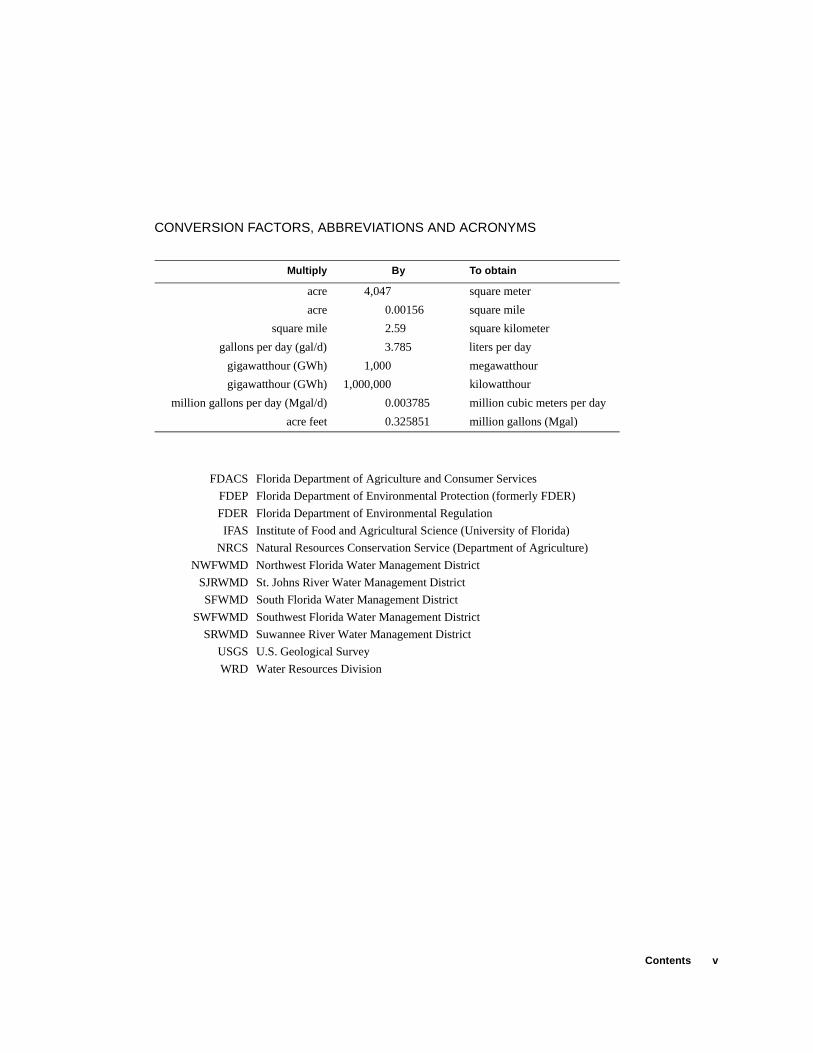
CONVERSION FACTORS, ABBREVIATIONS AND ACRONYMS
Multiply By To obtain
acre 4,047 square meter
acre 0.00156 square mile
square mile 2.59 square kilometer
gallons per day (gal/d) 3.785 liters per day
gigawatthour (GWh) 1,000 megawatthour
gigawatthour (GWh) 1,000,000 kilowatthour
million gallons per day (Mgal/d) 0.003785 million cubic meters per day
acre feet 0.325851 million gallons (Mgal)
FDACS Florida Department of Agriculture and Consumer Services
FDEP Florida Department of Environmental Protection (formerly FDER)
FDER Florida Department of Environmental Regulation
IFAS Institute of Food and Agricultural Science (University of Florida)
NRCS Natural Resources Conservation Service (Department of Agriculture)
NWFWMD Northwest Florida Water Management District
SJRWMD St. Johns River Water Management District
SFWMD South Florida Water Management District
SWFWMD Southwest Florida Water Management District
SRWMD Suwannee River Water Management District
USGS U.S. Geological Survey
WRD Water Resources Division
vi Contents
GLOSSARY
Advanced wastewater treatment. -- Any treatment of sewage that goes beyond the secondary or biological water treatment stage and includes the removal of nutrients, such as phosphorus and nitrogen and a high percentage of suspended solids. This treatment is more stringent than secondary treatment, and requires an 85 percent reduction in conventional pollutant concentrations or a significant reduction in non-conventional pollutants (U.S. Environmental Protection Agency, 1997, written commun.).
Agriculture water use.--Includes water used for agricultural irrigation and nonirrigation purposes. Irrigation water use includes the artificial application of water on lands to assist in the growing of crops, plants, and pasture, or to maintain vegetative growth in recreational lands, parks, and golf courses. Nonirrigation water use includes water used for livestock, fish farming, and other farm needs. Livestock water use includes water used for stock watering, feedlots, and dairy operations.
Commercial water use.--Water for motels, hotels, restaurants, office buildings, commer-cial facilities and civilian and military institutions. The water may be obtained from a public supply or may be self-supplied.
Community water system.--A public water system which serves at least 15 service con-nections used by year-round residents or regularly serves at least 25 year-round resi-dents (Florida Department of Environmental Regulation, 1990a).
Consumptive use.--That part of water withdrawn that is evaporated, transpired, incorpo-rated into products or crops, consumed by humans or livestock, or otherwise removed from the immediate water environment. Sometimes called water consumed or water depleted.
Cooling pond.--Usually a manmade water body used by power plants or large industrial plants that enables the facility to recirculate once-through cooling water. The water levels in the pond are usually maintained by rainfall or augmented by pumping (with-drawal of) water from another source (fresh, saline, or reclaimed).
Cooling tower.--A large tower or stack that is used for heat exchange of once-through cooling water generated by steam condensers. Hot water from the plant is sprayed into the top of the tower and exchanges heat with the passing air as it falls. The water is then collected at the bottom of the tower and used again. A small amount of water is lost (consumed) through evaporation in this process. See cooling water or once-through cooling.
Cooling water.--Water used for cooling purposes by electric generators, steam condens-ers, large machinery or products at power or industrial plants. Water used for cooling purposes can be either fresh, saline, or reclaimed and may be used only once or recir-culated multiple times. See cooling pond or once-through cooling water.
Desalination.--The removal of salts from water. Desalination is primarily used for public-supply water to ensure that it meets Florida Department of Environmental Protection secondary drinking standards. The three primary types of desalination used in Florida are: (1) distillation, (2) electrodialysis processes, and (3) reverse osmosis processes (Buros, 1989, South Florida Water Management District, 1990). The reverse osmosis processes are the most commonly used in Florida followed by electrodialysis (Dykes and Conlon, 1989). In addition to these three desalination processes, many public suppliers also dilute or blend brackish or saline water with fresher water to produce potable water. Also see reverse osmosis.
Dewatering.--The deliberate attempt to lower the ground-water level in or below land surface for selected purposes such as agricultural, construction, mining or other activities. For mining operation, dewatering usually is accomplished by pumping the water out of the ground and discharging to a surface-water body. However, some dewatering involves gravity feeding water from the surficial aquifer into a deeper aquifer (usually the Floridan aquifer system) through recharge wells (Campbell,
Contents vii
1986). In Florida, this discharge usually requires a permit from the Florida Depart-ment of Environmental Protection.
Domestic wastewater facility.--Facilities that receive or dispose of wastewater derived principally from residential dwellings, business or commercial buildings, institutions, and the like (Florida Department of Environmental Regulation, 1991). Can also include some wastewater derived from industrial facilities. May also be referred to as a municipal wastewater facility.
Domestic water use.--Water for normal household purposes, such as drinking, food prep-aration, bathing, washing clothes and dishes, flushing toilets, and watering lawns and gardens. Also called residential water use. The water can be obtained from a public supply or be self-supplied.
Effluent.--Water that flows out of a wastewater treatment facility or other works used for the purpose of treating, stabilizing, or holding waste.
Flood irrigation.-- Irrigation systems that control the water table with lateral supply ditches. These include open field ditch systems (furrows), semi-closed conveyance systems, subsurface conduit systems, crown flood systems, and continuous flood systems. Also includes seepage or subsurface irrigation systems. The efficiencies of these flood irrigation systems range from 20 to 80 percent (Smajstrla and others, 1988), however, an average of 60 percent is commonly used for estimating water requirements. May also be referred to as subsurface irrigation.
Freshwater.--Water that contains less than 1,000 milligrams per liter (mg/L) of dissolved solids; generally, more than 500 mg/L is considered undesirable for drinking and many industrial uses. Generally, freshwater is considered potable.
Gigawatthour (GWh).--A measure of electricity, one billion watthours.Ground water.--Specifically, that part of the subsurface water that is in the saturated zone
(a zone in which all voids are filled with water).Ground-water disposal.--Wastewater that is disposed of through the ground either by
injection or seepage. This includes the following discharge methods; absorption beds, injection wells, drainfields, percolation ponds, rapid infiltration basins, spray fields, and land application systems (Marella, 1994). Land application systems or reuse sys-tems are considered a ground-water disposal as treated wastewater used to irrigate is generally intended to filter down through the soil.
Hydroelectric power water use.--The use of water in the generation of electricity at plants where the turbine generators are driven by falling water. This is considered an instream use of water.
Industrial wastewater facility.--Facilities that produce, treat or dispose of wastewater not otherwise defined as a domestic wastewater; includes the runoff and leachate from areas that receive pollutants associated with industrial or commercial storage, handling, or processing (Florida Department of Environmental Regulation, 1991).
Industrial water use.--Water used for industrial purposes such as fabricating, processing, washing, and cooling, and includes such industries as steel, chemical and allied prod-ucts, paper and allied products, mining, and petroleum refining. The water can be obtained from a public supply or be self-supplied.
Instream use.--Water use taking place within a stream channel for such purposes as hydroelectric power generation, navigation, water-quality improvement, fish and wildlife propagation, and recreation. Sometimes called nonwithdrawal use or in-channel use.
Micro-irrigation.--Irrigation systems that apply water directly to, or very near, the soil surface, either above the ground or into the air, in discrete drops, continuous drops, small streams, mist, or sprays. These include drip systems, spray systems, jet sys-tems, and bubbler systems. Also referred to as drip, low pressure or low volume irri-gation. The efficiencies of these micro-irrigation systems range from 75 to 95 percent (Smajstrla and others, 1988), however, an average of 80 percent is commonly used for estimating water requirements.
viii Contents
Mining water use.--Water used for the extraction of minerals and liquids. Mining also includes water used for milling (such as crushing, screening, washing, and flotation), environmental purposes (such as dust control and wetland restoration or mainte-nance), material conveyance, dewatering, and domestic uses on the premises. Gener-ally, most of the water used at a mining operation is self-supplied.
Navigational water use.--Water utilized as a means of commercial (and sometimes recre-ational) transportation. Includes water used to lift a vessel in a lock, or maintain a navigable channel level. Navigational water use is considered a nonconsumptive instream use of water and is generally not measured.
Net water use.--Water withdrawals plus or minus water transfers. In most counties, the net water use and water withdrawals are equal. However, in counties involved in water transfers (imports and exports), the net water use represents the actual amount of water used regardless of the amount of water withdrawn. In Florida, water trans-fers are mostly found in the public supply category. Also see water transfers.
Non-Community water system.--A public water system which provides piped water for human consumption to at least 15 service connections or which serves at least 25 individuals at least 60 days out of the year but which is not a community water system. The difference between a community water system and a non-community water system is that the former serves inhabitants whereas the latter serves transients or non-residents who other wise do not inhabit the building served by the system. (Florida Department of Environmental Regulation, 1990a).
Non-Transient Non-Community water system.--A public water system that is not a community water system and that regularly serves at least 25 of the same persons over a 6 month period. (Florida Department of Environmental Regulation, 1990a).
Once-through cooling water.--Water (fresh or saline) that is withdrawn from a river, stream or other water body (manmade or natural), or a well, that is passed through a steam condenser one time, and then returned to the river or stream or other water body some distance from the intake (Hughes, 1975). Once-through cooling water is used to exchange the heat from the steam condensers to the cooler water. This method of cooling is commonly used in power production throughout Florida, and usually results in no consumption.
Offstream use.--Water withdrawn or diverted from a ground- or surface-water source for public-water supply, industry, irrigation, livestock, thermoelectric power generation, and other uses. Sometimes called off-channel use or withdrawal use.
Other water use.--Water used in Florida for such purposes as heating, cooling, irrigation (public-supplied only), lake augmentation, and other nonspecific uses. The water can be obtained from a public supply or be self-supplied.
Per capita use.--The average amount of water used per person during a standard time period, generally per day.
Potable water.-- Water that meets the quality standards set by the Florida Department of Environmental Protection. Potable water is considered safe for human consumption and is often referred to as drinking water. In Florida, chloride and dissolved-solids concentrations in potable water must be less than or equal to 250 and 500 mg/L, respectively. Freshwater that exceeds these chloride and dissolved solids limits is often referred to as slightly saline, brackish, or nonpotable water and is either diluted with fresher water or treated through a desalination process to meet potable-water standards for public supply.
Primary wastewater treatment.--First step in wastewater treatment where screens and sedimentation tanks are used to remove most materials that float or settle. Primary treatment removes about 30 percent of carbonaceous biochemical oxygen demand from domestic sewage (U.S. Environmental Protection Agency, 1997, written com-mun.).
Public supply.--Water withdrawn by public or private water suppliers and delivered to users who do not supply their own water. Water suppliers provide water for a variety of uses, such as domestic, commercial, industrial, thermoelectric power (domestic
Contents ix
and cooling purposes), and public-water use. According to the Florida Department of Environmental Protection, any water system that serves more than 25 people or has 15 year-round service connections is considered a community public supplier (Flor-ida Department of Environmental Regulation, 1990a). For this report, public supply includes those systems that serve more than 400 people or use more than 10,000 gal-lons per day.
Public-water use.--Water supplied from a public-water supply and used for such purposes as firefighting, street washing, and municipal parks and swimming pools. Public-water use also includes system water losses (water lost to leakage) and unusable water discharged from desalination or lime-softening facilities. Also referred to as utility-water use.
Reclaimed water.--Water that has received at least secondary treatment and is reused after leaving a wastewater treatment facility.
Recycled water.--Water that is used more than one time before it passes back into the natural hydrological system or is discharged into a wastewater system. Also referred to as recirculated water.
Resident population.--The number of persons who live in a State who consider the State their permanent place of residence. College students, military personnel, and inmates of penal institutions are counted as permanent residents. According to this definition, tourist and seasonal or part-time residents are considered nonresident population.
Residential water use.--See domestic water use.Reuse system.--The deliberate application of reclaimed water for a beneficial or other
useful purpose. Reuse may encompass landscape irrigation (such as golf courses, cemeteries, highway medians, parks, playgrounds, school yards, nurseries, and resi-dential properties), agricultural irrigation (such as food and fruit crops, wholesale nurseries, sod farms and pasture grass), aesthetic uses, ground-water recharge, envi-ronmental enhancement of surface water and wetland restoration, fire protection, and other useful purposes.
Reverse osmosis.--The process of removing salts from water using a membrane. With reverse osmosis, the product water passes through a fine membrane that the salts are unable to pass through, and the salt waste (brine) is removed and disposed. This differs from electrodialysis where the salts are extracted from the feedwater by using a membrane with an electrical current to separate the ions. During electrodialysis the positive ions flow through one membrane, while the negative ions flow through a different membrane, leaving freshwater as the end product. In this report, reverse osmosis includes any water treated through both reverse osmosis and electrodialysis and any water diluted or blended with fresher water that was used to obtain potable water. Also see desalination.
Saline water.--Water that contains more than 1,000 mg/L of dissolved solids.Secondary wastewater treatment.--The second step in most domestic wastewater treat-
ment systems in which bacteria consume the organic parts of the waste. This treat-ment removes floating and settleable solids and about 90 percent of the oxygen-demanding substances and suspended solids. Disinfection is the final stage of sec-ondary treatment (U.S. Environmental Protection Agency, 1997, written commun.).
Self-supplied water.--Water withdrawn from a ground- or surface-water source by a user and not obtained from a public supply.
Settling pond.--A holding pond for wastewater where heavier particles sink to the bottom for removal and disposal.
Sprinkler irrigation.--A pressurized irrigation system where water is distributed through pipes to the field and applied through a variety of sprinkler heads or nozzles. Pressure is used to spread water droplets above the crop canopy to simulate a rainfall (Izuno and Haman, 1987). These systems include portable and traveling guns, solid or permanent fixtures (overhead or pop ups), center pivots, and periodic moving systems. Also referred to as overhead irrigation. The efficiencies of these sprinkler
x Contents
irrigation systems range from 15 to 85 percent (Smajstrla and others, 1988), however, an average of 70 percent is commonly used for estimating water requirements.
Surface-water disposal.-- Refers to the release of reclaimed water or treated effluent directly into a surface water body (including marshes or wetlands). This does not include water discharged into ponds for holding or percolation purposes (Marella, 1994).
Tail-water runoff.--Unused irrigation water or rain water that is collected at the base or end of an irrigated system or field in a ditch or impoundment. This water may be reused again for irrigation purposes, be left to evaporate, percolate into the ground, receive treatment, and (or) be discharged to surface-water bodies.
Thermoelectric power.--Electrical power generated by using fossil fuel (coal, oil, natural gas or biomass), geothermal, or nuclear energy.
Thermoelectric power water use.--Water used in the process of the generation of electric power. The majority of water used for this category is for cooling purposes (much of which is used for once-through cooling). Water is also used for boiler makeup or domestic purposes throughout the plant. Boiler makeup water and water used for domestic purposes are generally obtained from public supply, however, for plants located in remote areas, this water can be self-supplied. Cooling water is generally self-supplied, although some smaller plants use public-supply water for cooling purposes.
Treated (wastewater) effluent.--Water that has received primary, secondary, or advanced treatment and is released from a wastewater facility after treatment.
Wastewater.--A combination of liquid and water-carried pollutants from residential or commercial buildings, industrial plants, and institutions. Wastewater may include any ground water, surface runoff, or leachate that may be present in the system.
Water transfer.--Artificial conveyance of water from one area to another across a politi-cal or hydrological boundary. This is referred to as an import or export of water from one basin or county to another.
Water use.--1) In a restrictive sence, the term refers to water that is actually used for a specific purpose such as domestic use, irrigation, or industial processing. 2) More broadly, water use pertains to human’s interaction with and influence on the hydro-logic cycle, and includes elements such as water withdrawals, deliveries, consump-tive use, wastewater releases, reclaimed wastewater, return flow and instream use.
Withdrawal.--Water removed from the ground or diverted from a surface-water source.The amount of water withdrawn may not equal the amount of water used due to water transfers or the recirculation or recycling of the same water. For example, a power plant may use the same water multiple times but withdraw a significantly dif-ferent amount.
Water Withdrawals, Use, Discharge, and Trends in Florida, 1995By Richard L. Marella
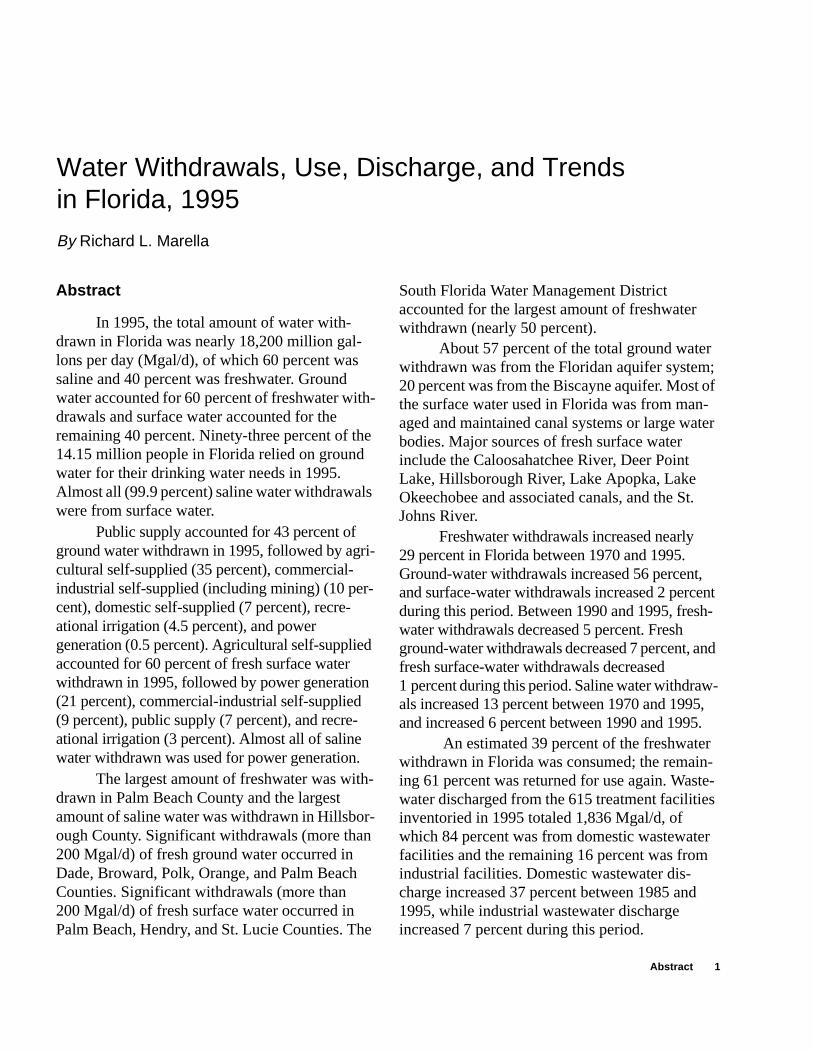
Abstract
In 1995, the total amount of water with-drawn in Florida was nearly 18,200 million gal-lons per day (Mgal/d), of which 60 percent was saline and 40 percent was freshwater. Ground water accounted for 60 percent of freshwater with-drawals and surface water accounted for the remaining 40 percent. Ninety-three percent of the 14.15 million people in Florida relied on ground water for their drinking water needs in 1995. Almost all (99.9 percent) saline water withdrawals were from surface water.
Public supply accounted for 43 percent of ground water withdrawn in 1995, followed by agri-cultural self-supplied (35 percent), commercial-industrial self-supplied (including mining) (10 per-cent), domestic self-supplied (7 percent), recre-ational irrigation (4.5 percent), and power generation (0.5 percent). Agricultural self-supplied accounted for 60 percent of fresh surface water withdrawn in 1995, followed by power generation (21 percent), commercial-industrial self-supplied (9 percent), public supply (7 percent), and recre-ational irrigation (3 percent). Almost all of saline water withdrawn was used for power generation.
The largest amount of freshwater was with-drawn in Palm Beach County and the largest amount of saline water was withdrawn in Hillsbor-ough County. Significant withdrawals (more than 200 Mgal/d) of fresh ground water occurred in Dade, Broward, Polk, Orange, and Palm Beach Counties. Significant withdrawals (more than 200 Mgal/d) of fresh surface water occurred in Palm Beach, Hendry, and St. Lucie Counties. The
South Florida Water Management District accounted for the largest amount of freshwater withdrawn (nearly 50 percent).
About 57 percent of the total ground water withdrawn was from the Floridan aquifer system; 20 percent was from the Biscayne aquifer. Most of the surface water used in Florida was from man-aged and maintained canal systems or large water bodies. Major sources of fresh surface water include the Caloosahatchee River, Deer Point Lake, Hillsborough River, Lake Apopka, Lake Okeechobee and associated canals, and the St. Johns River.
Freshwater withdrawals increased nearly 29 percent in Florida between 1970 and 1995. Ground-water withdrawals increased 56 percent, and surface-water withdrawals increased 2 percent during this period. Between 1990 and 1995, fresh-water withdrawals decreased 5 percent. Fresh ground-water withdrawals decreased 7 percent, and fresh surface-water withdrawals decreased 1 percent during this period. Saline water withdraw-als increased 13 percent between 1970 and 1995, and increased 6 percent between 1990 and 1995.
An estimated 39 percent of the freshwater withdrawn in Florida was consumed; the remain-ing 61 percent was returned for use again. Waste-water discharged from the 615 treatment facilities inventoried in 1995 totaled 1,836 Mgal/d, of which 84 percent was from domestic wastewater facilities and the remaining 16 percent was from industrial facilities. Domestic wastewater dis-charge increased 37 percent between 1985 and 1995, while industrial wastewater discharge increased 7 percent during this period.
Abstract 1
al
rt
d er-
te sti-
r d o-ct-
er r d,
-
a-d
of
-ere re-
ut nd
led
Water resources are one of Florida’s most valued assets. The State has more than 1,700 streams and riv-ers and 7,800 freshwater lakes, and is underlain virtu-ally everywhere by aquifers capable of yielding significant quantities of freshwater to wells. These water resources provide for human and environmental needs. However, the resources are finite and growth in population, tourism, and agriculture are placing an increasing demand on them.
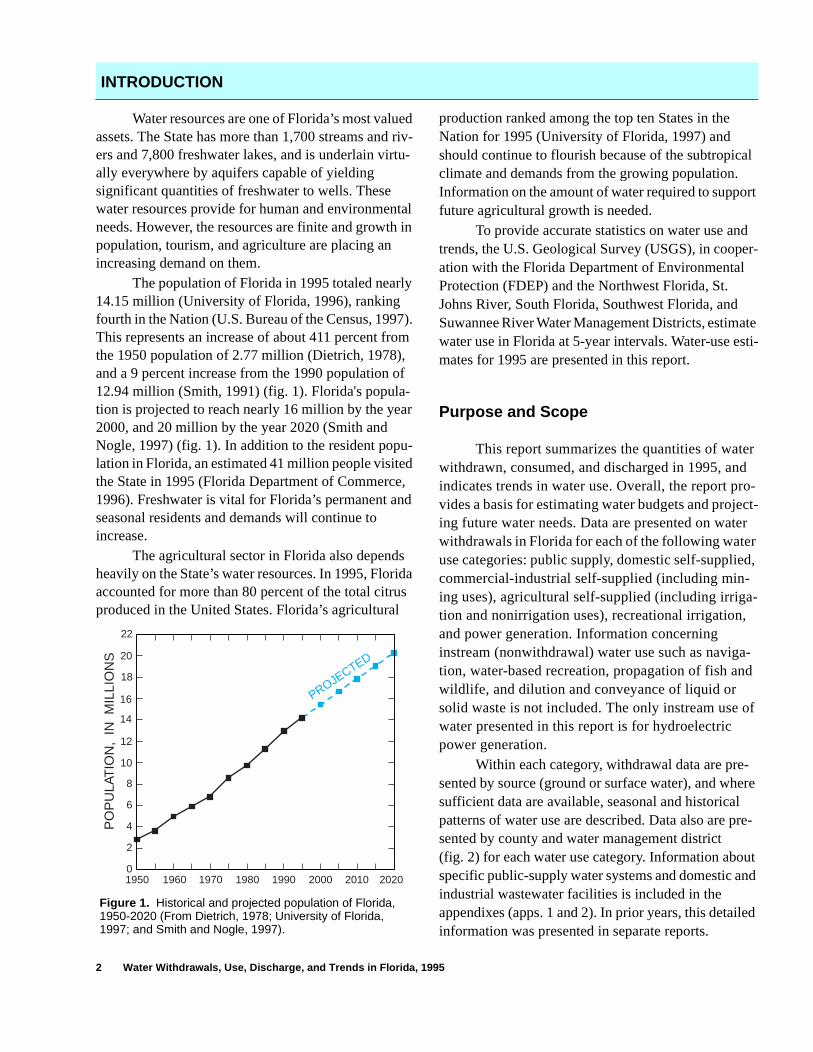
The population of Florida in 1995 totaled nearly 14.15 million (University of Florida, 1996), ranking fourth in the Nation (U.S. Bureau of the Census, 1997). This represents an increase of about 411 percent from the 1950 population of 2.77 million (Dietrich, 1978), and a 9 percent increase from the 1990 population of 12.94 million (Smith, 1991) (fig. 1). Florida's popula-tion is projected to reach nearly 16 million by the year 2000, and 20 million by the year 2020 (Smith and Nogle, 1997) (fig. 1). In addition to the resident popu-lation in Florida, an estimated 41 million people visited the State in 1995 (Florida Department of Commerce, 1996). Freshwater is vital for Florida’s permanent and seasonal residents and demands will continue to increase.
The agricultural sector in Florida also depends heavily on the State’s water resources. In 1995, Florida accounted for more than 80 percent of the total citrus produced in the United States. Florida’s agricultural
production ranked among the top ten States in the Nation for 1995 (University of Florida, 1997) and should continue to flourish because of the subtropicclimate and demands from the growing population. Information on the amount of water required to suppofuture agricultural growth is needed.
To provide accurate statistics on water use antrends, the U.S. Geological Survey (USGS), in coopation with the Florida Department of Environmental Protection (FDEP) and the Northwest Florida, St. Johns River, South Florida, Southwest Florida, and Suwannee River Water Management Districts, estimawater use in Florida at 5-year intervals. Water-use emates for 1995 are presented in this report.
Purpose and Scope
This report summarizes the quantities of watewithdrawn, consumed, and discharged in 1995, anindicates trends in water use. Overall, the report prvides a basis for estimating water budgets and projeing future water needs. Data are presented on watwithdrawals in Florida for each of the following wateuse categories: public supply, domestic self-suppliecommercial-industrial self-supplied (including min-ing uses), agricultural self-supplied (including irrigation and nonirrigation uses), recreational irrigation,and power generation. Information concerning instream (nonwithdrawal) water use such as navigtion, water-based recreation, propagation of fish anwildlife, and dilution and conveyance of liquid or solid waste is not included. The only instream use water presented in this report is for hydroelectric power generation.
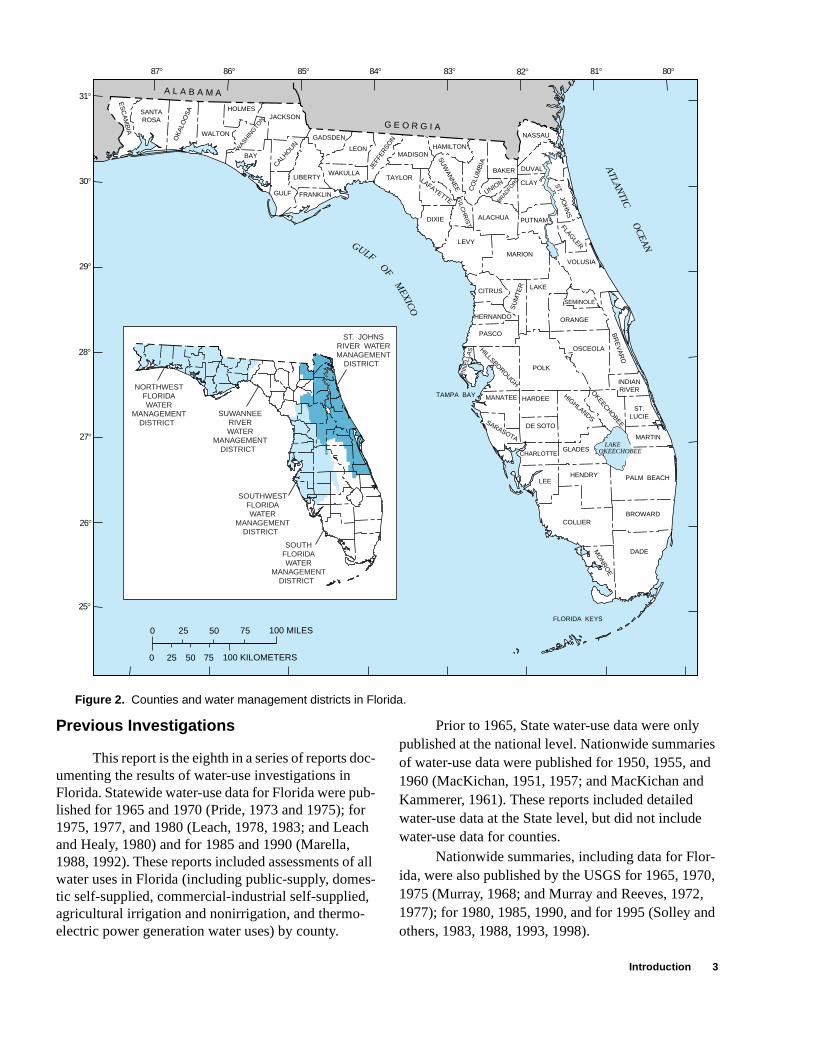
Within each category, withdrawal data are presented by source (ground or surface water), and whsufficient data are available, seasonal and historicalpatterns of water use are described. Data also are psented by county and water management district (fig. 2) for each water use category. Information abospecific public-supply water systems and domestic aindustrial wastewater facilities is included in the appendixes (apps. 1 and 2). In prior years, this detaiinformation was presented in separate reports.
INTRODUCTION
8
10
12
14
16
18
20
22
6
4
2
0
PO
PU
LAT
ION
, IN
MIL
LIO
NS
1950 1960 1970 1980 1990 2000 2010 2020
PROJECTED
Figure 1. Historical and projected population of Florida, 1950-2020 (From Dietrich, 1978; University of Florida, 1997; and Smith and Nogle, 1997).
2 Water Withdrawals, Use, Discharge, and Trends in Florida, 1995
Previous Investigations
This report is the eighth in a series of reports doc-umenting the results of water-use investigations in Florida. Statewide water-use data for Florida were pub-lished for 1965 and 1970 (Pride, 1973 and 1975); for 1975, 1977, and 1980 (Leach, 1978, 1983; and Leach and Healy, 1980) and for 1985 and 1990 (Marella, 1988, 1992). These reports included assessments of all water uses in Florida (including public-supply, domes-tic self-supplied, commercial-industrial self-supplied, agricultural irrigation and nonirrigation, and thermo-electric power generation water uses) by county.
Prior to 1965, State water-use data were only published at the national level. Nationwide summaries of water-use data were published for 1950, 1955, and 1960 (MacKichan, 1951, 1957; and MacKichan and Kammerer, 1961). These reports included detailed water-use data at the State level, but did not include water-use data for counties.
Nationwide summaries, including data for Flor-ida, were also published by the USGS for 1965, 1970, 1975 (Murray, 1968; and Murray and Reeves, 1972, 1977); for 1980, 1985, 1990, and for 1995 (Solley and others, 1983, 1988, 1993, 1998).
A L A B A M A
G E O R G I A
100 MILES25 50 750
25 100 KILOMETERS50 750
31
30
29
28
27
26
25
87 86 85 84 83 82 81 80
ES
CA
MB
IA
TAMPA BAY
LAKEOKEECHOBEE
FLORIDA KEYS
HILLSBOROUGH
BR
EV
AR
D
JEFF
ERSO
NOK
ALO
OS
A
SU
WA
NN
EE C
OLU
MB
IA
UNION
FLAGLER
SU
MTE
R
HIGHLANDSSARASOTA
OKEECHO
BEE
MO
NR
OE
PIN
ELL
AS
INDIANRIVER
LEE
ORANGE
PASCO
OSCEOLA
LAKE
BAKER
MARION
CLAY
DUVAL
NASSAU
PUTNAMALACHUA
SANTAROSA
WALTON
HOLMES
BAY
JACKSON
GADSDEN
GULF FRANKLIN
LIBERTYWAKULLA
LEONMADISON
HAMILTON
TAYLOR
DIXIE
LEVY
VOLUSIA
CITRUS
HERNANDO
SEMINOLE
POLK
HARDEE
DE SOTO
ST.LUCIE
MARTIN
MANATEE
GLADES
HENDRY PALM BEACH
BROWARDCOLLIER
DADE
CHARLOTTE
WASHIN
GTO
N
CALHOUN
LAFAYETTE GILC
HR
IST
BRADFORD S
T. JOH
NS
ATLA
NTIC
OC
EA
NGULF
OFM
EXICO
SUWANNEERIVERWATER
MANAGEMENTDISTRICT
NORTHWESTFLORIDAWATER
MANAGEMENTDISTRICT
SOUTHWESTFLORIDAWATER
MANAGEMENTDISTRICT
ST. JOHNSRIVER WATERMANAGEMENT
DISTRICT
SOUTHFLORIDAWATER
MANAGEMENTDISTRICT
Figure 2. Counties and water management districts in Florida.
Introduction 3
ns t ce -
u-al -r
op-
s
-
it st
- by ted 5
-,
;
da );
of e
ed irri-
Additional water-use reports have been pub-lished by selected water management districts between 1975 and 1995 (see selected water use bibliography). The St. Johns River and the Southwest Florida Water Management District have published annual water-use reports since 1977; the Northwest Florida, South Flor-ida, and the Suwannee River Water Management Dis-tricts have intermittently published reports between 1977 and 1985. Detailed water-use data for 1995 were published for the St. Johns River Water Management District (Florence and Moore, 1997) and the Southwest Florida Water Management District (1997).
Data Sources and Limitations
As part of the USGS National Water-Use Infor-mation Program, water-use data are collected and com-piled for each State every 5 years (Solley and others, 1988). Data are reported for each State by water-use cat-egory, county, hydrologic unit (basin), and aquifer. For this report, Florida water-use data were compiled through an ongoing cooperative program with the FDEP, as part of the 1995 National Water-Use Information Pro-gram. Data were obtained from the FDEP (Drinking Water and Wastewater Sections), the Northwest Florida Water Management District (NWFWMD), the St. Johns River Water Management District (SJRWMD), the South Florida Water Management District (SFWMD), the Southwest Florida Water Management District (SWFWMD), and the Suwannee River Water Manage-ment District (SRWMD), as well as from various utili-ties, industries, and power companies. Specific data sources for each category are listed below.
Public supply.--Data for public-supply with-drawals were obtained from the FDEP’s Drinking Water Section (monthly operating reports), the five water management districts (consumptive water-use permit files or annual reports), or directly from the water supplier. All water use values for this category are from metered data. The population served value for each public supplier was selected by one of three sources: (1) estimated using the number of service con-nections multipled by the number people per household per county (Smith and Cody, 1996); (2) published pop-ulation estimates for selected cities (University of Flor-ida, 1996); or (3) estimates made by the individual public supplier that were reported to FDEP (Drinking Water Quick Look Report, Florida Department of Environmental Protection, written commun., April 1995). Population served numbers in the Northwest
Florida, the South Florida, and the Suwannee RiverWater Management Districts were estimated by the USGS. Estimates for population served in the St. JohRiver and the Southwest Florida Water ManagemenDistrict were made by the respective districts (Florenand Moore, 1997; Southwest Florida Water Management District, 1997).
Domestic self-supplied.--Domestic self-sup-plied populations are derived by subtracting the poplation served by public-supplied systems from the totcounty population. Domestic self-supplied withdrawals are calculated by multiplying the public-supply pecapita use (in gallons per day) by the self-supplied pulation served for each county or were obtained fromthe water management districts. All water use valuefor this category are estimated.
Commercial-industrial self-supplied.--Data for commercial, industrial, and mining withdrawals were obtained from the FDEP’s Drinking Water Section (monthly operating reports), the five water management districts (consumptive water-use permfiles or annual reports), or directly from the user. Moof the water use values for this category are from metered data.
Agricultural self-supplied.--Water with-drawn for irrigation was estimated by the water management districts based on crop acreage, multiplieda use coefficient (usually in inches per acre) generafrom selected irrigation models for each crop. Only asmall percentage of the water-use estimates for 199were derived from actual metered data.
Acreage data were obtained by the water management districts from a variety of sources including(1) the University of Florida, Institute of Food and Agriculture Science (IFAS), County Extension Offices(2) the water management districts’ consumptive water-use permit files; (3) the Florida Department ofAgriculture and Consumer Services (FDACS); Agri-cultural Statistics Service, Citrus Summary, Field Crops Summary, and the Vegetable Summary (FloriAgricultural Statistics Service, 1996a; 1996b; 1996c(4) the FDACS, Division of Plant Industry, Annual Report (Florida Department of Agriculture and Con-sumer Services, 1995); and (5) the U.S. DepartmentAgricultural, Natural Resources Conservation Servic(NRCS), County Field Offices. The total number of acres for selected crops for each county was obtainusing these sources, as well as the acreage that wasgated and the method of irrigation.
4 Water Withdrawals, Use, Discharge, and Trends in Florida, 1995
m of r it
d -, S. f
r-al ta
mul-se e
cal for-
s - a-
p-
al-
om -st
-g
. red ed -
al
The supplemental irrigation coefficient used to determine the amount of water needed per crop was obtained from several irrigation models and publica-tions including (1) the modified Blaney-Criddle irriga-tion model; "Irrigation Water Requirements, 1970, revised" (U.S. Soil Conservation Service, 1970); (2) the University of Florida "AFSIRS" computer model (Smajstrla, 1986); and, (3) the "Florida Irrigation Guide" (U.S. Soil Conservation Service, 1982). These models or publications either use actual or long-term averages of rainfall, and temperature (Jones and oth-ers, 1984). Other sources of supplemental irrigation coefficients used for determining irrigation needs included actual metered data for selected crops, or those coefficients provided by agricultural authorities.
Supplemental irrigation application rates (in inches per acre) generated from these sources were mul-tiplied by the number of irrigated acres to yield water use. From these values, estimates of the water sources (ground or surface) were made by local county extension personnel or by using information from the water man-agement district’s consumptive water-use data base. Supplemental irrigation rates include the amount of water needed to grow each crop, and the amount of water necessary to overcome the inefficiency of the irrigation system and water used for frost and freeze protection.
Withdrawals were estimated for livestock and fish farming by multiplying the total number of cattle (including dairy cattle), chickens, horses, and swine for each county by a water-use coefficient per animal type. The number of animals per county was obtained from the FDACS, Agricultural Statistics Service, Livestock Summary (Florida Agricultural Statistics Service, 1996d). Water-use coefficients were obtained from the University of Florida, IFAS (St. Johns River Water Management District, 1984).
Estimates of the quantity of ground or surface water used were provided by local county extension personnel or were determined by using information from the water management district’s consumptive water-use data base. The quantity of water withdrawn for fish farming was obtained from the water manage-ment district's consumptive water-use permit files or was estimated based on a coefficient of 50 inches per pond acre. Pond acreage was obtained from the county extension office and the water management districts.
Recreational irrigation.--Water withdrawal values for recreational irrigation were estimated based on irrigated acreage multiplied by a coefficient (usually in inches per acre) generated from selected irrigation models for turf grass. Only a small percentage of the water-use estimates for 1995 were derived from actual metered data.
The total number of acres and acres irrigated were obtained by the water management districts froa variety of sources that included: (1) the University Florida, IFAS, County Extension Offices; (2) the watemanagement districts’ consumptive water-use permfiles and needs and sources documents; and (3) theFlorida Department of Commerce, Florida Sports Foundation (Florida Sports Foundation, 1994).
The supplemental irrigation coefficient used todetermine the amount of water needed was obtainefrom several irrigation models or publications including: (1) the modified Blaney-Criddle irrigation modeland Irrigation Water Requirements, 1970, revised (U.Soil Conservation Service, 1970); (2) the University oFlorida AFSIRS computer model (Smajstrla, 1986); and (3) the Florida Irrigation Guide (U.S. Soil Consevation Service, 1982). Other sources of supplementirrigation coefficients were derived from metered daor were provided by turf-grass authorities.
Supplemental irrigation application rates (in inches per acre) generated from these sources were tiplied by the number of irrigated acres and a water-uvalue was calculated. From this value, estimates of thwater sources (ground or surface) were provided by locounty extension personnel or were made by using inmation from the water management districts.
Power generation.--Data for power genera-tion withdrawals were obtained from the water man-agement districts (consumptive water-use permit fileor annual reports), or directly from the power companies. Withdrawal data were collected for ground andsurface waters, both fresh and saline sources. Informtion on the amount of water purchased from public suplies was obtained from each facility along with the total gross power generated. Most of the water-use vues for this category are from metered data.
Wastewater discharges.--Data for domestic and industrial wastewater discharges were obtained frthe FDEP’s Domestic and Industrial Wastewater Sections (Domestic Plant Flows Report, GMS35, and TeSite History Report for Industrial, GMS36, Florida Department of Environmental Protection, written commun., May 1996), or directly from the monthly operatinreports, the five water management districts (annual reuse reports), or directly from the discharge facilitiesMost discharge values for this category are from metedata. The population served value for each domesticwastewater facility was selected by either: (1) publishpopulation estimates for selected areas (local comprehensive plans); or (2) estimates made by the individudischarge facility that were reported to FDEP (Outfall
Introduction 5
a - a
n, s-
h-
r
n-
a-
ir rly e -r, e m -
e
e ls t. ,
l
m c
Detail Report, GMS05, Florida Department of Environ-mental Protection, written commun., March 1996).
Water withdrawals and use data presented in this report represent the average daily quantities used, as derived from annual data, and are expressed in million gallons per day (Mgal/d). Water-use values presented in the tables in this report are reported to two places to the right of the decimal or to the nearest 10,000 gallons per day (gal/d). Water-use values in the text are rounded to the nearest million gallons per day, and percentages are rounded. Water-use data published in this report may not be identical to the water-use data published by the water management districts or FDEP because of differences in data-collection procedures, categories, and methodology.
The accuracy of these values varies from category to category. Public-supply values usually are more accu-rate because most public-supply systems meter their usage. Whereas agricultural self-supplied or domestic self-supplied values are most often estimated. However, a small percentage of the irrigation values (agricultural and recreational) for 1995 were obtained from metered data.
Several changes in water-use categories have occured in Florida between 1970 and 1995. Most catego-ries have remained the same since 1970, with the follow-ing exceptions. During the 1970’s, rural water use consisted of domestic self-supplied and livestock. In the 1980’s, livestock was added to the agricultural, and domestic self-supplied became a separate category. In the past, agricultural water use has included all irrigation, in 1995, recreational irrigation was removed from agricul-tural water use and placed within its own category. Agricultural self-supplied was called irrigation in the 1970’s, then became agricultural irrigation in the 1980’s, with the addition of livestock and removal of recreation irrigation. Commercial-industrial self-supplied was once called industrial water use, and power generation was once called thermoelectric power generation.
Miscellaneous water withdrawals and uses included in county totals presented in the 1985 water-use report (Marella, 1988) included water withdrawals for residential lawn irrigation, residential heat pumps and air-conditioning units, and water discharged through free-flowing wells. Because of the inconsistency in data from county to county for these uses, they were not included in the 1985 statewide totals (Marella, 1988). Since 1985, some data on residential lawn watering for several counties have been updated and are included in the recreational irrigation section of this report under turf grass. However, the 1990 and 1995 statewide data for water used by residential heat pumps and air condition-ing units and water discharged through free-flowing wells remain inconsistent between counties and are not included in this report.
Acknowledgments
The author gratefully acknowledges the FloridDepartment of Environmental Protection for its cooperation in the State water-use program, and extendsspecial thanks to the following individuals who pro-vided data and technical assistance; Richard AddisoFred Noble, Kenna Study, and David York in Tallahasee, as well as the many individuals in the Drinking Water and Wastewater Programs from the FDEP district offices in Ft. Myers, Jacksonville, Orlando, Pensacola, Tampa, and West Palm Beach.
Special thanks are extended to the Executive Directors of the five water management districts (Nortwest Florida Water Management District, St. Johns River Water Management District, South Florida WateManagement District, Southwest Florida Water Man-agement District, and the Suwannee River Water Maagement District) for their participation and staff cooperation in providing water-use data. The particiption of the following individuals is acknowledged for their data collection and tabulation efforts, and for thetechnical advice and support: Angela Chelette, KimbeRobinson, and Patricia Ryan at the Northwest FloridaWater Management District in Havana; Bruce Florencand Cynthia Moore at the St. Johns River Water Management District in Palatka; Jane Bucca, Mark ElsneDavid Gilpin-Hudson, and Anne-Marie Schroden at thSouth Florida Water Management District in West PalBeach; Mark Hammond, Tabitha Ostow, and You-JenTsai at the Southwest Florida Water Management District in Brooksville; Tammy Davis and William Kirk at the Suwannee River Water Management District in LivOak.
Additionally, special thanks are extended to thmany utility operators, plant managers, and individuawho provided data vital to the completion of this efforThese include staff from: Bay County Public UtilitiesBroward County Public Health Unit, Florida Power and Light Company, Florida Power Corporation, Florida Rock Industries, Florida Water Services (for-merly Southern States Utilities), Gainesville RegionaUtilities, Gulf Power Company, Jacksonville ElectricAuthority, City of Key West, Lakeland Electric and Water, Lee County Public Health Unit, Miami-Dade Water and Sewer, Orlando Utilities Commission, PalBeach County Public Health Unit, Polk County PubliHealth Unit, Sarasota County Public Health Unit, Tampa Electric, City of Tallahassee, University of Florida (Institute of Food and Agriculture Science), U.S. Department of Agricultural (Natural ResourcesConservation Service), and the many others who provided data and technical guidance.
6 Water Withdrawals, Use, Discharge, and Trends in Florida, 1995
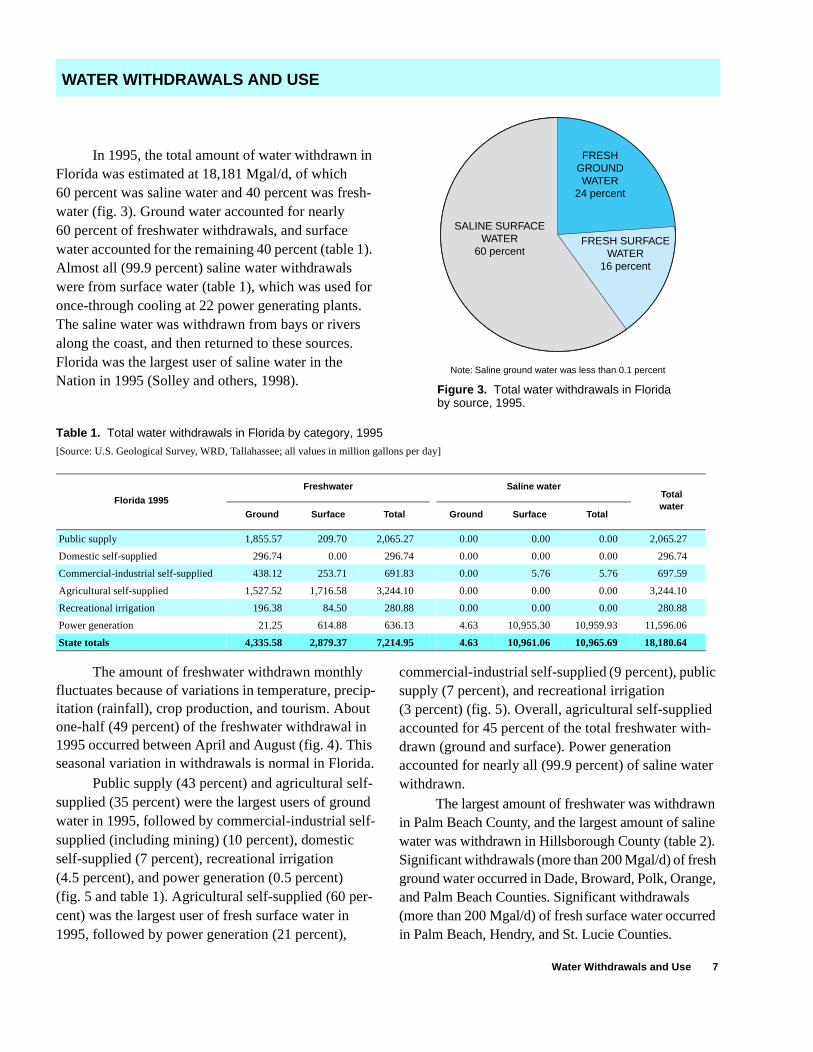
In 1995, the total amount of water withdrawn in Florida was estimated at 18,181 Mgal/d, of which 60 percent was saline water and 40 percent was fresh-water (fig. 3). Ground water accounted for nearly 60 percent of freshwater withdrawals, and surface water accounted for the remaining 40 percent (table 1). Almost all (99.9 percent) saline water withdrawals were from surface water (table 1), which was used for once-through cooling at 22 power generating plants. The saline water was withdrawn from bays or rivers along the coast, and then returned to these sources. Florida was the largest user of saline water in the Nation in 1995 (Solley and others, 1998).
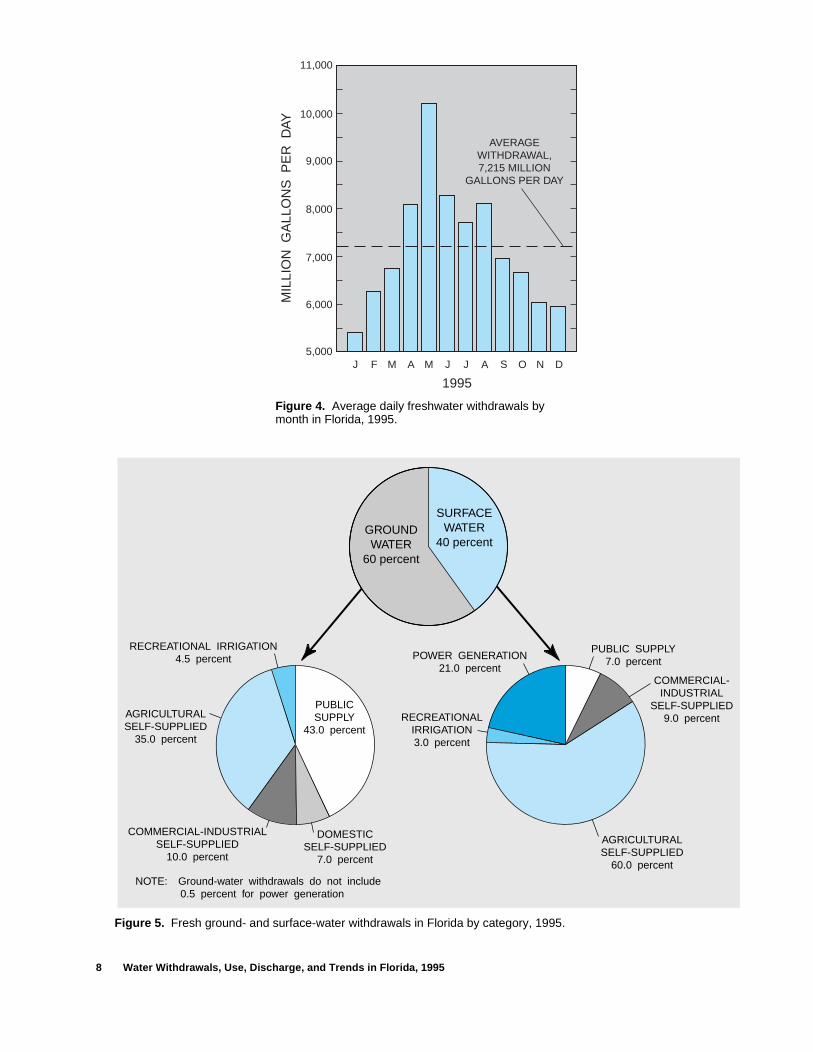
The amount of freshwater withdrawn monthly fluctuates because of variations in temperature, precip-itation (rainfall), crop production, and tourism. About one-half (49 percent) of the freshwater withdrawal in 1995 occurred between April and August (fig. 4). This seasonal variation in withdrawals is normal in Florida.
Public supply (43 percent) and agricultural self-supplied (35 percent) were the largest users of ground water in 1995, followed by commercial-industrial self-supplied (including mining) (10 percent), domestic self-supplied (7 percent), recreational irrigation (4.5 percent), and power generation (0.5 percent) (fig. 5 and table 1). Agricultural self-supplied (60 per-cent) was the largest user of fresh surface water in 1995, followed by power generation (21 percent),
commercial-industrial self-supplied (9 percent), public supply (7 percent), and recreational irrigation (3 percent) (fig. 5). Overall, agricultural self-supplied accounted for 45 percent of the total freshwater with-drawn (ground and surface). Power generation accounted for nearly all (99.9 percent) of saline water withdrawn.
The largest amount of freshwater was withdrawn in Palm Beach County, and the largest amount of saline water was withdrawn in Hillsborough County (table 2). Significant withdrawals (more than 200 Mgal/d) of fresh ground water occurred in Dade, Broward, Polk, Orange, and Palm Beach Counties. Significant withdrawals (more than 200 Mgal/d) of fresh surface water occurred in Palm Beach, Hendry, and St. Lucie Counties.
WATER WITHDRAWALS AND USE
FRESHGROUNDWATER
24 percent
FRESH SURFACEWATER
16 percent
SALINE SURFACEWATER
60 percent
Note: Saline ground water was less than 0.1 percent
Figure 3. Total water withdrawals in Florida by source, 1995.
Table 1. Total water withdrawals in Florida by category, 1995
[Source: U.S. Geological Survey, WRD, Tallahassee; all values in million gallons per day]
Florida 1995
Freshwater Saline waterTotalwater
Ground Surface Total Ground Surface Total
Public supply 1,855.57 209.70 2,065.27 0.00 0.00 0.00 2,065.27
Domestic self-supplied 296.74 0.00 296.74 0.00 0.00 0.00 296.74
Commercial-industrial self-supplied 438.12 253.71 691.83 0.00 5.76 5.76 697.59
Agricultural self-supplied 1,527.52 1,716.58 3,244.10 0.00 0.00 0.00 3,244.10
Recreational irrigation 196.38 84.50 280.88 0.00 0.00 0.00 280.88
Power generation 21.25 614.88 636.13 4.63 10,955.30 10,959.93 11,596.06
State totals 4,335.58 2,879.37 7,214.95 4.63 10,961.06 10,965.69 18,180.64
Water Withdrawals and Use 7
11,000
10,000
9,000
8,000
7,000
6,000
5,000
AVERAGEWITHDRAWAL,7,215 MILLION
GALLONS PER DAY
MIL
LIO
N G
ALL
ON
S P
ER
DAY
1995
J F M A M J J A S O N D
Figure 4. Average daily freshwater withdrawals by month in Florida, 1995.
NOTE: Ground-water withdrawals do not include 0.5 percent for power generation
PUBLICSUPPLY
43.0 percent
DOMESTICSELF-SUPPLIED
7.0 percent
COMMERCIAL-INDUSTRIALSELF-SUPPLIED
10.0 percent
AGRICULTURALSELF-SUPPLIED
35.0 percent
RECREATIONAL IRRIGATION4.5 percent
PUBLIC SUPPLY7.0 percent
COMMERCIAL-INDUSTRIAL
SELF-SUPPLIED9.0 percent
AGRICULTURALSELF-SUPPLIED
60.0 percent
RECREATIONALIRRIGATION3.0 percent
POWER GENERATION21.0 percent
GROUNDWATER
60 percent
SURFACEWATER
40 percent
Figure 5. Fresh ground- and surface-water withdrawals in Florida by category, 1995.
8 Water Withdrawals, Use, Discharge, and Trends in Florida, 1995
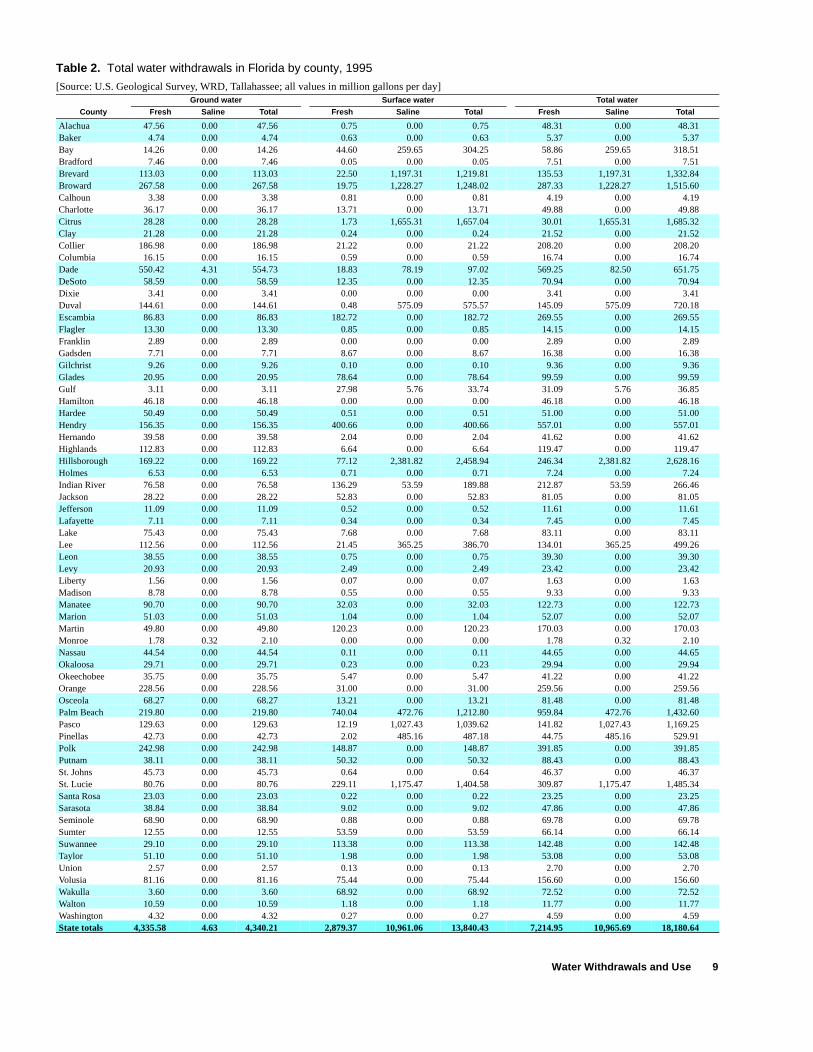
Table 2. Total water withdrawals in Florida by county, 1995
[Source: U.S. Geological Survey, WRD, Tallahassee; all values in million gallons per day]Ground water Surface water Total water
County Fresh Saline Total Fresh Saline Total Fresh Saline Total
Alachua 47.56 0.00 47.56 0.75 0.00 0.75 48.31 0.00 48.31Baker 4.74 0.00 4.74 0.63 0.00 0.63 5.37 0.00 5.37Bay 14.26 0.00 14.26 44.60 259.65 304.25 58.86 259.65 318.51Bradford 7.46 0.00 7.46 0.05 0.00 0.05 7.51 0.00 7.51Brevard 113.03 0.00 113.03 22.50 1,197.31 1,219.81 135.53 1,197.31 1,332.84Broward 267.58 0.00 267.58 19.75 1,228.27 1,248.02 287.33 1,228.27 1,515.60Calhoun 3.38 0.00 3.38 0.81 0.00 0.81 4.19 0.00 4.19Charlotte 36.17 0.00 36.17 13.71 0.00 13.71 49.88 0.00 49.88Citrus 28.28 0.00 28.28 1.73 1,655.31 1,657.04 30.01 1,655.31 1,685.32Clay 21.28 0.00 21.28 0.24 0.00 0.24 21.52 0.00 21.52Collier 186.98 0.00 186.98 21.22 0.00 21.22 208.20 0.00 208.20Columbia 16.15 0.00 16.15 0.59 0.00 0.59 16.74 0.00 16.74Dade 550.42 4.31 554.73 18.83 78.19 97.02 569.25 82.50 651.75DeSoto 58.59 0.00 58.59 12.35 0.00 12.35 70.94 0.00 70.94Dixie 3.41 0.00 3.41 0.00 0.00 0.00 3.41 0.00 3.41Duval 144.61 0.00 144.61 0.48 575.09 575.57 145.09 575.09 720.18Escambia 86.83 0.00 86.83 182.72 0.00 182.72 269.55 0.00 269.55Flagler 13.30 0.00 13.30 0.85 0.00 0.85 14.15 0.00 14.15Franklin 2.89 0.00 2.89 0.00 0.00 0.00 2.89 0.00 2.89Gadsden 7.71 0.00 7.71 8.67 0.00 8.67 16.38 0.00 16.38Gilchrist 9.26 0.00 9.26 0.10 0.00 0.10 9.36 0.00 9.36Glades 20.95 0.00 20.95 78.64 0.00 78.64 99.59 0.00 99.59Gulf 3.11 0.00 3.11 27.98 5.76 33.74 31.09 5.76 36.85Hamilton 46.18 0.00 46.18 0.00 0.00 0.00 46.18 0.00 46.18Hardee 50.49 0.00 50.49 0.51 0.00 0.51 51.00 0.00 51.00Hendry 156.35 0.00 156.35 400.66 0.00 400.66 557.01 0.00 557.01Hernando 39.58 0.00 39.58 2.04 0.00 2.04 41.62 0.00 41.62Highlands 112.83 0.00 112.83 6.64 0.00 6.64 119.47 0.00 119.47Hillsborough 169.22 0.00 169.22 77.12 2,381.82 2,458.94 246.34 2,381.82 2,628.16Holmes 6.53 0.00 6.53 0.71 0.00 0.71 7.24 0.00 7.24Indian River 76.58 0.00 76.58 136.29 53.59 189.88 212.87 53.59 266.46Jackson 28.22 0.00 28.22 52.83 0.00 52.83 81.05 0.00 81.05Jefferson 11.09 0.00 11.09 0.52 0.00 0.52 11.61 0.00 11.61Lafayette 7.11 0.00 7.11 0.34 0.00 0.34 7.45 0.00 7.45Lake 75.43 0.00 75.43 7.68 0.00 7.68 83.11 0.00 83.11Lee 112.56 0.00 112.56 21.45 365.25 386.70 134.01 365.25 499.26Leon 38.55 0.00 38.55 0.75 0.00 0.75 39.30 0.00 39.30Levy 20.93 0.00 20.93 2.49 0.00 2.49 23.42 0.00 23.42Liberty 1.56 0.00 1.56 0.07 0.00 0.07 1.63 0.00 1.63Madison 8.78 0.00 8.78 0.55 0.00 0.55 9.33 0.00 9.33Manatee 90.70 0.00 90.70 32.03 0.00 32.03 122.73 0.00 122.73Marion 51.03 0.00 51.03 1.04 0.00 1.04 52.07 0.00 52.07Martin 49.80 0.00 49.80 120.23 0.00 120.23 170.03 0.00 170.03Monroe 1.78 0.32 2.10 0.00 0.00 0.00 1.78 0.32 2.10Nassau 44.54 0.00 44.54 0.11 0.00 0.11 44.65 0.00 44.65Okaloosa 29.71 0.00 29.71 0.23 0.00 0.23 29.94 0.00 29.94Okeechobee 35.75 0.00 35.75 5.47 0.00 5.47 41.22 0.00 41.22Orange 228.56 0.00 228.56 31.00 0.00 31.00 259.56 0.00 259.56Osceola 68.27 0.00 68.27 13.21 0.00 13.21 81.48 0.00 81.48Palm Beach 219.80 0.00 219.80 740.04 472.76 1,212.80 959.84 472.76 1,432.60Pasco 129.63 0.00 129.63 12.19 1,027.43 1,039.62 141.82 1,027.43 1,169.25Pinellas 42.73 0.00 42.73 2.02 485.16 487.18 44.75 485.16 529.91Polk 242.98 0.00 242.98 148.87 0.00 148.87 391.85 0.00 391.85Putnam 38.11 0.00 38.11 50.32 0.00 50.32 88.43 0.00 88.43St. Johns 45.73 0.00 45.73 0.64 0.00 0.64 46.37 0.00 46.37St. Lucie 80.76 0.00 80.76 229.11 1,175.47 1,404.58 309.87 1,175.47 1,485.34Santa Rosa 23.03 0.00 23.03 0.22 0.00 0.22 23.25 0.00 23.25Sarasota 38.84 0.00 38.84 9.02 0.00 9.02 47.86 0.00 47.86Seminole 68.90 0.00 68.90 0.88 0.00 0.88 69.78 0.00 69.78Sumter 12.55 0.00 12.55 53.59 0.00 53.59 66.14 0.00 66.14Suwannee 29.10 0.00 29.10 113.38 0.00 113.38 142.48 0.00 142.48Taylor 51.10 0.00 51.10 1.98 0.00 1.98 53.08 0.00 53.08Union 2.57 0.00 2.57 0.13 0.00 0.13 2.70 0.00 2.70Volusia 81.16 0.00 81.16 75.44 0.00 75.44 156.60 0.00 156.60Wakulla 3.60 0.00 3.60 68.92 0.00 68.92 72.52 0.00 72.52Walton 10.59 0.00 10.59 1.18 0.00 1.18 11.77 0.00 11.77Washington 4.32 0.00 4.32 0.27 0.00 0.27 4.59 0.00 4.59State totals 4,335.58 4.63 4,340.21 2,879.37 10,961.06 13,840.43 7,214.95 10,965.69 18,180.64
Water Withdrawals and Use 9
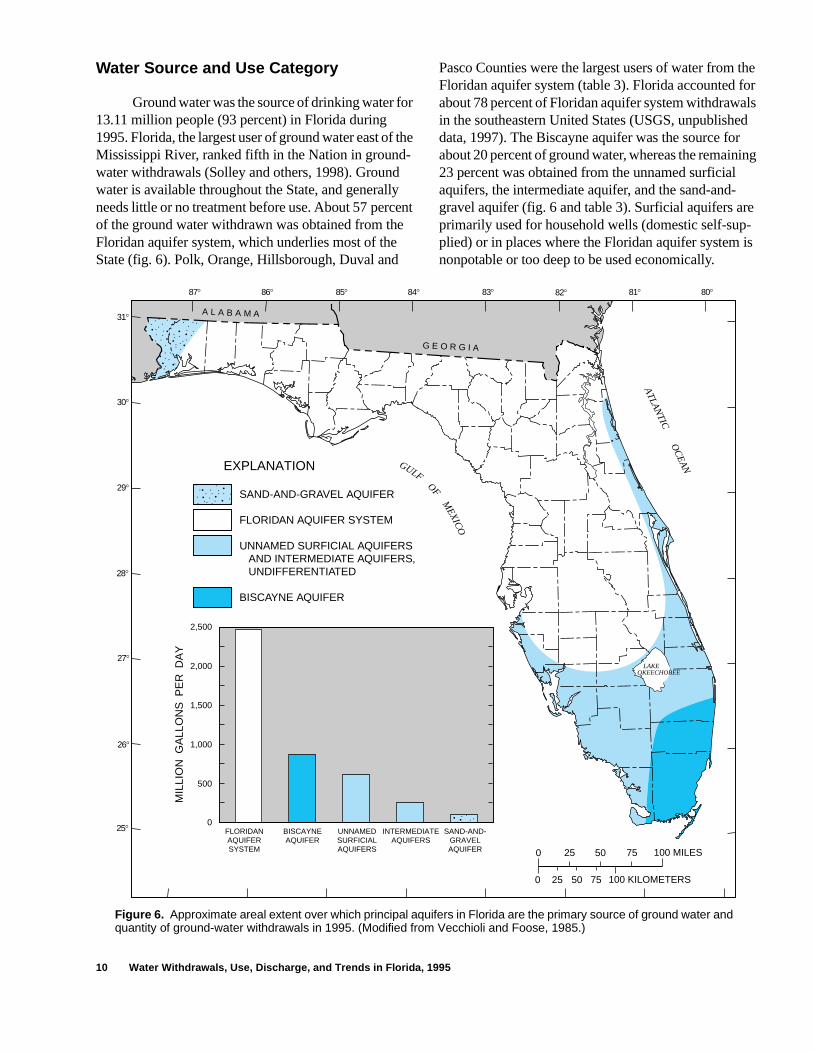
Water Source and Use Category
Ground water was the source of drinking water for 13.11 million people (93 percent) in Florida during 1995. Florida, the largest user of ground water east of the Mississippi River, ranked fifth in the Nation in ground-water withdrawals (Solley and others, 1998). Ground water is available throughout the State, and generally needs little or no treatment before use. About 57 percent of the ground water withdrawn was obtained from the Floridan aquifer system, which underlies most of the State (fig. 6). Polk, Orange, Hillsborough, Duval and
Pasco Counties were the largest users of water from the Floridan aquifer system (table 3). Florida accounted for about 78 percent of Floridan aquifer system withdrawals in the southeastern United States (USGS, unpublished data, 1997). The Biscayne aquifer was the source for about 20 percent of ground water, whereas the remaining 23 percent was obtained from the unnamed surficial aquifers, the intermediate aquifer, and the sand-and-gravel aquifer (fig. 6 and table 3). Surficial aquifers are primarily used for household wells (domestic self-sup-plied) or in places where the Floridan aquifer system is nonpotable or too deep to be used economically.
������
SAND-AND-GRAVEL AQUIFER
FLORIDAN AQUIFER SYSTEM
UNNAMED SURFICIAL AQUIFERS AND INTERMEDIATE AQUIFERS, UNDIFFERENTIATED
BISCAYNE AQUIFER
EXPLANATION��
ATLA
NTIC
OC
EA
N
A L A B A M A
G E O R G I A
31
30
29
28
27
26
25
87 86 85 84 83 82 81 80
LAKEOKEECHOBEE
GULF
OFM
EXICO
100 MILES25 50 750
25 100 KILOMETERS50 750�FLORIDANAQUIFERSYSTEM
BISCAYNEAQUIFER
UNNAMEDSURFICIALAQUIFERS
INTERMEDIATEAQUIFERS
SAND-AND-GRAVELAQUIFER
2,500
500
1,000
1,500
2,000
0
MIL
LIO
N G
ALL
ON
S P
ER
DA
Y
Figure 6. Approximate areal extent over which principal aquifers in Florida are the primary source of ground water and quantity of ground-water withdrawals in 1995. (Modified from Vecchioli and Foose, 1985.)
10 Water Withdrawals, Use, Discharge, and Trends in Florida, 1995
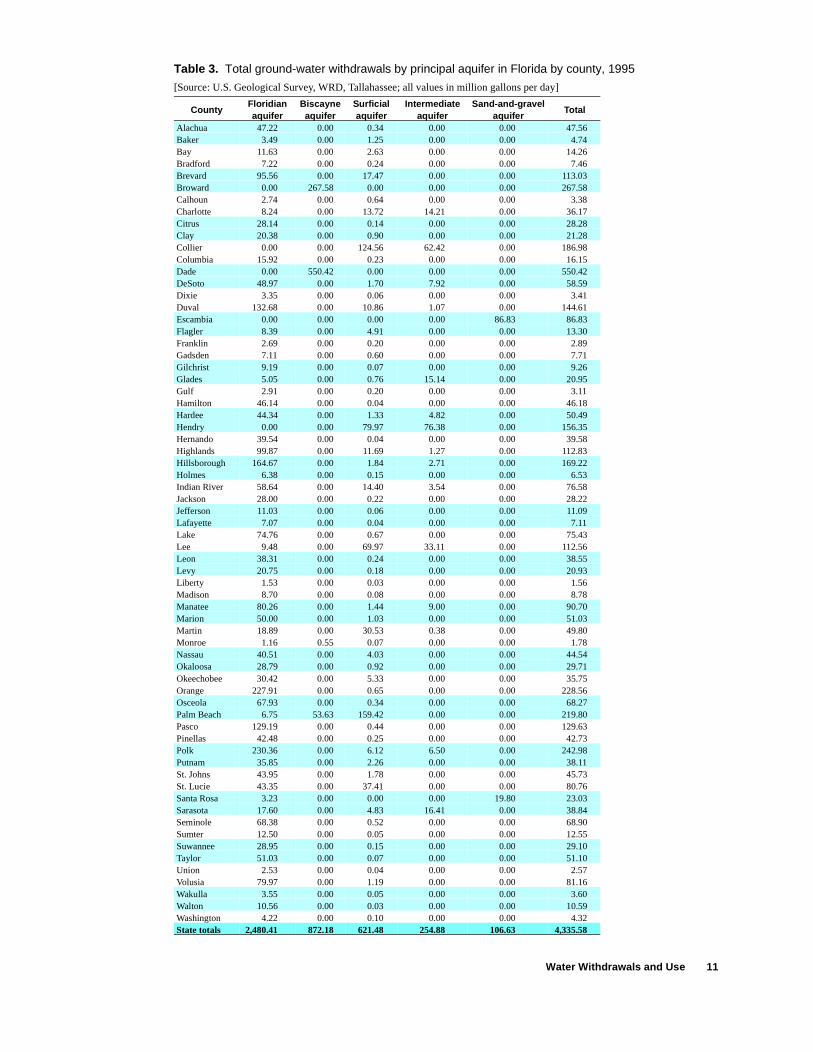
Table 3. Total ground-water withdrawals by principal aquifer in Florida by county, 1995
[Source: U.S. Geological Survey, WRD, Tallahassee; all values in million gallons per day]
CountyFloridianaquifer
Biscayneaquifer
Surficialaquifer
Intermediateaquifer
Sand-and-gravelaquifer
Total
Alachua 47.22 0.00 0.34 0.00 0.00 47.56Baker 3.49 0.00 1.25 0.00 0.00 4.74Bay 11.63 0.00 2.63 0.00 0.00 14.26Bradford 7.22 0.00 0.24 0.00 0.00 7.46Brevard 95.56 0.00 17.47 0.00 0.00 113.03Broward 0.00 267.58 0.00 0.00 0.00 267.58Calhoun 2.74 0.00 0.64 0.00 0.00 3.38Charlotte 8.24 0.00 13.72 14.21 0.00 36.17Citrus 28.14 0.00 0.14 0.00 0.00 28.28Clay 20.38 0.00 0.90 0.00 0.00 21.28Collier 0.00 0.00 124.56 62.42 0.00 186.98Columbia 15.92 0.00 0.23 0.00 0.00 16.15Dade 0.00 550.42 0.00 0.00 0.00 550.42DeSoto 48.97 0.00 1.70 7.92 0.00 58.59Dixie 3.35 0.00 0.06 0.00 0.00 3.41Duval 132.68 0.00 10.86 1.07 0.00 144.61Escambia 0.00 0.00 0.00 0.00 86.83 86.83Flagler 8.39 0.00 4.91 0.00 0.00 13.30Franklin 2.69 0.00 0.20 0.00 0.00 2.89Gadsden 7.11 0.00 0.60 0.00 0.00 7.71Gilchrist 9.19 0.00 0.07 0.00 0.00 9.26Glades 5.05 0.00 0.76 15.14 0.00 20.95Gulf 2.91 0.00 0.20 0.00 0.00 3.11Hamilton 46.14 0.00 0.04 0.00 0.00 46.18Hardee 44.34 0.00 1.33 4.82 0.00 50.49Hendry 0.00 0.00 79.97 76.38 0.00 156.35Hernando 39.54 0.00 0.04 0.00 0.00 39.58Highlands 99.87 0.00 11.69 1.27 0.00 112.83Hillsborough 164.67 0.00 1.84 2.71 0.00 169.22Holmes 6.38 0.00 0.15 0.00 0.00 6.53Indian River 58.64 0.00 14.40 3.54 0.00 76.58Jackson 28.00 0.00 0.22 0.00 0.00 28.22Jefferson 11.03 0.00 0.06 0.00 0.00 11.09Lafayette 7.07 0.00 0.04 0.00 0.00 7.11Lake 74.76 0.00 0.67 0.00 0.00 75.43Lee 9.48 0.00 69.97 33.11 0.00 112.56Leon 38.31 0.00 0.24 0.00 0.00 38.55Levy 20.75 0.00 0.18 0.00 0.00 20.93Liberty 1.53 0.00 0.03 0.00 0.00 1.56Madison 8.70 0.00 0.08 0.00 0.00 8.78Manatee 80.26 0.00 1.44 9.00 0.00 90.70Marion 50.00 0.00 1.03 0.00 0.00 51.03Martin 18.89 0.00 30.53 0.38 0.00 49.80Monroe 1.16 0.55 0.07 0.00 0.00 1.78Nassau 40.51 0.00 4.03 0.00 0.00 44.54Okaloosa 28.79 0.00 0.92 0.00 0.00 29.71Okeechobee 30.42 0.00 5.33 0.00 0.00 35.75Orange 227.91 0.00 0.65 0.00 0.00 228.56Osceola 67.93 0.00 0.34 0.00 0.00 68.27Palm Beach 6.75 53.63 159.42 0.00 0.00 219.80Pasco 129.19 0.00 0.44 0.00 0.00 129.63Pinellas 42.48 0.00 0.25 0.00 0.00 42.73Polk 230.36 0.00 6.12 6.50 0.00 242.98Putnam 35.85 0.00 2.26 0.00 0.00 38.11St. Johns 43.95 0.00 1.78 0.00 0.00 45.73St. Lucie 43.35 0.00 37.41 0.00 0.00 80.76Santa Rosa 3.23 0.00 0.00 0.00 19.80 23.03Sarasota 17.60 0.00 4.83 16.41 0.00 38.84Seminole 68.38 0.00 0.52 0.00 0.00 68.90Sumter 12.50 0.00 0.05 0.00 0.00 12.55Suwannee 28.95 0.00 0.15 0.00 0.00 29.10Taylor 51.03 0.00 0.07 0.00 0.00 51.10Union 2.53 0.00 0.04 0.00 0.00 2.57Volusia 79.97 0.00 1.19 0.00 0.00 81.16Wakulla 3.55 0.00 0.05 0.00 0.00 3.60Walton 10.56 0.00 0.03 0.00 0.00 10.59Washington 4.22 0.00 0.10 0.00 0.00 4.32State totals 2,480.41 872.18 621.48 254.88 106.63 4,335.58
Water Withdrawals and Use 11
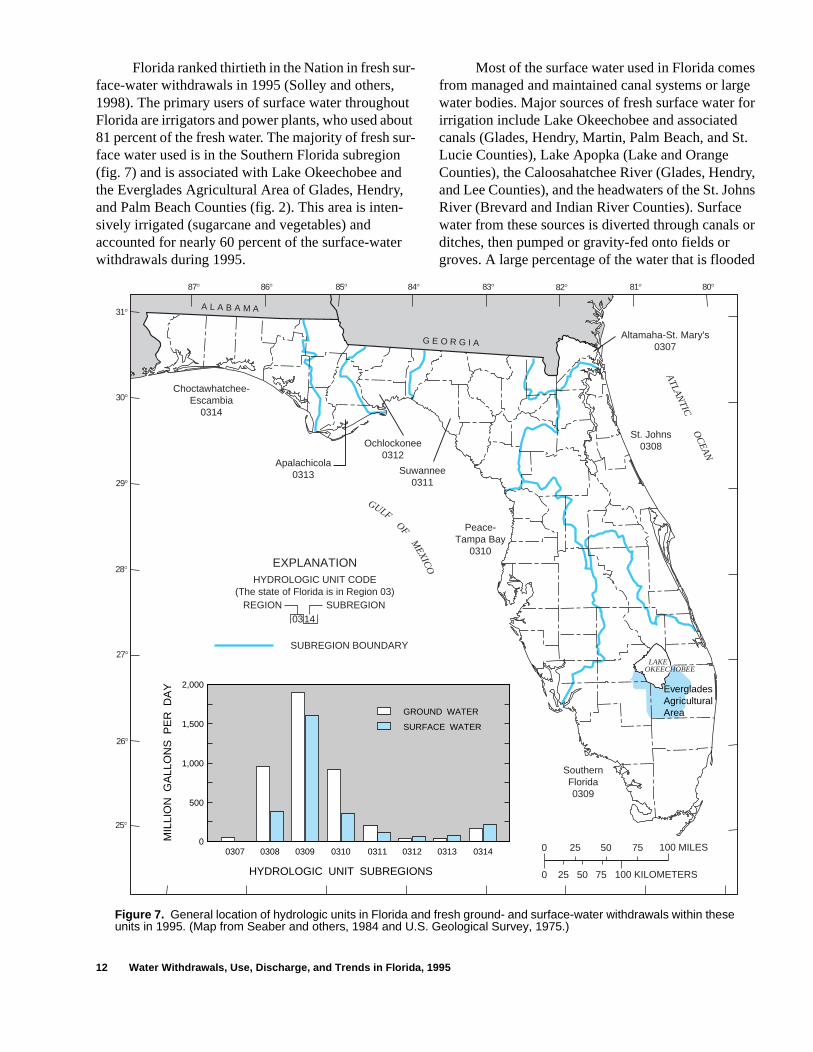
Florida ranked thirtieth in the Nation in fresh sur-face-water withdrawals in 1995 (Solley and others, 1998). The primary users of surface water throughout Florida are irrigators and power plants, who used about 81 percent of the fresh water. The majority of fresh sur-face water used is in the Southern Florida subregion (fig. 7) and is associated with Lake Okeechobee and the Everglades Agricultural Area of Glades, Hendry, and Palm Beach Counties (fig. 2). This area is inten-sively irrigated (sugarcane and vegetables) and accounted for nearly 60 percent of the surface-water withdrawals during 1995.
Most of the surface water used in Florida comes from managed and maintained canal systems or large water bodies. Major sources of fresh surface water for irrigation include Lake Okeechobee and associated canals (Glades, Hendry, Martin, Palm Beach, and St. Lucie Counties), Lake Apopka (Lake and Orange Counties), the Caloosahatchee River (Glades, Hendry, and Lee Counties), and the headwaters of the St. Johns River (Brevard and Indian River Counties). Surface water from these sources is diverted through canals or ditches, then pumped or gravity-fed onto fields or groves. A large percentage of the water that is flooded
EvergladesAgriculturalArea
Choctawhatchee-Escambia
0314
Apalachicola0313
Ochlockonee0312
Altamaha-St. Mary's0307
St. Johns0308
Suwannee0311
Peace-Tampa Bay
0310
SouthernFlorida0309
0314 REGION SUBREGION
HYDROLOGIC UNIT CODE(The state of Florida is in Region 03)
SUBREGION BOUNDARY
EXPLANATION
87 86
A L A B A M A
G E O R G I A
31
30
29
28
27
26
25
85 84 83 82 81 80
ATLA
NTIC
OC
EA
N
GULF
OFM
EXICO
100 MILES25 50 750
25 100 KILOMETERS50 750
LAKEOKEECHOBEE
MIL
LIO
N G
ALL
ON
S P
ER
DA
Y
0307 0308 0309 0310
HYDROLOGIC UNIT SUBREGIONS
031403120311 0313
500
1,000
1,500
2,000
0
GROUND WATER
SURFACE WATER
Figure 7. General location of hydrologic units in Florida and fresh ground- and surface-water withdrawals within these units in 1995. (Map from Seaber and others, 1984 and U.S. Geological Survey, 1975.)
12 Water Withdrawals, Use, Discharge, and Trends in Florida, 1995
f
e
a ls d s,
f
er
n-e
r
ply
l ria-
onto fields or groves is unused and pumped back into the canals or ditches for further use. Throughout the rest of Florida, surface water for irrigation is obtained from local canals, ditches, lakes, ponds, small rivers, creeks, or tributaries. Many of the canals, ditches, or ponds that are used for irrigation are augmented with ground water.
Public Supply
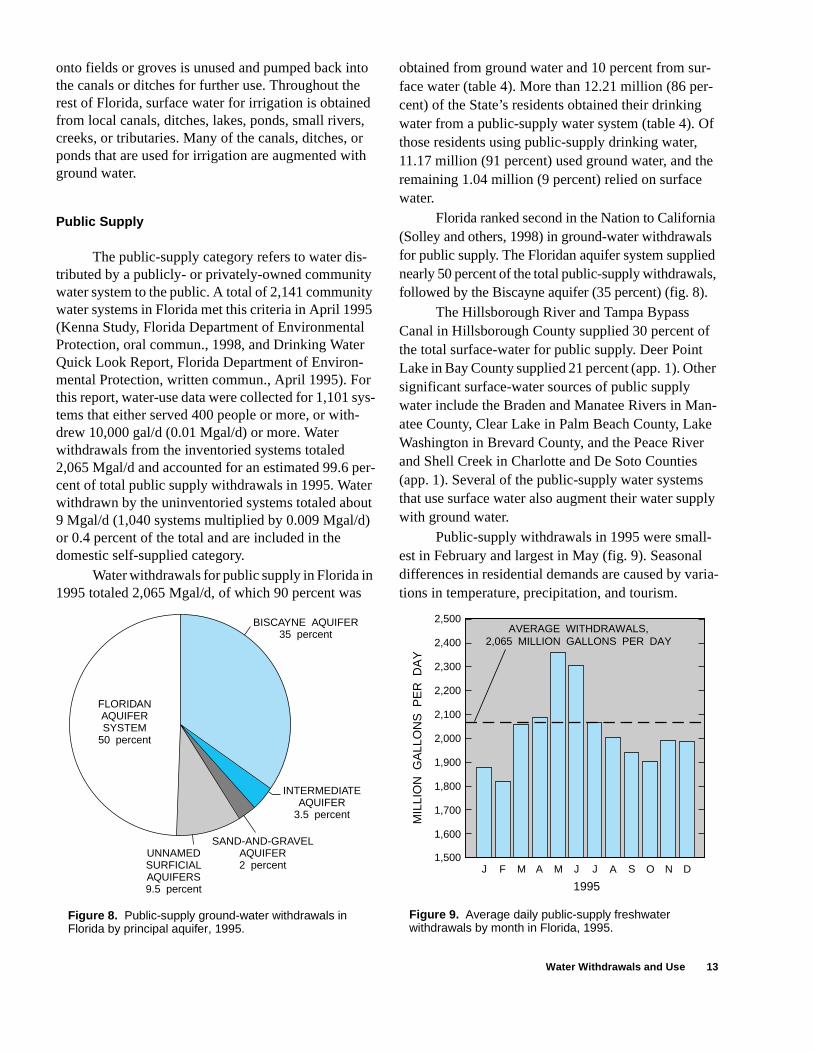
The public-supply category refers to water dis-tributed by a publicly- or privately-owned community water system to the public. A total of 2,141 community water systems in Florida met this criteria in April 1995 (Kenna Study, Florida Department of Environmental Protection, oral commun., 1998, and Drinking Water Quick Look Report, Florida Department of Environ-mental Protection, written commun., April 1995). For this report, water-use data were collected for 1,101 sys-tems that either served 400 people or more, or with-drew 10,000 gal/d (0.01 Mgal/d) or more. Water withdrawals from the inventoried systems totaled 2,065 Mgal/d and accounted for an estimated 99.6 per-cent of total public supply withdrawals in 1995. Water withdrawn by the uninventoried systems totaled about 9 Mgal/d (1,040 systems multiplied by 0.009 Mgal/d) or 0.4 percent of the total and are included in the domestic self-supplied category.
Water withdrawals for public supply in Florida in 1995 totaled 2,065 Mgal/d, of which 90 percent was
obtained from ground water and 10 percent from sur-face water (table 4). More than 12.21 million (86 per-cent) of the State’s residents obtained their drinkingwater from a public-supply water system (table 4). Othose residents using public-supply drinking water, 11.17 million (91 percent) used ground water, and thremaining 1.04 million (9 percent) relied on surface water.
Florida ranked second in the Nation to Californi(Solley and others, 1998) in ground-water withdrawafor public supply. The Floridan aquifer system supplienearly 50 percent of the total public-supply withdrawalfollowed by the Biscayne aquifer (35 percent) (fig. 8).
The Hillsborough River and Tampa Bypass Canal in Hillsborough County supplied 30 percent othe total surface-water for public supply. Deer Point Lake in Bay County supplied 21 percent (app. 1). Othsignificant surface-water sources of public supply water include the Braden and Manatee Rivers in Maatee County, Clear Lake in Palm Beach County, LakWashington in Brevard County, and the Peace Riveand Shell Creek in Charlotte and De Soto Counties (app. 1). Several of the public-supply water systemsthat use surface water also augment their water supwith ground water.
Public-supply withdrawals in 1995 were small-est in February and largest in May (fig. 9). Seasonadifferences in residential demands are caused by vations in temperature, precipitation, and tourism.
FLORIDANAQUIFERSYSTEM
50 percent
UNNAMEDSURFICIALAQUIFERS9.5 percent
SAND-AND-GRAVELAQUIFER2 percent
INTERMEDIATEAQUIFER
3.5 percent
BISCAYNE AQUIFER35 percent
Figure 8. Public-supply ground-water withdrawals in Florida by principal aquifer, 1995.
J F M A M J J A S O N D
2,500
1,600
1,700
1,800
1,900
2,000
2,100
2,200
2,300
2,400
1,500
MIL
LIO
N G
ALL
ON
S P
ER
DA
Y
AVERAGE WITHDRAWALS,2,065 MILLION GALLONS PER DAY
1995
Figure 9. Average daily public-supply freshwater withdrawals by month in Florida, 1995.
Water Withdrawals and Use 13
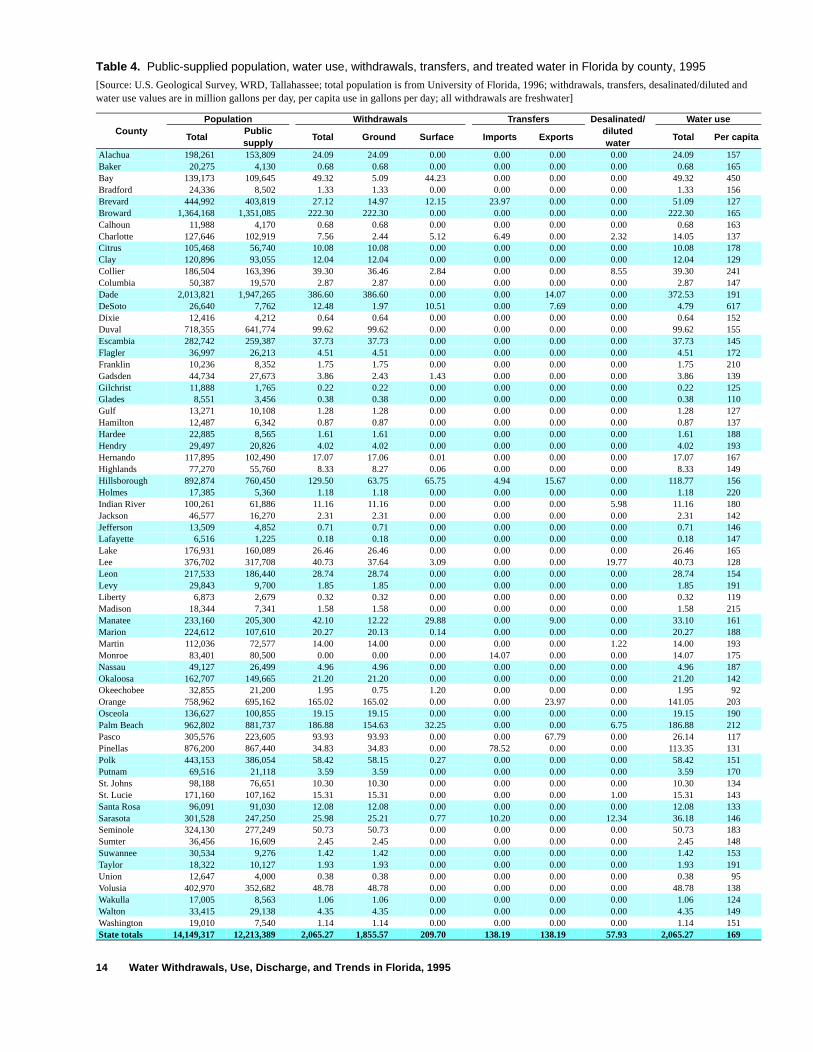
Table 4. Public-supplied population, water use, withdrawals, transfers, and treated water in Florida by county, 1995
[Source: U.S. Geological Survey, WRD, Tallahassee; total population is from University of Florida, 1996; withdrawals, transfers, desalinated/diluted and water use values are in million gallons per day, per capita use in gallons per day; all withdrawals are freshwater]
CountyPopulation Withdrawals Transfers Desalinated/
dilutedwater
Water use
Imports ExportsTotalPublicsupply
Total Ground Surface Total Per capita
Alachua 198,261 153,809 24.09 24.09 0.00 0.00 0.00 0.00 24.09 157Baker 20,275 4,130 0.68 0.68 0.00 0.00 0.00 0.00 0.68 165Bay 139,173 109,645 49.32 5.09 44.23 0.00 0.00 0.00 49.32 450Bradford 24,336 8,502 1.33 1.33 0.00 0.00 0.00 0.00 1.33 156Brevard 444,992 403,819 27.12 14.97 12.15 23.97 0.00 0.00 51.09 127Broward 1,364,168 1,351,085 222.30 222.30 0.00 0.00 0.00 0.00 222.30 165Calhoun 11,988 4,170 0.68 0.68 0.00 0.00 0.00 0.00 0.68 163Charlotte 127,646 102,919 7.56 2.44 5.12 6.49 0.00 2.32 14.05 137Citrus 105,468 56,740 10.08 10.08 0.00 0.00 0.00 0.00 10.08 178Clay 120,896 93,055 12.04 12.04 0.00 0.00 0.00 0.00 12.04 129Collier 186,504 163,396 39.30 36.46 2.84 0.00 0.00 8.55 39.30 241Columbia 50,387 19,570 2.87 2.87 0.00 0.00 0.00 0.00 2.87 147Dade 2,013,821 1,947,265 386.60 386.60 0.00 0.00 14.07 0.00 372.53 191DeSoto 26,640 7,762 12.48 1.97 10.51 0.00 7.69 0.00 4.79 617Dixie 12,416 4,212 0.64 0.64 0.00 0.00 0.00 0.00 0.64 152Duval 718,355 641,774 99.62 99.62 0.00 0.00 0.00 0.00 99.62 155Escambia 282,742 259,387 37.73 37.73 0.00 0.00 0.00 0.00 37.73 145Flagler 36,997 26,213 4.51 4.51 0.00 0.00 0.00 0.00 4.51 172Franklin 10,236 8,352 1.75 1.75 0.00 0.00 0.00 0.00 1.75 210Gadsden 44,734 27,673 3.86 2.43 1.43 0.00 0.00 0.00 3.86 139Gilchrist 11,888 1,765 0.22 0.22 0.00 0.00 0.00 0.00 0.22 125Glades 8,551 3,456 0.38 0.38 0.00 0.00 0.00 0.00 0.38 110Gulf 13,271 10,108 1.28 1.28 0.00 0.00 0.00 0.00 1.28 127Hamilton 12,487 6,342 0.87 0.87 0.00 0.00 0.00 0.00 0.87 137Hardee 22,885 8,565 1.61 1.61 0.00 0.00 0.00 0.00 1.61 188Hendry 29,497 20,826 4.02 4.02 0.00 0.00 0.00 0.00 4.02 193Hernando 117,895 102,490 17.07 17.06 0.01 0.00 0.00 0.00 17.07 167Highlands 77,270 55,760 8.33 8.27 0.06 0.00 0.00 0.00 8.33 149Hillsborough 892,874 760,450 129.50 63.75 65.75 4.94 15.67 0.00 118.77 156Holmes 17,385 5,360 1.18 1.18 0.00 0.00 0.00 0.00 1.18 220Indian River 100,261 61,886 11.16 11.16 0.00 0.00 0.00 5.98 11.16 180Jackson 46,577 16,270 2.31 2.31 0.00 0.00 0.00 0.00 2.31 142Jefferson 13,509 4,852 0.71 0.71 0.00 0.00 0.00 0.00 0.71 146Lafayette 6,516 1,225 0.18 0.18 0.00 0.00 0.00 0.00 0.18 147Lake 176,931 160,089 26.46 26.46 0.00 0.00 0.00 0.00 26.46 165Lee 376,702 317,708 40.73 37.64 3.09 0.00 0.00 19.77 40.73 128Leon 217,533 186,440 28.74 28.74 0.00 0.00 0.00 0.00 28.74 154Levy 29,843 9,700 1.85 1.85 0.00 0.00 0.00 0.00 1.85 191Liberty 6,873 2,679 0.32 0.32 0.00 0.00 0.00 0.00 0.32 119Madison 18,344 7,341 1.58 1.58 0.00 0.00 0.00 0.00 1.58 215Manatee 233,160 205,300 42.10 12.22 29.88 0.00 9.00 0.00 33.10 161Marion 224,612 107,610 20.27 20.13 0.14 0.00 0.00 0.00 20.27 188Martin 112,036 72,577 14.00 14.00 0.00 0.00 0.00 1.22 14.00 193Monroe 83,401 80,500 0.00 0.00 0.00 14.07 0.00 0.00 14.07 175Nassau 49,127 26,499 4.96 4.96 0.00 0.00 0.00 0.00 4.96 187Okaloosa 162,707 149,665 21.20 21.20 0.00 0.00 0.00 0.00 21.20 142Okeechobee 32,855 21,200 1.95 0.75 1.20 0.00 0.00 0.00 1.95 92Orange 758,962 695,162 165.02 165.02 0.00 0.00 23.97 0.00 141.05 203Osceola 136,627 100,855 19.15 19.15 0.00 0.00 0.00 0.00 19.15 190Palm Beach 962,802 881,737 186.88 154.63 32.25 0.00 0.00 6.75 186.88 212Pasco 305,576 223,605 93.93 93.93 0.00 0.00 67.79 0.00 26.14 117Pinellas 876,200 867,440 34.83 34.83 0.00 78.52 0.00 0.00 113.35 131Polk 443,153 386,054 58.42 58.15 0.27 0.00 0.00 0.00 58.42 151Putnam 69,516 21,118 3.59 3.59 0.00 0.00 0.00 0.00 3.59 170St. Johns 98,188 76,651 10.30 10.30 0.00 0.00 0.00 0.00 10.30 134St. Lucie 171,160 107,162 15.31 15.31 0.00 0.00 0.00 1.00 15.31 143Santa Rosa 96,091 91,030 12.08 12.08 0.00 0.00 0.00 0.00 12.08 133Sarasota 301,528 247,250 25.98 25.21 0.77 10.20 0.00 12.34 36.18 146Seminole 324,130 277,249 50.73 50.73 0.00 0.00 0.00 0.00 50.73 183Sumter 36,456 16,609 2.45 2.45 0.00 0.00 0.00 0.00 2.45 148Suwannee 30,534 9,276 1.42 1.42 0.00 0.00 0.00 0.00 1.42 153Taylor 18,322 10,127 1.93 1.93 0.00 0.00 0.00 0.00 1.93 191Union 12,647 4,000 0.38 0.38 0.00 0.00 0.00 0.00 0.38 95Volusia 402,970 352,682 48.78 48.78 0.00 0.00 0.00 0.00 48.78 138Wakulla 17,005 8,563 1.06 1.06 0.00 0.00 0.00 0.00 1.06 124Walton 33,415 29,138 4.35 4.35 0.00 0.00 0.00 0.00 4.35 149Washington 19,010 7,540 1.14 1.14 0.00 0.00 0.00 0.00 1.14 151State totals 14,149,317 12,213,389 2,065.27 1,855.57 209.70 138.19 138.19 57.93 2,065.27 169
14 Water Withdrawals, Use, Discharge, and Trends in Florida, 1995
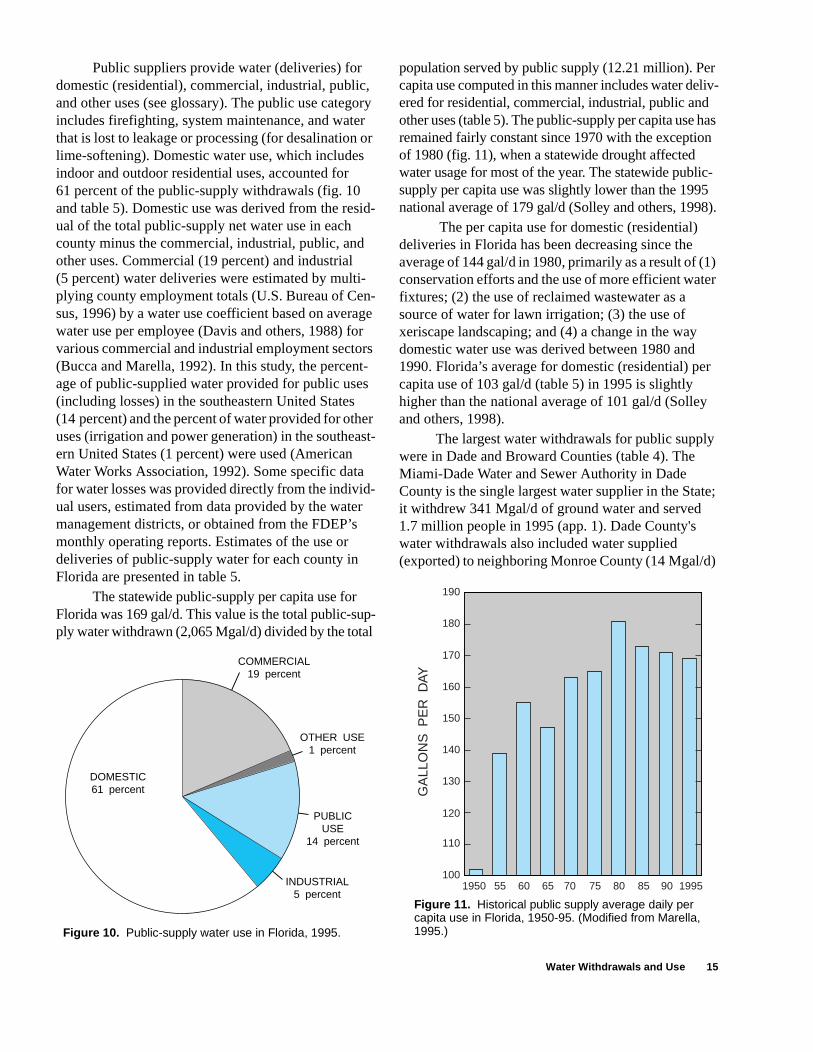
r liv-
has n
ic-5 8).
1) ter
r
y
te;
)
Public suppliers provide water (deliveries) for domestic (residential), commercial, industrial, public, and other uses (see glossary). The public use category includes firefighting, system maintenance, and water that is lost to leakage or processing (for desalination or lime-softening). Domestic water use, which includes indoor and outdoor residential uses, accounted for 61 percent of the public-supply withdrawals (fig. 10 and table 5). Domestic use was derived from the resid-ual of the total public-supply net water use in each county minus the commercial, industrial, public, and other uses. Commercial (19 percent) and industrial (5 percent) water deliveries were estimated by multi-plying county employment totals (U.S. Bureau of Cen-sus, 1996) by a water use coefficient based on average water use per employee (Davis and others, 1988) for various commercial and industrial employment sectors (Bucca and Marella, 1992). In this study, the percent-age of public-supplied water provided for public uses (including losses) in the southeastern United States (14 percent) and the percent of water provided for other uses (irrigation and power generation) in the southeast-ern United States (1 percent) were used (American Water Works Association, 1992). Some specific data for water losses was provided directly from the individ-ual users, estimated from data provided by the water management districts, or obtained from the FDEP’s monthly operating reports. Estimates of the use or deliveries of public-supply water for each county in Florida are presented in table 5.
The statewide public-supply per capita use for Florida was 169 gal/d. This value is the total public-sup-ply water withdrawn (2,065 Mgal/d) divided by the total
population served by public supply (12.21 million). Pecapita use computed in this manner includes water deered for residential, commercial, industrial, public andother uses (table 5). The public-supply per capita use remained fairly constant since 1970 with the exceptioof 1980 (fig. 11), when a statewide drought affected water usage for most of the year. The statewide publsupply per capita use was slightly lower than the 199national average of 179 gal/d (Solley and others, 199
The per capita use for domestic (residential) deliveries in Florida has been decreasing since the average of 144 gal/d in 1980, primarily as a result of (conservation efforts and the use of more efficient wafixtures; (2) the use of reclaimed wastewater as a source of water for lawn irrigation; (3) the use of xeriscape landscaping; and (4) a change in the waydomestic water use was derived between 1980 and1990. Florida’s average for domestic (residential) pecapita use of 103 gal/d (table 5) in 1995 is slightly higher than the national average of 101 gal/d (Solleand others, 1998).
The largest water withdrawals for public supplywere in Dade and Broward Counties (table 4). The Miami-Dade Water and Sewer Authority in Dade County is the single largest water supplier in the Stait withdrew 341 Mgal/d of ground water and served 1.7 million people in 1995 (app. 1). Dade County's water withdrawals also included water supplied (exported) to neighboring Monroe County (14 Mgal/d
INDUSTRIAL5 percent
PUBLICUSE
14 percent
COMMERCIAL19 percent
OTHER USE1 percent
DOMESTIC61 percent
Figure 10. Public-supply water use in Florida, 1995.
110
120
130
140
150
160
170
180
190
100
GA
LLO
NS
PE
R D
AY
60 65 70 75 80 851950 9055 1995
Figure 11. Historical public supply average daily per capita use in Florida, 1950-95. (Modified from Marella, 1995.)
Water Withdrawals and Use 15
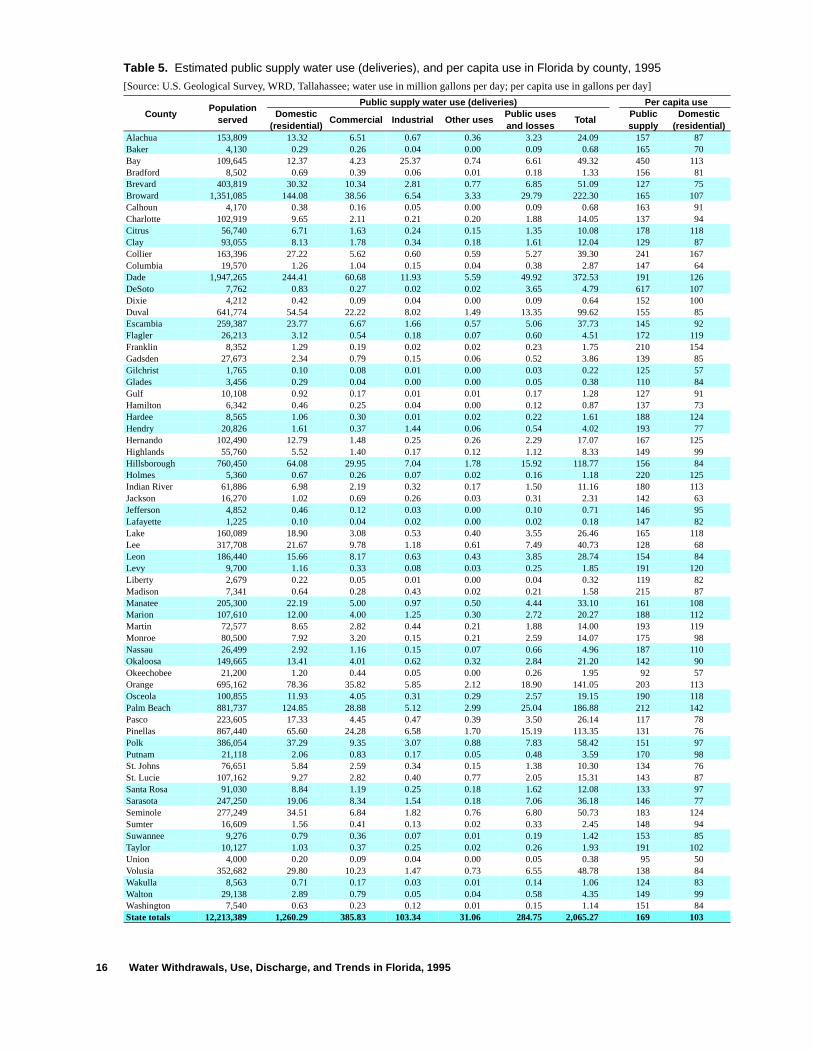
Table 5. Estimated public supply water use (deliveries), and per capita use in Florida by county, 1995
[Source: U.S. Geological Survey, WRD, Tallahassee; water use in million gallons per day; per capita use in gallons per day]
CountyPopulation
served
Public supply water use (deliveries) Per capita useDomestic
(residential)Commercial Industrial Other uses
Public usesand losses
TotalPublicsupply
Domestic(residential)
Alachua 153,809 13.32 6.51 0.67 0.36 3.23 24.09 157 87Baker 4,130 0.29 0.26 0.04 0.00 0.09 0.68 165 70Bay 109,645 12.37 4.23 25.37 0.74 6.61 49.32 450 113Bradford 8,502 0.69 0.39 0.06 0.01 0.18 1.33 156 81Brevard 403,819 30.32 10.34 2.81 0.77 6.85 51.09 127 75Broward 1,351,085 144.08 38.56 6.54 3.33 29.79 222.30 165 107Calhoun 4,170 0.38 0.16 0.05 0.00 0.09 0.68 163 91Charlotte 102,919 9.65 2.11 0.21 0.20 1.88 14.05 137 94Citrus 56,740 6.71 1.63 0.24 0.15 1.35 10.08 178 118Clay 93,055 8.13 1.78 0.34 0.18 1.61 12.04 129 87Collier 163,396 27.22 5.62 0.60 0.59 5.27 39.30 241 167Columbia 19,570 1.26 1.04 0.15 0.04 0.38 2.87 147 64Dade 1,947,265 244.41 60.68 11.93 5.59 49.92 372.53 191 126DeSoto 7,762 0.83 0.27 0.02 0.02 3.65 4.79 617 107Dixie 4,212 0.42 0.09 0.04 0.00 0.09 0.64 152 100Duval 641,774 54.54 22.22 8.02 1.49 13.35 99.62 155 85Escambia 259,387 23.77 6.67 1.66 0.57 5.06 37.73 145 92Flagler 26,213 3.12 0.54 0.18 0.07 0.60 4.51 172 119Franklin 8,352 1.29 0.19 0.02 0.02 0.23 1.75 210 154Gadsden 27,673 2.34 0.79 0.15 0.06 0.52 3.86 139 85Gilchrist 1,765 0.10 0.08 0.01 0.00 0.03 0.22 125 57Glades 3,456 0.29 0.04 0.00 0.00 0.05 0.38 110 84Gulf 10,108 0.92 0.17 0.01 0.01 0.17 1.28 127 91Hamilton 6,342 0.46 0.25 0.04 0.00 0.12 0.87 137 73Hardee 8,565 1.06 0.30 0.01 0.02 0.22 1.61 188 124Hendry 20,826 1.61 0.37 1.44 0.06 0.54 4.02 193 77Hernando 102,490 12.79 1.48 0.25 0.26 2.29 17.07 167 125Highlands 55,760 5.52 1.40 0.17 0.12 1.12 8.33 149 99Hillsborough 760,450 64.08 29.95 7.04 1.78 15.92 118.77 156 84Holmes 5,360 0.67 0.26 0.07 0.02 0.16 1.18 220 125Indian River 61,886 6.98 2.19 0.32 0.17 1.50 11.16 180 113Jackson 16,270 1.02 0.69 0.26 0.03 0.31 2.31 142 63Jefferson 4,852 0.46 0.12 0.03 0.00 0.10 0.71 146 95Lafayette 1,225 0.10 0.04 0.02 0.00 0.02 0.18 147 82Lake 160,089 18.90 3.08 0.53 0.40 3.55 26.46 165 118Lee 317,708 21.67 9.78 1.18 0.61 7.49 40.73 128 68Leon 186,440 15.66 8.17 0.63 0.43 3.85 28.74 154 84Levy 9,700 1.16 0.33 0.08 0.03 0.25 1.85 191 120Liberty 2,679 0.22 0.05 0.01 0.00 0.04 0.32 119 82Madison 7,341 0.64 0.28 0.43 0.02 0.21 1.58 215 87Manatee 205,300 22.19 5.00 0.97 0.50 4.44 33.10 161 108Marion 107,610 12.00 4.00 1.25 0.30 2.72 20.27 188 112Martin 72,577 8.65 2.82 0.44 0.21 1.88 14.00 193 119Monroe 80,500 7.92 3.20 0.15 0.21 2.59 14.07 175 98Nassau 26,499 2.92 1.16 0.15 0.07 0.66 4.96 187 110Okaloosa 149,665 13.41 4.01 0.62 0.32 2.84 21.20 142 90Okeechobee 21,200 1.20 0.44 0.05 0.00 0.26 1.95 92 57Orange 695,162 78.36 35.82 5.85 2.12 18.90 141.05 203 113Osceola 100,855 11.93 4.05 0.31 0.29 2.57 19.15 190 118Palm Beach 881,737 124.85 28.88 5.12 2.99 25.04 186.88 212 142Pasco 223,605 17.33 4.45 0.47 0.39 3.50 26.14 117 78Pinellas 867,440 65.60 24.28 6.58 1.70 15.19 113.35 131 76Polk 386,054 37.29 9.35 3.07 0.88 7.83 58.42 151 97Putnam 21,118 2.06 0.83 0.17 0.05 0.48 3.59 170 98St. Johns 76,651 5.84 2.59 0.34 0.15 1.38 10.30 134 76St. Lucie 107,162 9.27 2.82 0.40 0.77 2.05 15.31 143 87Santa Rosa 91,030 8.84 1.19 0.25 0.18 1.62 12.08 133 97Sarasota 247,250 19.06 8.34 1.54 0.18 7.06 36.18 146 77Seminole 277,249 34.51 6.84 1.82 0.76 6.80 50.73 183 124Sumter 16,609 1.56 0.41 0.13 0.02 0.33 2.45 148 94Suwannee 9,276 0.79 0.36 0.07 0.01 0.19 1.42 153 85Taylor 10,127 1.03 0.37 0.25 0.02 0.26 1.93 191 102Union 4,000 0.20 0.09 0.04 0.00 0.05 0.38 95 50Volusia 352,682 29.80 10.23 1.47 0.73 6.55 48.78 138 84Wakulla 8,563 0.71 0.17 0.03 0.01 0.14 1.06 124 83Walton 29,138 2.89 0.79 0.05 0.04 0.58 4.35 149 99Washington 7,540 0.63 0.23 0.12 0.01 0.15 1.14 151 84State totals 12,213,389 1,260.29 385.83 103.34 31.06 284.75 2,065.27 169 103
16 Water Withdrawals, Use, Discharge, and Trends in Florida, 1995
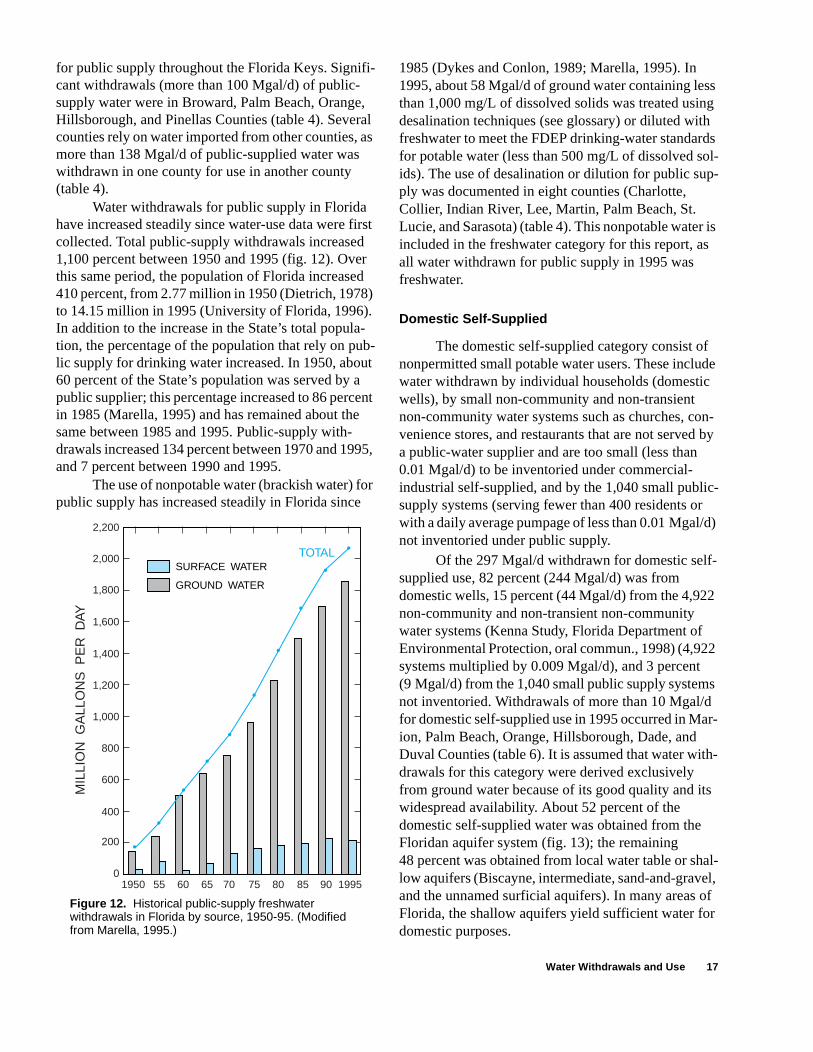
ss g
h ds ol-p-
r is s
f de
n- by
ic-r /d)
-
2
2
s r-
th-
ts
al-el, of r
for public supply throughout the Florida Keys. Signifi-cant withdrawals (more than 100 Mgal/d) of public-supply water were in Broward, Palm Beach, Orange, Hillsborough, and Pinellas Counties (table 4). Several counties rely on water imported from other counties, as more than 138 Mgal/d of public-supplied water was withdrawn in one county for use in another county (table 4).
Water withdrawals for public supply in Florida have increased steadily since water-use data were first collected. Total public-supply withdrawals increased 1,100 percent between 1950 and 1995 (fig. 12). Over this same period, the population of Florida increased 410 percent, from 2.77 million in 1950 (Dietrich, 1978) to 14.15 million in 1995 (University of Florida, 1996). In addition to the increase in the State’s total popula-tion, the percentage of the population that rely on pub-lic supply for drinking water increased. In 1950, about 60 percent of the State’s population was served by a public supplier; this percentage increased to 86 percent in 1985 (Marella, 1995) and has remained about the same between 1985 and 1995. Public-supply with-drawals increased 134 percent between 1970 and 1995, and 7 percent between 1990 and 1995.
The use of nonpotable water (brackish water) for public supply has increased steadily in Florida since
1985 (Dykes and Conlon, 1989; Marella, 1995). In 1995, about 58 Mgal/d of ground water containing lethan 1,000 mg/L of dissolved solids was treated usindesalination techniques (see glossary) or diluted witfreshwater to meet the FDEP drinking-water standarfor potable water (less than 500 mg/L of dissolved sids). The use of desalination or dilution for public suply was documented in eight counties (Charlotte, Collier, Indian River, Lee, Martin, Palm Beach, St. Lucie, and Sarasota) (table 4). This nonpotable wateincluded in the freshwater category for this report, aall water withdrawn for public supply in 1995 was freshwater.
Domestic Self-Supplied
The domestic self-supplied category consist ononpermitted small potable water users. These incluwater withdrawn by individual households (domesticwells), by small non-community and non-transient non-community water systems such as churches, covenience stores, and restaurants that are not serveda public-water supplier and are too small (less than 0.01 Mgal/d) to be inventoried under commercial-industrial self-supplied, and by the 1,040 small publsupply systems (serving fewer than 400 residents owith a daily average pumpage of less than 0.01 Mgalnot inventoried under public supply.
Of the 297 Mgal/d withdrawn for domestic selfsupplied use, 82 percent (244 Mgal/d) was from domestic wells, 15 percent (44 Mgal/d) from the 4,92non-community and non-transient non-community water systems (Kenna Study, Florida Department ofEnvironmental Protection, oral commun., 1998) (4,92systems multiplied by 0.009 Mgal/d), and 3 percent (9 Mgal/d) from the 1,040 small public supply systemnot inventoried. Withdrawals of more than 10 Mgal/dfor domestic self-supplied use in 1995 occurred in Maion, Palm Beach, Orange, Hillsborough, Dade, and Duval Counties (table 6). It is assumed that water widrawals for this category were derived exclusively from ground water because of its good quality and iwidespread availability. About 52 percent of the domestic self-supplied water was obtained from theFloridan aquifer system (fig. 13); the remaining 48 percent was obtained from local water table or shlow aquifers (Biscayne, intermediate, sand-and-gravand the unnamed surficial aquifers). In many areas Florida, the shallow aquifers yield sufficient water fodomestic purposes.
200
400
600
800
1,000
1,200
1,400
1,600
1,800
2,000
2,200
0
MIL
LIO
N G
ALL
ON
S P
ER
DAY
60 65 70 75 80 851950 9055 1995
TOTALSURFACE WATER
GROUND WATER
Figure 12. Historical public-supply freshwater withdrawals in Florida by source, 1950-95. (Modified from Marella, 1995.)
Water Withdrawals and Use 17
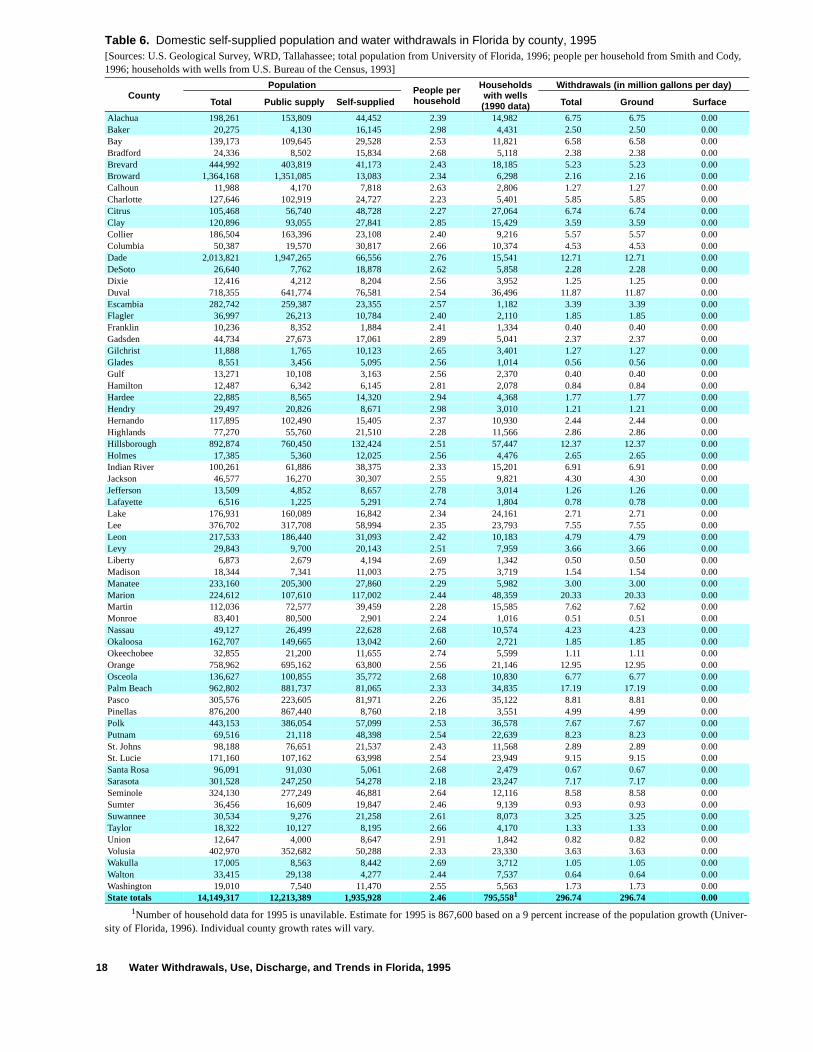
Table 6. Domestic self-supplied population and water withdrawals in Florida by county, 1995[Sources: U.S. Geological Survey, WRD, Tallahassee; total population from University of Florida, 1996; people per household from Smith and Cody, 1996; households with wells from U.S. Bureau of the Census, 1993]
CountyPopulation People per
household
Householdswith wells(1990 data)
Withdrawals (in million gallons per day)
Total Public supply Self-supplied Total Ground Surface
Alachua 198,261 153,809 44,452 2.39 14,982 6.75 6.75 0.00Baker 20,275 4,130 16,145 2.98 4,431 2.50 2.50 0.00Bay 139,173 109,645 29,528 2.53 11,821 6.58 6.58 0.00Bradford 24,336 8,502 15,834 2.68 5,118 2.38 2.38 0.00Brevard 444,992 403,819 41,173 2.43 18,185 5.23 5.23 0.00Broward 1,364,168 1,351,085 13,083 2.34 6,298 2.16 2.16 0.00Calhoun 11,988 4,170 7,818 2.63 2,806 1.27 1.27 0.00Charlotte 127,646 102,919 24,727 2.23 5,401 5.85 5.85 0.00Citrus 105,468 56,740 48,728 2.27 27,064 6.74 6.74 0.00Clay 120,896 93,055 27,841 2.85 15,429 3.59 3.59 0.00Collier 186,504 163,396 23,108 2.40 9,216 5.57 5.57 0.00Columbia 50,387 19,570 30,817 2.66 10,374 4.53 4.53 0.00Dade 2,013,821 1,947,265 66,556 2.76 15,541 12.71 12.71 0.00DeSoto 26,640 7,762 18,878 2.62 5,858 2.28 2.28 0.00Dixie 12,416 4,212 8,204 2.56 3,952 1.25 1.25 0.00Duval 718,355 641,774 76,581 2.54 36,496 11.87 11.87 0.00Escambia 282,742 259,387 23,355 2.57 1,182 3.39 3.39 0.00Flagler 36,997 26,213 10,784 2.40 2,110 1.85 1.85 0.00Franklin 10,236 8,352 1,884 2.41 1,334 0.40 0.40 0.00Gadsden 44,734 27,673 17,061 2.89 5,041 2.37 2.37 0.00Gilchrist 11,888 1,765 10,123 2.65 3,401 1.27 1.27 0.00Glades 8,551 3,456 5,095 2.56 1,014 0.56 0.56 0.00Gulf 13,271 10,108 3,163 2.56 2,370 0.40 0.40 0.00Hamilton 12,487 6,342 6,145 2.81 2,078 0.84 0.84 0.00Hardee 22,885 8,565 14,320 2.94 4,368 1.77 1.77 0.00Hendry 29,497 20,826 8,671 2.98 3,010 1.21 1.21 0.00Hernando 117,895 102,490 15,405 2.37 10,930 2.44 2.44 0.00Highlands 77,270 55,760 21,510 2.28 11,566 2.86 2.86 0.00Hillsborough 892,874 760,450 132,424 2.51 57,447 12.37 12.37 0.00Holmes 17,385 5,360 12,025 2.56 4,476 2.65 2.65 0.00Indian River 100,261 61,886 38,375 2.33 15,201 6.91 6.91 0.00Jackson 46,577 16,270 30,307 2.55 9,821 4.30 4.30 0.00Jefferson 13,509 4,852 8,657 2.78 3,014 1.26 1.26 0.00Lafayette 6,516 1,225 5,291 2.74 1,804 0.78 0.78 0.00Lake 176,931 160,089 16,842 2.34 24,161 2.71 2.71 0.00Lee 376,702 317,708 58,994 2.35 23,793 7.55 7.55 0.00Leon 217,533 186,440 31,093 2.42 10,183 4.79 4.79 0.00Levy 29,843 9,700 20,143 2.51 7,959 3.66 3.66 0.00Liberty 6,873 2,679 4,194 2.69 1,342 0.50 0.50 0.00Madison 18,344 7,341 11,003 2.75 3,719 1.54 1.54 0.00Manatee 233,160 205,300 27,860 2.29 5,982 3.00 3.00 0.00Marion 224,612 107,610 117,002 2.44 48,359 20.33 20.33 0.00Martin 112,036 72,577 39,459 2.28 15,585 7.62 7.62 0.00Monroe 83,401 80,500 2,901 2.24 1,016 0.51 0.51 0.00Nassau 49,127 26,499 22,628 2.68 10,574 4.23 4.23 0.00Okaloosa 162,707 149,665 13,042 2.60 2,721 1.85 1.85 0.00Okeechobee 32,855 21,200 11,655 2.74 5,599 1.11 1.11 0.00Orange 758,962 695,162 63,800 2.56 21,146 12.95 12.95 0.00Osceola 136,627 100,855 35,772 2.68 10,830 6.77 6.77 0.00Palm Beach 962,802 881,737 81,065 2.33 34,835 17.19 17.19 0.00Pasco 305,576 223,605 81,971 2.26 35,122 8.81 8.81 0.00Pinellas 876,200 867,440 8,760 2.18 3,551 4.99 4.99 0.00Polk 443,153 386,054 57,099 2.53 36,578 7.67 7.67 0.00Putnam 69,516 21,118 48,398 2.54 22,639 8.23 8.23 0.00St. Johns 98,188 76,651 21,537 2.43 11,568 2.89 2.89 0.00St. Lucie 171,160 107,162 63,998 2.54 23,949 9.15 9.15 0.00Santa Rosa 96,091 91,030 5,061 2.68 2,479 0.67 0.67 0.00Sarasota 301,528 247,250 54,278 2.18 23,247 7.17 7.17 0.00Seminole 324,130 277,249 46,881 2.64 12,116 8.58 8.58 0.00Sumter 36,456 16,609 19,847 2.46 9,139 0.93 0.93 0.00Suwannee 30,534 9,276 21,258 2.61 8,073 3.25 3.25 0.00Taylor 18,322 10,127 8,195 2.66 4,170 1.33 1.33 0.00Union 12,647 4,000 8,647 2.91 1,842 0.82 0.82 0.00Volusia 402,970 352,682 50,288 2.33 23,330 3.63 3.63 0.00Wakulla 17,005 8,563 8,442 2.69 3,712 1.05 1.05 0.00Walton 33,415 29,138 4,277 2.44 7,537 0.64 0.64 0.00Washington 19,010 7,540 11,470 2.55 5,563 1.73 1.73 0.00State totals 14,149,317 12,213,389 1,935,928 2.46 795,5581 296.74 296.74 0.00
1Number of household data for 1995 is unavilable. Estimate for 1995 is 867,600 based on a 9 percent increase of the population growth (Univer-sity of Florida, 1996). Individual county growth rates will vary.
18 Water Withdrawals, Use, Discharge, and Trends in Florida, 1995
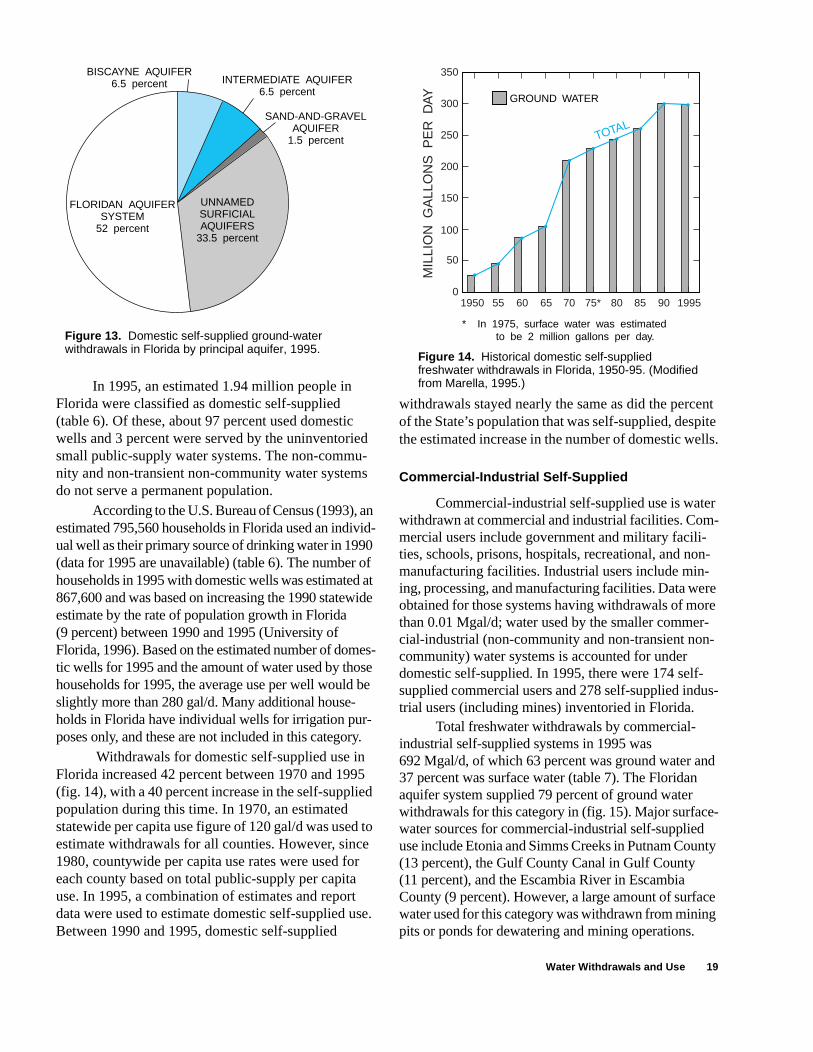
ite lls.
r -
n-
re re
r--
us-
d
- nty
ce g
In 1995, an estimated 1.94 million people in Florida were classified as domestic self-supplied (table 6). Of these, about 97 percent used domestic wells and 3 percent were served by the uninventoried small public-supply water systems. The non-commu-nity and non-transient non-community water systems do not serve a permanent population.
According to the U.S. Bureau of Census (1993), an estimated 795,560 households in Florida used an individ-ual well as their primary source of drinking water in 1990 (data for 1995 are unavailable) (table 6). The number of households in 1995 with domestic wells was estimated at 867,600 and was based on increasing the 1990 statewide estimate by the rate of population growth in Florida (9 percent) between 1990 and 1995 (University of Florida, 1996). Based on the estimated number of domes-tic wells for 1995 and the amount of water used by those households for 1995, the average use per well would be slightly more than 280 gal/d. Many additional house-holds in Florida have individual wells for irrigation pur-poses only, and these are not included in this category.
Withdrawals for domestic self-supplied use in Florida increased 42 percent between 1970 and 1995 (fig. 14), with a 40 percent increase in the self-supplied population during this time. In 1970, an estimated statewide per capita use figure of 120 gal/d was used to estimate withdrawals for all counties. However, since 1980, countywide per capita use rates were used for each county based on total public-supply per capita use. In 1995, a combination of estimates and report data were used to estimate domestic self-supplied use. Between 1990 and 1995, domestic self-supplied
withdrawals stayed nearly the same as did the percent of the State’s population that was self-supplied, despthe estimated increase in the number of domestic we
Commercial-Industrial Self-Supplied
Commercial-industrial self-supplied use is watewithdrawn at commercial and industrial facilities. Commercial users include government and military facili-ties, schools, prisons, hospitals, recreational, and nomanufacturing facilities. Industrial users include min-ing, processing, and manufacturing facilities. Data weobtained for those systems having withdrawals of mothan 0.01 Mgal/d; water used by the smaller commecial-industrial (non-community and non-transient noncommunity) water systems is accounted for under domestic self-supplied. In 1995, there were 174 self-supplied commercial users and 278 self-supplied indtrial users (including mines) inventoried in Florida.
Total freshwater withdrawals by commercial-industrial self-supplied systems in 1995 was 692 Mgal/d, of which 63 percent was ground water an37 percent was surface water (table 7). The Floridan aquifer system supplied 79 percent of ground water withdrawals for this category in (fig. 15). Major surfacewater sources for commercial-industrial self-supplieduse include Etonia and Simms Creeks in Putnam Cou(13 percent), the Gulf County Canal in Gulf County (11 percent), and the Escambia River in Escambia County (9 percent). However, a large amount of surfawater used for this category was withdrawn from mininpits or ponds for dewatering and mining operations.
FLORIDAN AQUIFERSYSTEM
52 percent
UNNAMEDSURFICIALAQUIFERS
33.5 percent
SAND-AND-GRAVELAQUIFER
1.5 percent
INTERMEDIATE AQUIFER6.5 percent
BISCAYNE AQUIFER6.5 percent
Figure 13. Domestic self-supplied ground-water withdrawals in Florida by principal aquifer, 1995.
50
100
150
200
250
300
350
0
MIL
LIO
N G
ALL
ON
S P
ER
DAY
TOTAL
60 65 70 75* 80 851950 9055 1995
GROUND WATER
* In 1975, surface water was estimated to be 2 million gallons per day.
Figure 14. Historical domestic self-supplied freshwater withdrawals in Florida, 1950-95. (Modified from Marella, 1995.)
Water Withdrawals and Use 19
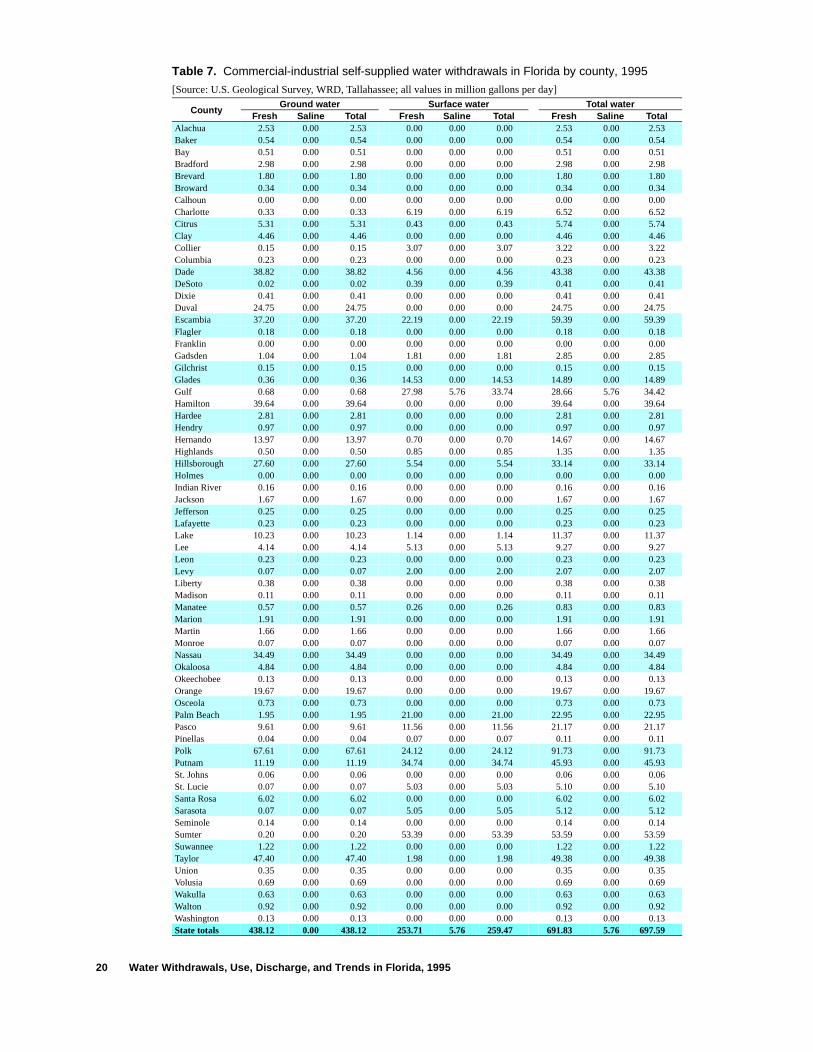
Table 7. Commercial-industrial self-supplied water withdrawals in Florida by county, 1995
[Source: U.S. Geological Survey, WRD, Tallahassee; all values in million gallons per day]
CountyGround water Surface water Total water
Fresh Saline Total Fresh Saline Total Fresh Saline TotalAlachua 2.53 0.00 2.53 0.00 0.00 0.00 2.53 0.00 2.53Baker 0.54 0.00 0.54 0.00 0.00 0.00 0.54 0.00 0.54Bay 0.51 0.00 0.51 0.00 0.00 0.00 0.51 0.00 0.51Bradford 2.98 0.00 2.98 0.00 0.00 0.00 2.98 0.00 2.98Brevard 1.80 0.00 1.80 0.00 0.00 0.00 1.80 0.00 1.80Broward 0.34 0.00 0.34 0.00 0.00 0.00 0.34 0.00 0.34Calhoun 0.00 0.00 0.00 0.00 0.00 0.00 0.00 0.00 0.00Charlotte 0.33 0.00 0.33 6.19 0.00 6.19 6.52 0.00 6.52Citrus 5.31 0.00 5.31 0.43 0.00 0.43 5.74 0.00 5.74Clay 4.46 0.00 4.46 0.00 0.00 0.00 4.46 0.00 4.46Collier 0.15 0.00 0.15 3.07 0.00 3.07 3.22 0.00 3.22Columbia 0.23 0.00 0.23 0.00 0.00 0.00 0.23 0.00 0.23Dade 38.82 0.00 38.82 4.56 0.00 4.56 43.38 0.00 43.38DeSoto 0.02 0.00 0.02 0.39 0.00 0.39 0.41 0.00 0.41Dixie 0.41 0.00 0.41 0.00 0.00 0.00 0.41 0.00 0.41Duval 24.75 0.00 24.75 0.00 0.00 0.00 24.75 0.00 24.75Escambia 37.20 0.00 37.20 22.19 0.00 22.19 59.39 0.00 59.39Flagler 0.18 0.00 0.18 0.00 0.00 0.00 0.18 0.00 0.18Franklin 0.00 0.00 0.00 0.00 0.00 0.00 0.00 0.00 0.00Gadsden 1.04 0.00 1.04 1.81 0.00 1.81 2.85 0.00 2.85Gilchrist 0.15 0.00 0.15 0.00 0.00 0.00 0.15 0.00 0.15Glades 0.36 0.00 0.36 14.53 0.00 14.53 14.89 0.00 14.89Gulf 0.68 0.00 0.68 27.98 5.76 33.74 28.66 5.76 34.42Hamilton 39.64 0.00 39.64 0.00 0.00 0.00 39.64 0.00 39.64Hardee 2.81 0.00 2.81 0.00 0.00 0.00 2.81 0.00 2.81Hendry 0.97 0.00 0.97 0.00 0.00 0.00 0.97 0.00 0.97Hernando 13.97 0.00 13.97 0.70 0.00 0.70 14.67 0.00 14.67Highlands 0.50 0.00 0.50 0.85 0.00 0.85 1.35 0.00 1.35Hillsborough 27.60 0.00 27.60 5.54 0.00 5.54 33.14 0.00 33.14Holmes 0.00 0.00 0.00 0.00 0.00 0.00 0.00 0.00 0.00Indian River 0.16 0.00 0.16 0.00 0.00 0.00 0.16 0.00 0.16Jackson 1.67 0.00 1.67 0.00 0.00 0.00 1.67 0.00 1.67Jefferson 0.25 0.00 0.25 0.00 0.00 0.00 0.25 0.00 0.25Lafayette 0.23 0.00 0.23 0.00 0.00 0.00 0.23 0.00 0.23Lake 10.23 0.00 10.23 1.14 0.00 1.14 11.37 0.00 11.37Lee 4.14 0.00 4.14 5.13 0.00 5.13 9.27 0.00 9.27Leon 0.23 0.00 0.23 0.00 0.00 0.00 0.23 0.00 0.23Levy 0.07 0.00 0.07 2.00 0.00 2.00 2.07 0.00 2.07Liberty 0.38 0.00 0.38 0.00 0.00 0.00 0.38 0.00 0.38Madison 0.11 0.00 0.11 0.00 0.00 0.00 0.11 0.00 0.11Manatee 0.57 0.00 0.57 0.26 0.00 0.26 0.83 0.00 0.83Marion 1.91 0.00 1.91 0.00 0.00 0.00 1.91 0.00 1.91Martin 1.66 0.00 1.66 0.00 0.00 0.00 1.66 0.00 1.66Monroe 0.07 0.00 0.07 0.00 0.00 0.00 0.07 0.00 0.07Nassau 34.49 0.00 34.49 0.00 0.00 0.00 34.49 0.00 34.49Okaloosa 4.84 0.00 4.84 0.00 0.00 0.00 4.84 0.00 4.84Okeechobee 0.13 0.00 0.13 0.00 0.00 0.00 0.13 0.00 0.13Orange 19.67 0.00 19.67 0.00 0.00 0.00 19.67 0.00 19.67Osceola 0.73 0.00 0.73 0.00 0.00 0.00 0.73 0.00 0.73Palm Beach 1.95 0.00 1.95 21.00 0.00 21.00 22.95 0.00 22.95Pasco 9.61 0.00 9.61 11.56 0.00 11.56 21.17 0.00 21.17Pinellas 0.04 0.00 0.04 0.07 0.00 0.07 0.11 0.00 0.11Polk 67.61 0.00 67.61 24.12 0.00 24.12 91.73 0.00 91.73Putnam 11.19 0.00 11.19 34.74 0.00 34.74 45.93 0.00 45.93St. Johns 0.06 0.00 0.06 0.00 0.00 0.00 0.06 0.00 0.06St. Lucie 0.07 0.00 0.07 5.03 0.00 5.03 5.10 0.00 5.10Santa Rosa 6.02 0.00 6.02 0.00 0.00 0.00 6.02 0.00 6.02Sarasota 0.07 0.00 0.07 5.05 0.00 5.05 5.12 0.00 5.12Seminole 0.14 0.00 0.14 0.00 0.00 0.00 0.14 0.00 0.14Sumter 0.20 0.00 0.20 53.39 0.00 53.39 53.59 0.00 53.59Suwannee 1.22 0.00 1.22 0.00 0.00 0.00 1.22 0.00 1.22Taylor 47.40 0.00 47.40 1.98 0.00 1.98 49.38 0.00 49.38Union 0.35 0.00 0.35 0.00 0.00 0.00 0.35 0.00 0.35Volusia 0.69 0.00 0.69 0.00 0.00 0.00 0.69 0.00 0.69Wakulla 0.63 0.00 0.63 0.00 0.00 0.00 0.63 0.00 0.63Walton 0.92 0.00 0.92 0.00 0.00 0.00 0.92 0.00 0.92Washington 0.13 0.00 0.13 0.00 0.00 0.00 0.13 0.00 0.13State totals 438.12 0.00 438.12 253.71 5.76 259.47 691.83 5.76 697.59
20 Water Withdrawals, Use, Discharge, and Trends in Florida, 1995
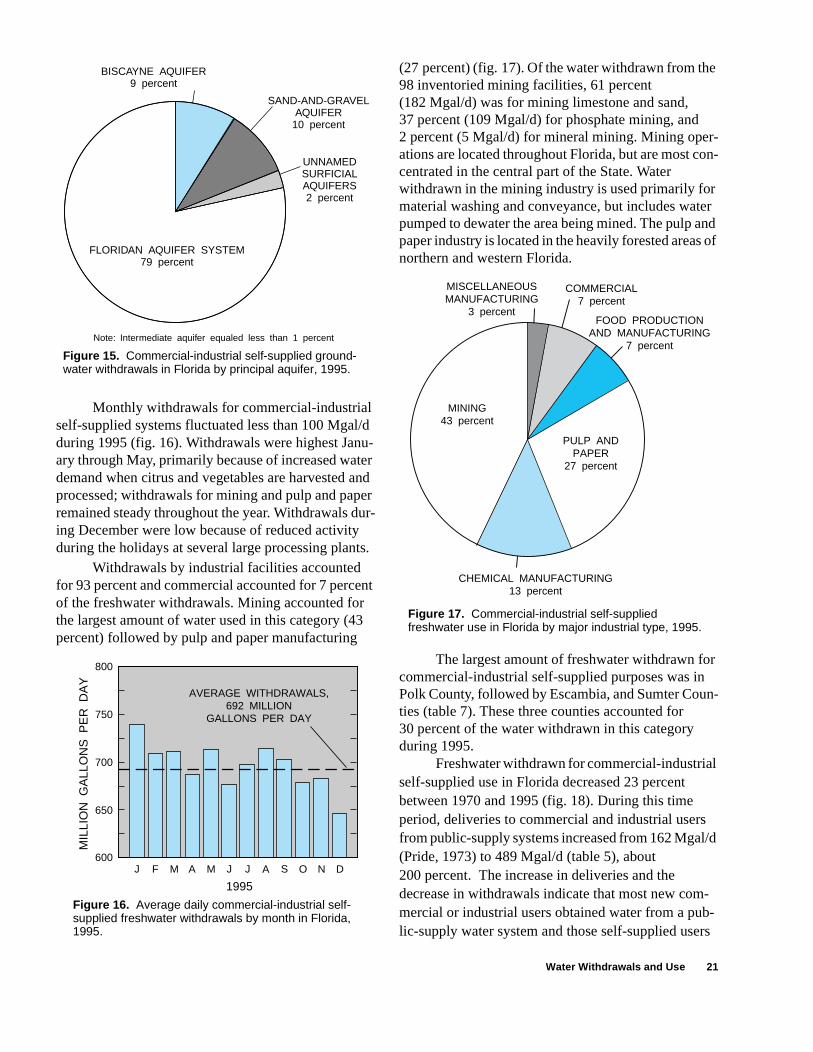
Monthly withdrawals for commercial-industrial self-supplied systems fluctuated less than 100 Mgal/d during 1995 (fig. 16). Withdrawals were highest Janu-ary through May, primarily because of increased water demand when citrus and vegetables are harvested and processed; withdrawals for mining and pulp and paper remained steady throughout the year. Withdrawals dur-ing December were low because of reduced activity during the holidays at several large processing plants.
Withdrawals by industrial facilities accounted for 93 percent and commercial accounted for 7 percent of the freshwater withdrawals. Mining accounted for the largest amount of water used in this category (43 percent) followed by pulp and paper manufacturing
(27 percent) (fig. 17). Of the water withdrawn from the 98 inventoried mining facilities, 61 percent (182 Mgal/d) was for mining limestone and sand, 37 percent (109 Mgal/d) for phosphate mining, and 2 percent (5 Mgal/d) for mineral mining. Mining oper-ations are located throughout Florida, but are most con-centrated in the central part of the State. Water withdrawn in the mining industry is used primarily for material washing and conveyance, but includes water pumped to dewater the area being mined. The pulp and paper industry is located in the heavily forested areas of northern and western Florida.
The largest amount of freshwater withdrawn for commercial-industrial self-supplied purposes was in Polk County, followed by Escambia, and Sumter Coun-ties (table 7). These three counties accounted for 30 percent of the water withdrawn in this category during 1995.
Freshwater withdrawn for commercial-industrial self-supplied use in Florida decreased 23 percent between 1970 and 1995 (fig. 18). During this time period, deliveries to commercial and industrial users from public-supply systems increased from 162 Mgal/d (Pride, 1973) to 489 Mgal/d (table 5), about 200 percent. The increase in deliveries and the decrease in withdrawals indicate that most new com-mercial or industrial users obtained water from a pub-lic-supply water system and those self-supplied users
FLORIDAN AQUIFER SYSTEM79 percent
UNNAMEDSURFICIALAQUIFERS2 percent
SAND-AND-GRAVELAQUIFER
10 percent
BISCAYNE AQUIFER9 percent
Note: Intermediate aquifer equaled less than 1 percent
Figure 15. Commercial-industrial self-supplied ground-water withdrawals in Florida by principal aquifer, 1995.
J F M A M J J A S O N D
650
700
750
800
600
MIL
LIO
N G
ALL
ON
S P
ER
DA
Y
AVERAGE WITHDRAWALS,692 MILLION
GALLONS PER DAY
1995
Figure 16. Average daily commercial-industrial self-supplied freshwater withdrawals by month in Florida, 1995.
MINING43 percent
MISCELLANEOUSMANUFACTURING
3 percent
COMMERCIAL7 percent
FOOD PRODUCTIONAND MANUFACTURING
7 percent
PULP ANDPAPER
27 percent
CHEMICAL MANUFACTURING13 percent
Figure 17. Commercial-industrial self-supplied freshwater use in Florida by major industrial type, 1995.
Water Withdrawals and Use 21
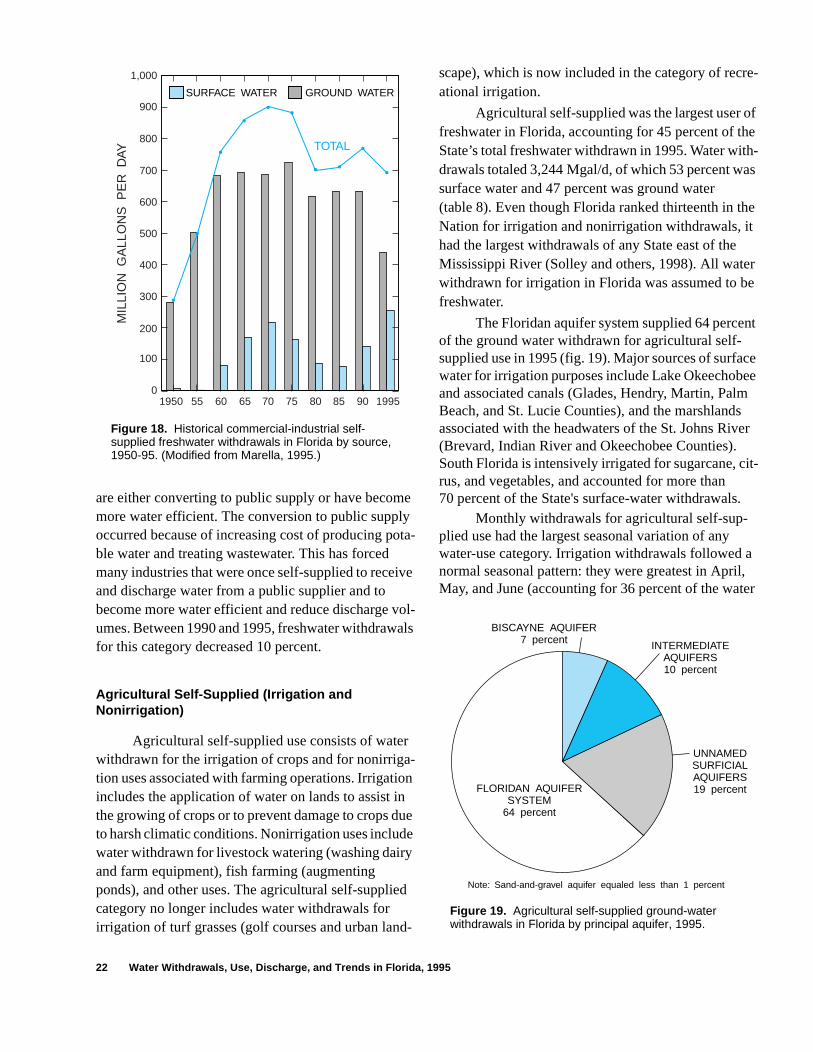
h-s
e r e
nt
ce ee m er
it-
, ter
are either converting to public supply or have become more water efficient. The conversion to public supply occurred because of increasing cost of producing pota-ble water and treating wastewater. This has forced many industries that were once self-supplied to receive and discharge water from a public supplier and to become more water efficient and reduce discharge vol-umes. Between 1990 and 1995, freshwater withdrawals for this category decreased 10 percent.
Agricultural Self-Supplied (Irrigation and Nonirrigation)
Agricultural self-supplied use consists of water withdrawn for the irrigation of crops and for nonirriga-tion uses associated with farming operations. Irrigation includes the application of water on lands to assist in the growing of crops or to prevent damage to crops due to harsh climatic conditions. Nonirrigation uses include water withdrawn for livestock watering (washing dairy and farm equipment), fish farming (augmenting ponds), and other uses. The agricultural self-supplied category no longer includes water withdrawals for irrigation of turf grasses (golf courses and urban land-
scape), which is now included in the category of recre-ational irrigation.
Agricultural self-supplied was the largest user of freshwater in Florida, accounting for 45 percent of the State’s total freshwater withdrawn in 1995. Water witdrawals totaled 3,244 Mgal/d, of which 53 percent wasurface water and 47 percent was ground water (table 8). Even though Florida ranked thirteenth in thNation for irrigation and nonirrigation withdrawals, ithad the largest withdrawals of any State east of theMississippi River (Solley and others, 1998). All watewithdrawn for irrigation in Florida was assumed to bfreshwater.
The Floridan aquifer system supplied 64 perceof the ground water withdrawn for agricultural self-supplied use in 1995 (fig. 19). Major sources of surfawater for irrigation purposes include Lake Okeechoband associated canals (Glades, Hendry, Martin, PalBeach, and St. Lucie Counties), and the marshlandsassociated with the headwaters of the St. Johns Riv(Brevard, Indian River and Okeechobee Counties). South Florida is intensively irrigated for sugarcane, crus, and vegetables, and accounted for more than 70 percent of the State's surface-water withdrawals.
Monthly withdrawals for agricultural self-sup-plied use had the largest seasonal variation of any water-use category. Irrigation withdrawals followed anormal seasonal pattern: they were greatest in AprilMay, and June (accounting for 36 percent of the wa
100
200
300
400
500
600
700
800
900
1,000
060 65 70 75 80 851950 9055 1995
TOTAL
SURFACE WATER GROUND WATER
MIL
LIO
N G
ALL
ON
S P
ER
DAY
Figure 18. Historical commercial-industrial self-supplied freshwater withdrawals in Florida by source, 1950-95. (Modified from Marella, 1995.)
UNNAMEDSURFICIALAQUIFERS19 percent
INTERMEDIATEAQUIFERS10 percent
BISCAYNE AQUIFER7 percent
Note: Sand-and-gravel aquifer equaled less than 1 percent
FLORIDAN AQUIFERSYSTEM
64 percent
Figure 19. Agricultural self-supplied ground-water withdrawals in Florida by principal aquifer, 1995.
22 Water Withdrawals, Use, Discharge, and Trends in Florida, 1995
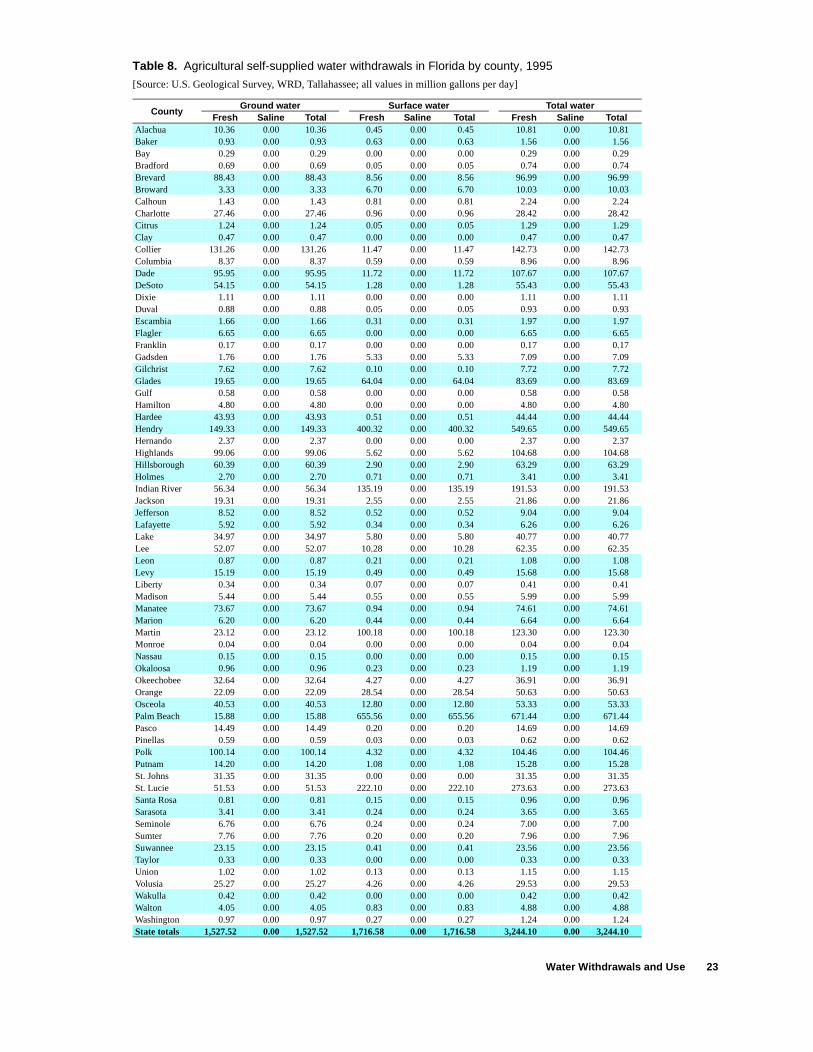
Table 8. Agricultural self-supplied water withdrawals in Florida by county, 1995
[Source: U.S. Geological Survey, WRD, Tallahassee; all values in million gallons per day]
CountyGround water Surface water Total water
Fresh Saline Total Fresh Saline Total Fresh Saline TotalAlachua 10.36 0.00 10.36 0.45 0.00 0.45 10.81 0.00 10.81Baker 0.93 0.00 0.93 0.63 0.00 0.63 1.56 0.00 1.56Bay 0.29 0.00 0.29 0.00 0.00 0.00 0.29 0.00 0.29Bradford 0.69 0.00 0.69 0.05 0.00 0.05 0.74 0.00 0.74Brevard 88.43 0.00 88.43 8.56 0.00 8.56 96.99 0.00 96.99Broward 3.33 0.00 3.33 6.70 0.00 6.70 10.03 0.00 10.03Calhoun 1.43 0.00 1.43 0.81 0.00 0.81 2.24 0.00 2.24Charlotte 27.46 0.00 27.46 0.96 0.00 0.96 28.42 0.00 28.42Citrus 1.24 0.00 1.24 0.05 0.00 0.05 1.29 0.00 1.29Clay 0.47 0.00 0.47 0.00 0.00 0.00 0.47 0.00 0.47Collier 131.26 0.00 131.26 11.47 0.00 11.47 142.73 0.00 142.73Columbia 8.37 0.00 8.37 0.59 0.00 0.59 8.96 0.00 8.96Dade 95.95 0.00 95.95 11.72 0.00 11.72 107.67 0.00 107.67DeSoto 54.15 0.00 54.15 1.28 0.00 1.28 55.43 0.00 55.43Dixie 1.11 0.00 1.11 0.00 0.00 0.00 1.11 0.00 1.11Duval 0.88 0.00 0.88 0.05 0.00 0.05 0.93 0.00 0.93Escambia 1.66 0.00 1.66 0.31 0.00 0.31 1.97 0.00 1.97Flagler 6.65 0.00 6.65 0.00 0.00 0.00 6.65 0.00 6.65Franklin 0.17 0.00 0.17 0.00 0.00 0.00 0.17 0.00 0.17Gadsden 1.76 0.00 1.76 5.33 0.00 5.33 7.09 0.00 7.09Gilchrist 7.62 0.00 7.62 0.10 0.00 0.10 7.72 0.00 7.72Glades 19.65 0.00 19.65 64.04 0.00 64.04 83.69 0.00 83.69Gulf 0.58 0.00 0.58 0.00 0.00 0.00 0.58 0.00 0.58Hamilton 4.80 0.00 4.80 0.00 0.00 0.00 4.80 0.00 4.80Hardee 43.93 0.00 43.93 0.51 0.00 0.51 44.44 0.00 44.44Hendry 149.33 0.00 149.33 400.32 0.00 400.32 549.65 0.00 549.65Hernando 2.37 0.00 2.37 0.00 0.00 0.00 2.37 0.00 2.37Highlands 99.06 0.00 99.06 5.62 0.00 5.62 104.68 0.00 104.68Hillsborough 60.39 0.00 60.39 2.90 0.00 2.90 63.29 0.00 63.29Holmes 2.70 0.00 2.70 0.71 0.00 0.71 3.41 0.00 3.41Indian River 56.34 0.00 56.34 135.19 0.00 135.19 191.53 0.00 191.53Jackson 19.31 0.00 19.31 2.55 0.00 2.55 21.86 0.00 21.86Jefferson 8.52 0.00 8.52 0.52 0.00 0.52 9.04 0.00 9.04Lafayette 5.92 0.00 5.92 0.34 0.00 0.34 6.26 0.00 6.26Lake 34.97 0.00 34.97 5.80 0.00 5.80 40.77 0.00 40.77Lee 52.07 0.00 52.07 10.28 0.00 10.28 62.35 0.00 62.35Leon 0.87 0.00 0.87 0.21 0.00 0.21 1.08 0.00 1.08Levy 15.19 0.00 15.19 0.49 0.00 0.49 15.68 0.00 15.68Liberty 0.34 0.00 0.34 0.07 0.00 0.07 0.41 0.00 0.41Madison 5.44 0.00 5.44 0.55 0.00 0.55 5.99 0.00 5.99Manatee 73.67 0.00 73.67 0.94 0.00 0.94 74.61 0.00 74.61Marion 6.20 0.00 6.20 0.44 0.00 0.44 6.64 0.00 6.64Martin 23.12 0.00 23.12 100.18 0.00 100.18 123.30 0.00 123.30Monroe 0.04 0.00 0.04 0.00 0.00 0.00 0.04 0.00 0.04Nassau 0.15 0.00 0.15 0.00 0.00 0.00 0.15 0.00 0.15Okaloosa 0.96 0.00 0.96 0.23 0.00 0.23 1.19 0.00 1.19Okeechobee 32.64 0.00 32.64 4.27 0.00 4.27 36.91 0.00 36.91Orange 22.09 0.00 22.09 28.54 0.00 28.54 50.63 0.00 50.63Osceola 40.53 0.00 40.53 12.80 0.00 12.80 53.33 0.00 53.33Palm Beach 15.88 0.00 15.88 655.56 0.00 655.56 671.44 0.00 671.44Pasco 14.49 0.00 14.49 0.20 0.00 0.20 14.69 0.00 14.69Pinellas 0.59 0.00 0.59 0.03 0.00 0.03 0.62 0.00 0.62Polk 100.14 0.00 100.14 4.32 0.00 4.32 104.46 0.00 104.46Putnam 14.20 0.00 14.20 1.08 0.00 1.08 15.28 0.00 15.28St. Johns 31.35 0.00 31.35 0.00 0.00 0.00 31.35 0.00 31.35St. Lucie 51.53 0.00 51.53 222.10 0.00 222.10 273.63 0.00 273.63Santa Rosa 0.81 0.00 0.81 0.15 0.00 0.15 0.96 0.00 0.96Sarasota 3.41 0.00 3.41 0.24 0.00 0.24 3.65 0.00 3.65Seminole 6.76 0.00 6.76 0.24 0.00 0.24 7.00 0.00 7.00Sumter 7.76 0.00 7.76 0.20 0.00 0.20 7.96 0.00 7.96Suwannee 23.15 0.00 23.15 0.41 0.00 0.41 23.56 0.00 23.56Taylor 0.33 0.00 0.33 0.00 0.00 0.00 0.33 0.00 0.33Union 1.02 0.00 1.02 0.13 0.00 0.13 1.15 0.00 1.15Volusia 25.27 0.00 25.27 4.26 0.00 4.26 29.53 0.00 29.53Wakulla 0.42 0.00 0.42 0.00 0.00 0.00 0.42 0.00 0.42Walton 4.05 0.00 4.05 0.83 0.00 0.83 4.88 0.00 4.88Washington 0.97 0.00 0.97 0.27 0.00 0.27 1.24 0.00 1.24State totals 1,527.52 0.00 1,527.52 1,716.58 0.00 1,716.58 3,244.10 0.00 3,244.10
Water Withdrawals and Use 23
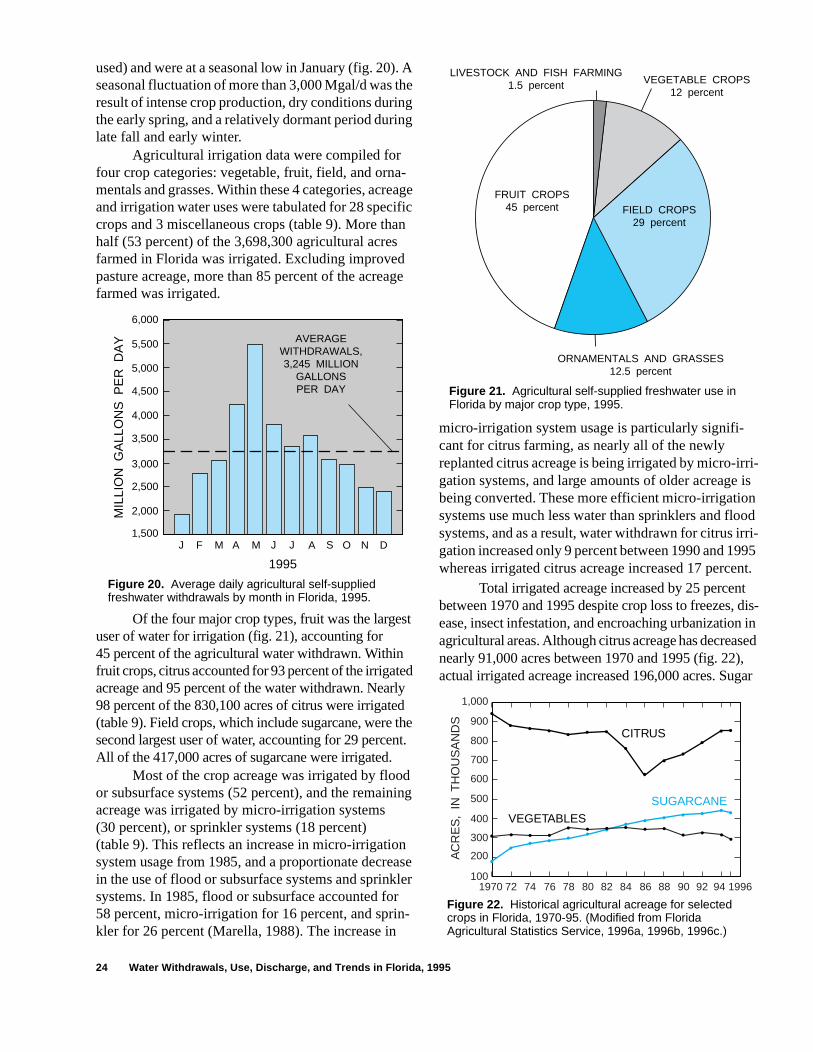
used) and were at a seasonal low in January (fig. 20). A seasonal fluctuation of more than 3,000 Mgal/d was the result of intense crop production, dry conditions during the early spring, and a relatively dormant period during late fall and early winter.
Agricultural irrigation data were compiled for four crop categories: vegetable, fruit, field, and orna-mentals and grasses. Within these 4 categories, acreage and irrigation water uses were tabulated for 28 specific crops and 3 miscellaneous crops (table 9). More than half (53 percent) of the 3,698,300 agricultural acres farmed in Florida was irrigated. Excluding improved pasture acreage, more than 85 percent of the acreage farmed was irrigated.
Of the four major crop types, fruit was the largest user of water for irrigation (fig. 21), accounting for 45 percent of the agricultural water withdrawn. Within fruit crops, citrus accounted for 93 percent of the irrigated acreage and 95 percent of the water withdrawn. Nearly 98 percent of the 830,100 acres of citrus were irrigated (table 9). Field crops, which include sugarcane, were the second largest user of water, accounting for 29 percent. All of the 417,000 acres of sugarcane were irrigated.
Most of the crop acreage was irrigated by flood or subsurface systems (52 percent), and the remaining acreage was irrigated by micro-irrigation systems (30 percent), or sprinkler systems (18 percent) (table 9). This reflects an increase in micro-irrigation system usage from 1985, and a proportionate decrease in the use of flood or subsurface systems and sprinkler systems. In 1985, flood or subsurface accounted for 58 percent, micro-irrigation for 16 percent, and sprin-kler for 26 percent (Marella, 1988). The increase in
micro-irrigation system usage is particularly signifi-cant for citrus farming, as nearly all of the newly replanted citrus acreage is being irrigated by micro-irri-gation systems, and large amounts of older acreage is being converted. These more efficient micro-irrigation systems use much less water than sprinklers and flood systems, and as a result, water withdrawn for citrus irri-gation increased only 9 percent between 1990 and 1995 whereas irrigated citrus acreage increased 17 percent.
Total irrigated acreage increased by 25 percent between 1970 and 1995 despite crop loss to freezes, dis-ease, insect infestation, and encroaching urbanization in agricultural areas. Although citrus acreage has decreased nearly 91,000 acres between 1970 and 1995 (fig. 22), actual irrigated acreage increased 196,000 acres. Sugar
6,000
5,500
5,000
4,500
4,000
3,500
3,000
2,500
1,500
2,000
1995
J F M A M J J A S O N D
AVERAGEWITHDRAWALS,3,245 MILLION
GALLONSPER DAY
MIL
LIO
N G
ALL
ON
S P
ER
DA
Y
Figure 20. Average daily agricultural self-supplied freshwater withdrawals by month in Florida, 1995.
ORNAMENTALS AND GRASSES12.5 percent
LIVESTOCK AND FISH FARMING1.5 percent
FRUIT CROPS45 percent
VEGETABLE CROPS12 percent
FIELD CROPS29 percent
Figure 21. Agricultural self-supplied freshwater use in Florida by major crop type, 1995.
500
600
700
800
900
1,000
400
300
200
100
AC
RE
S,
IN T
HO
US
AN
DS
1970 72 74 76 78 80 82 84 86 88 90 92 94 1996
CITRUS
VEGETABLES
SUGARCANE
Figure 22. Historical agricultural acreage for selected crops in Florida, 1970-95. (Modified from Florida Agricultural Statistics Service, 1996a, 1996b, 1996c.)
24 Water Withdrawals, Use, Discharge, and Trends in Florida, 1995
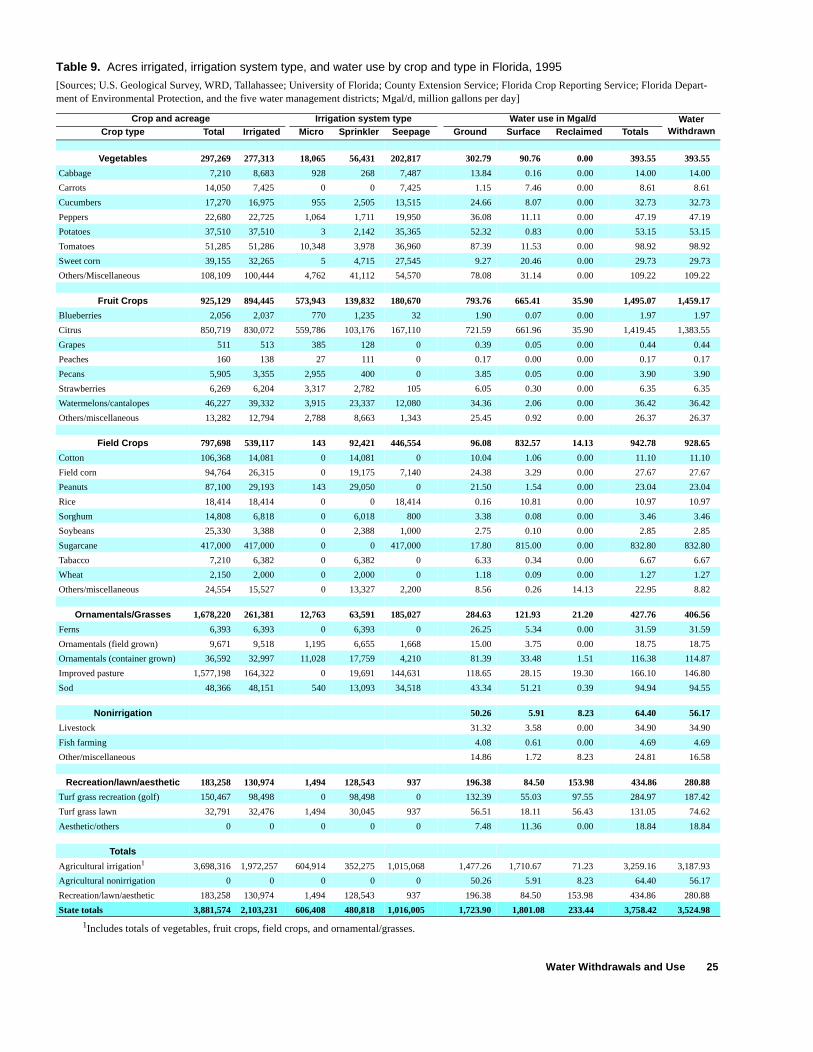
Table 9. Acres irrigated, irrigation system type, and water use by crop and type in Florida, 1995
[Sources; U.S. Geological Survey, WRD, Tallahassee; University of Florida; County Extension Service; Florida Crop Reporting Service; Florida Depart-ment of Environmental Protection, and the five water management districts; Mgal/d, million gallons per day]
Crop and acreage Irrigation system type Water use in Mgal/d WaterWithdrawnCrop type Total Irrigated Micro Sprinkler Seepage Ground Surface Reclaimed Totals
Vegetables 297,269 277,313 18,065 56,431 202,817 302.79 90.76 0.00 393.55 393.55
Cabbage 7,210 8,683 928 268 7,487 13.84 0.16 0.00 14.00 14.00
Carrots 14,050 7,425 0 0 7,425 1.15 7.46 0.00 8.61 8.61
Cucumbers 17,270 16,975 955 2,505 13,515 24.66 8.07 0.00 32.73 32.73
Peppers 22,680 22,725 1,064 1,711 19,950 36.08 11.11 0.00 47.19 47.19
Potatoes 37,510 37,510 3 2,142 35,365 52.32 0.83 0.00 53.15 53.15
Tomatoes 51,285 51,286 10,348 3,978 36,960 87.39 11.53 0.00 98.92 98.92
Sweet corn 39,155 32,265 5 4,715 27,545 9.27 20.46 0.00 29.73 29.73
Others/Miscellaneous 108,109 100,444 4,762 41,112 54,570 78.08 31.14 0.00 109.22 109.22
Fruit Crops 925,129 894,445 573,943 139,832 180,670 793.76 665.41 35.90 1,495.07 1,459.17
Blueberries 2,056 2,037 770 1,235 32 1.90 0.07 0.00 1.97 1.97
Citrus 850,719 830,072 559,786 103,176 167,110 721.59 661.96 35.90 1,419.45 1,383.55
Grapes 511 513 385 128 0 0.39 0.05 0.00 0.44 0.44
Peaches 160 138 27 111 0 0.17 0.00 0.00 0.17 0.17
Pecans 5,905 3,355 2,955 400 0 3.85 0.05 0.00 3.90 3.90
Strawberries 6,269 6,204 3,317 2,782 105 6.05 0.30 0.00 6.35 6.35
Watermelons/cantalopes 46,227 39,332 3,915 23,337 12,080 34.36 2.06 0.00 36.42 36.42
Others/miscellaneous 13,282 12,794 2,788 8,663 1,343 25.45 0.92 0.00 26.37 26.37
Field Crops 797,698 539,117 143 92,421 446,554 96.08 832.57 14.13 942.78 928.65
Cotton 106,368 14,081 0 14,081 0 10.04 1.06 0.00 11.10 11.10
Field corn 94,764 26,315 0 19,175 7,140 24.38 3.29 0.00 27.67 27.67
Peanuts 87,100 29,193 143 29,050 0 21.50 1.54 0.00 23.04 23.04
Rice 18,414 18,414 0 0 18,414 0.16 10.81 0.00 10.97 10.97
Sorghum 14,808 6,818 0 6,018 800 3.38 0.08 0.00 3.46 3.46
Soybeans 25,330 3,388 0 2,388 1,000 2.75 0.10 0.00 2.85 2.85
Sugarcane 417,000 417,000 0 0 417,000 17.80 815.00 0.00 832.80 832.80
Tabacco 7,210 6,382 0 6,382 0 6.33 0.34 0.00 6.67 6.67
Wheat 2,150 2,000 0 2,000 0 1.18 0.09 0.00 1.27 1.27
Others/miscellaneous 24,554 15,527 0 13,327 2,200 8.56 0.26 14.13 22.95 8.82
Ornamentals/Grasses 1,678,220 261,381 12,763 63,591 185,027 284.63 121.93 21.20 427.76 406.56
Ferns 6,393 6,393 0 6,393 0 26.25 5.34 0.00 31.59 31.59
Ornamentals (field grown) 9,671 9,518 1,195 6,655 1,668 15.00 3.75 0.00 18.75 18.75
Ornamentals (container grown) 36,592 32,997 11,028 17,759 4,210 81.39 33.48 1.51 116.38 114.87
Improved pasture 1,577,198 164,322 0 19,691 144,631 118.65 28.15 19.30 166.10 146.80
Sod 48,366 48,151 540 13,093 34,518 43.34 51.21 0.39 94.94 94.55
Nonirrigation 50.26 5.91 8.23 64.40 56.17
Livestock 31.32 3.58 0.00 34.90 34.90
Fish farming 4.08 0.61 0.00 4.69 4.69
Other/miscellaneous 14.86 1.72 8.23 24.81 16.58
Recreation/lawn/aesthetic 183,258 130,974 1,494 128,543 937 196.38 84.50 153.98 434.86 280.88
Turf grass recreation (golf) 150,467 98,498 0 98,498 0 132.39 55.03 97.55 284.97 187.42
Turf grass lawn 32,791 32,476 1,494 30,045 937 56.51 18.11 56.43 131.05 74.62
Aesthetic/others 0 0 0 0 0 7.48 11.36 0.00 18.84 18.84
Totals
Agricultural irrigation1 3,698,316 1,972,257 604,914 352,275 1,015,068 1,477.26 1,710.67 71.23 3,259.16 3,187.93
Agricultural nonirrigation 0 0 0 0 0 50.26 5.91 8.23 64.40 56.17
Recreation/lawn/aesthetic 183,258 130,974 1,494 128,543 937 196.38 84.50 153.98 434.86 280.88
State totals 3,881,574 2,103,231 606,408 480,818 1,016,005 1,723.90 1,801.08 233.44 3,758.42 3,524.98
1Includes totals of vegetables, fruit crops, field crops, and ornamental/grasses.
Water Withdrawals and Use 25
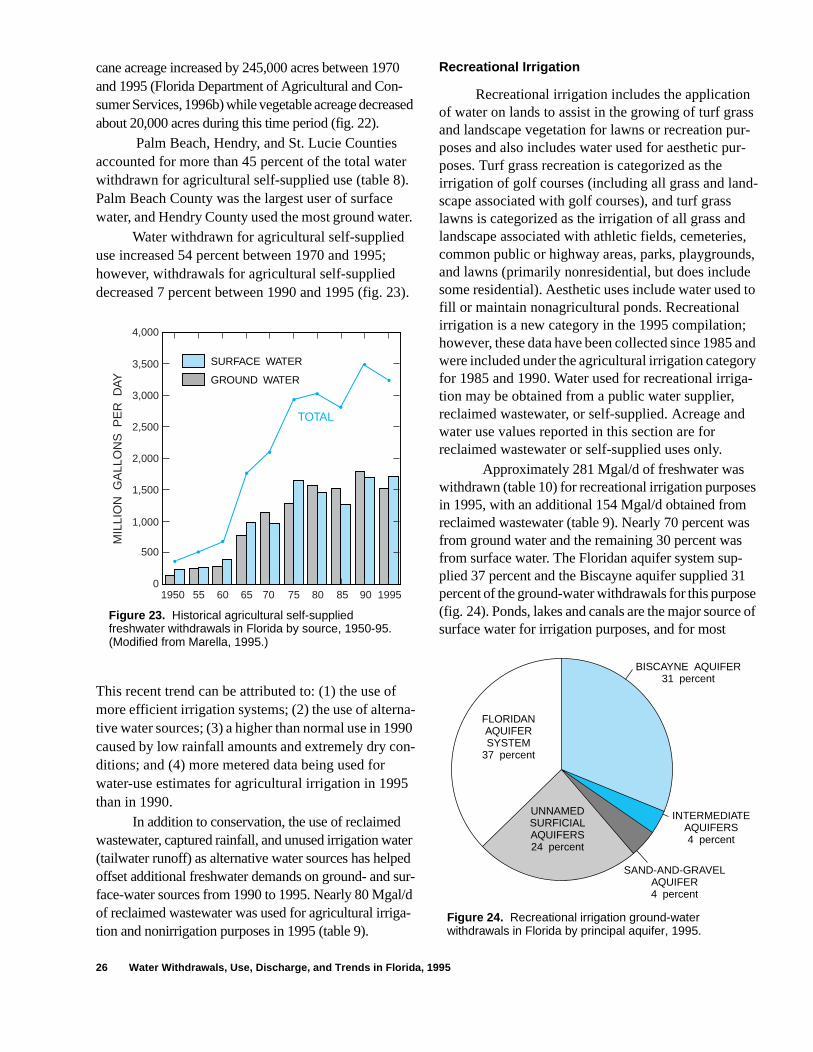
cane acreage increased by 245,000 acres between 1970 and 1995 (Florida Department of Agricultural and Con-sumer Services, 1996b) while vegetable acreage decreased about 20,000 acres during this time period (fig. 22).
Palm Beach, Hendry, and St. Lucie Counties accounted for more than 45 percent of the total water withdrawn for agricultural self-supplied use (table 8). Palm Beach County was the largest user of surface water, and Hendry County used the most ground water.
Water withdrawn for agricultural self-supplied use increased 54 percent between 1970 and 1995; however, withdrawals for agricultural self-supplied decreased 7 percent between 1990 and 1995 (fig. 23).
This recent trend can be attributed to: (1) the use of more efficient irrigation systems; (2) the use of alterna-tive water sources; (3) a higher than normal use in 1990 caused by low rainfall amounts and extremely dry con-ditions; and (4) more metered data being used for water-use estimates for agricultural irrigation in 1995 than in 1990.
In addition to conservation, the use of reclaimed wastewater, captured rainfall, and unused irrigation water (tailwater runoff) as alternative water sources has helped offset additional freshwater demands on ground- and sur-face-water sources from 1990 to 1995. Nearly 80 Mgal/d of reclaimed wastewater was used for agricultural irriga-tion and nonirrigation purposes in 1995 (table 9).
Recreational Irrigation
Recreational irrigation includes the application of water on lands to assist in the growing of turf grass and landscape vegetation for lawns or recreation pur-poses and also includes water used for aesthetic pur-poses. Turf grass recreation is categorized as the irrigation of golf courses (including all grass and land-scape associated with golf courses), and turf grass lawns is categorized as the irrigation of all grass and landscape associated with athletic fields, cemeteries, common public or highway areas, parks, playgrounds, and lawns (primarily nonresidential, but does include some residential). Aesthetic uses include water used to fill or maintain nonagricultural ponds. Recreational irrigation is a new category in the 1995 compilation; however, these data have been collected since 1985 and were included under the agricultural irrigation category for 1985 and 1990. Water used for recreational irriga-tion may be obtained from a public water supplier, reclaimed wastewater, or self-supplied. Acreage and water use values reported in this section are for reclaimed wastewater or self-supplied uses only.
Approximately 281 Mgal/d of freshwater was withdrawn (table 10) for recreational irrigation purposes in 1995, with an additional 154 Mgal/d obtained from reclaimed wastewater (table 9). Nearly 70 percent was from ground water and the remaining 30 percent was from surface water. The Floridan aquifer system sup-plied 37 percent and the Biscayne aquifer supplied 31 percent of the ground-water withdrawals for this purpose (fig. 24). Ponds, lakes and canals are the major source of surface water for irrigation purposes, and for most
500
1,000
1,500
2,000
2,500
3,000
3,500
4,000
0
MIL
LIO
N G
ALL
ON
S P
ER
DAY
60 65 70 75 80 851950 9055 1995
TOTAL
SURFACE WATER
GROUND WATER
Figure 23. Historical agricultural self-supplied freshwater withdrawals in Florida by source, 1950-95. (Modified from Marella, 1995.)
FLORIDANAQUIFERSYSTEM
37 percent
UNNAMEDSURFICIALAQUIFERS24 percent
SAND-AND-GRAVELAQUIFER4 percent
INTERMEDIATEAQUIFERS4 percent
BISCAYNE AQUIFER31 percent
Figure 24. Recreational irrigation ground-water withdrawals in Florida by principal aquifer, 1995.
26 Water Withdrawals, Use, Discharge, and Trends in Florida, 1995
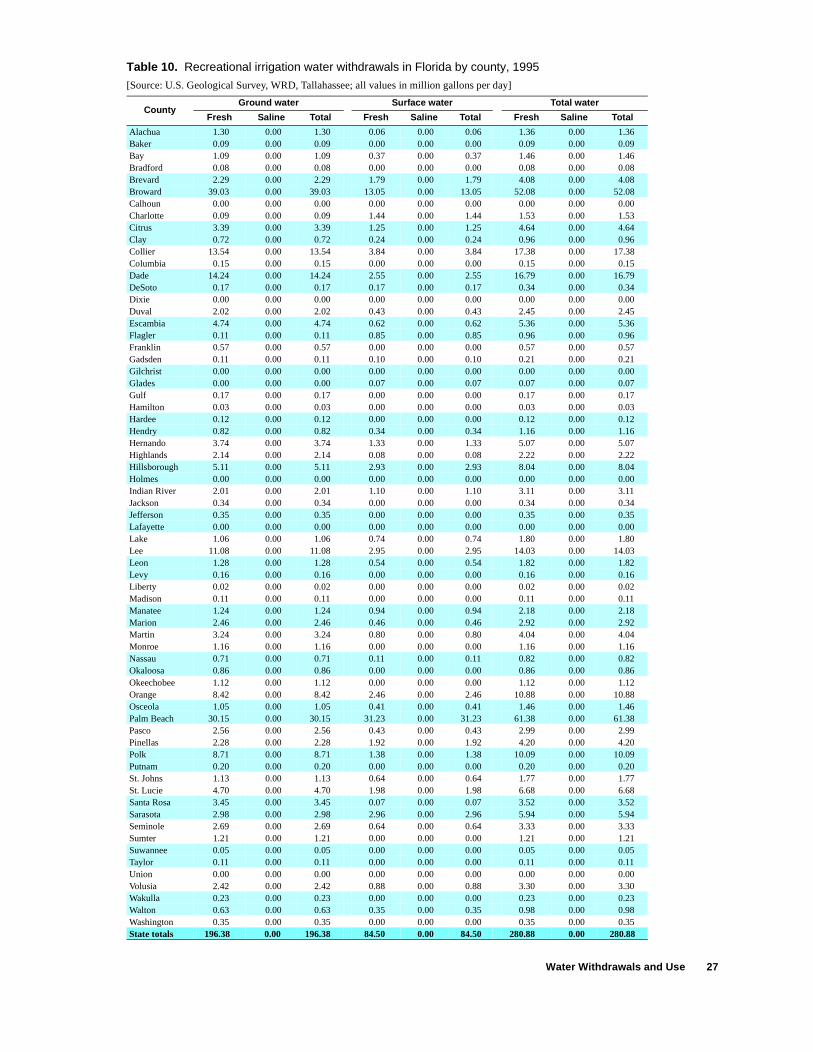
Table 10. Recreational irrigation water withdrawals in Florida by county, 1995
[Source: U.S. Geological Survey, WRD, Tallahassee; all values in million gallons per day]
CountyGround water Surface water Total water
Fresh Saline Total Fresh Saline Total Fresh Saline Total
Alachua 1.30 0.00 1.30 0.06 0.00 0.06 1.36 0.00 1.36Baker 0.09 0.00 0.09 0.00 0.00 0.00 0.09 0.00 0.09Bay 1.09 0.00 1.09 0.37 0.00 0.37 1.46 0.00 1.46Bradford 0.08 0.00 0.08 0.00 0.00 0.00 0.08 0.00 0.08Brevard 2.29 0.00 2.29 1.79 0.00 1.79 4.08 0.00 4.08Broward 39.03 0.00 39.03 13.05 0.00 13.05 52.08 0.00 52.08Calhoun 0.00 0.00 0.00 0.00 0.00 0.00 0.00 0.00 0.00Charlotte 0.09 0.00 0.09 1.44 0.00 1.44 1.53 0.00 1.53Citrus 3.39 0.00 3.39 1.25 0.00 1.25 4.64 0.00 4.64Clay 0.72 0.00 0.72 0.24 0.00 0.24 0.96 0.00 0.96Collier 13.54 0.00 13.54 3.84 0.00 3.84 17.38 0.00 17.38Columbia 0.15 0.00 0.15 0.00 0.00 0.00 0.15 0.00 0.15Dade 14.24 0.00 14.24 2.55 0.00 2.55 16.79 0.00 16.79DeSoto 0.17 0.00 0.17 0.17 0.00 0.17 0.34 0.00 0.34Dixie 0.00 0.00 0.00 0.00 0.00 0.00 0.00 0.00 0.00Duval 2.02 0.00 2.02 0.43 0.00 0.43 2.45 0.00 2.45Escambia 4.74 0.00 4.74 0.62 0.00 0.62 5.36 0.00 5.36Flagler 0.11 0.00 0.11 0.85 0.00 0.85 0.96 0.00 0.96Franklin 0.57 0.00 0.57 0.00 0.00 0.00 0.57 0.00 0.57Gadsden 0.11 0.00 0.11 0.10 0.00 0.10 0.21 0.00 0.21Gilchrist 0.00 0.00 0.00 0.00 0.00 0.00 0.00 0.00 0.00Glades 0.00 0.00 0.00 0.07 0.00 0.07 0.07 0.00 0.07Gulf 0.17 0.00 0.17 0.00 0.00 0.00 0.17 0.00 0.17Hamilton 0.03 0.00 0.03 0.00 0.00 0.00 0.03 0.00 0.03Hardee 0.12 0.00 0.12 0.00 0.00 0.00 0.12 0.00 0.12Hendry 0.82 0.00 0.82 0.34 0.00 0.34 1.16 0.00 1.16Hernando 3.74 0.00 3.74 1.33 0.00 1.33 5.07 0.00 5.07Highlands 2.14 0.00 2.14 0.08 0.00 0.08 2.22 0.00 2.22Hillsborough 5.11 0.00 5.11 2.93 0.00 2.93 8.04 0.00 8.04Holmes 0.00 0.00 0.00 0.00 0.00 0.00 0.00 0.00 0.00Indian River 2.01 0.00 2.01 1.10 0.00 1.10 3.11 0.00 3.11Jackson 0.34 0.00 0.34 0.00 0.00 0.00 0.34 0.00 0.34Jefferson 0.35 0.00 0.35 0.00 0.00 0.00 0.35 0.00 0.35Lafayette 0.00 0.00 0.00 0.00 0.00 0.00 0.00 0.00 0.00Lake 1.06 0.00 1.06 0.74 0.00 0.74 1.80 0.00 1.80Lee 11.08 0.00 11.08 2.95 0.00 2.95 14.03 0.00 14.03Leon 1.28 0.00 1.28 0.54 0.00 0.54 1.82 0.00 1.82Levy 0.16 0.00 0.16 0.00 0.00 0.00 0.16 0.00 0.16Liberty 0.02 0.00 0.02 0.00 0.00 0.00 0.02 0.00 0.02Madison 0.11 0.00 0.11 0.00 0.00 0.00 0.11 0.00 0.11Manatee 1.24 0.00 1.24 0.94 0.00 0.94 2.18 0.00 2.18Marion 2.46 0.00 2.46 0.46 0.00 0.46 2.92 0.00 2.92Martin 3.24 0.00 3.24 0.80 0.00 0.80 4.04 0.00 4.04Monroe 1.16 0.00 1.16 0.00 0.00 0.00 1.16 0.00 1.16Nassau 0.71 0.00 0.71 0.11 0.00 0.11 0.82 0.00 0.82Okaloosa 0.86 0.00 0.86 0.00 0.00 0.00 0.86 0.00 0.86Okeechobee 1.12 0.00 1.12 0.00 0.00 0.00 1.12 0.00 1.12Orange 8.42 0.00 8.42 2.46 0.00 2.46 10.88 0.00 10.88Osceola 1.05 0.00 1.05 0.41 0.00 0.41 1.46 0.00 1.46Palm Beach 30.15 0.00 30.15 31.23 0.00 31.23 61.38 0.00 61.38Pasco 2.56 0.00 2.56 0.43 0.00 0.43 2.99 0.00 2.99Pinellas 2.28 0.00 2.28 1.92 0.00 1.92 4.20 0.00 4.20Polk 8.71 0.00 8.71 1.38 0.00 1.38 10.09 0.00 10.09Putnam 0.20 0.00 0.20 0.00 0.00 0.00 0.20 0.00 0.20St. Johns 1.13 0.00 1.13 0.64 0.00 0.64 1.77 0.00 1.77St. Lucie 4.70 0.00 4.70 1.98 0.00 1.98 6.68 0.00 6.68Santa Rosa 3.45 0.00 3.45 0.07 0.00 0.07 3.52 0.00 3.52Sarasota 2.98 0.00 2.98 2.96 0.00 2.96 5.94 0.00 5.94Seminole 2.69 0.00 2.69 0.64 0.00 0.64 3.33 0.00 3.33Sumter 1.21 0.00 1.21 0.00 0.00 0.00 1.21 0.00 1.21Suwannee 0.05 0.00 0.05 0.00 0.00 0.00 0.05 0.00 0.05Taylor 0.11 0.00 0.11 0.00 0.00 0.00 0.11 0.00 0.11Union 0.00 0.00 0.00 0.00 0.00 0.00 0.00 0.00 0.00Volusia 2.42 0.00 2.42 0.88 0.00 0.88 3.30 0.00 3.30Wakulla 0.23 0.00 0.23 0.00 0.00 0.00 0.23 0.00 0.23Walton 0.63 0.00 0.63 0.35 0.00 0.35 0.98 0.00 0.98Washington 0.35 0.00 0.35 0.00 0.00 0.00 0.35 0.00 0.35State totals 196.38 0.00 196.38 84.50 0.00 84.50 280.88 0.00 280.88
Water Withdrawals and Use 27
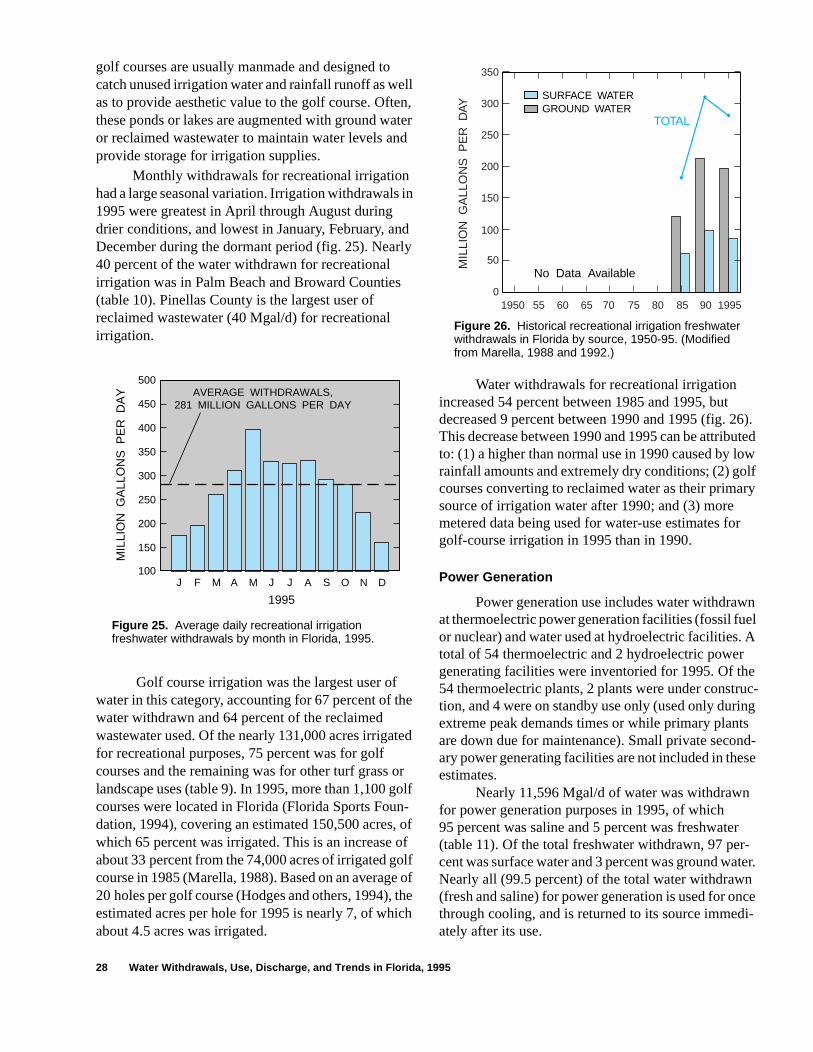
golf courses are usually manmade and designed to catch unused irrigation water and rainfall runoff as well as to provide aesthetic value to the golf course. Often, these ponds or lakes are augmented with ground water or reclaimed wastewater to maintain water levels and provide storage for irrigation supplies.
Monthly withdrawals for recreational irrigation had a large seasonal variation. Irrigation withdrawals in 1995 were greatest in April through August during drier conditions, and lowest in January, February, and December during the dormant period (fig. 25). Nearly 40 percent of the water withdrawn for recreational irrigation was in Palm Beach and Broward Counties (table 10). Pinellas County is the largest user of reclaimed wastewater (40 Mgal/d) for recreational irrigation.
Golf course irrigation was the largest user of water in this category, accounting for 67 percent of the water withdrawn and 64 percent of the reclaimed wastewater used. Of the nearly 131,000 acres irrigated for recreational purposes, 75 percent was for golf courses and the remaining was for other turf grass or landscape uses (table 9). In 1995, more than 1,100 golf courses were located in Florida (Florida Sports Foun-dation, 1994), covering an estimated 150,500 acres, of which 65 percent was irrigated. This is an increase of about 33 percent from the 74,000 acres of irrigated golf course in 1985 (Marella, 1988). Based on an average of 20 holes per golf course (Hodges and others, 1994), the estimated acres per hole for 1995 is nearly 7, of which about 4.5 acres was irrigated.
Water withdrawals for recreational irrigation increased 54 percent between 1985 and 1995, but decreased 9 percent between 1990 and 1995 (fig. 26). This decrease between 1990 and 1995 can be attributed to: (1) a higher than normal use in 1990 caused by low rainfall amounts and extremely dry conditions; (2) golf courses converting to reclaimed water as their primary source of irrigation water after 1990; and (3) more metered data being used for water-use estimates for golf-course irrigation in 1995 than in 1990.
Power Generation
Power generation use includes water withdrawn at thermoelectric power generation facilities (fossil fuel or nuclear) and water used at hydroelectric facilities. A total of 54 thermoelectric and 2 hydroelectric power generating facilities were inventoried for 1995. Of the 54 thermoelectric plants, 2 plants were under construc-tion, and 4 were on standby use only (used only during extreme peak demands times or while primary plants are down due for maintenance). Small private second-ary power generating facilities are not included in these estimates.
Nearly 11,596 Mgal/d of water was withdrawn for power generation purposes in 1995, of which 95 percent was saline and 5 percent was freshwater (table 11). Of the total freshwater withdrawn, 97 per-cent was surface water and 3 percent was ground water. Nearly all (99.5 percent) of the total water withdrawn (fresh and saline) for power generation is used for once through cooling, and is returned to its source immedi-ately after its use.
J F M A M J J A S O N D
150
200
250
300
350
400
450
500
100
MIL
LIO
N G
ALL
ON
S P
ER
DA
Y AVERAGE WITHDRAWALS,281 MILLION GALLONS PER DAY
1995
Figure 25. Average daily recreational irrigation freshwater withdrawals by month in Florida, 1995.
50
100
150
200
250
300
350
0
MIL
LIO
N G
ALL
ON
S P
ER
DAY
SURFACE WATERGROUND WATER
TOTAL
60 65 70 75 80 851950 9055 1995
No Data Available
Figure 26. Historical recreational irrigation freshwater withdrawals in Florida by source, 1950-95. (Modified from Marella, 1988 and 1992.)
28 Water Withdrawals, Use, Discharge, and Trends in Florida, 1995
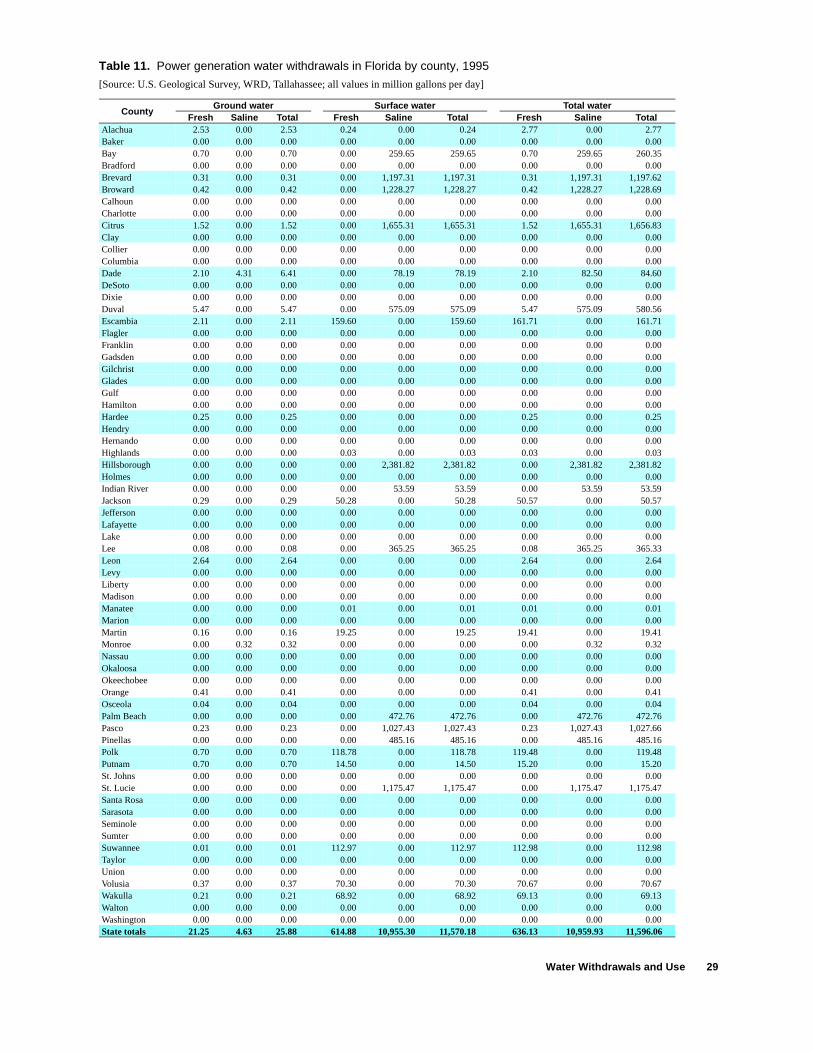
Table 11. Power generation water withdrawals in Florida by county, 1995
[Source: U.S. Geological Survey, WRD, Tallahassee; all values in million gallons per day]
CountyGround water Surface water Total water
Fresh Saline Total Fresh Saline Total Fresh Saline TotalAlachua 2.53 0.00 2.53 0.24 0.00 0.24 2.77 0.00 2.77Baker 0.00 0.00 0.00 0.00 0.00 0.00 0.00 0.00 0.00Bay 0.70 0.00 0.70 0.00 259.65 259.65 0.70 259.65 260.35Bradford 0.00 0.00 0.00 0.00 0.00 0.00 0.00 0.00 0.00Brevard 0.31 0.00 0.31 0.00 1,197.31 1,197.31 0.31 1,197.31 1,197.62Broward 0.42 0.00 0.42 0.00 1,228.27 1,228.27 0.42 1,228.27 1,228.69Calhoun 0.00 0.00 0.00 0.00 0.00 0.00 0.00 0.00 0.00Charlotte 0.00 0.00 0.00 0.00 0.00 0.00 0.00 0.00 0.00Citrus 1.52 0.00 1.52 0.00 1,655.31 1,655.31 1.52 1,655.31 1,656.83Clay 0.00 0.00 0.00 0.00 0.00 0.00 0.00 0.00 0.00Collier 0.00 0.00 0.00 0.00 0.00 0.00 0.00 0.00 0.00Columbia 0.00 0.00 0.00 0.00 0.00 0.00 0.00 0.00 0.00Dade 2.10 4.31 6.41 0.00 78.19 78.19 2.10 82.50 84.60DeSoto 0.00 0.00 0.00 0.00 0.00 0.00 0.00 0.00 0.00Dixie 0.00 0.00 0.00 0.00 0.00 0.00 0.00 0.00 0.00Duval 5.47 0.00 5.47 0.00 575.09 575.09 5.47 575.09 580.56Escambia 2.11 0.00 2.11 159.60 0.00 159.60 161.71 0.00 161.71Flagler 0.00 0.00 0.00 0.00 0.00 0.00 0.00 0.00 0.00Franklin 0.00 0.00 0.00 0.00 0.00 0.00 0.00 0.00 0.00Gadsden 0.00 0.00 0.00 0.00 0.00 0.00 0.00 0.00 0.00Gilchrist 0.00 0.00 0.00 0.00 0.00 0.00 0.00 0.00 0.00Glades 0.00 0.00 0.00 0.00 0.00 0.00 0.00 0.00 0.00Gulf 0.00 0.00 0.00 0.00 0.00 0.00 0.00 0.00 0.00Hamilton 0.00 0.00 0.00 0.00 0.00 0.00 0.00 0.00 0.00Hardee 0.25 0.00 0.25 0.00 0.00 0.00 0.25 0.00 0.25Hendry 0.00 0.00 0.00 0.00 0.00 0.00 0.00 0.00 0.00Hernando 0.00 0.00 0.00 0.00 0.00 0.00 0.00 0.00 0.00Highlands 0.00 0.00 0.00 0.03 0.00 0.03 0.03 0.00 0.03Hillsborough 0.00 0.00 0.00 0.00 2,381.82 2,381.82 0.00 2,381.82 2,381.82Holmes 0.00 0.00 0.00 0.00 0.00 0.00 0.00 0.00 0.00Indian River 0.00 0.00 0.00 0.00 53.59 53.59 0.00 53.59 53.59Jackson 0.29 0.00 0.29 50.28 0.00 50.28 50.57 0.00 50.57Jefferson 0.00 0.00 0.00 0.00 0.00 0.00 0.00 0.00 0.00Lafayette 0.00 0.00 0.00 0.00 0.00 0.00 0.00 0.00 0.00Lake 0.00 0.00 0.00 0.00 0.00 0.00 0.00 0.00 0.00Lee 0.08 0.00 0.08 0.00 365.25 365.25 0.08 365.25 365.33Leon 2.64 0.00 2.64 0.00 0.00 0.00 2.64 0.00 2.64Levy 0.00 0.00 0.00 0.00 0.00 0.00 0.00 0.00 0.00Liberty 0.00 0.00 0.00 0.00 0.00 0.00 0.00 0.00 0.00Madison 0.00 0.00 0.00 0.00 0.00 0.00 0.00 0.00 0.00Manatee 0.00 0.00 0.00 0.01 0.00 0.01 0.01 0.00 0.01Marion 0.00 0.00 0.00 0.00 0.00 0.00 0.00 0.00 0.00Martin 0.16 0.00 0.16 19.25 0.00 19.25 19.41 0.00 19.41Monroe 0.00 0.32 0.32 0.00 0.00 0.00 0.00 0.32 0.32Nassau 0.00 0.00 0.00 0.00 0.00 0.00 0.00 0.00 0.00Okaloosa 0.00 0.00 0.00 0.00 0.00 0.00 0.00 0.00 0.00Okeechobee 0.00 0.00 0.00 0.00 0.00 0.00 0.00 0.00 0.00Orange 0.41 0.00 0.41 0.00 0.00 0.00 0.41 0.00 0.41Osceola 0.04 0.00 0.04 0.00 0.00 0.00 0.04 0.00 0.04Palm Beach 0.00 0.00 0.00 0.00 472.76 472.76 0.00 472.76 472.76Pasco 0.23 0.00 0.23 0.00 1,027.43 1,027.43 0.23 1,027.43 1,027.66Pinellas 0.00 0.00 0.00 0.00 485.16 485.16 0.00 485.16 485.16Polk 0.70 0.00 0.70 118.78 0.00 118.78 119.48 0.00 119.48Putnam 0.70 0.00 0.70 14.50 0.00 14.50 15.20 0.00 15.20St. Johns 0.00 0.00 0.00 0.00 0.00 0.00 0.00 0.00 0.00St. Lucie 0.00 0.00 0.00 0.00 1,175.47 1,175.47 0.00 1,175.47 1,175.47Santa Rosa 0.00 0.00 0.00 0.00 0.00 0.00 0.00 0.00 0.00Sarasota 0.00 0.00 0.00 0.00 0.00 0.00 0.00 0.00 0.00Seminole 0.00 0.00 0.00 0.00 0.00 0.00 0.00 0.00 0.00Sumter 0.00 0.00 0.00 0.00 0.00 0.00 0.00 0.00 0.00Suwannee 0.01 0.00 0.01 112.97 0.00 112.97 112.98 0.00 112.98Taylor 0.00 0.00 0.00 0.00 0.00 0.00 0.00 0.00 0.00Union 0.00 0.00 0.00 0.00 0.00 0.00 0.00 0.00 0.00Volusia 0.37 0.00 0.37 70.30 0.00 70.30 70.67 0.00 70.67Wakulla 0.21 0.00 0.21 68.92 0.00 68.92 69.13 0.00 69.13Walton 0.00 0.00 0.00 0.00 0.00 0.00 0.00 0.00 0.00Washington 0.00 0.00 0.00 0.00 0.00 0.00 0.00 0.00 0.00State totals 21.25 4.63 25.88 614.88 10,955.30 11,570.18 636.13 10,959.93 11,596.06
Water Withdrawals and Use 29
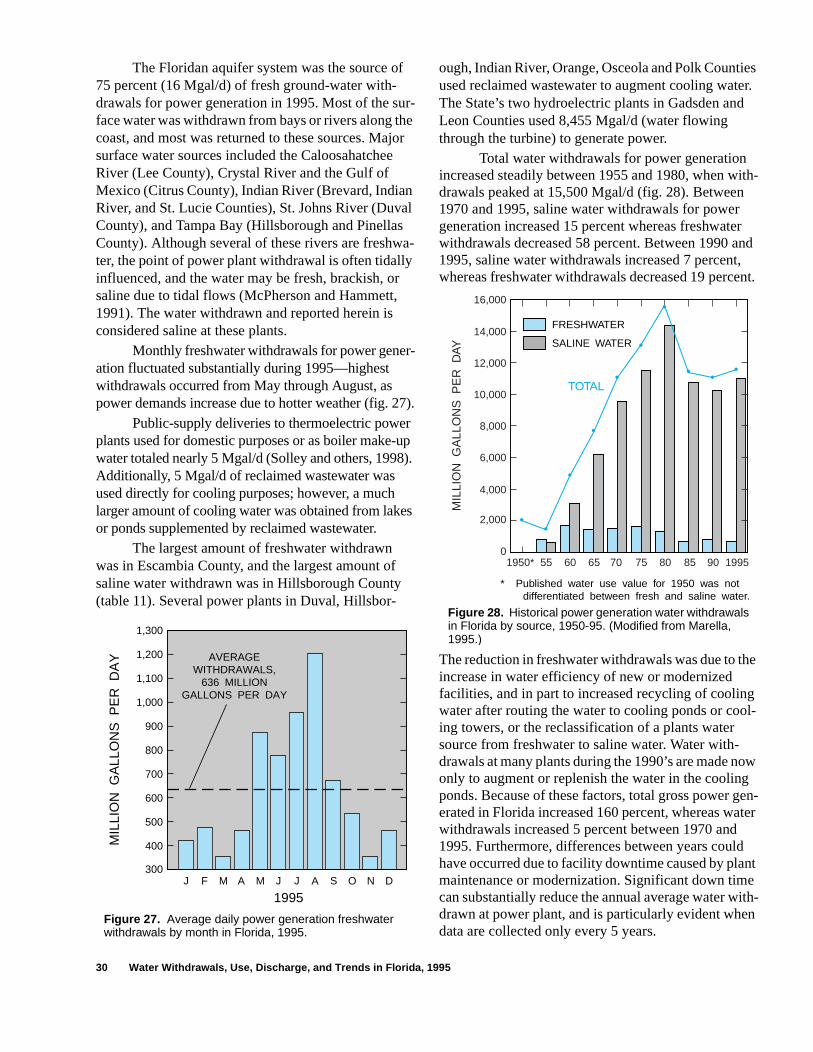
ies er.
ith-
r nd nt.
he
g l-
ow en-ter
nt e ith-n
The Floridan aquifer system was the source of 75 percent (16 Mgal/d) of fresh ground-water with-drawals for power generation in 1995. Most of the sur-face water was withdrawn from bays or rivers along the coast, and most was returned to these sources. Major surface water sources included the Caloosahatchee River (Lee County), Crystal River and the Gulf of Mexico (Citrus County), Indian River (Brevard, Indian River, and St. Lucie Counties), St. Johns River (Duval County), and Tampa Bay (Hillsborough and Pinellas County). Although several of these rivers are freshwa-ter, the point of power plant withdrawal is often tidally influenced, and the water may be fresh, brackish, or saline due to tidal flows (McPherson and Hammett, 1991). The water withdrawn and reported herein is considered saline at these plants.
Monthly freshwater withdrawals for power gener-ation fluctuated substantially during 1995—highest withdrawals occurred from May through August, as power demands increase due to hotter weather (fig. 27).
Public-supply deliveries to thermoelectric power plants used for domestic purposes or as boiler make-up water totaled nearly 5 Mgal/d (Solley and others, 1998). Additionally, 5 Mgal/d of reclaimed wastewater was used directly for cooling purposes; however, a much larger amount of cooling water was obtained from lakes or ponds supplemented by reclaimed wastewater.
The largest amount of freshwater withdrawn was in Escambia County, and the largest amount of saline water withdrawn was in Hillsborough County (table 11). Several power plants in Duval, Hillsbor-
ough, Indian River, Orange, Osceola and Polk Countused reclaimed wastewater to augment cooling watThe State’s two hydroelectric plants in Gadsden andLeon Counties used 8,455 Mgal/d (water flowing through the turbine) to generate power.
Total water withdrawals for power generation increased steadily between 1955 and 1980, when wdrawals peaked at 15,500 Mgal/d (fig. 28). Between1970 and 1995, saline water withdrawals for power generation increased 15 percent whereas freshwatewithdrawals decreased 58 percent. Between 1990 a1995, saline water withdrawals increased 7 percent,whereas freshwater withdrawals decreased 19 perce
The reduction in freshwater withdrawals was due to tincrease in water efficiency of new or modernized facilities, and in part to increased recycling of coolinwater after routing the water to cooling ponds or cooing towers, or the reclassification of a plants water source from freshwater to saline water. Water with-drawals at many plants during the 1990’s are made nonly to augment or replenish the water in the coolingponds. Because of these factors, total gross power gerated in Florida increased 160 percent, whereas wawithdrawals increased 5 percent between 1970 and1995. Furthermore, differences between years couldhave occurred due to facility downtime caused by plamaintenance or modernization. Significant down timcan substantially reduce the annual average water wdrawn at power plant, and is particularly evident whedata are collected only every 5 years.
J F M A M J J A S O N D
1,300
400
500
600
700
800
900
1,000
1,100
1,200
300
MIL
LIO
N G
ALL
ON
S P
ER
DA
Y AVERAGEWITHDRAWALS,
636 MILLIONGALLONS PER DAY
1995
Figure 27. Average daily power generation freshwater withdrawals by month in Florida, 1995.
2,000
4,000
6,000
8,000
10,000
12,000
14,000
16,000
0
MIL
LIO
N G
ALL
ON
S P
ER
DAY
60 65 70 75 80 851950* 9055 1995
TOTAL
FRESHWATER
SALINE WATER
* Published water use value for 1950 was not differentiated between fresh and saline water.
Figure 28. Historical power generation water withdrawals in Florida by source, 1950-95. (Modified from Marella, 1995.)
30 Water Withdrawals, Use, Discharge, and Trends in Florida, 1995

t
t), D
or r nt
ral or
tly
-
sh
.
Water Management District
The Florida Water Resource Act of 1972 estab-lished authority for management of the State’s water resources through five water management districts that operate under the general supervision of the Florida Department of Environmental Protection (formerly the Florida Department of Natural Resources) (Fernald and Patton, 1984). These five water management districts, which encompass the entire State, are the Northwest Florida, the St. Johns River, the South Florida, the Southwest Florida, and the Suwannee River (fig. 2).
The population of Florida in 1995 was 14.15 mil-lion (University of Florida, 1996), of which 40 percent (5.66 million) lived in the SFWMD, followed by the SWFWMD at 25.5 percent (3.61 million), the SJR-WMD at 25 percent (3.51 million), the NWFWMD at 8 percent (1.13 million), and the SRWMD at 1.5 per-cent (0.25 million) (fig. 29). The SFWMD included the largest number of residents served by public-supply water systems (5.23 million) in 1995 (fig. 29).
The largest amount of freshwater withdrawn was from the SFWMD, which was nearly one-half (49.5 percent) of the State’s total freshwater withdrawn
in (fig. 30 and table 12). The percentage of the total freshwater withdrawn in the other water managemendistricts were: SWFWMD, 19 percent; SJRWMD, 18 percent; NWFWMD, 9 percent; and SRWMD, 4.5 percent. The SFWMD accounted for the largest amount of freshwater withdrawn for public supply (47 percent), agricultural self-supplied use (68 percenand recreational irrigation (67 percent). The SWFWMaccounted for the largest amount of freshwater with-drawn for commercial-industrial self-supplied use (34 percent); the SJRWMD accounted for the largestamount of freshwater withdrawn for domestic self-supplied (32 percent); and the NWFWMD accounted fthe largest amount of freshwater withdrawn for powegeneration (45 percent) (table 12). The largest amou(51 percent) of saline water withdrawn was from the SWFWMD and was used for cooling purposes at sevepower generation facilities located along Tampa Bay the Gulf of Mexico (fig. 31 and table 12).
Freshwater withdrawals in all but the SFWMDhave remained about the same or decreased slighbetween 1975 and 1995 (fig. 32). However, as a result of increases in irrigated acreage and population, freshwater withdrawals in the SFWMD increased between 1985 and 1995. Since 1975, freground-water withdrawals increased in all but the SWFWMD (fig.33), and fresh surface-water with-drawals decreased in all but the SFWMD (fig. 34)
NORTHWEST
FLORIDAST. JOHNS
RIVERSOUTHWEST
FLORIDASOUTH
FLORIDA
SUWANNEE
RIVER
1
2
3
4
5
6
0
PO
PU
LAT
ION
, IN
MIL
LIO
NS
WATER MANAGEMENT DISTRICT
TOTALPOPULATION
POPULATION SERVED BY
PUBLIC SUPPLY
Figure 29. Population and population served by public supply by water management district, 1995.
SOUTH FLORIDA49.5 percent
ST. JOHNS RIVER18 percent
NORTHWESTFLORIDA9 percent
SUWANNEERIVER
4.5 percent
SOUTHWEST FLORIDA19 percent
Figure 30. Freshwater withdrawals by water management district, 1995.
Water Withdrawals and Use 31
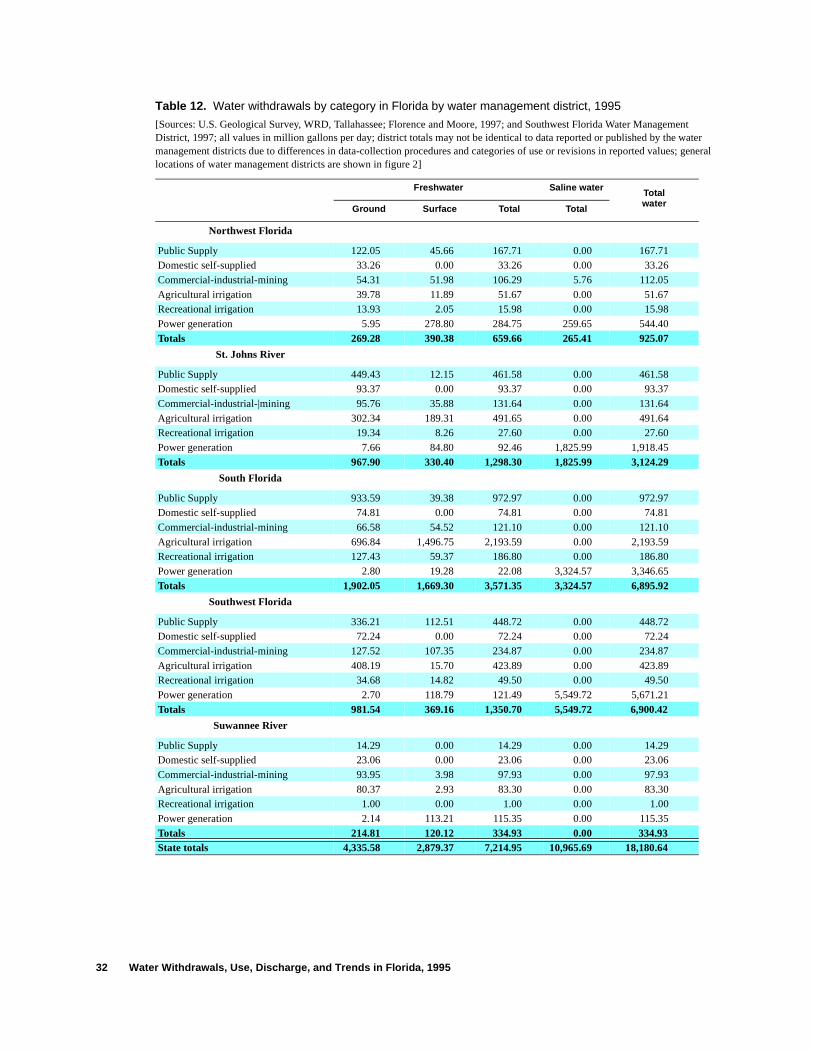
Table 12. Water withdrawals by category in Florida by water management district, 1995
[Sources: U.S. Geological Survey, WRD, Tallahassee; Florence and Moore, 1997; and Southwest Florida Water Management District, 1997; all values in million gallons per day; district totals may not be identical to data reported or published by the water management districts due to differences in data-collection procedures and categories of use or revisions in reported values; general locations of water management districts are shown in figure 2]
Freshwater Saline water TotalwaterGround Surface Total Total
Northwest Florida
Public Supply 122.05 45.66 167.71 0.00 167.71Domestic self-supplied 33.26 0.00 33.26 0.00 33.26Commercial-industrial-mining 54.31 51.98 106.29 5.76 112.05Agricultural irrigation 39.78 11.89 51.67 0.00 51.67Recreational irrigation 13.93 2.05 15.98 0.00 15.98Power generation 5.95 278.80 284.75 259.65 544.40Totals 269.28 390.38 659.66 265.41 925.07
St. Johns River
Public Supply 449.43 12.15 461.58 0.00 461.58Domestic self-supplied 93.37 0.00 93.37 0.00 93.37Commercial-industrial-|mining 95.76 35.88 131.64 0.00 131.64Agricultural irrigation 302.34 189.31 491.65 0.00 491.64Recreational irrigation 19.34 8.26 27.60 0.00 27.60Power generation 7.66 84.80 92.46 1,825.99 1,918.45Totals 967.90 330.40 1,298.30 1,825.99 3,124.29
South Florida
Public Supply 933.59 39.38 972.97 0.00 972.97Domestic self-supplied 74.81 0.00 74.81 0.00 74.81Commercial-industrial-mining 66.58 54.52 121.10 0.00 121.10Agricultural irrigation 696.84 1,496.75 2,193.59 0.00 2,193.59Recreational irrigation 127.43 59.37 186.80 0.00 186.80Power generation 2.80 19.28 22.08 3,324.57 3,346.65Totals 1,902.05 1,669.30 3,571.35 3,324.57 6,895.92
Southwest Florida
Public Supply 336.21 112.51 448.72 0.00 448.72Domestic self-supplied 72.24 0.00 72.24 0.00 72.24Commercial-industrial-mining 127.52 107.35 234.87 0.00 234.87Agricultural irrigation 408.19 15.70 423.89 0.00 423.89Recreational irrigation 34.68 14.82 49.50 0.00 49.50Power generation 2.70 118.79 121.49 5,549.72 5,671.21Totals 981.54 369.16 1,350.70 5,549.72 6,900.42
Suwannee River
Public Supply 14.29 0.00 14.29 0.00 14.29Domestic self-supplied 23.06 0.00 23.06 0.00 23.06Commercial-industrial-mining 93.95 3.98 97.93 0.00 97.93Agricultural irrigation 80.37 2.93 83.30 0.00 83.30Recreational irrigation 1.00 0.00 1.00 0.00 1.00Power generation 2.14 113.21 115.35 0.00 115.35Totals 214.81 120.12 334.93 0.00 334.93State totals 4,335.58 2,879.37 7,214.95 10,965.69 18,180.64
32 Water Withdrawals, Use, Discharge, and Trends in Florida, 1995
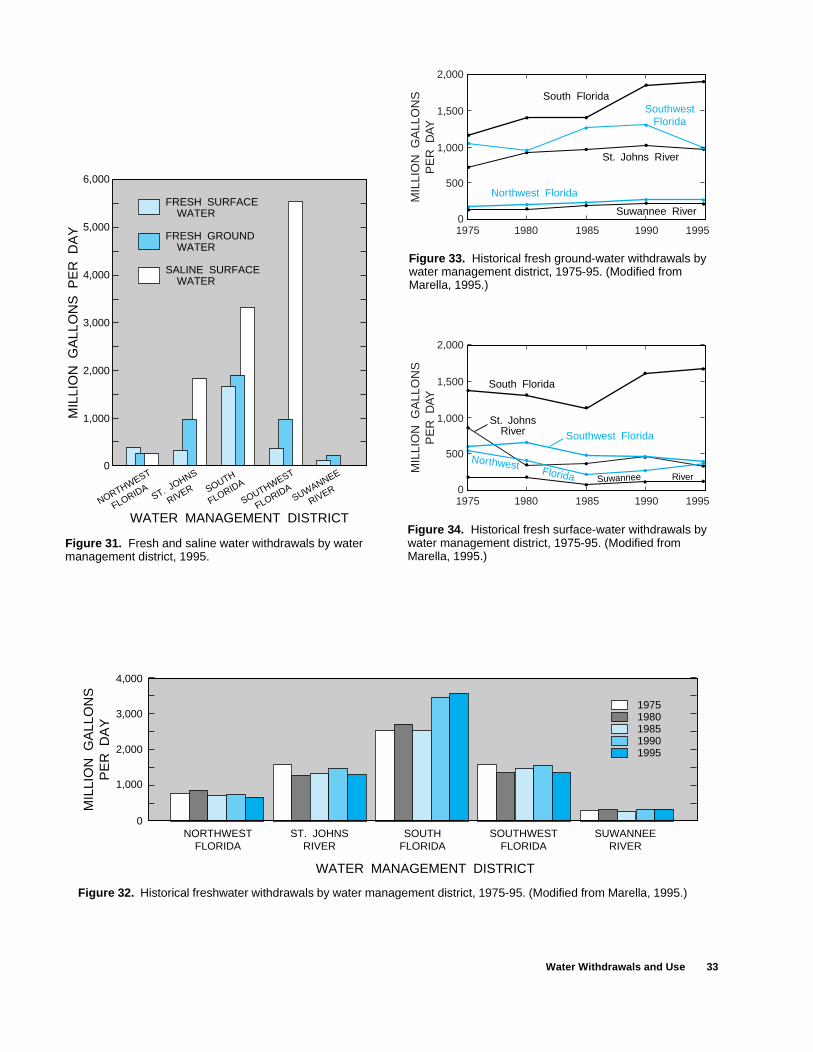
MIL
LIO
N G
ALL
ON
S P
ER
DA
Y
1,000
2,000
3,000
4,000
5,000
6,000
0
FRESH SURFACE WATER
FRESH GROUND WATER
SALINE SURFACE WATER
NORTHWEST
FLORIDAST. JOHNS
RIVERSOUTHWEST
FLORIDASOUTH
FLORIDA
SUWANNEE
RIVER
WATER MANAGEMENT DISTRICT
Figure 31. Fresh and saline water withdrawals by water management district, 1995.
MIL
LIO
N G
ALL
ON
SP
ER
DA
Y
NORTHWESTFLORIDA
ST. JOHNSRIVER
SOUTHFLORIDA
SOUTHWESTFLORIDA
SUWANNEERIVER
1,000
2,000
3,000
4,000
0
WATER MANAGEMENT DISTRICT
19751980198519901995
Figure 32. Historical freshwater withdrawals by water management district, 1975-95. (Modified from Marella, 1995.)
1,000
1,500
2,000
500
0
MIL
LIO
N G
ALL
ON
SP
ER
DAY
1975 1980 19901985 1995
Suwannee River
St. Johns River
South FloridaSouthwest
Florida
Northwest Florida
Figure 33. Historical fresh ground-water withdrawals by water management district, 1975-95. (Modified from Marella, 1995.)
1,000
1,500
2,000
500
0
MIL
LIO
N G
ALL
ON
SP
ER
DAY
1975 1980 19901985 1995
RiverSuwannee
St. JohnsRiver
South Florida
Southwest Florida
Florida
Northwest
Figure 34. Historical fresh surface-water withdrawals by water management district, 1975-95. (Modified from Marella, 1995.)
Water Withdrawals and Use 33
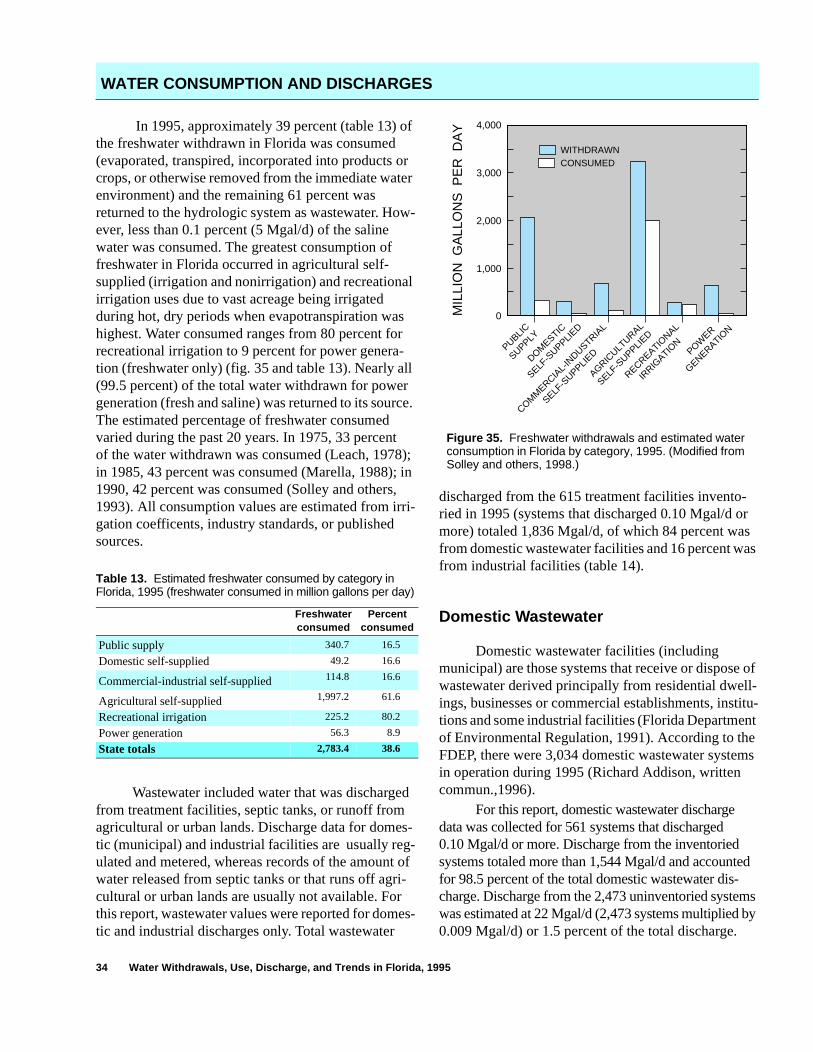
In 1995, approximately 39 percent (table 13) of the freshwater withdrawn in Florida was consumed (evaporated, transpired, incorporated into products or crops, or otherwise removed from the immediate water environment) and the remaining 61 percent was returned to the hydrologic system as wastewater. How-ever, less than 0.1 percent (5 Mgal/d) of the saline water was consumed. The greatest consumption of freshwater in Florida occurred in agricultural self-supplied (irrigation and nonirrigation) and recreational irrigation uses due to vast acreage being irrigated during hot, dry periods when evapotranspiration was highest. Water consumed ranges from 80 percent for recreational irrigation to 9 percent for power genera-tion (freshwater only) (fig. 35 and table 13). Nearly all (99.5 percent) of the total water withdrawn for power generation (fresh and saline) was returned to its source. The estimated percentage of freshwater consumed varied during the past 20 years. In 1975, 33 percent of the water withdrawn was consumed (Leach, 1978); in 1985, 43 percent was consumed (Marella, 1988); in 1990, 42 percent was consumed (Solley and others, 1993). All consumption values are estimated from irri-gation coefficents, industry standards, or published sources.
Wastewater included water that was discharged from treatment facilities, septic tanks, or runoff from agricultural or urban lands. Discharge data for domes-tic (municipal) and industrial facilities are usually reg-ulated and metered, whereas records of the amount of water released from septic tanks or that runs off agri-cultural or urban lands are usually not available. For this report, wastewater values were reported for domes-tic and industrial discharges only. Total wastewater
discharged from the 615 treatment facilities invento-ried in 1995 (systems that discharged 0.10 Mgal/d or more) totaled 1,836 Mgal/d, of which 84 percent was from domestic wastewater facilities and 16 percent was from industrial facilities (table 14).
Domestic Wastewater
Domestic wastewater facilities (including municipal) are those systems that receive or dispose of wastewater derived principally from residential dwell-ings, businesses or commercial establishments, institu-tions and some industrial facilities (Florida Department of Environmental Regulation, 1991). According to the FDEP, there were 3,034 domestic wastewater systems in operation during 1995 (Richard Addison, written commun.,1996).
For this report, domestic wastewater discharge data was collected for 561 systems that discharged 0.10 Mgal/d or more. Discharge from the inventoried systems totaled more than 1,544 Mgal/d and accounted for 98.5 percent of the total domestic wastewater dis-charge. Discharge from the 2,473 uninventoried systems was estimated at 22 Mgal/d (2,473 systems multiplied by 0.009 Mgal/d) or 1.5 percent of the total discharge.
Table 13. Estimated freshwater consumed by category in Florida, 1995 (freshwater consumed in million gallons per day)
Freshwaterconsumed
Percentconsumed
Public supply 340.7 16.5
Domestic self-supplied 49.2 16.6
Commercial-industrial self-supplied 114.8 16.6
Agricultural self-supplied 1,997.2 61.6
Recreational irrigation 225.2 80.2
Power generation 56.3 8.9
State totals 2,783.4 38.6
WATER CONSUMPTION AND DISCHARGES
PUBLIC
SUPPLY
DOMESTIC
SELF-S
UPPLIED
COMM
ERCIAL-
INDUSTRIA
L
SELF-S
UPPLIED
AGRICULT
URAL
SELF-S
UPPLIED
RECREATIONAL
IRRIG
ATION
POWER
GENERATION
1,000
2,000
3,000
4,000
0MIL
LIO
N G
ALL
ON
S P
ER
DA
Y
WITHDRAWNCONSUMED
Figure 35. Freshwater withdrawals and estimated water consumption in Florida by category, 1995. (Modified from Solley and others, 1998.)
34 Water Withdrawals, Use, Discharge, and Trends in Florida, 1995
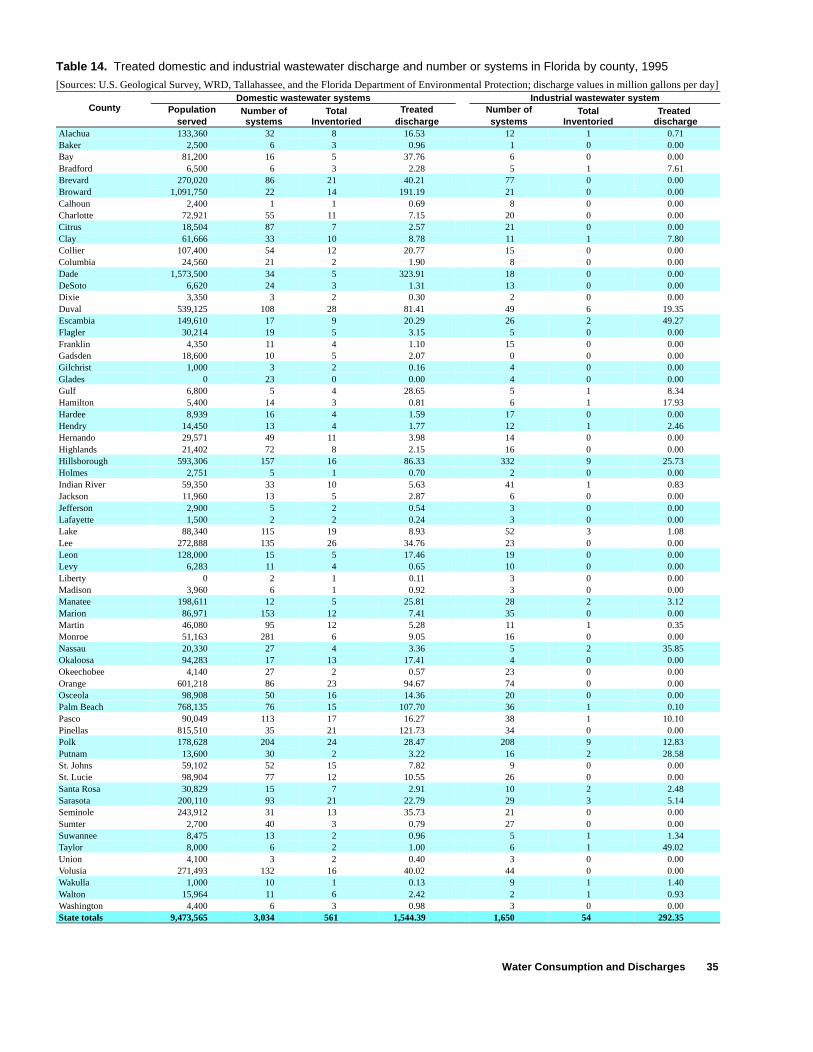
Table 14. Treated domestic and industrial wastewater discharge and number or systems in Florida by county, 1995
[Sources: U.S. Geological Survey, WRD, Tallahassee, and the Florida Department of Environmental Protection; discharge values in million gallons per day]
CountyDomestic wastewater systems Industrial wastewater system
Populationserved
Number ofsystems
Total Inventoried
Treateddischarge
Number ofsystems
TotalInventoried
Treated discharge
Alachua 133,360 32 8 16.53 12 1 0.71Baker 2,500 6 3 0.96 1 0 0.00Bay 81,200 16 5 37.76 6 0 0.00Bradford 6,500 6 3 2.28 5 1 7.61Brevard 270,020 86 21 40.21 77 0 0.00Broward 1,091,750 22 14 191.19 21 0 0.00Calhoun 2,400 1 1 0.69 8 0 0.00Charlotte 72,921 55 11 7.15 20 0 0.00Citrus 18,504 87 7 2.57 21 0 0.00Clay 61,666 33 10 8.78 11 1 7.80Collier 107,400 54 12 20.77 15 0 0.00Columbia 24,560 21 2 1.90 8 0 0.00Dade 1,573,500 34 5 323.91 18 0 0.00DeSoto 6,620 24 3 1.31 13 0 0.00Dixie 3,350 3 2 0.30 2 0 0.00Duval 539,125 108 28 81.41 49 6 19.35Escambia 149,610 17 9 20.29 26 2 49.27Flagler 30,214 19 5 3.15 5 0 0.00Franklin 4,350 11 4 1.10 15 0 0.00Gadsden 18,600 10 5 2.07 0 0 0.00Gilchrist 1,000 3 2 0.16 4 0 0.00Glades 0 23 0 0.00 4 0 0.00Gulf 6,800 5 4 28.65 5 1 8.34Hamilton 5,400 14 3 0.81 6 1 17.93Hardee 8,939 16 4 1.59 17 0 0.00Hendry 14,450 13 4 1.77 12 1 2.46Hernando 29,571 49 11 3.98 14 0 0.00Highlands 21,402 72 8 2.15 16 0 0.00Hillsborough 593,306 157 16 86.33 332 9 25.73Holmes 2,751 5 1 0.70 2 0 0.00Indian River 59,350 33 10 5.63 41 1 0.83Jackson 11,960 13 5 2.87 6 0 0.00Jefferson 2,900 5 2 0.54 3 0 0.00Lafayette 1,500 2 2 0.24 3 0 0.00Lake 88,340 115 19 8.93 52 3 1.08Lee 272,888 135 26 34.76 23 0 0.00Leon 128,000 15 5 17.46 19 0 0.00Levy 6,283 11 4 0.65 10 0 0.00Liberty 0 2 1 0.11 3 0 0.00Madison 3,960 6 1 0.92 3 0 0.00Manatee 198,611 12 5 25.81 28 2 3.12Marion 86,971 153 12 7.41 35 0 0.00Martin 46,080 95 12 5.28 11 1 0.35Monroe 51,163 281 6 9.05 16 0 0.00Nassau 20,330 27 4 3.36 5 2 35.85Okaloosa 94,283 17 13 17.41 4 0 0.00Okeechobee 4,140 27 2 0.57 23 0 0.00Orange 601,218 86 23 94.67 74 0 0.00Osceola 98,908 50 16 14.36 20 0 0.00Palm Beach 768,135 76 15 107.70 36 1 0.10Pasco 90,049 113 17 16.27 38 1 10.10Pinellas 815,510 35 21 121.73 34 0 0.00Polk 178,628 204 24 28.47 208 9 12.83Putnam 13,600 30 2 3.22 16 2 28.58St. Johns 59,102 52 15 7.82 9 0 0.00St. Lucie 98,904 77 12 10.55 26 0 0.00Santa Rosa 30,829 15 7 2.91 10 2 2.48Sarasota 200,110 93 21 22.79 29 3 5.14Seminole 243,912 31 13 35.73 21 0 0.00Sumter 2,700 40 3 0.79 27 0 0.00Suwannee 8,475 13 2 0.96 5 1 1.34Taylor 8,000 6 2 1.00 6 1 49.02Union 4,100 3 2 0.40 3 0 0.00Volusia 271,493 132 16 40.02 44 0 0.00Wakulla 1,000 10 1 0.13 9 1 1.40Walton 15,964 11 6 2.42 2 1 0.93Washington 4,400 6 3 0.98 3 0 0.00State totals 9,473,565 3,034 561 1,544.39 1,650 54 292.35
Water Consumption and Discharges 35
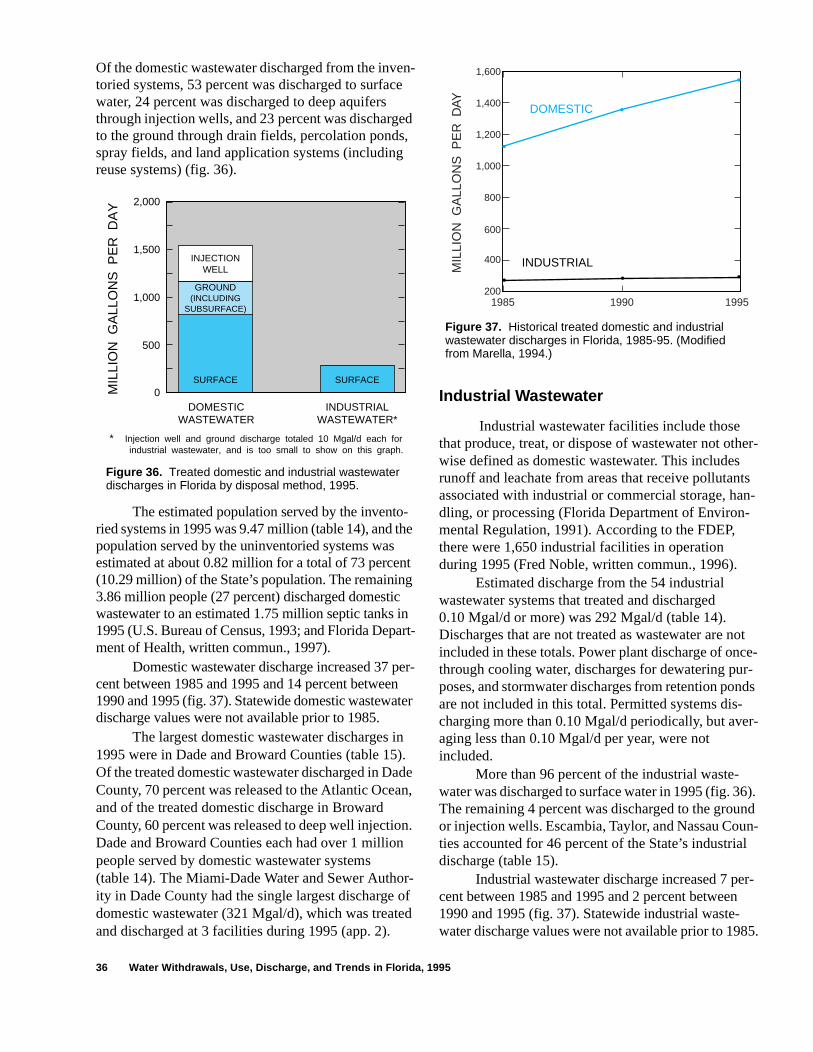
er- ts n-
ot ce-r-ds
r-
6). nd n-l
r-
85.
Of the domestic wastewater discharged from the inven-toried systems, 53 percent was discharged to surface water, 24 percent was discharged to deep aquifers through injection wells, and 23 percent was discharged to the ground through drain fields, percolation ponds, spray fields, and land application systems (including reuse systems) (fig. 36).
The estimated population served by the invento-ried systems in 1995 was 9.47 million (table 14), and the population served by the uninventoried systems was estimated at about 0.82 million for a total of 73 percent (10.29 million) of the State’s population. The remaining 3.86 million people (27 percent) discharged domestic wastewater to an estimated 1.75 million septic tanks in 1995 (U.S. Bureau of Census, 1993; and Florida Depart-ment of Health, written commun., 1997).
Domestic wastewater discharge increased 37 per-cent between 1985 and 1995 and 14 percent between 1990 and 1995 (fig. 37). Statewide domestic wastewater discharge values were not available prior to 1985.
The largest domestic wastewater discharges in 1995 were in Dade and Broward Counties (table 15). Of the treated domestic wastewater discharged in Dade County, 70 percent was released to the Atlantic Ocean, and of the treated domestic discharge in Broward County, 60 percent was released to deep well injection. Dade and Broward Counties each had over 1 million people served by domestic wastewater systems (table 14). The Miami-Dade Water and Sewer Author-ity in Dade County had the single largest discharge of domestic wastewater (321 Mgal/d), which was treated and discharged at 3 facilities during 1995 (app. 2).
Industrial Wastewater
Industrial wastewater facilities include those that produce, treat, or dispose of wastewater not othwise defined as domestic wastewater. This includesrunoff and leachate from areas that receive pollutanassociated with industrial or commercial storage, hadling, or processing (Florida Department of Environ-mental Regulation, 1991). According to the FDEP, there were 1,650 industrial facilities in operation during 1995 (Fred Noble, written commun., 1996).
Estimated discharge from the 54 industrial wastewater systems that treated and discharged 0.10 Mgal/d or more) was 292 Mgal/d (table 14). Discharges that are not treated as wastewater are nincluded in these totals. Power plant discharge of onthrough cooling water, discharges for dewatering puposes, and stormwater discharges from retention ponare not included in this total. Permitted systems dis-charging more than 0.10 Mgal/d periodically, but aveaging less than 0.10 Mgal/d per year, were not included.
More than 96 percent of the industrial waste-water was discharged to surface water in 1995 (fig. 3The remaining 4 percent was discharged to the grouor injection wells. Escambia, Taylor, and Nassau Couties accounted for 46 percent of the State’s industriadischarge (table 15).
Industrial wastewater discharge increased 7 pecent between 1985 and 1995 and 2 percent between1990 and 1995 (fig. 37). Statewide industrial waste-water discharge values were not available prior to 19
500
1,000
1,500
2,000
0MIL
LIO
N G
ALL
ON
S P
ER
DA
Y
DOMESTICWASTEWATER
INDUSTRIALWASTEWATER*
SURFACE SURFACE
GROUND(INCLUDING
SUBSURFACE)
INJECTIONWELL
* Injection well and ground discharge totaled 10 Mgal/d each for industrial wastewater, and is too small to show on this graph.
Figure 36. Treated domestic and industrial wastewater discharges in Florida by disposal method, 1995.
400
600
800
1,000
1,200
1,400
1,600
200
MIL
LIO
N G
ALL
ON
S P
ER
DAY
19901985 1995
INDUSTRIAL
DOMESTIC
Figure 37. Historical treated domestic and industrial wastewater discharges in Florida, 1985-95. (Modified from Marella, 1994.)
36 Water Withdrawals, Use, Discharge, and Trends in Florida, 1995
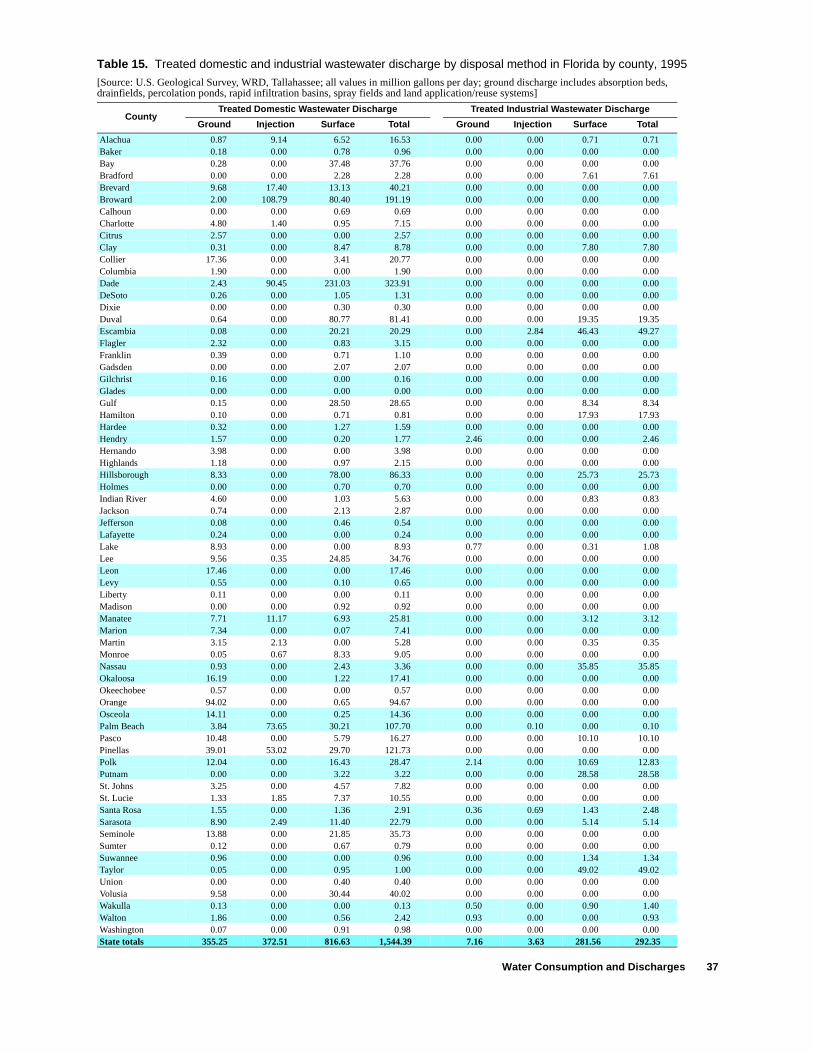
Table 15. Treated domestic and industrial wastewater discharge by disposal method in Florida by county, 1995
[Source: U.S. Geological Survey, WRD, Tallahassee; all values in million gallons per day; ground discharge includes absorption beds, drainfields, percolation ponds, rapid infiltration basins, spray fields and land application/reuse systems]
CountyTreated Domestic Wastewater Discharge Treated Industrial Wastewater Discharge
Ground Injection Surface Total Ground Injection Surface Total
Alachua 0.87 9.14 6.52 16.53 0.00 0.00 0.71 0.71Baker 0.18 0.00 0.78 0.96 0.00 0.00 0.00 0.00Bay 0.28 0.00 37.48 37.76 0.00 0.00 0.00 0.00Bradford 0.00 0.00 2.28 2.28 0.00 0.00 7.61 7.61Brevard 9.68 17.40 13.13 40.21 0.00 0.00 0.00 0.00Broward 2.00 108.79 80.40 191.19 0.00 0.00 0.00 0.00Calhoun 0.00 0.00 0.69 0.69 0.00 0.00 0.00 0.00Charlotte 4.80 1.40 0.95 7.15 0.00 0.00 0.00 0.00Citrus 2.57 0.00 0.00 2.57 0.00 0.00 0.00 0.00Clay 0.31 0.00 8.47 8.78 0.00 0.00 7.80 7.80Collier 17.36 0.00 3.41 20.77 0.00 0.00 0.00 0.00Columbia 1.90 0.00 0.00 1.90 0.00 0.00 0.00 0.00Dade 2.43 90.45 231.03 323.91 0.00 0.00 0.00 0.00DeSoto 0.26 0.00 1.05 1.31 0.00 0.00 0.00 0.00Dixie 0.00 0.00 0.30 0.30 0.00 0.00 0.00 0.00Duval 0.64 0.00 80.77 81.41 0.00 0.00 19.35 19.35Escambia 0.08 0.00 20.21 20.29 0.00 2.84 46.43 49.27Flagler 2.32 0.00 0.83 3.15 0.00 0.00 0.00 0.00Franklin 0.39 0.00 0.71 1.10 0.00 0.00 0.00 0.00Gadsden 0.00 0.00 2.07 2.07 0.00 0.00 0.00 0.00Gilchrist 0.16 0.00 0.00 0.16 0.00 0.00 0.00 0.00Glades 0.00 0.00 0.00 0.00 0.00 0.00 0.00 0.00Gulf 0.15 0.00 28.50 28.65 0.00 0.00 8.34 8.34Hamilton 0.10 0.00 0.71 0.81 0.00 0.00 17.93 17.93Hardee 0.32 0.00 1.27 1.59 0.00 0.00 0.00 0.00Hendry 1.57 0.00 0.20 1.77 2.46 0.00 0.00 2.46Hernando 3.98 0.00 0.00 3.98 0.00 0.00 0.00 0.00Highlands 1.18 0.00 0.97 2.15 0.00 0.00 0.00 0.00Hillsborough 8.33 0.00 78.00 86.33 0.00 0.00 25.73 25.73Holmes 0.00 0.00 0.70 0.70 0.00 0.00 0.00 0.00Indian River 4.60 0.00 1.03 5.63 0.00 0.00 0.83 0.83Jackson 0.74 0.00 2.13 2.87 0.00 0.00 0.00 0.00Jefferson 0.08 0.00 0.46 0.54 0.00 0.00 0.00 0.00Lafayette 0.24 0.00 0.00 0.24 0.00 0.00 0.00 0.00Lake 8.93 0.00 0.00 8.93 0.77 0.00 0.31 1.08Lee 9.56 0.35 24.85 34.76 0.00 0.00 0.00 0.00Leon 17.46 0.00 0.00 17.46 0.00 0.00 0.00 0.00Levy 0.55 0.00 0.10 0.65 0.00 0.00 0.00 0.00Liberty 0.11 0.00 0.00 0.11 0.00 0.00 0.00 0.00Madison 0.00 0.00 0.92 0.92 0.00 0.00 0.00 0.00Manatee 7.71 11.17 6.93 25.81 0.00 0.00 3.12 3.12Marion 7.34 0.00 0.07 7.41 0.00 0.00 0.00 0.00Martin 3.15 2.13 0.00 5.28 0.00 0.00 0.35 0.35Monroe 0.05 0.67 8.33 9.05 0.00 0.00 0.00 0.00Nassau 0.93 0.00 2.43 3.36 0.00 0.00 35.85 35.85Okaloosa 16.19 0.00 1.22 17.41 0.00 0.00 0.00 0.00Okeechobee 0.57 0.00 0.00 0.57 0.00 0.00 0.00 0.00Orange 94.02 0.00 0.65 94.67 0.00 0.00 0.00 0.00Osceola 14.11 0.00 0.25 14.36 0.00 0.00 0.00 0.00Palm Beach 3.84 73.65 30.21 107.70 0.00 0.10 0.00 0.10Pasco 10.48 0.00 5.79 16.27 0.00 0.00 10.10 10.10Pinellas 39.01 53.02 29.70 121.73 0.00 0.00 0.00 0.00Polk 12.04 0.00 16.43 28.47 2.14 0.00 10.69 12.83Putnam 0.00 0.00 3.22 3.22 0.00 0.00 28.58 28.58St. Johns 3.25 0.00 4.57 7.82 0.00 0.00 0.00 0.00St. Lucie 1.33 1.85 7.37 10.55 0.00 0.00 0.00 0.00Santa Rosa 1.55 0.00 1.36 2.91 0.36 0.69 1.43 2.48Sarasota 8.90 2.49 11.40 22.79 0.00 0.00 5.14 5.14Seminole 13.88 0.00 21.85 35.73 0.00 0.00 0.00 0.00Sumter 0.12 0.00 0.67 0.79 0.00 0.00 0.00 0.00Suwannee 0.96 0.00 0.00 0.96 0.00 0.00 1.34 1.34Taylor 0.05 0.00 0.95 1.00 0.00 0.00 49.02 49.02Union 0.00 0.00 0.40 0.40 0.00 0.00 0.00 0.00Volusia 9.58 0.00 30.44 40.02 0.00 0.00 0.00 0.00Wakulla 0.13 0.00 0.00 0.13 0.50 0.00 0.90 1.40Walton 1.86 0.00 0.56 2.42 0.93 0.00 0.00 0.93Washington 0.07 0.00 0.91 0.98 0.00 0.00 0.00 0.00State totals 355.25 372.51 816.63 1,544.39 7.16 3.63 281.56 292.35
Water Consumption and Discharges 37
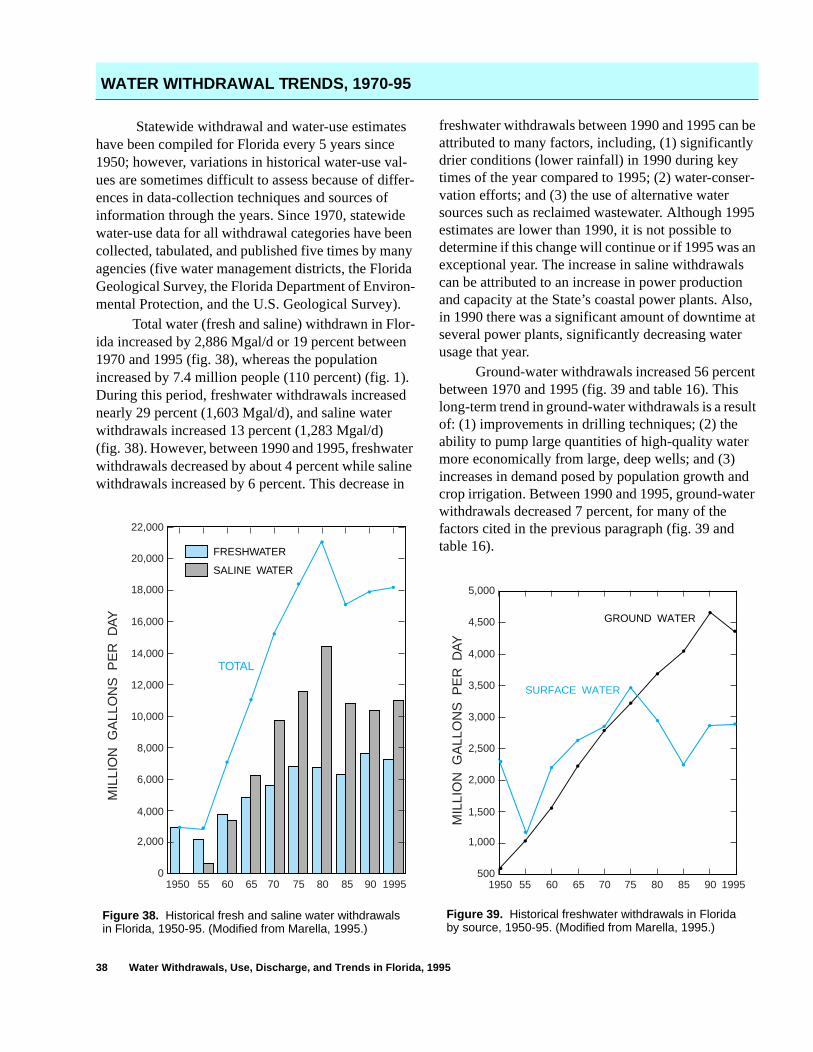
o, at
nt
lt
d er
Statewide withdrawal and water-use estimates have been compiled for Florida every 5 years since 1950; however, variations in historical water-use val-ues are sometimes difficult to assess because of differ-ences in data-collection techniques and sources of information through the years. Since 1970, statewide water-use data for all withdrawal categories have been collected, tabulated, and published five times by many agencies (five water management districts, the Florida Geological Survey, the Florida Department of Environ-mental Protection, and the U.S. Geological Survey).
Total water (fresh and saline) withdrawn in Flor-ida increased by 2,886 Mgal/d or 19 percent between 1970 and 1995 (fig. 38), whereas the population increased by 7.4 million people (110 percent) (fig. 1). During this period, freshwater withdrawals increased nearly 29 percent (1,603 Mgal/d), and saline water withdrawals increased 13 percent (1,283 Mgal/d) (fig. 38). However, between 1990 and 1995, freshwater withdrawals decreased by about 4 percent while saline withdrawals increased by 6 percent. This decrease in
freshwater withdrawals between 1990 and 1995 can be attributed to many factors, including, (1) significantly drier conditions (lower rainfall) in 1990 during key times of the year compared to 1995; (2) water-conser-vation efforts; and (3) the use of alternative water sources such as reclaimed wastewater. Although 1995 estimates are lower than 1990, it is not possible to determine if this change will continue or if 1995 was an exceptional year. The increase in saline withdrawals can be attributed to an increase in power production and capacity at the State’s coastal power plants. Alsin 1990 there was a significant amount of downtime several power plants, significantly decreasing waterusage that year.
Ground-water withdrawals increased 56 percebetween 1970 and 1995 (fig. 39 and table 16). This long-term trend in ground-water withdrawals is a resuof: (1) improvements in drilling techniques; (2) the ability to pump large quantities of high-quality watermore economically from large, deep wells; and (3) increases in demand posed by population growth ancrop irrigation. Between 1990 and 1995, ground-watwithdrawals decreased 7 percent, for many of the factors cited in the previous paragraph (fig. 39 and table 16).
WATER WITHDRAWAL TRENDS, 1970-95
2,000
4,000
6,000
8,000
10,000
12,000
14,000
16,000
18,000
20,000
22,000
0
MIL
LIO
N G
ALL
ON
S P
ER
DAY
60 65 70 75 80 851950 9055 1995
TOTAL
FRESHWATER
SALINE WATER
Figure 38. Historical fresh and saline water withdrawals in Florida, 1950-95. (Modified from Marella, 1995.)
1,000
1,500
2,000
2,500
3,000
3,500
4,000
4,500
5,000
500
MIL
LIO
N G
ALL
ON
S P
ER
DAY
60 65 70 75 80 851950 9055 1995
SURFACE WATER
GROUND WATER
Figure 39. Historical freshwater withdrawals in Florida by source, 1950-95. (Modified from Marella, 1995.)
38 Water Withdrawals, Use, Discharge, and Trends in Florida, 1995
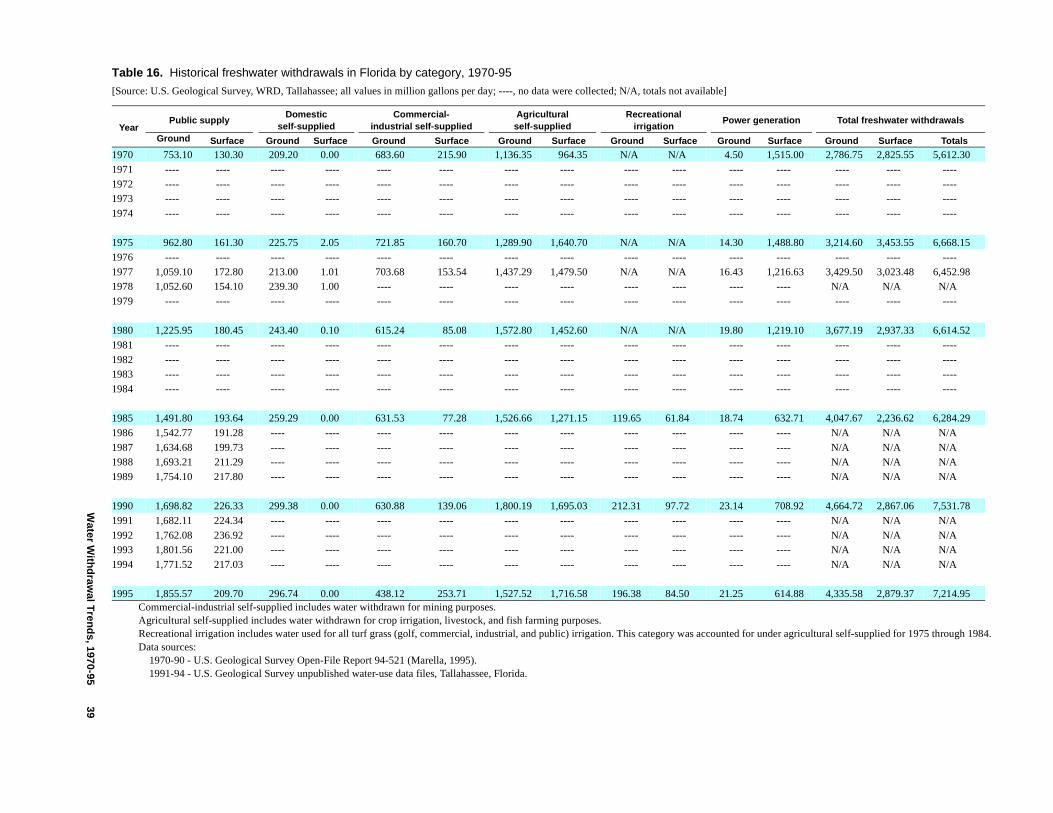
d for under agricultural self-supplied for 1975 through 1984.
wer generation Total freshwater withdrawals
und Surface Ground Surface Totals
50 1,515.00 2,786.75 2,825.55 5,612.30--- ---- ---- ---- ---- --- ---- ---- ---- ---- --- ---- ---- ---- ---- --- ---- ---- ---- ----
30 1,488.80 3,214.60 3,453.55 6,668.15--- ---- ---- ---- ---- 43 1,216.63 3,429.50 3,023.48 6,452.98--- ---- N/A N/A N/A--- ---- ---- ---- ----
80 1,219.10 3,677.19 2,937.33 6,614.52--- ---- ---- ---- ---- --- ---- ---- ---- ---- --- ---- ---- ---- ---- --- ---- ---- ---- ----
74 632.71 4,047.67 2,236.62 6,284.29--- ---- N/A N/A N/A--- ---- N/A N/A N/A--- ---- N/A N/A N/A--- ---- N/A N/A N/A
14 708.92 4,664.72 2,867.06 7,531.78--- ---- N/A N/A N/A--- ---- N/A N/A N/A--- ---- N/A N/A N/A--- ---- N/A N/A N/A
25 614.88 4,335.58 2,879.37 7,214.95
Water W
ithd
rawal T
rend
s, 1970-9539
Commercial-industrial self-supplied includes water withdrawn for mining purposes.Agricultural self-supplied includes water withdrawn for crop irrigation, livestock, and fish farming purposes.Recreational irrigation includes water used for all turf grass (golf, commercial, industrial, and public) irrigation. This category was accounteData sources: 1970-90 - U.S. Geological Survey Open-File Report 94-521 (Marella, 1995). 1991-94 - U.S. Geological Survey unpublished water-use data files, Tallahassee, Florida.
Table 16. Historical freshwater withdrawals in Florida by category, 1970-95
[Source: U.S. Geological Survey, WRD, Tallahassee; all values in million gallons per day; ----, no data were collected; N/A, totals not available]
YearPublic supply
Domesticself-supplied
Commercial-industrial self-supplied
Agriculturalself-supplied
Recreationalirrigation
Po
Ground Surface Ground Surface Ground Surface Ground Surface Ground Surface Gro
1970 753.10 130.30 209.20 0.00 683.60 215.90 1,136.35 964.35 N/A N/A 4.1971 ---- ---- ---- ---- ---- ---- ---- ---- ---- ---- -1972 ---- ---- ---- ---- ---- ---- ---- ---- ---- ---- -1973 ---- ---- ---- ---- ---- ---- ---- ---- ---- ---- -1974 ---- ---- ---- ---- ---- ---- ---- ---- ---- ---- -
1975 962.80 161.30 225.75 2.05 721.85 160.70 1,289.90 1,640.70 N/A N/A 14.1976 ---- ---- ---- ---- ---- ---- ---- ---- ---- ---- -1977 1,059.10 172.80 213.00 1.01 703.68 153.54 1,437.29 1,479.50 N/A N/A 16.1978 1,052.60 154.10 239.30 1.00 ---- ---- ---- ---- ---- ---- -1979 ---- ---- ---- ---- ---- ---- ---- ---- ---- ---- -
1980 1,225.95 180.45 243.40 0.10 615.24 85.08 1,572.80 1,452.60 N/A N/A 19.1981 ---- ---- ---- ---- ---- ---- ---- ---- ---- ---- -1982 ---- ---- ---- ---- ---- ---- ---- ---- ---- ---- -1983 ---- ---- ---- ---- ---- ---- ---- ---- ---- ---- -1984 ---- ---- ---- ---- ---- ---- ---- ---- ---- ---- -
1985 1,491.80 193.64 259.29 0.00 631.53 77.28 1,526.66 1,271.15 119.65 61.84 18.1986 1,542.77 191.28 ---- ---- ---- ---- ---- ---- ---- ---- -1987 1,634.68 199.73 ---- ---- ---- ---- ---- ---- ---- ---- -1988 1,693.21 211.29 ---- ---- ---- ---- ---- ---- ---- ---- -1989 1,754.10 217.80 ---- ---- ---- ---- ---- ---- ---- ---- -
1990 1,698.82 226.33 299.38 0.00 630.88 139.06 1,800.19 1,695.03 212.31 97.72 23.1991 1,682.11 224.34 ---- ---- ---- ---- ---- ---- ---- ---- -1992 1,762.08 236.92 ---- ---- ---- ---- ---- ---- ---- ---- -1993 1,801.56 221.00 ---- ---- ---- ---- ---- ---- ---- ---- -1994 1,771.52 217.03 ---- ---- ---- ---- ---- ---- ---- ---- -
1995 1,855.57 209.70 296.74 0.00 438.12 253.71 1,527.52 1,716.58 196.38 84.50 21.
f 9 r
ce
an by EP
-
to er , f
n-
y e,
red er n
use sh--
Fresh surface-water withdrawals have increased only slightly (2 percent) between 1970 and 1995, and increased less than 1 percent between 1990 and 1995. Fresh surface-water withdrawals peaked in 1975, pri-marily due to power generation demands (fig. 39 and table 16). Increases in fresh surface-water demands posed by increased irrigated agricultural acreage in southern Florida during 1970 through 1995 helped off-set the large decrease in withdrawals for power gener-ation.
Between 1970 and 1995, total freshwater with-drawals increased for public supply by 134 percent, for agricultural self-supplied by 54 percent, and for domes-tic self-supplied by 42 percent. However, during this period withdrawals decreased for power generation (thermoelectric) by 58 percent and for commercial-industrial self-supplied by 24 percent (table 16). Recre-ational irrigation withdrawals increased 55 percent between 1985 and 1995; prior to 1985, recreational irri-gation water use was included in the agricultural self-supplied category. Public supply and domestic self-supplied increases are a result of population growth and tourism during this time period. Agricultural self-sup-plied increases during this period are a result of irriga-tion development and the availablilty of water for irrigation which allowed farmers to increase crop pro-duction while decreasing the risk of crop damage due to prolonged dry conditions.
Between 1990 and 1995, agricultural self-sup-plied withdrawals decreased 7 percent. This reduction in agricultural self-supplied use reflects greater rainfall in 1995 than in 1990, more efficient irrigation systems and practices, and more accurate data from metered irrigation systems. Public-supply water withdrawals increased 7 percent between 1990 and 1995, primarily
as a result of an increase in the State’s population opercent (1.2 million people). Withdrawals for the othecategories remained relatively unchanged between 1990 and 1995 (table 16).
The use of nonpotable ground water as a sourof supply, primarily for public supply, also has increased in Florida. Nonpotable water (sometimes referred to as brackish water), which contains less th1,000 mg/L of dissolved solids, is sometimes treated desalination processes (see glossary) to meet the FDdrinking-water standards for public supply use. The amount of nonpotable water treated to meet drinkingwater standards increased from 17 Mgal/d in 1985 (Marella, 1995) to 58 Mgal/d in 1995.
The use of reclaimed wastewater also has increased in Florida since the mid 1980’s. According the FDEP, nearly 402 Mgal/d of reclaimed wastewatwas used in 1996, compared to 266 Mgal/d in 1990and 206 Mgal/d used in 1986 (Florida Department oEnvironmental Protection, 1997). For 1995, an esti-mated 383 Mgal/d of reclaimed wastewater was invetoried by the Water Management Districts (Florida Water Management Districts, 1996), which differs from the 240 Mgal/d identified in this report. This difference in reported values for 1995 is explained bthe fact that the FDEP defines ground-water rechargwetlands enhancement, and other such factors as waste-water reuse. These categories are not considereuse in this report. Most of the reclaimed wastewat(64 percent) reported by FDEP was used for irrigatiopurposes (agricultural and public access areas). Theof reclaimed wastewater reduces the demand for frewater, and is expected to continue to increase statewide.
40 Water Withdrawals, Use, Discharge, and Trends in Florida, 1995
Water resources are among Florida’s most important natural assets. Freshwater supplies are vital for our daily lives, future residents and visitors, natural systems, recreation and agriculture.
Florida’s freshwater supplies are finite and the demands of a growing population and the need to sustain our rivers, lakes, wetlands and estuaries requires the utmost care and thoughtfulness in planning and using our freshwater supplies.
--Quote from Lawton Chiles, former Governor of Florida, from the Water Resources Atlas of Florida by Fernald, E.A., and Purdum, E.D., 1998, p. iii.
p. s, d
, r-
a m-
-
,
of
,
r
e, s
ac
P.,
s
r r-i-
nd,
cli-
American Water Works Association, 1992, Water industry data base: utility profiles: Denver, Colorado, American Water Works Association, 80 p.
Bucca, Jane, and Marella, R.L., 1992, An improved method for determining the nonresidential water use component of total public water supply estimates, in Jones, M.E., and Laenen, Antonius (eds.), Interdisciplinary approaches in hydrology and hydrogeology: American Institute of Hydrology, p. 511-523.
Buros, O.K., 1989, Desalting practices in the United States: American Water Works Association Journal, v. 81, no. 11, November, p. 38-42.
Campbell, K.M., 1986, The industrial minerals of Florida: Tallahassee, Florida Bureau of Geology Information Circular No. 102, 94 p.
Davis, W.Y., Rodrigo, D.M., Opitz, E.M., Dziegielewski, B., Baumann, D.D., and Boland, J.J., 1988, IWR-Main water use forecasting system, version 5.1: Users man-ual and system description: Fort Belvoir, Va., U.S. Army Corps of Engineers, Institute for Water Resources, IWR-Main Report 88-R-6, 273 p.
Dietrich, T.S., 1978, The urbanization of Florida’s popula-tion: An historical perspective of county growth 1830-1970: Gainesville, University of Florida, College of Business Administration, Bureau of Economic and Business Research, 211 p.
Dykes, G.M., and Conlon, W.J., 1989, Use of membrane technology in Florida: American Water Works Associ-ation Journal, v. 81, no. 11, November, p. 43-46.
Fernald, E.A., and Patton, D.J., eds., 1984, Water resources atlas of Florida: Tallahassee, Florida State University, Institute of Science and Public Affairs, 291 p.
Fernald, E.A., and Purdum, E.D., eds., 1992, Atlas of Flor-ida: Tallahassee, Florida State University, Institute of Science and Public Affairs, 280 p.
Fernald, E.A., and Purdum, E.D., eds., 1998, Water resource atlas of Florida: Tallahassee, Florida State University, Institute of Science and Public Affairs, 312 p.
Florence, B.L., and Moore, Cynthia, 1997, Annual water use survey; 1995: Palatka, St. Johns River Water Manage-ment District Technical Publication SJ 97-4, 128 p.
Florida Agricultural Statistics Service, 1996a, Citrus sum-mary 1994-1995: Orlando, Florida Department of Agri-culture and Consumer Services, 45 p.
———1996b, Field crop summary 1995: Orlando, Florida Department of Agriculture and Consumer Services, 19 p.
———1996c, Vegetable summary 1994-1995: Orlando, Florida Department of Agriculture and Consumer Services, 72 p.
———1996d, Livestock, dairy, and poultry summary 1995: Orlando, Florida Department of Agriculture and Con-sumer Services, 84 p.
———1996e, Catfish - February, 1995: Orlando, Florida Department of Agriculture and Consumer Services, 2
Florida Department of Agriculture and Consumer Service1995, Annual report: Gainesville, Bureau of Plant anApiary Inspection, Division of Plant Industry, July 1, 1994-June 30, 1995, 63 p.
———1996, 1996 Florida Agricultural Facts: TallahasseeFlorida Department of Agricultural and Consumer Sevices, 72 p.
Florida Chamber of Commerce, 1995, Directory of Floridindustries 1995 (58th ed.): Tallahassee, Florida Chaber of Commerce Business Center, 936 p.
Florida Department of Commerce, 1996, Florida visitor study, 1995: Tallahassee, Bureau of Economic Analysis, Office of Tourism Research, 90 p.
1Florida Department of Environmental Regulation, 1990aDrinking water standards, monitoring, and reporting:Tallahassee, chap. 17-550, 48 p.
———1990b, 1990 Reuse inventory: Tallahassee, State the environment, 50 p.
———1991, Domestic wastewater facilities: Tallahasseechap. 17-600, 70 p.
Florida Department of Environmental Protection, 1997, 1996 Reuse inventory: Tallahassee, Bureau of WateFacilities, 81 p.
Florida Sports Foundation, 1994, Fairways in the sunshinOfficial Florida golf guide: Tallahassee, Florida SportFoundation, Hillsboro Printing Company, 54 p.
Heath, R.C., and Conover, C.S., 1981, Hydrologic almanof Florida: U.S. Geological Survey Open-File Report81-1107, 239 p.
Hodges, A.W., Haydu, J.J., van Blokland, P.J., and Bell, A.1994, Contribution of the turf grass industry to Flor-ida’s economy, 1991/92: A value added approach: Gainesville, University of Florida, Institute of Food andAgricultural Sciences, Food and Resource EconomicDepartment, Economic Report ER94-1, 83 p.
Hughes, G.H., 1975, Perspective on use of freshwater focooling systems of thermoelectric power plants in Floida: U.S. Geological Survey Water-Resources Investgations 43-75, 30 p.
Jones, J.W., Allen, L.H., Shih, S.F., Rogers, J.S., HammoL.C., Smajstrla, A.G., and Martsolf, J.D., 1984, Esti-mated and measured evapotranspiration for Florida mate, crops, and soils: Gainesville, University of Florida, Institute of Food and Agricultural Sciences, Bulletin 840 (technical), 65 p.
SELECTED REFERENCES
1Florida Department of Environmental Regulation is now Florida Department of Environmental Protection.
Selected References 41
0:
.): 6,
ti-
a, 9 p. s
ity ,
ns
4 p.ds nd
.a -
ed g-
ed g-
-.
in
Izuno, F.T., and Haman, D.Z., 1987, Basic irrigation termi-nology: Gainesville, University of Florida, Institute of Food and Agricultural Sciences, Agricultural Engineer-ing Fact Sheet AE-66, 4 p.
Leach, S.D., 1978, Source, use, and disposition of water in Florida, 1975: U.S. Geological Survey Water-Resources Investigations 78-17, 90 p.
———1983, Source, use, and disposition of water in Flor-ida, 1980: U.S. Geological Survey Water-Resources Investigations 82-4090, 337 p.
Leach, S.D., and Healy, H.G., 1980, Estimated water use in Florida, 1977: U.S. Geological Survey Water-Resources Investigations Report 79-112, 76 p.
MacKichan, K.A., 1951, Estimated use of water in the United States, 1950: U.S. Geological Survey Circular 115, 13 p.
———1957, Estimated use of water in the United States, 1955, U.S. Geological Survey Circular 398, 18 p.
MacKichan, K.A., and Kammerer, J.C., 1961, Estimated use of water in the United States, 1960: U.S. Geological Survey Circular 456, 44 p.
Marella, R.L., 1988, Water withdrawals, use, and trends in Florida, 1985: U.S. Geological Survey Water-Resources Investigations Report 88-4103, 43 p.
———1992, Water withdrawals, use, and trends in Florida, 1990: U.S. Geological Survey Water-Resources Inves-tigations Report 92-4140, 38 p.
———1994, Estimated discharge of treated wastewater in Florida, 1990: U.S. Geological Survey Open-File Report 93-364, 53 p.
———1995, Water-use data by category, county, and water management district in Florida, 1950-90: U.S. Geolog-ical Survey Open-File Report 94-521, 114 p.
———1997, Irrigated crop acreage and water withdrawals in Florida, 1990: Florida Department of Environmental Protection, Tallahassee, Florida Geological Survey, Map Series 143, 1 sheet.
McPherson, B.F., and Hammett, K.M., 1991, Tidal Rivers of Florida, in Livingston, R.J., ed., The rivers of Florida: New York, Springer-Verlag Incorporated, Ecological Studies 83, p. 31-46.
Murray, C.R., 1968, Estimated use of water in the United States, 1965: U.S. Geological Survey Circular 556, 53 p.
Murray, C.R., Reeves, E.B., 1972, Estimated use of water in the United States, 1970: U.S. Geological Survey Circu-lar 676, 37 p.
———1977, Estimated use of water in the United States, 1975: U.S. Geological Survey Circular 765, 37 p.
National Golf Foundation, 1997, 1995-96 National golf course directory: Jupiter, Florida, v. I, Alabama-Mon-tana, 543 p.
Northwest Florida Water Management District, 1996, 1995 Annual reuse report: Havana, Northwest Florida Water Management District, 29 p.
Pride, R.W., 1973, Estimated use of water in Florida, 197Tallahassee, Florida Bureau of Geology Information Circular 83, 31 p.
———1975, Estimated water use in Florida, 1965 (2d edTallahassee, Florida Bureau of Geology Map Series 31 sheet.
Purdum, E.D., 1994, Florida County Atlas and Municipal Fact Book: Tallahassee, Florida State University, Instute of Science and Public Affairs, 146 p.
St. Johns River Water Management District, 1984, Con-sumptive uses of water; applicant's handbook: PalatkResource Management Department, June 1, 1984, 4
———1996, 1995 Annual reuse report: Palatka, St. JohnRiver Water Management District, 29 p.
Seaber, P.R., Kapinos, F.P., and Knapp, G.L., 1984, Statehydrologic unit maps: U.S. Geological Survey Open-File Report 84-708, 63 p.
Smajstrla, A.G., 1986, Agricultural field scale irrigation requirements simulation model: Technical manual: Gainesville, University of Florida, Agricultural Engi-neering Department, 52 p.
Smajstrla, A.G., Boman, B.J., Clark, G.A., Haman, D.Z., Harrison, D.S., Izuno, F.T., and Zazueta, F.S., 1988,Efficiencies of Florida agricultural irrigation systems:Gainesville, University of Florida, Institute of Food andAgricultural Sciences, Bulletin 247, 15 p.
Smajstrla, A.G., and others, 1993, Microirrigation in Flor-ida: Systems, acreage and cost: Gainesville, Universof Florida, Institute of Food and Agricultural SciencesBulletin 276, 12 p.
Smith, S.K., 1991, Population growth of States and regio1980-1990: Gainesville, University of Florida, Collegeof Business Administration, Bureau of Economic andBusiness Research, Economic Leaflets, v. 50, no. 1,
Smith, S.K., and Cody, Scott, 1996, Number of householand average household size in Florida: 1980, 1990 a1995: Gainesville, University of Florida, College of Business Administration, Bureau of Economic and Business Research, v. 29, no. 1, Bulletin no. 113, 4 p
Smith, S.K., and Nogle, June, 1997, Projections of Floridpopulation by county 1996-2020: Gainesville, University of Florida, College of Business Administration, Bureau of Economic and Business Research, v. 30, no. 2, Bulletin no. 117, 8 p.
Solley, W.B., Chase, E.B., and Mann, W.B., 1983, Estimatuse of water in the United States in 1980: U.S. Geoloical Survey Circular 1001, 56 p.
Solley, W.B., Merk, C.F., and Pierce, R.R., 1988, Estimatuse of water in the United States in 1985: U.S. Geoloical Survey Circular 1004, 82 p.
Solley, W.B., Pierce, R.R., and Perlman, H.A., 1993, Estimated use of water in the United States in 1990: U.SGeological Survey Circular 1081, 76 p.
———1998, Estimated use of water in the United States1995: U.S. Geological Survey Circular 1200, 78 p.
42 Water Withdrawals, Use, Discharge, and Trends in Florida, 1995
s
ic le
e
,
,
s
-d
South Florida Water Management District, 1990, Desalina-tion: An additional water source for south Florida: West Palm Beach, South Florida Water Management District, Office of Communications, (PIO 276 290 5M), 4 p.
———1996, 1995 Annual reuse report: West Palm Beach, South Florida Water Management District, Planning Department, 35 p.
Southwest Florida Water Management District, 1996, 1995 Annual reuse report: Brooksville, Resource Projects Department, Conservation Projects Section, 31 p.
———1997, 1995 Estimated water use in the Southwest Florida Water Management District: Brooksville, Resource Projects Department, Conservation Projects Section, 54 p.
Suwannee River Water Management District, 1996, 1995 Annual reuse report: Live Oak, Suwannee River Water Management District, 16 p.
U.S. Bureau of the Census, 1993, 1990 Census of housing, detailed housing characteristics: Florida: Washington D.C., U.S. Department of Commerce, Bureau of the Census, Ch-2-11, 793 p.
———1996, County business patterns, 1994, Florida: Washington D.C., U.S. Department of Commerce, Bureau of the Census, CBP-94-11, 159 p.
———1997, 1997 Statistical abstract of the United State(117th ed.): Washington D.C., U.S. Department of Commerce, Bureau of the Census, 1023 p.
U.S. Geological Survey, 1975, State of Florida, Hydrologunit map-1974: U.S. Geological Survey, 1 sheet, sca1:500,000.
U.S. Soil Conservation Service, 1970, Irrigation water requirement (revised), U.S. Department of AgriculturTechnical Release no. 21, 88 p.
———1982, Florida irrigation guide: Gainesville, U.S. Department of Agriculture, Soil Conservation Service300 p.
University of Florida, 1996, Florida estimates of population1995: Gainesville, University of Florida, College of Business Administration, Bureau of Economic and Business Research, 60 p.
———1997, 1997 Florida statistical abstract (30th ed.): Gainesville, University of Florida, College of BusinesAdministration, Bureau of Economic and Business Research, 809 p.
Vecchioli, John, and Foose, D.W., 1985, Florida ground-water resources, in the National water summary, 1984-Hydrologic events, selected water quality trends anground-water resources: U.S. Geological Survey Water-Supply Paper 2275, p. 173-178.
Selected References 43
in
ter g-
,
in
,
0:
.): 6,
or-ap
ct
t --3,
e
ic ia,
ct
st
Florida
Conover, C.S., Vecchioli, John, and Foose, D.W., 1989, Ground-water sources and withdrawals for 1985: Talla-hassee, Florida Bureau of Geology Map Series 124, 1 sheet.
Healy, H.G., 1972, Public water supplies of selected munic-ipalities in Florida, 1970: Tallahassee, Florida Bureau of Geology Information Circular no. 81, 213 p.
———1977, Public water supplies of selected municipali-ties in Florida, 1975: U.S. Geological Survey Water-Resources Investigations Report 77-53, 309 p.
Leach, S.D., 1978, Source, use, and disposition of water in Florida, 1975: U.S. Geological Survey Water-Resources Investigations 78-17, 90 p.
———1978, Freshwater use in Florida, 1975: Tallahassee, Florida Bureau of Geology Map Series 87, 1 sheet.
———1982, Estimated water use in Florida, 1980: Tallahas-see, Florida Bureau of Geology Map Series 103, 1 sheet.
———1982, Consumptive use of freshwater in Florida, 1980: Tallahassee, Florida Bureau of Geology Map Series 105, 1 sheet.
———1983, Source, use, and disposition of water in Flor-ida, 1980: U.S. Geological Survey Water-Resources Investigations 82-4090, 337 p.
———1984, Projected public supply and rural (self-sup-plied) water use in Florida through the year 2020: Tallahassee, Florida Bureau of Geology Map Series 108, 1 sheet.
Leach, S.D., and Healy, H.G., 1980, Estimated water use in Florida, 1977, U.S. Geological Survey Water-Resources Investigations Report 79-112, 76 p.
Marella, R.L., 1988, Water withdrawals, use and trends in Florida, 1985: U.S. Geological Survey Water-Resources Investigations Report 88-4103, 43 p.
———1989, Freshwater withdrawals, water-use trends in Florida, 1985: Tallahassee, Florida Bureau of Geology Map Series 123, 1 sheet.
———1990, Florida water supply and use, in the National water summary 1987--Hydrologic events and water supply and use: U.S. Geological Survey Water-Supply Paper 2350, p. 207-214.
———1990, Public supply water use in Florida, 1987: U.S. Geological Survey Open-File Report 90-596, 39 p.
———1992, Factors that affect public-supply water use in Florida, with a section on projected water use to the year 2020: U.S. Geological Survey Water-Resources Investigations Report 91-4123, 35 p.
———1993, Public supply water use in Florida, 1990: U.S. Geological Survey Open-File Report 93-134, 46 p.
———1994, Estimated discharge of treated wastewater Florida, 1990: U.S. Geological Survey Open-File Report 93-364, 53 p.
———1995, Water-use data by category, county, and wamanagement district in Florida, 1950-90: U.S. Geoloical Survey Open-File Report 94-521, 114 p.
———1997, Freshwater withdrawals, water-use trends inFlorida, 1990: Tallahassee, Florida Department of Environmental Protection, Florida Geological SurveyMap Series 141, 1 sheet.
———1997 Irrigated crop acreage and water withdrawalsFlorida, 1990: Tallahassee, Florida Department of Environmental Protection, Florida Geological SurveyMap Series 143, 1 sheet.
Pride, R.W., 1973, Estimated use of water in Florida, 197Tallahassee, Florida Bureau of Geology Information Circular 83, 31 p.
———1975, Estimated water use in Florida, 1965 (2d edTallahassee, Florida Bureau of Geology Map Series 31 sheet.
Spechler, R.M., 1983, Estimated irrigation water use in Flida, 1980: Tallahassee, Florida Bureau of Geology MSeries 106, 1 sheet.
Northwest Florida Water Management District
Bielby, Camille, 1987, 1985 Annual water use survey: Havana, Northwest Florida Water Management DistriProgram Development Series 87-1, 107 p.
Kranzer, B.S., 1983, Water use in the Northwest Florida Water Management District, an examination of currenand past use: Havana, Northwest Florida Water Management District Water Resources Special Report 8347 p.
Marella, R.L., Mokray, M.F., and Hallock-Solomon, M.J., 1998, Water use trends and demand projections in thNorthwest Florida Water Management District: U.S. Geological Survey Open-File Report 98-269, 37 p.
Northwest Florida Water Management District, 1981, Publwater supply systems in the coastal areas of EscambSanta Rosa, Okaloosa, Bay, and Walton Counties: Havana, Northwest Florida Water Management DistriWater Resources Special Report 83-1, 153 p.
———1996, 1995 Annual reuse report: Havana, NorthweFlorida Water Management District, 29 p.
———1998, District Water Supply Assessment: Havana,Northwest Florida Water Management District WaterResources Assessment 98-2, 143 p.
WATER-USE BIBLIOGRAPHY FOR FLORIDA
44 Water Withdrawals, Use, Discharge, and Trends in Florida, 1995
l
l
i-
.
l
ka, l
t.
f f
ct, n
h,
st ct,
: t
Richards, C.J., 1993, Historical water use and projected demands for southeastern Santa Rosa County: Havana, Northwest Florida Water Management District Water Resources Technical File Report 93-1, 33 p.
St. Johns River Water Management District
Florence, B.L., 1990, Annual water use survey: 1988: Palatka, St. Johns River Water Management District Technical Publication SJ 90-12, 128 p.
———1991, Annual water use survey: 1989: Palatka, St. Johns River Water Management District Technical Publication SJ 91-6, 126 p.
———1992, Annual water use survey: 1990: Palatka, St. Johns River Water Management District Technical Publication SJ 92-4, 122 p.
———1994, Annual water use survey; 1991: Palatka, St. Johns River Water Management District Technical Publication SJ 94-4, 130 p.
———1995, Annual water use survey: 1992: Palatka, St. Johns River Water Management District Technical Publication SJ 95-2, 128 p.
———1996, Annual water use survey: 1993: Palatka, St. Johns River Water Management District Technical Publication SJ 96-1, 128 p.
———1996, Annual water use survey: 1994: Palatka, St. Johns River Water Management District Technical Publication SJ 96-3, 126 p.
Florence, B.L., and Moore, Cynthia, 1997, Annual water use survey; 1995: Palatka, St. Johns River Water Manage-ment District Technical Publication SJ 97-4, 128 p.
Lewis, Kathryn, Carriker, Roy, and Marella, R.L., 1981, Analysis of residential demand for water in the St. Johns River Water Management District: Palatka, St. Johns River Water Management District Technical Publication SJ 81-2, 107 p.
Marella, R.L., 1981, Annual water use survey; 1979: Palatka, St. Johns River Water Management District Technical Publication SJ 81-3, 127
———1982, Annual water use survey; 1980: Palatka, St. Johns River Water Management District Technical Publication SJ 82-5, 107 p
———1983, Annual water use survey; 1981: Palatka, St. Johns River Water Management District Technical Publication SJ 83-9, 107 p.
———1984, Annual water use survey; 1982: Palatka, St. Johns River Water Management District Technical Publication SJ 84-2, 97 p.
———1984, Annual water use survey; 1983: Palatka, St. Johns River Water Management District Technical Publication SJ 84-5, 103 p.
———1985, Annual water use survey; 1984: Palatka, St. Johns River Water Management District TechnicaPublication SJ 85-7, 113 p.
———1986, Annual water use survey; 1985: Palatka, St. Johns River Water Management District TechnicaPublication SJ 86-5, 117 p.
———1987, Annual water use survey; 1980 Revised Edtion: Palatka, St. Johns River Water Management District Technical Publication SJ 82-5, 55 p.
———1988, Annual water use survey; 1986: Palatka, StJohns River Water Management District Technical Publication SJ 88-7, 128 p.
———1990, Annual water use survey; 1987: Palatka, St. Johns River Water Management District TechnicaPublication SJ 90-4, 126 p.
Scott, Elaine, 1980, Annual water use survey; 1978: PalatSt. Johns River Water Management District TechnicaPublication SJ 80-5, 107 p.
St. Johns River Water Management District, 1996, 1995 Annual reuse report: Palatka, St. Johns River Water Management District, 29 p.
———1998, Water supply assessment, 1998: Palatka, SJohns River Water Management District Technical Publication SJ 98-2, 154 p.
South Florida Water Management District
Alvarez, J.A., and Bacon, D.D., 1988, Production zones omajor public water supply wellfields for the counties othe South Florida Water Management District: West Palm Beach, South Florida Water Management DistriResource Planning Department, Technical Publicatio88-4, Appendix II, 17 p.
South Florida Water Management District, 1992, Water supply needs and sources 1990-2010: West Palm Beach, South Florida Water Management District, Planning Department, 204 p.
———1996, 1995 Annual reuse report: West Palm BeacSouth Florida Water Management District, Planning Department, 35 p.
——— 1998, Districtwide Water Supply Assessment: WePalm Beach, South Florida Water Management Distri249 p.
Woehlcke, L.C., Bucca, Jane, and Loving, D.R., 1982, A potable water use data base for South Florida, 1980West Palm Beach, South Florida Water ManagemenDistrict, Planning Department, Technical Memoran-dum, 23 p.
Water-Use Bibliography for Florida 45
st ,
a -
a -
e , -
r e-
ee
od nt
n
m in
-
Southwest Florida Water Management District
Duerr, A.D., and Sohm, J.E., 1983, Estimated water use in Southwest Florida, 1981, and summary of annual water use, 1970, 1975, and 1977-81: U.S. Geological Survey Open-File Report 83-45, 75 p.
Duerr, A.D., and Trommer, J.T., 1981, Estimated water use in the Southwest Florida Water Management District and adjacent areas, 1979: U.S. Geological Survey Open-File Report 81-56, 58 p.
———1981, Estimated water use in the Southwest Florida Water Management District and adjacent areas, 1980: U.S. Geological Survey Open-File Report 81-1060, 60 p.
———1982, The benchmark farm program--a method for estimated irrigation water use in Southwest Florida: U.S. Geological Survey Water-Resources Investigations Report 82-17, 49 p.
Sorensen, L.A., 1992, 1989 and 1990 Estimated water use in the Southwest Florida Water Management District: Brooksville, Southwest Florida Water Management District, Planning Department, 132 p.
Sorensen, L.A., Burns, L.L., Miles, D.M., Norris, Henry, and Tuttell, Maryellen, 1990, 1988 Estimated water use in the Southwest Florida Water Management District: Brooksville, Southwest Florida Water Management District, Planning Department, 96 p.
Southwest Florida Water Management District, 1984, Esti-mated water use in the Southwest Florida Water Man-agement District, 1982: Brooksville, Southwest Florida Water Management District Planning and Performance Evaluation Section, 20 p.
———1994, Estimated water use in the Southwest Florida Water Management District, 1991 and 1992: Brooks-ville, Resource Projects Department, Conservation Projects Section, 109 p.
———1995, 1993 Estimated water use in the Southwest Florida Water Management District: Brooksville, Resource Projects Department, Conservation Projects Section, 111 p.
———1996, 1994 Estimated water use in the Southwest Florida Water Management District: Brooksville, Resource Projects Department, Conservation Projects Section, 111 p.
———1996, 1995 Annual reuse report: Brooksville, Resource Projects Department, Conservation Projects Section, 31 p.
———1997, 1995 Estimated water use in the Southwest Florida Water Management District: Brooksville, Resource Projects Department, Conservation Projects Section, 54 p.
———1998, Southwest Florida Water Management District water supply assessment 1995-2020: Brooksville, Resource Projects Department, 48 p.
Stieglitz, E.H., 1985, Estimated water use in the SouthweFlorida Water Management District, 1983: BrooksvilleSouthwest Florida Water Management District, Plan-ning Department, 33 p.
———1985, Estimated water use in the Southwest FloridWater Management District, 1984: Brooksville, Southwest Florida Water Management District, Planning Department, 44 p.
———1986, Estimated water use in the Southwest FloridWater Management District, 1985: Brooksville, Southwest Florida Water Management District, Planning Department, 53 p.
Stieglitz, E.H., and Tomik, K.E., 1987, Estimated water usin the Southwest Florida Water Management District1986: Brooksville, Southwest Florida Water Management District, Planning Department, 57 p.
Tuttell, Maryellen, and Sorensen, L.A., 1989, 1987 Esti-mated water use in the Southwest Florida Water Management District: Brooksville, Southwest FloridaWater Management District, Planning Department, 99 p.
Suwannee River Water Management District
Suwannee River Water Management District, 1979, Wateuse, 1977: Live Oak, Suwannee River Water Managment District Information Circular #7, 47 p.
———1998, Water supply assessment: Live Oak, SuwannRiver Water Management District, 35.
Additional Water-Use Reports or Papers
Betz, J.V., 1984, Chapter 8, Water Use, in Fernald, E.A., and Purdum, E.D., eds., Water resource atlas of Florida: Tallahassee, Florida State University, Institute of Science and Public Affairs, p. 108-115.
Bucca, Jane, and Marella, R.L., 1992, An improved methfor determining the nonresidential water use componeof total public water supply estimates, in Jones, M.E., and Laenen, Antonius (eds.), Interdisciplinary approaches in hydrology and hydrogeology: AmericaInstitute of Hydrology, p. 511-523.
Duerr, A.D., and Trommer, J.T., 1982, The benchmark farprogram--a method for estimated irrigation water usesouthwest Florida: U.S. Geological Survey Water-Resources Investigations Report 82-17, 49 p.
Dykes, G.M., and Conlon, W.J., 1989, Use of membranetechnology in Florida: American Water Works Association Journal, v. 81, no. 11, November, p. 43-46.
46 Water Withdrawals, Use, Discharge, and Trends in Florida, 1995
ge-nt
ee-r
es
te-er-
e,
Fanning, J.L., 1997, Water use in Georgia by county for 1995: Atlanta, Georgia Department of Natural Resources, Environmental Protection Division, Geor-gia Geological Survey, Information Circular 101, 95 p.
Franks, B.J., 1981, Land application of domestic wastewater in Florida--Statewide assessment of impact on ground-water quality: U.S. Geological Survey Water-Resources Investigations Report 81-3, 37 p.
Harrison, D.S., Smajstrla, A.G., Choate, R.E., and Isaacs, G.W., 1983, Irrigation in Florida Agriculture in the 80’s: Gainesville, University of Florida, Institute of Food and Agricultural Sciences, Bulletin 196, 10 p.
Holland, T.W., 1992, Water-use data collection techniques in the southeastern United States, Puerto Rico, and the U.S. Virgin Islands: U.S. Geological Survey Water-Resources Investigations Report 92-4028, 76 p.
Hughes, G.H., 1975, Perspective on use of freshwater for cooling systems of thermoelectric powerplants in Florida: U.S. Geological Survey Water-Resources Investigations Report 43-75, 30 p.
Marella, R.L., 1983, Ground-water withdrawals from the Floridan aquifer in Duval County--1980: Palatka, St. Johns River Water Management District Technical Publication SJ 83-7, 1 sheet.
———1984, Ground-water withdrawals from the Floridan aquifer in the Nassau County Area: Palatka, St. Johns River Water Management District Map Series 84-4, 1 sheet.
———1984, Ground-water withdrawals from the Floridan Aquifer in the Clay and portions of Bradford Counties: Palatka, St. Johns River Water Management District Map Series 84-14, 1 sheet.
———1987, Water use, in the Indian River Lagoon Joint Reconnaissance Report, St. Johns River Water Manament District and the South Florida Water ManagemeDistrict, November 1987, chap. 8, p. 8-1 to 8-9.
———1998, Water Quality Assessment of Southern Florida--Wastewater discharges and runoff: U.S. Geological Survey Fact Sheet 032-98, 6 p.
Marella, R.L., Fanning, J.L., and Mooty, W.S., 1993, Esti-mated use of water in the Apalachicola-ChattahoochFlint River basin during 1990, with State summaries fo1970 to 1990: U.S. Geological Survey Water-ResourcInvestigations Report 93-4084, 45 p.
Marella, R.L., and Fanning, J.L., 1996, National Water Quality Assessment of the Georgia-Florida Coastal Plain study unit--Water withdrawals and treated waswater discharges, 1990: U.S. Geological Survey WatResources Investigations Report 95-4084, 76 p.
Marella, R.L., and York, D.W., 1998, Chapter 6, Water Usin Fernald, E.A., and Purdum, E.D., eds., Water resource atlas of Florida: Tallahassee, Florida State University, Institute of Science and Public Affairs, p. 114-135.
Miller, M.L., and Alvarez, J.A., 1984, Public-supply wateruse, Palm Beach County, Florida, 1978-82: U.S. Geological Survey Open-File Report 84-240, 14 p.
Mooty, W.S., and Richardson, J.R., 1998, Water use in Alabama, 1995: U.S. Geological Survey Water Resources Investigations Report 98-4154, 92 p.
O'Donnell, T.H., 1977, Municipal water suppliers in Lee County, 1974: U.S. Geological Survey Open-File Report 77-277, 96 p.
Water-Use Bibliography for Florida 47

APPENDIX I
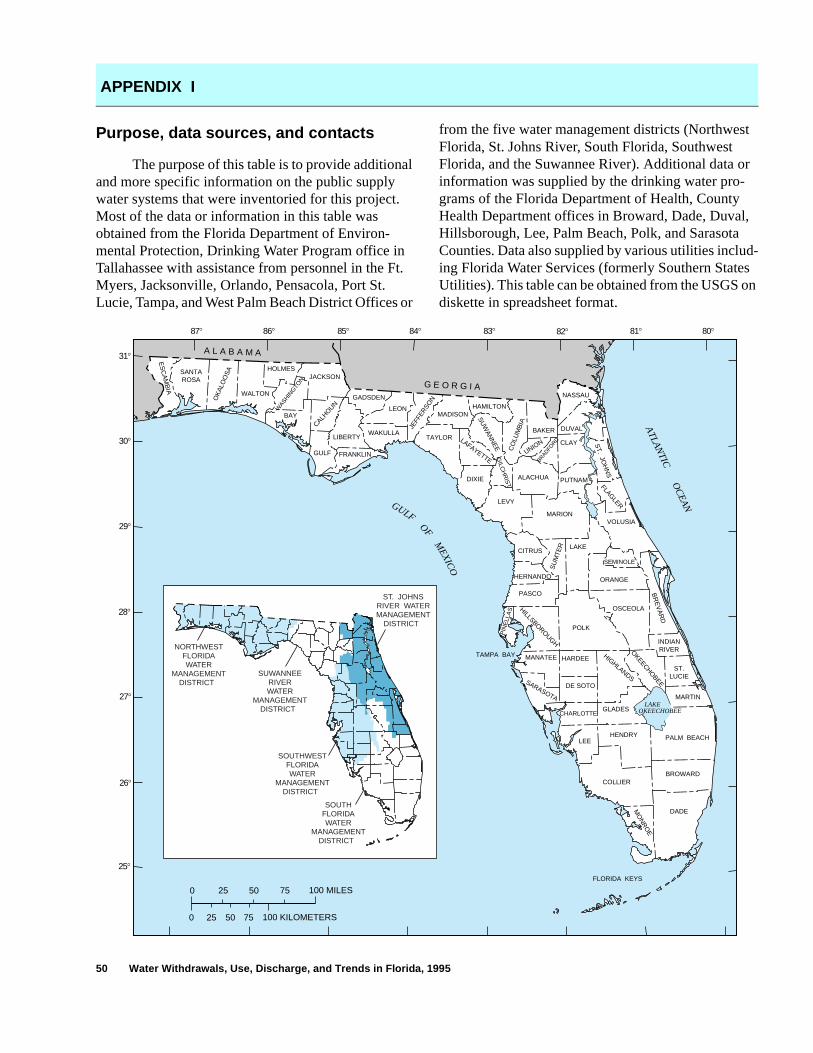
50 Water Withdrawals, Use, Discharge, and Trends in Florida, 1995
Purpose, data sources, and contacts
The purpose of this table is to provide additional and more specific information on the public supply water systems that were inventoried for this project. Most of the data or information in this table was obtained from the Florida Department of Environ-mental Protection, Drinking Water Program office in Tallahassee with assistance from personnel in the Ft. Myers, Jacksonville, Orlando, Pensacola, Port St. Lucie, Tampa, and West Palm Beach District Offices or
from the five water management districts (Northwest Florida, St. Johns River, South Florida, Southwest Florida, and the Suwannee River). Additional data or information was supplied by the drinking water pro-grams of the Florida Department of Health, County Health Department offices in Broward, Dade, Duval, Hillsborough, Lee, Palm Beach, Polk, and Sarasota Counties. Data also supplied by various utilities includ-ing Florida Water Services (formerly Southern States Utilities). This table can be obtained from the USGS on diskette in spreadsheet format.
APPENDIX I
A L A B A M A
G E O R G I A
100 MILES25 50 750
25 100 KILOMETERS50 750
31
30
29
28
27
26
25
87 86 85 84 83 82 81 80
ES
CA
MB
IA
TAMPA BAY
LAKEOKEECHOBEE
FLORIDA KEYS
HILLSBOROUGH
BR
EV
AR
D
JEFF
ERSO
NOK
ALO
OS
A
SU
WA
NN
EE C
OLU
MB
IA
UNION
FLAGLER
SU
MTE
R
HIGHLANDSSARASOTA
OKEECHO
BEE
MO
NR
OE
PIN
ELL
AS
INDIANRIVER
LEE
ORANGE
PASCO
OSCEOLA
LAKE
BAKER
MARION
CLAY
DUVAL
NASSAU
PUTNAMALACHUA
SANTAROSA
WALTON
HOLMES
BAY
JACKSON
GADSDEN
GULF FRANKLIN
LIBERTYWAKULLA
LEONMADISON
HAMILTON
TAYLOR
DIXIE
LEVY
VOLUSIA
CITRUS
HERNANDO
SEMINOLE
POLK
HARDEE
DE SOTO
ST.LUCIE
MARTIN
MANATEE
GLADES
HENDRY PALM BEACH
BROWARDCOLLIER
DADE
CHARLOTTE
WASHIN
GTO
N
CALHOUN
LAFAYETTE GILC
HR
IST
BRADFORD S
T. JOH
NS
ATLA
NTIC
OC
EA
NGULF
OFM
EXICO
SUWANNEERIVERWATER
MANAGEMENTDISTRICT
NORTHWESTFLORIDAWATER
MANAGEMENTDISTRICT
SOUTHWESTFLORIDAWATER
MANAGEMENTDISTRICT
ST. JOHNSRIVER WATERMANAGEMENT
DISTRICT
SOUTHFLORIDAWATER
MANAGEMENTDISTRICT
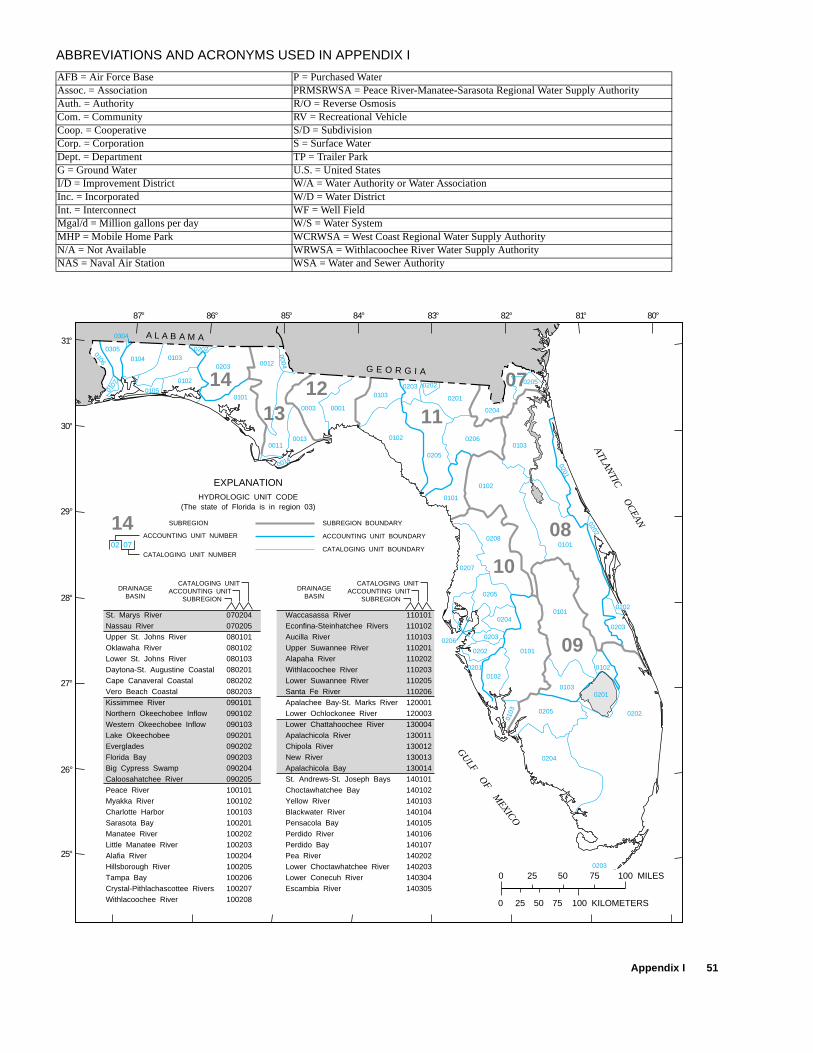
Appendix I 51
ABBREVIATIONS AND ACRONYMS USED IN APPENDIX I
AFB = Air Force Base P = Purchased WaterAssoc. = Association PRMSRWSA = Peace River-Manatee-Sarasota Regional Water Supply AuthorityAuth. = Authority R/O = Reverse OsmosisCom. = Community RV = Recreational VehicleCoop. = Cooperative S/D = SubdivisionCorp. = Corporation S = Surface WaterDept. = Department TP = Trailer ParkG = Ground Water U.S. = United StatesI/D = Improvement District W/A = Water Authority or Water AssociationInc. = Incorporated W/D = Water DistrictInt. = Interconnect WF = Well FieldMgal/d = Million gallons per day W/S = Water SystemMHP = Mobile Home Park WCRWSA = West Coast Regional Water Supply AuthorityN/A = Not Available WRWSA = Withlacoochee River Water Supply AuthorityNAS = Naval Air Station WSA = Water and Sewer Authority
09
08
10
07
111214
130101
0003 0001
0103
0102
0101
0101
0103
0103
01020102
0101
0102
0103
0101
0201
02020205
0204
0203
0208
0207
0205
0204
0203
0202
0201
0202
0203 0202
0201
0204
0205
0205
0206
0105
0102
0012
0011
0014
0203
0013
0004
01030203
0202
0104
03050106
0107
14 SUBREGION
CATALOGING UNIT NUMBER
ACCOUNTING UNIT NUMBER
02 07
HYDROLOGIC UNIT CODE(The state of Florida is in region 03)
SUBREGION BOUNDARY
ACCOUNTING UNIT BOUNDARY
CATALOGING UNIT BOUNDARY
EXPLANATION
A L A B A M A
G E O R G I A
31°
30°
29°
28°
27°
26°
25°
87° 86° 85° 84° 83° 82° 81° 80°
0304
GU
LF OF M
EXICO
ATLANTIC
OC
EAN
Waccasassa RiverEconfina-Steinhatchee RiversAucilla RiverUpper Suwannee RiverAlapaha RiverWithlacoochee RiverLower Suwannee RiverSanta Fe RiverApalachee Bay-St. Marks RiverLower Ochlockonee RiverLower Chattahoochee RiverApalachicola RiverChipola RiverNew RiverApalachicola BaySt. Andrews-St. Joseph BaysChoctawhatchee BayYellow RiverBlackwater RiverPensacola BayPerdido RiverPerdido BayPea RiverLower Choctawhatchee RiverLower Conecuh RiverEscambia River
St. Marys RiverNassau RiverUpper St. Johns RiverOklawaha RiverLower St. Johns RiverDaytona-St. Augustine CoastalCape Canaveral CoastalVero Beach CoastalKissimmee RiverNorthern Okeechobee InflowWestern Okeechobee InflowLake OkeechobeeEvergladesFlorida BayBig Cypress SwampCaloosahatchee RiverPeace RiverMyakka RiverCharlotte HarborSarasota BayManatee RiverLittle Manatee RiverAlafia RiverHillsborough RiverTampa BayCrystal-Pithlachascottee RiversWithlacoochee River
110101110102110103110201110202110203110205110206120001120003130004130011130012130013130014140101140102140103140104140105140106140107140202140203140304140305
070204070205080101080102080103080201080202080203090101090102090103090201090202090203090204090205100101100102100103100201100202100203100204100205100206100207100208
SUBREGION
DRAINAGEBASIN
CATALOGING UNITACCOUNTING UNIT
SUBREGION
DRAINAGEBASIN
CATALOGING UNITACCOUNTING UNIT
100 MILES25 50 750
25 100 KILOMETERS50 750
0201
0206
0202
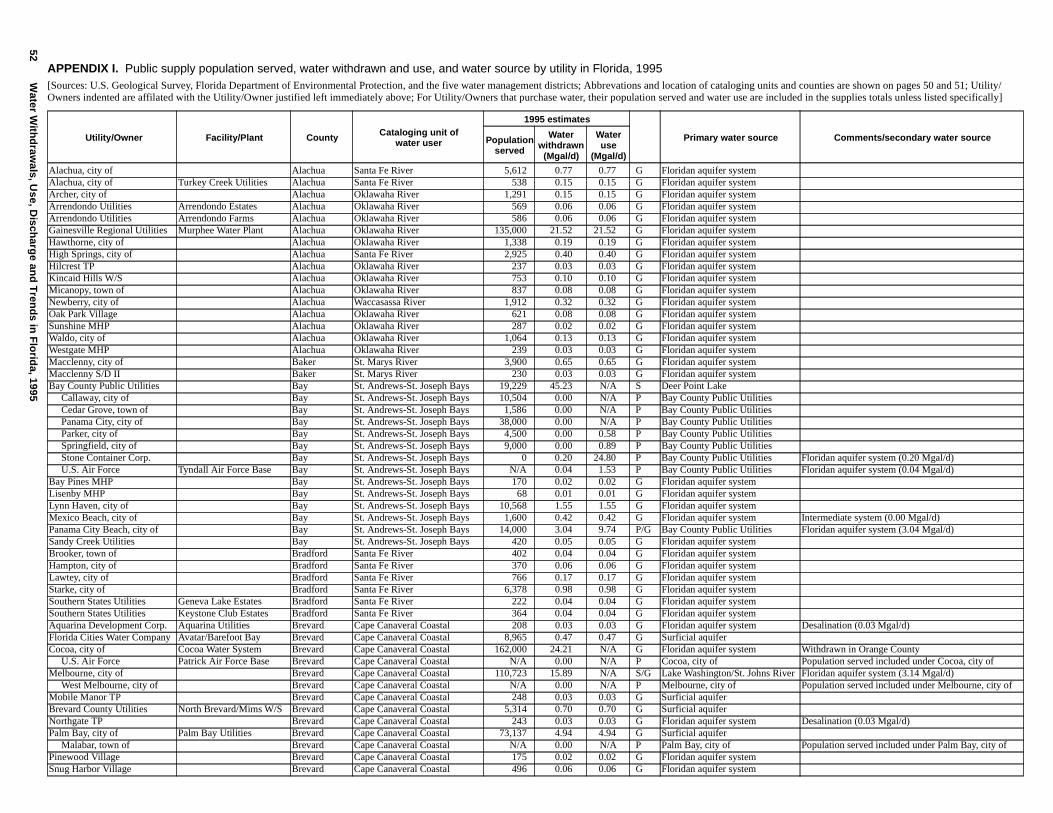
52W
ater With
draw
als, Use, D
ischarg
e and
Tren
ds in
Flo
rida, 1995
APPENDIX I. Public supply population served, water withdrawn and use, and water source by utility in Florida, 1995[Sources: U.S. Geological Survey, Florida Department of Environmental Protection, and the five water management districts; Abbrevations and location of cataloging units and counties are shown on pages 50 and 51; Utility/Owners indented are affilated with the Utility/Owner justified left immediately above; For Utility/Owners that purchase water, their population served and water use are included in the supplies totals unless listed specifically]
Utility/Owner Facility/Plant County Cataloging unit of water user
1995 estimates
Primary water source Comments/secondary water source Populationserved
Waterwithdrawn
(Mgal/d)
Wateruse
(Mgal/d)
Alachua, city of Alachua Santa Fe River 5,612 0.77 0.77 G Floridan aquifer systemAlachua, city of Turkey Creek Utilities Alachua Santa Fe River 538 0.15 0.15 G Floridan aquifer systemArcher, city of Alachua Oklawaha River 1,291 0.15 0.15 G Floridan aquifer systemArrendondo Utilities Arrendondo Estates Alachua Oklawaha River 569 0.06 0.06 G Floridan aquifer systemArrendondo Utilities Arrendondo Farms Alachua Oklawaha River 586 0.06 0.06 G Floridan aquifer systemGainesville Regional Utilities Murphee Water Plant Alachua Oklawaha River 135,000 21.52 21.52 G Floridan aquifer systemHawthorne, city of Alachua Oklawaha River 1,338 0.19 0.19 G Floridan aquifer systemHigh Springs, city of Alachua Santa Fe River 2,925 0.40 0.40 G Floridan aquifer systemHilcrest TP Alachua Oklawaha River 237 0.03 0.03 G Floridan aquifer systemKincaid Hills W/S Alachua Oklawaha River 753 0.10 0.10 G Floridan aquifer systemMicanopy, town of Alachua Oklawaha River 837 0.08 0.08 G Floridan aquifer systemNewberry, city of Alachua Waccasassa River 1,912 0.32 0.32 G Floridan aquifer systemOak Park Village Alachua Oklawaha River 621 0.08 0.08 G Floridan aquifer systemSunshine MHP Alachua Oklawaha River 287 0.02 0.02 G Floridan aquifer systemWaldo, city of Alachua Oklawaha River 1,064 0.13 0.13 G Floridan aquifer systemWestgate MHP Alachua Oklawaha River 239 0.03 0.03 G Floridan aquifer systemMacclenny, city of Baker St. Marys River 3,900 0.65 0.65 G Floridan aquifer systemMacclenny S/D II Baker St. Marys River 230 0.03 0.03 G Floridan aquifer systemBay County Public Utilities Bay St. Andrews-St. Joseph Bays 19,229 45.23 N/A S Deer Point Lake Callaway, city of Bay St. Andrews-St. Joseph Bays 10,504 0.00 N/A P Bay County Public Utilities Cedar Grove, town of Bay St. Andrews-St. Joseph Bays 1,586 0.00 N/A P Bay County Public Utilities Panama City, city of Bay St. Andrews-St. Joseph Bays 38,000 0.00 N/A P Bay County Public Utilities Parker, city of Bay St. Andrews-St. Joseph Bays 4,500 0.00 0.58 P Bay County Public Utilities Springfield, city of Bay St. Andrews-St. Joseph Bays 9,000 0.00 0.89 P Bay County Public Utilities Stone Container Corp. Bay St. Andrews-St. Joseph Bays 0 0.20 24.80 P Bay County Public Utilities Floridan aquifer system (0.20 Mgal/d) U.S. Air Force Tyndall Air Force Base Bay St. Andrews-St. Joseph Bays N/A 0.04 1.53 P Bay County Public Utilities Floridan aquifer system (0.04 Mgal/d)Bay Pines MHP Bay St. Andrews-St. Joseph Bays 170 0.02 0.02 G Floridan aquifer systemLisenby MHP Bay St. Andrews-St. Joseph Bays 68 0.01 0.01 G Floridan aquifer systemLynn Haven, city of Bay St. Andrews-St. Joseph Bays 10,568 1.55 1.55 G Floridan aquifer systemMexico Beach, city of Bay St. Andrews-St. Joseph Bays 1,600 0.42 0.42 G Floridan aquifer system Intermediate system (0.00 Mgal/d)Panama City Beach, city of Bay St. Andrews-St. Joseph Bays 14,000 3.04 9.74 P/G Bay County Public Utilities Floridan aquifer system (3.04 Mgal/d)Sandy Creek Utilities Bay St. Andrews-St. Joseph Bays 420 0.05 0.05 G Floridan aquifer systemBrooker, town of Bradford Santa Fe River 402 0.04 0.04 G Floridan aquifer systemHampton, city of Bradford Santa Fe River 370 0.06 0.06 G Floridan aquifer systemLawtey, city of Bradford Santa Fe River 766 0.17 0.17 G Floridan aquifer systemStarke, city of Bradford Santa Fe River 6,378 0.98 0.98 G Floridan aquifer systemSouthern States Utilities Geneva Lake Estates Bradford Santa Fe River 222 0.04 0.04 G Floridan aquifer systemSouthern States Utilities Keystone Club Estates Bradford Santa Fe River 364 0.04 0.04 G Floridan aquifer systemAquarina Development Corp. Aquarina Utilities Brevard Cape Canaveral Coastal 208 0.03 0.03 G Floridan aquifer system Desalination (0.03 Mgal/d)Florida Cities Water Company Avatar/Barefoot Bay Brevard Cape Canaveral Coastal 8,965 0.47 0.47 G Surficial aquiferCocoa, city of Cocoa Water System Brevard Cape Canaveral Coastal 162,000 24.21 N/A G Floridan aquifer system Withdrawn in Orange County U.S. Air Force Patrick Air Force Base Brevard Cape Canaveral Coastal N/A 0.00 N/A P Cocoa, city of Population served included under Cocoa, city ofMelbourne, city of Brevard Cape Canaveral Coastal 110,723 15.89 N/A S/G Lake Washington/St. Johns River Floridan aquifer system (3.14 Mgal/d) West Melbourne, city of Brevard Cape Canaveral Coastal N/A 0.00 N/A P Melbourne, city of Population served included under Melbourne, city ofMobile Manor TP Brevard Cape Canaveral Coastal 248 0.03 0.03 G Surficial aquiferBrevard County Utilities North Brevard/Mims W/S Brevard Cape Canaveral Coastal 5,314 0.70 0.70 G Surficial aquiferNorthgate TP Brevard Cape Canaveral Coastal 243 0.03 0.03 G Floridan aquifer system Desalination (0.03 Mgal/d)Palm Bay, city of Palm Bay Utilities Brevard Cape Canaveral Coastal 73,137 4.94 4.94 G Surficial aquifer Malabar, town of Brevard Cape Canaveral Coastal N/A 0.00 N/A P Palm Bay, city of Population served included under Palm Bay, city ofPinewood Village Brevard Cape Canaveral Coastal 175 0.02 0.02 G Floridan aquifer systemSnug Harbor Village Brevard Cape Canaveral Coastal 496 0.06 0.06 G Floridan aquifer system
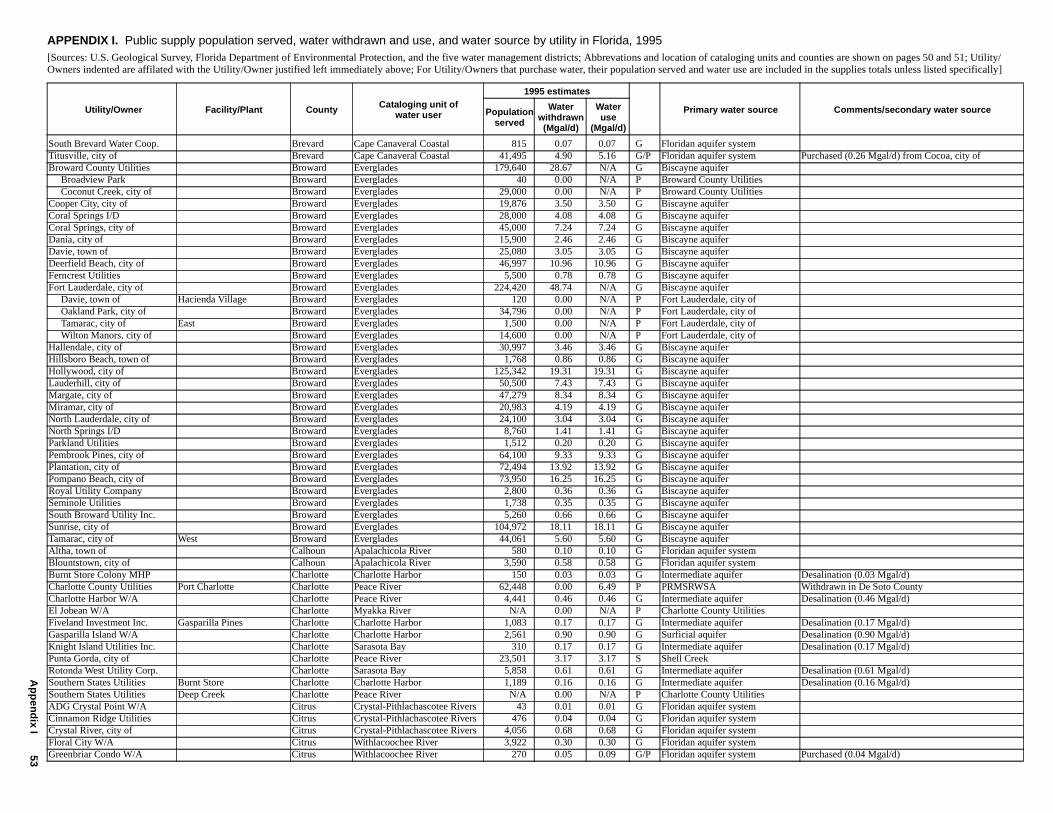
Ap
pen
dix I
53
South Brevard Water Coop. Brevard Cape Canaveral Coastal 815 0.07 0.07 G Floridan aquifer systemTitusville, city of Brevard Cape Canaveral Coastal 41,495 4.90 5.16 G/P Floridan aquifer system Purchased (0.26 Mgal/d) from Cocoa, city ofBroward County Utilities Broward Everglades 179,640 28.67 N/A G Biscayne aquifer Broadview Park Broward Everglades 40 0.00 N/A P Broward County Utilities Coconut Creek, city of Broward Everglades 29,000 0.00 N/A P Broward County UtilitiesCooper City, city of Broward Everglades 19,876 3.50 3.50 G Biscayne aquiferCoral Springs I/D Broward Everglades 28,000 4.08 4.08 G Biscayne aquiferCoral Springs, city of Broward Everglades 45,000 7.24 7.24 G Biscayne aquiferDania, city of Broward Everglades 15,900 2.46 2.46 G Biscayne aquiferDavie, town of Broward Everglades 25,080 3.05 3.05 G Biscayne aquiferDeerfield Beach, city of Broward Everglades 46,997 10.96 10.96 G Biscayne aquiferFerncrest Utilities Broward Everglades 5,500 0.78 0.78 G Biscayne aquiferFort Lauderdale, city of Broward Everglades 224,420 48.74 N/A G Biscayne aquifer Davie, town of Hacienda Village Broward Everglades 120 0.00 N/A P Fort Lauderdale, city of Oakland Park, city of Broward Everglades 34,796 0.00 N/A P Fort Lauderdale, city of Tamarac, city of East Broward Everglades 1,500 0.00 N/A P Fort Lauderdale, city of Wilton Manors, city of Broward Everglades 14,600 0.00 N/A P Fort Lauderdale, city ofHallendale, city of Broward Everglades 30,997 3.46 3.46 G Biscayne aquiferHillsboro Beach, town of Broward Everglades 1,768 0.86 0.86 G Biscayne aquiferHollywood, city of Broward Everglades 125,342 19.31 19.31 G Biscayne aquiferLauderhill, city of Broward Everglades 50,500 7.43 7.43 G Biscayne aquiferMargate, city of Broward Everglades 47,279 8.34 8.34 G Biscayne aquiferMiramar, city of Broward Everglades 20,983 4.19 4.19 G Biscayne aquiferNorth Lauderdale, city of Broward Everglades 24,100 3.04 3.04 G Biscayne aquiferNorth Springs I/D Broward Everglades 8,760 1.41 1.41 G Biscayne aquiferParkland Utilities Broward Everglades 1,512 0.20 0.20 G Biscayne aquiferPembrook Pines, city of Broward Everglades 64,100 9.33 9.33 G Biscayne aquiferPlantation, city of Broward Everglades 72,494 13.92 13.92 G Biscayne aquiferPompano Beach, city of Broward Everglades 73,950 16.25 16.25 G Biscayne aquiferRoyal Utility Company Broward Everglades 2,800 0.36 0.36 G Biscayne aquiferSeminole Utilities Broward Everglades 1,738 0.35 0.35 G Biscayne aquiferSouth Broward Utility Inc. Broward Everglades 5,260 0.66 0.66 G Biscayne aquiferSunrise, city of Broward Everglades 104,972 18.11 18.11 G Biscayne aquiferTamarac, city of West Broward Everglades 44,061 5.60 5.60 G Biscayne aquiferAltha, town of Calhoun Apalachicola River 580 0.10 0.10 G Floridan aquifer systemBlountstown, city of Calhoun Apalachicola River 3,590 0.58 0.58 G Floridan aquifer systemBurnt Store Colony MHP Charlotte Charlotte Harbor 150 0.03 0.03 G Intermediate aquifer Desalination (0.03 Mgal/d)Charlotte County Utilities Port Charlotte Charlotte Peace River 62,448 0.00 6.49 P PRMSRWSA Withdrawn in De Soto CountyCharlotte Harbor W/A Charlotte Peace River 4,441 0.46 0.46 G Intermediate aquifer Desalination (0.46 Mgal/d)El Jobean W/A Charlotte Myakka River N/A 0.00 N/A P Charlotte County UtilitiesFiveland Investment Inc. Gasparilla Pines Charlotte Charlotte Harbor 1,083 0.17 0.17 G Intermediate aquifer Desalination (0.17 Mgal/d)Gasparilla Island W/A Charlotte Charlotte Harbor 2,561 0.90 0.90 G Surficial aquifer Desalination (0.90 Mgal/d)Knight Island Utilities Inc. Charlotte Sarasota Bay 310 0.17 0.17 G Intermediate aquifer Desalination (0.17 Mgal/d)Punta Gorda, city of Charlotte Peace River 23,501 3.17 3.17 S Shell CreekRotonda West Utility Corp. Charlotte Sarasota Bay 5,858 0.61 0.61 G Intermediate aquifer Desalination (0.61 Mgal/d)Southern States Utilities Burnt Store Charlotte Charlotte Harbor 1,189 0.16 0.16 G Intermediate aquifer Desalination (0.16 Mgal/d)Southern States Utilities Deep Creek Charlotte Peace River N/A 0.00 N/A P Charlotte County UtilitiesADG Crystal Point W/A Citrus Crystal-Pithlachascotee Rivers 43 0.01 0.01 G Floridan aquifer systemCinnamon Ridge Utilities Citrus Crystal-Pithlachascotee Rivers 476 0.04 0.04 G Floridan aquifer systemCrystal River, city of Citrus Crystal-Pithlachascotee Rivers 4,056 0.68 0.68 G Floridan aquifer systemFloral City W/A Citrus Withlacoochee River 3,922 0.30 0.30 G Floridan aquifer systemGreenbriar Condo W/A Citrus Withlacoochee River 270 0.05 0.09 G/P Floridan aquifer system Purchased (0.04 Mgal/d)
APPENDIX I. Public supply population served, water withdrawn and use, and water source by utility in Florida, 1995[Sources: U.S. Geological Survey, Florida Department of Environmental Protection, and the five water management districts; Abbrevations and location of cataloging units and counties are shown on pages 50 and 51; Utility/Owners indented are affilated with the Utility/Owner justified left immediately above; For Utility/Owners that purchase water, their population served and water use are included in the supplies totals unless listed specifically]
Utility/Owner Facility/Plant County Cataloging unit of water user
1995 estimates
Primary water source Comments/secondary water source Populationserved
Waterwithdrawn(Mgal/d)
Wateruse
(Mgal/d)
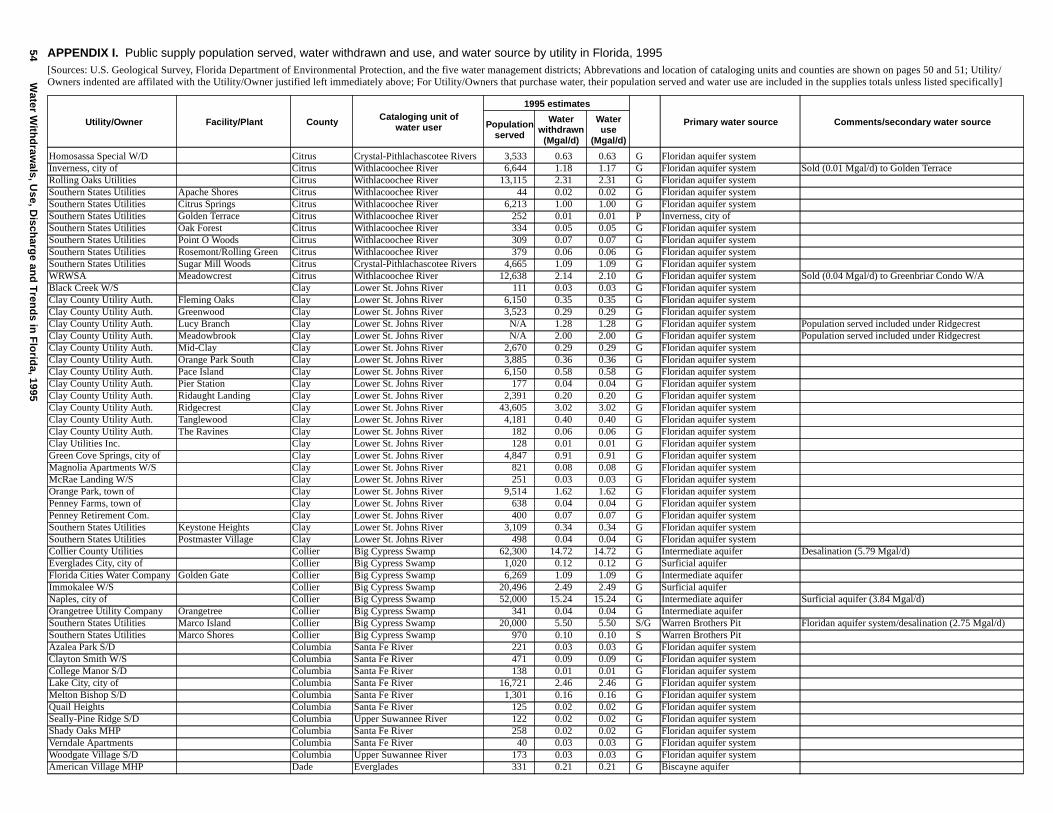
54W
ater With
draw
als, Use, D
ischarg
e and
Tren
ds in
Flo
rida, 1995
Homosassa Special W/D Citrus Crystal-Pithlachascotee Rivers 3,533 0.63 0.63 G Floridan aquifer systemInverness, city of Citrus Withlacoochee River 6,644 1.18 1.17 G Floridan aquifer system Sold (0.01 Mgal/d) to Golden TerraceRolling Oaks Utilities Citrus Withlacoochee River 13,115 2.31 2.31 G Floridan aquifer systemSouthern States Utilities Apache Shores Citrus Withlacoochee River 44 0.02 0.02 G Floridan aquifer systemSouthern States Utilities Citrus Springs Citrus Withlacoochee River 6,213 1.00 1.00 G Floridan aquifer systemSouthern States Utilities Golden Terrace Citrus Withlacoochee River 252 0.01 0.01 P Inverness, city ofSouthern States Utilities Oak Forest Citrus Withlacoochee River 334 0.05 0.05 G Floridan aquifer systemSouthern States Utilities Point O Woods Citrus Withlacoochee River 309 0.07 0.07 G Floridan aquifer systemSouthern States Utilities Rosemont/Rolling Green Citrus Withlacoochee River 379 0.06 0.06 G Floridan aquifer systemSouthern States Utilities Sugar Mill Woods Citrus Crystal-Pithlachascotee Rivers 4,665 1.09 1.09 G Floridan aquifer systemWRWSA Meadowcrest Citrus Withlacoochee River 12,638 2.14 2.10 G Floridan aquifer system Sold (0.04 Mgal/d) to Greenbriar Condo W/ABlack Creek W/S Clay Lower St. Johns River 111 0.03 0.03 G Floridan aquifer systemClay County Utility Auth. Fleming Oaks Clay Lower St. Johns River 6,150 0.35 0.35 G Floridan aquifer systemClay County Utility Auth. Greenwood Clay Lower St. Johns River 3,523 0.29 0.29 G Floridan aquifer systemClay County Utility Auth. Lucy Branch Clay Lower St. Johns River N/A 1.28 1.28 G Floridan aquifer system Population served included under RidgecrestClay County Utility Auth. Meadowbrook Clay Lower St. Johns River N/A 2.00 2.00 G Floridan aquifer system Population served included under RidgecrestClay County Utility Auth. Mid-Clay Clay Lower St. Johns River 2,670 0.29 0.29 G Floridan aquifer systemClay County Utility Auth. Orange Park South Clay Lower St. Johns River 3,885 0.36 0.36 G Floridan aquifer systemClay County Utility Auth. Pace Island Clay Lower St. Johns River 6,150 0.58 0.58 G Floridan aquifer systemClay County Utility Auth. Pier Station Clay Lower St. Johns River 177 0.04 0.04 G Floridan aquifer systemClay County Utility Auth. Ridaught Landing Clay Lower St. Johns River 2,391 0.20 0.20 G Floridan aquifer systemClay County Utility Auth. Ridgecrest Clay Lower St. Johns River 43,605 3.02 3.02 G Floridan aquifer systemClay County Utility Auth. Tanglewood Clay Lower St. Johns River 4,181 0.40 0.40 G Floridan aquifer systemClay County Utility Auth. The Ravines Clay Lower St. Johns River 182 0.06 0.06 G Floridan aquifer systemClay Utilities Inc. Clay Lower St. Johns River 128 0.01 0.01 G Floridan aquifer systemGreen Cove Springs, city of Clay Lower St. Johns River 4,847 0.91 0.91 G Floridan aquifer systemMagnolia Apartments W/S Clay Lower St. Johns River 821 0.08 0.08 G Floridan aquifer systemMcRae Landing W/S Clay Lower St. Johns River 251 0.03 0.03 G Floridan aquifer systemOrange Park, town of Clay Lower St. Johns River 9,514 1.62 1.62 G Floridan aquifer systemPenney Farms, town of Clay Lower St. Johns River 638 0.04 0.04 G Floridan aquifer systemPenney Retirement Com. Clay Lower St. Johns River 400 0.07 0.07 G Floridan aquifer systemSouthern States Utilities Keystone Heights Clay Lower St. Johns River 3,109 0.34 0.34 G Floridan aquifer systemSouthern States Utilities Postmaster Village Clay Lower St. Johns River 498 0.04 0.04 G Floridan aquifer systemCollier County Utilities Collier Big Cypress Swamp 62,300 14.72 14.72 G Intermediate aquifer Desalination (5.79 Mgal/d)Everglades City, city of Collier Big Cypress Swamp 1,020 0.12 0.12 G Surficial aquiferFlorida Cities Water Company Golden Gate Collier Big Cypress Swamp 6,269 1.09 1.09 G Intermediate aquiferImmokalee W/S Collier Big Cypress Swamp 20,496 2.49 2.49 G Surficial aquiferNaples, city of Collier Big Cypress Swamp 52,000 15.24 15.24 G Intermediate aquifer Surficial aquifer (3.84 Mgal/d)Orangetree Utility Company Orangetree Collier Big Cypress Swamp 341 0.04 0.04 G Intermediate aquiferSouthern States Utilities Marco Island Collier Big Cypress Swamp 20,000 5.50 5.50 S/G Warren Brothers Pit Floridan aquifer system/desalination (2.75 Mgal/d)Southern States Utilities Marco Shores Collier Big Cypress Swamp 970 0.10 0.10 S Warren Brothers PitAzalea Park S/D Columbia Santa Fe River 221 0.03 0.03 G Floridan aquifer systemClayton Smith W/S Columbia Santa Fe River 471 0.09 0.09 G Floridan aquifer systemCollege Manor S/D Columbia Santa Fe River 138 0.01 0.01 G Floridan aquifer systemLake City, city of Columbia Santa Fe River 16,721 2.46 2.46 G Floridan aquifer systemMelton Bishop S/D Columbia Santa Fe River 1,301 0.16 0.16 G Floridan aquifer systemQuail Heights Columbia Santa Fe River 125 0.02 0.02 G Floridan aquifer systemSeally-Pine Ridge S/D Columbia Upper Suwannee River 122 0.02 0.02 G Floridan aquifer systemShady Oaks MHP Columbia Santa Fe River 258 0.02 0.02 G Floridan aquifer systemVerndale Apartments Columbia Santa Fe River 40 0.03 0.03 G Floridan aquifer systemWoodgate Village S/D Columbia Upper Suwannee River 173 0.03 0.03 G Floridan aquifer systemAmerican Village MHP Dade Everglades 331 0.21 0.21 G Biscayne aquifer
APPENDIX I. Public supply population served, water withdrawn and use, and water source by utility in Florida, 1995[Sources: U.S. Geological Survey, Florida Department of Environmental Protection, and the five water management districts; Abbrevations and location of cataloging units and counties are shown on pages 50 and 51; Utility/Owners indented are affilated with the Utility/Owner justified left immediately above; For Utility/Owners that purchase water, their population served and water use are included in the supplies totals unless listed specifically]
Utility/Owner Facility/Plant County Cataloging unit of water user
1995 estimates
Primary water source Comments/secondary water source Populationserved
Waterwithdrawn
(Mgal/d)
Wateruse
(Mgal/d)
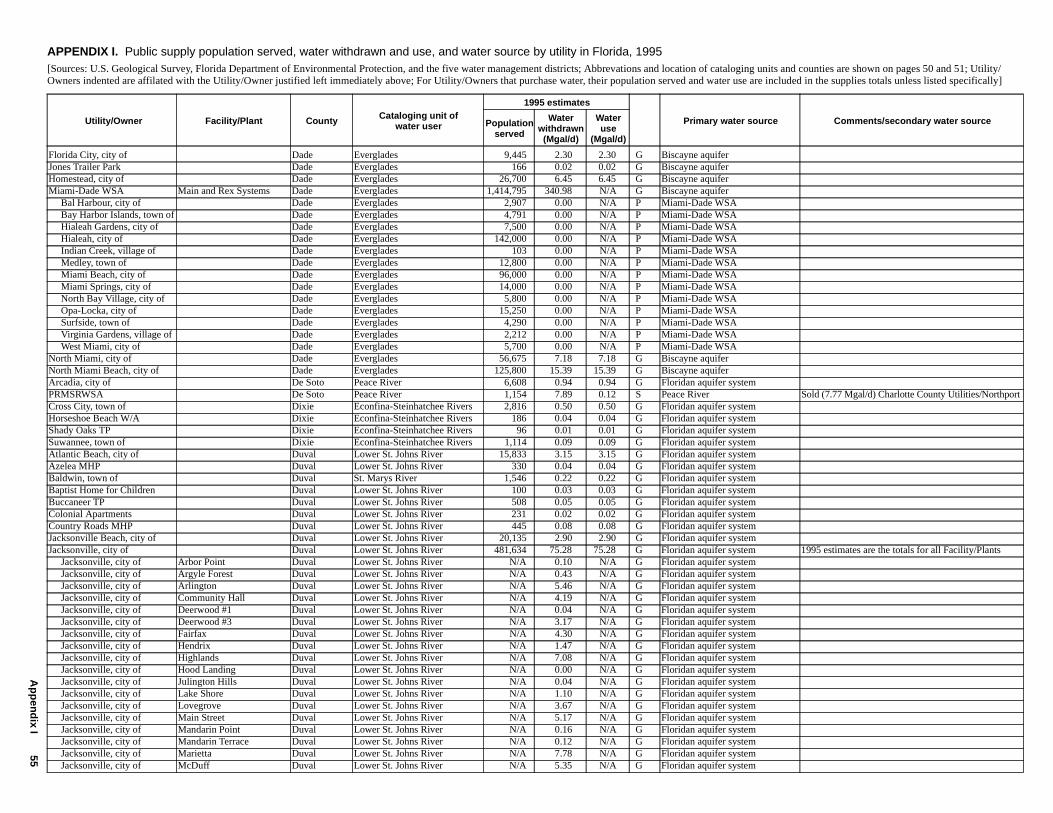
Ap
pen
dix I
55
Florida City, city of Dade Everglades 9,445 2.30 2.30 G Biscayne aquiferJones Trailer Park Dade Everglades 166 0.02 0.02 G Biscayne aquiferHomestead, city of Dade Everglades 26,700 6.45 6.45 G Biscayne aquiferMiami-Dade WSA Main and Rex Systems Dade Everglades 1,414,795 340.98 N/A G Biscayne aquifer Bal Harbour, city of Dade Everglades 2,907 0.00 N/A P Miami-Dade WSA Bay Harbor Islands, town of Dade Everglades 4,791 0.00 N/A P Miami-Dade WSA Hialeah Gardens, city of Dade Everglades 7,500 0.00 N/A P Miami-Dade WSA Hialeah, city of Dade Everglades 142,000 0.00 N/A P Miami-Dade WSA Indian Creek, village of Dade Everglades 103 0.00 N/A P Miami-Dade WSA Medley, town of Dade Everglades 12,800 0.00 N/A P Miami-Dade WSA Miami Beach, city of Dade Everglades 96,000 0.00 N/A P Miami-Dade WSA Miami Springs, city of Dade Everglades 14,000 0.00 N/A P Miami-Dade WSA North Bay Village, city of Dade Everglades 5,800 0.00 N/A P Miami-Dade WSA Opa-Locka, city of Dade Everglades 15,250 0.00 N/A P Miami-Dade WSA Surfside, town of Dade Everglades 4,290 0.00 N/A P Miami-Dade WSA Virginia Gardens, village of Dade Everglades 2,212 0.00 N/A P Miami-Dade WSA West Miami, city of Dade Everglades 5,700 0.00 N/A P Miami-Dade WSA North Miami, city of Dade Everglades 56,675 7.18 7.18 G Biscayne aquiferNorth Miami Beach, city of Dade Everglades 125,800 15.39 15.39 G Biscayne aquiferArcadia, city of De Soto Peace River 6,608 0.94 0.94 G Floridan aquifer systemPRMSRWSA De Soto Peace River 1,154 7.89 0.12 S Peace River Sold (7.77 Mgal/d) Charlotte County Utilities/NorthportCross City, town of Dixie Econfina-Steinhatchee Rivers 2,816 0.50 0.50 G Floridan aquifer systemHorseshoe Beach W/A Dixie Econfina-Steinhatchee Rivers 186 0.04 0.04 G Floridan aquifer systemShady Oaks TP Dixie Econfina-Steinhatchee Rivers 96 0.01 0.01 G Floridan aquifer systemSuwannee, town of Dixie Econfina-Steinhatchee Rivers 1,114 0.09 0.09 G Floridan aquifer systemAtlantic Beach, city of Duval Lower St. Johns River 15,833 3.15 3.15 G Floridan aquifer systemAzelea MHP Duval Lower St. Johns River 330 0.04 0.04 G Floridan aquifer systemBaldwin, town of Duval St. Marys River 1,546 0.22 0.22 G Floridan aquifer systemBaptist Home for Children Duval Lower St. Johns River 100 0.03 0.03 G Floridan aquifer systemBuccaneer TP Duval Lower St. Johns River 508 0.05 0.05 G Floridan aquifer systemColonial Apartments Duval Lower St. Johns River 231 0.02 0.02 G Floridan aquifer systemCountry Roads MHP Duval Lower St. Johns River 445 0.08 0.08 G Floridan aquifer systemJacksonville Beach, city of Duval Lower St. Johns River 20,135 2.90 2.90 G Floridan aquifer systemJacksonville, city of Duval Lower St. Johns River 481,634 75.28 75.28 G Floridan aquifer system 1995 estimates are the totals for all Facility/Plants Jacksonville, city of Arbor Point Duval Lower St. Johns River N/A 0.10 N/A G Floridan aquifer system Jacksonville, city of Argyle Forest Duval Lower St. Johns River N/A 0.43 N/A G Floridan aquifer system Jacksonville, city of Arlington Duval Lower St. Johns River N/A 5.46 N/A G Floridan aquifer system Jacksonville, city of Community Hall Duval Lower St. Johns River N/A 4.19 N/A G Floridan aquifer system Jacksonville, city of Deerwood #1 Duval Lower St. Johns River N/A 0.04 N/A G Floridan aquifer system Jacksonville, city of Deerwood #3 Duval Lower St. Johns River N/A 3.17 N/A G Floridan aquifer system Jacksonville, city of Fairfax Duval Lower St. Johns River N/A 4.30 N/A G Floridan aquifer system Jacksonville, city of Hendrix Duval Lower St. Johns River N/A 1.47 N/A G Floridan aquifer system Jacksonville, city of Highlands Duval Lower St. Johns River N/A 7.08 N/A G Floridan aquifer system Jacksonville, city of Hood Landing Duval Lower St. Johns River N/A 0.00 N/A G Floridan aquifer system Jacksonville, city of Julington Hills Duval Lower St. Johns River N/A 0.04 N/A G Floridan aquifer system Jacksonville, city of Lake Shore Duval Lower St. Johns River N/A 1.10 N/A G Floridan aquifer system Jacksonville, city of Lovegrove Duval Lower St. Johns River N/A 3.67 N/A G Floridan aquifer system Jacksonville, city of Main Street Duval Lower St. Johns River N/A 5.17 N/A G Floridan aquifer system Jacksonville, city of Mandarin Point Duval Lower St. Johns River N/A 0.16 N/A G Floridan aquifer system Jacksonville, city of Mandarin Terrace Duval Lower St. Johns River N/A 0.12 N/A G Floridan aquifer system Jacksonville, city of Marietta Duval Lower St. Johns River N/A 7.78 N/A G Floridan aquifer system Jacksonville, city of McDuff Duval Lower St. Johns River N/A 5.35 N/A G Floridan aquifer system
APPENDIX I. Public supply population served, water withdrawn and use, and water source by utility in Florida, 1995[Sources: U.S. Geological Survey, Florida Department of Environmental Protection, and the five water management districts; Abbrevations and location of cataloging units and counties are shown on pages 50 and 51; Utility/Owners indented are affilated with the Utility/Owner justified left immediately above; For Utility/Owners that purchase water, their population served and water use are included in the supplies totals unless listed specifically]
Utility/Owner Facility/Plant County Cataloging unit of water user
1995 estimates
Primary water source Comments/secondary water source Populationserved
Waterwithdrawn(Mgal/d)
Wateruse
(Mgal/d)
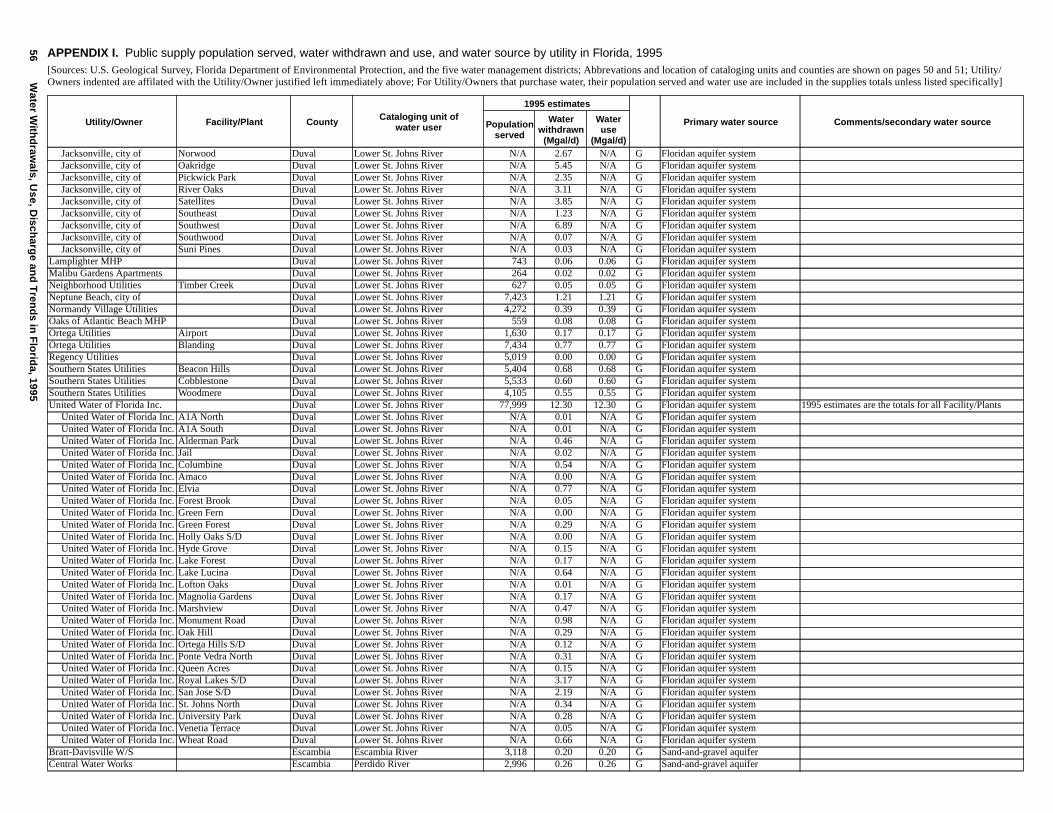
56W
ater With
draw
als, Use, D
ischarg
e and
Tren
ds in
Flo
rida, 1995
Jacksonville, city of Norwood Duval Lower St. Johns River N/A 2.67 N/A G Floridan aquifer system Jacksonville, city of Oakridge Duval Lower St. Johns River N/A 5.45 N/A G Floridan aquifer system Jacksonville, city of Pickwick Park Duval Lower St. Johns River N/A 2.35 N/A G Floridan aquifer system Jacksonville, city of River Oaks Duval Lower St. Johns River N/A 3.11 N/A G Floridan aquifer system Jacksonville, city of Satellites Duval Lower St. Johns River N/A 3.85 N/A G Floridan aquifer system Jacksonville, city of Southeast Duval Lower St. Johns River N/A 1.23 N/A G Floridan aquifer system Jacksonville, city of Southwest Duval Lower St. Johns River N/A 6.89 N/A G Floridan aquifer system Jacksonville, city of Southwood Duval Lower St. Johns River N/A 0.07 N/A G Floridan aquifer system Jacksonville, city of Suni Pines Duval Lower St. Johns River N/A 0.03 N/A G Floridan aquifer systemLamplighter MHP Duval Lower St. Johns River 743 0.06 0.06 G Floridan aquifer systemMalibu Gardens Apartments Duval Lower St. Johns River 264 0.02 0.02 G Floridan aquifer systemNeighborhood Utilities Timber Creek Duval Lower St. Johns River 627 0.05 0.05 G Floridan aquifer systemNeptune Beach, city of Duval Lower St. Johns River 7,423 1.21 1.21 G Floridan aquifer systemNormandy Village Utilities Duval Lower St. Johns River 4,272 0.39 0.39 G Floridan aquifer systemOaks of Atlantic Beach MHP Duval Lower St. Johns River 559 0.08 0.08 G Floridan aquifer systemOrtega Utilities Airport Duval Lower St. Johns River 1,630 0.17 0.17 G Floridan aquifer systemOrtega Utilities Blanding Duval Lower St. Johns River 7,434 0.77 0.77 G Floridan aquifer systemRegency Utilities Duval Lower St. Johns River 5,019 0.00 0.00 G Floridan aquifer systemSouthern States Utilities Beacon Hills Duval Lower St. Johns River 5,404 0.68 0.68 G Floridan aquifer systemSouthern States Utilities Cobblestone Duval Lower St. Johns River 5,533 0.60 0.60 G Floridan aquifer systemSouthern States Utilities Woodmere Duval Lower St. Johns River 4,105 0.55 0.55 G Floridan aquifer systemUnited Water of Florida Inc. Duval Lower St. Johns River 77,999 12.30 12.30 G Floridan aquifer system 1995 estimates are the totals for all Facility/Plants United Water of Florida Inc. A1A North Duval Lower St. Johns River N/A 0.01 N/A G Floridan aquifer system United Water of Florida Inc. A1A South Duval Lower St. Johns River N/A 0.01 N/A G Floridan aquifer system United Water of Florida Inc. Alderman Park Duval Lower St. Johns River N/A 0.46 N/A G Floridan aquifer system United Water of Florida Inc. Jail Duval Lower St. Johns River N/A 0.02 N/A G Floridan aquifer system United Water of Florida Inc. Columbine Duval Lower St. Johns River N/A 0.54 N/A G Floridan aquifer system United Water of Florida Inc. Amaco Duval Lower St. Johns River N/A 0.00 N/A G Floridan aquifer system United Water of Florida Inc. Elvia Duval Lower St. Johns River N/A 0.77 N/A G Floridan aquifer system United Water of Florida Inc. Forest Brook Duval Lower St. Johns River N/A 0.05 N/A G Floridan aquifer system United Water of Florida Inc. Green Fern Duval Lower St. Johns River N/A 0.00 N/A G Floridan aquifer system United Water of Florida Inc. Green Forest Duval Lower St. Johns River N/A 0.29 N/A G Floridan aquifer system United Water of Florida Inc. Holly Oaks S/D Duval Lower St. Johns River N/A 0.00 N/A G Floridan aquifer system United Water of Florida Inc. Hyde Grove Duval Lower St. Johns River N/A 0.15 N/A G Floridan aquifer system United Water of Florida Inc. Lake Forest Duval Lower St. Johns River N/A 0.17 N/A G Floridan aquifer system United Water of Florida Inc. Lake Lucina Duval Lower St. Johns River N/A 0.64 N/A G Floridan aquifer system United Water of Florida Inc. Lofton Oaks Duval Lower St. Johns River N/A 0.01 N/A G Floridan aquifer system United Water of Florida Inc. Magnolia Gardens Duval Lower St. Johns River N/A 0.17 N/A G Floridan aquifer system United Water of Florida Inc. Marshview Duval Lower St. Johns River N/A 0.47 N/A G Floridan aquifer system United Water of Florida Inc. Monument Road Duval Lower St. Johns River N/A 0.98 N/A G Floridan aquifer system United Water of Florida Inc. Oak Hill Duval Lower St. Johns River N/A 0.29 N/A G Floridan aquifer system United Water of Florida Inc. Ortega Hills S/D Duval Lower St. Johns River N/A 0.12 N/A G Floridan aquifer system United Water of Florida Inc. Ponte Vedra North Duval Lower St. Johns River N/A 0.31 N/A G Floridan aquifer system United Water of Florida Inc. Queen Acres Duval Lower St. Johns River N/A 0.15 N/A G Floridan aquifer system United Water of Florida Inc. Royal Lakes S/D Duval Lower St. Johns River N/A 3.17 N/A G Floridan aquifer system United Water of Florida Inc. San Jose S/D Duval Lower St. Johns River N/A 2.19 N/A G Floridan aquifer system United Water of Florida Inc. St. Johns North Duval Lower St. Johns River N/A 0.34 N/A G Floridan aquifer system United Water of Florida Inc. University Park Duval Lower St. Johns River N/A 0.28 N/A G Floridan aquifer system United Water of Florida Inc. Venetia Terrace Duval Lower St. Johns River N/A 0.05 N/A G Floridan aquifer system United Water of Florida Inc. Wheat Road Duval Lower St. Johns River N/A 0.66 N/A G Floridan aquifer systemBratt-Davisville W/S Escambia Escambia River 3,118 0.20 0.20 G Sand-and-gravel aquiferCentral Water Works Escambia Perdido River 2,996 0.26 0.26 G Sand-and-gravel aquifer
APPENDIX I. Public supply population served, water withdrawn and use, and water source by utility in Florida, 1995[Sources: U.S. Geological Survey, Florida Department of Environmental Protection, and the five water management districts; Abbrevations and location of cataloging units and counties are shown on pages 50 and 51; Utility/Owners indented are affilated with the Utility/Owner justified left immediately above; For Utility/Owners that purchase water, their population served and water use are included in the supplies totals unless listed specifically]
Utility/Owner Facility/Plant County Cataloging unit of water user
1995 estimates
Primary water source Comments/secondary water source Populationserved
Waterwithdrawn
(Mgal/d)
Wateruse
(Mgal/d)

Ap
pen
dix I
57
Century Utilities Escambia Escambia River 3,086 0.51 0.51 G Sand-and-gravel aquiferCottage Hill Utilities Escambia Escambia River 2,657 0.33 0.33 G Sand-and-gravel aquiferEscambia County Utility Auth. Escambia Pensacola Bay 197,923 32.90 32.28 G Sand-and-gravel aquifer Sold (0.62 Mgal/d) to Gulf Breeze and Saufley FieldFarm Hill Utilities Escambia Escambia River 2,891 0.29 0.29 G Sand-and-gravel aquiferGonzalez Utilities Escambia Perdido Bay 3,169 0.39 0.39 G Sand-and-gravel aquiferMolino Utilities Escambia Escambia River 4,410 0.58 0.58 G Sand-and-gravel aquiferNavarre Beach W/S Escambia Pensacola Bay 7,008 0.00 N/A P Escambia County Utility Auth.Peoples Water Company Escambia Pensacola Bay 25,589 2.08 2.08 G Sand-and-gravel aquiferSanta Rosa Island W/S Escambia Pensacola Bay 4,869 0.20 0.40 P/G Midway W/S Sand-and-gravel aquifer (0.20 Mgal/d)Walnut Hill Water Works Escambia Perdido River 1,671 0.19 0.19 G Sand-and-gravel aquiferBunnell, city of Flagler Lower St. Johns River 2,087 0.25 0.25 G Floridan aquifer systemFlagler Beach, city of Flagler Daytona-St. Augustine Coastal 4,175 0.49 0.49 G Floridan aquifer systemOcean City Utilities Beverly Beach Flagler Daytona-St. Augustine Coastal 322 0.05 0.05 G Floridan aquifer systemPalm Coast Utilities Flagler Daytona-St. Augustine Coastal 18,852 3.66 3.66 G Surficial aquifer Floridan aquifer system (0.74 Mgal/d)Plantation Bay W/S Flagler Daytona-St. Augustine Coastal 777 0.06 0.06 G Floridan aquifer systemAlligator Point W/D Franklin New River 980 0.12 0.12 G Floridan aquifer systemApalachicola, city of Franklin Apalachicola River 2,774 0.70 0.70 G Floridan aquifer systemCarrabelle, city of Franklin New River 800 0.17 0.17 G Floridan aquifer systemEast Point, town of Franklin New River 1,100 0.21 0.21 G Floridan aquifer systemLanark Village W/S Franklin New River 1,074 0.20 0.20 G Floridan aquifer systemSt. George Island Utilities Franklin Apalachicola Bay 1,624 0.35 0.35 G Floridan aquifer systemChattahoochee, city of Gadsden Apalachicola River 4,259 0.91 0.91 G Floridan aquifer systemGreensboro, town of Gadsden Lower Ochlockonee River 580 0.08 0.08 G Floridan aquifer systemGretna, town of Gadsden Lower Ochlockonee River 1,960 0.25 0.25 G Floridan aquifer systemHavana, town of Gadsden Lower Ochlockonee River 3,766 0.58 0.58 G Floridan aquifer systemJoyland S/D Gadsden Lower Ochlockonee River 133 0.02 0.02 G Floridan aquifer systemQuincy, city of Gadsden Lower Ochlockonee River 11,008 1.44 1.44 S/G Quincy Creek Floridan aquifer system (0.01 Mgal/d)Rentz MHP Gadsden Lower Ochlockonee River 118 0.01 0.01 G Floridan aquifer systemTalquin Electric Cooperative Atlanta Street Gadsden Lower Ochlockonee River 289 0.00 N/A P N/ATalquin Electric Cooperative Hammock Creek Gadsden Lower Ochlockonee River 35 0.00 0.00 G Floridan aquifer systemTalquin Electric Cooperative Hinson Heights Gadsden Lower Ochlockonee River 145 0.00 N/A P N/ATalquin Electric Cooperative Jamison Gadsden Lower Ochlockonee River 90 0.01 0.01 G Floridan aquifer systemTalquin Electric Cooperative Scottstown Gadsden Lower Ochlockonee River 2,295 0.27 0.27 G Floridan aquifer systemTalquin Electric Cooperative Shiloh Gadsden Lower Ochlockonee River 2,916 0.27 0.27 G Floridan aquifer systemTalquin Electric Cooperative St. James Gadsden Lower Ochlockonee River 81 0.01 0.01 G Floridan aquifer systemTrenton, city of Gilchrist Lower Suwannee River 1,765 0.22 0.22 G Floridan aquifer systemLakeport W/A Glades Caloosahatchee River 1,091 0.11 0.11 G Intermediate aquiferMoore Haven, city of Glades Caloosahatchee River 2,365 0.27 0.27 G Intermediate aquiferLighthouse Utilities Inc. Cape San Blas Gulf St. Andrews-St. Joseph Bays 1,400 0.11 0.11 G Floridan aquifer systemPort St. Joe, city of Gulf St. Andrews-St. Joseph Bays 6,887 1.04 N/A G Floridan aquifer system Surficial aquifer (0.52 Mgal/d) Highland View W/S Gulf St. Andrews-St. Joseph Bays 768 0.00 N/A P Port St. Joe, city of St. Joe Beach W/S Gulf St. Andrews-St. Joseph Bays 1,119 0.00 N/A P Port St. Joe, city of White City Gulf St. Andrews-St. Joseph Bays 443 0.00 N/A P Port St. Joe, city ofWewahitchka, city of Gulf Chipola River 1,821 0.13 0.13 G Floridan aquifer systemJasper, city of Hamilton Upper Suwannee River 4,215 0.62 0.62 G Floridan aquifer systemJennings, town of Hamilton Alapaha River 966 0.13 0.13 G Floridan aquifer systemWhite Springs, town of Hamilton Upper Suwannee River 1,161 0.12 0.12 G Floridan aquifer systemBowling Green, city of Hardee Peace River 1,959 0.29 0.29 G Floridan aquifer systemWauchula, city of Hardee Peace River 5,436 0.86 0.86 G Floridan aquifer systemZolfo Springs, city of Hardee Peace River 1,279 0.22 0.22 G Floridan aquifer systemU.S. Sugar Corp. Hendry Everglades N/A N/A N/A S Lake Okeechobee Clewiston, city of Hendry Everglades 14,212 0.00 3.25 P U.S. Sugar Company South Shore Utilities Hendry Everglades 3,642 0.00 N/A P U.S. Sugar Company
APPENDIX I. Public supply population served, water withdrawn and use, and water source by utility in Florida, 1995[Sources: U.S. Geological Survey, Florida Department of Environmental Protection, and the five water management districts; Abbrevations and location of cataloging units and counties are shown on pages 50 and 51; Utility/Owners indented are affilated with the Utility/Owner justified left immediately above; For Utility/Owners that purchase water, their population served and water use are included in the supplies totals unless listed specifically]
Utility/Owner Facility/Plant County Cataloging unit of water user
1995 estimates
Primary water source Comments/secondary water source Populationserved
Waterwithdrawn(Mgal/d)
Wateruse
(Mgal/d)
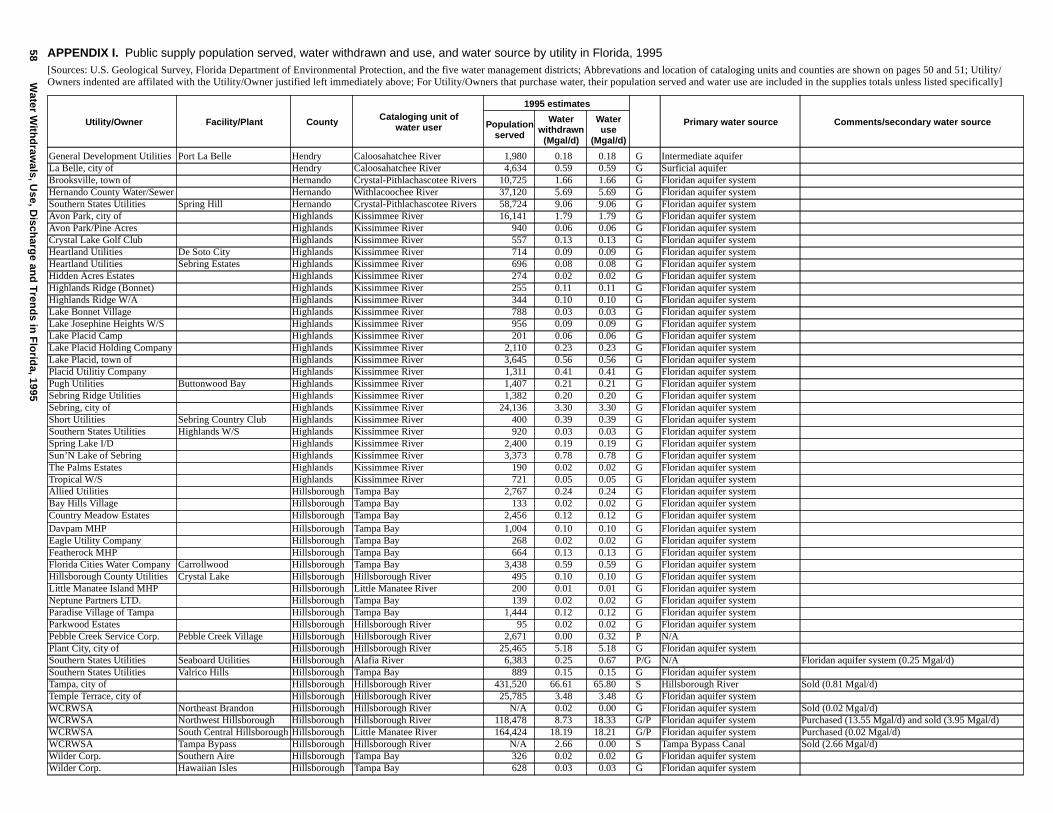
58W
ater With
draw
als, Use, D
ischarg
e and
Tren
ds in
Flo
rida, 1995
General Development Utilities Port La Belle Hendry Caloosahatchee River 1,980 0.18 0.18 G Intermediate aquiferLa Belle, city of Hendry Caloosahatchee River 4,634 0.59 0.59 G Surficial aquiferBrooksville, town of Hernando Crystal-Pithlachascotee Rivers 10,725 1.66 1.66 G Floridan aquifer systemHernando County Water/Sewer Hernando Withlacoochee River 37,120 5.69 5.69 G Floridan aquifer systemSouthern States Utilities Spring Hill Hernando Crystal-Pithlachascotee Rivers 58,724 9.06 9.06 G Floridan aquifer systemAvon Park, city of Highlands Kissimmee River 16,141 1.79 1.79 G Floridan aquifer systemAvon Park/Pine Acres Highlands Kissimmee River 940 0.06 0.06 G Floridan aquifer systemCrystal Lake Golf Club Highlands Kissimmee River 557 0.13 0.13 G Floridan aquifer systemHeartland Utilities De Soto City Highlands Kissimmee River 714 0.09 0.09 G Floridan aquifer systemHeartland Utilities Sebring Estates Highlands Kissimmee River 696 0.08 0.08 G Floridan aquifer systemHidden Acres Estates Highlands Kissimmee River 274 0.02 0.02 G Floridan aquifer systemHighlands Ridge (Bonnet) Highlands Kissimmee River 255 0.11 0.11 G Floridan aquifer systemHighlands Ridge W/A Highlands Kissimmee River 344 0.10 0.10 G Floridan aquifer systemLake Bonnet Village Highlands Kissimmee River 788 0.03 0.03 G Floridan aquifer systemLake Josephine Heights W/S Highlands Kissimmee River 956 0.09 0.09 G Floridan aquifer systemLake Placid Camp Highlands Kissimmee River 201 0.06 0.06 G Floridan aquifer systemLake Placid Holding Company Highlands Kissimmee River 2,110 0.23 0.23 G Floridan aquifer systemLake Placid, town of Highlands Kissimmee River 3,645 0.56 0.56 G Floridan aquifer systemPlacid Utilitiy Company Highlands Kissimmee River 1,311 0.41 0.41 G Floridan aquifer systemPugh Utilities Buttonwood Bay Highlands Kissimmee River 1,407 0.21 0.21 G Floridan aquifer systemSebring Ridge Utilities Highlands Kissimmee River 1,382 0.20 0.20 G Floridan aquifer systemSebring, city of Highlands Kissimmee River 24,136 3.30 3.30 G Floridan aquifer systemShort Utilities Sebring Country Club Highlands Kissimmee River 400 0.39 0.39 G Floridan aquifer systemSouthern States Utilities Highlands W/S Highlands Kissimmee River 920 0.03 0.03 G Floridan aquifer systemSpring Lake I/D Highlands Kissimmee River 2,400 0.19 0.19 G Floridan aquifer systemSun’N Lake of Sebring Highlands Kissimmee River 3,373 0.78 0.78 G Floridan aquifer systemThe Palms Estates Highlands Kissimmee River 190 0.02 0.02 G Floridan aquifer systemTropical W/S Highlands Kissimmee River 721 0.05 0.05 G Floridan aquifer systemAllied Utilities Hillsborough Tampa Bay 2,767 0.24 0.24 G Floridan aquifer systemBay Hills Village Hillsborough Tampa Bay 133 0.02 0.02 G Floridan aquifer systemCountry Meadow Estates Hillsborough Tampa Bay 2,456 0.12 0.12 G Floridan aquifer systemDavpam MHP Hillsborough Tampa Bay 1,004 0.10 0.10 G Floridan aquifer systemEagle Utility Company Hillsborough Tampa Bay 268 0.02 0.02 G Floridan aquifer systemFeatherock MHP Hillsborough Tampa Bay 664 0.13 0.13 G Floridan aquifer systemFlorida Cities Water Company Carrollwood Hillsborough Tampa Bay 3,438 0.59 0.59 G Floridan aquifer systemHillsborough County Utilities Crystal Lake Hillsborough Hillsborough River 495 0.10 0.10 G Floridan aquifer systemLittle Manatee Island MHP Hillsborough Little Manatee River 200 0.01 0.01 G Floridan aquifer systemNeptune Partners LTD. Hillsborough Tampa Bay 139 0.02 0.02 G Floridan aquifer systemParadise Village of Tampa Hillsborough Tampa Bay 1,444 0.12 0.12 G Floridan aquifer systemParkwood Estates Hillsborough Hillsborough River 95 0.02 0.02 G Floridan aquifer systemPebble Creek Service Corp. Pebble Creek Village Hillsborough Hillsborough River 2,671 0.00 0.32 P N/APlant City, city of Hillsborough Hillsborough River 25,465 5.18 5.18 G Floridan aquifer systemSouthern States Utilities Seaboard Utilities Hillsborough Alafia River 6,383 0.25 0.67 P/G N/A Floridan aquifer system (0.25 Mgal/d)Southern States Utilities Valrico Hills Hillsborough Tampa Bay 889 0.15 0.15 G Floridan aquifer systemTampa, city of Hillsborough Hillsborough River 431,520 66.61 65.80 S Hillsborough River Sold (0.81 Mgal/d)Temple Terrace, city of Hillsborough Hillsborough River 25,785 3.48 3.48 G Floridan aquifer systemWCRWSA Northeast Brandon Hillsborough Hillsborough River N/A 0.02 0.00 G Floridan aquifer system Sold (0.02 Mgal/d)WCRWSA Northwest Hillsborough Hillsborough Hillsborough River 118,478 8.73 18.33 G/P Floridan aquifer system Purchased (13.55 Mgal/d) and sold (3.95 Mgal/d)WCRWSA South Central Hillsborough Hillsborough Little Manatee River 164,424 18.19 18.21 G/P Floridan aquifer system Purchased (0.02 Mgal/d)WCRWSA Tampa Bypass Hillsborough Hillsborough River N/A 2.66 0.00 S Tampa Bypass Canal Sold (2.66 Mgal/d)Wilder Corp. Southern Aire Hillsborough Tampa Bay 326 0.02 0.02 G Floridan aquifer systemWilder Corp. Hawaiian Isles Hillsborough Tampa Bay 628 0.03 0.03 G Floridan aquifer system
APPENDIX I. Public supply population served, water withdrawn and use, and water source by utility in Florida, 1995[Sources: U.S. Geological Survey, Florida Department of Environmental Protection, and the five water management districts; Abbrevations and location of cataloging units and counties are shown on pages 50 and 51; Utility/Owners indented are affilated with the Utility/Owner justified left immediately above; For Utility/Owners that purchase water, their population served and water use are included in the supplies totals unless listed specifically]
Utility/Owner Facility/Plant County Cataloging unit of water user
1995 estimates
Primary water source Comments/secondary water source Populationserved
Waterwithdrawn
(Mgal/d)
Wateruse
(Mgal/d)
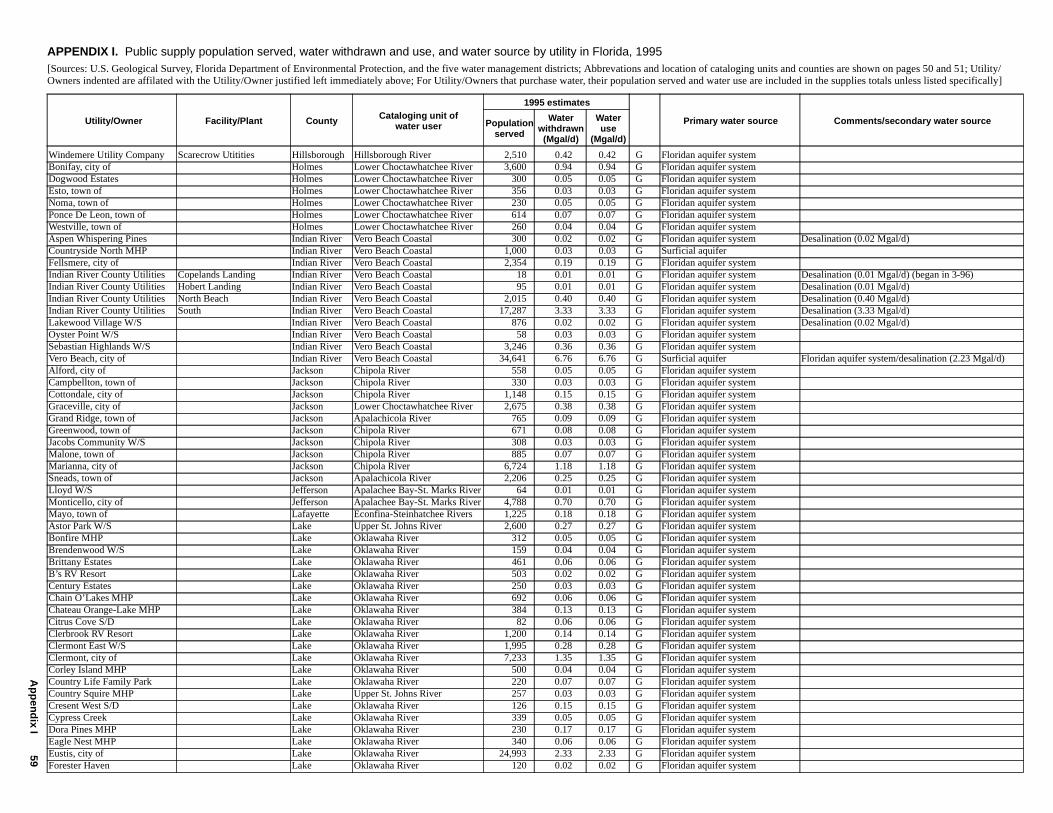
Ap
pen
dix I
59
Windemere Utility Company Scarecrow Utitities Hillsborough Hillsborough River 2,510 0.42 0.42 G Floridan aquifer systemBonifay, city of Holmes Lower Choctawhatchee River 3,600 0.94 0.94 G Floridan aquifer systemDogwood Estates Holmes Lower Choctawhatchee River 300 0.05 0.05 G Floridan aquifer systemEsto, town of Holmes Lower Choctawhatchee River 356 0.03 0.03 G Floridan aquifer systemNoma, town of Holmes Lower Choctawhatchee River 230 0.05 0.05 G Floridan aquifer systemPonce De Leon, town of Holmes Lower Choctawhatchee River 614 0.07 0.07 G Floridan aquifer systemWestville, town of Holmes Lower Choctawhatchee River 260 0.04 0.04 G Floridan aquifer systemAspen Whispering Pines Indian River Vero Beach Coastal 300 0.02 0.02 G Floridan aquifer system Desalination (0.02 Mgal/d)Countryside North MHP Indian River Vero Beach Coastal 1,000 0.03 0.03 G Surficial aquiferFellsmere, city of Indian River Vero Beach Coastal 2,354 0.19 0.19 G Floridan aquifer systemIndian River County Utilities Copelands Landing Indian River Vero Beach Coastal 18 0.01 0.01 G Floridan aquifer system Desalination (0.01 Mgal/d) (began in 3-96)Indian River County Utilities Hobert Landing Indian River Vero Beach Coastal 95 0.01 0.01 G Floridan aquifer system Desalination (0.01 Mgal/d)Indian River County Utilities North Beach Indian River Vero Beach Coastal 2,015 0.40 0.40 G Floridan aquifer system Desalination (0.40 Mgal/d)Indian River County Utilities South Indian River Vero Beach Coastal 17,287 3.33 3.33 G Floridan aquifer system Desalination (3.33 Mgal/d)Lakewood Village W/S Indian River Vero Beach Coastal 876 0.02 0.02 G Floridan aquifer system Desalination (0.02 Mgal/d)Oyster Point W/S Indian River Vero Beach Coastal 58 0.03 0.03 G Floridan aquifer systemSebastian Highlands W/S Indian River Vero Beach Coastal 3,246 0.36 0.36 G Floridan aquifer systemVero Beach, city of Indian River Vero Beach Coastal 34,641 6.76 6.76 G Surficial aquifer Floridan aquifer system/desalination (2.23 Mgal/d)Alford, city of Jackson Chipola River 558 0.05 0.05 G Floridan aquifer systemCampbellton, town of Jackson Chipola River 330 0.03 0.03 G Floridan aquifer systemCottondale, city of Jackson Chipola River 1,148 0.15 0.15 G Floridan aquifer systemGraceville, city of Jackson Lower Choctawhatchee River 2,675 0.38 0.38 G Floridan aquifer systemGrand Ridge, town of Jackson Apalachicola River 765 0.09 0.09 G Floridan aquifer systemGreenwood, town of Jackson Chipola River 671 0.08 0.08 G Floridan aquifer systemJacobs Community W/S Jackson Chipola River 308 0.03 0.03 G Floridan aquifer systemMalone, town of Jackson Chipola River 885 0.07 0.07 G Floridan aquifer systemMarianna, city of Jackson Chipola River 6,724 1.18 1.18 G Floridan aquifer systemSneads, town of Jackson Apalachicola River 2,206 0.25 0.25 G Floridan aquifer systemLloyd W/S Jefferson Apalachee Bay-St. Marks River 64 0.01 0.01 G Floridan aquifer systemMonticello, city of Jefferson Apalachee Bay-St. Marks River 4,788 0.70 0.70 G Floridan aquifer systemMayo, town of Lafayette Econfina-Steinhatchee Rivers 1,225 0.18 0.18 G Floridan aquifer systemAstor Park W/S Lake Upper St. Johns River 2,600 0.27 0.27 G Floridan aquifer systemBonfire MHP Lake Oklawaha River 312 0.05 0.05 G Floridan aquifer systemBrendenwood W/S Lake Oklawaha River 159 0.04 0.04 G Floridan aquifer systemBrittany Estates Lake Oklawaha River 461 0.06 0.06 G Floridan aquifer systemB’s RV Resort Lake Oklawaha River 503 0.02 0.02 G Floridan aquifer systemCentury Estates Lake Oklawaha River 250 0.03 0.03 G Floridan aquifer systemChain O’Lakes MHP Lake Oklawaha River 692 0.06 0.06 G Floridan aquifer systemChateau Orange-Lake MHP Lake Oklawaha River 384 0.13 0.13 G Floridan aquifer systemCitrus Cove S/D Lake Oklawaha River 82 0.06 0.06 G Floridan aquifer systemClerbrook RV Resort Lake Oklawaha River 1,200 0.14 0.14 G Floridan aquifer systemClermont East W/S Lake Oklawaha River 1,995 0.28 0.28 G Floridan aquifer systemClermont, city of Lake Oklawaha River 7,233 1.35 1.35 G Floridan aquifer systemCorley Island MHP Lake Oklawaha River 500 0.04 0.04 G Floridan aquifer systemCountry Life Family Park Lake Oklawaha River 220 0.07 0.07 G Floridan aquifer systemCountry Squire MHP Lake Upper St. Johns River 257 0.03 0.03 G Floridan aquifer systemCresent West S/D Lake Oklawaha River 126 0.15 0.15 G Floridan aquifer systemCypress Creek Lake Oklawaha River 339 0.05 0.05 G Floridan aquifer systemDora Pines MHP Lake Oklawaha River 230 0.17 0.17 G Floridan aquifer systemEagle Nest MHP Lake Oklawaha River 340 0.06 0.06 G Floridan aquifer systemEustis, city of Lake Oklawaha River 24,993 2.33 2.33 G Floridan aquifer systemForester Haven Lake Oklawaha River 120 0.02 0.02 G Floridan aquifer system
APPENDIX I. Public supply population served, water withdrawn and use, and water source by utility in Florida, 1995[Sources: U.S. Geological Survey, Florida Department of Environmental Protection, and the five water management districts; Abbrevations and location of cataloging units and counties are shown on pages 50 and 51; Utility/Owners indented are affilated with the Utility/Owner justified left immediately above; For Utility/Owners that purchase water, their population served and water use are included in the supplies totals unless listed specifically]
Utility/Owner Facility/Plant County Cataloging unit of water user
1995 estimates
Primary water source Comments/secondary water source Populationserved
Waterwithdrawn(Mgal/d)
Wateruse
(Mgal/d)
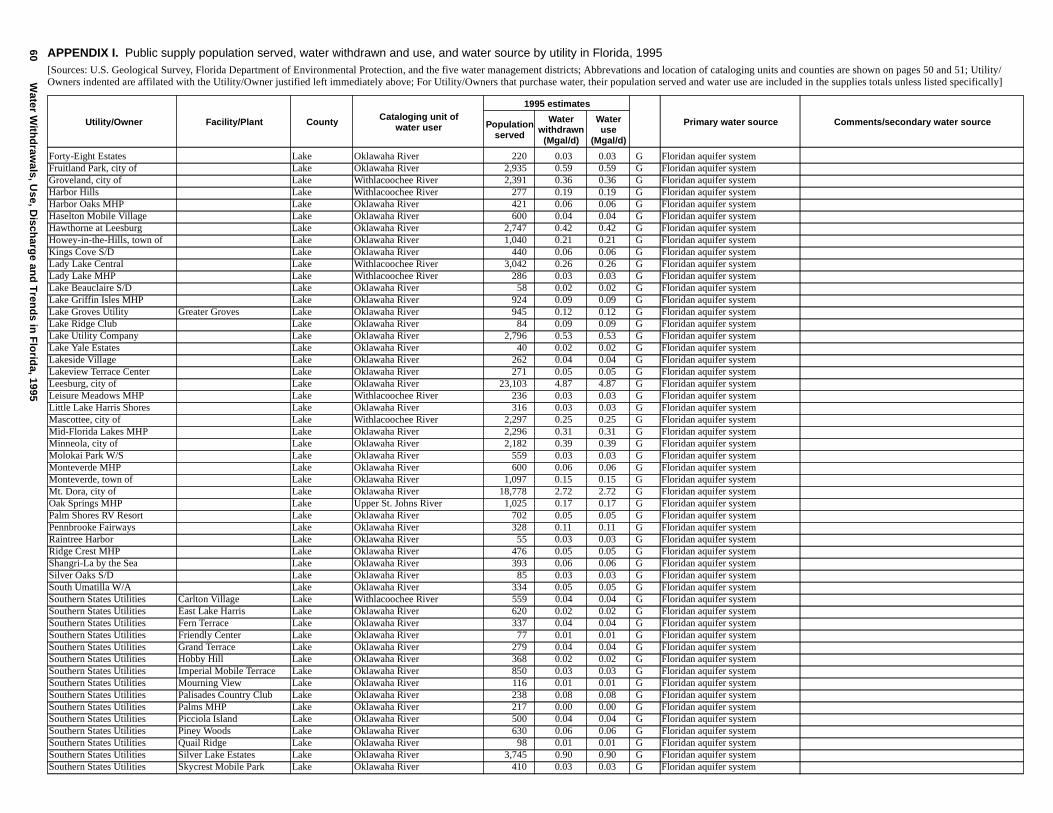
60W
ater With
draw
als, Use, D
ischarg
e and
Tren
ds in
Flo
rida, 1995
Forty-Eight Estates Lake Oklawaha River 220 0.03 0.03 G Floridan aquifer systemFruitland Park, city of Lake Oklawaha River 2,935 0.59 0.59 G Floridan aquifer systemGroveland, city of Lake Withlacoochee River 2,391 0.36 0.36 G Floridan aquifer systemHarbor Hills Lake Withlacoochee River 277 0.19 0.19 G Floridan aquifer systemHarbor Oaks MHP Lake Oklawaha River 421 0.06 0.06 G Floridan aquifer systemHaselton Mobile Village Lake Oklawaha River 600 0.04 0.04 G Floridan aquifer systemHawthorne at Leesburg Lake Oklawaha River 2,747 0.42 0.42 G Floridan aquifer systemHowey-in-the-Hills, town of Lake Oklawaha River 1,040 0.21 0.21 G Floridan aquifer systemKings Cove S/D Lake Oklawaha River 440 0.06 0.06 G Floridan aquifer systemLady Lake Central Lake Withlacoochee River 3,042 0.26 0.26 G Floridan aquifer systemLady Lake MHP Lake Withlacoochee River 286 0.03 0.03 G Floridan aquifer systemLake Beauclaire S/D Lake Oklawaha River 58 0.02 0.02 G Floridan aquifer systemLake Griffin Isles MHP Lake Oklawaha River 924 0.09 0.09 G Floridan aquifer systemLake Groves Utility Greater Groves Lake Oklawaha River 945 0.12 0.12 G Floridan aquifer systemLake Ridge Club Lake Oklawaha River 84 0.09 0.09 G Floridan aquifer systemLake Utility Company Lake Oklawaha River 2,796 0.53 0.53 G Floridan aquifer systemLake Yale Estates Lake Oklawaha River 40 0.02 0.02 G Floridan aquifer systemLakeside Village Lake Oklawaha River 262 0.04 0.04 G Floridan aquifer systemLakeview Terrace Center Lake Oklawaha River 271 0.05 0.05 G Floridan aquifer systemLeesburg, city of Lake Oklawaha River 23,103 4.87 4.87 G Floridan aquifer systemLeisure Meadows MHP Lake Withlacoochee River 236 0.03 0.03 G Floridan aquifer systemLittle Lake Harris Shores Lake Oklawaha River 316 0.03 0.03 G Floridan aquifer systemMascottee, city of Lake Withlacoochee River 2,297 0.25 0.25 G Floridan aquifer systemMid-Florida Lakes MHP Lake Oklawaha River 2,296 0.31 0.31 G Floridan aquifer systemMinneola, city of Lake Oklawaha River 2,182 0.39 0.39 G Floridan aquifer systemMolokai Park W/S Lake Oklawaha River 559 0.03 0.03 G Floridan aquifer systemMonteverde MHP Lake Oklawaha River 600 0.06 0.06 G Floridan aquifer systemMonteverde, town of Lake Oklawaha River 1,097 0.15 0.15 G Floridan aquifer systemMt. Dora, city of Lake Oklawaha River 18,778 2.72 2.72 G Floridan aquifer systemOak Springs MHP Lake Upper St. Johns River 1,025 0.17 0.17 G Floridan aquifer systemPalm Shores RV Resort Lake Oklawaha River 702 0.05 0.05 G Floridan aquifer systemPennbrooke Fairways Lake Oklawaha River 328 0.11 0.11 G Floridan aquifer systemRaintree Harbor Lake Oklawaha River 55 0.03 0.03 G Floridan aquifer systemRidge Crest MHP Lake Oklawaha River 476 0.05 0.05 G Floridan aquifer systemShangri-La by the Sea Lake Oklawaha River 393 0.06 0.06 G Floridan aquifer systemSilver Oaks S/D Lake Oklawaha River 85 0.03 0.03 G Floridan aquifer systemSouth Umatilla W/A Lake Oklawaha River 334 0.05 0.05 G Floridan aquifer systemSouthern States Utilities Carlton Village Lake Withlacoochee River 559 0.04 0.04 G Floridan aquifer systemSouthern States Utilities East Lake Harris Lake Oklawaha River 620 0.02 0.02 G Floridan aquifer systemSouthern States Utilities Fern Terrace Lake Oklawaha River 337 0.04 0.04 G Floridan aquifer systemSouthern States Utilities Friendly Center Lake Oklawaha River 77 0.01 0.01 G Floridan aquifer systemSouthern States Utilities Grand Terrace Lake Oklawaha River 279 0.04 0.04 G Floridan aquifer systemSouthern States Utilities Hobby Hill Lake Oklawaha River 368 0.02 0.02 G Floridan aquifer systemSouthern States Utilities Imperial Mobile Terrace Lake Oklawaha River 850 0.03 0.03 G Floridan aquifer systemSouthern States Utilities Mourning View Lake Oklawaha River 116 0.01 0.01 G Floridan aquifer systemSouthern States Utilities Palisades Country Club Lake Oklawaha River 238 0.08 0.08 G Floridan aquifer systemSouthern States Utilities Palms MHP Lake Oklawaha River 217 0.00 0.00 G Floridan aquifer systemSouthern States Utilities Picciola Island Lake Oklawaha River 500 0.04 0.04 G Floridan aquifer systemSouthern States Utilities Piney Woods Lake Oklawaha River 630 0.06 0.06 G Floridan aquifer systemSouthern States Utilities Quail Ridge Lake Oklawaha River 98 0.01 0.01 G Floridan aquifer systemSouthern States Utilities Silver Lake Estates Lake Oklawaha River 3,745 0.90 0.90 G Floridan aquifer systemSouthern States Utilities Skycrest Mobile Park Lake Oklawaha River 410 0.03 0.03 G Floridan aquifer system
APPENDIX I. Public supply population served, water withdrawn and use, and water source by utility in Florida, 1995[Sources: U.S. Geological Survey, Florida Department of Environmental Protection, and the five water management districts; Abbrevations and location of cataloging units and counties are shown on pages 50 and 51; Utility/Owners indented are affilated with the Utility/Owner justified left immediately above; For Utility/Owners that purchase water, their population served and water use are included in the supplies totals unless listed specifically]
Utility/Owner Facility/Plant County Cataloging unit of water user
1995 estimates
Primary water source Comments/secondary water source Populationserved
Waterwithdrawn
(Mgal/d)
Wateruse
(Mgal/d)
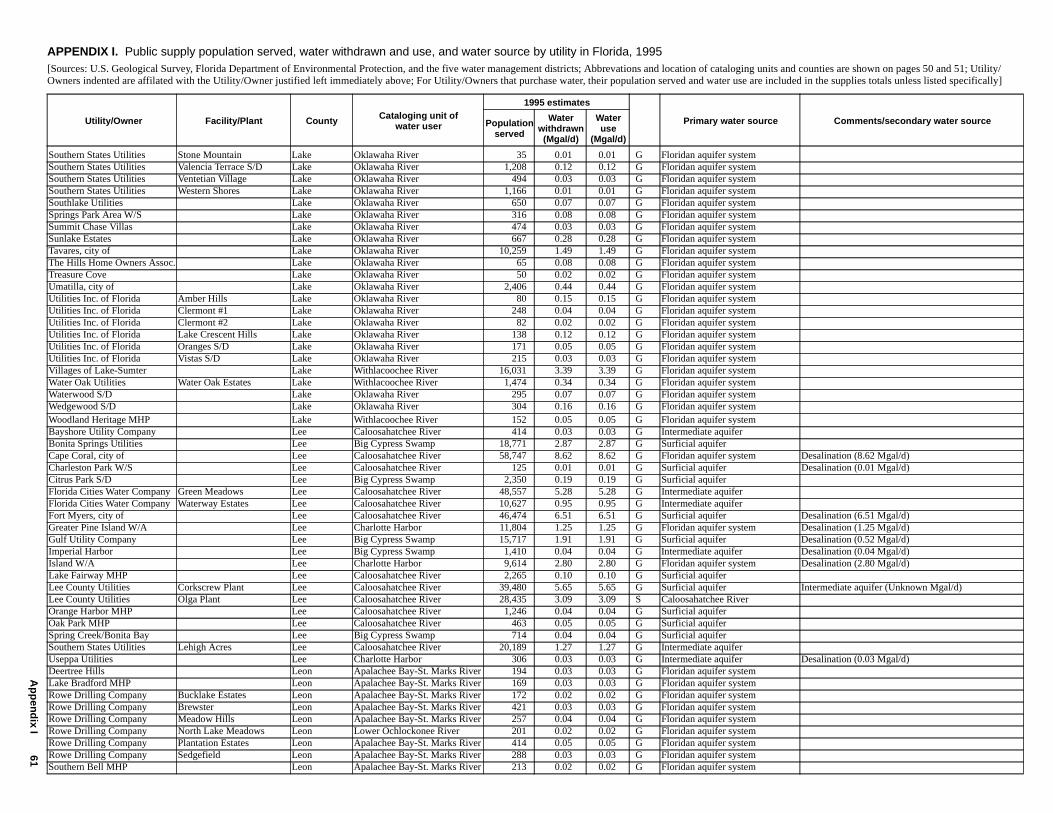
Ap
pen
dix I
61
Southern States Utilities Stone Mountain Lake Oklawaha River 35 0.01 0.01 G Floridan aquifer systemSouthern States Utilities Valencia Terrace S/D Lake Oklawaha River 1,208 0.12 0.12 G Floridan aquifer systemSouthern States Utilities Ventetian Village Lake Oklawaha River 494 0.03 0.03 G Floridan aquifer systemSouthern States Utilities Western Shores Lake Oklawaha River 1,166 0.01 0.01 G Floridan aquifer systemSouthlake Utilities Lake Oklawaha River 650 0.07 0.07 G Floridan aquifer systemSprings Park Area W/S Lake Oklawaha River 316 0.08 0.08 G Floridan aquifer systemSummit Chase Villas Lake Oklawaha River 474 0.03 0.03 G Floridan aquifer systemSunlake Estates Lake Oklawaha River 667 0.28 0.28 G Floridan aquifer systemTavares, city of Lake Oklawaha River 10,259 1.49 1.49 G Floridan aquifer systemThe Hills Home Owners Assoc. Lake Oklawaha River 65 0.08 0.08 G Floridan aquifer systemTreasure Cove Lake Oklawaha River 50 0.02 0.02 G Floridan aquifer systemUmatilla, city of Lake Oklawaha River 2,406 0.44 0.44 G Floridan aquifer systemUtilities Inc. of Florida Amber Hills Lake Oklawaha River 80 0.15 0.15 G Floridan aquifer systemUtilities Inc. of Florida Clermont #1 Lake Oklawaha River 248 0.04 0.04 G Floridan aquifer systemUtilities Inc. of Florida Clermont #2 Lake Oklawaha River 82 0.02 0.02 G Floridan aquifer systemUtilities Inc. of Florida Lake Crescent Hills Lake Oklawaha River 138 0.12 0.12 G Floridan aquifer systemUtilities Inc. of Florida Oranges S/D Lake Oklawaha River 171 0.05 0.05 G Floridan aquifer systemUtilities Inc. of Florida Vistas S/D Lake Oklawaha River 215 0.03 0.03 G Floridan aquifer systemVillages of Lake-Sumter Lake Withlacoochee River 16,031 3.39 3.39 G Floridan aquifer systemWater Oak Utilities Water Oak Estates Lake Withlacoochee River 1,474 0.34 0.34 G Floridan aquifer systemWaterwood S/D Lake Oklawaha River 295 0.07 0.07 G Floridan aquifer systemWedgewood S/D Lake Oklawaha River 304 0.16 0.16 G Floridan aquifer systemWoodland Heritage MHP Lake Withlacoochee River 152 0.05 0.05 G Floridan aquifer systemBayshore Utility Company Lee Caloosahatchee River 414 0.03 0.03 G Intermediate aquiferBonita Springs Utilities Lee Big Cypress Swamp 18,771 2.87 2.87 G Surficial aquiferCape Coral, city of Lee Caloosahatchee River 58,747 8.62 8.62 G Floridan aquifer system Desalination (8.62 Mgal/d)Charleston Park W/S Lee Caloosahatchee River 125 0.01 0.01 G Surficial aquifer Desalination (0.01 Mgal/d)Citrus Park S/D Lee Big Cypress Swamp 2,350 0.19 0.19 G Surficial aquiferFlorida Cities Water Company Green Meadows Lee Caloosahatchee River 48,557 5.28 5.28 G Intermediate aquiferFlorida Cities Water Company Waterway Estates Lee Caloosahatchee River 10,627 0.95 0.95 G Intermediate aquiferFort Myers, city of Lee Caloosahatchee River 46,474 6.51 6.51 G Surficial aquifer Desalination (6.51 Mgal/d)Greater Pine Island W/A Lee Charlotte Harbor 11,804 1.25 1.25 G Floridan aquifer system Desalination (1.25 Mgal/d)Gulf Utility Company Lee Big Cypress Swamp 15,717 1.91 1.91 G Surficial aquifer Desalination (0.52 Mgal/d)Imperial Harbor Lee Big Cypress Swamp 1,410 0.04 0.04 G Intermediate aquifer Desalination (0.04 Mgal/d)Island W/A Lee Charlotte Harbor 9,614 2.80 2.80 G Floridan aquifer system Desalination (2.80 Mgal/d)Lake Fairway MHP Lee Caloosahatchee River 2,265 0.10 0.10 G Surficial aquiferLee County Utilities Corkscrew Plant Lee Caloosahatchee River 39,480 5.65 5.65 G Surficial aquifer Intermediate aquifer (Unknown Mgal/d)Lee County Utilities Olga Plant Lee Caloosahatchee River 28,435 3.09 3.09 S Caloosahatchee RiverOrange Harbor MHP Lee Caloosahatchee River 1,246 0.04 0.04 G Surficial aquiferOak Park MHP Lee Caloosahatchee River 463 0.05 0.05 G Surficial aquiferSpring Creek/Bonita Bay Lee Big Cypress Swamp 714 0.04 0.04 G Surficial aquiferSouthern States Utilities Lehigh Acres Lee Caloosahatchee River 20,189 1.27 1.27 G Intermediate aquiferUseppa Utilities Lee Charlotte Harbor 306 0.03 0.03 G Intermediate aquifer Desalination (0.03 Mgal/d)Deertree Hills Leon Apalachee Bay-St. Marks River 194 0.03 0.03 G Floridan aquifer systemLake Bradford MHP Leon Apalachee Bay-St. Marks River 169 0.03 0.03 G Floridan aquifer systemRowe Drilling Company Bucklake Estates Leon Apalachee Bay-St. Marks River 172 0.02 0.02 G Floridan aquifer systemRowe Drilling Company Brewster Leon Apalachee Bay-St. Marks River 421 0.03 0.03 G Floridan aquifer systemRowe Drilling Company Meadow Hills Leon Apalachee Bay-St. Marks River 257 0.04 0.04 G Floridan aquifer systemRowe Drilling Company North Lake Meadows Leon Lower Ochlockonee River 201 0.02 0.02 G Floridan aquifer systemRowe Drilling Company Plantation Estates Leon Apalachee Bay-St. Marks River 414 0.05 0.05 G Floridan aquifer systemRowe Drilling Company Sedgefield Leon Apalachee Bay-St. Marks River 288 0.03 0.03 G Floridan aquifer systemSouthern Bell MHP Leon Apalachee Bay-St. Marks River 213 0.02 0.02 G Floridan aquifer system
APPENDIX I. Public supply population served, water withdrawn and use, and water source by utility in Florida, 1995[Sources: U.S. Geological Survey, Florida Department of Environmental Protection, and the five water management districts; Abbrevations and location of cataloging units and counties are shown on pages 50 and 51; Utility/Owners indented are affilated with the Utility/Owner justified left immediately above; For Utility/Owners that purchase water, their population served and water use are included in the supplies totals unless listed specifically]
Utility/Owner Facility/Plant County Cataloging unit of water user
1995 estimates
Primary water source Comments/secondary water source Populationserved
Waterwithdrawn(Mgal/d)
Wateruse
(Mgal/d)
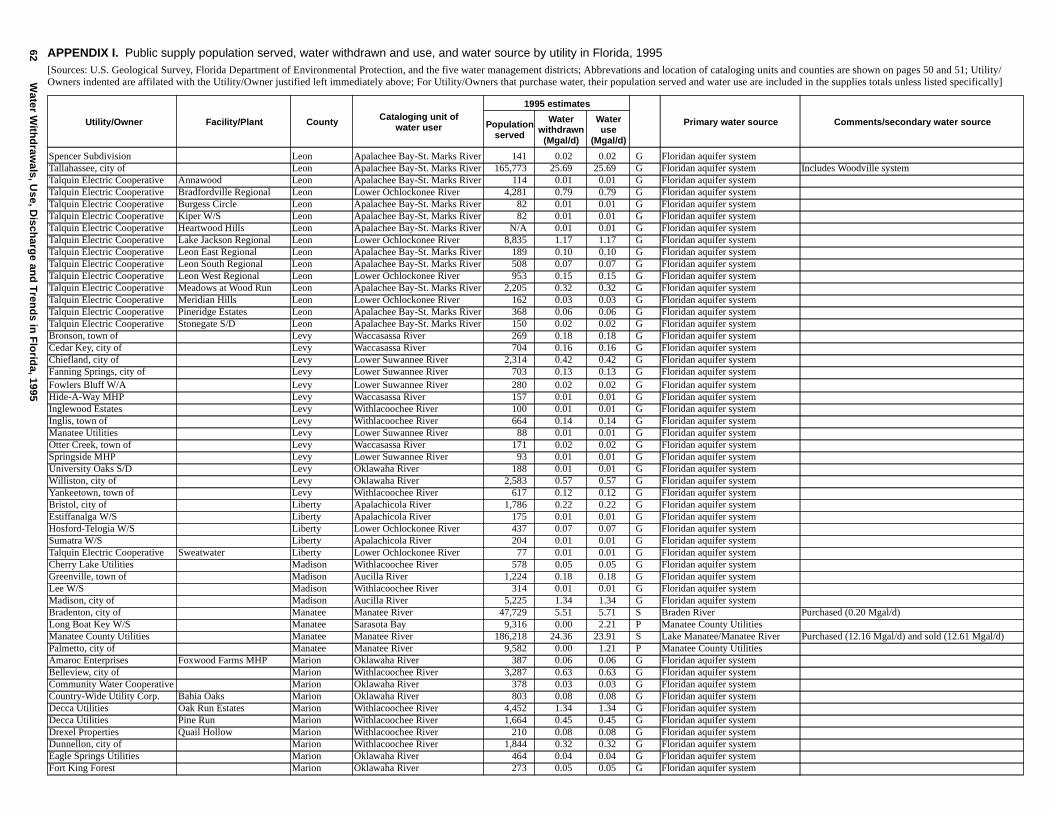
62W
ater With
draw
als, Use, D
ischarg
e and
Tren
ds in
Flo
rida, 1995
Spencer Subdivision Leon Apalachee Bay-St. Marks River 141 0.02 0.02 G Floridan aquifer systemTallahassee, city of Leon Apalachee Bay-St. Marks River 165,773 25.69 25.69 G Floridan aquifer system Includes Woodville systemTalquin Electric Cooperative Annawood Leon Apalachee Bay-St. Marks River 114 0.01 0.01 G Floridan aquifer systemTalquin Electric Cooperative Bradfordville Regional Leon Lower Ochlockonee River 4,281 0.79 0.79 G Floridan aquifer systemTalquin Electric Cooperative Burgess Circle Leon Apalachee Bay-St. Marks River 82 0.01 0.01 G Floridan aquifer systemTalquin Electric Cooperative Kiper W/S Leon Apalachee Bay-St. Marks River 82 0.01 0.01 G Floridan aquifer systemTalquin Electric Cooperative Heartwood Hills Leon Apalachee Bay-St. Marks River N/A 0.01 0.01 G Floridan aquifer systemTalquin Electric Cooperative Lake Jackson Regional Leon Lower Ochlockonee River 8,835 1.17 1.17 G Floridan aquifer systemTalquin Electric Cooperative Leon East Regional Leon Apalachee Bay-St. Marks River 189 0.10 0.10 G Floridan aquifer systemTalquin Electric Cooperative Leon South Regional Leon Apalachee Bay-St. Marks River 508 0.07 0.07 G Floridan aquifer systemTalquin Electric Cooperative Leon West Regional Leon Lower Ochlockonee River 953 0.15 0.15 G Floridan aquifer systemTalquin Electric Cooperative Meadows at Wood Run Leon Apalachee Bay-St. Marks River 2,205 0.32 0.32 G Floridan aquifer systemTalquin Electric Cooperative Meridian Hills Leon Lower Ochlockonee River 162 0.03 0.03 G Floridan aquifer systemTalquin Electric Cooperative Pineridge Estates Leon Apalachee Bay-St. Marks River 368 0.06 0.06 G Floridan aquifer systemTalquin Electric Cooperative Stonegate S/D Leon Apalachee Bay-St. Marks River 150 0.02 0.02 G Floridan aquifer systemBronson, town of Levy Waccasassa River 269 0.18 0.18 G Floridan aquifer systemCedar Key, city of Levy Waccasassa River 704 0.16 0.16 G Floridan aquifer systemChiefland, city of Levy Lower Suwannee River 2,314 0.42 0.42 G Floridan aquifer systemFanning Springs, city of Levy Lower Suwannee River 703 0.13 0.13 G Floridan aquifer systemFowlers Bluff W/A Levy Lower Suwannee River 280 0.02 0.02 G Floridan aquifer systemHide-A-Way MHP Levy Waccasassa River 157 0.01 0.01 G Floridan aquifer systemInglewood Estates Levy Withlacoochee River 100 0.01 0.01 G Floridan aquifer systemInglis, town of Levy Withlacoochee River 664 0.14 0.14 G Floridan aquifer systemManatee Utilities Levy Lower Suwannee River 88 0.01 0.01 G Floridan aquifer systemOtter Creek, town of Levy Waccasassa River 171 0.02 0.02 G Floridan aquifer systemSpringside MHP Levy Lower Suwannee River 93 0.01 0.01 G Floridan aquifer systemUniversity Oaks S/D Levy Oklawaha River 188 0.01 0.01 G Floridan aquifer systemWilliston, city of Levy Oklawaha River 2,583 0.57 0.57 G Floridan aquifer systemYankeetown, town of Levy Withlacoochee River 617 0.12 0.12 G Floridan aquifer systemBristol, city of Liberty Apalachicola River 1,786 0.22 0.22 G Floridan aquifer systemEstiffanalga W/S Liberty Apalachicola River 175 0.01 0.01 G Floridan aquifer systemHosford-Telogia W/S Liberty Lower Ochlockonee River 437 0.07 0.07 G Floridan aquifer systemSumatra W/S Liberty Apalachicola River 204 0.01 0.01 G Floridan aquifer systemTalquin Electric Cooperative Sweatwater Liberty Lower Ochlockonee River 77 0.01 0.01 G Floridan aquifer systemCherry Lake Utilities Madison Withlacoochee River 578 0.05 0.05 G Floridan aquifer systemGreenville, town of Madison Aucilla River 1,224 0.18 0.18 G Floridan aquifer systemLee W/S Madison Withlacoochee River 314 0.01 0.01 G Floridan aquifer systemMadison, city of Madison Aucilla River 5,225 1.34 1.34 G Floridan aquifer systemBradenton, city of Manatee Manatee River 47,729 5.51 5.71 S Braden River Purchased (0.20 Mgal/d)Long Boat Key W/S Manatee Sarasota Bay 9,316 0.00 2.21 P Manatee County UtilitiesManatee County Utilities Manatee Manatee River 186,218 24.36 23.91 S Lake Manatee/Manatee River Purchased (12.16 Mgal/d) and sold (12.61 Mgal/d)Palmetto, city of Manatee Manatee River 9,582 0.00 1.21 P Manatee County UtilitiesAmaroc Enterprises Foxwood Farms MHP Marion Oklawaha River 387 0.06 0.06 G Floridan aquifer systemBelleview, city of Marion Withlacoochee River 3,287 0.63 0.63 G Floridan aquifer systemCommunity Water Cooperative Marion Oklawaha River 378 0.03 0.03 G Floridan aquifer systemCountry-Wide Utility Corp. Bahia Oaks Marion Oklawaha River 803 0.08 0.08 G Floridan aquifer systemDecca Utilities Oak Run Estates Marion Withlacoochee River 4,452 1.34 1.34 G Floridan aquifer systemDecca Utilities Pine Run Marion Withlacoochee River 1,664 0.45 0.45 G Floridan aquifer systemDrexel Properties Quail Hollow Marion Withlacoochee River 210 0.08 0.08 G Floridan aquifer systemDunnellon, city of Marion Withlacoochee River 1,844 0.32 0.32 G Floridan aquifer systemEagle Springs Utilities Marion Oklawaha River 464 0.04 0.04 G Floridan aquifer systemFort King Forest Marion Oklawaha River 273 0.05 0.05 G Floridan aquifer system
APPENDIX I. Public supply population served, water withdrawn and use, and water source by utility in Florida, 1995[Sources: U.S. Geological Survey, Florida Department of Environmental Protection, and the five water management districts; Abbrevations and location of cataloging units and counties are shown on pages 50 and 51; Utility/Owners indented are affilated with the Utility/Owner justified left immediately above; For Utility/Owners that purchase water, their population served and water use are included in the supplies totals unless listed specifically]
Utility/Owner Facility/Plant County Cataloging unit of water user
1995 estimates
Primary water source Comments/secondary water source Populationserved
Waterwithdrawn
(Mgal/d)
Wateruse
(Mgal/d)
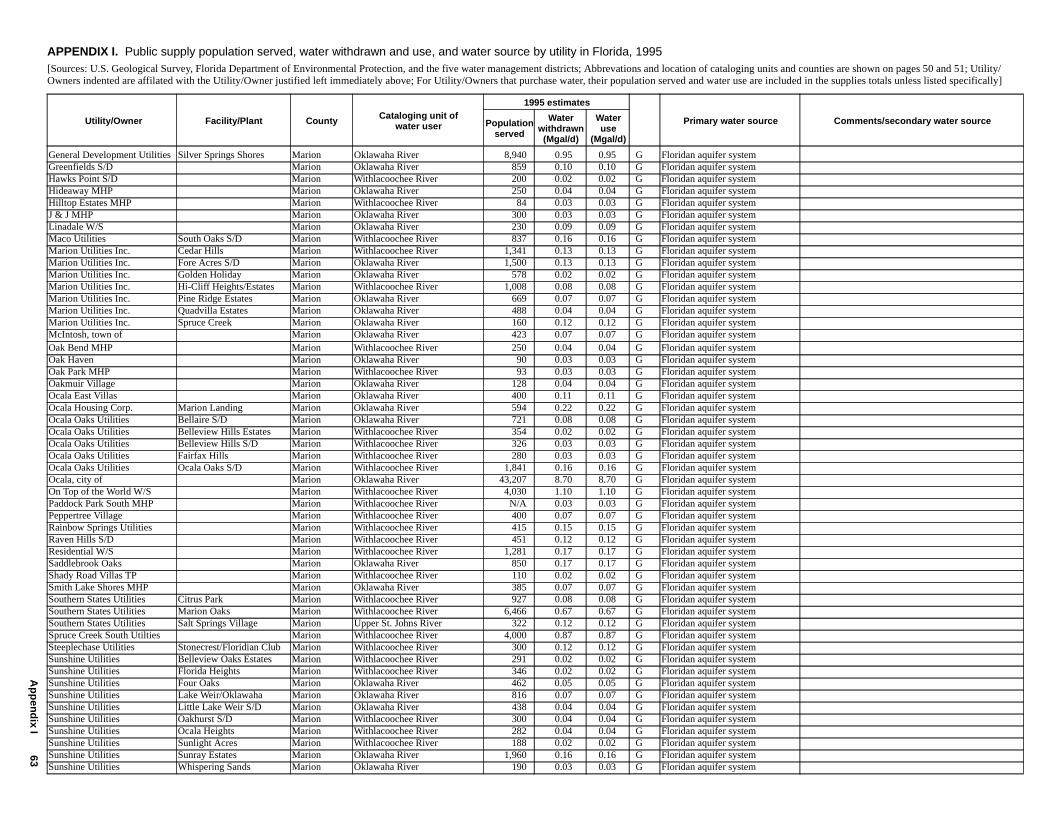
Ap
pen
dix I
63
General Development Utilities Silver Springs Shores Marion Oklawaha River 8,940 0.95 0.95 G Floridan aquifer systemGreenfields S/D Marion Oklawaha River 859 0.10 0.10 G Floridan aquifer systemHawks Point S/D Marion Withlacoochee River 200 0.02 0.02 G Floridan aquifer systemHideaway MHP Marion Oklawaha River 250 0.04 0.04 G Floridan aquifer systemHilltop Estates MHP Marion Withlacoochee River 84 0.03 0.03 G Floridan aquifer systemJ & J MHP Marion Oklawaha River 300 0.03 0.03 G Floridan aquifer systemLinadale W/S Marion Oklawaha River 230 0.09 0.09 G Floridan aquifer systemMaco Utilities South Oaks S/D Marion Withlacoochee River 837 0.16 0.16 G Floridan aquifer systemMarion Utilities Inc. Cedar Hills Marion Withlacoochee River 1,341 0.13 0.13 G Floridan aquifer systemMarion Utilities Inc. Fore Acres S/D Marion Oklawaha River 1,500 0.13 0.13 G Floridan aquifer systemMarion Utilities Inc. Golden Holiday Marion Oklawaha River 578 0.02 0.02 G Floridan aquifer systemMarion Utilities Inc. Hi-Cliff Heights/Estates Marion Withlacoochee River 1,008 0.08 0.08 G Floridan aquifer systemMarion Utilities Inc. Pine Ridge Estates Marion Oklawaha River 669 0.07 0.07 G Floridan aquifer systemMarion Utilities Inc. Quadvilla Estates Marion Oklawaha River 488 0.04 0.04 G Floridan aquifer systemMarion Utilities Inc. Spruce Creek Marion Oklawaha River 160 0.12 0.12 G Floridan aquifer systemMcIntosh, town of Marion Oklawaha River 423 0.07 0.07 G Floridan aquifer systemOak Bend MHP Marion Withlacoochee River 250 0.04 0.04 G Floridan aquifer systemOak Haven Marion Oklawaha River 90 0.03 0.03 G Floridan aquifer systemOak Park MHP Marion Withlacoochee River 93 0.03 0.03 G Floridan aquifer systemOakmuir Village Marion Oklawaha River 128 0.04 0.04 G Floridan aquifer systemOcala East Villas Marion Oklawaha River 400 0.11 0.11 G Floridan aquifer systemOcala Housing Corp. Marion Landing Marion Oklawaha River 594 0.22 0.22 G Floridan aquifer systemOcala Oaks Utilities Bellaire S/D Marion Oklawaha River 721 0.08 0.08 G Floridan aquifer systemOcala Oaks Utilities Belleview Hills Estates Marion Withlacoochee River 354 0.02 0.02 G Floridan aquifer systemOcala Oaks Utilities Belleview Hills S/D Marion Withlacoochee River 326 0.03 0.03 G Floridan aquifer systemOcala Oaks Utilities Fairfax Hills Marion Withlacoochee River 280 0.03 0.03 G Floridan aquifer systemOcala Oaks Utilities Ocala Oaks S/D Marion Withlacoochee River 1,841 0.16 0.16 G Floridan aquifer systemOcala, city of Marion Oklawaha River 43,207 8.70 8.70 G Floridan aquifer systemOn Top of the World W/S Marion Withlacoochee River 4,030 1.10 1.10 G Floridan aquifer systemPaddock Park South MHP Marion Withlacoochee River N/A 0.03 0.03 G Floridan aquifer systemPeppertree Village Marion Withlacoochee River 400 0.07 0.07 G Floridan aquifer systemRainbow Springs Utilities Marion Withlacoochee River 415 0.15 0.15 G Floridan aquifer systemRaven Hills S/D Marion Withlacoochee River 451 0.12 0.12 G Floridan aquifer systemResidential W/S Marion Withlacoochee River 1,281 0.17 0.17 G Floridan aquifer systemSaddlebrook Oaks Marion Oklawaha River 850 0.17 0.17 G Floridan aquifer systemShady Road Villas TP Marion Withlacoochee River 110 0.02 0.02 G Floridan aquifer systemSmith Lake Shores MHP Marion Oklawaha River 385 0.07 0.07 G Floridan aquifer systemSouthern States Utilities Citrus Park Marion Withlacoochee River 927 0.08 0.08 G Floridan aquifer systemSouthern States Utilities Marion Oaks Marion Withlacoochee River 6,466 0.67 0.67 G Floridan aquifer systemSouthern States Utilities Salt Springs Village Marion Upper St. Johns River 322 0.12 0.12 G Floridan aquifer systemSpruce Creek South Utilties Marion Withlacoochee River 4,000 0.87 0.87 G Floridan aquifer systemSteeplechase Utilities Stonecrest/Floridian Club Marion Withlacoochee River 300 0.12 0.12 G Floridan aquifer systemSunshine Utilities Belleview Oaks Estates Marion Withlacoochee River 291 0.02 0.02 G Floridan aquifer systemSunshine Utilities Florida Heights Marion Withlacoochee River 346 0.02 0.02 G Floridan aquifer systemSunshine Utilities Four Oaks Marion Oklawaha River 462 0.05 0.05 G Floridan aquifer systemSunshine Utilities Lake Weir/Oklawaha Marion Oklawaha River 816 0.07 0.07 G Floridan aquifer systemSunshine Utilities Little Lake Weir S/D Marion Oklawaha River 438 0.04 0.04 G Floridan aquifer systemSunshine Utilities Oakhurst S/D Marion Withlacoochee River 300 0.04 0.04 G Floridan aquifer systemSunshine Utilities Ocala Heights Marion Withlacoochee River 282 0.04 0.04 G Floridan aquifer systemSunshine Utilities Sunlight Acres Marion Withlacoochee River 188 0.02 0.02 G Floridan aquifer systemSunshine Utilities Sunray Estates Marion Oklawaha River 1,960 0.16 0.16 G Floridan aquifer systemSunshine Utilities Whispering Sands Marion Oklawaha River 190 0.03 0.03 G Floridan aquifer system
APPENDIX I. Public supply population served, water withdrawn and use, and water source by utility in Florida, 1995[Sources: U.S. Geological Survey, Florida Department of Environmental Protection, and the five water management districts; Abbrevations and location of cataloging units and counties are shown on pages 50 and 51; Utility/Owners indented are affilated with the Utility/Owner justified left immediately above; For Utility/Owners that purchase water, their population served and water use are included in the supplies totals unless listed specifically]
Utility/Owner Facility/Plant County Cataloging unit of water user
1995 estimates
Primary water source Comments/secondary water source Populationserved
Waterwithdrawn(Mgal/d)
Wateruse
(Mgal/d)
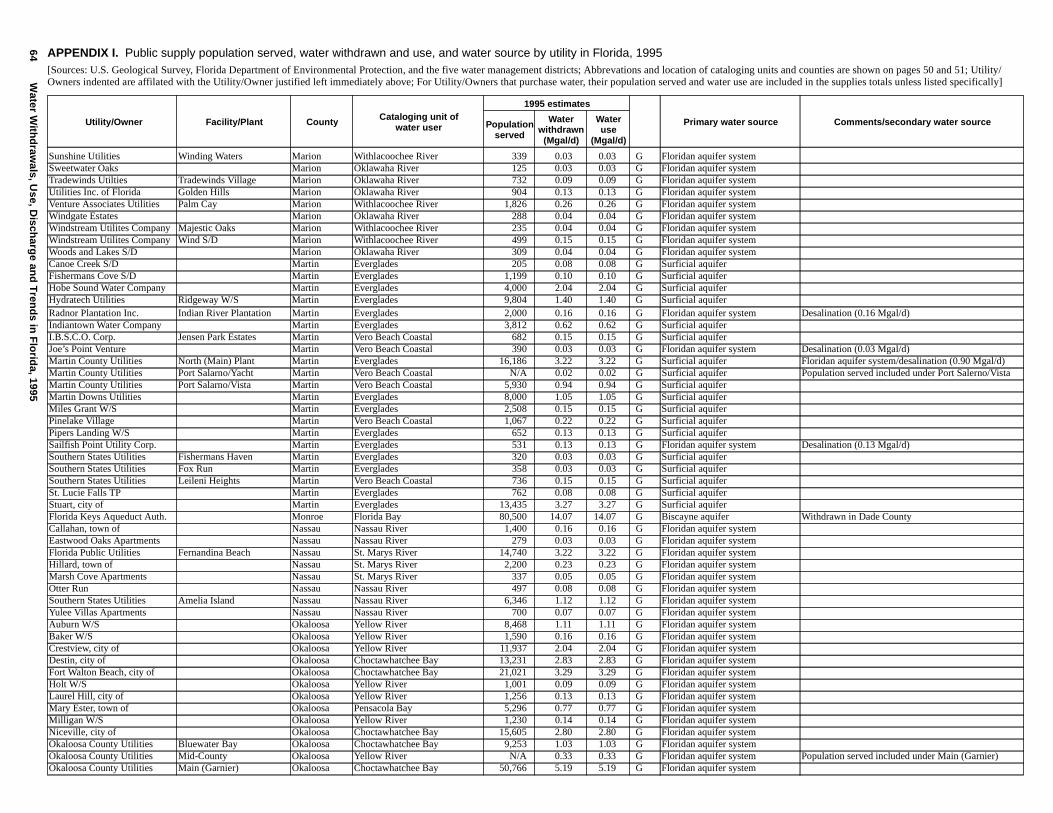
64W
ater With
draw
als, Use, D
ischarg
e and
Tren
ds in
Flo
rida, 1995
Sunshine Utilities Winding Waters Marion Withlacoochee River 339 0.03 0.03 G Floridan aquifer systemSweetwater Oaks Marion Oklawaha River 125 0.03 0.03 G Floridan aquifer systemTradewinds Utilties Tradewinds Village Marion Oklawaha River 732 0.09 0.09 G Floridan aquifer systemUtilities Inc. of Florida Golden Hills Marion Oklawaha River 904 0.13 0.13 G Floridan aquifer systemVenture Associates Utilities Palm Cay Marion Withlacoochee River 1,826 0.26 0.26 G Floridan aquifer systemWindgate Estates Marion Oklawaha River 288 0.04 0.04 G Floridan aquifer systemWindstream Utilites Company Majestic Oaks Marion Withlacoochee River 235 0.04 0.04 G Floridan aquifer systemWindstream Utilites Company Wind S/D Marion Withlacoochee River 499 0.15 0.15 G Floridan aquifer systemWoods and Lakes S/D Marion Oklawaha River 309 0.04 0.04 G Floridan aquifer systemCanoe Creek S/D Martin Everglades 205 0.08 0.08 G Surficial aquiferFishermans Cove S/D Martin Everglades 1,199 0.10 0.10 G Surficial aquiferHobe Sound Water Company Martin Everglades 4,000 2.04 2.04 G Surficial aquiferHydratech Utilities Ridgeway W/S Martin Everglades 9,804 1.40 1.40 G Surficial aquiferRadnor Plantation Inc. Indian River Plantation Martin Everglades 2,000 0.16 0.16 G Floridan aquifer system Desalination (0.16 Mgal/d)Indiantown Water Company Martin Everglades 3,812 0.62 0.62 G Surficial aquiferI.B.S.C.O. Corp. Jensen Park Estates Martin Vero Beach Coastal 682 0.15 0.15 G Surficial aquiferJoe’s Point Venture Martin Vero Beach Coastal 390 0.03 0.03 G Floridan aquifer system Desalination (0.03 Mgal/d)Martin County Utilities North (Main) Plant Martin Everglades 16,186 3.22 3.22 G Surficial aquifer Floridan aquifer system/desalination (0.90 Mgal/d)Martin County Utilities Port Salarno/Yacht Martin Vero Beach Coastal N/A 0.02 0.02 G Surficial aquifer Population served included under Port Salerno/VistaMartin County Utilities Port Salarno/Vista Martin Vero Beach Coastal 5,930 0.94 0.94 G Surficial aquiferMartin Downs Utilities Martin Everglades 8,000 1.05 1.05 G Surficial aquiferMiles Grant W/S Martin Everglades 2,508 0.15 0.15 G Surficial aquiferPinelake Village Martin Vero Beach Coastal 1,067 0.22 0.22 G Surficial aquiferPipers Landing W/S Martin Everglades 652 0.13 0.13 G Surficial aquiferSailfish Point Utility Corp. Martin Everglades 531 0.13 0.13 G Floridan aquifer system Desalination (0.13 Mgal/d)Southern States Utilities Fishermans Haven Martin Everglades 320 0.03 0.03 G Surficial aquiferSouthern States Utilities Fox Run Martin Everglades 358 0.03 0.03 G Surficial aquiferSouthern States Utilities Leileni Heights Martin Vero Beach Coastal 736 0.15 0.15 G Surficial aquiferSt. Lucie Falls TP Martin Everglades 762 0.08 0.08 G Surficial aquiferStuart, city of Martin Everglades 13,435 3.27 3.27 G Surficial aquiferFlorida Keys Aqueduct Auth. Monroe Florida Bay 80,500 14.07 14.07 G Biscayne aquifer Withdrawn in Dade CountyCallahan, town of Nassau Nassau River 1,400 0.16 0.16 G Floridan aquifer systemEastwood Oaks Apartments Nassau Nassau River 279 0.03 0.03 G Floridan aquifer systemFlorida Public Utilities Fernandina Beach Nassau St. Marys River 14,740 3.22 3.22 G Floridan aquifer systemHillard, town of Nassau St. Marys River 2,200 0.23 0.23 G Floridan aquifer systemMarsh Cove Apartments Nassau St. Marys River 337 0.05 0.05 G Floridan aquifer systemOtter Run Nassau Nassau River 497 0.08 0.08 G Floridan aquifer systemSouthern States Utilities Amelia Island Nassau Nassau River 6,346 1.12 1.12 G Floridan aquifer systemYulee Villas Apartments Nassau Nassau River 700 0.07 0.07 G Floridan aquifer systemAuburn W/S Okaloosa Yellow River 8,468 1.11 1.11 G Floridan aquifer systemBaker W/S Okaloosa Yellow River 1,590 0.16 0.16 G Floridan aquifer systemCrestview, city of Okaloosa Yellow River 11,937 2.04 2.04 G Floridan aquifer systemDestin, city of Okaloosa Choctawhatchee Bay 13,231 2.83 2.83 G Floridan aquifer systemFort Walton Beach, city of Okaloosa Choctawhatchee Bay 21,021 3.29 3.29 G Floridan aquifer systemHolt W/S Okaloosa Yellow River 1,001 0.09 0.09 G Floridan aquifer systemLaurel Hill, city of Okaloosa Yellow River 1,256 0.13 0.13 G Floridan aquifer systemMary Ester, town of Okaloosa Pensacola Bay 5,296 0.77 0.77 G Floridan aquifer systemMilligan W/S Okaloosa Yellow River 1,230 0.14 0.14 G Floridan aquifer systemNiceville, city of Okaloosa Choctawhatchee Bay 15,605 2.80 2.80 G Floridan aquifer systemOkaloosa County Utilities Bluewater Bay Okaloosa Choctawhatchee Bay 9,253 1.03 1.03 G Floridan aquifer systemOkaloosa County Utilities Mid-County Okaloosa Yellow River N/A 0.33 0.33 G Floridan aquifer system Population served included under Main (Garnier)Okaloosa County Utilities Main (Garnier) Okaloosa Choctawhatchee Bay 50,766 5.19 5.19 G Floridan aquifer system
APPENDIX I. Public supply population served, water withdrawn and use, and water source by utility in Florida, 1995[Sources: U.S. Geological Survey, Florida Department of Environmental Protection, and the five water management districts; Abbrevations and location of cataloging units and counties are shown on pages 50 and 51; Utility/Owners indented are affilated with the Utility/Owner justified left immediately above; For Utility/Owners that purchase water, their population served and water use are included in the supplies totals unless listed specifically]
Utility/Owner Facility/Plant County Cataloging unit of water user
1995 estimates
Primary water source Comments/secondary water source Populationserved
Waterwithdrawn
(Mgal/d)
Wateruse
(Mgal/d)
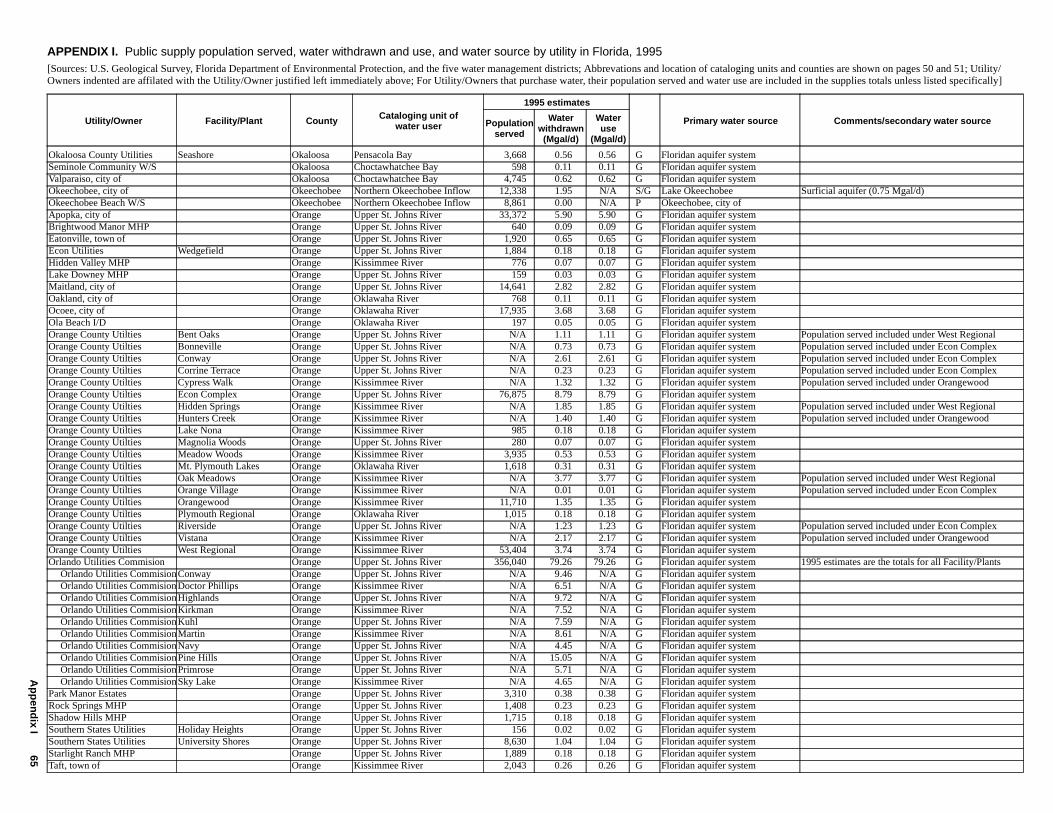
Ap
pen
dix I
65
Okaloosa County Utilities Seashore Okaloosa Pensacola Bay 3,668 0.56 0.56 G Floridan aquifer systemSeminole Community W/S Okaloosa Choctawhatchee Bay 598 0.11 0.11 G Floridan aquifer systemValparaiso, city of Okaloosa Choctawhatchee Bay 4,745 0.62 0.62 G Floridan aquifer systemOkeechobee, city of Okeechobee Northern Okeechobee Inflow 12,338 1.95 N/A S/G Lake Okeechobee Surficial aquifer (0.75 Mgal/d)Okeechobee Beach W/S Okeechobee Northern Okeechobee Inflow 8,861 0.00 N/A P Okeechobee, city ofApopka, city of Orange Upper St. Johns River 33,372 5.90 5.90 G Floridan aquifer systemBrightwood Manor MHP Orange Upper St. Johns River 640 0.09 0.09 G Floridan aquifer systemEatonville, town of Orange Upper St. Johns River 1,920 0.65 0.65 G Floridan aquifer systemEcon Utilities Wedgefield Orange Upper St. Johns River 1,884 0.18 0.18 G Floridan aquifer systemHidden Valley MHP Orange Kissimmee River 776 0.07 0.07 G Floridan aquifer systemLake Downey MHP Orange Upper St. Johns River 159 0.03 0.03 G Floridan aquifer systemMaitland, city of Orange Upper St. Johns River 14,641 2.82 2.82 G Floridan aquifer systemOakland, city of Orange Oklawaha River 768 0.11 0.11 G Floridan aquifer systemOcoee, city of Orange Oklawaha River 17,935 3.68 3.68 G Floridan aquifer systemOla Beach I/D Orange Oklawaha River 197 0.05 0.05 G Floridan aquifer systemOrange County Utilties Bent Oaks Orange Upper St. Johns River N/A 1.11 1.11 G Floridan aquifer system Population served included under West RegionalOrange County Utilties Bonneville Orange Upper St. Johns River N/A 0.73 0.73 G Floridan aquifer system Population served included under Econ ComplexOrange County Utilties Conway Orange Upper St. Johns River N/A 2.61 2.61 G Floridan aquifer system Population served included under Econ ComplexOrange County Utilties Corrine Terrace Orange Upper St. Johns River N/A 0.23 0.23 G Floridan aquifer system Population served included under Econ ComplexOrange County Utilties Cypress Walk Orange Kissimmee River N/A 1.32 1.32 G Floridan aquifer system Population served included under OrangewoodOrange County Utilties Econ Complex Orange Upper St. Johns River 76,875 8.79 8.79 G Floridan aquifer systemOrange County Utilties Hidden Springs Orange Kissimmee River N/A 1.85 1.85 G Floridan aquifer system Population served included under West RegionalOrange County Utilties Hunters Creek Orange Kissimmee River N/A 1.40 1.40 G Floridan aquifer system Population served included under OrangewoodOrange County Utilties Lake Nona Orange Kissimmee River 985 0.18 0.18 G Floridan aquifer systemOrange County Utilties Magnolia Woods Orange Upper St. Johns River 280 0.07 0.07 G Floridan aquifer systemOrange County Utilties Meadow Woods Orange Kissimmee River 3,935 0.53 0.53 G Floridan aquifer systemOrange County Utilties Mt. Plymouth Lakes Orange Oklawaha River 1,618 0.31 0.31 G Floridan aquifer systemOrange County Utilties Oak Meadows Orange Kissimmee River N/A 3.77 3.77 G Floridan aquifer system Population served included under West RegionalOrange County Utilties Orange Village Orange Kissimmee River N/A 0.01 0.01 G Floridan aquifer system Population served included under Econ ComplexOrange County Utilties Orangewood Orange Kissimmee River 11,710 1.35 1.35 G Floridan aquifer systemOrange County Utilties Plymouth Regional Orange Oklawaha River 1,015 0.18 0.18 G Floridan aquifer systemOrange County Utilties Riverside Orange Upper St. Johns River N/A 1.23 1.23 G Floridan aquifer system Population served included under Econ ComplexOrange County Utilties Vistana Orange Kissimmee River N/A 2.17 2.17 G Floridan aquifer system Population served included under OrangewoodOrange County Utilties West Regional Orange Kissimmee River 53,404 3.74 3.74 G Floridan aquifer systemOrlando Utilities Commision Orange Upper St. Johns River 356,040 79.26 79.26 G Floridan aquifer system 1995 estimates are the totals for all Facility/Plants Orlando Utilities Commision Conway Orange Upper St. Johns River N/A 9.46 N/A G Floridan aquifer system Orlando Utilities Commision Doctor Phillips Orange Kissimmee River N/A 6.51 N/A G Floridan aquifer system Orlando Utilities Commision Highlands Orange Upper St. Johns River N/A 9.72 N/A G Floridan aquifer system Orlando Utilities Commision Kirkman Orange Kissimmee River N/A 7.52 N/A G Floridan aquifer system Orlando Utilities Commision Kuhl Orange Upper St. Johns River N/A 7.59 N/A G Floridan aquifer system Orlando Utilities Commision Martin Orange Kissimmee River N/A 8.61 N/A G Floridan aquifer system Orlando Utilities Commision Navy Orange Upper St. Johns River N/A 4.45 N/A G Floridan aquifer system Orlando Utilities Commision Pine Hills Orange Upper St. Johns River N/A 15.05 N/A G Floridan aquifer system Orlando Utilities Commision Primrose Orange Upper St. Johns River N/A 5.71 N/A G Floridan aquifer system Orlando Utilities Commision Sky Lake Orange Kissimmee River N/A 4.65 N/A G Floridan aquifer systemPark Manor Estates Orange Upper St. Johns River 3,310 0.38 0.38 G Floridan aquifer systemRock Springs MHP Orange Upper St. Johns River 1,408 0.23 0.23 G Floridan aquifer systemShadow Hills MHP Orange Upper St. Johns River 1,715 0.18 0.18 G Floridan aquifer systemSouthern States Utilities Holiday Heights Orange Upper St. Johns River 156 0.02 0.02 G Floridan aquifer systemSouthern States Utilities University Shores Orange Upper St. Johns River 8,630 1.04 1.04 G Floridan aquifer systemStarlight Ranch MHP Orange Upper St. Johns River 1,889 0.18 0.18 G Floridan aquifer systemTaft, town of Orange Kissimmee River 2,043 0.26 0.26 G Floridan aquifer system
APPENDIX I. Public supply population served, water withdrawn and use, and water source by utility in Florida, 1995[Sources: U.S. Geological Survey, Florida Department of Environmental Protection, and the five water management districts; Abbrevations and location of cataloging units and counties are shown on pages 50 and 51; Utility/Owners indented are affilated with the Utility/Owner justified left immediately above; For Utility/Owners that purchase water, their population served and water use are included in the supplies totals unless listed specifically]
Utility/Owner Facility/Plant County Cataloging unit of water user
1995 estimates
Primary water source Comments/secondary water source Populationserved
Waterwithdrawn(Mgal/d)
Wateruse
(Mgal/d)
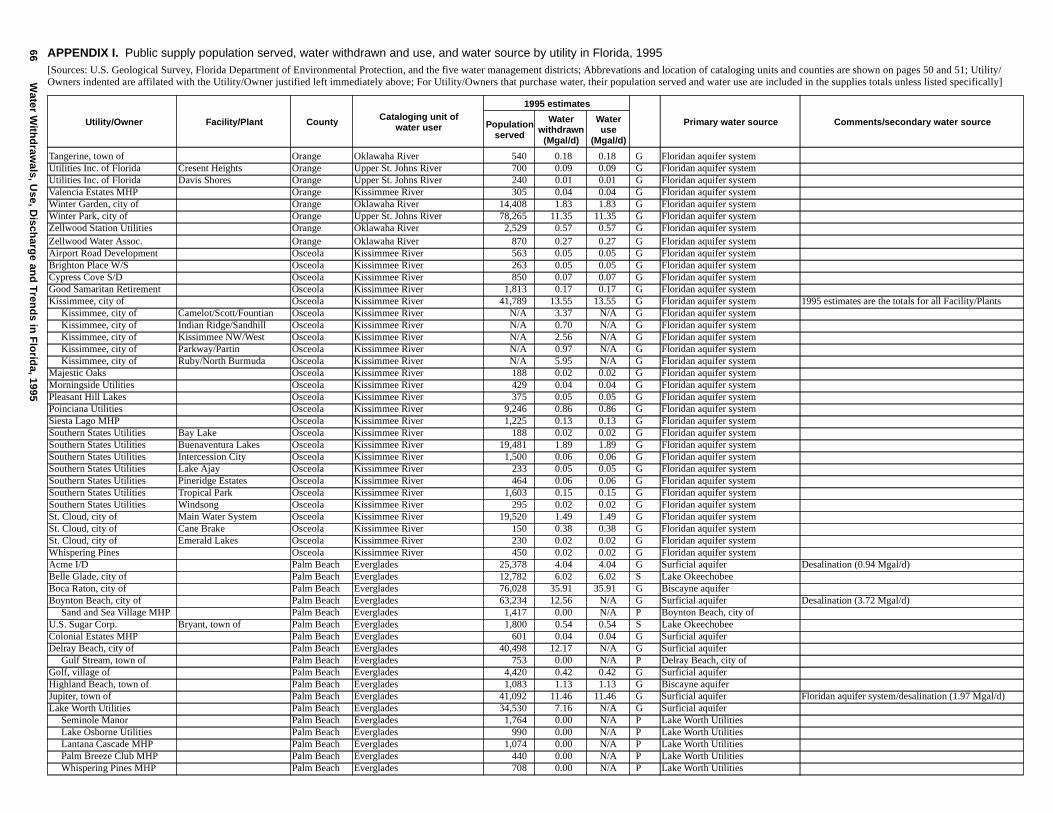
66W
ater With
draw
als, Use, D
ischarg
e and
Tren
ds in
Flo
rida, 1995
Tangerine, town of Orange Oklawaha River 540 0.18 0.18 G Floridan aquifer systemUtilities Inc. of Florida Cresent Heights Orange Upper St. Johns River 700 0.09 0.09 G Floridan aquifer systemUtilities Inc. of Florida Davis Shores Orange Upper St. Johns River 240 0.01 0.01 G Floridan aquifer systemValencia Estates MHP Orange Kissimmee River 305 0.04 0.04 G Floridan aquifer systemWinter Garden, city of Orange Oklawaha River 14,408 1.83 1.83 G Floridan aquifer systemWinter Park, city of Orange Upper St. Johns River 78,265 11.35 11.35 G Floridan aquifer systemZellwood Station Utilities Orange Oklawaha River 2,529 0.57 0.57 G Floridan aquifer systemZellwood Water Assoc. Orange Oklawaha River 870 0.27 0.27 G Floridan aquifer systemAirport Road Development Osceola Kissimmee River 563 0.05 0.05 G Floridan aquifer systemBrighton Place W/S Osceola Kissimmee River 263 0.05 0.05 G Floridan aquifer systemCypress Cove S/D Osceola Kissimmee River 850 0.07 0.07 G Floridan aquifer systemGood Samaritan Retirement Osceola Kissimmee River 1,813 0.17 0.17 G Floridan aquifer systemKissimmee, city of Osceola Kissimmee River 41,789 13.55 13.55 G Floridan aquifer system 1995 estimates are the totals for all Facility/Plants Kissimmee, city of Camelot/Scott/Fountian Osceola Kissimmee River N/A 3.37 N/A G Floridan aquifer system Kissimmee, city of Indian Ridge/Sandhill Osceola Kissimmee River N/A 0.70 N/A G Floridan aquifer system Kissimmee, city of Kissimmee NW/West Osceola Kissimmee River N/A 2.56 N/A G Floridan aquifer system Kissimmee, city of Parkway/Partin Osceola Kissimmee River N/A 0.97 N/A G Floridan aquifer system Kissimmee, city of Ruby/North Burmuda Osceola Kissimmee River N/A 5.95 N/A G Floridan aquifer systemMajestic Oaks Osceola Kissimmee River 188 0.02 0.02 G Floridan aquifer systemMorningside Utilities Osceola Kissimmee River 429 0.04 0.04 G Floridan aquifer systemPleasant Hill Lakes Osceola Kissimmee River 375 0.05 0.05 G Floridan aquifer systemPoinciana Utilities Osceola Kissimmee River 9,246 0.86 0.86 G Floridan aquifer systemSiesta Lago MHP Osceola Kissimmee River 1,225 0.13 0.13 G Floridan aquifer systemSouthern States Utilities Bay Lake Osceola Kissimmee River 188 0.02 0.02 G Floridan aquifer systemSouthern States Utilities Buenaventura Lakes Osceola Kissimmee River 19,481 1.89 1.89 G Floridan aquifer systemSouthern States Utilities Intercession City Osceola Kissimmee River 1,500 0.06 0.06 G Floridan aquifer systemSouthern States Utilities Lake Ajay Osceola Kissimmee River 233 0.05 0.05 G Floridan aquifer systemSouthern States Utilities Pineridge Estates Osceola Kissimmee River 464 0.06 0.06 G Floridan aquifer systemSouthern States Utilities Tropical Park Osceola Kissimmee River 1,603 0.15 0.15 G Floridan aquifer systemSouthern States Utilities Windsong Osceola Kissimmee River 295 0.02 0.02 G Floridan aquifer systemSt. Cloud, city of Main Water System Osceola Kissimmee River 19,520 1.49 1.49 G Floridan aquifer systemSt. Cloud, city of Cane Brake Osceola Kissimmee River 150 0.38 0.38 G Floridan aquifer systemSt. Cloud, city of Emerald Lakes Osceola Kissimmee River 230 0.02 0.02 G Floridan aquifer systemWhispering Pines Osceola Kissimmee River 450 0.02 0.02 G Floridan aquifer systemAcme I/D Palm Beach Everglades 25,378 4.04 4.04 G Surficial aquifer Desalination (0.94 Mgal/d)Belle Glade, city of Palm Beach Everglades 12,782 6.02 6.02 S Lake OkeechobeeBoca Raton, city of Palm Beach Everglades 76,028 35.91 35.91 G Biscayne aquiferBoynton Beach, city of Palm Beach Everglades 63,234 12.56 N/A G Surficial aquifer Desalination (3.72 Mgal/d) Sand and Sea Village MHP Palm Beach Everglades 1,417 0.00 N/A P Boynton Beach, city ofU.S. Sugar Corp. Bryant, town of Palm Beach Everglades 1,800 0.54 0.54 S Lake OkeechobeeColonial Estates MHP Palm Beach Everglades 601 0.04 0.04 G Surficial aquiferDelray Beach, city of Palm Beach Everglades 40,498 12.17 N/A G Surficial aquifer Gulf Stream, town of Palm Beach Everglades 753 0.00 N/A P Delray Beach, city ofGolf, village of Palm Beach Everglades 4,420 0.42 0.42 G Surficial aquiferHighland Beach, town of Palm Beach Everglades 1,083 1.13 1.13 G Biscayne aquiferJupiter, town of Palm Beach Everglades 41,092 11.46 11.46 G Surficial aquifer Floridan aquifer system/desalination (1.97 Mgal/d)Lake Worth Utilities Palm Beach Everglades 34,530 7.16 N/A G Surficial aquifer Seminole Manor Palm Beach Everglades 1,764 0.00 N/A P Lake Worth Utilities Lake Osborne Utilities Palm Beach Everglades 990 0.00 N/A P Lake Worth Utilities Lantana Cascade MHP Palm Beach Everglades 1,074 0.00 N/A P Lake Worth Utilities Palm Breeze Club MHP Palm Beach Everglades 440 0.00 N/A P Lake Worth Utilities Whispering Pines MHP Palm Beach Everglades 708 0.00 N/A P Lake Worth Utilities
APPENDIX I. Public supply population served, water withdrawn and use, and water source by utility in Florida, 1995[Sources: U.S. Geological Survey, Florida Department of Environmental Protection, and the five water management districts; Abbrevations and location of cataloging units and counties are shown on pages 50 and 51; Utility/Owners indented are affilated with the Utility/Owner justified left immediately above; For Utility/Owners that purchase water, their population served and water use are included in the supplies totals unless listed specifically]
Utility/Owner Facility/Plant County Cataloging unit of water user
1995 estimates
Primary water source Comments/secondary water source Populationserved
Waterwithdrawn
(Mgal/d)
Wateruse
(Mgal/d)

Ap
pen
dix I
67
Lake Worth Village Palm Beach Everglades 1,932 0.19 0.19 G Surficial aquiferLantana, town of Palm Beach Everglades 9,250 2.06 N/A G Surficial aquifer Palm Breezes Club MHP Palm Beach Everglades 250 0.00 N/A P Lantana, town ofMagnolia Park Utilities Palm Beach Everglades 806 0.34 0.34 G Surficial aquiferManalapan, town of Palm Beach Everglades 1,049 1.00 1.00 G Surficial aquiferPahokee, city of Palm Beach Everglades 5,179 0.77 N/A S Lake Okeechobee Southeastern States Utility Palm Beach Everglades 524 0.00 N/A P Pahokee, city ofPalm Beach County Utilities Palm Beach Everglades 350,250 34.78 N/A G Surficial aquifer Atlantis, city of Palm Beach Everglades 2,750 0.00 N/A P Palm Beach County Utilities Century Village Palm Beach Everglades 7,500 0.00 N/A P Palm Beach County UtilitiesPalm Springs Village Palm Beach Everglades 24,584 4.01 163 G Surficial aquifer Englewood Manor Palm Beach Everglades 881 0.00 N/A P Palm Springs Village Forest Hill Gardens Palm Beach Everglades 599 0.00 N/A P Palm Springs Village Forest Hill Gardens East Palm Beach Everglades 645 0.00 N/A P Palm Springs Village Lake Clarke Shores, town of Palm Beach Everglades 1,573 0.00 N/A P Palm Springs VillageRiviera Beach, city of Main System Palm Beach Everglades 26,088 8.75 N/A G Surficial aquifer Palm Lakes Estates North Palm Beach Everglades 480 0.00 N/A P Riviera Beach, city of Palm Lakes Estates South Palm Beach Everglades 700 0.00 N/A P Riviera Beach, city ofRiviera Beach, city of Water System 2 Palm Beach Everglades 1,561 0.19 0.19 G Surficial aquiferRoyal Palm Beach Utilities Palm Beach Everglades 15,467 2.20 2.20 G Surficial aquifer Desalination (0.12 Mgal/d)Seacoast Utilities Palm Beach Everglades 61,808 13.91 13.91 G Surficial aquiferSouth Bay, city of Palm Beach Everglades 2,982 0.47 N/A S Lake Okeechobee South Shore W/A Palm Beach Everglades 228 0.00 N/A P South Bay, city ofTequesta, village of Palm Beach Everglades 10,634 1.41 1.41 G Surficial aquiferTropical Breeze Estates Palm Beach Everglades 746 0.09 0.09 G Surficial aquiferWest Palm Beach, city of Palm Beach Everglades 67,643 25.22 25.22 S Clear Lake and Lake MangoniaWoodhaven Villas Palm Beach Everglades 312 0.04 0.04 G Surficial aquiferAloha Utilities Aloha Gardens Pasco Crystal-Pithlachascotee Rivers 6,935 0.12 0.42 P/G Pasco County Utilities Floridan aquifer system (0.12 Mgal/d)Aloha Utilities Seven Springs Pasco Crystal-Pithlachascotee Rivers 16,814 2.00 2.16 G/P Floridan aquifer system Purchased (0.16 Mgal/d)Bartelt Sunshine Buena Vista TP Pasco Crystal-Pithlachascotee Rivers 1,838 0.15 0.15 G Floridan aquifer systemCAV Homeowners Coop. Country Aire Village (CAV) Pasco Hillsborough River 550 0.35 0.35 G Floridan aquifer systemCountry Village MHP Pasco Crystal-Pithlachascotee Rivers 237 0.04 0.04 G Floridan aquifer systemCrestridge Utility Corp. Crestridge Gardens Pasco Crystal-Pithlachascotee Rivers 1,251 0.11 0.11 G Floridan aquifer systemCS Water Company, Inc. Crystal Springs (CS) Pasco Hillsborough River 669 0.08 0.08 G Floridan aquifer systemDade City, city of Pasco Withlacoochee River 15,578 1.50 1.50 G Floridan aquifer systemDixie Grove Estates Pasco Crystal-Pithlachascotee Rivers 602 0.04 0.04 G Floridan aquifer systemFloralino Properties Inc. Colonial Manor Pasco Crystal-Pithlachascotee Rivers 1,575 0.14 0.14 G Floridan aquifer systemForest Hills Utilities Inc. Pasco Crystal-Pithlachascotee Rivers 4,500 0.45 0.45 G Floridan aquifer systemHacienda Village MHP Pasco Crystal-Pithlachascotee Rivers 502 0.05 0.05 G Floridan aquifer systemHoliday Gardens Utilities Pasco Crystal-Pithlachascotee Rivers 1,183 0.09 0.09 G Floridan aquifer systemHudson Water Works Inc. Pasco Crystal-Pithlachascotee Rivers 5,922 0.59 0.59 G Floridan aquifer systemJasmine Lakes Utility Inc. Pasco Crystal-Pithlachascotee Rivers 3,434 0.08 0.18 P/G Pasco County Utilities Floridan aquifer system (0.10 Mgal/d)Lindrick Service Corp. Gulf Harbor Pasco Crystal-Pithlachascotee Rivers 8,018 0.07 0.70 P/G New Port Richey, city of Floridan aquifer system (0.07 Mgal/d)LWV Utilities Inc. Lakewood Village (LWV) Pasco Crystal-Pithlachascotee Rivers 700 0.05 0.05 G Floridan aquifer systemMad Hatter Utility Turtle Lakes Pasco Hillsborough River 4,030 0.58 0.58 G Floridan aquifer systemNew Port Richey, city of Pasco Crystal-Pithlachascotee Rivers 24,387 0.46 3.21 P/G WCRWSA Floridan aquifer system (0.46 Mgal/d) and sold
(1.06 Mgal/d)Orangewood Lakes MHP Pasco Crystal-Pithlachascotee Rivers 860 0.08 0.08 G Floridan aquifer systemOrder of Saint Bendictin Pasco Hillsborough River 505 0.09 0.09 G Floridan aquifer systemPasco County Utilities East System Pasco Hillsborough River 19,688 0.05 4.76 P/G WCRWSA Floridan aquifer system (0.05 Mgal/d)Pasco County Utilities West System Pasco Crystal-Pithlachascotee Rivers 103,063 0.59 11.26 P/G WCRWSA Floridan aquifer system (0.59 Mgal/d) and sold
(0.78 Mgal/d)
APPENDIX I. Public supply population served, water withdrawn and use, and water source by utility in Florida, 1995[Sources: U.S. Geological Survey, Florida Department of Environmental Protection, and the five water management districts; Abbrevations and location of cataloging units and counties are shown on pages 50 and 51; Utility/Owners indented are affilated with the Utility/Owner justified left immediately above; For Utility/Owners that purchase water, their population served and water use are included in the supplies totals unless listed specifically]
Utility/Owner Facility/Plant County Cataloging unit of water user
1995 estimates
Primary water source Comments/secondary water source Populationserved
Waterwithdrawn(Mgal/d)
Wateruse
(Mgal/d)

68W
ater With
draw
als, Use, D
ischarg
e and
Tren
ds in
Flo
rida, 1995
Pasco Utilities Inc. Angus Valley Pasco Hillsborough River 1,288 0.18 0.18 G Floridan aquifer systemPort Richey, city of Pasco Crystal-Pithlachascotee Rivers 7,955 0.42 0.80 G/P Floridan aquifer system Purchased (0.38 Mga/d)San Antonio, city of Pasco Hillsborough River 793 0.09 0.09 G Floridan aquifer systemScarecrow Utilities Pasco Crystal-Pithlachascotee Rivers 143 0.01 0.01 G Floridan aquifer systemSH Utility Inc. Shamerock Heights (SH) Pasco Crystal-Pithlachascotee Rivers 266 0.03 0.03 G Floridan aquifer systemSouthern States Utilities Palm Terrace Pasco Crystal-Pithlachascotee Rivers 2,332 0.06 0.22 P/G Pasco County Utilities Floridan aquifer system (0.06 Mgal/d)Sweetwater RV Park Pasco Hillsborough River 250 0.02 0.02 G Floridan aquifer systemTravelers Rest Inc. Pasco Withlacoochee River 382 0.05 0.05 G Floridan aquifer systemUtilities Inc. of Florida Orangewood W/S Pasco Crystal-Pithlachascotee Rivers 1,283 0.11 0.11 G Floridan aquifer systemUtilities Inc. of Florida Summer-tree Pasco Crystal-Pithlachascotee Rivers 1,757 0.13 0.13 G Floridan aquifer systemWCRWSA Cross Bar WF Pasco Crystal-Pithlachascotee Rivers 0 23.89 0.00 G Floridan aquifer system Sold (23.89 Mgal/d)WCRWSA Cypress Bridge WF Pasco Crystal-Pithlachascotee Rivers 0 1.52 0.00 G Floridan aquifer system Sold (1.52 Mgal/d)WCRWSA Cypress Creek WF Pasco Hillsborough River 0 27.28 0.00 G Floridan aquifer system Sold (27.28 Mgal/d)WCRWSA North Pasco WF Pasco Crystal-Pithlachascotee Rivers 0 2.19 0.00 G Floridan aquifer system Sold (2.19 Mgal/d)WCRWSA Starkey WF Pasco Crystal-Pithlachascotee Rivers 0 11.93 0.00 G Floridan aquifer system Sold (11.93 Mgal/d)Zephyrhills, city of Pasco Hillsborough River 13,168 2.18 1.87 G Floridan aquifer system Sold (0.31 Mgal/d)Belleair, town of Pinellas Crystal-Pithlachascotee Rivers 4,968 1.08 0.92 G Floridan aquifer system Sold (0.16 Mgal/d)Clearwater, city of Pinellas Crystal-Pithlachascotee Rivers 113,110 3.67 14.17 P/G Pinellas County Water/Sewer Floridan aquifer system (3.67 Mgal/d)Dunedin, city of Pinellas Crystal-Pithlachascotee Rivers 35,738 5.10 5.19 G/P Floridan aquifer system Pinellas County Water/Sewer (0.09 Mgal/d)Gulfport, city of Pinellas Crystal-Pithlachascotee Rivers 13,473 0.00 1.20 P St. Petersburg, city ofOldsmar, city of Pinellas Tampa Bay 9,500 0.00 1.08 P St. Petersburg, city ofPinellas County Water/Sewer Eldridge/Wilde WF Pinellas Tampa Bay 373,278 25.85 48.54 G/P Floridan aquifer system WCRWSA (43.74 Mgal/d) and sold (21.05 Mgal/d)Pinellas Park, city of Pinellas Crystal-Pithlachascotee Rivers 56,457 0.00 5.20 P Pinellas County Water/SewerSafety Harbor, city of Pinellas Tampa Bay 13,200 0.00 1.90 P Pinellas County Water/SewerSt. Petersburg, city of Pinellas Tampa Bay 290,963 0.00 31.18 P WCRWSA Sold (2.28 Mgal/d)Tarpon Springs, city of Pinellas Crystal-Pithlachascotee Rivers 26,624 0.27 3.27 P/G Pinellas County Water/Sewer Floridan aquifer system (0.27 Mgal/d)Utilities Inc. of Florida Lake Tarpon Pinellas Tampa Bay 1,280 0.14 0.14 G Floridan aquifer systemAuburndale, city of Polk Peace River 17,383 2.49 2.49 G Floridan aquifer systemBartow, city of Polk Peace River 17,200 3.83 3.83 G Floridan aquifer systemBreeze Hill MHP Polk Kissimmee River 150 0.06 0.06 G Floridan aquifer systemCarefree RV Country Club Polk Peace River 559 0.07 0.07 G Floridan aquifer systemCentury Reality Group Inc. Plantation Landings Polk Peace River 792 0.07 0.07 G Floridan aquifer systemCentury Reality Group Inc. Swiss Village Polk Peace River 1,557 0.26 0.26 G Floridan aquifer systemCentury Reality Group Inc. Polk Peace River 1,907 0.41 0.41 G Floridan aquifer systemCrooked Lake Park W/S Polk Kissimmee River 1,768 0.19 0.19 G Floridan aquifer systemCypress Lakes Venture Cypress Lakes Polk Peace River 1,354 0.22 0.22 G Floridan aquifer systemDavenport, town of Polk Kissimmee River 2,970 0.47 0.47 G Floridan aquifer systemDundee, town of Polk Peace River 3,196 0.45 0.45 G Floridan aquifer systemEagle Lake, city of Polk Peace River 2,481 0.24 0.24 G Floridan aquifer systemEmerald Acres/Lakes Polk Oklawaha River 200 0.02 0.02 G Floridan aquifer systemFort Meade, city of Polk Peace River 6,123 1.05 1.05 G Floridan aquifer systemFrostproof, city of Polk Kissimmee River 3,129 1.33 1.33 G Floridan aquifer systemGarden Grove Utilities Towerwood Polk Peace River 356 0.05 0.05 G Floridan aquifer systemGarden Grove Water Company Cypress Gardens Polk Peace River 20,043 2.96 2.96 G Floridan aquifer systemHaines City, city of Polk Peace River 12,601 2.21 2.21 G Floridan aquifer systemIndian Lake Estates Polk Kissimmee River 251 0.19 0.19 G Floridan aquifer systemLake Alfred, city of Polk Peace River 4,247 0.67 0.67 G Floridan aquifer systemLake Hamilton, town of Polk Peace River 1,630 0.28 0.28 G Floridan aquifer systemLake Regional MHP Polk Peace River 988 0.11 0.11 G Floridan aquifer systemLake Wales Utility Corp. Fedhaven Polk Kissimmee River 2,100 0.15 0.15 G Floridan aquifer systemLake Wales, city of Polk Kissimmee River 17,047 2.63 2.63 G Floridan aquifer systemLakeland, city of Polk City System Polk Withlacoochee River 1,888 0.28 0.28 G Floridan aquifer system
APPENDIX I. Public supply population served, water withdrawn and use, and water source by utility in Florida, 1995[Sources: U.S. Geological Survey, Florida Department of Environmental Protection, and the five water management districts; Abbrevations and location of cataloging units and counties are shown on pages 50 and 51; Utility/Owners indented are affilated with the Utility/Owner justified left immediately above; For Utility/Owners that purchase water, their population served and water use are included in the supplies totals unless listed specifically]
Utility/Owner Facility/Plant County Cataloging unit of water user
1995 estimates
Primary water source Comments/secondary water source Populationserved
Waterwithdrawn
(Mgal/d)
Wateruse
(Mgal/d)
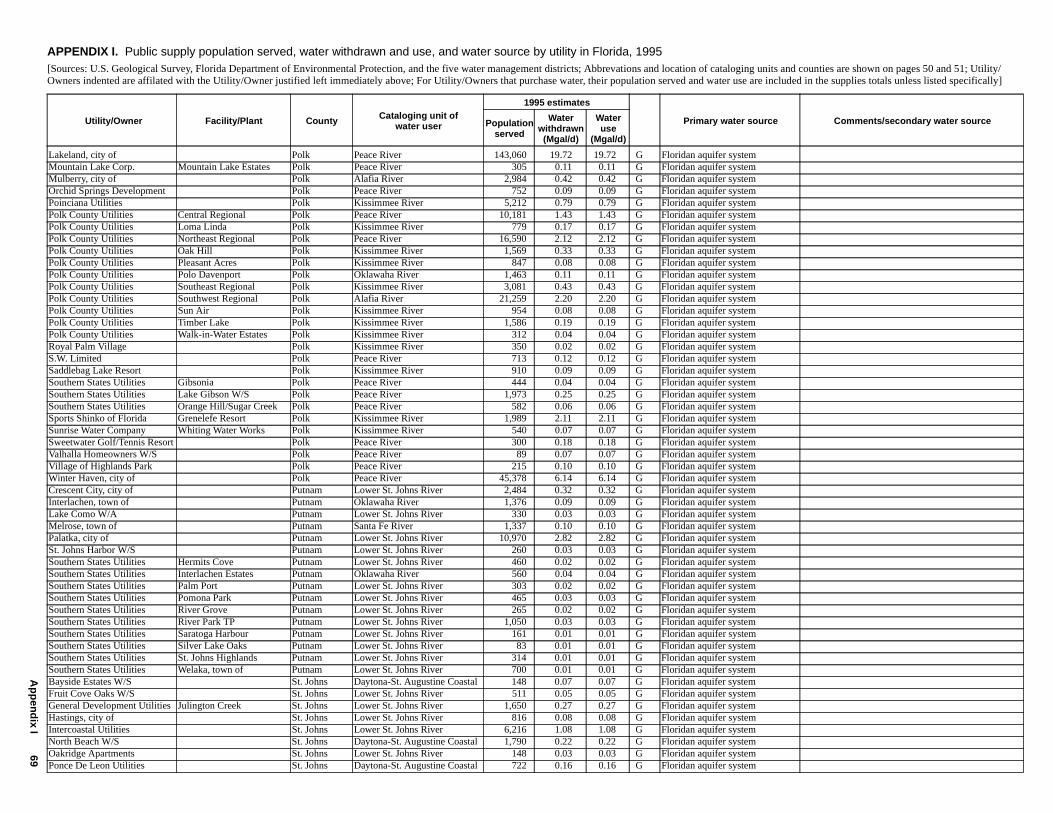
Ap
pen
dix I
69
Lakeland, city of Polk Peace River 143,060 19.72 19.72 G Floridan aquifer systemMountain Lake Corp. Mountain Lake Estates Polk Peace River 305 0.11 0.11 G Floridan aquifer systemMulberry, city of Polk Alafia River 2,984 0.42 0.42 G Floridan aquifer systemOrchid Springs Development Polk Peace River 752 0.09 0.09 G Floridan aquifer systemPoinciana Utilities Polk Kissimmee River 5,212 0.79 0.79 G Floridan aquifer systemPolk County Utilities Central Regional Polk Peace River 10,181 1.43 1.43 G Floridan aquifer systemPolk County Utilities Loma Linda Polk Kissimmee River 779 0.17 0.17 G Floridan aquifer systemPolk County Utilities Northeast Regional Polk Peace River 16,590 2.12 2.12 G Floridan aquifer systemPolk County Utilities Oak Hill Polk Kissimmee River 1,569 0.33 0.33 G Floridan aquifer systemPolk County Utilities Pleasant Acres Polk Kissimmee River 847 0.08 0.08 G Floridan aquifer systemPolk County Utilities Polo Davenport Polk Oklawaha River 1,463 0.11 0.11 G Floridan aquifer systemPolk County Utilities Southeast Regional Polk Kissimmee River 3,081 0.43 0.43 G Floridan aquifer systemPolk County Utilities Southwest Regional Polk Alafia River 21,259 2.20 2.20 G Floridan aquifer systemPolk County Utilities Sun Air Polk Kissimmee River 954 0.08 0.08 G Floridan aquifer systemPolk County Utilities Timber Lake Polk Kissimmee River 1,586 0.19 0.19 G Floridan aquifer systemPolk County Utilities Walk-in-Water Estates Polk Kissimmee River 312 0.04 0.04 G Floridan aquifer systemRoyal Palm Village Polk Kissimmee River 350 0.02 0.02 G Floridan aquifer systemS.W. Limited Polk Peace River 713 0.12 0.12 G Floridan aquifer systemSaddlebag Lake Resort Polk Kissimmee River 910 0.09 0.09 G Floridan aquifer systemSouthern States Utilities Gibsonia Polk Peace River 444 0.04 0.04 G Floridan aquifer systemSouthern States Utilities Lake Gibson W/S Polk Peace River 1,973 0.25 0.25 G Floridan aquifer systemSouthern States Utilities Orange Hill/Sugar Creek Polk Peace River 582 0.06 0.06 G Floridan aquifer systemSports Shinko of Florida Grenelefe Resort Polk Kissimmee River 1,989 2.11 2.11 G Floridan aquifer systemSunrise Water Company Whiting Water Works Polk Kissimmee River 540 0.07 0.07 G Floridan aquifer systemSweetwater Golf/Tennis Resort Polk Peace River 300 0.18 0.18 G Floridan aquifer systemValhalla Homeowners W/S Polk Peace River 89 0.07 0.07 G Floridan aquifer systemVillage of Highlands Park Polk Peace River 215 0.10 0.10 G Floridan aquifer systemWinter Haven, city of Polk Peace River 45,378 6.14 6.14 G Floridan aquifer systemCrescent City, city of Putnam Lower St. Johns River 2,484 0.32 0.32 G Floridan aquifer systemInterlachen, town of Putnam Oklawaha River 1,376 0.09 0.09 G Floridan aquifer systemLake Como W/A Putnam Lower St. Johns River 330 0.03 0.03 G Floridan aquifer systemMelrose, town of Putnam Santa Fe River 1,337 0.10 0.10 G Floridan aquifer systemPalatka, city of Putnam Lower St. Johns River 10,970 2.82 2.82 G Floridan aquifer systemSt. Johns Harbor W/S Putnam Lower St. Johns River 260 0.03 0.03 G Floridan aquifer systemSouthern States Utilities Hermits Cove Putnam Lower St. Johns River 460 0.02 0.02 G Floridan aquifer systemSouthern States Utilities Interlachen Estates Putnam Oklawaha River 560 0.04 0.04 G Floridan aquifer systemSouthern States Utilities Palm Port Putnam Lower St. Johns River 303 0.02 0.02 G Floridan aquifer systemSouthern States Utilities Pomona Park Putnam Lower St. Johns River 465 0.03 0.03 G Floridan aquifer systemSouthern States Utilities River Grove Putnam Lower St. Johns River 265 0.02 0.02 G Floridan aquifer systemSouthern States Utilities River Park TP Putnam Lower St. Johns River 1,050 0.03 0.03 G Floridan aquifer systemSouthern States Utilities Saratoga Harbour Putnam Lower St. Johns River 161 0.01 0.01 G Floridan aquifer systemSouthern States Utilities Silver Lake Oaks Putnam Lower St. Johns River 83 0.01 0.01 G Floridan aquifer systemSouthern States Utilities St. Johns Highlands Putnam Lower St. Johns River 314 0.01 0.01 G Floridan aquifer systemSouthern States Utilities Welaka, town of Putnam Lower St. Johns River 700 0.01 0.01 G Floridan aquifer systemBayside Estates W/S St. Johns Daytona-St. Augustine Coastal 148 0.07 0.07 G Floridan aquifer systemFruit Cove Oaks W/S St. Johns Lower St. Johns River 511 0.05 0.05 G Floridan aquifer systemGeneral Development Utilities Julington Creek St. Johns Lower St. Johns River 1,650 0.27 0.27 G Floridan aquifer systemHastings, city of St. Johns Lower St. Johns River 816 0.08 0.08 G Floridan aquifer systemIntercoastal Utilities St. Johns Lower St. Johns River 6,216 1.08 1.08 G Floridan aquifer systemNorth Beach W/S St. Johns Daytona-St. Augustine Coastal 1,790 0.22 0.22 G Floridan aquifer systemOakridge Apartments St. Johns Lower St. Johns River 148 0.03 0.03 G Floridan aquifer systemPonce De Leon Utilities St. Johns Daytona-St. Augustine Coastal 722 0.16 0.16 G Floridan aquifer system
APPENDIX I. Public supply population served, water withdrawn and use, and water source by utility in Florida, 1995[Sources: U.S. Geological Survey, Florida Department of Environmental Protection, and the five water management districts; Abbrevations and location of cataloging units and counties are shown on pages 50 and 51; Utility/Owners indented are affilated with the Utility/Owner justified left immediately above; For Utility/Owners that purchase water, their population served and water use are included in the supplies totals unless listed specifically]
Utility/Owner Facility/Plant County Cataloging unit of water user
1995 estimates
Primary water source Comments/secondary water source Populationserved
Waterwithdrawn(Mgal/d)
Wateruse
(Mgal/d)
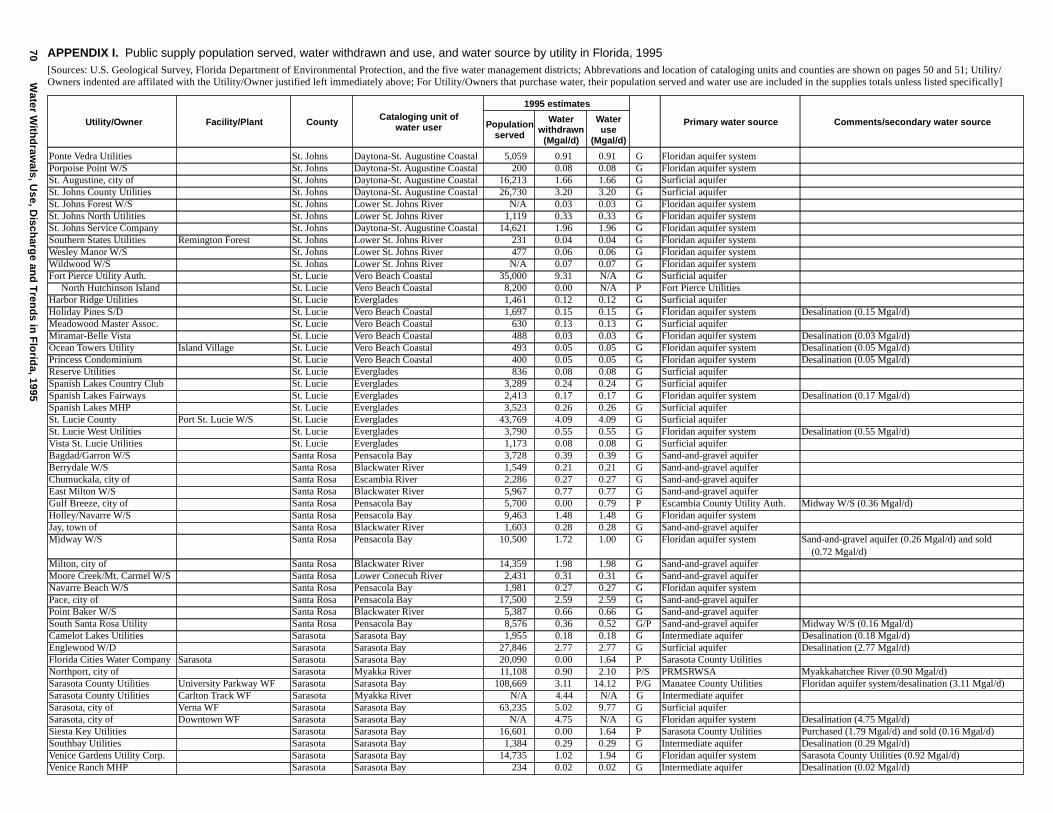
70W
ater With
draw
als, Use, D
ischarg
e and
Tren
ds in
Flo
rida, 1995
Ponte Vedra Utilities St. Johns Daytona-St. Augustine Coastal 5,059 0.91 0.91 G Floridan aquifer systemPorpoise Point W/S St. Johns Daytona-St. Augustine Coastal 200 0.08 0.08 G Floridan aquifer systemSt. Augustine, city of St. Johns Daytona-St. Augustine Coastal 16,213 1.66 1.66 G Surficial aquiferSt. Johns County Utilities St. Johns Daytona-St. Augustine Coastal 26,730 3.20 3.20 G Surficial aquiferSt. Johns Forest W/S St. Johns Lower St. Johns River N/A 0.03 0.03 G Floridan aquifer systemSt. Johns North Utilities St. Johns Lower St. Johns River 1,119 0.33 0.33 G Floridan aquifer systemSt. Johns Service Company St. Johns Daytona-St. Augustine Coastal 14,621 1.96 1.96 G Floridan aquifer systemSouthern States Utilities Remington Forest St. Johns Lower St. Johns River 231 0.04 0.04 G Floridan aquifer systemWesley Manor W/S St. Johns Lower St. Johns River 477 0.06 0.06 G Floridan aquifer systemWildwood W/S St. Johns Lower St. Johns River N/A 0.07 0.07 G Floridan aquifer systemFort Pierce Utility Auth. St. Lucie Vero Beach Coastal 35,000 9.31 N/A G Surficial aquifer North Hutchinson Island St. Lucie Vero Beach Coastal 8,200 0.00 N/A P Fort Pierce UtilitiesHarbor Ridge Utilities St. Lucie Everglades 1,461 0.12 0.12 G Surficial aquiferHoliday Pines S/D St. Lucie Vero Beach Coastal 1,697 0.15 0.15 G Floridan aquifer system Desalination (0.15 Mgal/d)Meadowood Master Assoc. St. Lucie Vero Beach Coastal 630 0.13 0.13 G Surficial aquiferMiramar-Belle Vista St. Lucie Vero Beach Coastal 488 0.03 0.03 G Floridan aquifer system Desalination (0.03 Mgal/d)Ocean Towers Utility Island Village St. Lucie Vero Beach Coastal 493 0.05 0.05 G Floridan aquifer system Desalination (0.05 Mgal/d)Princess Condominium St. Lucie Vero Beach Coastal 400 0.05 0.05 G Floridan aquifer system Desalination (0.05 Mgal/d)Reserve Utilities St. Lucie Everglades 836 0.08 0.08 G Surficial aquiferSpanish Lakes Country Club St. Lucie Everglades 3,289 0.24 0.24 G Surficial aquiferSpanish Lakes Fairways St. Lucie Everglades 2,413 0.17 0.17 G Floridan aquifer system Desalination (0.17 Mgal/d)Spanish Lakes MHP St. Lucie Everglades 3,523 0.26 0.26 G Surficial aquiferSt. Lucie County Port St. Lucie W/S St. Lucie Everglades 43,769 4.09 4.09 G Surficial aquiferSt. Lucie West Utilities St. Lucie Everglades 3,790 0.55 0.55 G Floridan aquifer system Desalination (0.55 Mgal/d)Vista St. Lucie Utilities St. Lucie Everglades 1,173 0.08 0.08 G Surficial aquiferBagdad/Garron W/S Santa Rosa Pensacola Bay 3,728 0.39 0.39 G Sand-and-gravel aquiferBerrydale W/S Santa Rosa Blackwater River 1,549 0.21 0.21 G Sand-and-gravel aquiferChumuckala, city of Santa Rosa Escambia River 2,286 0.27 0.27 G Sand-and-gravel aquiferEast Milton W/S Santa Rosa Blackwater River 5,967 0.77 0.77 G Sand-and-gravel aquiferGulf Breeze, city of Santa Rosa Pensacola Bay 5,700 0.00 0.79 P Escambia County Utility Auth. Midway W/S (0.36 Mgal/d)Holley/Navarre W/S Santa Rosa Pensacola Bay 9,463 1.48 1.48 G Floridan aquifer systemJay, town of Santa Rosa Blackwater River 1,603 0.28 0.28 G Sand-and-gravel aquiferMidway W/S Santa Rosa Pensacola Bay 10,500 1.72 1.00 G Floridan aquifer system Sand-and-gravel aquifer (0.26 Mgal/d) and sold
(0.72 Mgal/d)Milton, city of Santa Rosa Blackwater River 14,359 1.98 1.98 G Sand-and-gravel aquiferMoore Creek/Mt. Carmel W/S Santa Rosa Lower Conecuh River 2,431 0.31 0.31 G Sand-and-gravel aquiferNavarre Beach W/S Santa Rosa Pensacola Bay 1,981 0.27 0.27 G Floridan aquifer systemPace, city of Santa Rosa Pensacola Bay 17,500 2.59 2.59 G Sand-and-gravel aquiferPoint Baker W/S Santa Rosa Blackwater River 5,387 0.66 0.66 G Sand-and-gravel aquiferSouth Santa Rosa Utility Santa Rosa Pensacola Bay 8,576 0.36 0.52 G/P Sand-and-gravel aquifer Midway W/S (0.16 Mgal/d)Camelot Lakes Utilities Sarasota Sarasota Bay 1,955 0.18 0.18 G Intermediate aquifer Desalination (0.18 Mgal/d)Englewood W/D Sarasota Sarasota Bay 27,846 2.77 2.77 G Surficial aquifer Desalination (2.77 Mgal/d)Florida Cities Water Company Sarasota Sarasota Sarasota Bay 20,090 0.00 1.64 P Sarasota County UtilitiesNorthport, city of Sarasota Myakka River 11,108 0.90 2.10 P/S PRMSRWSA Myakkahatchee River (0.90 Mgal/d)Sarasota County Utilities University Parkway WF Sarasota Sarasota Bay 108,669 3.11 14.12 P/G Manatee County Utilities Floridan aquifer system/desalination (3.11 Mgal/d)Sarasota County Utilities Carlton Track WF Sarasota Myakka River N/A 4.44 N/A G Intermediate aquiferSarasota, city of Verna WF Sarasota Sarasota Bay 63,235 5.02 9.77 G Surficial aquiferSarasota, city of Downtown WF Sarasota Sarasota Bay N/A 4.75 N/A G Floridan aquifer system Desalination (4.75 Mgal/d)Siesta Key Utilities Sarasota Sarasota Bay 16,601 0.00 1.64 P Sarasota County Utilities Purchased (1.79 Mgal/d) and sold (0.16 Mgal/d)Southbay Utilities Sarasota Sarasota Bay 1,384 0.29 0.29 G Intermediate aquifer Desalination (0.29 Mgal/d)Venice Gardens Utility Corp. Sarasota Sarasota Bay 14,735 1.02 1.94 G Floridan aquifer system Sarasota County Utilities (0.92 Mgal/d)Venice Ranch MHP Sarasota Sarasota Bay 234 0.02 0.02 G Intermediate aquifer Desalination (0.02 Mgal/d)
APPENDIX I. Public supply population served, water withdrawn and use, and water source by utility in Florida, 1995[Sources: U.S. Geological Survey, Florida Department of Environmental Protection, and the five water management districts; Abbrevations and location of cataloging units and counties are shown on pages 50 and 51; Utility/Owners indented are affilated with the Utility/Owner justified left immediately above; For Utility/Owners that purchase water, their population served and water use are included in the supplies totals unless listed specifically]
Utility/Owner Facility/Plant County Cataloging unit of water user
1995 estimates
Primary water source Comments/secondary water source Populationserved
Waterwithdrawn
(Mgal/d)
Wateruse
(Mgal/d)
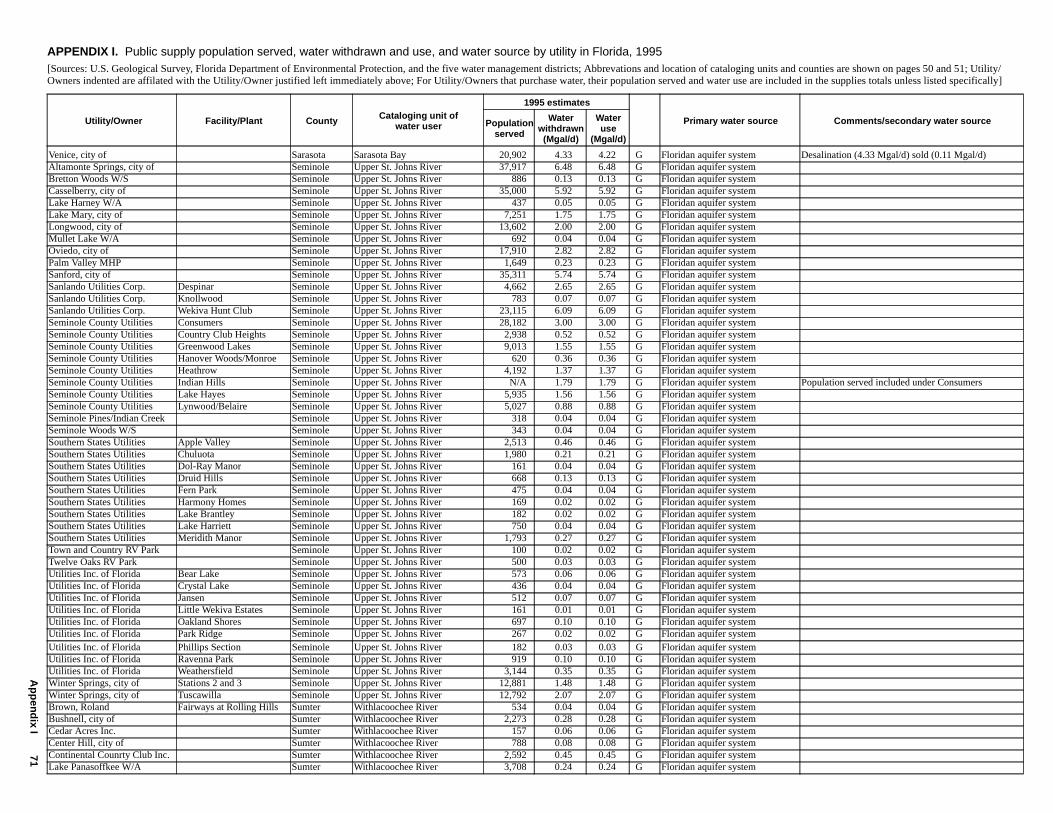
Ap
pen
dix I
71
Venice, city of Sarasota Sarasota Bay 20,902 4.33 4.22 G Floridan aquifer system Desalination (4.33 Mgal/d) sold (0.11 Mgal/d)Altamonte Springs, city of Seminole Upper St. Johns River 37,917 6.48 6.48 G Floridan aquifer systemBretton Woods W/S Seminole Upper St. Johns River 886 0.13 0.13 G Floridan aquifer systemCasselberry, city of Seminole Upper St. Johns River 35,000 5.92 5.92 G Floridan aquifer systemLake Harney W/A Seminole Upper St. Johns River 437 0.05 0.05 G Floridan aquifer systemLake Mary, city of Seminole Upper St. Johns River 7,251 1.75 1.75 G Floridan aquifer systemLongwood, city of Seminole Upper St. Johns River 13,602 2.00 2.00 G Floridan aquifer systemMullet Lake W/A Seminole Upper St. Johns River 692 0.04 0.04 G Floridan aquifer systemOviedo, city of Seminole Upper St. Johns River 17,910 2.82 2.82 G Floridan aquifer systemPalm Valley MHP Seminole Upper St. Johns River 1,649 0.23 0.23 G Floridan aquifer systemSanford, city of Seminole Upper St. Johns River 35,311 5.74 5.74 G Floridan aquifer systemSanlando Utilities Corp. Despinar Seminole Upper St. Johns River 4,662 2.65 2.65 G Floridan aquifer systemSanlando Utilities Corp. Knollwood Seminole Upper St. Johns River 783 0.07 0.07 G Floridan aquifer systemSanlando Utilities Corp. Wekiva Hunt Club Seminole Upper St. Johns River 23,115 6.09 6.09 G Floridan aquifer systemSeminole County Utilities Consumers Seminole Upper St. Johns River 28,182 3.00 3.00 G Floridan aquifer systemSeminole County Utilities Country Club Heights Seminole Upper St. Johns River 2,938 0.52 0.52 G Floridan aquifer systemSeminole County Utilities Greenwood Lakes Seminole Upper St. Johns River 9,013 1.55 1.55 G Floridan aquifer systemSeminole County Utilities Hanover Woods/Monroe Seminole Upper St. Johns River 620 0.36 0.36 G Floridan aquifer systemSeminole County Utilities Heathrow Seminole Upper St. Johns River 4,192 1.37 1.37 G Floridan aquifer systemSeminole County Utilities Indian Hills Seminole Upper St. Johns River N/A 1.79 1.79 G Floridan aquifer system Population served included under ConsumersSeminole County Utilities Lake Hayes Seminole Upper St. Johns River 5,935 1.56 1.56 G Floridan aquifer systemSeminole County Utilities Lynwood/Belaire Seminole Upper St. Johns River 5,027 0.88 0.88 G Floridan aquifer systemSeminole Pines/Indian Creek Seminole Upper St. Johns River 318 0.04 0.04 G Floridan aquifer systemSeminole Woods W/S Seminole Upper St. Johns River 343 0.04 0.04 G Floridan aquifer systemSouthern States Utilities Apple Valley Seminole Upper St. Johns River 2,513 0.46 0.46 G Floridan aquifer systemSouthern States Utilities Chuluota Seminole Upper St. Johns River 1,980 0.21 0.21 G Floridan aquifer systemSouthern States Utilities Dol-Ray Manor Seminole Upper St. Johns River 161 0.04 0.04 G Floridan aquifer systemSouthern States Utilities Druid Hills Seminole Upper St. Johns River 668 0.13 0.13 G Floridan aquifer systemSouthern States Utilities Fern Park Seminole Upper St. Johns River 475 0.04 0.04 G Floridan aquifer systemSouthern States Utilities Harmony Homes Seminole Upper St. Johns River 169 0.02 0.02 G Floridan aquifer systemSouthern States Utilities Lake Brantley Seminole Upper St. Johns River 182 0.02 0.02 G Floridan aquifer systemSouthern States Utilities Lake Harriett Seminole Upper St. Johns River 750 0.04 0.04 G Floridan aquifer systemSouthern States Utilities Meridith Manor Seminole Upper St. Johns River 1,793 0.27 0.27 G Floridan aquifer systemTown and Country RV Park Seminole Upper St. Johns River 100 0.02 0.02 G Floridan aquifer systemTwelve Oaks RV Park Seminole Upper St. Johns River 500 0.03 0.03 G Floridan aquifer systemUtilities Inc. of Florida Bear Lake Seminole Upper St. Johns River 573 0.06 0.06 G Floridan aquifer systemUtilities Inc. of Florida Crystal Lake Seminole Upper St. Johns River 436 0.04 0.04 G Floridan aquifer systemUtilities Inc. of Florida Jansen Seminole Upper St. Johns River 512 0.07 0.07 G Floridan aquifer systemUtilities Inc. of Florida Little Wekiva Estates Seminole Upper St. Johns River 161 0.01 0.01 G Floridan aquifer systemUtilities Inc. of Florida Oakland Shores Seminole Upper St. Johns River 697 0.10 0.10 G Floridan aquifer systemUtilities Inc. of Florida Park Ridge Seminole Upper St. Johns River 267 0.02 0.02 G Floridan aquifer systemUtilities Inc. of Florida Phillips Section Seminole Upper St. Johns River 182 0.03 0.03 G Floridan aquifer systemUtilities Inc. of Florida Ravenna Park Seminole Upper St. Johns River 919 0.10 0.10 G Floridan aquifer systemUtilities Inc. of Florida Weathersfield Seminole Upper St. Johns River 3,144 0.35 0.35 G Floridan aquifer systemWinter Springs, city of Stations 2 and 3 Seminole Upper St. Johns River 12,881 1.48 1.48 G Floridan aquifer systemWinter Springs, city of Tuscawilla Seminole Upper St. Johns River 12,792 2.07 2.07 G Floridan aquifer systemBrown, Roland Fairways at Rolling Hills Sumter Withlacoochee River 534 0.04 0.04 G Floridan aquifer systemBushnell, city of Sumter Withlacoochee River 2,273 0.28 0.28 G Floridan aquifer systemCedar Acres Inc. Sumter Withlacoochee River 157 0.06 0.06 G Floridan aquifer systemCenter Hill, city of Sumter Withlacoochee River 788 0.08 0.08 G Floridan aquifer systemContinental Counrty Club Inc. Sumter Withlacoochee River 2,592 0.45 0.45 G Floridan aquifer systemLake Panasoffkee W/A Sumter Withlacoochee River 3,708 0.24 0.24 G Floridan aquifer system
APPENDIX I. Public supply population served, water withdrawn and use, and water source by utility in Florida, 1995[Sources: U.S. Geological Survey, Florida Department of Environmental Protection, and the five water management districts; Abbrevations and location of cataloging units and counties are shown on pages 50 and 51; Utility/Owners indented are affilated with the Utility/Owner justified left immediately above; For Utility/Owners that purchase water, their population served and water use are included in the supplies totals unless listed specifically]
Utility/Owner Facility/Plant County Cataloging unit of water user
1995 estimates
Primary water source Comments/secondary water source Populationserved
Waterwithdrawn(Mgal/d)
Wateruse
(Mgal/d)
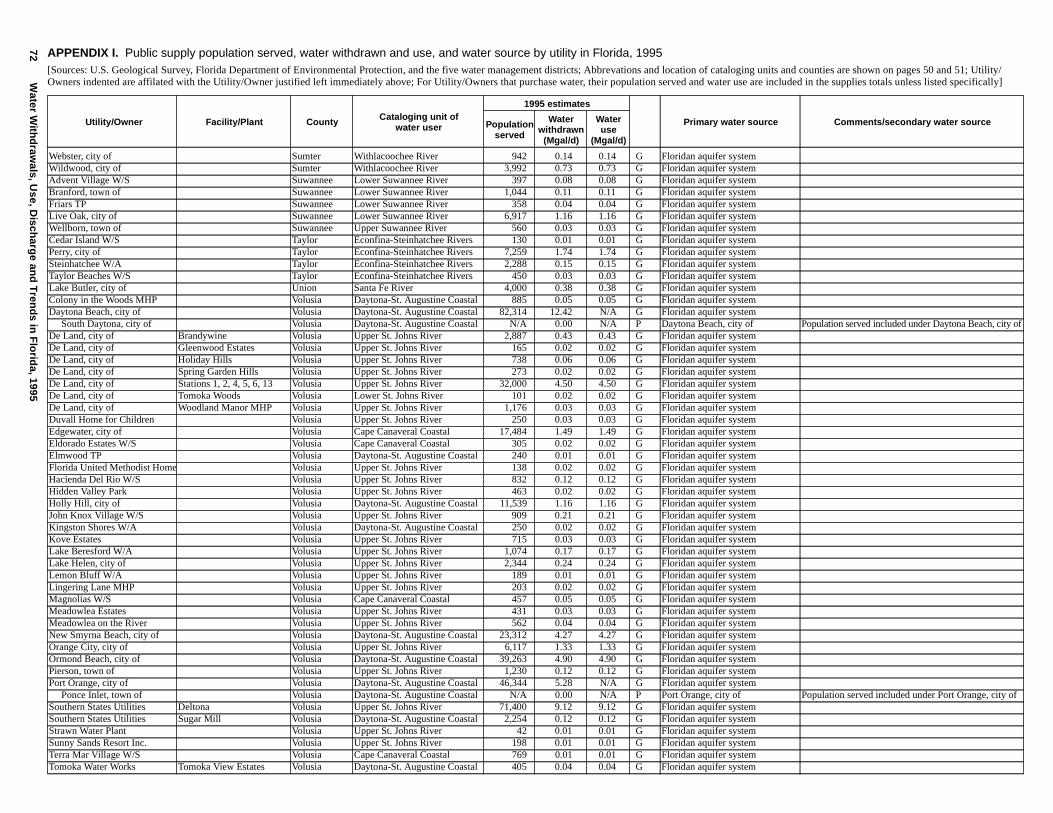
72W
ater With
draw
als, Use, D
ischarg
e and
Tren
ds in
Flo
rida, 1995
Webster, city of Sumter Withlacoochee River 942 0.14 0.14 G Floridan aquifer systemWildwood, city of Sumter Withlacoochee River 3,992 0.73 0.73 G Floridan aquifer systemAdvent Village W/S Suwannee Lower Suwannee River 397 0.08 0.08 G Floridan aquifer systemBranford, town of Suwannee Lower Suwannee River 1,044 0.11 0.11 G Floridan aquifer systemFriars TP Suwannee Lower Suwannee River 358 0.04 0.04 G Floridan aquifer systemLive Oak, city of Suwannee Lower Suwannee River 6,917 1.16 1.16 G Floridan aquifer systemWellborn, town of Suwannee Upper Suwannee River 560 0.03 0.03 G Floridan aquifer systemCedar Island W/S Taylor Econfina-Steinhatchee Rivers 130 0.01 0.01 G Floridan aquifer systemPerry, city of Taylor Econfina-Steinhatchee Rivers 7,259 1.74 1.74 G Floridan aquifer systemSteinhatchee W/A Taylor Econfina-Steinhatchee Rivers 2,288 0.15 0.15 G Floridan aquifer systemTaylor Beaches W/S Taylor Econfina-Steinhatchee Rivers 450 0.03 0.03 G Floridan aquifer systemLake Butler, city of Union Santa Fe River 4,000 0.38 0.38 G Floridan aquifer systemColony in the Woods MHP Volusia Daytona-St. Augustine Coastal 885 0.05 0.05 G Floridan aquifer systemDaytona Beach, city of Volusia Daytona-St. Augustine Coastal 82,314 12.42 N/A G Floridan aquifer system South Daytona, city of Volusia Daytona-St. Augustine Coastal N/A 0.00 N/A P Daytona Beach, city of Population served included under Daytona Beach, city ofDe Land, city of Brandywine Volusia Upper St. Johns River 2,887 0.43 0.43 G Floridan aquifer systemDe Land, city of Gleenwood Estates Volusia Upper St. Johns River 165 0.02 0.02 G Floridan aquifer systemDe Land, city of Holiday Hills Volusia Upper St. Johns River 738 0.06 0.06 G Floridan aquifer systemDe Land, city of Spring Garden Hills Volusia Upper St. Johns River 273 0.02 0.02 G Floridan aquifer systemDe Land, city of Stations 1, 2, 4, 5, 6, 13 Volusia Upper St. Johns River 32,000 4.50 4.50 G Floridan aquifer systemDe Land, city of Tomoka Woods Volusia Lower St. Johns River 101 0.02 0.02 G Floridan aquifer systemDe Land, city of Woodland Manor MHP Volusia Upper St. Johns River 1,176 0.03 0.03 G Floridan aquifer systemDuvall Home for Children Volusia Upper St. Johns River 250 0.03 0.03 G Floridan aquifer systemEdgewater, city of Volusia Cape Canaveral Coastal 17,484 1.49 1.49 G Floridan aquifer systemEldorado Estates W/S Volusia Cape Canaveral Coastal 305 0.02 0.02 G Floridan aquifer systemElmwood TP Volusia Daytona-St. Augustine Coastal 240 0.01 0.01 G Floridan aquifer systemFlorida United Methodist Home Volusia Upper St. Johns River 138 0.02 0.02 G Floridan aquifer systemHacienda Del Rio W/S Volusia Upper St. Johns River 832 0.12 0.12 G Floridan aquifer systemHidden Valley Park Volusia Upper St. Johns River 463 0.02 0.02 G Floridan aquifer systemHolly Hill, city of Volusia Daytona-St. Augustine Coastal 11,539 1.16 1.16 G Floridan aquifer systemJohn Knox Village W/S Volusia Upper St. Johns River 909 0.21 0.21 G Floridan aquifer systemKingston Shores W/A Volusia Daytona-St. Augustine Coastal 250 0.02 0.02 G Floridan aquifer systemKove Estates Volusia Upper St. Johns River 715 0.03 0.03 G Floridan aquifer systemLake Beresford W/A Volusia Upper St. Johns River 1,074 0.17 0.17 G Floridan aquifer systemLake Helen, city of Volusia Upper St. Johns River 2,344 0.24 0.24 G Floridan aquifer systemLemon Bluff W/A Volusia Upper St. Johns River 189 0.01 0.01 G Floridan aquifer systemLingering Lane MHP Volusia Upper St. Johns River 203 0.02 0.02 G Floridan aquifer systemMagnolias W/S Volusia Cape Canaveral Coastal 457 0.05 0.05 G Floridan aquifer systemMeadowlea Estates Volusia Upper St. Johns River 431 0.03 0.03 G Floridan aquifer systemMeadowlea on the River Volusia Upper St. Johns River 562 0.04 0.04 G Floridan aquifer systemNew Smyrna Beach, city of Volusia Daytona-St. Augustine Coastal 23,312 4.27 4.27 G Floridan aquifer systemOrange City, city of Volusia Upper St. Johns River 6,117 1.33 1.33 G Floridan aquifer systemOrmond Beach, city of Volusia Daytona-St. Augustine Coastal 39,263 4.90 4.90 G Floridan aquifer systemPierson, town of Volusia Upper St. Johns River 1,230 0.12 0.12 G Floridan aquifer systemPort Orange, city of Volusia Daytona-St. Augustine Coastal 46,344 5.28 N/A G Floridan aquifer system Ponce Inlet, town of Volusia Daytona-St. Augustine Coastal N/A 0.00 N/A P Port Orange, city of Population served included under Port Orange, city ofSouthern States Utilities Deltona Volusia Upper St. Johns River 71,400 9.12 9.12 G Floridan aquifer systemSouthern States Utilities Sugar Mill Volusia Daytona-St. Augustine Coastal 2,254 0.12 0.12 G Floridan aquifer systemStrawn Water Plant Volusia Upper St. Johns River 42 0.01 0.01 G Floridan aquifer systemSunny Sands Resort Inc. Volusia Upper St. Johns River 198 0.01 0.01 G Floridan aquifer systemTerra Mar Village W/S Volusia Cape Canaveral Coastal 769 0.01 0.01 G Floridan aquifer systemTomoka Water Works Tomoka View Estates Volusia Daytona-St. Augustine Coastal 405 0.04 0.04 G Floridan aquifer system
APPENDIX I. Public supply population served, water withdrawn and use, and water source by utility in Florida, 1995[Sources: U.S. Geological Survey, Florida Department of Environmental Protection, and the five water management districts; Abbrevations and location of cataloging units and counties are shown on pages 50 and 51; Utility/Owners indented are affilated with the Utility/Owner justified left immediately above; For Utility/Owners that purchase water, their population served and water use are included in the supplies totals unless listed specifically]
Utility/Owner Facility/Plant County Cataloging unit of water user
1995 estimates
Primary water source Comments/secondary water source Populationserved
Waterwithdrawn
(Mgal/d)
Wateruse
(Mgal/d)
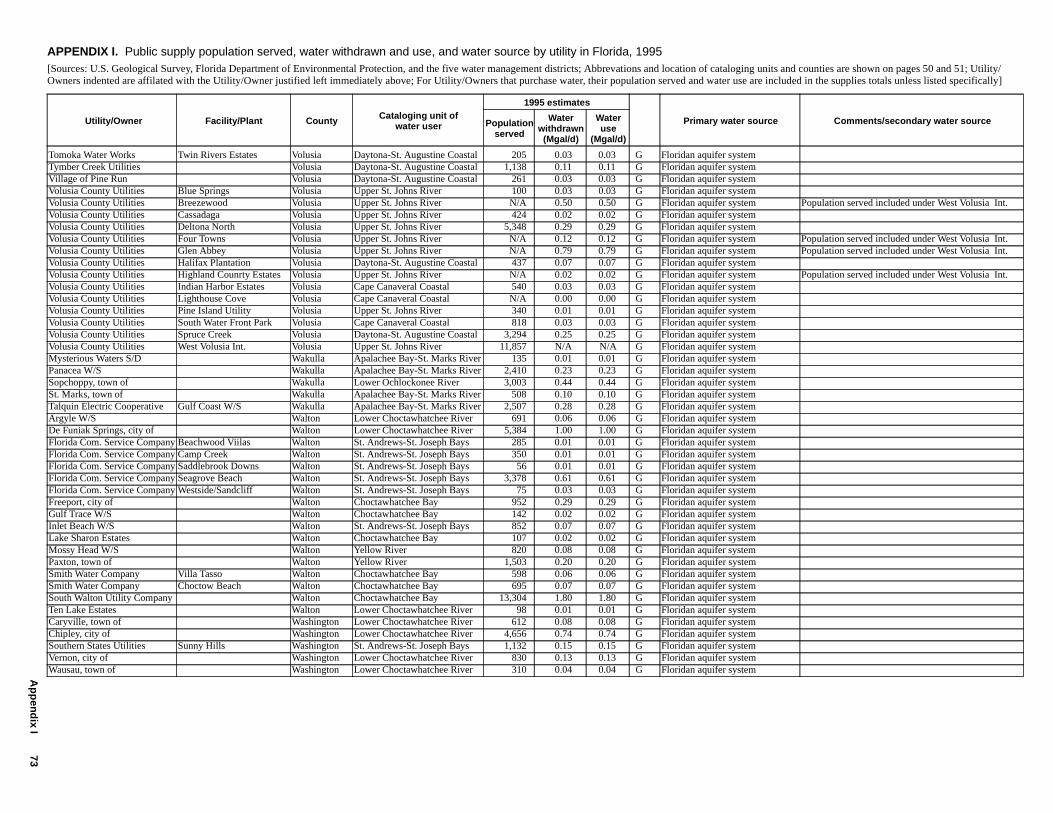
Ap
pen
dix I
73
Tomoka Water Works Twin Rivers Estates Volusia Daytona-St. Augustine Coastal 205 0.03 0.03 G Floridan aquifer systemTymber Creek Utilities Volusia Daytona-St. Augustine Coastal 1,138 0.11 0.11 G Floridan aquifer systemVillage of Pine Run Volusia Daytona-St. Augustine Coastal 261 0.03 0.03 G Floridan aquifer systemVolusia County Utilities Blue Springs Volusia Upper St. Johns River 100 0.03 0.03 G Floridan aquifer systemVolusia County Utilities Breezewood Volusia Upper St. Johns River N/A 0.50 0.50 G Floridan aquifer system Population served included under West Volusia Int.Volusia County Utilities Cassadaga Volusia Upper St. Johns River 424 0.02 0.02 G Floridan aquifer systemVolusia County Utilities Deltona North Volusia Upper St. Johns River 5,348 0.29 0.29 G Floridan aquifer systemVolusia County Utilities Four Towns Volusia Upper St. Johns River N/A 0.12 0.12 G Floridan aquifer system Population served included under West Volusia Int.Volusia County Utilities Glen Abbey Volusia Upper St. Johns River N/A 0.79 0.79 G Floridan aquifer system Population served included under West Volusia Int.Volusia County Utilities Halifax Plantation Volusia Daytona-St. Augustine Coastal 437 0.07 0.07 G Floridan aquifer systemVolusia County Utilities Highland Counrty Estates Volusia Upper St. Johns River N/A 0.02 0.02 G Floridan aquifer system Population served included under West Volusia Int.Volusia County Utilities Indian Harbor Estates Volusia Cape Canaveral Coastal 540 0.03 0.03 G Floridan aquifer systemVolusia County Utilities Lighthouse Cove Volusia Cape Canaveral Coastal N/A 0.00 0.00 G Floridan aquifer systemVolusia County Utilities Pine Island Utility Volusia Upper St. Johns River 340 0.01 0.01 G Floridan aquifer systemVolusia County Utilities South Water Front Park Volusia Cape Canaveral Coastal 818 0.03 0.03 G Floridan aquifer systemVolusia County Utilities Spruce Creek Volusia Daytona-St. Augustine Coastal 3,294 0.25 0.25 G Floridan aquifer systemVolusia County Utilities West Volusia Int. Volusia Upper St. Johns River 11,857 N/A N/A G Floridan aquifer systemMysterious Waters S/D Wakulla Apalachee Bay-St. Marks River 135 0.01 0.01 G Floridan aquifer systemPanacea W/S Wakulla Apalachee Bay-St. Marks River 2,410 0.23 0.23 G Floridan aquifer systemSopchoppy, town of Wakulla Lower Ochlockonee River 3,003 0.44 0.44 G Floridan aquifer systemSt. Marks, town of Wakulla Apalachee Bay-St. Marks River 508 0.10 0.10 G Floridan aquifer systemTalquin Electric Cooperative Gulf Coast W/S Wakulla Apalachee Bay-St. Marks River 2,507 0.28 0.28 G Floridan aquifer systemArgyle W/S Walton Lower Choctawhatchee River 691 0.06 0.06 G Floridan aquifer systemDe Funiak Springs, city of Walton Lower Choctawhatchee River 5,384 1.00 1.00 G Floridan aquifer systemFlorida Com. Service Company Beachwood Viilas Walton St. Andrews-St. Joseph Bays 285 0.01 0.01 G Floridan aquifer systemFlorida Com. Service Company Camp Creek Walton St. Andrews-St. Joseph Bays 350 0.01 0.01 G Floridan aquifer systemFlorida Com. Service Company Saddlebrook Downs Walton St. Andrews-St. Joseph Bays 56 0.01 0.01 G Floridan aquifer systemFlorida Com. Service Company Seagrove Beach Walton St. Andrews-St. Joseph Bays 3,378 0.61 0.61 G Floridan aquifer systemFlorida Com. Service Company Westside/Sandcliff Walton St. Andrews-St. Joseph Bays 75 0.03 0.03 G Floridan aquifer systemFreeport, city of Walton Choctawhatchee Bay 952 0.29 0.29 G Floridan aquifer systemGulf Trace W/S Walton Choctawhatchee Bay 142 0.02 0.02 G Floridan aquifer systemInlet Beach W/S Walton St. Andrews-St. Joseph Bays 852 0.07 0.07 G Floridan aquifer systemLake Sharon Estates Walton Choctawhatchee Bay 107 0.02 0.02 G Floridan aquifer systemMossy Head W/S Walton Yellow River 820 0.08 0.08 G Floridan aquifer systemPaxton, town of Walton Yellow River 1,503 0.20 0.20 G Floridan aquifer systemSmith Water Company Villa Tasso Walton Choctawhatchee Bay 598 0.06 0.06 G Floridan aquifer systemSmith Water Company Choctow Beach Walton Choctawhatchee Bay 695 0.07 0.07 G Floridan aquifer systemSouth Walton Utility Company Walton Choctawhatchee Bay 13,304 1.80 1.80 G Floridan aquifer systemTen Lake Estates Walton Lower Choctawhatchee River 98 0.01 0.01 G Floridan aquifer systemCaryville, town of Washington Lower Choctawhatchee River 612 0.08 0.08 G Floridan aquifer systemChipley, city of Washington Lower Choctawhatchee River 4,656 0.74 0.74 G Floridan aquifer systemSouthern States Utilities Sunny Hills Washington St. Andrews-St. Joseph Bays 1,132 0.15 0.15 G Floridan aquifer systemVernon, city of Washington Lower Choctawhatchee River 830 0.13 0.13 G Floridan aquifer systemWausau, town of Washington Lower Choctawhatchee River 310 0.04 0.04 G Floridan aquifer system
APPENDIX I. Public supply population served, water withdrawn and use, and water source by utility in Florida, 1995[Sources: U.S. Geological Survey, Florida Department of Environmental Protection, and the five water management districts; Abbrevations and location of cataloging units and counties are shown on pages 50 and 51; Utility/Owners indented are affilated with the Utility/Owner justified left immediately above; For Utility/Owners that purchase water, their population served and water use are included in the supplies totals unless listed specifically]
Utility/Owner Facility/Plant County Cataloging unit of water user
1995 estimates
Primary water source Comments/secondary water source Populationserved
Waterwithdrawn(Mgal/d)
Wateruse
(Mgal/d)
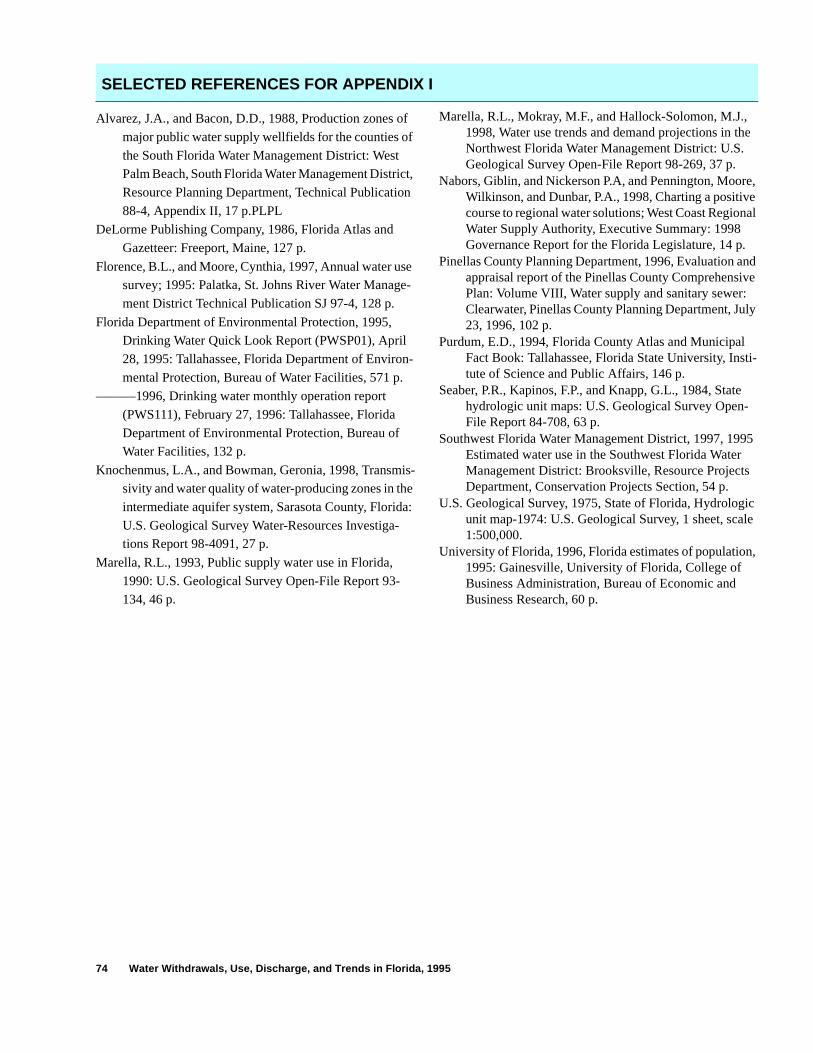
74 Water Withdrawals, Use, Discharge, and Trends in Florida, 1995
Alvarez, J.A., and Bacon, D.D., 1988, Production zones of
major public water supply wellfields for the counties of
the South Florida Water Management District: West Palm Beach, South Florida Water Management District,
Resource Planning Department, Technical Publication
88-4, Appendix II, 17 p.PLPL
DeLorme Publishing Company, 1986, Florida Atlas and
Gazetteer: Freeport, Maine, 127 p.
Florence, B.L., and Moore, Cynthia, 1997, Annual water use survey; 1995: Palatka, St. Johns River Water Manage-
ment District Technical Publication SJ 97-4, 128 p.
Florida Department of Environmental Protection, 1995, Drinking Water Quick Look Report (PWSP01), April
28, 1995: Tallahassee, Florida Department of Environ-
mental Protection, Bureau of Water Facilities, 571 p.
———1996, Drinking water monthly operation report
(PWS111), February 27, 1996: Tallahassee, Florida
Department of Environmental Protection, Bureau of Water Facilities, 132 p.
Knochenmus, L.A., and Bowman, Geronia, 1998, Transmis-sivity and water quality of water-producing zones in the
intermediate aquifer system, Sarasota County, Florida:
U.S. Geological Survey Water-Resources Investiga-tions Report 98-4091, 27 p.
Marella, R.L., 1993, Public supply water use in Florida,
1990: U.S. Geological Survey Open-File Report 93-134, 46 p.
Marella, R.L., Mokray, M.F., and Hallock-Solomon, M.J., 1998, Water use trends and demand projections in the Northwest Florida Water Management District: U.S. Geological Survey Open-File Report 98-269, 37 p.
Nabors, Giblin, and Nickerson P.A, and Pennington, Moore, Wilkinson, and Dunbar, P.A., 1998, Charting a positive course to regional water solutions; West Coast Regional Water Supply Authority, Executive Summary: 1998 Governance Report for the Florida Legislature, 14 p.
Pinellas County Planning Department, 1996, Evaluation and appraisal report of the Pinellas County Comprehensive Plan: Volume VIII, Water supply and sanitary sewer: Clearwater, Pinellas County Planning Department, July 23, 1996, 102 p.
Purdum, E.D., 1994, Florida County Atlas and Municipal Fact Book: Tallahassee, Florida State University, Insti-tute of Science and Public Affairs, 146 p.
Seaber, P.R., Kapinos, F.P., and Knapp, G.L., 1984, State hydrologic unit maps: U.S. Geological Survey Open-File Report 84-708, 63 p.
Southwest Florida Water Management District, 1997, 1995 Estimated water use in the Southwest Florida Water Management District: Brooksville, Resource Projects Department, Conservation Projects Section, 54 p.
U.S. Geological Survey, 1975, State of Florida, Hydrologic unit map-1974: U.S. Geological Survey, 1 sheet, scale 1:500,000.
University of Florida, 1996, Florida estimates of population, 1995: Gainesville, University of Florida, College of Business Administration, Bureau of Economic and Business Research, 60 p.
SELECTED REFERENCES FOR APPENDIX I

APPENDIX II
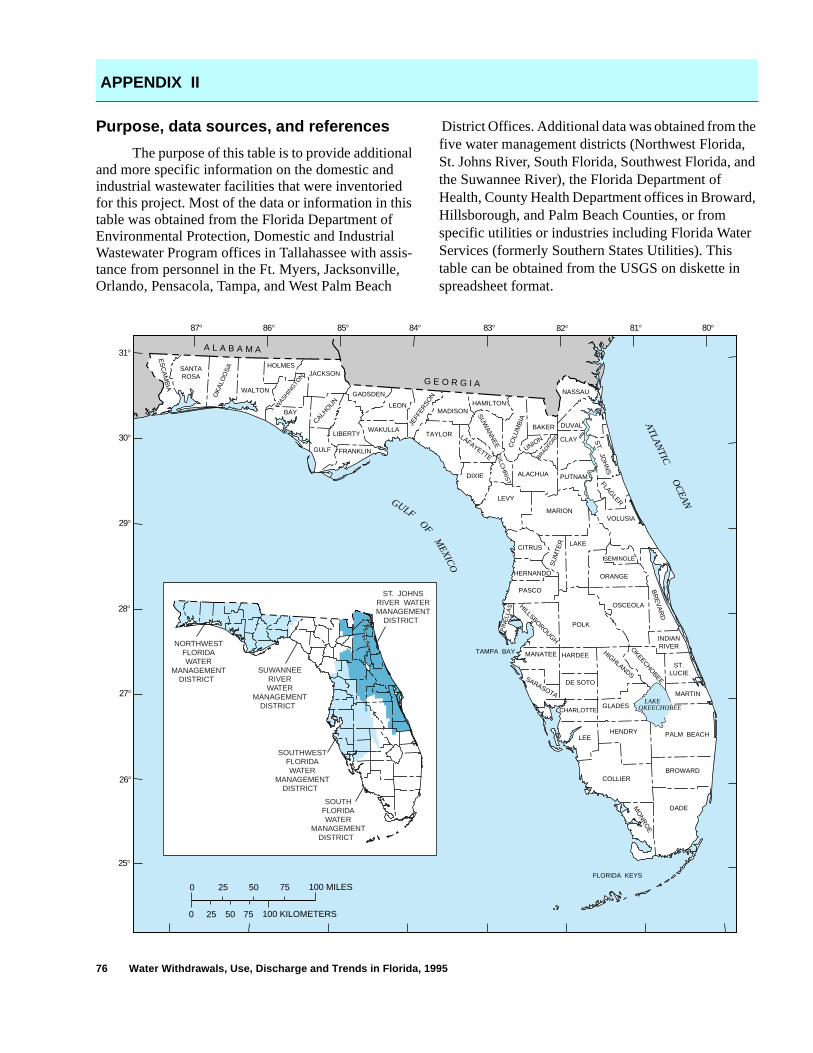
76 Water Withdrawals, Use, Discharge and Trends in Florida, 1995
Purpose, data sources, and references
The purpose of this table is to provide additional and more specific information on the domestic and industrial wastewater facilities that were inventoried for this project. Most of the data or information in this table was obtained from the Florida Department of Environmental Protection, Domestic and Industrial Wastewater Program offices in Tallahassee with assis-tance from personnel in the Ft. Myers, Jacksonville, Orlando, Pensacola, Tampa, and West Palm Beach
District Offices. Additional data was obtained from the five water management districts (Northwest Florida, St. Johns River, South Florida, Southwest Florida, and the Suwannee River), the Florida Department of Health, County Health Department offices in Broward, Hillsborough, and Palm Beach Counties, or from specific utilities or industries including Florida Water Services (formerly Southern States Utilities). This table can be obtained from the USGS on diskette in spreadsheet format.
APPENDIX II
A L A B A M A
G E O R G I A
100 MILES25 50 750
25 100 KILOMETERS50 750
31
30
29
28
27
26
25
87 86 85 84 83 82 81 80
ES
CA
MB
IATAMPA BAY
LAKEOKEECHOBEE
FLORIDA KEYS
HILLSBOROUGH
BR
EV
AR
D
JEFF
ERSO
NOK
ALO
OS
A
SU
WA
NN
EE C
OLU
MB
IA
UNION
FLAGLER
SU
MTE
R
HIGHLANDSSARASOTA
OKEECHO
BEE
MO
NR
OE
PIN
ELL
AS
INDIANRIVER
LEE
ORANGE
PASCO
OSCEOLA
LAKE
BAKER
MARION
CLAY
DUVAL
NASSAU
PUTNAMALACHUA
SANTAROSA
WALTON
HOLMES
BAY
JACKSON
GADSDEN
GULF FRANKLIN
LIBERTYWAKULLA
LEONMADISON
HAMILTON
TAYLOR
DIXIE
LEVY
VOLUSIA
CITRUS
HERNANDO
SEMINOLE
POLK
HARDEE
DE SOTO
ST.LUCIE
MARTIN
MANATEE
GLADES
HENDRY PALM BEACH
BROWARDCOLLIER
DADE
CHARLOTTE
WASHIN
GTO
N
CALHOUN
LAFAYETTE GILC
HR
IST
BRADFORD S
T. JOH
NS
ATLA
NTIC
OC
EA
NGULF
OFM
EXICO
SUWANNEERIVERWATER
MANAGEMENTDISTRICT
NORTHWESTFLORIDAWATER
MANAGEMENTDISTRICT
SOUTHWESTFLORIDAWATER
MANAGEMENTDISTRICT
ST. JOHNSRIVER WATERMANAGEMENT
DISTRICT
SOUTHFLORIDAWATER
MANAGEMENTDISTRICT
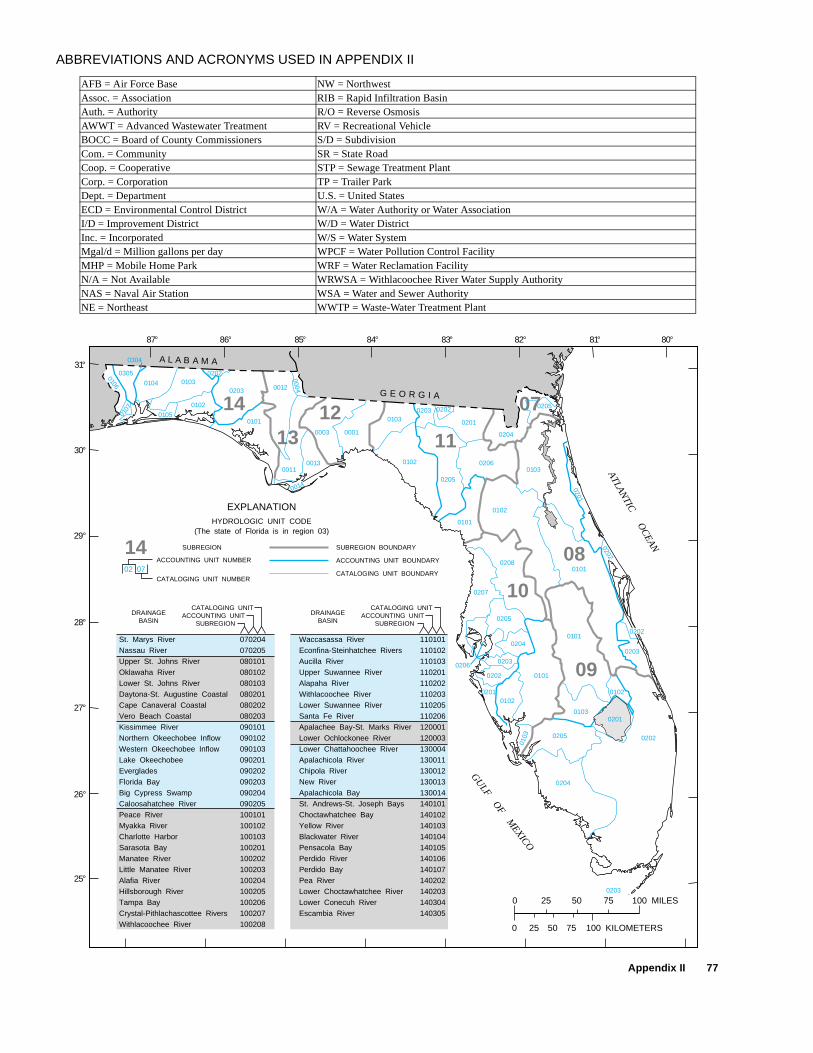
Appendix II 77
ABBREVIATIONS AND ACRONYMS USED IN APPENDIX II
AFB = Air Force Base NW = NorthwestAssoc. = Association RIB = Rapid Infiltration BasinAuth. = Authority R/O = Reverse OsmosisAWWT = Advanced Wastewater Treatment RV = Recreational VehicleBOCC = Board of County Commissioners S/D = SubdivisionCom. = Community SR = State RoadCoop. = Cooperative STP = Sewage Treatment PlantCorp. = Corporation TP = Trailer ParkDept. = Department U.S. = United StatesECD = Environmental Control District W/A = Water Authority or Water AssociationI/D = Improvement District W/D = Water DistrictInc. = Incorporated W/S = Water SystemMgal/d = Million gallons per day WPCF = Water Pollution Control FacilityMHP = Mobile Home Park WRF = Water Reclamation FacilityN/A = Not Available WRWSA = Withlacoochee River Water Supply AuthorityNAS = Naval Air Station WSA = Water and Sewer AuthorityNE = Northeast WWTP = Waste-Water Treatment Plant
09
08
10
07
111214
130101
0003 0001
0103
0102
0101
0101
0103
0103
01020102
0101
0102
0103
0101
0201
02020205
0204
0203
0208
0207
0205
0204
0203
0202
0201
0202
0203 0202
0201
0204
0205
0205
0206
0105
0102
0012
0011
0014
0203
0013
0004
01030203
0202
0104
03050106
0107
14 SUBREGION
CATALOGING UNIT NUMBER
ACCOUNTING UNIT NUMBER
02 07
HYDROLOGIC UNIT CODE(The state of Florida is in region 03)
SUBREGION BOUNDARY
ACCOUNTING UNIT BOUNDARY
CATALOGING UNIT BOUNDARY
EXPLANATION
A L A B A M A
G E O R G I A
31°
30°
29°
28°
27°
26°
25°
87° 86° 85° 84° 83° 82° 81° 80°
0304
GU
LF OF M
EXICO
ATLANTIC
OC
EAN
Waccasassa RiverEconfina-Steinhatchee RiversAucilla RiverUpper Suwannee RiverAlapaha RiverWithlacoochee RiverLower Suwannee RiverSanta Fe RiverApalachee Bay-St. Marks RiverLower Ochlockonee RiverLower Chattahoochee RiverApalachicola RiverChipola RiverNew RiverApalachicola BaySt. Andrews-St. Joseph BaysChoctawhatchee BayYellow RiverBlackwater RiverPensacola BayPerdido RiverPerdido BayPea RiverLower Choctawhatchee RiverLower Conecuh RiverEscambia River
St. Marys RiverNassau RiverUpper St. Johns RiverOklawaha RiverLower St. Johns RiverDaytona-St. Augustine CoastalCape Canaveral CoastalVero Beach CoastalKissimmee RiverNorthern Okeechobee InflowWestern Okeechobee InflowLake OkeechobeeEvergladesFlorida BayBig Cypress SwampCaloosahatchee RiverPeace RiverMyakka RiverCharlotte HarborSarasota BayManatee RiverLittle Manatee RiverAlafia RiverHillsborough RiverTampa BayCrystal-Pithlachascottee RiversWithlacoochee River
110101110102110103110201110202110203110205110206120001120003130004130011130012130013130014140101140102140103140104140105140106140107140202140203140304140305
070204070205080101080102080103080201080202080203090101090102090103090201090202090203090204090205100101100102100103100201100202100203100204100205100206100207100208
SUBREGION
DRAINAGEBASIN
CATALOGING UNITACCOUNTING UNIT
SUBREGION
DRAINAGEBASIN
CATALOGING UNITACCOUNTING UNIT
100 MILES25 50 750
25 100 KILOMETERS50 750
0201
0206
0202
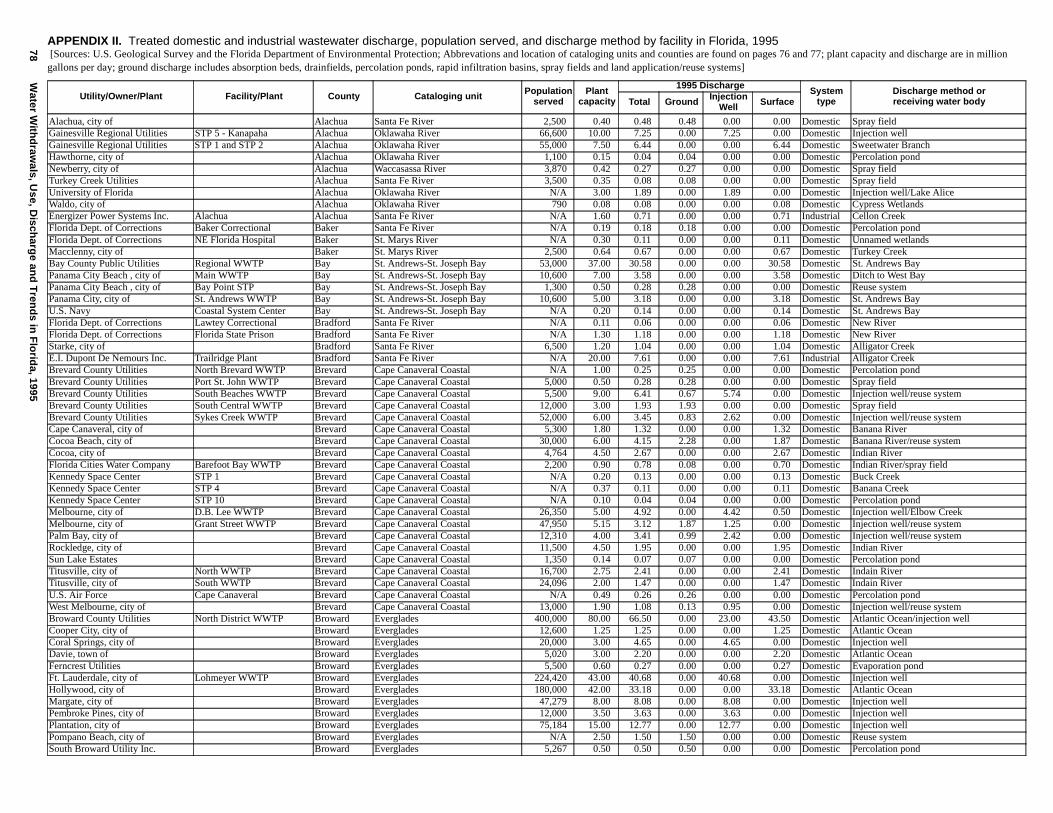
78W
ater With
draw
als, Use, D
ischarg
e and
Tren
ds in
Flo
rida, 1995
APPENDIX II. Treated domestic and industrial wastewater discharge, population served, and discharge method by facility in Florida, 1995 [Sources: U.S. Geological Survey and the Florida Department of Environmental Protection; Abbrevations and location of cataloging units and counties are found on pages 76 and 77; plant capacity and discharge are in million gallons per day; ground discharge includes absorption beds, drainfields, percolation ponds, rapid infiltration basins, spray fields and land application/reuse systems]
Utility/Owner/Plant Facility/Plant County Cataloging unit Population served
Plant capacity
1995 DischargeSystem
typeDischarge method or receiving water bodyTotal Ground Injection
Well Surface
Alachua, city of Alachua Santa Fe River 2,500 0.40 0.48 0.48 0.00 0.00 Domestic Spray fieldGainesville Regional Utilities STP 5 - Kanapaha Alachua Oklawaha River 66,600 10.00 7.25 0.00 7.25 0.00 Domestic Injection wellGainesville Regional Utilities STP 1 and STP 2 Alachua Oklawaha River 55,000 7.50 6.44 0.00 0.00 6.44 Domestic Sweetwater BranchHawthorne, city of Alachua Oklawaha River 1,100 0.15 0.04 0.04 0.00 0.00 Domestic Percolation pondNewberry, city of Alachua Waccasassa River 3,870 0.42 0.27 0.27 0.00 0.00 Domestic Spray fieldTurkey Creek Utilities Alachua Santa Fe River 3,500 0.35 0.08 0.08 0.00 0.00 Domestic Spray fieldUniversity of Florida Alachua Oklawaha River N/A 3.00 1.89 0.00 1.89 0.00 Domestic Injection well/Lake AliceWaldo, city of Alachua Oklawaha River 790 0.08 0.08 0.00 0.00 0.08 Domestic Cypress WetlandsEnergizer Power Systems Inc. Alachua Alachua Santa Fe River N/A 1.60 0.71 0.00 0.00 0.71 Industrial Cellon CreekFlorida Dept. of Corrections Baker Correctional Baker Santa Fe River N/A 0.19 0.18 0.18 0.00 0.00 Domestic Percolation pondFlorida Dept. of Corrections NE Florida Hospital Baker St. Marys River N/A 0.30 0.11 0.00 0.00 0.11 Domestic Unnamed wetlandsMacclenny, city of Baker St. Marys River 2,500 0.64 0.67 0.00 0.00 0.67 Domestic Turkey CreekBay County Public Utilities Regional WWTP Bay St. Andrews-St. Joseph Bay 53,000 37.00 30.58 0.00 0.00 30.58 Domestic St. Andrews BayPanama City Beach , city of Main WWTP Bay St. Andrews-St. Joseph Bay 10,600 7.00 3.58 0.00 0.00 3.58 Domestic Ditch to West BayPanama City Beach , city of Bay Point STP Bay St. Andrews-St. Joseph Bay 1,300 0.50 0.28 0.28 0.00 0.00 Domestic Reuse systemPanama City, city of St. Andrews WWTP Bay St. Andrews-St. Joseph Bay 10,600 5.00 3.18 0.00 0.00 3.18 Domestic St. Andrews BayU.S. Navy Coastal System Center Bay St. Andrews-St. Joseph Bay N/A 0.20 0.14 0.00 0.00 0.14 Domestic St. Andrews BayFlorida Dept. of Corrections Lawtey Correctional Bradford Santa Fe River N/A 0.11 0.06 0.00 0.00 0.06 Domestic New RiverFlorida Dept. of Corrections Florida State Prison Bradford Santa Fe River N/A 1.30 1.18 0.00 0.00 1.18 Domestic New RiverStarke, city of Bradford Santa Fe River 6,500 1.20 1.04 0.00 0.00 1.04 Domestic Alligator CreekE.I. Dupont De Nemours Inc. Trailridge Plant Bradford Santa Fe River N/A 20.00 7.61 0.00 0.00 7.61 Industrial Alligator CreekBrevard County Utilities North Brevard WWTP Brevard Cape Canaveral Coastal N/A 1.00 0.25 0.25 0.00 0.00 Domestic Percolation pondBrevard County Utilities Port St. John WWTP Brevard Cape Canaveral Coastal 5,000 0.50 0.28 0.28 0.00 0.00 Domestic Spray fieldBrevard County Utilities South Beaches WWTP Brevard Cape Canaveral Coastal 5,500 9.00 6.41 0.67 5.74 0.00 Domestic Injection well/reuse systemBrevard County Utilities South Central WWTP Brevard Cape Canaveral Coastal 12,000 3.00 1.93 1.93 0.00 0.00 Domestic Spray fieldBrevard County Utilities Sykes Creek WWTP Brevard Cape Canaveral Coastal 52,000 6.00 3.45 0.83 2.62 0.00 Domestic Injection well/reuse systemCape Canaveral, city of Brevard Cape Canaveral Coastal 5,300 1.80 1.32 0.00 0.00 1.32 Domestic Banana RiverCocoa Beach, city of Brevard Cape Canaveral Coastal 30,000 6.00 4.15 2.28 0.00 1.87 Domestic Banana River/reuse systemCocoa, city of Brevard Cape Canaveral Coastal 4,764 4.50 2.67 0.00 0.00 2.67 Domestic Indian River Florida Cities Water Company Barefoot Bay WWTP Brevard Cape Canaveral Coastal 2,200 0.90 0.78 0.08 0.00 0.70 Domestic Indian River/spray fieldKennedy Space Center STP 1 Brevard Cape Canaveral Coastal N/A 0.20 0.13 0.00 0.00 0.13 Domestic Buck CreekKennedy Space Center STP 4 Brevard Cape Canaveral Coastal N/A 0.37 0.11 0.00 0.00 0.11 Domestic Banana CreekKennedy Space Center STP 10 Brevard Cape Canaveral Coastal N/A 0.10 0.04 0.04 0.00 0.00 Domestic Percolation pondMelbourne, city of D.B. Lee WWTP Brevard Cape Canaveral Coastal 26,350 5.00 4.92 0.00 4.42 0.50 Domestic Injection well/Elbow CreekMelbourne, city of Grant Street WWTP Brevard Cape Canaveral Coastal 47,950 5.15 3.12 1.87 1.25 0.00 Domestic Injection well/reuse systemPalm Bay, city of Brevard Cape Canaveral Coastal 12,310 4.00 3.41 0.99 2.42 0.00 Domestic Injection well/reuse systemRockledge, city of Brevard Cape Canaveral Coastal 11,500 4.50 1.95 0.00 0.00 1.95 Domestic Indian RiverSun Lake Estates Brevard Cape Canaveral Coastal 1,350 0.14 0.07 0.07 0.00 0.00 Domestic Percolation pondTitusville, city of North WWTP Brevard Cape Canaveral Coastal 16,700 2.75 2.41 0.00 0.00 2.41 Domestic Indain RiverTitusville, city of South WWTP Brevard Cape Canaveral Coastal 24,096 2.00 1.47 0.00 0.00 1.47 Domestic Indain RiverU.S. Air Force Cape Canaveral Brevard Cape Canaveral Coastal N/A 0.49 0.26 0.26 0.00 0.00 Domestic Percolation pondWest Melbourne, city of Brevard Cape Canaveral Coastal 13,000 1.90 1.08 0.13 0.95 0.00 Domestic Injection well/reuse systemBroward County Utilities North District WWTP Broward Everglades 400,000 80.00 66.50 0.00 23.00 43.50 Domestic Atlantic Ocean/injection wellCooper City, city of Broward Everglades 12,600 1.25 1.25 0.00 0.00 1.25 Domestic Atlantic OceanCoral Springs, city of Broward Everglades 20,000 3.00 4.65 0.00 4.65 0.00 Domestic Injection wellDavie, town of Broward Everglades 5,020 3.00 2.20 0.00 0.00 2.20 Domestic Atlantic OceanFerncrest Utilities Broward Everglades 5,500 0.60 0.27 0.00 0.00 0.27 Domestic Evaporation pondFt. Lauderdale, city of Lohmeyer WWTP Broward Everglades 224,420 43.00 40.68 0.00 40.68 0.00 Domestic Injection wellHollywood, city of Broward Everglades 180,000 42.00 33.18 0.00 0.00 33.18 Domestic Atlantic OceanMargate, city of Broward Everglades 47,279 8.00 8.08 0.00 8.08 0.00 Domestic Injection wellPembroke Pines, city of Broward Everglades 12,000 3.50 3.63 0.00 3.63 0.00 Domestic Injection wellPlantation, city of Broward Everglades 75,184 15.00 12.77 0.00 12.77 0.00 Domestic Injection wellPompano Beach, city of Broward Everglades N/A 2.50 1.50 1.50 0.00 0.00 Domestic Reuse systemSouth Broward Utility Inc. Broward Everglades 5,267 0.50 0.50 0.50 0.00 0.00 Domestic Percolation pond
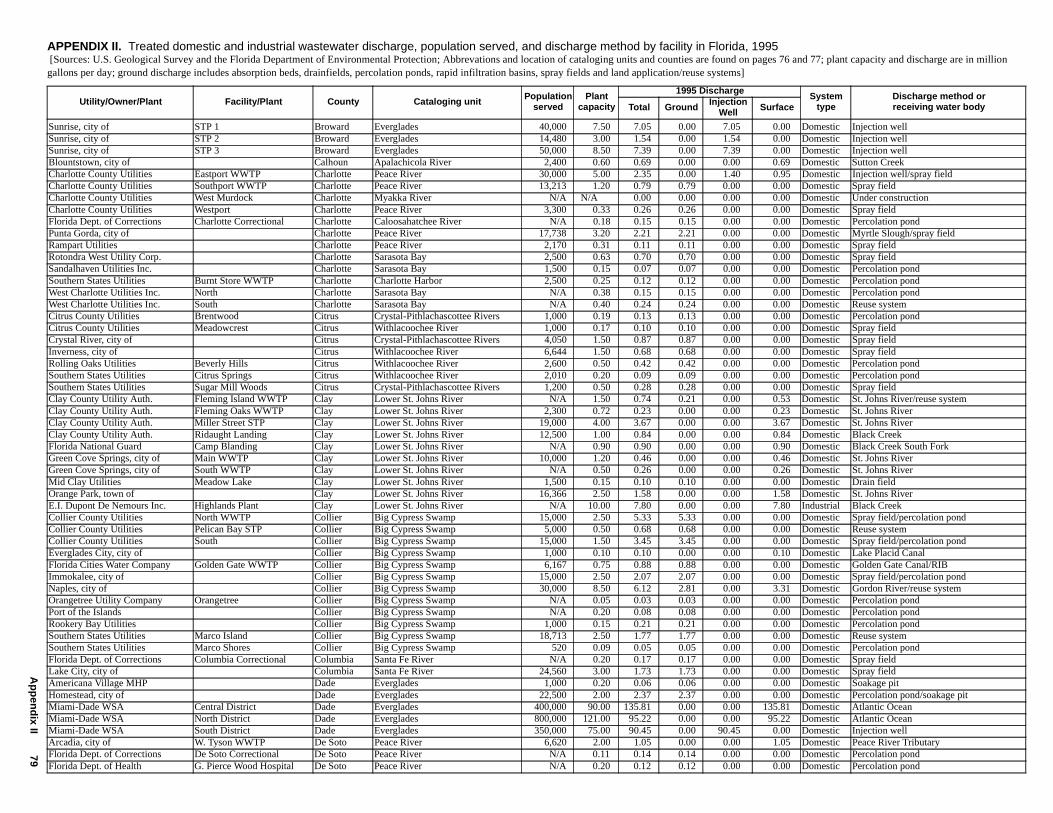
Ap
pen
dix II
79
Sunrise, city of STP 1 Broward Everglades 40,000 7.50 7.05 0.00 7.05 0.00 Domestic Injection wellSunrise, city of STP 2 Broward Everglades 14,480 3.00 1.54 0.00 1.54 0.00 Domestic Injection wellSunrise, city of STP 3 Broward Everglades 50,000 8.50 7.39 0.00 7.39 0.00 Domestic Injection wellBlountstown, city of Calhoun Apalachicola River 2,400 0.60 0.69 0.00 0.00 0.69 Domestic Sutton CreekCharlotte County Utilities Eastport WWTP Charlotte Peace River 30,000 5.00 2.35 0.00 1.40 0.95 Domestic Injection well/spray fieldCharlotte County Utilities Southport WWTP Charlotte Peace River 13,213 1.20 0.79 0.79 0.00 0.00 Domestic Spray fieldCharlotte County Utilities West Murdock Charlotte Myakka River N/A N/A 0.00 0.00 0.00 0.00 Domestic Under constructionCharlotte County Utilities Westport Charlotte Peace River 3,300 0.33 0.26 0.26 0.00 0.00 Domestic Spray fieldFlorida Dept. of Corrections Charlotte Correctional Charlotte Caloosahatchee River N/A 0.18 0.15 0.15 0.00 0.00 Domestic Percolation pondPunta Gorda, city of Charlotte Peace River 17,738 3.20 2.21 2.21 0.00 0.00 Domestic Myrtle Slough/spray fieldRampart Utilities Charlotte Peace River 2,170 0.31 0.11 0.11 0.00 0.00 Domestic Spray field Rotondra West Utility Corp. Charlotte Sarasota Bay 2,500 0.63 0.70 0.70 0.00 0.00 Domestic Spray field Sandalhaven Utilities Inc. Charlotte Sarasota Bay 1,500 0.15 0.07 0.07 0.00 0.00 Domestic Percolation pondSouthern States Utilities Burnt Store WWTP Charlotte Charlotte Harbor 2,500 0.25 0.12 0.12 0.00 0.00 Domestic Percolation pondWest Charlotte Utilities Inc. North Charlotte Sarasota Bay N/A 0.38 0.15 0.15 0.00 0.00 Domestic Percolation pondWest Charlotte Utilities Inc. South Charlotte Sarasota Bay N/A 0.40 0.24 0.24 0.00 0.00 Domestic Reuse systemCitrus County Utilities Brentwood Citrus Crystal-Pithlachascottee Rivers 1,000 0.19 0.13 0.13 0.00 0.00 Domestic Percolation pondCitrus County Utilities Meadowcrest Citrus Withlacoochee River 1,000 0.17 0.10 0.10 0.00 0.00 Domestic Spray fieldCrystal River, city of Citrus Crystal-Pithlachascottee Rivers 4,050 1.50 0.87 0.87 0.00 0.00 Domestic Spray fieldInverness, city of Citrus Withlacoochee River 6,644 1.50 0.68 0.68 0.00 0.00 Domestic Spray fieldRolling Oaks Utilities Beverly Hills Citrus Withlacoochee River 2,600 0.50 0.42 0.42 0.00 0.00 Domestic Percolation pondSouthern States Utilities Citrus Springs Citrus Withlacoochee River 2,010 0.20 0.09 0.09 0.00 0.00 Domestic Percolation pondSouthern States Utilities Sugar Mill Woods Citrus Crystal-Pithlachascottee Rivers 1,200 0.50 0.28 0.28 0.00 0.00 Domestic Spray fieldClay County Utility Auth. Fleming Island WWTP Clay Lower St. Johns River N/A 1.50 0.74 0.21 0.00 0.53 Domestic St. Johns River/reuse systemClay County Utility Auth. Fleming Oaks WWTP Clay Lower St. Johns River 2,300 0.72 0.23 0.00 0.00 0.23 Domestic St. Johns RiverClay County Utility Auth. Miller Street STP Clay Lower St. Johns River 19,000 4.00 3.67 0.00 0.00 3.67 Domestic St. Johns RiverClay County Utility Auth. Ridaught Landing Clay Lower St. Johns River 12,500 1.00 0.84 0.00 0.00 0.84 Domestic Black CreekFlorida National Guard Camp Blanding Clay Lower St. Johns River N/A 0.90 0.90 0.00 0.00 0.90 Domestic Black Creek South ForkGreen Cove Springs, city of Main WWTP Clay Lower St. Johns River 10,000 1.20 0.46 0.00 0.00 0.46 Domestic St. Johns RiverGreen Cove Springs, city of South WWTP Clay Lower St. Johns River N/A 0.50 0.26 0.00 0.00 0.26 Domestic St. Johns RiverMid Clay Utilities Meadow Lake Clay Lower St. Johns River 1,500 0.15 0.10 0.10 0.00 0.00 Domestic Drain fieldOrange Park, town of Clay Lower St. Johns River 16,366 2.50 1.58 0.00 0.00 1.58 Domestic St. Johns RiverE.I. Dupont De Nemours Inc. Highlands Plant Clay Lower St. Johns River N/A 10.00 7.80 0.00 0.00 7.80 Industrial Black CreekCollier County Utilities North WWTP Collier Big Cypress Swamp 15,000 2.50 5.33 5.33 0.00 0.00 Domestic Spray field/percolation pondCollier County Utilities Pelican Bay STP Collier Big Cypress Swamp 5,000 0.50 0.68 0.68 0.00 0.00 Domestic Reuse systemCollier County Utilities South Collier Big Cypress Swamp 15,000 1.50 3.45 3.45 0.00 0.00 Domestic Spray field/percolation pondEverglades City, city of Collier Big Cypress Swamp 1,000 0.10 0.10 0.00 0.00 0.10 Domestic Lake Placid CanalFlorida Cities Water Company Golden Gate WWTP Collier Big Cypress Swamp 6,167 0.75 0.88 0.88 0.00 0.00 Domestic Golden Gate Canal/RIBImmokalee, city of Collier Big Cypress Swamp 15,000 2.50 2.07 2.07 0.00 0.00 Domestic Spray field/percolation pondNaples, city of Collier Big Cypress Swamp 30,000 8.50 6.12 2.81 0.00 3.31 Domestic Gordon River/reuse systemOrangetree Utility Company Orangetree Collier Big Cypress Swamp N/A 0.05 0.03 0.03 0.00 0.00 Domestic Percolation pondPort of the Islands Collier Big Cypress Swamp N/A 0.20 0.08 0.08 0.00 0.00 Domestic Percolation pondRookery Bay Utilities Collier Big Cypress Swamp 1,000 0.15 0.21 0.21 0.00 0.00 Domestic Percolation pondSouthern States Utilities Marco Island Collier Big Cypress Swamp 18,713 2.50 1.77 1.77 0.00 0.00 Domestic Reuse systemSouthern States Utilities Marco Shores Collier Big Cypress Swamp 520 0.09 0.05 0.05 0.00 0.00 Domestic Percolation pondFlorida Dept. of Corrections Columbia Correctional Columbia Santa Fe River N/A 0.20 0.17 0.17 0.00 0.00 Domestic Spray fieldLake City, city of Columbia Santa Fe River 24,560 3.00 1.73 1.73 0.00 0.00 Domestic Spray fieldAmericana Village MHP Dade Everglades 1,000 0.20 0.06 0.06 0.00 0.00 Domestic Soakage pitHomestead, city of Dade Everglades 22,500 2.00 2.37 2.37 0.00 0.00 Domestic Percolation pond/soakage pitMiami-Dade WSA Central District Dade Everglades 400,000 90.00 135.81 0.00 0.00 135.81 Domestic Atlantic OceanMiami-Dade WSA North District Dade Everglades 800,000 121.00 95.22 0.00 0.00 95.22 Domestic Atlantic OceanMiami-Dade WSA South District Dade Everglades 350,000 75.00 90.45 0.00 90.45 0.00 Domestic Injection wellArcadia, city of W. Tyson WWTP De Soto Peace River 6,620 2.00 1.05 0.00 0.00 1.05 Domestic Peace River TributaryFlorida Dept. of Corrections De Soto Correctional De Soto Peace River N/A 0.11 0.14 0.14 0.00 0.00 Domestic Percolation pondFlorida Dept. of Health G. Pierce Wood Hospital De Soto Peace River N/A 0.20 0.12 0.12 0.00 0.00 Domestic Percolation pond
APPENDIX II. Treated domestic and industrial wastewater discharge, population served, and discharge method by facility in Florida, 1995 [Sources: U.S. Geological Survey and the Florida Department of Environmental Protection; Abbrevations and location of cataloging units and counties are found on pages 76 and 77; plant capacity and discharge are in million gallons per day; ground discharge includes absorption beds, drainfields, percolation ponds, rapid infiltration basins, spray fields and land application/reuse systems]
Utility/Owner/Plant Facility/Plant County Cataloging unit Population served
Plant capacity
1995 DischargeSystem
typeDischarge method or receiving water bodyTotal Ground Injection
Well Surface
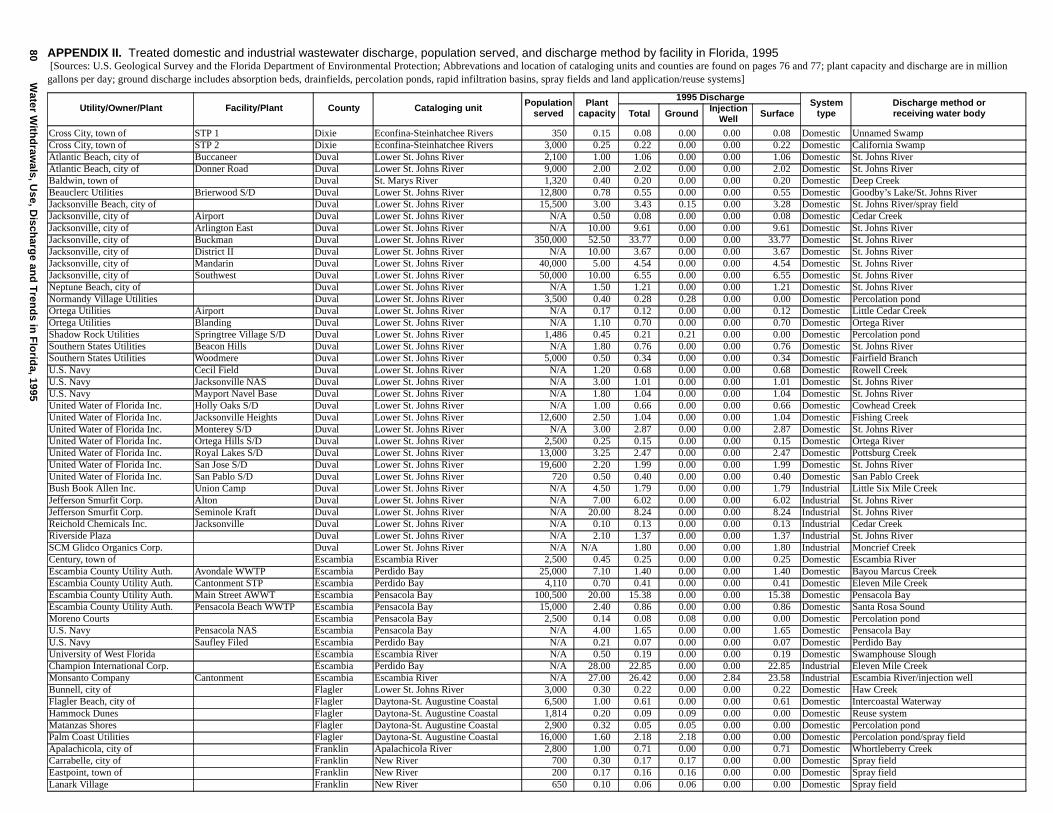
80W
ater With
draw
als, Use, D
ischarg
e and
Tren
ds in
Flo
rida, 1995
Cross City, town of STP 1 Dixie Econfina-Steinhatchee Rivers 350 0.15 0.08 0.00 0.00 0.08 Domestic Unnamed SwampCross City, town of STP 2 Dixie Econfina-Steinhatchee Rivers 3,000 0.25 0.22 0.00 0.00 0.22 Domestic California SwampAtlantic Beach, city of Buccaneer Duval Lower St. Johns River 2,100 1.00 1.06 0.00 0.00 1.06 Domestic St. Johns RiverAtlantic Beach, city of Donner Road Duval Lower St. Johns River 9,000 2.00 2.02 0.00 0.00 2.02 Domestic St. Johns RiverBaldwin, town of Duval St. Marys River 1,320 0.40 0.20 0.00 0.00 0.20 Domestic Deep CreekBeauclerc Utilities Brierwood S/D Duval Lower St. Johns River 12,800 0.78 0.55 0.00 0.00 0.55 Domestic Goodby’s Lake/St. Johns RiverJacksonville Beach, city of Duval Lower St. Johns River 15,500 3.00 3.43 0.15 0.00 3.28 Domestic St. Johns River/spray fieldJacksonville, city of Airport Duval Lower St. Johns River N/A 0.50 0.08 0.00 0.00 0.08 Domestic Cedar CreekJacksonville, city of Arlington East Duval Lower St. Johns River N/A 10.00 9.61 0.00 0.00 9.61 Domestic St. Johns RiverJacksonville, city of Buckman Duval Lower St. Johns River 350,000 52.50 33.77 0.00 0.00 33.77 Domestic St. Johns RiverJacksonville, city of District II Duval Lower St. Johns River N/A 10.00 3.67 0.00 0.00 3.67 Domestic St. Johns RiverJacksonville, city of Mandarin Duval Lower St. Johns River 40,000 5.00 4.54 0.00 0.00 4.54 Domestic St. Johns RiverJacksonville, city of Southwest Duval Lower St. Johns River 50,000 10.00 6.55 0.00 0.00 6.55 Domestic St. Johns RiverNeptune Beach, city of Duval Lower St. Johns River N/A 1.50 1.21 0.00 0.00 1.21 Domestic St. Johns RiverNormandy Village Utilities Duval Lower St. Johns River 3,500 0.40 0.28 0.28 0.00 0.00 Domestic Percolation pondOrtega Utilities Airport Duval Lower St. Johns River N/A 0.17 0.12 0.00 0.00 0.12 Domestic Little Cedar CreekOrtega Utilities Blanding Duval Lower St. Johns River N/A 1.10 0.70 0.00 0.00 0.70 Domestic Ortega RiverShadow Rock Utilities Springtree Village S/D Duval Lower St. Johns River 1,486 0.45 0.21 0.21 0.00 0.00 Domestic Percolation pondSouthern States Utilities Beacon Hills Duval Lower St. Johns River N/A 1.80 0.76 0.00 0.00 0.76 Domestic St. Johns RiverSouthern States Utilities Woodmere Duval Lower St. Johns River 5,000 0.50 0.34 0.00 0.00 0.34 Domestic Fairfield BranchU.S. Navy Cecil Field Duval Lower St. Johns River N/A 1.20 0.68 0.00 0.00 0.68 Domestic Rowell CreekU.S. Navy Jacksonville NAS Duval Lower St. Johns River N/A 3.00 1.01 0.00 0.00 1.01 Domestic St. Johns RiverU.S. Navy Mayport Navel Base Duval Lower St. Johns River N/A 1.80 1.04 0.00 0.00 1.04 Domestic St. Johns RiverUnited Water of Florida Inc. Holly Oaks S/D Duval Lower St. Johns River N/A 1.00 0.66 0.00 0.00 0.66 Domestic Cowhead CreekUnited Water of Florida Inc. Jacksonville Heights Duval Lower St. Johns River 12,600 2.50 1.04 0.00 0.00 1.04 Domestic Fishing CreekUnited Water of Florida Inc. Monterey S/D Duval Lower St. Johns River N/A 3.00 2.87 0.00 0.00 2.87 Domestic St. Johns RiverUnited Water of Florida Inc. Ortega Hills S/D Duval Lower St. Johns River 2,500 0.25 0.15 0.00 0.00 0.15 Domestic Ortega RiverUnited Water of Florida Inc. Royal Lakes S/D Duval Lower St. Johns River 13,000 3.25 2.47 0.00 0.00 2.47 Domestic Pottsburg CreekUnited Water of Florida Inc. San Jose S/D Duval Lower St. Johns River 19,600 2.20 1.99 0.00 0.00 1.99 Domestic St. Johns RiverUnited Water of Florida Inc. San Pablo S/D Duval Lower St. Johns River 720 0.50 0.40 0.00 0.00 0.40 Domestic San Pablo CreekBush Book Allen Inc. Union Camp Duval Lower St. Johns River N/A 4.50 1.79 0.00 0.00 1.79 Industrial Little Six Mile CreekJefferson Smurfit Corp. Alton Duval Lower St. Johns River N/A 7.00 6.02 0.00 0.00 6.02 Industrial St. Johns RiverJefferson Smurfit Corp. Seminole Kraft Duval Lower St. Johns River N/A 20.00 8.24 0.00 0.00 8.24 Industrial St. Johns RiverReichold Chemicals Inc. Jacksonville Duval Lower St. Johns River N/A 0.10 0.13 0.00 0.00 0.13 Industrial Cedar CreekRiverside Plaza Duval Lower St. Johns River N/A 2.10 1.37 0.00 0.00 1.37 Industrial St. Johns RiverSCM Glidco Organics Corp. Duval Lower St. Johns River N/A N/A 1.80 0.00 0.00 1.80 Industrial Moncrief CreekCentury, town of Escambia Escambia River 2,500 0.45 0.25 0.00 0.00 0.25 Domestic Escambia RiverEscambia County Utility Auth. Avondale WWTP Escambia Perdido Bay 25,000 7.10 1.40 0.00 0.00 1.40 Domestic Bayou Marcus CreekEscambia County Utility Auth. Cantonment STP Escambia Perdido Bay 4,110 0.70 0.41 0.00 0.00 0.41 Domestic Eleven Mile CreekEscambia County Utility Auth. Main Street AWWT Escambia Pensacola Bay 100,500 20.00 15.38 0.00 0.00 15.38 Domestic Pensacola BayEscambia County Utility Auth. Pensacola Beach WWTP Escambia Pensacola Bay 15,000 2.40 0.86 0.00 0.00 0.86 Domestic Santa Rosa SoundMoreno Courts Escambia Pensacola Bay 2,500 0.14 0.08 0.08 0.00 0.00 Domestic Percolation pondU.S. Navy Pensacola NAS Escambia Pensacola Bay N/A 4.00 1.65 0.00 0.00 1.65 Domestic Pensacola BayU.S. Navy Saufley Filed Escambia Perdido Bay N/A 0.21 0.07 0.00 0.00 0.07 Domestic Perdido BayUniversity of West Florida Escambia Escambia River N/A 0.50 0.19 0.00 0.00 0.19 Domestic Swamphouse SloughChampion International Corp. Escambia Perdido Bay N/A 28.00 22.85 0.00 0.00 22.85 Industrial Eleven Mile CreekMonsanto Company Cantonment Escambia Escambia River N/A 27.00 26.42 0.00 2.84 23.58 Industrial Escambia River/injection wellBunnell, city of Flagler Lower St. Johns River 3,000 0.30 0.22 0.00 0.00 0.22 Domestic Haw CreekFlagler Beach, city of Flagler Daytona-St. Augustine Coastal 6,500 1.00 0.61 0.00 0.00 0.61 Domestic Intercoastal WaterwayHammock Dunes Flagler Daytona-St. Augustine Coastal 1,814 0.20 0.09 0.09 0.00 0.00 Domestic Reuse systemMatanzas Shores Flagler Daytona-St. Augustine Coastal 2,900 0.32 0.05 0.05 0.00 0.00 Domestic Percolation pondPalm Coast Utilities Flagler Daytona-St. Augustine Coastal 16,000 1.60 2.18 2.18 0.00 0.00 Domestic Percolation pond/spray fieldApalachicola, city of Franklin Apalachicola River 2,800 1.00 0.71 0.00 0.00 0.71 Domestic Whortleberry CreekCarrabelle, city of Franklin New River 700 0.30 0.17 0.17 0.00 0.00 Domestic Spray fieldEastpoint, town of Franklin New River 200 0.17 0.16 0.16 0.00 0.00 Domestic Spray fieldLanark Village Franklin New River 650 0.10 0.06 0.06 0.00 0.00 Domestic Spray field
APPENDIX II. Treated domestic and industrial wastewater discharge, population served, and discharge method by facility in Florida, 1995 [Sources: U.S. Geological Survey and the Florida Department of Environmental Protection; Abbrevations and location of cataloging units and counties are found on pages 76 and 77; plant capacity and discharge are in million gallons per day; ground discharge includes absorption beds, drainfields, percolation ponds, rapid infiltration basins, spray fields and land application/reuse systems]
Utility/Owner/Plant Facility/Plant County Cataloging unit Population served
Plant capacity
1995 DischargeSystem
typeDischarge method or receiving water bodyTotal Ground Injection
Well Surface
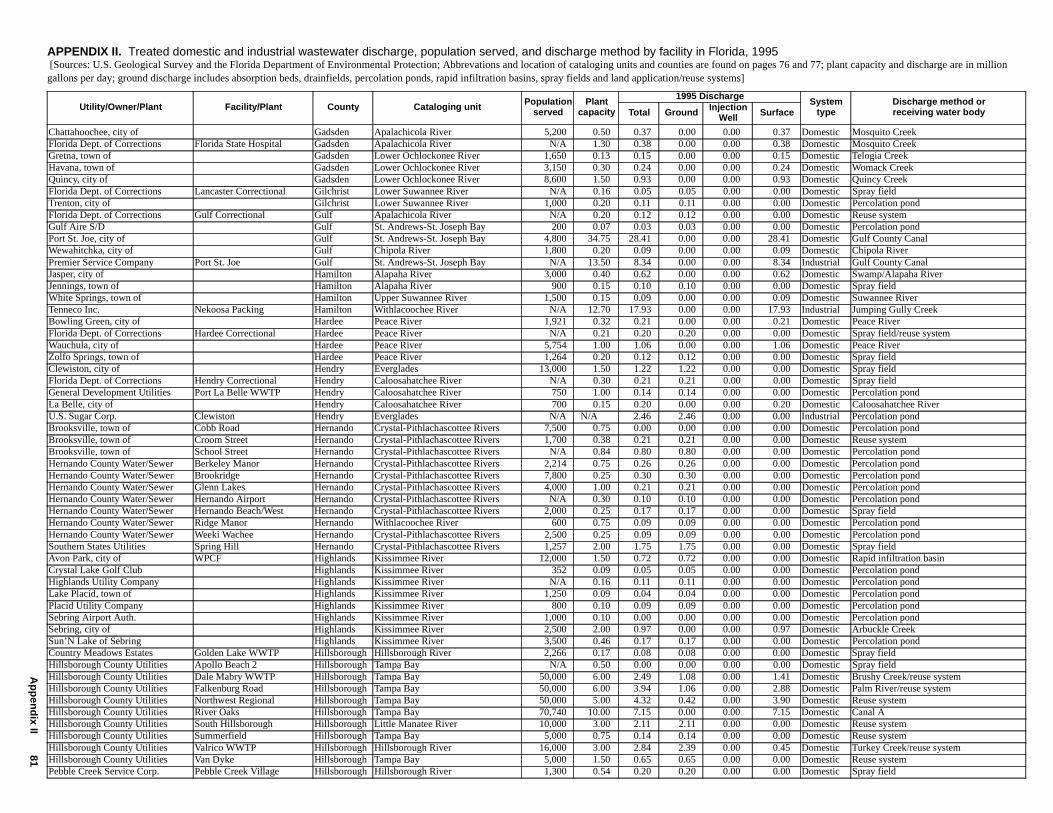
Ap
pen
dix II
81
Chattahoochee, city of Gadsden Apalachicola River 5,200 0.50 0.37 0.00 0.00 0.37 Domestic Mosquito CreekFlorida Dept. of Corrections Florida State Hospital Gadsden Apalachicola River N/A 1.30 0.38 0.00 0.00 0.38 Domestic Mosquito CreekGretna, town of Gadsden Lower Ochlockonee River 1,650 0.13 0.15 0.00 0.00 0.15 Domestic Telogia CreekHavana, town of Gadsden Lower Ochlockonee River 3,150 0.30 0.24 0.00 0.00 0.24 Domestic Womack CreekQuincy, city of Gadsden Lower Ochlockonee River 8,600 1.50 0.93 0.00 0.00 0.93 Domestic Quincy CreekFlorida Dept. of Corrections Lancaster Correctional Gilchrist Lower Suwannee River N/A 0.16 0.05 0.05 0.00 0.00 Domestic Spray fieldTrenton, city of Gilchrist Lower Suwannee River 1,000 0.20 0.11 0.11 0.00 0.00 Domestic Percolation pondFlorida Dept. of Corrections Gulf Correctional Gulf Apalachicola River N/A 0.20 0.12 0.12 0.00 0.00 Domestic Reuse systemGulf Aire S/D Gulf St. Andrews-St. Joseph Bay 200 0.07 0.03 0.03 0.00 0.00 Domestic Percolation pondPort St. Joe, city of Gulf St. Andrews-St. Joseph Bay 4,800 34.75 28.41 0.00 0.00 28.41 Domestic Gulf County CanalWewahitchka, city of Gulf Chipola River 1,800 0.20 0.09 0.00 0.00 0.09 Domestic Chipola RiverPremier Service Company Port St. Joe Gulf St. Andrews-St. Joseph Bay N/A 13.50 8.34 0.00 0.00 8.34 Industrial Gulf County CanalJasper, city of Hamilton Alapaha River 3,000 0.40 0.62 0.00 0.00 0.62 Domestic Swamp/Alapaha RiverJennings, town of Hamilton Alapaha River 900 0.15 0.10 0.10 0.00 0.00 Domestic Spray fieldWhite Springs, town of Hamilton Upper Suwannee River 1,500 0.15 0.09 0.00 0.00 0.09 Domestic Suwannee RiverTenneco Inc. Nekoosa Packing Hamilton Withlacoochee River N/A 12.70 17.93 0.00 0.00 17.93 Industrial Jumping Gully CreekBowling Green, city of Hardee Peace River 1,921 0.32 0.21 0.00 0.00 0.21 Domestic Peace RiverFlorida Dept. of Corrections Hardee Correctional Hardee Peace River N/A 0.21 0.20 0.20 0.00 0.00 Domestic Spray field/reuse systemWauchula, city of Hardee Peace River 5,754 1.00 1.06 0.00 0.00 1.06 Domestic Peace RiverZolfo Springs, town of Hardee Peace River 1,264 0.20 0.12 0.12 0.00 0.00 Domestic Spray fieldClewiston, city of Hendry Everglades 13,000 1.50 1.22 1.22 0.00 0.00 Domestic Spray fieldFlorida Dept. of Corrections Hendry Correctional Hendry Caloosahatchee River N/A 0.30 0.21 0.21 0.00 0.00 Domestic Spray fieldGeneral Development Utilities Port La Belle WWTP Hendry Caloosahatchee River 750 1.00 0.14 0.14 0.00 0.00 Domestic Percolation pondLa Belle, city of Hendry Caloosahatchee River 700 0.15 0.20 0.00 0.00 0.20 Domestic Caloosahatchee RiverU.S. Sugar Corp. Clewiston Hendry Everglades N/A N/A 2.46 2.46 0.00 0.00 Industrial Percolation pondBrooksville, town of Cobb Road Hernando Crystal-Pithlachascottee Rivers 7,500 0.75 0.00 0.00 0.00 0.00 Domestic Percolation pondBrooksville, town of Croom Street Hernando Crystal-Pithlachascottee Rivers 1,700 0.38 0.21 0.21 0.00 0.00 Domestic Reuse systemBrooksville, town of School Street Hernando Crystal-Pithlachascottee Rivers N/A 0.84 0.80 0.80 0.00 0.00 Domestic Percolation pondHernando County Water/Sewer Berkeley Manor Hernando Crystal-Pithlachascottee Rivers 2,214 0.75 0.26 0.26 0.00 0.00 Domestic Percolation pondHernando County Water/Sewer Brookridge Hernando Crystal-Pithlachascottee Rivers 7,800 0.25 0.30 0.30 0.00 0.00 Domestic Percolation pondHernando County Water/Sewer Glenn Lakes Hernando Crystal-Pithlachascottee Rivers 4,000 1.00 0.21 0.21 0.00 0.00 Domestic Percolation pondHernando County Water/Sewer Hernando Airport Hernando Crystal-Pithlachascottee Rivers N/A 0.30 0.10 0.10 0.00 0.00 Domestic Percolation pondHernando County Water/Sewer Hernando Beach/West Hernando Crystal-Pithlachascottee Rivers 2,000 0.25 0.17 0.17 0.00 0.00 Domestic Spray fieldHernando County Water/Sewer Ridge Manor Hernando Withlacoochee River 600 0.75 0.09 0.09 0.00 0.00 Domestic Percolation pondHernando County Water/Sewer Weeki Wachee Hernando Crystal-Pithlachascottee Rivers 2,500 0.25 0.09 0.09 0.00 0.00 Domestic Percolation pondSouthern States Utilities Spring Hill Hernando Crystal-Pithlachascottee Rivers 1,257 2.00 1.75 1.75 0.00 0.00 Domestic Spray fieldAvon Park, city of WPCF Highlands Kissimmee River 12,000 1.50 0.72 0.72 0.00 0.00 Domestic Rapid infiltration basinCrystal Lake Golf Club Highlands Kissimmee River 352 0.09 0.05 0.05 0.00 0.00 Domestic Percolation pondHighlands Utility Company Highlands Kissimmee River N/A 0.16 0.11 0.11 0.00 0.00 Domestic Percolation pondLake Placid, town of Highlands Kissimmee River 1,250 0.09 0.04 0.04 0.00 0.00 Domestic Percolation pondPlacid Utility Company Highlands Kissimmee River 800 0.10 0.09 0.09 0.00 0.00 Domestic Percolation pondSebring Airport Auth. Highlands Kissimmee River 1,000 0.10 0.00 0.00 0.00 0.00 Domestic Percolation pondSebring, city of Highlands Kissimmee River 2,500 2.00 0.97 0.00 0.00 0.97 Domestic Arbuckle CreekSun’N Lake of Sebring Highlands Kissimmee River 3,500 0.46 0.17 0.17 0.00 0.00 Domestic Percolation pondCountry Meadows Estates Golden Lake WWTP Hillsborough Hillsborough River 2,266 0.17 0.08 0.08 0.00 0.00 Domestic Spray fieldHillsborough County Utilities Apollo Beach 2 Hillsborough Tampa Bay N/A 0.50 0.00 0.00 0.00 0.00 Domestic Spray fieldHillsborough County Utilities Dale Mabry WWTP Hillsborough Tampa Bay 50,000 6.00 2.49 1.08 0.00 1.41 Domestic Brushy Creek/reuse systemHillsborough County Utilities Falkenburg Road Hillsborough Tampa Bay 50,000 6.00 3.94 1.06 0.00 2.88 Domestic Palm River/reuse systemHillsborough County Utilities Northwest Regional Hillsborough Tampa Bay 50,000 5.00 4.32 0.42 0.00 3.90 Domestic Reuse systemHillsborough County Utilities River Oaks Hillsborough Tampa Bay 70,740 10.00 7.15 0.00 0.00 7.15 Domestic Canal AHillsborough County Utilities South Hillsborough Hillsborough Little Manatee River 10,000 3.00 2.11 2.11 0.00 0.00 Domestic Reuse systemHillsborough County Utilities Summerfield Hillsborough Tampa Bay 5,000 0.75 0.14 0.14 0.00 0.00 Domestic Reuse systemHillsborough County Utilities Valrico WWTP Hillsborough Hillsborough River 16,000 3.00 2.84 2.39 0.00 0.45 Domestic Turkey Creek/reuse systemHillsborough County Utilities Van Dyke Hillsborough Tampa Bay 5,000 1.50 0.65 0.65 0.00 0.00 Domestic Reuse systemPebble Creek Service Corp. Pebble Creek Village Hillsborough Hillsborough River 1,300 0.54 0.20 0.20 0.00 0.00 Domestic Spray field
APPENDIX II. Treated domestic and industrial wastewater discharge, population served, and discharge method by facility in Florida, 1995 [Sources: U.S. Geological Survey and the Florida Department of Environmental Protection; Abbrevations and location of cataloging units and counties are found on pages 76 and 77; plant capacity and discharge are in million gallons per day; ground discharge includes absorption beds, drainfields, percolation ponds, rapid infiltration basins, spray fields and land application/reuse systems]
Utility/Owner/Plant Facility/Plant County Cataloging unit Population served
Plant capacity
1995 DischargeSystem
typeDischarge method or receiving water bodyTotal Ground Injection
Well Surface
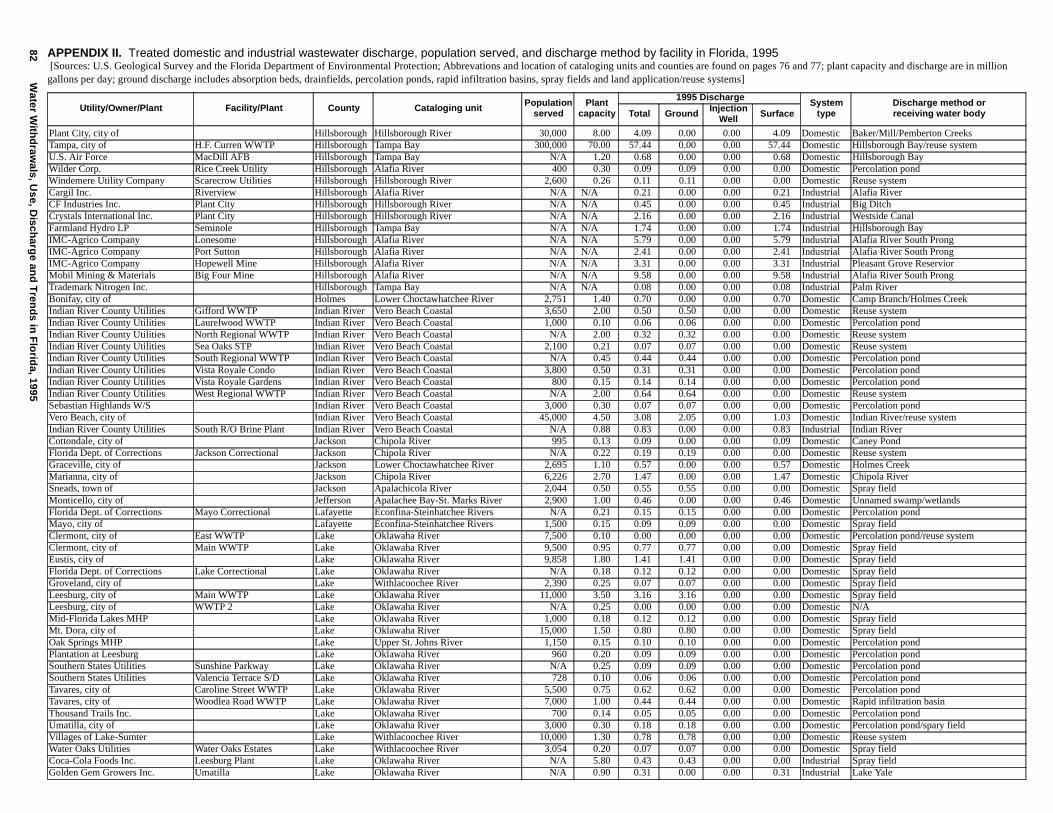
82W
ater With
draw
als, Use, D
ischarg
e and
Tren
ds in
Flo
rida, 1995
Plant City, city of Hillsborough Hillsborough River 30,000 8.00 4.09 0.00 0.00 4.09 Domestic Baker/Mill/Pemberton CreeksTampa, city of H.F. Curren WWTP Hillsborough Tampa Bay 300,000 70.00 57.44 0.00 0.00 57.44 Domestic Hillsborough Bay/reuse systemU.S. Air Force MacDill AFB Hillsborough Tampa Bay N/A 1.20 0.68 0.00 0.00 0.68 Domestic Hillsborough BayWilder Corp. Rice Creek Utility Hillsborough Alafia River 400 0.30 0.09 0.09 0.00 0.00 Domestic Percolation pondWindemere Utility Company Scarecrow Utilities Hillsborough Hillsborough River 2,600 0.26 0.11 0.11 0.00 0.00 Domestic Reuse systemCargil Inc. Riverview Hillsborough Alafia River N/A N/A 0.21 0.00 0.00 0.21 Industrial Alafia RiverCF Industries Inc. Plant City Hillsborough Hillsborough River N/A N/A 0.45 0.00 0.00 0.45 Industrial Big DitchCrystals International Inc. Plant City Hillsborough Hillsborough River N/A N/A 2.16 0.00 0.00 2.16 Industrial Westside CanalFarmland Hydro LP Seminole Hillsborough Tampa Bay N/A N/A 1.74 0.00 0.00 1.74 Industrial Hillsborough BayIMC-Agrico Company Lonesome Hillsborough Alafia River N/A N/A 5.79 0.00 0.00 5.79 Industrial Alafia River South ProngIMC-Agrico Company Port Sutton Hillsborough Alafia River N/A N/A 2.41 0.00 0.00 2.41 Industrial Alafia River South ProngIMC-Agrico Company Hopewell Mine Hillsborough Alafia River N/A N/A 3.31 0.00 0.00 3.31 Industrial Pleasant Grove ReserviorMobil Mining & Materials Big Four Mine Hillsborough Alafia River N/A N/A 9.58 0.00 0.00 9.58 Industrial Alafia River South ProngTrademark Nitrogen Inc. Hillsborough Tampa Bay N/A N/A 0.08 0.00 0.00 0.08 Industrial Palm RiverBonifay, city of Holmes Lower Choctawhatchee River 2,751 1.40 0.70 0.00 0.00 0.70 Domestic Camp Branch/Holmes CreekIndian River County Utilities Gifford WWTP Indian River Vero Beach Coastal 3,650 2.00 0.50 0.50 0.00 0.00 Domestic Reuse systemIndian River County Utilities Laurelwood WWTP Indian River Vero Beach Coastal 1,000 0.10 0.06 0.06 0.00 0.00 Domestic Percolation pondIndian River County Utilities North Regional WWTP Indian River Vero Beach Coastal N/A 2.00 0.32 0.32 0.00 0.00 Domestic Reuse systemIndian River County Utilities Sea Oaks STP Indian River Vero Beach Coastal 2,100 0.21 0.07 0.07 0.00 0.00 Domestic Reuse systemIndian River County Utilities South Regional WWTP Indian River Vero Beach Coastal N/A 0.45 0.44 0.44 0.00 0.00 Domestic Percolation pondIndian River County Utilities Vista Royale Condo Indian River Vero Beach Coastal 3,800 0.50 0.31 0.31 0.00 0.00 Domestic Percolation pondIndian River County Utilities Vista Royale Gardens Indian River Vero Beach Coastal 800 0.15 0.14 0.14 0.00 0.00 Domestic Percolation pondIndian River County Utilities West Regional WWTP Indian River Vero Beach Coastal N/A 2.00 0.64 0.64 0.00 0.00 Domestic Reuse systemSebastian Highlands W/S Indian River Vero Beach Coastal 3,000 0.30 0.07 0.07 0.00 0.00 Domestic Percolation pondVero Beach, city of Indian River Vero Beach Coastal 45,000 4.50 3.08 2.05 0.00 1.03 Domestic Indian River/reuse systemIndian River County Utilities South R/O Brine Plant Indian River Vero Beach Coastal N/A 0.88 0.83 0.00 0.00 0.83 Industrial Indian RiverCottondale, city of Jackson Chipola River 995 0.13 0.09 0.00 0.00 0.09 Domestic Caney PondFlorida Dept. of Corrections Jackson Correctional Jackson Chipola River N/A 0.22 0.19 0.19 0.00 0.00 Domestic Reuse systemGraceville, city of Jackson Lower Choctawhatchee River 2,695 1.10 0.57 0.00 0.00 0.57 Domestic Holmes CreekMarianna, city of Jackson Chipola River 6,226 2.70 1.47 0.00 0.00 1.47 Domestic Chipola RiverSneads, town of Jackson Apalachicola River 2,044 0.50 0.55 0.55 0.00 0.00 Domestic Spray fieldMonticello, city of Jefferson Apalachee Bay-St. Marks River 2,900 1.00 0.46 0.00 0.00 0.46 Domestic Unnamed swamp/wetlandsFlorida Dept. of Corrections Mayo Correctional Lafayette Econfina-Steinhatchee Rivers N/A 0.21 0.15 0.15 0.00 0.00 Domestic Percolation pondMayo, city of Lafayette Econfina-Steinhatchee Rivers 1,500 0.15 0.09 0.09 0.00 0.00 Domestic Spray fieldClermont, city of East WWTP Lake Oklawaha River 7,500 0.10 0.00 0.00 0.00 0.00 Domestic Percolation pond/reuse systemClermont, city of Main WWTP Lake Oklawaha River 9,500 0.95 0.77 0.77 0.00 0.00 Domestic Spray fieldEustis, city of Lake Oklawaha River 9,858 1.80 1.41 1.41 0.00 0.00 Domestic Spray fieldFlorida Dept. of Corrections Lake Correctional Lake Oklawaha River N/A 0.18 0.12 0.12 0.00 0.00 Domestic Spray fieldGroveland, city of Lake Withlacoochee River 2,390 0.25 0.07 0.07 0.00 0.00 Domestic Spray fieldLeesburg, city of Main WWTP Lake Oklawaha River 11,000 3.50 3.16 3.16 0.00 0.00 Domestic Spray fieldLeesburg, city of WWTP 2 Lake Oklawaha River N/A 0.25 0.00 0.00 0.00 0.00 Domestic N/AMid-Florida Lakes MHP Lake Oklawaha River 1,000 0.18 0.12 0.12 0.00 0.00 Domestic Spray fieldMt. Dora, city of Lake Oklawaha River 15,000 1.50 0.80 0.80 0.00 0.00 Domestic Spray fieldOak Springs MHP Lake Upper St. Johns River 1,150 0.15 0.10 0.10 0.00 0.00 Domestic Percolation pondPlantation at Leesburg Lake Oklawaha River 960 0.20 0.09 0.09 0.00 0.00 Domestic Percolation pondSouthern States Utilities Sunshine Parkway Lake Oklawaha River N/A 0.25 0.09 0.09 0.00 0.00 Domestic Percolation pondSouthern States Utilities Valencia Terrace S/D Lake Oklawaha River 728 0.10 0.06 0.06 0.00 0.00 Domestic Percolation pondTavares, city of Caroline Street WWTP Lake Oklawaha River 5,500 0.75 0.62 0.62 0.00 0.00 Domestic Percolation pondTavares, city of Woodlea Road WWTP Lake Oklawaha River 7,000 1.00 0.44 0.44 0.00 0.00 Domestic Rapid infiltration basinThousand Trails Inc. Lake Oklawaha River 700 0.14 0.05 0.05 0.00 0.00 Domestic Percolation pondUmatilla, city of Lake Oklawaha River 3,000 0.30 0.18 0.18 0.00 0.00 Domestic Percolation pond/spary fieldVillages of Lake-Sumter Lake Withlacoochee River 10,000 1.30 0.78 0.78 0.00 0.00 Domestic Reuse systemWater Oaks Utilities Water Oaks Estates Lake Withlacoochee River 3,054 0.20 0.07 0.07 0.00 0.00 Domestic Spray fieldCoca-Cola Foods Inc. Leesburg Plant Lake Oklawaha River N/A 5.80 0.43 0.43 0.00 0.00 Industrial Spray fieldGolden Gem Growers Inc. Umatilla Lake Oklawaha River N/A 0.90 0.31 0.00 0.00 0.31 Industrial Lake Yale
APPENDIX II. Treated domestic and industrial wastewater discharge, population served, and discharge method by facility in Florida, 1995 [Sources: U.S. Geological Survey and the Florida Department of Environmental Protection; Abbrevations and location of cataloging units and counties are found on pages 76 and 77; plant capacity and discharge are in million gallons per day; ground discharge includes absorption beds, drainfields, percolation ponds, rapid infiltration basins, spray fields and land application/reuse systems]
Utility/Owner/Plant Facility/Plant County Cataloging unit Population served
Plant capacity
1995 DischargeSystem
typeDischarge method or receiving water bodyTotal Ground Injection
Well Surface

Ap
pen
dix II
83
Silver Springs Citrus Corp. Ocoee Lake Oklawaha River N/A 0.50 0.34 0.34 0.00 0.00 Industrial Spray fieldBonita Springs Country Club Lee Big Cypress Swamp 360 0.30 0.09 0.09 0.00 0.00 Domestic Percolation pondBonita Springs Utilities Lee Big Cypress Swamp 25,000 2.50 1.57 1.57 0.00 0.00 Domestic Spray fieldBuccaneer MHP Lee Big Cypress Swamp N/A 0.17 0.14 0.14 0.00 0.00 Domestic Percolation pondCape Coral, city of Everest WRF Lee Caloosahatchee River 15,000 14.60 6.43 0.00 0.00 6.43 Domestic Caloosahatchee RiverCitrus Park S/D Lee Big Cypress Swamp 2,000 0.20 0.07 0.07 0.00 0.00 Domestic Percolation pondCross Creek Country Club Lee Big Cypress Swamp 2,065 0.25 0.10 0.10 0.00 0.00 Domestic Spray fieldDel Tura Country Club Lee Charlotte Harbor 415 0.20 0.12 0.12 0.00 0.00 Domestic Spray fieldEagle Ridge Utilities Lee Big Cypress Swamp 2,000 0.10 0.16 0.16 0.00 0.00 Domestic Reuse systemFlorida Cities Water Company Fiesta Village Lee Caloosahatchee River 15,000 5.00 1.93 0.00 0.00 1.93 Domestic Caloosahatchee RiverFlorida Cities Water Company Waterway Estates Lee Caloosahatchee River 15,800 1.50 1.10 0.00 0.00 1.10 Domestic Caloosahatchee RiverFlorida Dept. of Corrections Gulf Coast Center Lee Caloosahatchee River N/A 0.10 0.08 0.08 0.00 0.00 Domestic Percolation pondForest Utilities Lee Big Cypress Swamp 250 0.50 0.20 0.20 0.00 0.00 Domestic Reuse systemFort Myers, city of Central WWTP Lee Caloosahatchee River 50,000 11.00 7.93 0.00 0.00 7.93 Domestic Caloosahatchee RiverFort Myers, city of South AWWT Lee Caloosahatchee River 60,000 12.00 7.46 0.00 0.00 7.46 Domestic Caloosahatchee RiverGasparilla Island W/D Lee Charlotte Harbor 2,750 0.28 0.33 0.33 0.00 0.00 Domestic Spray field/injection wellGateway Service District Lee Charlotte Harbor 800 1.00 0.11 0.11 0.00 0.00 Domestic Percolation pondGulf Utility Company San Carlos WWTP Lee Big Cypress Swamp 3,000 0.30 0.20 0.20 0.00 0.00 Domestic Reuse systemJamaica Bay West Lee Caloosahatchee River 2,830 0.30 0.18 0.18 0.00 0.00 Domestic Percolation pondLake Fairway Country Club Lee Charlotte Harbor 1,800 0.30 0.13 0.13 0.00 0.00 Domestic Percolation pond/spray fieldLee County Utilities Fort Myers Beach STP Lee Big Cypress Swamp 59,218 6.00 2.83 2.83 0.00 0.00 Domestic Reuse systemLee County Utilities Matlacha Lee Charlotte Harbor 1,500 0.15 0.13 0.13 0.00 0.00 Domestic Percolation pondNorth Fort Myers Utility Lee Caloosahatchee River N/A 2.00 0.75 0.40 0.35 0.00 Domestic Spray field Sanibel Utilites Donax WRF Lee Charlotte Harbor 10,000 1.60 0.94 0.94 0.00 0.00 Domestic Reuse systemSouth Seas Utility Company South Seas Plantation Lee Charlotte Harbor 1,600 0.45 0.23 0.23 0.00 0.00 Domestic Percolation pond/spray fieldSouthern States Utilities Lehigh Acres Lee Caloosahatchee River N/A 1.40 1.51 1.51 0.00 0.00 Domestic Percolation pondTamiami Utility Company Tamiami Village Lee Caloosahatchee River 1,500 0.15 0.04 0.04 0.00 0.00 Domestic Percolation pondTallahassee, city of Airport STP Leon Apalachee Bay-St. Marks River N/A 0.06 0.04 0.04 0.00 0.00 Domestic Spray fieldTallahassee, city of Lake Bradford STP Leon Apalachee Bay-St. Marks River 25,000 4.50 3.49 3.49 0.00 0.00 Domestic Spray fieldTallahassee, city of T.P. Smith WWTP Leon Apalachee Bay-St. Marks River 100,000 27.50 13.49 13.49 0.00 0.00 Domestic Reuse systemTalquin Electric Cooperative Killearn Lakes STP Leon Lower Ochlockonee River 1,000 0.35 0.21 0.21 0.00 0.00 Domestic Percolation pondTalquin Electric Cooperative Lakewood Area STP Leon Lower Ochlockonee River 2,000 0.30 0.23 0.23 0.00 0.00 Domestic Percolation pondCedar Key, city of Levy Waccasassa River 1,000 0.10 0.10 0.10 0.00 0.00 Domestic Gulf of MexicoChiefland, city of Levy Lower Suwannee River 3,000 0.30 0.22 0.22 0.00 0.00 Domestic Percolation pondWilliston, city of Levy Oklawaha River 2,000 0.45 0.27 0.27 0.00 0.00 Domestic Spray fieldFlorida Dept. of Corrections Liberty Correctional Liberty Apalachicola River N/A 0.20 0.11 0.11 0.00 0.00 Domestic Percolation pondMadison, city of Madison Aucilla River 3,960 0.70 0.92 0.00 0.00 0.92 Domestic Unnamed LakeBradenton, city of Manatee Manatee River 58,864 6.00 6.35 0.67 0.00 5.68 Domestic Manatee River/reuse systemManatee County Utilities North Regional WWTP Manatee Manatee River 15,000 5.40 2.34 2.34 0.00 0.00 Domestic Reuse systemManatee County Utilities Southeast Regional Manatee Sarasota Bay 15,000 5.40 2.41 2.41 0.00 0.00 Domestic Reuse systemManatee County Utilities Southwest Subregional Manatee Sarasota Bay 100,000 18.00 13.38 2.21 11.17 0.00 Domestic Injection well/reuse systemPalmetto, city of Manatee Tampa Bay 9,747 1.40 1.33 0.08 0.00 1.25 Domestic Terra Ceia Bay/reuse systemNu-Gulf Industries Inc. Wyngate Creek Mine Manatee Myakka River N/A N/A 1.73 0.00 0.00 1.73 Industrial Wyngate CreekTropicana Products Inc. Bradenton Manatee Manatee River N/A 0.80 1.39 0.00 0.00 1.39 Industrial Manatee RiverBelleview, city of Marion Withlacoochee River 5,500 0.58 0.10 0.10 0.00 0.00 Domestic Reuse system/spray fieldDecca Utilities Oak Run Estates Marion Withlacoochee River 4,450 0.37 0.29 0.29 0.00 0.00 Domestic Percolation pondDunnellon, city of Marion Withlacoochee River 1,146 0.25 0.14 0.07 0.00 0.07 Domestic Rainbow River/spray fieldFlorida Dept. of Corrections Marion Correctional Marion Oklawaha River N/A 0.44 0.44 0.44 0.00 0.00 Domestic Spray fieldMarion County Utilities Silver Springs Shores Marion Oklawaha River 12,000 1.20 0.62 0.62 0.00 0.00 Domestic Percolation pond/spray fieldOcala, city of WWTP 1 Marion Oklawaha River 15,000 2.40 1.58 1.58 0.00 0.00 Domestic Reuse systemOcala, city of WWTP 2 Marion Withlacoochee River 32,000 6.50 3.54 3.54 0.00 0.00 Domestic Spray fieldOn Top of The World W/S Marion Withlacoochee River 2,635 0.75 0.29 0.29 0.00 0.00 Domestic Percolation pondRainbow Springs Utilities Rainbow Springs Estates Marion Withlacoochee River 4,030 0.09 0.06 0.06 0.00 0.00 Domestic Percolation pondRolling Green MHP Marion Oklawaha River 2,500 0.25 0.10 0.10 0.00 0.00 Domestic Percolation pondSouthern States Utilities Marion Oaks Marion Withlacoochee River 6,460 0.20 0.16 0.16 0.00 0.00 Domestic Percolation pond
APPENDIX II. Treated domestic and industrial wastewater discharge, population served, and discharge method by facility in Florida, 1995 [Sources: U.S. Geological Survey and the Florida Department of Environmental Protection; Abbrevations and location of cataloging units and counties are found on pages 76 and 77; plant capacity and discharge are in million gallons per day; ground discharge includes absorption beds, drainfields, percolation ponds, rapid infiltration basins, spray fields and land application/reuse systems]
Utility/Owner/Plant Facility/Plant County Cataloging unit Population served
Plant capacity
1995 DischargeSystem
typeDischarge method or receiving water bodyTotal Ground Injection
Well Surface
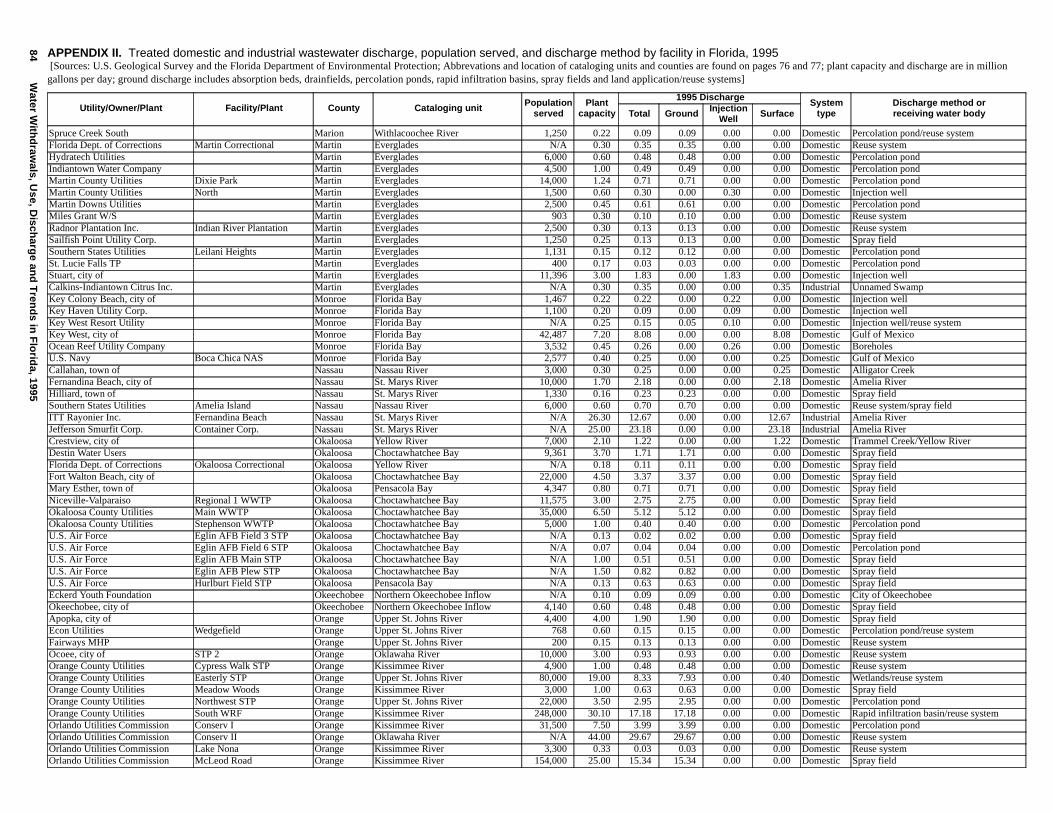
84W
ater With
draw
als, Use, D
ischarg
e and
Tren
ds in
Flo
rida, 1995
Spruce Creek South Marion Withlacoochee River 1,250 0.22 0.09 0.09 0.00 0.00 Domestic Percolation pond/reuse systemFlorida Dept. of Corrections Martin Correctional Martin Everglades N/A 0.30 0.35 0.35 0.00 0.00 Domestic Reuse systemHydratech Utilities Martin Everglades 6,000 0.60 0.48 0.48 0.00 0.00 Domestic Percolation pondIndiantown Water Company Martin Everglades 4,500 1.00 0.49 0.49 0.00 0.00 Domestic Percolation pondMartin County Utilities Dixie Park Martin Everglades 14,000 1.24 0.71 0.71 0.00 0.00 Domestic Percolation pondMartin County Utilities North Martin Everglades 1,500 0.60 0.30 0.00 0.30 0.00 Domestic Injection wellMartin Downs Utilities Martin Everglades 2,500 0.45 0.61 0.61 0.00 0.00 Domestic Percolation pondMiles Grant W/S Martin Everglades 903 0.30 0.10 0.10 0.00 0.00 Domestic Reuse systemRadnor Plantation Inc. Indian River Plantation Martin Everglades 2,500 0.30 0.13 0.13 0.00 0.00 Domestic Reuse systemSailfish Point Utility Corp. Martin Everglades 1,250 0.25 0.13 0.13 0.00 0.00 Domestic Spray fieldSouthern States Utilities Leilani Heights Martin Everglades 1,131 0.15 0.12 0.12 0.00 0.00 Domestic Percolation pondSt. Lucie Falls TP Martin Everglades 400 0.17 0.03 0.03 0.00 0.00 Domestic Percolation pondStuart, city of Martin Everglades 11,396 3.00 1.83 0.00 1.83 0.00 Domestic Injection wellCalkins-Indiantown Citrus Inc. Martin Everglades N/A 0.30 0.35 0.00 0.00 0.35 Industrial Unnamed SwampKey Colony Beach, city of Monroe Florida Bay 1,467 0.22 0.22 0.00 0.22 0.00 Domestic Injection wellKey Haven Utility Corp. Monroe Florida Bay 1,100 0.20 0.09 0.00 0.09 0.00 Domestic Injection wellKey West Resort Utility Monroe Florida Bay N/A 0.25 0.15 0.05 0.10 0.00 Domestic Injection well/reuse systemKey West, city of Monroe Florida Bay 42,487 7.20 8.08 0.00 0.00 8.08 Domestic Gulf of MexicoOcean Reef Utility Company Monroe Florida Bay 3,532 0.45 0.26 0.00 0.26 0.00 Domestic BoreholesU.S. Navy Boca Chica NAS Monroe Florida Bay 2,577 0.40 0.25 0.00 0.00 0.25 Domestic Gulf of MexicoCallahan, town of Nassau Nassau River 3,000 0.30 0.25 0.00 0.00 0.25 Domestic Alligator CreekFernandina Beach, city of Nassau St. Marys River 10,000 1.70 2.18 0.00 0.00 2.18 Domestic Amelia RiverHilliard, town of Nassau St. Marys River 1,330 0.16 0.23 0.23 0.00 0.00 Domestic Spray fieldSouthern States Utilities Amelia Island Nassau Nassau River 6,000 0.60 0.70 0.70 0.00 0.00 Domestic Reuse system/spray fieldITT Rayonier Inc. Fernandina Beach Nassau St. Marys River N/A 26.30 12.67 0.00 0.00 12.67 Industrial Amelia RiverJefferson Smurfit Corp. Container Corp. Nassau St. Marys River N/A 25.00 23.18 0.00 0.00 23.18 Industrial Amelia RiverCrestview, city of Okaloosa Yellow River 7,000 2.10 1.22 0.00 0.00 1.22 Domestic Trammel Creek/Yellow RiverDestin Water Users Okaloosa Choctawhatchee Bay 9,361 3.70 1.71 1.71 0.00 0.00 Domestic Spray fieldFlorida Dept. of Corrections Okaloosa Correctional Okaloosa Yellow River N/A 0.18 0.11 0.11 0.00 0.00 Domestic Spray fieldFort Walton Beach, city of Okaloosa Choctawhatchee Bay 22,000 4.50 3.37 3.37 0.00 0.00 Domestic Spray fieldMary Esther, town of Okaloosa Pensacola Bay 4,347 0.80 0.71 0.71 0.00 0.00 Domestic Spray fieldNiceville-Valparaiso Regional 1 WWTP Okaloosa Choctawhatchee Bay 11,575 3.00 2.75 2.75 0.00 0.00 Domestic Spray fieldOkaloosa County Utilities Main WWTP Okaloosa Choctawhatchee Bay 35,000 6.50 5.12 5.12 0.00 0.00 Domestic Spray fieldOkaloosa County Utilities Stephenson WWTP Okaloosa Choctawhatchee Bay 5,000 1.00 0.40 0.40 0.00 0.00 Domestic Percolation pondU.S. Air Force Eglin AFB Field 3 STP Okaloosa Choctawhatchee Bay N/A 0.13 0.02 0.02 0.00 0.00 Domestic Spray fieldU.S. Air Force Eglin AFB Field 6 STP Okaloosa Choctawhatchee Bay N/A 0.07 0.04 0.04 0.00 0.00 Domestic Percolation pondU.S. Air Force Eglin AFB Main STP Okaloosa Choctawhatchee Bay N/A 1.00 0.51 0.51 0.00 0.00 Domestic Spray fieldU.S. Air Force Eglin AFB Plew STP Okaloosa Choctawhatchee Bay N/A 1.50 0.82 0.82 0.00 0.00 Domestic Spray fieldU.S. Air Force Hurlburt Field STP Okaloosa Pensacola Bay N/A 0.13 0.63 0.63 0.00 0.00 Domestic Spray fieldEckerd Youth Foundation Okeechobee Northern Okeechobee Inflow N/A 0.10 0.09 0.09 0.00 0.00 Domestic City of OkeechobeeOkeechobee, city of Okeechobee Northern Okeechobee Inflow 4,140 0.60 0.48 0.48 0.00 0.00 Domestic Spray fieldApopka, city of Orange Upper St. Johns River 4,400 4.00 1.90 1.90 0.00 0.00 Domestic Spray fieldEcon Utilities Wedgefield Orange Upper St. Johns River 768 0.60 0.15 0.15 0.00 0.00 Domestic Percolation pond/reuse systemFairways MHP Orange Upper St. Johns River 200 0.15 0.13 0.13 0.00 0.00 Domestic Reuse systemOcoee, city of STP 2 Orange Oklawaha River 10,000 3.00 0.93 0.93 0.00 0.00 Domestic Reuse systemOrange County Utilities Cypress Walk STP Orange Kissimmee River 4,900 1.00 0.48 0.48 0.00 0.00 Domestic Reuse systemOrange County Utilities Easterly STP Orange Upper St. Johns River 80,000 19.00 8.33 7.93 0.00 0.40 Domestic Wetlands/reuse systemOrange County Utilities Meadow Woods Orange Kissimmee River 3,000 1.00 0.63 0.63 0.00 0.00 Domestic Spray fieldOrange County Utilities Northwest STP Orange Upper St. Johns River 22,000 3.50 2.95 2.95 0.00 0.00 Domestic Percolation pondOrange County Utilities South WRF Orange Kissimmee River 248,000 30.10 17.18 17.18 0.00 0.00 Domestic Rapid infiltration basin/reuse systemOrlando Utilities Commission Conserv I Orange Kissimmee River 31,500 7.50 3.99 3.99 0.00 0.00 Domestic Percolation pondOrlando Utilities Commission Conserv II Orange Oklawaha River N/A 44.00 29.67 29.67 0.00 0.00 Domestic Reuse systemOrlando Utilities Commission Lake Nona Orange Kissimmee River 3,300 0.33 0.03 0.03 0.00 0.00 Domestic Reuse systemOrlando Utilities Commission McLeod Road Orange Kissimmee River 154,000 25.00 15.34 15.34 0.00 0.00 Domestic Spray field
APPENDIX II. Treated domestic and industrial wastewater discharge, population served, and discharge method by facility in Florida, 1995 [Sources: U.S. Geological Survey and the Florida Department of Environmental Protection; Abbrevations and location of cataloging units and counties are found on pages 76 and 77; plant capacity and discharge are in million gallons per day; ground discharge includes absorption beds, drainfields, percolation ponds, rapid infiltration basins, spray fields and land application/reuse systems]
Utility/Owner/Plant Facility/Plant County Cataloging unit Population served
Plant capacity
1995 DischargeSystem
typeDischarge method or receiving water bodyTotal Ground Injection
Well Surface
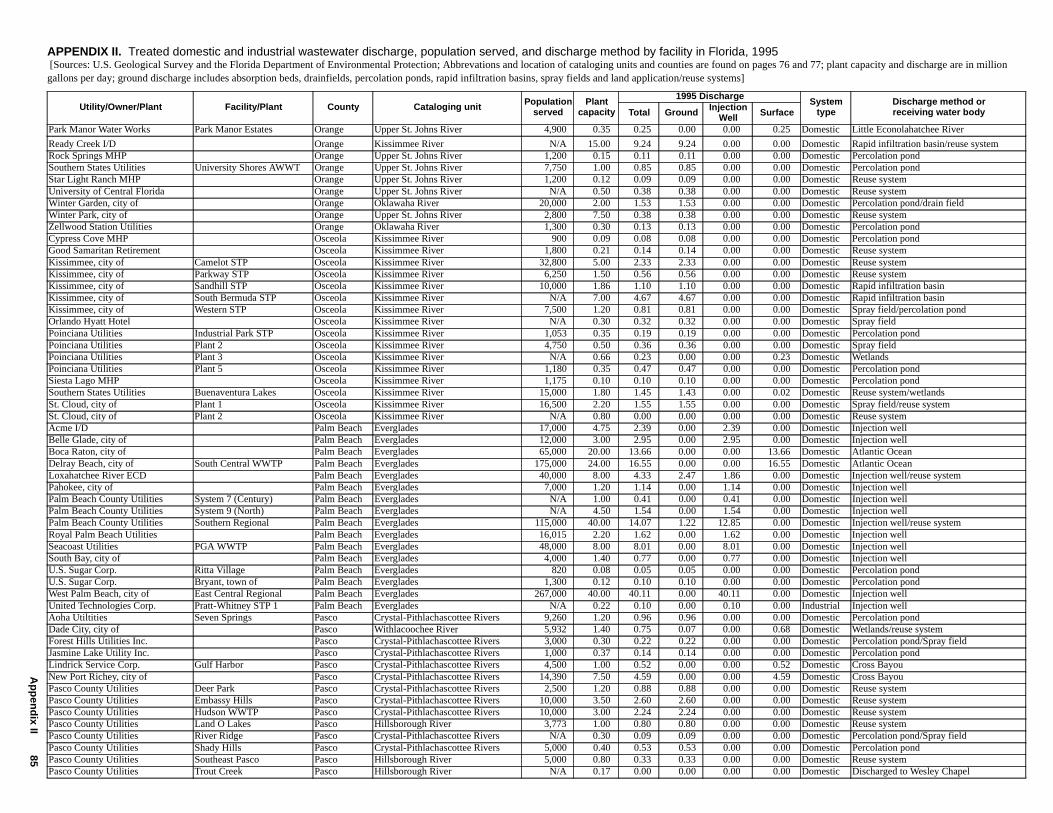
Ap
pen
dix II
85
Park Manor Water Works Park Manor Estates Orange Upper St. Johns River 4,900 0.35 0.25 0.00 0.00 0.25 Domestic Little Econolahatchee River
Ready Creek I/D Orange Kissimmee River N/A 15.00 9.24 9.24 0.00 0.00 Domestic Rapid infiltration basin/reuse systemRock Springs MHP Orange Upper St. Johns River 1,200 0.15 0.11 0.11 0.00 0.00 Domestic Percolation pondSouthern States Utilities University Shores AWWT Orange Upper St. Johns River 7,750 1.00 0.85 0.85 0.00 0.00 Domestic Percolation pondStar Light Ranch MHP Orange Upper St. Johns River 1,200 0.12 0.09 0.09 0.00 0.00 Domestic Reuse systemUniversity of Central Florida Orange Upper St. Johns River N/A 0.50 0.38 0.38 0.00 0.00 Domestic Reuse systemWinter Garden, city of Orange Oklawaha River 20,000 2.00 1.53 1.53 0.00 0.00 Domestic Percolation pond/drain fieldWinter Park, city of Orange Upper St. Johns River 2,800 7.50 0.38 0.38 0.00 0.00 Domestic Reuse systemZellwood Station Utilities Orange Oklawaha River 1,300 0.30 0.13 0.13 0.00 0.00 Domestic Percolation pond Cypress Cove MHP Osceola Kissimmee River 900 0.09 0.08 0.08 0.00 0.00 Domestic Percolation pondGood Samaritan Retirement Osceola Kissimmee River 1,800 0.21 0.14 0.14 0.00 0.00 Domestic Reuse system Kissimmee, city of Camelot STP Osceola Kissimmee River 32,800 5.00 2.33 2.33 0.00 0.00 Domestic Reuse system Kissimmee, city of Parkway STP Osceola Kissimmee River 6,250 1.50 0.56 0.56 0.00 0.00 Domestic Reuse system Kissimmee, city of Sandhill STP Osceola Kissimmee River 10,000 1.86 1.10 1.10 0.00 0.00 Domestic Rapid infiltration basinKissimmee, city of South Bermuda STP Osceola Kissimmee River N/A 7.00 4.67 4.67 0.00 0.00 Domestic Rapid infiltration basinKissimmee, city of Western STP Osceola Kissimmee River 7,500 1.20 0.81 0.81 0.00 0.00 Domestic Spray field/percolation pondOrlando Hyatt Hotel Osceola Kissimmee River N/A 0.30 0.32 0.32 0.00 0.00 Domestic Spray field Poinciana Utilities Industrial Park STP Osceola Kissimmee River 1,053 0.35 0.19 0.19 0.00 0.00 Domestic Percolation pondPoinciana Utilities Plant 2 Osceola Kissimmee River 4,750 0.50 0.36 0.36 0.00 0.00 Domestic Spray field Poinciana Utilities Plant 3 Osceola Kissimmee River N/A 0.66 0.23 0.00 0.00 0.23 Domestic WetlandsPoinciana Utilities Plant 5 Osceola Kissimmee River 1,180 0.35 0.47 0.47 0.00 0.00 Domestic Percolation pondSiesta Lago MHP Osceola Kissimmee River 1,175 0.10 0.10 0.10 0.00 0.00 Domestic Percolation pondSouthern States Utilities Buenaventura Lakes Osceola Kissimmee River 15,000 1.80 1.45 1.43 0.00 0.02 Domestic Reuse system/wetlandsSt. Cloud, city of Plant 1 Osceola Kissimmee River 16,500 2.20 1.55 1.55 0.00 0.00 Domestic Spray field/reuse systemSt. Cloud, city of Plant 2 Osceola Kissimmee River N/A 0.80 0.00 0.00 0.00 0.00 Domestic Reuse systemAcme I/D Palm Beach Everglades 17,000 4.75 2.39 0.00 2.39 0.00 Domestic Injection wellBelle Glade, city of Palm Beach Everglades 12,000 3.00 2.95 0.00 2.95 0.00 Domestic Injection wellBoca Raton, city of Palm Beach Everglades 65,000 20.00 13.66 0.00 0.00 13.66 Domestic Atlantic OceanDelray Beach, city of South Central WWTP Palm Beach Everglades 175,000 24.00 16.55 0.00 0.00 16.55 Domestic Atlantic OceanLoxahatchee River ECD Palm Beach Everglades 40,000 8.00 4.33 2.47 1.86 0.00 Domestic Injection well/reuse systemPahokee, city of Palm Beach Everglades 7,000 1.20 1.14 0.00 1.14 0.00 Domestic Injection wellPalm Beach County Utilities System 7 (Century) Palm Beach Everglades N/A 1.00 0.41 0.00 0.41 0.00 Domestic Injection wellPalm Beach County Utilities System 9 (North) Palm Beach Everglades N/A 4.50 1.54 0.00 1.54 0.00 Domestic Injection wellPalm Beach County Utilities Southern Regional Palm Beach Everglades 115,000 40.00 14.07 1.22 12.85 0.00 Domestic Injection well/reuse systemRoyal Palm Beach Utilities Palm Beach Everglades 16,015 2.20 1.62 0.00 1.62 0.00 Domestic Injection wellSeacoast Utilities PGA WWTP Palm Beach Everglades 48,000 8.00 8.01 0.00 8.01 0.00 Domestic Injection wellSouth Bay, city of Palm Beach Everglades 4,000 1.40 0.77 0.00 0.77 0.00 Domestic Injection wellU.S. Sugar Corp. Ritta Village Palm Beach Everglades 820 0.08 0.05 0.05 0.00 0.00 Domestic Percolation pondU.S. Sugar Corp. Bryant, town of Palm Beach Everglades 1,300 0.12 0.10 0.10 0.00 0.00 Domestic Percolation pondWest Palm Beach, city of East Central Regional Palm Beach Everglades 267,000 40.00 40.11 0.00 40.11 0.00 Domestic Injection wellUnited Technologies Corp. Pratt-Whitney STP 1 Palm Beach Everglades N/A 0.22 0.10 0.00 0.10 0.00 Industrial Injection wellAoha Utiltities Seven Springs Pasco Crystal-Pithlachascottee Rivers 9,260 1.20 0.96 0.96 0.00 0.00 Domestic Percolation pondDade City, city of Pasco Withlacoochee River 5,932 1.40 0.75 0.07 0.00 0.68 Domestic Wetlands/reuse systemForest Hills Utilities Inc. Pasco Crystal-Pithlachascottee Rivers 3,000 0.30 0.22 0.22 0.00 0.00 Domestic Percolation pond/Spray fieldJasmine Lake Utility Inc. Pasco Crystal-Pithlachascottee Rivers 1,000 0.37 0.14 0.14 0.00 0.00 Domestic Percolation pondLindrick Service Corp. Gulf Harbor Pasco Crystal-Pithlachascottee Rivers 4,500 1.00 0.52 0.00 0.00 0.52 Domestic Cross BayouNew Port Richey, city of Pasco Crystal-Pithlachascottee Rivers 14,390 7.50 4.59 0.00 0.00 4.59 Domestic Cross BayouPasco County Utilities Deer Park Pasco Crystal-Pithlachascottee Rivers 2,500 1.20 0.88 0.88 0.00 0.00 Domestic Reuse systemPasco County Utilities Embassy Hills Pasco Crystal-Pithlachascottee Rivers 10,000 3.50 2.60 2.60 0.00 0.00 Domestic Reuse systemPasco County Utilities Hudson WWTP Pasco Crystal-Pithlachascottee Rivers 10,000 3.00 2.24 2.24 0.00 0.00 Domestic Reuse systemPasco County Utilities Land O Lakes Pasco Hillsborough River 3,773 1.00 0.80 0.80 0.00 0.00 Domestic Reuse systemPasco County Utilities River Ridge Pasco Crystal-Pithlachascottee Rivers N/A 0.30 0.09 0.09 0.00 0.00 Domestic Percolation pond/Spray fieldPasco County Utilities Shady Hills Pasco Crystal-Pithlachascottee Rivers 5,000 0.40 0.53 0.53 0.00 0.00 Domestic Percolation pondPasco County Utilities Southeast Pasco Pasco Hillsborough River 5,000 0.80 0.33 0.33 0.00 0.00 Domestic Reuse systemPasco County Utilities Trout Creek Pasco Hillsborough River N/A 0.17 0.00 0.00 0.00 0.00 Domestic Discharged to Wesley Chapel
APPENDIX II. Treated domestic and industrial wastewater discharge, population served, and discharge method by facility in Florida, 1995 [Sources: U.S. Geological Survey and the Florida Department of Environmental Protection; Abbrevations and location of cataloging units and counties are found on pages 76 and 77; plant capacity and discharge are in million gallons per day; ground discharge includes absorption beds, drainfields, percolation ponds, rapid infiltration basins, spray fields and land application/reuse systems]
Utility/Owner/Plant Facility/Plant County Cataloging unit Population served
Plant capacity
1995 DischargeSystem
typeDischarge method or receiving water bodyTotal Ground Injection
Well Surface
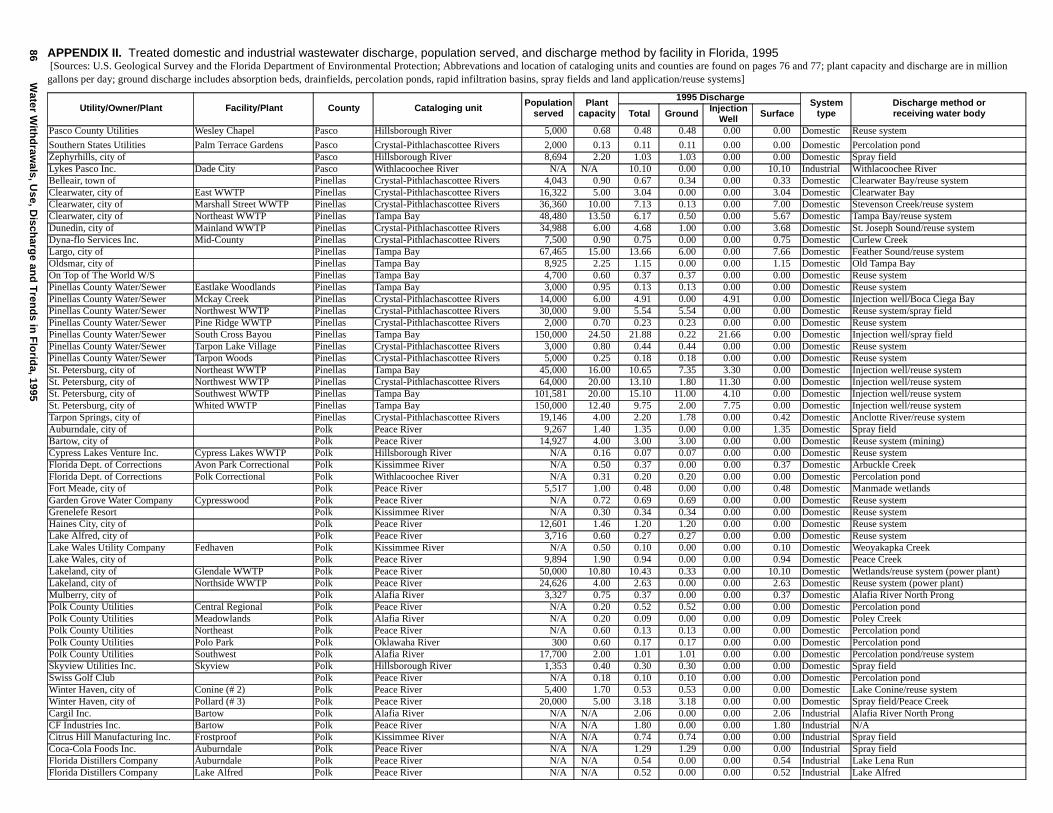
86W
ater With
draw
als, Use, D
ischarg
e and
Tren
ds in
Flo
rida, 1995
Pasco County Utilities Wesley Chapel Pasco Hillsborough River 5,000 0.68 0.48 0.48 0.00 0.00 Domestic Reuse system
Southern States Utilities Palm Terrace Gardens Pasco Crystal-Pithlachascottee Rivers 2,000 0.13 0.11 0.11 0.00 0.00 Domestic Percolation pondZephyrhills, city of Pasco Hillsborough River 8,694 2.20 1.03 1.03 0.00 0.00 Domestic Spray fieldLykes Pasco Inc. Dade City Pasco Withlacoochee River N/A N/A 10.10 0.00 0.00 10.10 Industrial Withlacoochee RiverBelleair, town of Pinellas Crystal-Pithlachascottee Rivers 4,043 0.90 0.67 0.34 0.00 0.33 Domestic Clearwater Bay/reuse systemClearwater, city of East WWTP Pinellas Crystal-Pithlachascottee Rivers 16,322 5.00 3.04 0.00 0.00 3.04 Domestic Clearwater BayClearwater, city of Marshall Street WWTP Pinellas Crystal-Pithlachascottee Rivers 36,360 10.00 7.13 0.13 0.00 7.00 Domestic Stevenson Creek/reuse systemClearwater, city of Northeast WWTP Pinellas Tampa Bay 48,480 13.50 6.17 0.50 0.00 5.67 Domestic Tampa Bay/reuse systemDunedin, city of Mainland WWTP Pinellas Crystal-Pithlachascottee Rivers 34,988 6.00 4.68 1.00 0.00 3.68 Domestic St. Joseph Sound/reuse systemDyna-flo Services Inc. Mid-County Pinellas Crystal-Pithlachascottee Rivers 7,500 0.90 0.75 0.00 0.00 0.75 Domestic Curlew CreekLargo, city of Pinellas Tampa Bay 67,465 15.00 13.66 6.00 0.00 7.66 Domestic Feather Sound/reuse systemOldsmar, city of Pinellas Tampa Bay 8,925 2.25 1.15 0.00 0.00 1.15 Domestic Old Tampa BayOn Top of The World W/S Pinellas Tampa Bay 4,700 0.60 0.37 0.37 0.00 0.00 Domestic Reuse systemPinellas County Water/Sewer Eastlake Woodlands Pinellas Tampa Bay 3,000 0.95 0.13 0.13 0.00 0.00 Domestic Reuse system Pinellas County Water/Sewer Mckay Creek Pinellas Crystal-Pithlachascottee Rivers 14,000 6.00 4.91 0.00 4.91 0.00 Domestic Injection well/Boca Ciega BayPinellas County Water/Sewer Northwest WWTP Pinellas Crystal-Pithlachascottee Rivers 30,000 9.00 5.54 5.54 0.00 0.00 Domestic Reuse system/spray fieldPinellas County Water/Sewer Pine Ridge WWTP Pinellas Crystal-Pithlachascottee Rivers 2,000 0.70 0.23 0.23 0.00 0.00 Domestic Reuse systemPinellas County Water/Sewer South Cross Bayou Pinellas Tampa Bay 150,000 24.50 21.88 0.22 21.66 0.00 Domestic Injection well/spray fieldPinellas County Water/Sewer Tarpon Lake Village Pinellas Crystal-Pithlachascottee Rivers 3,000 0.80 0.44 0.44 0.00 0.00 Domestic Reuse systemPinellas County Water/Sewer Tarpon Woods Pinellas Crystal-Pithlachascottee Rivers 5,000 0.25 0.18 0.18 0.00 0.00 Domestic Reuse systemSt. Petersburg, city of Northeast WWTP Pinellas Tampa Bay 45,000 16.00 10.65 7.35 3.30 0.00 Domestic Injection well/reuse systemSt. Petersburg, city of Northwest WWTP Pinellas Crystal-Pithlachascottee Rivers 64,000 20.00 13.10 1.80 11.30 0.00 Domestic Injection well/reuse systemSt. Petersburg, city of Southwest WWTP Pinellas Tampa Bay 101,581 20.00 15.10 11.00 4.10 0.00 Domestic Injection well/reuse systemSt. Petersburg, city of Whited WWTP Pinellas Tampa Bay 150,000 12.40 9.75 2.00 7.75 0.00 Domestic Injection well/reuse systemTarpon Springs, city of Pinellas Crystal-Pithlachascottee Rivers 19,146 4.00 2.20 1.78 0.00 0.42 Domestic Anclotte River/reuse systemAuburndale, city of Polk Peace River 9,267 1.40 1.35 0.00 0.00 1.35 Domestic Spray fieldBartow, city of Polk Peace River 14,927 4.00 3.00 3.00 0.00 0.00 Domestic Reuse system (mining)Cypress Lakes Venture Inc. Cypress Lakes WWTP Polk Hillsborough River N/A 0.16 0.07 0.07 0.00 0.00 Domestic Reuse systemFlorida Dept. of Corrections Avon Park Correctional Polk Kissimmee River N/A 0.50 0.37 0.00 0.00 0.37 Domestic Arbuckle CreekFlorida Dept. of Corrections Polk Correctional Polk Withlacoochee River N/A 0.31 0.20 0.20 0.00 0.00 Domestic Percolation pondFort Meade, city of Polk Peace River 5,517 1.00 0.48 0.00 0.00 0.48 Domestic Manmade wetlandsGarden Grove Water Company Cypresswood Polk Peace River N/A 0.72 0.69 0.69 0.00 0.00 Domestic Reuse systemGrenelefe Resort Polk Kissimmee River N/A 0.30 0.34 0.34 0.00 0.00 Domestic Reuse systemHaines City, city of Polk Peace River 12,601 1.46 1.20 1.20 0.00 0.00 Domestic Reuse systemLake Alfred, city of Polk Peace River 3,716 0.60 0.27 0.27 0.00 0.00 Domestic Reuse systemLake Wales Utility Company Fedhaven Polk Kissimmee River N/A 0.50 0.10 0.00 0.00 0.10 Domestic Weoyakapka CreekLake Wales, city of Polk Peace River 9,894 1.90 0.94 0.00 0.00 0.94 Domestic Peace CreekLakeland, city of Glendale WWTP Polk Peace River 50,000 10.80 10.43 0.33 0.00 10.10 Domestic Wetlands/reuse system (power plant)Lakeland, city of Northside WWTP Polk Peace River 24,626 4.00 2.63 0.00 0.00 2.63 Domestic Reuse system (power plant)Mulberry, city of Polk Alafia River 3,327 0.75 0.37 0.00 0.00 0.37 Domestic Alafia River North ProngPolk County Utilities Central Regional Polk Peace River N/A 0.20 0.52 0.52 0.00 0.00 Domestic Percolation pondPolk County Utilities Meadowlands Polk Alafia River N/A 0.20 0.09 0.00 0.00 0.09 Domestic Poley CreekPolk County Utilities Northeast Polk Peace River N/A 0.60 0.13 0.13 0.00 0.00 Domestic Percolation pondPolk County Utilities Polo Park Polk Oklawaha River 300 0.60 0.17 0.17 0.00 0.00 Domestic Percolation pondPolk County Utilities Southwest Polk Alafia River 17,700 2.00 1.01 1.01 0.00 0.00 Domestic Percolation pond/reuse systemSkyview Utilities Inc. Skyview Polk Hillsborough River 1,353 0.40 0.30 0.30 0.00 0.00 Domestic Spray fieldSwiss Golf Club Polk Peace River N/A 0.18 0.10 0.10 0.00 0.00 Domestic Percolation pondWinter Haven, city of Conine (# 2) Polk Peace River 5,400 1.70 0.53 0.53 0.00 0.00 Domestic Lake Conine/reuse systemWinter Haven, city of Pollard (# 3) Polk Peace River 20,000 5.00 3.18 3.18 0.00 0.00 Domestic Spray field/Peace CreekCargil Inc. Bartow Polk Alafia River N/A N/A 2.06 0.00 0.00 2.06 Industrial Alafia River North ProngCF Industries Inc. Bartow Polk Peace River N/A N/A 1.80 0.00 0.00 1.80 Industrial N/ACitrus Hill Manufacturing Inc. Frostproof Polk Kissimmee River N/A N/A 0.74 0.74 0.00 0.00 Industrial Spray fieldCoca-Cola Foods Inc. Auburndale Polk Peace River N/A N/A 1.29 1.29 0.00 0.00 Industrial Spray fieldFlorida Distillers Company Auburndale Polk Peace River N/A N/A 0.54 0.00 0.00 0.54 Industrial Lake Lena Run Florida Distillers Company Lake Alfred Polk Peace River N/A N/A 0.52 0.00 0.00 0.52 Industrial Lake Alfred
APPENDIX II. Treated domestic and industrial wastewater discharge, population served, and discharge method by facility in Florida, 1995 [Sources: U.S. Geological Survey and the Florida Department of Environmental Protection; Abbrevations and location of cataloging units and counties are found on pages 76 and 77; plant capacity and discharge are in million gallons per day; ground discharge includes absorption beds, drainfields, percolation ponds, rapid infiltration basins, spray fields and land application/reuse systems]
Utility/Owner/Plant Facility/Plant County Cataloging unit Population served
Plant capacity
1995 DischargeSystem
typeDischarge method or receiving water bodyTotal Ground Injection
Well Surface
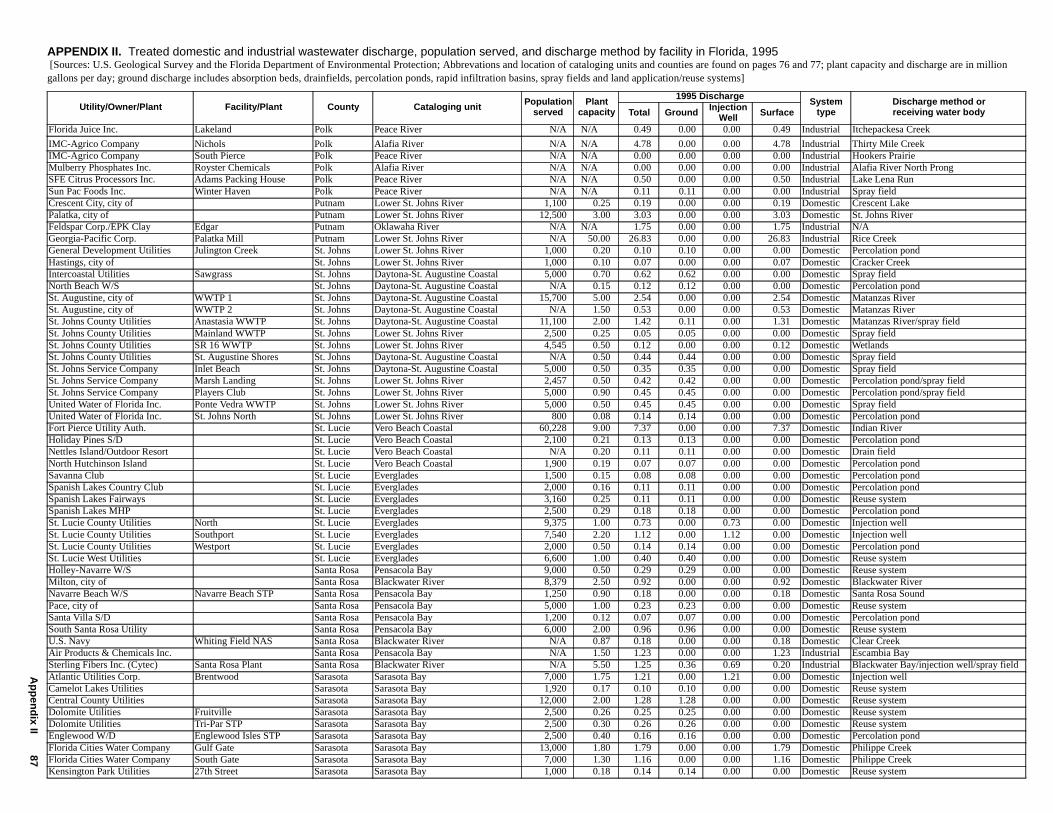
Ap
pen
dix II
87
Florida Juice Inc. Lakeland Polk Peace River N/A N/A 0.49 0.00 0.00 0.49 Industrial Itchepackesa Creek
IMC-Agrico Company Nichols Polk Alafia River N/A N/A 4.78 0.00 0.00 4.78 Industrial Thirty Mile CreekIMC-Agrico Company South Pierce Polk Peace River N/A N/A 0.00 0.00 0.00 0.00 Industrial Hookers PrairieMulberry Phosphates Inc. Royster Chemicals Polk Alafia River N/A N/A 0.00 0.00 0.00 0.00 Industrial Alafia River North ProngSFE Citrus Processors Inc. Adams Packing House Polk Peace River N/A N/A 0.50 0.00 0.00 0.50 Industrial Lake Lena Run Sun Pac Foods Inc. Winter Haven Polk Peace River N/A N/A 0.11 0.11 0.00 0.00 Industrial Spray fieldCrescent City, city of Putnam Lower St. Johns River 1,100 0.25 0.19 0.00 0.00 0.19 Domestic Crescent LakePalatka, city of Putnam Lower St. Johns River 12,500 3.00 3.03 0.00 0.00 3.03 Domestic St. Johns RiverFeldspar Corp./EPK Clay Edgar Putnam Oklawaha River N/A N/A 1.75 0.00 0.00 1.75 Industrial N/AGeorgia-Pacific Corp. Palatka Mill Putnam Lower St. Johns River N/A 50.00 26.83 0.00 0.00 26.83 Industrial Rice CreekGeneral Development Utilities Julington Creek St. Johns Lower St. Johns River 1,000 0.20 0.10 0.10 0.00 0.00 Domestic Percolation pondHastings, city of St. Johns Lower St. Johns River 1,000 0.10 0.07 0.00 0.00 0.07 Domestic Cracker CreekIntercoastal Utilities Sawgrass St. Johns Daytona-St. Augustine Coastal 5,000 0.70 0.62 0.62 0.00 0.00 Domestic Spray fieldNorth Beach W/S St. Johns Daytona-St. Augustine Coastal N/A 0.15 0.12 0.12 0.00 0.00 Domestic Percolation pondSt. Augustine, city of WWTP 1 St. Johns Daytona-St. Augustine Coastal 15,700 5.00 2.54 0.00 0.00 2.54 Domestic Matanzas RiverSt. Augustine, city of WWTP 2 St. Johns Daytona-St. Augustine Coastal N/A 1.50 0.53 0.00 0.00 0.53 Domestic Matanzas RiverSt. Johns County Utilities Anastasia WWTP St. Johns Daytona-St. Augustine Coastal 11,100 2.00 1.42 0.11 0.00 1.31 Domestic Matanzas River/spray fieldSt. Johns County Utilities Mainland WWTP St. Johns Lower St. Johns River 2,500 0.25 0.05 0.05 0.00 0.00 Domestic Spray fieldSt. Johns County Utilities SR 16 WWTP St. Johns Lower St. Johns River 4,545 0.50 0.12 0.00 0.00 0.12 Domestic WetlandsSt. Johns County Utilities St. Augustine Shores St. Johns Daytona-St. Augustine Coastal N/A 0.50 0.44 0.44 0.00 0.00 Domestic Spray fieldSt. Johns Service Company Inlet Beach St. Johns Daytona-St. Augustine Coastal 5,000 0.50 0.35 0.35 0.00 0.00 Domestic Spray fieldSt. Johns Service Company Marsh Landing St. Johns Lower St. Johns River 2,457 0.50 0.42 0.42 0.00 0.00 Domestic Percolation pond/spray fieldSt. Johns Service Company Players Club St. Johns Lower St. Johns River 5,000 0.90 0.45 0.45 0.00 0.00 Domestic Percolation pond/spray fieldUnited Water of Florida Inc. Ponte Vedra WWTP St. Johns Lower St. Johns River 5,000 0.50 0.45 0.45 0.00 0.00 Domestic Spray fieldUnited Water of Florida Inc. St. Johns North St. Johns Lower St. Johns River 800 0.08 0.14 0.14 0.00 0.00 Domestic Percolation pondFort Pierce Utility Auth. St. Lucie Vero Beach Coastal 60,228 9.00 7.37 0.00 0.00 7.37 Domestic Indian RiverHoliday Pines S/D St. Lucie Vero Beach Coastal 2,100 0.21 0.13 0.13 0.00 0.00 Domestic Percolation pondNettles Island/Outdoor Resort St. Lucie Vero Beach Coastal N/A 0.20 0.11 0.11 0.00 0.00 Domestic Drain fieldNorth Hutchinson Island St. Lucie Vero Beach Coastal 1,900 0.19 0.07 0.07 0.00 0.00 Domestic Percolation pondSavanna Club St. Lucie Everglades 1,500 0.15 0.08 0.08 0.00 0.00 Domestic Percolation pondSpanish Lakes Country Club St. Lucie Everglades 2,000 0.16 0.11 0.11 0.00 0.00 Domestic Percolation pondSpanish Lakes Fairways St. Lucie Everglades 3,160 0.25 0.11 0.11 0.00 0.00 Domestic Reuse systemSpanish Lakes MHP St. Lucie Everglades 2,500 0.29 0.18 0.18 0.00 0.00 Domestic Percolation pondSt. Lucie County Utilities North St. Lucie Everglades 9,375 1.00 0.73 0.00 0.73 0.00 Domestic Injection wellSt. Lucie County Utilities Southport St. Lucie Everglades 7,540 2.20 1.12 0.00 1.12 0.00 Domestic Injection wellSt. Lucie County Utilities Westport St. Lucie Everglades 2,000 0.50 0.14 0.14 0.00 0.00 Domestic Percolation pondSt. Lucie West Utilities St. Lucie Everglades 6,600 1.00 0.40 0.40 0.00 0.00 Domestic Reuse systemHolley-Navarre W/S Santa Rosa Pensacola Bay 9,000 0.50 0.29 0.29 0.00 0.00 Domestic Reuse systemMilton, city of Santa Rosa Blackwater River 8,379 2.50 0.92 0.00 0.00 0.92 Domestic Blackwater RiverNavarre Beach W/S Navarre Beach STP Santa Rosa Pensacola Bay 1,250 0.90 0.18 0.00 0.00 0.18 Domestic Santa Rosa SoundPace, city of Santa Rosa Pensacola Bay 5,000 1.00 0.23 0.23 0.00 0.00 Domestic Reuse systemSanta Villa S/D Santa Rosa Pensacola Bay 1,200 0.12 0.07 0.07 0.00 0.00 Domestic Percolation pondSouth Santa Rosa Utility Santa Rosa Pensacola Bay 6,000 2.00 0.96 0.96 0.00 0.00 Domestic Reuse systemU.S. Navy Whiting Field NAS Santa Rosa Blackwater River N/A 0.87 0.18 0.00 0.00 0.18 Domestic Clear CreekAir Products & Chemicals Inc. Santa Rosa Pensacola Bay N/A 1.50 1.23 0.00 0.00 1.23 Industrial Escambia BaySterling Fibers Inc. (Cytec) Santa Rosa Plant Santa Rosa Blackwater River N/A 5.50 1.25 0.36 0.69 0.20 Industrial Blackwater Bay/injection well/spray fieldAtlantic Utilities Corp. Brentwood Sarasota Sarasota Bay 7,000 1.75 1.21 0.00 1.21 0.00 Domestic Injection wellCamelot Lakes Utilities Sarasota Sarasota Bay 1,920 0.17 0.10 0.10 0.00 0.00 Domestic Reuse systemCentral County Utilities Sarasota Sarasota Bay 12,000 2.00 1.28 1.28 0.00 0.00 Domestic Reuse systemDolomite Utilities Fruitville Sarasota Sarasota Bay 2,500 0.26 0.25 0.25 0.00 0.00 Domestic Reuse systemDolomite Utilities Tri-Par STP Sarasota Sarasota Bay 2,500 0.30 0.26 0.26 0.00 0.00 Domestic Reuse systemEnglewood W/D Englewood Isles STP Sarasota Sarasota Bay 2,500 0.40 0.16 0.16 0.00 0.00 Domestic Percolation pondFlorida Cities Water Company Gulf Gate Sarasota Sarasota Bay 13,000 1.80 1.79 0.00 0.00 1.79 Domestic Philippe CreekFlorida Cities Water Company South Gate Sarasota Sarasota Bay 7,000 1.30 1.16 0.00 0.00 1.16 Domestic Philippe CreekKensington Park Utilities 27th Street Sarasota Sarasota Bay 1,000 0.18 0.14 0.14 0.00 0.00 Domestic Reuse system
APPENDIX II. Treated domestic and industrial wastewater discharge, population served, and discharge method by facility in Florida, 1995 [Sources: U.S. Geological Survey and the Florida Department of Environmental Protection; Abbrevations and location of cataloging units and counties are found on pages 76 and 77; plant capacity and discharge are in million gallons per day; ground discharge includes absorption beds, drainfields, percolation ponds, rapid infiltration basins, spray fields and land application/reuse systems]
Utility/Owner/Plant Facility/Plant County Cataloging unit Population served
Plant capacity
1995 DischargeSystem
typeDischarge method or receiving water bodyTotal Ground Injection
Well Surface
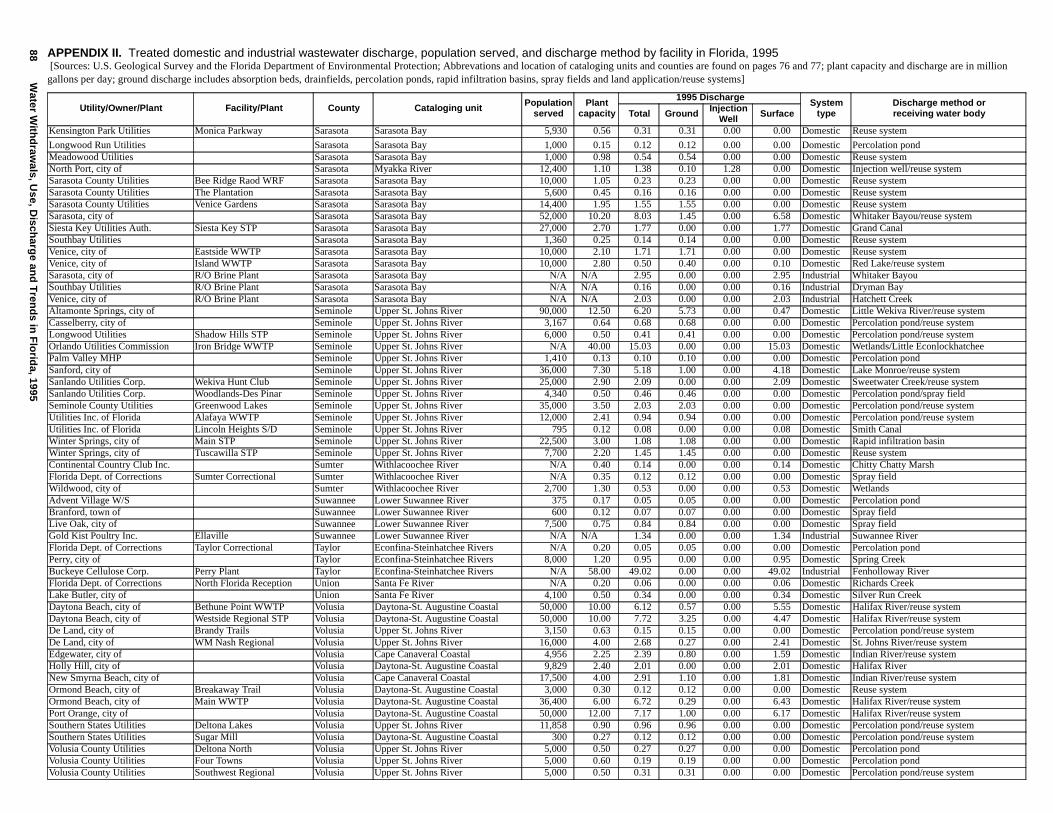
88W
ater With
draw
als, Use, D
ischarg
e and
Tren
ds in
Flo
rida, 1995
Kensington Park Utilities Monica Parkway Sarasota Sarasota Bay 5,930 0.56 0.31 0.31 0.00 0.00 Domestic Reuse system
Longwood Run Utilities Sarasota Sarasota Bay 1,000 0.15 0.12 0.12 0.00 0.00 Domestic Percolation pondMeadowood Utilities Sarasota Sarasota Bay 1,000 0.98 0.54 0.54 0.00 0.00 Domestic Reuse systemNorth Port, city of Sarasota Myakka River 12,400 1.10 1.38 0.10 1.28 0.00 Domestic Injection well/reuse systemSarasota County Utilities Bee Ridge Raod WRF Sarasota Sarasota Bay 10,000 1.05 0.23 0.23 0.00 0.00 Domestic Reuse systemSarasota County Utilities The Plantation Sarasota Sarasota Bay 5,600 0.45 0.16 0.16 0.00 0.00 Domestic Reuse systemSarasota County Utilities Venice Gardens Sarasota Sarasota Bay 14,400 1.95 1.55 1.55 0.00 0.00 Domestic Reuse systemSarasota, city of Sarasota Sarasota Bay 52,000 10.20 8.03 1.45 0.00 6.58 Domestic Whitaker Bayou/reuse systemSiesta Key Utilities Auth. Siesta Key STP Sarasota Sarasota Bay 27,000 2.70 1.77 0.00 0.00 1.77 Domestic Grand CanalSouthbay Utilities Sarasota Sarasota Bay 1,360 0.25 0.14 0.14 0.00 0.00 Domestic Reuse systemVenice, city of Eastside WWTP Sarasota Sarasota Bay 10,000 2.10 1.71 1.71 0.00 0.00 Domestic Reuse systemVenice, city of Island WWTP Sarasota Sarasota Bay 10,000 2.80 0.50 0.40 0.00 0.10 Domestic Red Lake/reuse systemSarasota, city of R/O Brine Plant Sarasota Sarasota Bay N/A N/A 2.95 0.00 0.00 2.95 Industrial Whitaker BayouSouthbay Utilities R/O Brine Plant Sarasota Sarasota Bay N/A N/A 0.16 0.00 0.00 0.16 Industrial Dryman BayVenice, city of R/O Brine Plant Sarasota Sarasota Bay N/A N/A 2.03 0.00 0.00 2.03 Industrial Hatchett CreekAltamonte Springs, city of Seminole Upper St. Johns River 90,000 12.50 6.20 5.73 0.00 0.47 Domestic Little Wekiva River/reuse systemCasselberry, city of Seminole Upper St. Johns River 3,167 0.64 0.68 0.68 0.00 0.00 Domestic Percolation pond/reuse systemLongwood Utilities Shadow Hills STP Seminole Upper St. Johns River 6,000 0.50 0.41 0.41 0.00 0.00 Domestic Percolation pond/reuse systemOrlando Utilities Commission Iron Bridge WWTP Seminole Upper St. Johns River N/A 40.00 15.03 0.00 0.00 15.03 Domestic Wetlands/Little EconlockhatcheePalm Valley MHP Seminole Upper St. Johns River 1,410 0.13 0.10 0.10 0.00 0.00 Domestic Percolation pondSanford, city of Seminole Upper St. Johns River 36,000 7.30 5.18 1.00 0.00 4.18 Domestic Lake Monroe/reuse systemSanlando Utilities Corp. Wekiva Hunt Club Seminole Upper St. Johns River 25,000 2.90 2.09 0.00 0.00 2.09 Domestic Sweetwater Creek/reuse systemSanlando Utilities Corp. Woodlands-Des Pinar Seminole Upper St. Johns River 4,340 0.50 0.46 0.46 0.00 0.00 Domestic Percolation pond/spray fieldSeminole County Utilities Greenwood Lakes Seminole Upper St. Johns River 35,000 3.50 2.03 2.03 0.00 0.00 Domestic Percolation pond/reuse systemUtilities Inc. of Florida Alafaya WWTP Seminole Upper St. Johns River 12,000 2.41 0.94 0.94 0.00 0.00 Domestic Percolation pond/reuse systemUtilities Inc. of Florida Lincoln Heights S/D Seminole Upper St. Johns River 795 0.12 0.08 0.00 0.00 0.08 Domestic Smith CanalWinter Springs, city of Main STP Seminole Upper St. Johns River 22,500 3.00 1.08 1.08 0.00 0.00 Domestic Rapid infiltration basinWinter Springs, city of Tuscawilla STP Seminole Upper St. Johns River 7,700 2.20 1.45 1.45 0.00 0.00 Domestic Reuse systemContinental Country Club Inc. Sumter Withlacoochee River N/A 0.40 0.14 0.00 0.00 0.14 Domestic Chitty Chatty MarshFlorida Dept. of Corrections Sumter Correctional Sumter Withlacoochee River N/A 0.35 0.12 0.12 0.00 0.00 Domestic Spray fieldWildwood, city of Sumter Withlacoochee River 2,700 1.30 0.53 0.00 0.00 0.53 Domestic WetlandsAdvent Village W/S Suwannee Lower Suwannee River 375 0.17 0.05 0.05 0.00 0.00 Domestic Percolation pondBranford, town of Suwannee Lower Suwannee River 600 0.12 0.07 0.07 0.00 0.00 Domestic Spray fieldLive Oak, city of Suwannee Lower Suwannee River 7,500 0.75 0.84 0.84 0.00 0.00 Domestic Spray fieldGold Kist Poultry Inc. Ellaville Suwannee Lower Suwannee River N/A N/A 1.34 0.00 0.00 1.34 Industrial Suwannee RiverFlorida Dept. of Corrections Taylor Correctional Taylor Econfina-Steinhatchee Rivers N/A 0.20 0.05 0.05 0.00 0.00 Domestic Percolation pondPerry, city of Taylor Econfina-Steinhatchee Rivers 8,000 1.20 0.95 0.00 0.00 0.95 Domestic Spring CreekBuckeye Cellulose Corp. Perry Plant Taylor Econfina-Steinhatchee Rivers N/A 58.00 49.02 0.00 0.00 49.02 Industrial Fenholloway RiverFlorida Dept. of Corrections North Florida Reception Union Santa Fe River N/A 0.20 0.06 0.00 0.00 0.06 Domestic Richards CreekLake Butler, city of Union Santa Fe River 4,100 0.50 0.34 0.00 0.00 0.34 Domestic Silver Run CreekDaytona Beach, city of Bethune Point WWTP Volusia Daytona-St. Augustine Coastal 50,000 10.00 6.12 0.57 0.00 5.55 Domestic Halifax River/reuse systemDaytona Beach, city of Westside Regional STP Volusia Daytona-St. Augustine Coastal 50,000 10.00 7.72 3.25 0.00 4.47 Domestic Halifax River/reuse systemDe Land, city of Brandy Trails Volusia Upper St. Johns River 3,150 0.63 0.15 0.15 0.00 0.00 Domestic Percolation pond/reuse systemDe Land, city of WM Nash Regional Volusia Upper St. Johns River 16,000 4.00 2.68 0.27 0.00 2.41 Domestic St. Johns River/reuse systemEdgewater, city of Volusia Cape Canaveral Coastal 4,956 2.25 2.39 0.80 0.00 1.59 Domestic Indian River/reuse systemHolly Hill, city of Volusia Daytona-St. Augustine Coastal 9,829 2.40 2.01 0.00 0.00 2.01 Domestic Halifax River New Smyrna Beach, city of Volusia Cape Canaveral Coastal 17,500 4.00 2.91 1.10 0.00 1.81 Domestic Indian River/reuse systemOrmond Beach, city of Breakaway Trail Volusia Daytona-St. Augustine Coastal 3,000 0.30 0.12 0.12 0.00 0.00 Domestic Reuse systemOrmond Beach, city of Main WWTP Volusia Daytona-St. Augustine Coastal 36,400 6.00 6.72 0.29 0.00 6.43 Domestic Halifax River/reuse systemPort Orange, city of Volusia Daytona-St. Augustine Coastal 50,000 12.00 7.17 1.00 0.00 6.17 Domestic Halifax River/reuse systemSouthern States Utilities Deltona Lakes Volusia Upper St. Johns River 11,858 0.90 0.96 0.96 0.00 0.00 Domestic Percolation pond/reuse systemSouthern States Utilities Sugar Mill Volusia Daytona-St. Augustine Coastal 300 0.27 0.12 0.12 0.00 0.00 Domestic Percolation pond/reuse systemVolusia County Utilities Deltona North Volusia Upper St. Johns River 5,000 0.50 0.27 0.27 0.00 0.00 Domestic Percolation pondVolusia County Utilities Four Towns Volusia Upper St. Johns River 5,000 0.60 0.19 0.19 0.00 0.00 Domestic Percolation pondVolusia County Utilities Southwest Regional Volusia Upper St. Johns River 5,000 0.50 0.31 0.31 0.00 0.00 Domestic Percolation pond/reuse system
APPENDIX II. Treated domestic and industrial wastewater discharge, population served, and discharge method by facility in Florida, 1995 [Sources: U.S. Geological Survey and the Florida Department of Environmental Protection; Abbrevations and location of cataloging units and counties are found on pages 76 and 77; plant capacity and discharge are in million gallons per day; ground discharge includes absorption beds, drainfields, percolation ponds, rapid infiltration basins, spray fields and land application/reuse systems]
Utility/Owner/Plant Facility/Plant County Cataloging unit Population served
Plant capacity
1995 DischargeSystem
typeDischarge method or receiving water bodyTotal Ground Injection
Well Surface
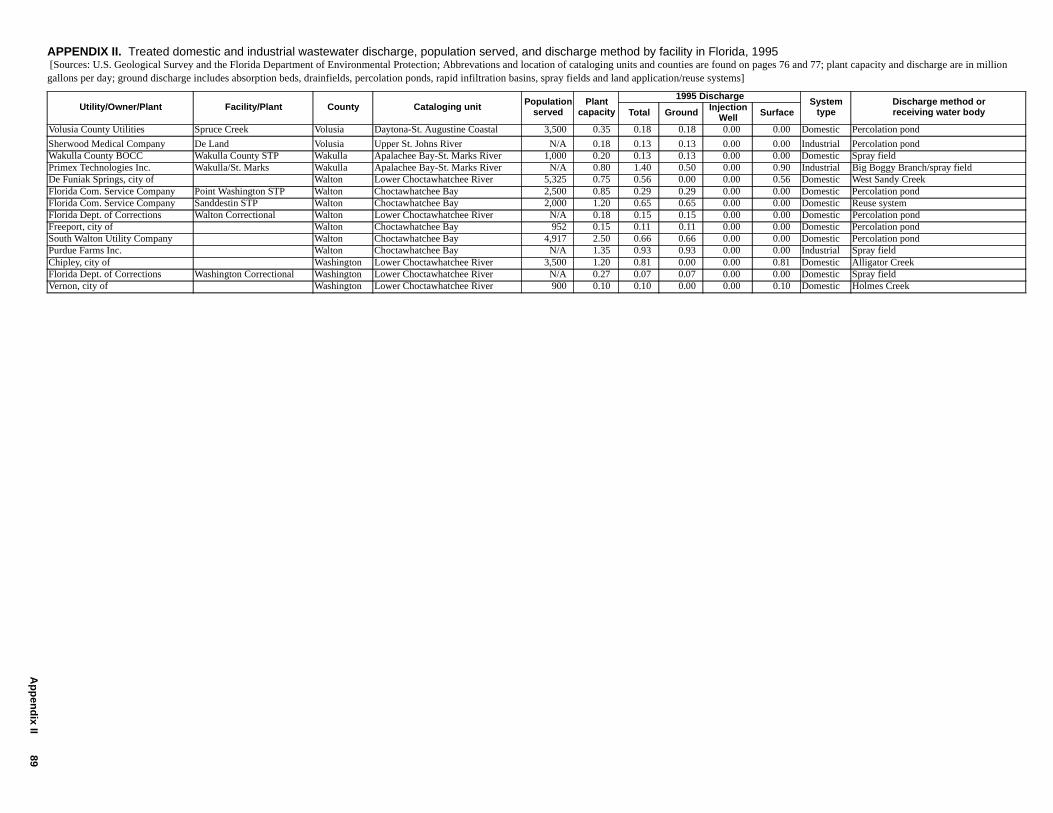
Ap
pen
dix II
89
Volusia County Utilities Spruce Creek Volusia Daytona-St. Augustine Coastal 3,500 0.35 0.18 0.18 0.00 0.00 Domestic Percolation pond
Sherwood Medical Company De Land Volusia Upper St. Johns River N/A 0.18 0.13 0.13 0.00 0.00 Industrial Percolation pondWakulla County BOCC Wakulla County STP Wakulla Apalachee Bay-St. Marks River 1,000 0.20 0.13 0.13 0.00 0.00 Domestic Spray fieldPrimex Technologies Inc. Wakulla/St. Marks Wakulla Apalachee Bay-St. Marks River N/A 0.80 1.40 0.50 0.00 0.90 Industrial Big Boggy Branch/spray fieldDe Funiak Springs, city of Walton Lower Choctawhatchee River 5,325 0.75 0.56 0.00 0.00 0.56 Domestic West Sandy CreekFlorida Com. Service Company Point Washington STP Walton Choctawhatchee Bay 2,500 0.85 0.29 0.29 0.00 0.00 Domestic Percolation pondFlorida Com. Service Company Sanddestin STP Walton Choctawhatchee Bay 2,000 1.20 0.65 0.65 0.00 0.00 Domestic Reuse systemFlorida Dept. of Corrections Walton Correctional Walton Lower Choctawhatchee River N/A 0.18 0.15 0.15 0.00 0.00 Domestic Percolation pondFreeport, city of Walton Choctawhatchee Bay 952 0.15 0.11 0.11 0.00 0.00 Domestic Percolation pondSouth Walton Utility Company Walton Choctawhatchee Bay 4,917 2.50 0.66 0.66 0.00 0.00 Domestic Percolation pondPurdue Farms Inc. Walton Choctawhatchee Bay N/A 1.35 0.93 0.93 0.00 0.00 Industrial Spray fieldChipley, city of Washington Lower Choctawhatchee River 3,500 1.20 0.81 0.00 0.00 0.81 Domestic Alligator CreekFlorida Dept. of Corrections Washington Correctional Washington Lower Choctawhatchee River N/A 0.27 0.07 0.07 0.00 0.00 Domestic Spray fieldVernon, city of Washington Lower Choctawhatchee River 900 0.10 0.10 0.00 0.00 0.10 Domestic Holmes Creek
APPENDIX II. Treated domestic and industrial wastewater discharge, population served, and discharge method by facility in Florida, 1995 [Sources: U.S. Geological Survey and the Florida Department of Environmental Protection; Abbrevations and location of cataloging units and counties are found on pages 76 and 77; plant capacity and discharge are in million gallons per day; ground discharge includes absorption beds, drainfields, percolation ponds, rapid infiltration basins, spray fields and land application/reuse systems]
Utility/Owner/Plant Facility/Plant County Cataloging unit Population served
Plant capacity
1995 DischargeSystem
typeDischarge method or receiving water bodyTotal Ground Injection
Well Surface
90 Water Withdrawals, Use, Discharge, and Trends in Florida, 1995
DeLorme Publishing Company, 1986, Florida Atlas and Gazetteer: Freeport, Maine, 127 p.
Florida Chamber of Commerce, 1995, Directory of Florida industries 1995 (58th ed.): Tallahassee, Florida Cham-ber of Commerce Business Center, 936 p.
Florida Department of Environmental Protection, 1996, Out-fall detail report (GMS05), March 26, 1996: Tallahas-see, Florida Department of Environmental Protection, Bureau of Water Facilities, 53 p.
———1996, Facilities with design capacity report (GMS78), April 5, 1996: Tallahassee, Florida Depart-ment of Environmental Protection, Bureau of Water Facilities, 338 p.
———1996, Test site history report for industrial (GMS36), May 23, 1996: Tallahassee, Florida Department of Environmental Protection, Bureau of Water Facilities, 549 p.
———1996, Domestic plant flows report (GMS35), Sep-tember 13, 1996: Tallahassee, Florida Department of Environmental Protection, Bureau of Water Facilities, 781 p.
———1997, 1996 Reuse inventory: Tallahassee, Bureau of Water Facilities, 81 p.
Marella, R.L., 1994, Estimated discharge of treated waste-water in Florida, 1990: U.S. Geological Survey Open-File Report 93-364, 53 p.
Marella, R.L., and Fanning, J.L., 1996, National Water Qual-ity Assessment of the Georgia-Florida Coastal Plain study unit--Water withdrawals and treated wastewater discharges, 1990: U.S. Geological Survey Water-Resources Investigations Report 95-4084, 76 p.
Northwest Florida Water Management District, 1996, 1995 Annual reuse report: Havana, Northwest Florida Water Management District, 29 p.
Pinellas County Planning Department, 1996, Evaluation and appraisal report of the Pinellas County Comprehensive Plan: Volume VIII, Water supply and sanitary sewer: Clearwater, Pinellas County Planning Department, July 23, 1996, 102 p.
Purdum, E.D., 1994, Florida County Atlas and Municipal Fact Book: Tallahassee, Florida State University, Insti-tute of Science and Public Affairs, 146 p.
St. Johns River Water Management District, 1996, 1995 Annual reuse report: Palatka, St. Johns River Water Management District, 29 p.
Seaber, P.R., Kapinos, F.P., and Knapp, G.L., 1984, State hydrologic unit maps: U.S. Geological Survey Open-File Report 84-708, 63 p.
South Florida Water Management District, 1996, 1995 Annual reuse report: West Palm Beach, South Florida Water Management District, Planning Department, 35 p.
Southwest Florida Water Management District, 1996, 1995 Annual reuse report: Brooksville, Resource Projects Department, Conservation Projects Section, 31 p.
Suwannee River Water Management District, 1996, 1995 Annual reuse report: Live Oak, Suwannee River Water Management District, 16 p.
U.S. Geological Survey, 1975, State of Florida, Hydrologic unit map-1974: U.S. Geological Survey, 1 sheet, scale 1:500,000.
University of Florida, 1996, Florida estimates of population, 1995: Gainesville, University of Florida, College of Business Administration, Bureau of Economic and Business Research, 60 p.
SELECTED REFERENCES FOR APPENDIX II