waterford retail strategy · pdf filewaterford retail strategy update ants 2 1.1 introduction...
TRANSCRIPT


Waterford Retail Strategy Update
ants 2
1.1 INTRODUCTION 1.1.1 The purpose of this addendum report is to review and take into consideration the key changes to the planning
policy framework guiding the development of the City since the Waterford City Retail Strategy 2011 was adopted as part of the Waterford City Development Plan 2013 - 2019. Consideration is provided as how these changes will guide the development of Waterford City and influence the future expansion of retail services in the City. The report has been prepared by John Spain Associates in conjunction with Waterford City and County Council.
1.1.2 A significant change is the designation of North Quays as a Strategic Development Zone (SDZ) and the emerging proposals for the SDZ area. This addendum report will in particular focus on the potential of the North Quays (NQ) in the context of the retail needs of the City and wider region.
1.2 PLANNING POLICY CONTEXT Regional Planning Guidelines for the South East Region 2010-2020 1.2.1 The Regional Planning Guidelines for the South East Region 2010-2020 identified Waterford NQ as a critical
enabling investment priority through significant expansion of the commercial, cultural and civic centre of Waterford City through investment in, and support for, the redevelopment of the NQ.
Waterford Planning and Land Use and Transportation Study 2004 1.2.2 The Waterford Planning and Land Use and Transportation Study 2004 recognised the potential of the North
Quays as an extension of the City Centre and prioritised a new city centre pedestrian bridge and a new public transport interchange at the location.
1.2.3 The PLUTS proposes that the future, balanced development of Waterford should aim to harness the Suir
Riverfront potential strategically positioned in the core city centre area to create a new focus for the City and to bring the North Quays and the Northern Suburbs fully into the social and economic ambit of the City. The proposed SDZ reflects the long term strategic aims of the PLUTS which saw population and employment growth focused in locations served by public transport.
Waterford City Development Plan 2013 - 2019 1.2.4 Successive City Development Plans have placed emphasis on the potential of the NQ through written
objectives and statements and the most recent Waterford City Development Plan 2013-2019 emphasises the strategic importance of the site through its zoning as a strategic ‘Opportunity Site’ with mixed uses allowed. The vision of the NQ area as contained in the Framework Plan is:
“To create a sustainable, modern, and innovative new city centre quarter acting as a gateway to the city with the opportunity to connect the city centre and Ferrybank, where a rich quality of life and unique sense of place can be experienced by residents, workers and visitors alike”.

Waterford Retail Strategy Update
ants 3
Figure 1: Waterford City Development Plan 2013 – 2019 Zoning Map Extract 1.2.5 It is a policy objective of the City Development Plan to realise the potential of the City Centre as a national and
regional attraction, which is vibrant and lived in, has a strong retail and cultural offering and a high quality public realm.
North Quays Strategic Development Zone (SDZ) 1.2.6 On the 19th of January 2016 the Government designated the North Quays as a Strategic Development Zone
for the purposes of delivering a mixed use development which may include commercial activities including, office, hotel, leisure and retail facilities, residential development and the provision of educational facilities, supporting transport infrastructure, emergency services and the provision of community facilities.
1.2.7 The North Quays is a significant and prominent land holding in close proximity to the commercial centre of Waterford City and it is considered that the SDZ is a key landbank in the city that has the potential to create long term sustainable employment, improved accessibility and facilitate the redevelopment of Waterford City.

Waterford Retail Strategy Update
ants 4
Figure 2: North Quays Strategic Development Zone
1.2.8 The North Quays consist of a brownfield opportunity site. In terms of accessibility and connectivity the Quays are strategically placed to capitalise on the excellent roads network (the M9 and N25 corridors) and the train station. The physical barrier presented by the River Suir is acknowledged, however, there are objectives to connect the North and South Quays with a pedestrian bridge complimented with a trolley bus or similar means of sustainable transportation. This will ensure that the traditional retail core has strong linkages to the city centre.

Waterford Retail Strategy Update
ants 5
2.0 QUANTITATIVE ASSESSMENT UPDATE 2.1 INTRODUCTION 2.1.1 This section provides an updated assessment of the likely capacity in quantitative terms for additional retail
floorspace in Waterford City. We cover the period from 2011-2016 and 2016 to 2022. In respect of looking beyond 2016, this enables a longer term look at retail planning and potential in the catchment area which is consistent with the Regional Planning Guidelines. The base year for the purposes of the study is 2016.
2.1.2 It should be noted that a quantitative assessment of this nature can only act as a broad brush indicator of the
likely quantum of floorspace that may be required in an area over a given period. It involves making forecasts for future population expenditure, turnover and other factors and as such the study is based on a number of assumptions and therefore can only provide a broad indication of anticipated capacity. Nonetheless, the quantitative section can give a useful overview of the position.
2.1.3 Furthermore, it should be noted that the figures set out in this section are not intended to be prescriptive
thresholds. Rather they are the minimum floorspace targets that need to be achieved in order to ensure that the retail function of Waterford City continues to be reinforced and strengthened.
2.1.4 It should be noted that all expenditure and turnover figures within this assessment are rounded off to the
nearest euro. The base year throughout is 2016 and the design year is 2022.
The Approach 2.1.5 The approach taken is a step by step capacity assessment including the following steps:
▪ Estimate the population at base and design year. ▪ Estimate of expenditure per capita on convenience, comparison and bulky household goods at the base
year and the design year. ▪ Incorporate projections on inflows and outflows of expenditure to the catchment area based on the results
of the shopper’s and household surveys undertaken by Demographics Ireland. ▪ Estimate of total available expenditure in the base year and design year for residents within the Waterford
City catchment. ▪ Estimate the likely increase in expenditure available for provision of additional floorspace, ▪ Estimate the likely average turnover of new floorspace in convenience and comparison goods. ▪ Estimate the capacity for additional floorspace in Waterford City.
2.2 DEFINITION OF STUDY AREA 2.2.1 The study areas identified for the purposes of this assessment are consistent with those identified in Chapter
4 of the Retail Strategy 2011 namely:
▪ Waterford City Council Area.
▪ 0 to 30 minute isochrone from the City Centre excluding the City Council area.
▪ 30-45 minute isochrone from the city centre, excluding the city council area.
▪ 45-60 minute isochrone from the city centre, excluding the city council area. 2.2.2 The study area for the purposes of this assessment is identified in Figure 3 overleaf prepared by
Demographics Ireland.

Waterford Retail Strategy Update
ants 6
Figure 3 – Identified Study Areas 2.3 POPULATION OF STUDY AREA 2.3.1 The 2011 Census of population identifies a population of 46,732 for Waterford City. Preliminary census 2016
figures outline that the population of the City has grown to 48,369 in 2016, an increase of 1,637 persons (3.5 %) in the 5 year intercensal period. A drivetime was commissioned from Demographics Ireland as part of the Household Survey undertaken to inform the Retail Strategy in 2011.
2.3.2 Table 2.1 below shows the population of the administrative boundary of Waterford City, a 0-30 drivetime
isochrone from the City excluding the former Waterford City administrative area, a 0-45 drivetime isochrone and a 45-60 minute isochrone of the City Centre in 2010, 2016 and 2022. The population figures for 2016 are based on the 2016 census results. The figures for the base year of 2016 are calculated based on a review of the preliminary results of the 2016 Census.
2.3.3 The Settlement Strategy included within the Regional Planning Guidelines sets out the target population for
the region and for each of the main settlements in the region. It is envisaged that by 2022, the population of the City will be 55,000. Between 2011 and 2016 the population growth rate for the city was 0.7% per annum. Applying, this growth rate of 0.7% for the city between 2016 and 2022 would result in a population of 50,444 persons which is consistent with the RPG population targets and is used for the purposes of this assessment.
2.3.4 The population growth rates assumed for the areas outside of the former administrative boundary of the City
are based on those set out within the Regional Planning Guidelines for the South East Region. An average population growth rate of 1% per annum between 2010 and 2016 was previously estimated in 2011, however based on 2016 preliminary CSO population data there was an average population growth rate of 0.6% per annum for the identified drivetime isochrone areas between 2011 and 2016. The Regional Planning Guidelines for the South East Region estimate an average of growth rates for Co. Waterford, Co. Kilkenny and Co. Wexford of 1.5% per annum between 2016 and 2022. An average growth rate of 1.5% per annum
Former Waterford City boundary

Waterford Retail Strategy Update
ants 7
between 2016 and 2022 is applied having regard to the Regional Planning Guidelines estimated average growth rates.
Table 2.1: Population Projections
Year Waterford
City
0-30 minute Isochrone (Excl Waterford City)
30-45 minute isochrone
45-60 minute isochrone
Total
2006 (Actual) 45,748 40,408 57,921 115,520 259,597
2011 (Actual) 46,732 44,536 62,255 124,705 278,404
2016 (Preliminary) 48,369 45,399 63,616 128,551 285,935
2022 (Estimate) 50,444 49,641 69,560 140,563 310,209
Source: CSO, Demographics Ireland & Regional Planning Guidelines for the South East Region 2010-2022 2.4 EXPENDITURE PER CAPITA 2.4.1 The Retail Planning Guidelines Study examines three principal sources of data on retail planning expenditure
in Ireland. These are the Annual Services Inquiry, the National Income and Expenditure Accounts and the Household Budget Survey. The survey concludes that the most reliable data source for established baseline expenditure is the Annual Services Inquiry. This is consistent with the source used within the 2003 Waterford City Study and the Waterford City Retail Strategy 2012.
2.4.2 Expenditure per capita is calculated based on the information contained within the Annual Services Inquiry
(ASI) published by the Central Statistics Office. The 2010 ASI was published in 2012. The ASI is listed as the preferred source for expenditure per capita listed in the 1999 Roger Tym and Partners and Jonathan Blackwell and Associates report on the Retail Planning Guidelines and is consistent with the source used within 2003 Waterford City Study and Waterford City Retail Strategy 2012. This source is therefore used for the purposes of this capacity assessment.
2.4.3 The CSO have provided information on the most appropriate categories to consider when making estimates
on expenditure per capita. The relevant categories include:
1. Retail sale in non-specialised stores (471) 2. Retail sale of food, beverages and tobacco in specialised stores (472) 3. Retail sale of information and communication equipment in specialised stores (474) 4. Retail sale of other household equipment in specialised stores (475) 5. Retail sale of cultural and recreation goods in specialised stores (476) 6. Retail sale of other goods in specialised stores (477) 7. Retail sale via stalls and markets (478)
2.4.4 In accordance with the guidance set out within the Roger Tym and Partners / Jonathan Blackwell & Associates
background study on the Retail Planning Guidelines, Categories 1 and 2 are classified as convenience goods expenditure. Categories 3-7 are classified as comparison expenditure for the purposes of this study. However, there is the exception of department stores which are classified under Item 1. The CSO have provided further information on the breakdown of the retail sale in non – specialised stores category and from this breakdown it is apparent that sales in department stores account for approximately 7.3% of the amalgam of convenience and department store category in 2010. The turnover attributed to expenditure in department stores is classified as comparison expenditure for the purposes of this study.
2.5 EXPENDITURE ESTIMATES 2.5.1 Based on the 2010 Annual Service Inquiry we have estimated that the total expenditure per capita in 2010
on convenience goods was €3,779 and €3,550 on comparison goods. 2.5.2 These expenditure figures are adjusted to a 2016 price year in line with the Consumer Price Index to €3,925
on convenience goods and €3,733 on comparison goods. 2.5.3 These figures illustrate convenience and comparison expenditure per capita prices in 2010 adjusted to a 2016
price year. Very marginal growth in convenience and comparison expenditure per capita has been applied

Waterford Retail Strategy Update
ants 8
between 2010 and 2013 having regard to the economic downturn. This approach is in accordance with the results of the Retail Sales Index which illustrates a very marginal increase in comparison expenditure between 2010 and 2013 and a significant increase in retail expenditure and in comparison expenditure in particular comparison expenditure from 2014 to 2016.
2.5.4 A significant increase in comparison goods expenditure per capita from 2014 to 2016 is recorded by the Retail
Sales Index. In contrast to the position when the 2011 retail strategy was undertaken, the Retail Sales Index shows that “high street” comparison goods, such as clothing and footwear have increased above 2010 levels and there has been a significant increase of 23.4% on the overall comparison expenditure per capita between 2010 and 2016 when adjusted for population increase nationally between 2010 and 2016. Having reviewed the figures for comparison goods expenditure as set out in 2010 and 2016 Retail Sales Index, it is considered that an increase of 3.5% per annum in expenditure per capita from 2010-2016 reflects recorded CSO data. The updated figures for 2016 are €4,321 on convenience goods (reflecting 10.01% growth since 2010) and €4,606 on comparison goods (reflecting 23.4% growth since 2010).
Convenience Expenditure Forecast 2.5.5 For convenience goods we have applied 1% growth per annum between 2010 and 2013, a 2% growth rate
between 2014 and 2016 and 1% growth rate between 2016 and 2022. This is based on the assessment of growth rates set out in the Retail Sales Index (CSO) for 2010 to 2016 and adjusted to allow for population increases and having regard to the national economic outlook.
Comparison Expenditure Forecast
2.5.6 Expenditure growth on comparison goods has been substantially higher than expenditure growth on convenience goods over time. This is because most household’s requirements in respect of convenience products have been largely satisfied and most additional expenditure has gone into products such as clothing, footwear, household goods, electrical goods, carpets, furniture and so on. Exceptionally high levels of growth in comparison goods sales were experienced in the late 1990’s up to 2007.
2.5.7 However, as a result of the economic downturn, expenditure per capita declined in the period 2008 to 2010, with very marginal growth of approximately 1% per annum between 2010 and 2013. From 2014 – 2015 expenditure per capita increased for comparison goods by 7.5% per annum. The growth rate has reduced recently and the recent RSI for December 2016 shows a growth rate of 3.3% for non-food goods in 2016. Overall, for comparison expenditure per capita for the period 2010 – 2016 increased on average by 3.5% per annum. This captures a period of recession, followed by a strong recovery. We have therefore used a conservative long term average for projecting forward of 3.5% per annum approximately between 2016 and 2022. This is close to the average increase in expenditure per capita on comparison goods nationally over the period 2010 – 2016, which encompasses both recession and recovery. This is illustrated in Table 2.2.
Table 2.2: Expenditure per capita
Convenience Comparison
2016 €4,321 €4,606
2022 €4,587 €5,662
Assumption: Convenience Goods Expenditure 1% growth rate annum from 2016 to 2022; Comparison Goods Expenditure 3.5% growth rate per annum from 2016 to 2022.
2.6 TOTAL AVAILABLE EXPENDITURE 2.6.1 The total available expenditure is set out in Tables 2.3 and 2.4 below. This is calculated by multiplying the
population by the expenditure per capita for each category for each year. For the convenience capacity assessment we have used a 0-30 minute isochrone catchment having regard to the results of the household and shopper’s survey set out in Chapter 4 of the 2011 strategy. As very little new floorspace has been provided in Waterford City or is catchment area since 2011, we have assumed that the survey results remain valid. The survey results illustrated an inflow of 8% of convenience expenditure from the 30-45 minute drivetime isochrone for convenience goods, with no inflow from the 45-60 minute drivetime isochrone for convenience goods. In 2016, we estimate the total available for convenience expenditure is €209m within the City Centre and €196m within the 0-30 minute drive time isochrone of the City Centre (excluding the City area). The total available expenditure for convenience goods is identified within Table 2.3 at €680 million in

Waterford Retail Strategy Update
ants 9
2016 and €778 million in 2022.
Table 2.3: Total Available Convenience Expenditure
Year Waterford City 0-30 minute
Isochrone (Excl Waterford City)
30-45 minute Isochrone
Total
2016 €209,002,449 €196,169,079 €274,884,736 €680,056,264
2022 €231,377,980 €227,694,757 €319,059,795 €778,132,533
Source: Tables 2.1 and 2.2 2.6.2 Table 2.5 below sets out the total available comparison expenditure within Waterford City, a 0-30 minute
isochrone excluding the City and 30-45 minute isochrone. These isochrones are included having regard to the results of the household survey which illustrates an inflow of 90% from the 0-30 minute drivetime isochrones, 52% from the 30-45 minute isochrones and 8% from the 45-60 minute isochrone. In 2016 it is estimated the total available for comparison expenditure is €222m within the City Centre and €209m within the 0-30 minute drive time isochrone of the City Centre (excluding the City area).
Table 2.4: Total Available Comparison Expenditure (including Bulky Household Goods)
Waterford City
0-30 minute Isochrone excl Waterford City
30-45 minute Isochrone
45-60 minute Isochrone
Total
2016 €222,787,614 €209,107,794 €293,015,296 €592,105,906 €1,317,016,610
2022 €285,611,407 €281,064,862 €393,845,244 €795,860,683 €1,756,382,196
Source: Tables 2.1 and 2.2 2.6.3 Table 2.4 sets out the total available comparison expenditure available within the administrative boundary of
Waterford City Council and a 0-30 and 30 to 45 minute isochrone from the City. In considering the above expenditure levels it is important to note that significantly different levels of turnover will apply to town centre comparison goods such as clothing and footwear and smaller household durables than would apply to bulky household goods sold in retail warehouses. Retail warehouses have a distinct function and are generally located outside of the City Centre. It is necessary to establish the expenditure potentially available to City Centre comparison floorspace. In this regard it is considered important to split between expenditure available for bulky warehouse goods and comparison goods within the catchment area. Having regard to the Household Budget Survey and experience elsewhere in this respect, it is estimated that approximately 20% of comparison expenditure will be accounted for by bulky household goods in retail warehouse type premises.
2.6.4 Estimates for expenditure on bulky warehouse goods and pure comparison floorspace are set out in Tables
2.5 and 2.6 below.
Table 2.5: Total Available Expenditure on Comparison Floorspace (excluding bulky household goods)
Waterford City
0-30 minute Isochrone excl Waterford City
30-45 Minute Isochrone
45-60 minute Isochrone
Total
2016 €178,230,091 €167,286,235 €234,412,237 €473,684,725 €1,053,613,288
2022 €228,489,126 €224,851,889 €315,076,195 €636,688,546 €1,405,105,757
Source: Table 2.5 above, Assumption 80% of total set out in Table 2.4

Waterford Retail Strategy Update
ants 10
Table 2.6 Total Available Bulky Household Goods Expenditure
Waterford City
0-30 minute Isochrone excl Waterford City
30-45 Minute Isochrone
45-60 minute Isochrone
Total
2016 €44,557,523 €41,821,559 €58,603,059 €118,421,181 €263,403,322
2022 €57,122,281 €56,212,972 €78,769,049 €159,172,137 €351,276,439
Source: Table 2.6 above, Assumption 20% of total set out in Table 2.5 2.7 ADJUSTMENTS TO AVAILABLE EXPENDITURE 2.7.1 Some adjustments are also required to the capacity figures outlined in Tables 2.3, 2.5 and 2.6 above to take
into account the levels of trade draw and leakage of expenditure from the catchment area. Assumptions on both market share and trade draw are informed by the household and shoppers surveys undertaken by Demographics Ireland, the results of which are summarised in Chapter 4 of the Retail Strategy.
Convenience:
2.7.2 The survey establishes that approximately 95% of convenience goods expenditure in Waterford City is
retained by the City, and the City attracts approximately 58% of convenience goods expenditure from the 0-30 minute isochrone from the City. The household survey also identifies an inflow of 8% of expenditure on convenience goods from the 30-45 minute isochrone. It is envisaged that this level expenditure inflows and retention will continue throughout the lifetime of the retail strategy.
Sources: Tables 2.3, 2.5 and 2.6
Comparison: 2.7.3 The household survey establishes that approximately 92% of comparison goods expenditure in Waterford
City is retained by the City Centre area and attracts a further 90% of comparison expenditure from the 0-30 minute drivetime isochrone and 52% from the 30-45 minute isochrone. The survey identifies an inflow of 8% of comparison expenditure from the 45-60 minute drivetime. Two scenarios are assumed in estimating the amount of expenditure available within the study area for the purposes of this assessment. Scenario 1, the low growth scenario assumes that the retention and inflow of expenditure to Waterford City Centre will remain at current levels over the lifetime of the retail strategy.
2.7.4 Scenario 2 estimates that the level of trade draw from the 0-30, 30-45 and 45-60 minute isochrones and
retention of comparison expenditure within the City area will increase within the timeframe of the Retail Strategy in line with improvements to the retail offer and trade draw of the City Centre. For the purposes of this assessment it is assumed that by 2016 the City Centre area will retain 94% of comparison goods expenditure within the City and this is envisaged to grow to 96% by 2022. Trade draw from the 0-30 minute drivetime isochrone is envisaged to grow to 94% by 2016 and 96% by 2022. Inflows from the 30-45 drivetime isochrone are estimated to grow to 55% by 2016 and 60% by 2022. Inflows from the 45-60 minute drivetime isochrone are anticipated to remain at 8%. Based on these projections the total available comparison expenditure for both Scenario 1 and 2 are set out in 2.8 below.
Table 2.7: Total Available Convenience Expenditure to Waterford City
Waterford City 0-30 minute Isochrone
excl Waterford City 30-45 minute isochrone
Total Available Expenditure
2016 €198,552,327 €113,778,066 €21,990,779 €334,321,171
2022 €219,809,081 €132,062,959 €25,524,784 €377,396,824
Waterford Retail Strategy Update
ants 11
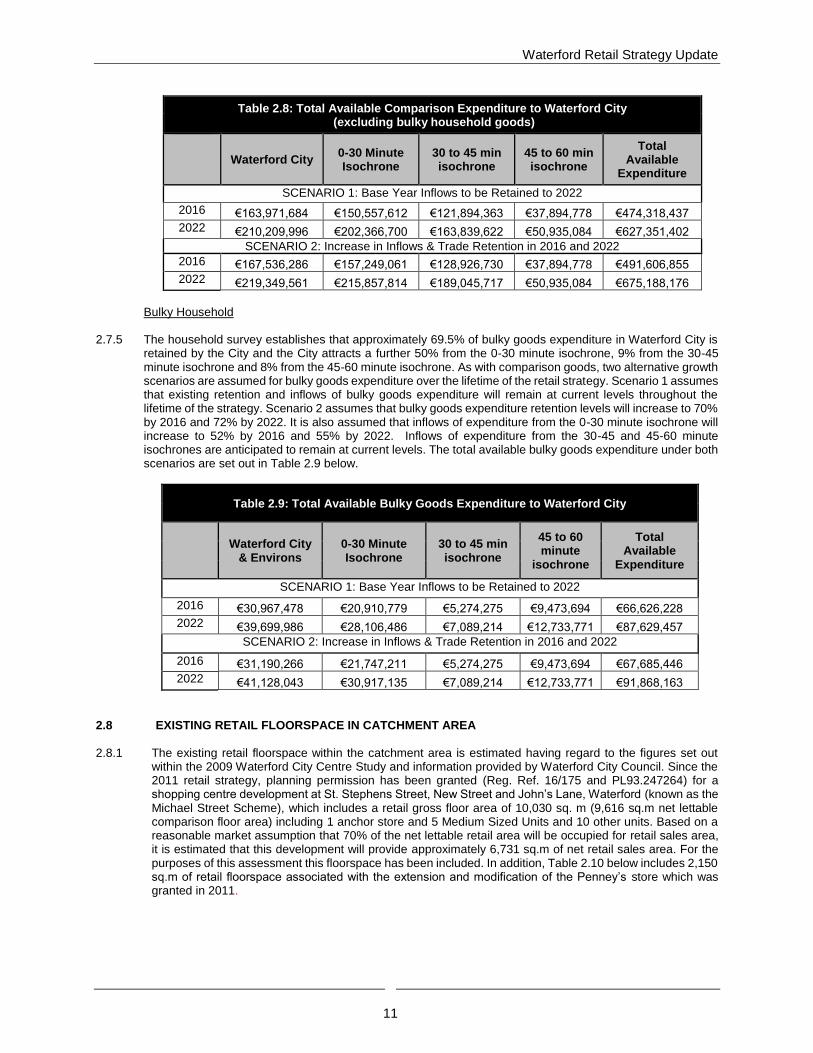
Table 2.8: Total Available Comparison Expenditure to Waterford City (excluding bulky household goods)
Waterford City 0-30 Minute Isochrone
30 to 45 min isochrone
45 to 60 min isochrone
Total Available
Expenditure
SCENARIO 1: Base Year Inflows to be Retained to 2022
2016 €163,971,684 €150,557,612 €121,894,363 €37,894,778 €474,318,437
2022 €210,209,996 €202,366,700 €163,839,622 €50,935,084 €627,351,402
SCENARIO 2: Increase in Inflows & Trade Retention in 2016 and 2022
2016 €167,536,286 €157,249,061 €128,926,730 €37,894,778 €491,606,855
2022 €219,349,561 €215,857,814 €189,045,717 €50,935,084 €675,188,176
Bulky Household
2.7.5 The household survey establishes that approximately 69.5% of bulky goods expenditure in Waterford City is
retained by the City and the City attracts a further 50% from the 0-30 minute isochrone, 9% from the 30-45 minute isochrone and 8% from the 45-60 minute isochrone. As with comparison goods, two alternative growth scenarios are assumed for bulky goods expenditure over the lifetime of the retail strategy. Scenario 1 assumes that existing retention and inflows of bulky goods expenditure will remain at current levels throughout the lifetime of the strategy. Scenario 2 assumes that bulky goods expenditure retention levels will increase to 70% by 2016 and 72% by 2022. It is also assumed that inflows of expenditure from the 0-30 minute isochrone will increase to 52% by 2016 and 55% by 2022. Inflows of expenditure from the 30-45 and 45-60 minute isochrones are anticipated to remain at current levels. The total available bulky goods expenditure under both scenarios are set out in Table 2.9 below.
Table 2.9: Total Available Bulky Goods Expenditure to Waterford City
Waterford City
& Environs 0-30 Minute Isochrone
30 to 45 min isochrone
45 to 60 minute
isochrone
Total Available
Expenditure
SCENARIO 1: Base Year Inflows to be Retained to 2022
2016 €30,967,478 €20,910,779 €5,274,275 €9,473,694 €66,626,228
2022 €39,699,986 €28,106,486 €7,089,214 €12,733,771 €87,629,457
SCENARIO 2: Increase in Inflows & Trade Retention in 2016 and 2022
2016 €31,190,266 €21,747,211 €5,274,275 €9,473,694 €67,685,446
2022 €41,128,043 €30,917,135 €7,089,214 €12,733,771 €91,868,163
2.8 EXISTING RETAIL FLOORSPACE IN CATCHMENT AREA 2.8.1 The existing retail floorspace within the catchment area is estimated having regard to the figures set out
within the 2009 Waterford City Centre Study and information provided by Waterford City Council. Since the 2011 retail strategy, planning permission has been granted (Reg. Ref. 16/175 and PL93.247264) for a shopping centre development at St. Stephens Street, New Street and John’s Lane, Waterford (known as the Michael Street Scheme), which includes a retail gross floor area of 10,030 sq. m (9,616 sq.m net lettable comparison floor area) including 1 anchor store and 5 Medium Sized Units and 10 other units. Based on a reasonable market assumption that 70% of the net lettable retail area will be occupied for retail sales area, it is estimated that this development will provide approximately 6,731 sq.m of net retail sales area. For the purposes of this assessment this floorspace has been included. In addition, Table 2.10 below includes 2,150 sq.m of retail floorspace associated with the extension and modification of the Penney’s store which was granted in 2011.

Waterford Retail Strategy Update
ants 12
Table 2.10: Existing and Permitted Retail Floorspace within Waterford City Centre
Convenience Comparison Bulky Total
sq.m. net sales
sq.m. net sales
sq.m. net sales
sq.m. net sales
Existing Floorspace breakdown Waterford City (2012 study)
31,675 39,252 41,444 112,371
Additional Floorspace (Penneys)
2,150
Total Existing Floorspace (2016)
31,675 41,402 41,444 121,252
Potential Additional Floorspace (Reg. Ref. 16/175)
6,731
Total Existing & Permitted Floorspace (2022)
31,675 48,133 41,444 121,252
Source: 2009 Waterford City Centre Study & Waterford City and County Council
2.9 TURNOVER OF EXISTING FLOORSPACE 2.9.1 It is possible to derive the turnover of existing floorspace within the catchment area by multiplying the
floorspace in each category by average turnover. A turnover of €9,225 per sq. m. is assumed for existing convenience floorspace within the catchment area in 2016 and €6,150 per sq. m. for comparison floorspace. An average turnover of €2,050 per sq. m. is assumed for bulky goods in 2016 prices. The figures are based on published retail industry data and have regard to the average turnover per sq.m. calculations established in the Retail Planning Guidelines Study 1999 (Tym and Blackwell). They reflect the average turnover levels retailers will require to sustain a healthy level of activity.
Table 2.11 Turnover per sq.m. of Existing Retail Floorspace
2016
Convenience €9,225
Comparison €6,150
Bulky €2,050
2.9.2 These figures show the average turnover per sq. metre of existing floor space overall in Waterford City. They
disguise significant differences in turnover for different shops. In general, multiple branches of national and international multiple shops are located within purpose built shopping centres or other prime locations. Prime town centre shop units will have substantially higher turnover per square metre than shops which are less well located or situated in older inefficient premises and are operated as independents. In particular, it is likely that smaller units have substantially lower turnover per sq. metre than these averages whilst the largest supermarket operators have substantially higher turnover rates per sq. metre.
2.9.3 The turnover of existing retail floorspace within the City in 2016 and 2022 is obtained by multiplying the
existing floorspace estimates set out in Table 2.11 by the turnover per sq. m. estimates set out in Table 2.11. This is illustrated in Table 2.12 below.
Table 2.12: Turnover of Existing Retail Floorspace
2016 2022
Convenience €292,201,875 €292,201,875
Comparison €254,622,300 €296,017,950
Bulky €84,960,200 €84,960,200
Source: Tables 2.10 and 2.11

Waterford Retail Strategy Update
ants 13
2.9.4 The residual surplus for additional retail floorspace within the City is obtained by subtracting the turnover of existing convenience, comparison and bulky goods expenditure as set out in Table 2.12 by the total available expenditure set out in tables 2.7, 2.8 and 2.9. Tables 2.13 a and b below set out the available expenditure under Scenario 1 and 2.
Table 2.13a: Scenario 1 Available Expenditure for Additional Retail Floorspace in Waterford City
Year Available
Expenditure Turnover of Existing
Floorspace Residual Surplus
Convenience
2016 €334,321,171 €292,201,875 €42,119,296
2022 €377,396,824 €292,201,875 €85,194,949
Comparison
2016 €474,318,437 €254,622,300 €219,696,137
2022 €627,351,402 €296,017,950 €331,333,452
Bulky
2016 €66,626,228 €84,960,200 -€18,333,972
2022 €87,629,457 €84,960,200 €2,669,257
Source: Tables 2.12, 2.6, 2.8 & 2
Table 2.13b: Available Expenditure for Additional Retail Floorspace in Waterford City Scenario 2
Year Available
Expenditure Turnover of Existing
Floorspace Residual Surplus
Convenience
2016 €334,321,171 €292,201,875 €42,119,296
2022 €377,396,824 €292,201,875 €85,194,949
Comparison
2016 €491,606,855 €254,622,300 €236,984,555
2022 €675,188,176 €296,017,950 €379,170,226
Bulky
2016 €67,685,446 €84,960,200 -€17,274,754
2022 €91,868,163 €84,960,200 €6,907,963
Source: Tables 2.12, 2.6, 2.8 & 2.9
2.10 FLOORSPACE CAPACITY 2.10.1 In order to calculate the requirements for additional retail floorspace within the catchment area the turnover
per sq. m. of future retail floorspace should be divided by the available expenditure figures set out in Table 2.13. For the purposes of this assessment a turnover per sq. m. of €12,300 is assumed for future convenience floorspace, €7,175 for comparison retail floorspace and €2,562 for bulky goods floorspace in 2016 prices. The figures for expenditure have been adjusted to grow at a rate of 2.5% per annum from 2016 to 2022 to allow for efficiency gains by retailers as illustrated in Table 2.14 below.

Waterford Retail Strategy Update
ants 14
Table 2.14 Turnover of Future Retail Floorspace 2011, 2016 and 2022
2016 2022
Convenience €12,300 €13,057
Comparison €7,175 €7,616
Bulky €2,562 €2,720
Assumption: 2.5% growth per annum 2.10.2 The future floorspace requirements for additional convenience, comparison and bulky goods floorspace within
the catchment is illustrated in Table 2.15.
Table 2.15 Additional Floorspace Requirements for Waterford City
2016 2022
SCENARIO 1: Base Year Inflows to be Retained to 2022
Convenience sq.m. 3,424 6,525
Comparison sq.m. 30,620 43,503
Bulky Goods sq.m. -7,156 981
SCENARIO 2: Increase in Inflows & Trade Retention in 2016 and 2022
Convenience sq.m. 3,424 6,525
Comparison sq.m. 33,029 49,783
Bulky Goods sq.m. -6,743 2,540
Source: Tables 2.15, 2.14a & 2.14b 2.10.3 It can be seen from Table 2.15 that the capacity for additional convenience floor space within the City area
is 6,525 sq.m. by 2022. Although the potential for additional net convenience floorspace would appear limited at 2016 (3,424 sq. metres), this should be viewed within the context of the extent of convenience floorspace which has been implemented. Notwithstanding the low projected figures, there is likely to be a need for further modest neighbourhood scale convenience development in the short to medium term. Such additional development would be appropriate in the designated neighbourhood centres or zoned commercial lands in existing neighbourhood/district centres. Additional modest scale convenience floorspace (i.e. less than 1,500 sq.m. net) within existing designated centres would be appropriate in order to improve the range of retail offer and improve competition in the market. The requirement for additional comparison floorspace within the City is significant over the period to 2016 and beyond to 2022. Table 2.15 indicates a requirement for an additional 43,503 sq. m. of comparison floorspace under Scenario 1 by 2022 and this increases to 49,783 sq.m. under Scenario 2.
2.10.4 Table 2.15 above illustrates no requirement for additional retail warehouse floorspace within the catchment
up to 2022. This is not surprising having regard to the extent of this format of retail floorspace developed within the Waterford City area.
2.10.5 It should be noted that the floorspace capacity figures outlined in Table 2.15 above should not be considered
as upper limits, merely as indicative of the scale of new floorspace required to meet the needs of existing and future population and expenditure in the City. Additional new floorspace may be proposed and this could replace some existing outdated or poorly located retail floorspace. These figures should be seen as minimum rather than maximums. The key consideration is the location of new floorspace. The quantum only becomes a critical consideration where new convenience and comparison floorspace is proposed outside of the defined retail core of the city and the issue of likely impact on the city centre as a whole arise.
