watershed indicators wsio version 1.3 order … indicators wsio version 1.3 order indicator_name...
TRANSCRIPT

Watershed Indicators WSIO version 1.3
Order Indicator_Name Type Component Description Field_Name
1 Hydrologic Unit Code 12-Digit (HUC12) Base HUC ID Political
Twelve digit Hydrologic Unit Code (HUC12) consistent with the WBD snapshot for
NHD Plus Version 2.1 (see metadata for more information). Region 4 WSIO Version 1,
October 2013. HUC12_TEXT
2 Name HUC12 Watershed Base HUC ID Political
Name of 12-digit Hydrologic Unit Code (HUC12) consistent with the WBD snapshot
for NHD Plus Version 2.1 (see metadata for more information). Region 4 WSIO
Version 1, October 2013. NAME_HUC12
3 EPA Region Base HUC ID Political
Identifies all EPA Regions within a HUC12 boundary. Calculated from State attribute.
Region 4 WSIO Version 1, October 2013 EPA_REGION
4 All States in HUC12 2014 Base HUC ID Political
Identifies all States that a HUC12 boundary crosses. Source data used was WBD
snapshot for NHD Plus Version 2.1 and NLCD2006 data (see metadata for more
information). Developed for the EPA by the EPA Office of Water Recovery Potential
Screening contractor, Cadmus. Region 4 WSIO Version 1, October 2013. STATES2014
5 Single State HUC Flag (if 1 single state) Base HUC ID Political
The percent of total HUC12 area that is comprised by a specific named state. Source
data used was WBD snapshot for NHD Plus Version 2.1 (see metadata for more
information) and 2013 state boundaries dataset from
http://www2.census.gov/geo/tiger/TIGER2013/STATE/. Region 4 WSIO Version 1,
October 2013. INSTATE_14
6 Tribal Lands in HUC12 Flag Base HUC ID Political
Identifies HUC12s that include Tribal land presence. Source data used was WBD
snapshot for NHD Plus Version 2.1 (see metadata for more information) and Tribal
information from
http://epamap5.epa.gov/ArcGIS/rest/services/EMEF/Tribal/MapServer/4, including
all lands associated with Federally-recognized tribal entities— Federally recognized
Reservations, Off-Reservation Trust Lands, and Census Oklahoma Tribal Statistical
Areas. Region 4 WSIO Version 1, October 2013.
TRIBE_FLAG
7 % Tribal Lands in HUC12 Base HUC ID Political
The percent of total HUC12 area constituting Tribal lands. Source data used was
WBD snapshot for NHD Plus Version 2.1 (see metadata for more information) and
Tribal information from
http://epamap5.epa.gov/ArcGIS/rest/services/EMEF/Tribal/MapServer/4, including
all lands associated with Federally-recognized tribal entities— Federally recognized
Reservations, Off-Reservation Trust Lands, and Census Oklahoma Tribal Statistical
Areas. Region 4 WSIO Version 1, October 2013. TRIBE_PCT
8 HUC12 Adjacent to Tribal HUC12s Base HUC ID Political
Identifies HUC12s that do not contain Tribal lands but border HUC12s that do contain
Tribal lands. Source data used was WBD snapshot for NHD Plus Version 2.1 (see
metadata for more information) and Tribal information from
http://epamap5.epa.gov/ArcGIS/rest/services/EMEF/Tribal/MapServer/4, including
all lands associated with Federally-recognized tribal entities— Federally recognized
Reservations, Off-Reservation Trust Lands, and Census Oklahoma Tribal Statistical
Areas. Region 4 WSIO Version 1, October 2013. TRIBE_BUFR
9 % Not In US Base HUC ID Political
The percent of the HUC12 area that is not included in the United States or State.
Region 4 WSIO Version 1, October 2013. LC0_NLCD06_PCT_WS
10 Area Of Watershed (HUC12) In Square Meters (Grid) Base
Hydrologic
EcoRegion
The total area of a HUC12 boundary calculated from 30-meter resolution grids
(square meters). Source data used was a grid of the WBD snapshot for NHD Plus
Version 2.1 (see metadata for more information). Region 4 WSIO Version 1, October
2013. AREA__WS_GRID_SQMETER
Page 1 of 57

Watershed Indicators WSIO version 1.3
Order Indicator_Name Type Component Description Field_Name
11 % Land in Watershed Base
Hydrologic
EcoRegion
The percent of the HUC12 that is land (not identified as surface water by the Water
Mask*). Equation used: (HUC12 area - Water Mask/HUC12 area) x 100. Region 4
WSIO Version 1, October 2013. *The Water Mask (see metadata for more
information) is determined using grid analysis to combine surface water features of
NLCD2006 and NHD Plus version 2. The combination of these two datasets represents
surface water and is referred to as the Water Mask. LAND_PCT_WS
12 % Water in Watershed Base
Hydrologic
EcoRegion
The percent of the HUC12 that is surface water as identified by the Water Mask*.
Equation used: Water Mask/ HUC12 area x 100. Region 4 WSIO Version 1, October
2013. *The Water Mask (see metadata for more information) is determined using
grid analysis to combine surface water features of NLCD2006 and NHD Plus version 2.
The combination of these two datasets represents surface water and is referred to as
the Water Mask. WATER_PCT_WS
13 Watershed NHDPlus2 Streamlength Base
Hydrologic
EcoRegion
The length of NHD stream features in HUC12 (kilometers). Calculated from the
"NHDPlus2 NHD Snapshot" dataset. Includes all NHDFlowline features with FTYPE
(feature type) equal to StreamRiver, CanalDitch, or Connector. NHDFlowline features
with FTYPE equal to ArtificialPath are only included if they pass through a NHDArea
feature with FTYPE equal to StreamRiver. STREAMLGTH_NHD
14 Watershed NHDPlus2 Waterbody Area Base
Hydrologic
EcoRegion
Area of NHD waterbody features in HUC12 (square kilometers). Calculated from the
"NHDPlus2 NHD Snapshot" dataset. WBAREA_NHD
15 % Hydrologically Connected Zone (HCZ) in Watershed Base
Hydrologic
EcoRegion
The percent of the HUC12 that is in the *Hydrologically Connected Zone. *The
Hydrologically Connected Zone (HCZ, see metadata for more information) is
determined using grid analysis to combine surface water features of three datasets.
First, the surface water features from the 2006 National Land Cover Database (NLCD).
Features included are 'Open Water' (code 11), 'Woody Wetlands' (code 90) and
'Emergent Herbaceous Wetlands' (code 95). Source data used was the NLCD2006
version 1 (see metadata for more information). Second, the flowline and waterbody
features as represented in the catseed grid from the National Hydrography Dataset
(NHD) Plus version 2. Source data used was NHD Plus Version 2.1, downloaded
October 31, 2012 (see metadata for more information). The combination of these
two datasets represents surface water and is referred to as the ‘Water Mask’ (see
metadata for more information). Third, all areas contiguous to surface water that
also has a wetness index value of 550 or greater. The wetness index, also known as
the compound topographic index (CTI), is a steady state wetness index. It is
commonly used to quantify topographic control on hydrological processes (see
metadata for more information). The combination of these three datasets represents
the Hydrologically Connected Zone (HCZ).Equation used: (Hydrologically Connected
Zone/ HUC12) x 100. Region 4 WSIO Version 1, October 2013. HCZ_PCT_WS
Page 2 of 57

Watershed Indicators WSIO version 1.3
Order Indicator_Name Type Component Description Field_Name
16 % Riparian Zone (RZ) in Watershed Base
Hydrologic
EcoRegion
The percent of the HUC12 that is in the *Riparian Zone. *The Riparian Zone (RZ, see
metadata for more information) is determined using grid analysis to combine two
surface water indicators and then place an approximate 100 meter buffer around
these features. First, the surface water features from the 2006 National Land Cover
Database (NLCD). Features included are 'Open Water' (code 11), 'Woody Wetlands'
(code 90) and 'Emergent Herbaceous Wetlands' (code 95). Source data used was
NLCD2006 version 1, downloaded February 2011 (see metadata for more
information). Second, the flowline and waterbody features as represented in the
catseed grid from the National Hydrography Dataset (NHD) Plus version 2. Source
data used was NHD Plus Version 2.1, downloaded October 31, 2012 (see metadata
for more information). The combination of these two datasets represents surface
water and is referred to as the ‘Water Mask’ (see metadata for more information).
Last, distance from surface water is calculated using the ArcMap Spatial Analyst
Euclidean Distance tool. All cells with a distance of 108 meters or less are included in
the riparian zone. The combination of these two datasets and all cells with a distance
of 108 meters or less from surface water are included in the Riparian Zone (RZ).
Equation used: (Riparian Zone/ HUC12) x 100. Region 4 WSIO Version 1, October
2013. RIPARIAN_ZONE_PCT_WS
17 EcoRegion (2010) Level 3 Codes [All] Base
Hydrologic
EcoRegion
All Level III Ecoregion codes within a HUC12 boundary. Level III Ecoregion source data
used was downloaded in May 2010 (see metadata for more information). Region 4
WSIO Version 1, October 2013. ECOREGION2010_L3_CODES_ALL
18 EcoRegion (2010) Level 3, 1st Code (Largest Area) Base
Hydrologic
EcoRegion
The Level III Ecoregion code with the greatest area within a HUC12 boundary. Level III
Ecoregion source data used was downloaded in May 2010 (see metadata for more
information). Region 4 WSIO Version 1, October 2013. ECOREGION2010_L3_1STCODE
19 River Basin Name Base
Hydrologic
EcoRegion
Name of 6-digit Hydrologic Unit Code (HUC06) that contains a HUC12 boundary.
Source data used was WBDHU6 Version 2 (June 2013), downloaded from NRCS WBD
February 2014. Region 4 WSIO Version 1, October 2013. RIVER_BASIN_NAME
20 Hydrologic Unit Code 8-Digit (HUC08) Base
Hydrologic
EcoRegion
Identifies the 8-digit Hydrologic Unit Code (HUC08) that contains a HUC12 boundary.
Source data used was WBDHU6 Version 2 (June 2013), downloaded from NRCS WBD
February 2014. Region 4 WSIO Version 1, October 2013. HUC08
21 Name Hydrologic Unit Code 8-Digit Base
Hydrologic
EcoRegion
Name of 8-digit Hydrologic Unit Code (HUC08) that contains a HUC12 boundary.
Source data used was WBDHU6 Version 2 (June 2013), downloaded from NRCS WBD
February 2014. Region 4 WSIO Version 1, October 2013. NAME_HUC08
Page 3 of 57
Watershed Indicators WSIO version 1.3
Order Indicator_Name Type Component Description Field_Name
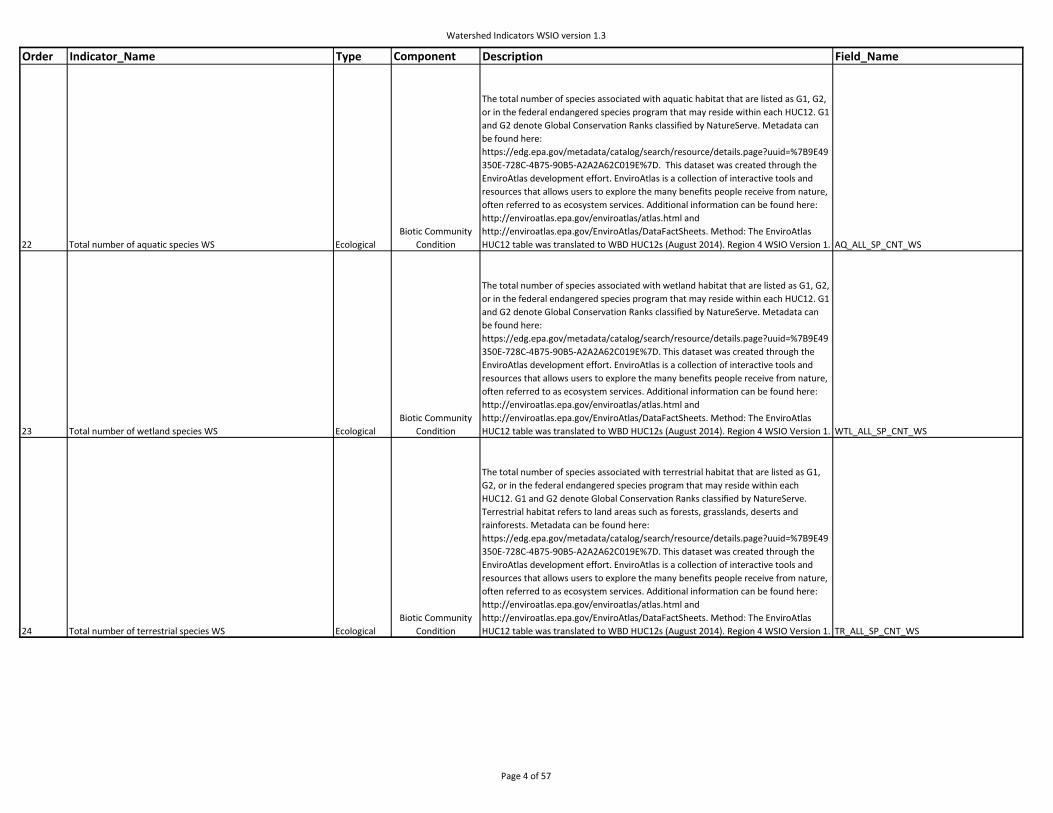
22 Total number of aquatic species WS Ecological
Biotic Community
Condition
The total number of species associated with aquatic habitat that are listed as G1, G2,
or in the federal endangered species program that may reside within each HUC12. G1
and G2 denote Global Conservation Ranks classified by NatureServe. Metadata can
be found here:
https://edg.epa.gov/metadata/catalog/search/resource/details.page?uuid=%7B9E49
350E-728C-4B75-90B5-A2A2A62C019E%7D. This dataset was created through the
EnviroAtlas development effort. EnviroAtlas is a collection of interactive tools and
resources that allows users to explore the many benefits people receive from nature,
often referred to as ecosystem services. Additional information can be found here:
http://enviroatlas.epa.gov/enviroatlas/atlas.html and
http://enviroatlas.epa.gov/EnviroAtlas/DataFactSheets. Method: The EnviroAtlas
HUC12 table was translated to WBD HUC12s (August 2014). Region 4 WSIO Version 1. AQ_ALL_SP_CNT_WS
23 Total number of wetland species WS Ecological
Biotic Community
Condition
The total number of species associated with wetland habitat that are listed as G1, G2,
or in the federal endangered species program that may reside within each HUC12. G1
and G2 denote Global Conservation Ranks classified by NatureServe. Metadata can
be found here:
https://edg.epa.gov/metadata/catalog/search/resource/details.page?uuid=%7B9E49
350E-728C-4B75-90B5-A2A2A62C019E%7D. This dataset was created through the
EnviroAtlas development effort. EnviroAtlas is a collection of interactive tools and
resources that allows users to explore the many benefits people receive from nature,
often referred to as ecosystem services. Additional information can be found here:
http://enviroatlas.epa.gov/enviroatlas/atlas.html and
http://enviroatlas.epa.gov/EnviroAtlas/DataFactSheets. Method: The EnviroAtlas
HUC12 table was translated to WBD HUC12s (August 2014). Region 4 WSIO Version 1. WTL_ALL_SP_CNT_WS
24 Total number of terrestrial species WS Ecological
Biotic Community
Condition
The total number of species associated with terrestrial habitat that are listed as G1,
G2, or in the federal endangered species program that may reside within each
HUC12. G1 and G2 denote Global Conservation Ranks classified by NatureServe.
Terrestrial habitat refers to land areas such as forests, grasslands, deserts and
rainforests. Metadata can be found here:
https://edg.epa.gov/metadata/catalog/search/resource/details.page?uuid=%7B9E49
350E-728C-4B75-90B5-A2A2A62C019E%7D. This dataset was created through the
EnviroAtlas development effort. EnviroAtlas is a collection of interactive tools and
resources that allows users to explore the many benefits people receive from nature,
often referred to as ecosystem services. Additional information can be found here:
http://enviroatlas.epa.gov/enviroatlas/atlas.html and
http://enviroatlas.epa.gov/EnviroAtlas/DataFactSheets. Method: The EnviroAtlas
HUC12 table was translated to WBD HUC12s (August 2014). Region 4 WSIO Version 1. TR_ALL_SP_CNT_WS
Page 4 of 57

Watershed Indicators WSIO version 1.3
Order Indicator_Name Type Component Description Field_Name
25 % Natural Cover, N-index (2006) in Watershed Ecological
Watershed Natural
Condition
The percent of the HUC12 with natural cover (excludes urban and agricultural
classifications). N-index cover classifications include 'Barren Land (Rock/Sand/Clay)'
(code 31), 'Deciduous Forrest' (code 41), 'Evergreen Forest' (code 42), 'Mixed Forest'
(code 43), 'Shrub/Scrub' (code 52), 'Grassland/Herbaceous' (code 71), ' Woody
Wetlands' (code 90), and 'Emergent Herbaceous Wetlands' (code 95) by the 2006
National Land Cover Database. Source data used was NLCD2006 version 1,
downloaded February 2011 (see metadata for more information). N-index is
consistent with the Analytical Tools Interface for Landscape Assessments (ATtILA)
version 2004. ATtILA user guide can be found here: http://www.epa.gov/esd/land-
sci/attila/pdf/user_guide.pdf. Region 4 WSIO Version 1, October 2013. N_INDEX_NLCD06_PCT_WS
26 % Natural Cover, N-index 2 (2006) in Watershed Ecological
Watershed Natural
Condition
The percent of the HUC12 with natural cover (excludes barren, urban or agricultural
classifications). N-index 2 cover classifications include 'Deciduous Forrest' (code 41),
'Evergreen Forest' (code 42), 'Mixed Forest' (code 43), 'Shrub/Scrub' (code 52),
'Grassland/Herbaceous' (code 71), ' Woody Wetlands' (code 90), and 'Emergent
Herbaceous Wetlands' (code 95) by the 2006 National Land Cover Database. Source
data used was NLCD2006 version 1, downloaded February 2011 (see metadata for
more information). N-index 2 was modified from the Analytical Tools Interface for
Landscape Assessments (ATtILA) version 2004. ATtILA user guide can be found here:
http://www.epa.gov/esd/land-sci/attila/pdf/user_guide.pdf. Region 4 WSIO Version
1, October 2013. N_INDEX2_NLCD06_PCT_WS
27 % Wetlands (2006) in Watershed Ecological
Watershed Natural
Condition
The percent of the HUC12 classified as wetlands by the 2006 National Land Cover
Database. Wetland land cover classifications include 'Woody Wetlands' (code 90),
and 'Emergent Herbaceous Wetlands' (code 95). Source data used was NLCD2006
version 1, downloaded February 2011 (see metadata for more information). Region 4
WSIO Version 1, October 2013. WETLANDS_NLCD06_PCT_WS
28 % Woody Wetlands (2006) in Watershed Ecological
Watershed Natural
Condition
The percent area in a HUC12 boundary classified as 'Woody Wetlands' (code 90) by
the 2006 National Land Cover Database. Source data used was NLCD2006 version 1,
downloaded February 2011 (see metadata for more information). Region 4 WSIO
Version 1, October 2013. LC90_NLCD06_PCT_WS
29 % Emergent Herbaceous Wetlands (2006) in Watershed Ecological
Watershed Natural
Condition
The percent area in a HUC12 boundary classified as 'Emergent Herbaceous Wetlands'
(code 95) by the 2006 National Land Cover Database. Source data used was
NLCD2006 version 1, downloaded February 2011 (see metadata for more
information). Region 4 WSIO Version 1, October 2013. LC95_NLCD06_PCT_WS
30 % Woody Vegetation (2006) in Watershed Ecological
Watershed Natural
Condition
The percent of the HUC12 classified with woody vegetation cover by the 2006
National Land Cover Database. Woody vegetation cover classifications include
'Deciduous Forrest' (code 41), 'Evergreen Forest' (code 42), 'Mixed Forest' (code 43),
'Shrub/Scrub' (code 52), and 'Woody Wetlands' (code 90). Source data used was
NLCD2006 version 1, downloaded February 2011 (see metadata for more
information). Region 4 WSIO Version 1, October 2013. WOODY_NLCD06_PCT_WS
31 % Forest (2006) in Watershed Ecological
Watershed Natural
Condition
The percent of the HUC12 classified with forest cover by the 2006 National Land
Cover Database. Forest cover classifications include 'Deciduous Forrest' (code 41),
'Evergreen Forest' (code 42), and 'Mixed Forest' (code 43). Source data used was
NLCD2006 version 1, downloaded February 2011 (see metadata for more
information). Region 4 WSIO Version 1, October 2013. FOREST_NLCD06_PCT_WS
Page 5 of 57
Watershed Indicators WSIO version 1.3
Order Indicator_Name Type Component Description Field_Name
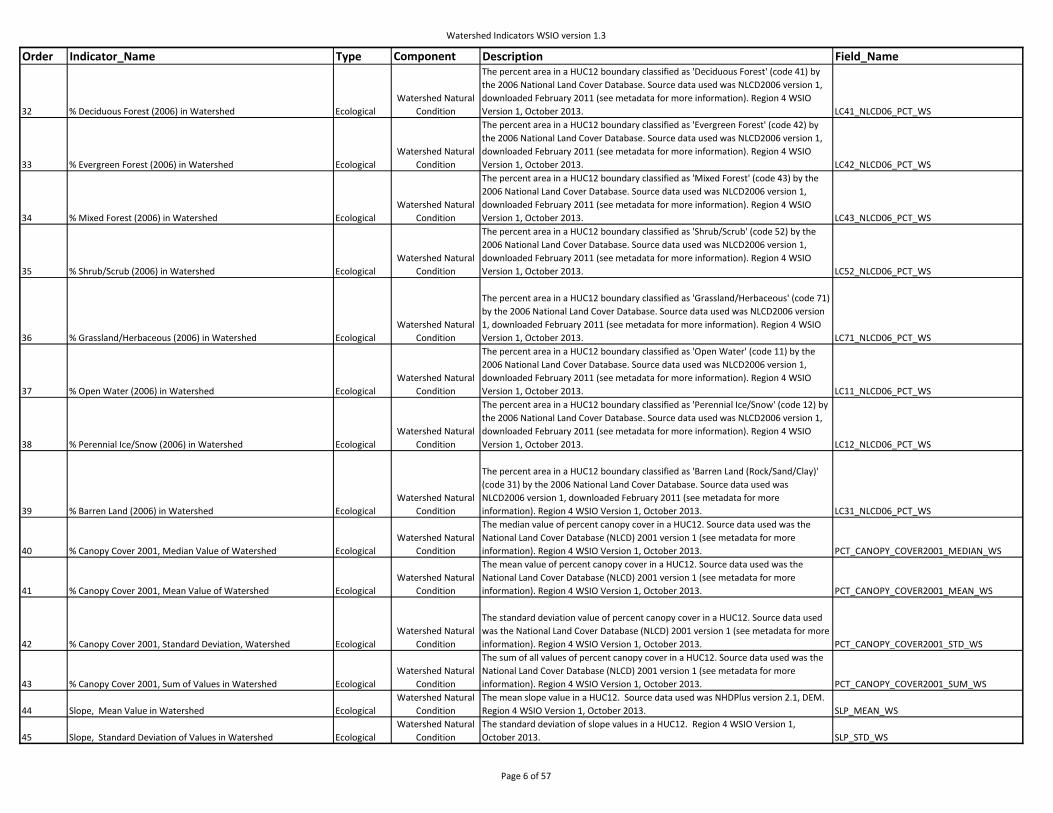
32 % Deciduous Forest (2006) in Watershed Ecological
Watershed Natural
Condition
The percent area in a HUC12 boundary classified as 'Deciduous Forest' (code 41) by
the 2006 National Land Cover Database. Source data used was NLCD2006 version 1,
downloaded February 2011 (see metadata for more information). Region 4 WSIO
Version 1, October 2013. LC41_NLCD06_PCT_WS
33 % Evergreen Forest (2006) in Watershed Ecological
Watershed Natural
Condition
The percent area in a HUC12 boundary classified as 'Evergreen Forest' (code 42) by
the 2006 National Land Cover Database. Source data used was NLCD2006 version 1,
downloaded February 2011 (see metadata for more information). Region 4 WSIO
Version 1, October 2013. LC42_NLCD06_PCT_WS
34 % Mixed Forest (2006) in Watershed Ecological
Watershed Natural
Condition
The percent area in a HUC12 boundary classified as 'Mixed Forest' (code 43) by the
2006 National Land Cover Database. Source data used was NLCD2006 version 1,
downloaded February 2011 (see metadata for more information). Region 4 WSIO
Version 1, October 2013. LC43_NLCD06_PCT_WS
35 % Shrub/Scrub (2006) in Watershed Ecological
Watershed Natural
Condition
The percent area in a HUC12 boundary classified as 'Shrub/Scrub' (code 52) by the
2006 National Land Cover Database. Source data used was NLCD2006 version 1,
downloaded February 2011 (see metadata for more information). Region 4 WSIO
Version 1, October 2013. LC52_NLCD06_PCT_WS
36 % Grassland/Herbaceous (2006) in Watershed Ecological
Watershed Natural
Condition
The percent area in a HUC12 boundary classified as 'Grassland/Herbaceous' (code 71)
by the 2006 National Land Cover Database. Source data used was NLCD2006 version
1, downloaded February 2011 (see metadata for more information). Region 4 WSIO
Version 1, October 2013. LC71_NLCD06_PCT_WS
37 % Open Water (2006) in Watershed Ecological
Watershed Natural
Condition
The percent area in a HUC12 boundary classified as 'Open Water' (code 11) by the
2006 National Land Cover Database. Source data used was NLCD2006 version 1,
downloaded February 2011 (see metadata for more information). Region 4 WSIO
Version 1, October 2013. LC11_NLCD06_PCT_WS
38 % Perennial Ice/Snow (2006) in Watershed Ecological
Watershed Natural
Condition
The percent area in a HUC12 boundary classified as 'Perennial Ice/Snow' (code 12) by
the 2006 National Land Cover Database. Source data used was NLCD2006 version 1,
downloaded February 2011 (see metadata for more information). Region 4 WSIO
Version 1, October 2013. LC12_NLCD06_PCT_WS
39 % Barren Land (2006) in Watershed Ecological
Watershed Natural
Condition
The percent area in a HUC12 boundary classified as 'Barren Land (Rock/Sand/Clay)'
(code 31) by the 2006 National Land Cover Database. Source data used was
NLCD2006 version 1, downloaded February 2011 (see metadata for more
information). Region 4 WSIO Version 1, October 2013. LC31_NLCD06_PCT_WS
40 % Canopy Cover 2001, Median Value of Watershed Ecological
Watershed Natural
Condition
The median value of percent canopy cover in a HUC12. Source data used was the
National Land Cover Database (NLCD) 2001 version 1 (see metadata for more
information). Region 4 WSIO Version 1, October 2013. PCT_CANOPY_COVER2001_MEDIAN_WS
41 % Canopy Cover 2001, Mean Value of Watershed Ecological
Watershed Natural
Condition
The mean value of percent canopy cover in a HUC12. Source data used was the
National Land Cover Database (NLCD) 2001 version 1 (see metadata for more
information). Region 4 WSIO Version 1, October 2013. PCT_CANOPY_COVER2001_MEAN_WS
42 % Canopy Cover 2001, Standard Deviation, Watershed Ecological
Watershed Natural
Condition
The standard deviation value of percent canopy cover in a HUC12. Source data used
was the National Land Cover Database (NLCD) 2001 version 1 (see metadata for more
information). Region 4 WSIO Version 1, October 2013. PCT_CANOPY_COVER2001_STD_WS
43 % Canopy Cover 2001, Sum of Values in Watershed Ecological
Watershed Natural
Condition
The sum of all values of percent canopy cover in a HUC12. Source data used was the
National Land Cover Database (NLCD) 2001 version 1 (see metadata for more
information). Region 4 WSIO Version 1, October 2013. PCT_CANOPY_COVER2001_SUM_WS
44 Slope, Mean Value in Watershed Ecological
Watershed Natural
Condition
The mean slope value in a HUC12. Source data used was NHDPlus version 2.1, DEM.
Region 4 WSIO Version 1, October 2013. SLP_MEAN_WS
45 Slope, Standard Deviation of Values in Watershed Ecological
Watershed Natural
Condition
The standard deviation of slope values in a HUC12. Region 4 WSIO Version 1,
October 2013. SLP_STD_WS
Page 6 of 57

Watershed Indicators WSIO version 1.3
Order Indicator_Name Type Component Description Field_Name
46 Elevation (cm), Mean Value of Watershed Ecological
Watershed Natural
Condition
The mean value elevation (cm) in a HUC12. Source data used was NHDPlus version
2.1, DEM. Region 4 WSIO Version 1, October 2013. ELEVATION_CM__MEAN_WS
47 Elevation (cm), Standard Deviation in Watershed Ecological
Watershed Natural
Condition
The standard deviation value elevation (cm) in a HUC12. Source data used was
NHDPlus version 2.1, DEM. Region 4 WSIO Version 1, October 2013. ELEVATION_CM__STD_WS
48 Elevation (cm), Range of Values in Watershed Ecological
Watershed Natural
Condition
The maximum value elevation (cm) in a HUC12. Source data used was NHDPlus
version 2.1, DEM. Region 4 WSIO Version 1, October 2013. ELEVATION_CM__RANGE_WS
49 Watershed Mean Soil Stability Ecological
Watershed Natural
Condition
Average soil stability in HUC12. Calculated as one minus average K factor
(WS_KFACTOR). WS_SOILSTABILITY
50 Percent rare ecosystem Ecological
Watershed Natural
Condition
An estimate of the percent of land within each HUC12 that could be classified as a
rare ecosystem. Ecosystem rarity in EnviroAtlas is based on size, shape, and type of
ecosystem. Metadata can be found here:
https://edg.epa.gov/metadata/catalog/search/resource/details.page?uuid=%7B5E59
1817-C13D-498A-BA0D-F3D28D986324%7D. This dataset was created through the
EnviroAtlas development effort. EnviroAtlas is a collection of interactive tools and
resources that allows users to explore the many benefits people receive from nature,
often referred to as ecosystem services. Additional information can be found here:
http://enviroatlas.epa.gov/enviroatlas/atlas.html and
http://enviroatlas.epa.gov/EnviroAtlas/DataFactSheets. Method: The EnviroAtlas
HUC12 table was translated to WBD HUC12s (August 2014). Region 4 WSIO Version 1. RARE_ECO_PCT_WS
51 Percent rare ecosystem protected Ecological
Watershed Natural
Condition
An estimate of the percent of land within each HUC12 that is protected and could be
classified as a rare ecosystem. Ecosystem rarity in EnviroAtlas is based on size, shape,
and type of ecosystem. Metadata can be found here:
https://edg.epa.gov/metadata/catalog/search/resource/details.page?uuid=%7B5E59
1817-C13D-498A-BA0D-F3D28D986324%7D. This dataset was created through the
EnviroAtlas development effort. EnviroAtlas is a collection of interactive tools and
resources that allows users to explore the many benefits people receive from nature,
often referred to as ecosystem services. Additional information can be found here:
http://enviroatlas.epa.gov/enviroatlas/atlas.html and
http://enviroatlas.epa.gov/EnviroAtlas/DataFactSheets. Method: The EnviroAtlas
HUC12 table was translated to WBD HUC12s (August 2014). Region 4 WSIO Version 1. RARE_ECO_PROT_PCT_WS
52 Carbon storage by tree biomass (kg/m2) Ecological
Watershed Natural
Condition
An estimate of the kilograms of dry carbon stored per square meter of above ground
biomass of trees and forests in each HUC12. Metadata can be found here:
https://edg.epa.gov/metadata/catalog/search/resource/details.page?uuid=%7B60BE
4324-84B3-4C0F-A9A3-22E198F814E6%7D. This dataset was created through the
EnviroAtlas development effort. EnviroAtlas is a collection of interactive tools and
resources that allows users to explore the many benefits people receive from nature,
often referred to as ecosystem services. Additional information can be found here:
http://enviroatlas.epa.gov/enviroatlas/atlas.html and
http://enviroatlas.epa.gov/EnviroAtlas/DataFactSheets. Method: The EnviroAtlas
HUC12 table was translated to WBD HUC12s (August 2014). Region 4 WSIO Version 1. CARBON_STORE_TREE_BIO_MASS_WS
Page 7 of 57

Watershed Indicators WSIO version 1.3
Order Indicator_Name Type Component Description Field_Name
53 Carbon storage by tree root biomass (kg/m2) Ecological
Watershed Natural
Condition
An estimate of the kilograms of dry carbon stored per square meter in below ground
biomass in each HUC12. Biomass below ground includes tree root biomass and soils.
Metadata can be found here:
https://edg.epa.gov/metadata/catalog/search/resource/details.page?uuid=%7B60BE
4324-84B3-4C0F-A9A3-22E198F814E6%7D. This dataset was created through the
EnviroAtlas development effort. EnviroAtlas is a collection of interactive tools and
resources that allows users to explore the many benefits people receive from nature,
often referred to as ecosystem services. Additional information can be found here:
http://enviroatlas.epa.gov/enviroatlas/atlas.html and
http://enviroatlas.epa.gov/EnviroAtlas/DataFactSheets. Method: The EnviroAtlas
HUC12 table was translated to WBD HUC12s (August 2014). Region 4 WSIO Version 1. CARBON_STORE_ROOT_BIO_MASS_WS
54 Natural biological nitrogen fixation (kg N/ha/yr) Ecological
Watershed Natural
Condition
This map depicts mean biological nitrogen fixation in natural and semi-natural
ecosystems within each subwatershed (12-digit HUC) in kg N/ha/yr. Metadata can be
found here:
https://edg.epa.gov/metadata/catalog/search/resource/details.page?uuid=%7B1B0B
5221-C726-4E7D-93FD-23F7A4FF8930%7D. This dataset was created through the
EnviroAtlas development effort. EnviroAtlas is a collection of interactive tools and
resources that allows users to explore the many benefits people receive from nature,
often referred to as ecosystem services. Additional information can be found here:
http://enviroatlas.epa.gov/enviroatlas/atlas.html and
http://enviroatlas.epa.gov/EnviroAtlas/DataFactSheets. Method: The EnviroAtlas
HUC12 table was translated to WBD HUC12s (August 2014). Region 4 WSIO Version 1. N_NAT_BIO_FIX_MEAN_WS
55 Cultivate biologic nitrogen fixation(kg N/ha/yr)WS Ecological
Watershed Natural
Condition
The mean rate of biological nitrogen fixation from the cultivation of crops within a
HUC12 (kg N/ha/yr). Metadata can be found here:
https://edg.epa.gov/metadata/catalog/search/resource/details.page?uuid=%7B18DA
5C01-F53D-4CC3-B557-046C3FF5A584%7D. This dataset was created through the
EnviroAtlas development effort. EnviroAtlas is a collection of interactive tools and
resources that allows users to explore the many benefits people receive from nature,
often referred to as ecosystem services. Additional information can be found here:
http://enviroatlas.epa.gov/enviroatlas/atlas.html and
http://enviroatlas.epa.gov/EnviroAtlas/DataFactSheets. Method: The EnviroAtlas
HUC12 table was translated to WBD HUC12s (August 2014). Region 4 WSIO Version 1. N_CULT_BIO_FIX_MEAN_WS
Page 8 of 57

Watershed Indicators WSIO version 1.3
Order Indicator_Name Type Component Description Field_Name
56 % Natural Cover, N-index (2006) in HCZ Ecological
HCZ -Corridor
Natural Condition
The percent area of the HUC12 boundary that is within the Hydrologically Connected
Zone* and classified as natural cover (excluding urban and agriculture) by the 2006
National Land Cover Database. N-index land cover classifications include 'Barren Land
(Rock/Sand/Clay)' (code 31), 'Deciduous Forrest' (code 41), 'Evergreen Forest' (code
42), 'Mixed Forest' (code 43), 'Shrub/Scrub' (code 52), 'Grassland/Herbaceous' (code
71), ' Woody Wetlands' (code 90), and 'Emergent Herbaceous Wetlands' (code 95).
Source data used was NLCD2006 version 1, downloaded February 2011 (see
metadata for more information). N-index is consistent with the Analytical Tools
Interface for Landscape Assessments (ATtILA) version 2004. ATtILA user guide can be
found here: http://www.epa.gov/esd/land-sci/attila/pdf/user_guide.pdf. Region 4
WSIO Version 1, October 2013. *The Hydrologically Connected Zone (HCZ, see
metadata for more information) is determined using grid analysis to combine surface
water features from NLCD2006 and NHD Plus version 2. It also includes areas
contiguous to surface water that also has a wetness index value of 550 or greater.
The combination of these three datasets represents the Hydrologically Connected
Zone (HCZ). N_INDEX_NLCD06_PCT_HZ
57 % Natural Cover, N-index 2 (2006) in HCZ Ecological
HCZ -Corridor
Natural Condition
The percent area of the HUC12 boundary that is within the Hydrologically Connected
Zone* and classified as natural cover (excluding barren, urban and agriculture) by the
2006 National Land Cover Database. N-index 2 land cover classifications include
'Deciduous Forrest' (code 41), 'Evergreen Forest' (code 42), 'Mixed Forest' (code 43),
'Shrub/Scrub' (code 52), 'Grassland/Herbaceous' (code 71), ' Woody Wetlands' (code
90), and 'Emergent Herbaceous Wetlands' (code 95). Source data used was
NLCD2006 version 1, downloaded February 2011 (see metadata for more
information). N-index 2 was modified from the Analytical Tools Interface for
Landscape Assessments (ATtILA) version 2004. ATtILA user guide can be found here:
http://www.epa.gov/esd/land-sci/attila/pdf/user_guide.pdf. Region 4 WSIO Version
1, October 2013. *The Hydrologically Connected Zone (HCZ, see metadata for more
information) is determined using grid analysis to combine surface water features
from NLCD2006 and NHD Plus version 2. It also includes areas contiguous to surface
water that also has a wetness index value of 550 or greater. The combination of these
three datasets represents the Hydrologically Connected Zone (HCZ). N_INDEX2_NLCD06_PCT_HZ
58 % Wetlands (2006) in HCZ Ecological
HCZ -Corridor
Natural Condition
The percent of the HUC12 that is within the Hydrologically Connected Zone* and
classified as wetlands by the 2006 National Land Cover Database. Wetland land cover
classifications include 'Woody Wetlands' (code 90), and 'Emergent Herbaceous
Wetlands' (code 95). Source data used was NLCD2006 version 1, downloaded
February 2011 (see metadata for more information). Region 4 WSIO Version 1,
October 2013. *The Hydrologically Connected Zone (HCZ, see metadata for more
information) is determined using grid analysis to combine surface water features
from NLCD2006 and NHD Plus version 2. It also includes areas contiguous to surface
water that also has a wetness index value of 550 or greater. The combination of these
three datasets represents the Hydrologically Connected Zone (HCZ). WETLANDS_NLCD06_PCT_HZ
Page 9 of 57

Watershed Indicators WSIO version 1.3
Order Indicator_Name Type Component Description Field_Name
59 % Woody Wetlands (2006) in HCZ Ecological
HCZ -Corridor
Natural Condition
The percent area of the HUC12 boundary that is within the Hydrologically Connected
Zone* and classified as 'Woody Wetlands' (code 90) by the 2006 National Land Cover
Database. Source data used was NLCD2006 version 1, downloaded February 2011
(see metadata for more information). Region 4 WSIO Version 1, October 2013. *The
Hydrologically Connected Zone (HCZ, see metadata for more information) is
determined using grid analysis to combine surface water features from NLCD2006
and NHD Plus version 2. It also includes areas contiguous to surface water that also
has a wetness index value of 550 or greater. The combination of these three datasets
represents the Hydrologically Connected Zone (HCZ). LC90_NLCD06_PCT_HZ
60 % Emergent Herbaceous Wetlands (2006) in HCZ Ecological
HCZ -Corridor
Natural Condition
The percent area of the HUC12 boundary that is within the Hydrologically Connected
Zone* and classified as 'Emergent Herbaceous Wetlands' (code 95) by the 2006
National Land Cover Database. Source data used was NLCD2006 version 1,
downloaded February 2011 (see metadata for more information). Region 4 WSIO
Version 1, October 2013. *The Hydrologically Connected Zone (HCZ, see metadata for
more information) is determined using grid analysis to combine surface water
features from NLCD2006 and NHD Plus version 2. It also includes areas contiguous to
surface water that also has a wetness index value of 550 or greater. The combination
of these three datasets represents the Hydrologically Connected Zone (HCZ). LC95_NLCD06_PCT_HZ
61 % Woody Vegetation (2006) in HCZ Ecological
HCZ -Corridor
Natural Condition
The percent of the HUC12 that is within the Hydrologically Connected Zone* and
classified with woody vegetation cover by the 2006 National Land Cover Database.
Woody vegetation cover classifications include 'Deciduous Forrest' (code 41),
'Evergreen Forest' (code 42), 'Mixed Forest' (code 43), 'Shrub/Scrub' (code 52), and
'Woody Wetlands' (code 90). Source data used was NLCD2006 version 1, downloaded
February 2011 (see metadata for more information). Region 4 WSIO Version 1,
October 2013. *The Hydrologically Connected Zone (HCZ, see metadata for more
information) is determined using grid analysis to combine surface water features
from NLCD2006 and NHD Plus version 2. It also includes areas contiguous to surface
water that also has a wetness index value of 550 or greater. The combination of these
three datasets represents the Hydrologically Connected Zone (HCZ). WOODY_NLCD06_PCT_HZ
62 % Forest (2006) in HCZ Ecological
HCZ -Corridor
Natural Condition
The percent of the HUC12 that is within the Hydrologically Connected Zone* and
classified with forest cover by the 2006 National Land Cover Database. Forest cover
classifications include 'Deciduous Forrest' (code 41), 'Evergreen Forest' (code 42), and
'Mixed Forest' (code 43). Source data used was NLCD2006 version 1, downloaded
February 2011 (see metadata for more information). Region 4 WSIO Version 1,
October 2013. *The Hydrologically Connected Zone (HCZ, see metadata for more
information) is determined using grid analysis to combine surface water features
from NLCD2006 and NHD Plus version 2. It also includes areas contiguous to surface
water that also has a wetness index value of 550 or greater. The combination of these
three datasets represents the Hydrologically Connected Zone (HCZ). FOREST_NLCD06_PCT_HZ
Page 10 of 57
Watershed Indicators WSIO version 1.3
Order Indicator_Name Type Component Description Field_Name
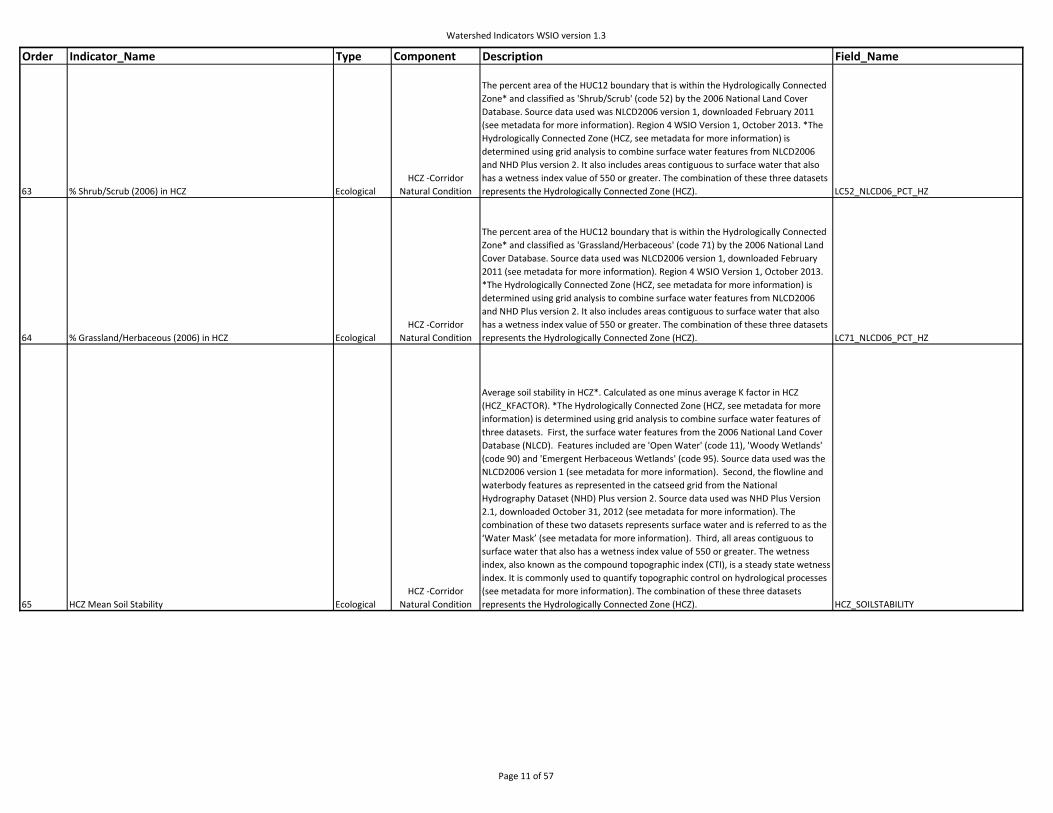
63 % Shrub/Scrub (2006) in HCZ Ecological
HCZ -Corridor
Natural Condition
The percent area of the HUC12 boundary that is within the Hydrologically Connected
Zone* and classified as 'Shrub/Scrub' (code 52) by the 2006 National Land Cover
Database. Source data used was NLCD2006 version 1, downloaded February 2011
(see metadata for more information). Region 4 WSIO Version 1, October 2013. *The
Hydrologically Connected Zone (HCZ, see metadata for more information) is
determined using grid analysis to combine surface water features from NLCD2006
and NHD Plus version 2. It also includes areas contiguous to surface water that also
has a wetness index value of 550 or greater. The combination of these three datasets
represents the Hydrologically Connected Zone (HCZ). LC52_NLCD06_PCT_HZ
64 % Grassland/Herbaceous (2006) in HCZ Ecological
HCZ -Corridor
Natural Condition
The percent area of the HUC12 boundary that is within the Hydrologically Connected
Zone* and classified as 'Grassland/Herbaceous' (code 71) by the 2006 National Land
Cover Database. Source data used was NLCD2006 version 1, downloaded February
2011 (see metadata for more information). Region 4 WSIO Version 1, October 2013.
*The Hydrologically Connected Zone (HCZ, see metadata for more information) is
determined using grid analysis to combine surface water features from NLCD2006
and NHD Plus version 2. It also includes areas contiguous to surface water that also
has a wetness index value of 550 or greater. The combination of these three datasets
represents the Hydrologically Connected Zone (HCZ). LC71_NLCD06_PCT_HZ
65 HCZ Mean Soil Stability Ecological
HCZ -Corridor
Natural Condition
Average soil stability in HCZ*. Calculated as one minus average K factor in HCZ
(HCZ_KFACTOR). *The Hydrologically Connected Zone (HCZ, see metadata for more
information) is determined using grid analysis to combine surface water features of
three datasets. First, the surface water features from the 2006 National Land Cover
Database (NLCD). Features included are 'Open Water' (code 11), 'Woody Wetlands'
(code 90) and 'Emergent Herbaceous Wetlands' (code 95). Source data used was the
NLCD2006 version 1 (see metadata for more information). Second, the flowline and
waterbody features as represented in the catseed grid from the National
Hydrography Dataset (NHD) Plus version 2. Source data used was NHD Plus Version
2.1, downloaded October 31, 2012 (see metadata for more information). The
combination of these two datasets represents surface water and is referred to as the
‘Water Mask’ (see metadata for more information). Third, all areas contiguous to
surface water that also has a wetness index value of 550 or greater. The wetness
index, also known as the compound topographic index (CTI), is a steady state wetness
index. It is commonly used to quantify topographic control on hydrological processes
(see metadata for more information). The combination of these three datasets
represents the Hydrologically Connected Zone (HCZ). HCZ_SOILSTABILITY
Page 11 of 57

Watershed Indicators WSIO version 1.3
Order Indicator_Name Type Component Description Field_Name
66 % Natural Cover, N-index (2006) in Riparian Zone Ecological
RZ -Corridor Natural
Condition
The percent area of the HUC12 boundary that is within the Riparian Zone* and
classified as natural cover (excluding urban and agriculture) by the 2006 National
Land Cover Database. N-index land cover classifications include 'Barren Land
(Rock/Sand/Clay)' (code 31), 'Deciduous Forrest' (code 41), 'Evergreen Forest' (code
42), 'Mixed Forest' (code 43), 'Shrub/Scrub' (code 52), 'Grassland/Herbaceous' (code
71), ' Woody Wetlands' (code 90), and 'Emergent Herbaceous Wetlands' (code 95).
Source data used was NLCD2006 version 1, downloaded February 2011 (see
metadata for more information). N-index is consistent with the Analytical Tools
Interface for Landscape Assessments (ATtILA) version 2004. ATtILA user guide can be
found here: http://www.epa.gov/esd/land-sci/attila/pdf/user_guide.pdf. Region 4
WSIO Version 1, October 2013. *The Riparian Zone (RZ, see metadata for more
information) is determined using grid analysis to combine surface water features
from NLCD2006 and NHD Plus version 2; then an approximate 100 meter buffer is
placed around these features. The combination of these two datasets and all cells
with a distance of 108 meters or less from surface water are included in the Riparian
Zone (RZ). N_INDEX_NLCD06_PCT_RZ
67 % Natural Cover, N-index 2 (2006) in Riparian Zone Ecological
RZ -Corridor Natural
Condition
The percent area of the HUC12 boundary that is within the Riparian Zone* and
classified as natural cover (excluding barren, urban and agriculture) by the 2006
National Land Cover Database. N-index 2 land cover classifications include 'Deciduous
Forrest' (code 41), 'Evergreen Forest' (code 42), 'Mixed Forest' (code 43),
'Shrub/Scrub' (code 52), 'Grassland/Herbaceous' (code 71), ' Woody Wetlands' (code
90), and 'Emergent Herbaceous Wetlands' (code 95). Source data used was
NLCD2006 version 1, downloaded February 2011. Citation: Fry, J., Xian, G., Jin, S.,
Dewitz, J., Homer, C., Yang, L., Barnes, C., Herold, N., and Wickham, J., 2011 (see
metadata for more information). N-index 2 was modified from the Analytical Tools
Interface for Landscape Assessments (ATtILA) version 2004. ATtILA user guide can be
found here: http://www.epa.gov/esd/land-sci/attila/pdf/user_guide.pdf. Region 4
WSIO Version 1, October 2013. *The Riparian Zone (RZ, see metadata for more
information) is determined using grid analysis to combine surface water features
from NLCD2006 and NHD Plus version 2; then an approximate 100 meter buffer is
placed around these features. The combination of these two datasets and all cells
with a distance of 108 meters or less from surface water are included in the Riparian
Zone (RZ). N_INDEX2_NLCD06_PCT_RZ
68 % Wetlands (2006) in Riparian Zone Ecological
RZ -Corridor Natural
Condition
The percent of the HUC12 that is within the Riparian Zone* and classified as wetlands
by the 2006 National Land Cover Database. Wetland land cover classifications include
'Woody Wetlands' (code 90), and 'Emergent Herbaceous Wetlands' (code 95). Source
data used was NLCD2006 version 1, downloaded February 2011 (see metadata for
more information). Region 4 WSIO Version 1, October 2013. *The Riparian Zone (RZ,
see metadata for more information) is determined using grid analysis to combine
surface water features from NLCD2006 and NHD Plus version 2; then an approximate
100 meter buffer is placed around these features. The combination of these two
datasets and all cells with a distance of 108 meters or less from surface water are
included in the Riparian Zone (RZ). WETLANDS_NLCD06_PCT_RZ
Page 12 of 57
Watershed Indicators WSIO version 1.3
Order Indicator_Name Type Component Description Field_Name
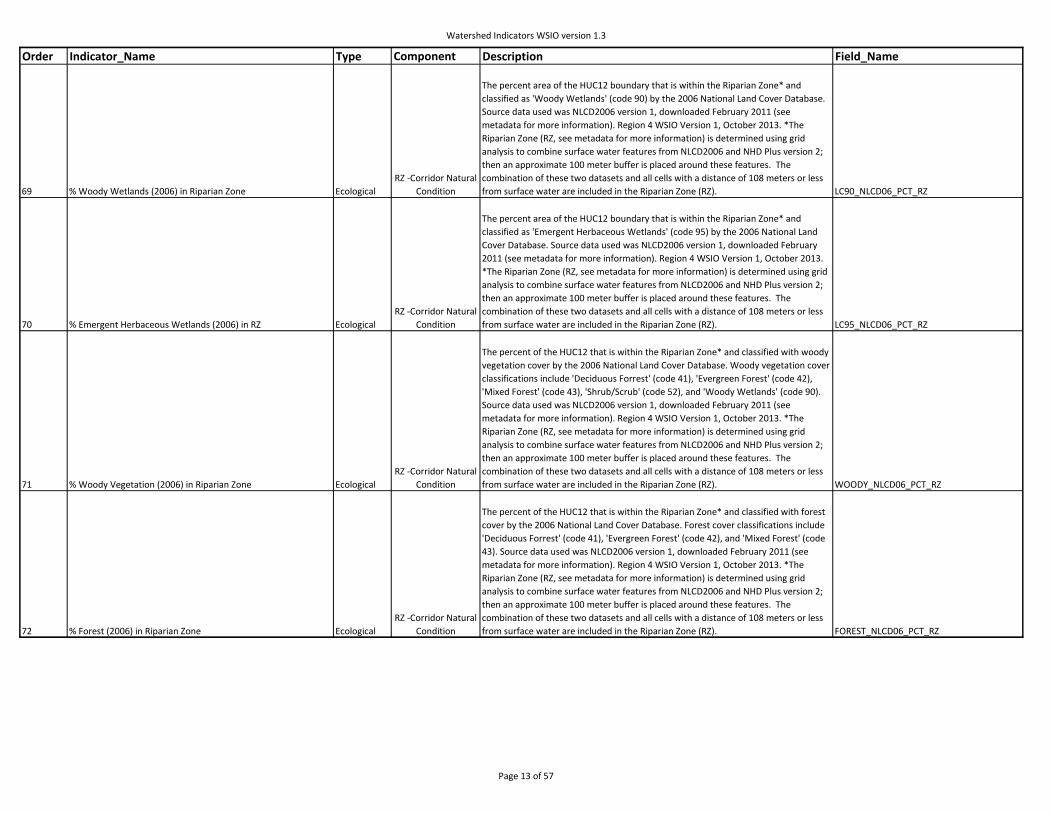
69 % Woody Wetlands (2006) in Riparian Zone Ecological
RZ -Corridor Natural
Condition
The percent area of the HUC12 boundary that is within the Riparian Zone* and
classified as 'Woody Wetlands' (code 90) by the 2006 National Land Cover Database.
Source data used was NLCD2006 version 1, downloaded February 2011 (see
metadata for more information). Region 4 WSIO Version 1, October 2013. *The
Riparian Zone (RZ, see metadata for more information) is determined using grid
analysis to combine surface water features from NLCD2006 and NHD Plus version 2;
then an approximate 100 meter buffer is placed around these features. The
combination of these two datasets and all cells with a distance of 108 meters or less
from surface water are included in the Riparian Zone (RZ). LC90_NLCD06_PCT_RZ
70 % Emergent Herbaceous Wetlands (2006) in RZ Ecological
RZ -Corridor Natural
Condition
The percent area of the HUC12 boundary that is within the Riparian Zone* and
classified as 'Emergent Herbaceous Wetlands' (code 95) by the 2006 National Land
Cover Database. Source data used was NLCD2006 version 1, downloaded February
2011 (see metadata for more information). Region 4 WSIO Version 1, October 2013.
*The Riparian Zone (RZ, see metadata for more information) is determined using grid
analysis to combine surface water features from NLCD2006 and NHD Plus version 2;
then an approximate 100 meter buffer is placed around these features. The
combination of these two datasets and all cells with a distance of 108 meters or less
from surface water are included in the Riparian Zone (RZ). LC95_NLCD06_PCT_RZ
71 % Woody Vegetation (2006) in Riparian Zone Ecological
RZ -Corridor Natural
Condition
The percent of the HUC12 that is within the Riparian Zone* and classified with woody
vegetation cover by the 2006 National Land Cover Database. Woody vegetation cover
classifications include 'Deciduous Forrest' (code 41), 'Evergreen Forest' (code 42),
'Mixed Forest' (code 43), 'Shrub/Scrub' (code 52), and 'Woody Wetlands' (code 90).
Source data used was NLCD2006 version 1, downloaded February 2011 (see
metadata for more information). Region 4 WSIO Version 1, October 2013. *The
Riparian Zone (RZ, see metadata for more information) is determined using grid
analysis to combine surface water features from NLCD2006 and NHD Plus version 2;
then an approximate 100 meter buffer is placed around these features. The
combination of these two datasets and all cells with a distance of 108 meters or less
from surface water are included in the Riparian Zone (RZ). WOODY_NLCD06_PCT_RZ
72 % Forest (2006) in Riparian Zone Ecological
RZ -Corridor Natural
Condition
The percent of the HUC12 that is within the Riparian Zone* and classified with forest
cover by the 2006 National Land Cover Database. Forest cover classifications include
'Deciduous Forrest' (code 41), 'Evergreen Forest' (code 42), and 'Mixed Forest' (code
43). Source data used was NLCD2006 version 1, downloaded February 2011 (see
metadata for more information). Region 4 WSIO Version 1, October 2013. *The
Riparian Zone (RZ, see metadata for more information) is determined using grid
analysis to combine surface water features from NLCD2006 and NHD Plus version 2;
then an approximate 100 meter buffer is placed around these features. The
combination of these two datasets and all cells with a distance of 108 meters or less
from surface water are included in the Riparian Zone (RZ). FOREST_NLCD06_PCT_RZ
Page 13 of 57

Watershed Indicators WSIO version 1.3
Order Indicator_Name Type Component Description Field_Name
73 % Shrub/Scrub (2006) in Riparian Zone Ecological
RZ -Corridor Natural
Condition
The percent area of the HUC12 boundary that is within the Riparian Zone* and
classified as 'Shrub/Scrub' (code 52) by the 2006 National Land Cover Database.
Source data used was NLCD2006 version 1, downloaded February 2011 (see
metadata for more information). Region 4 WSIO Version 1, October 2013. *The
Riparian Zone (RZ, see metadata for more information) is determined using grid
analysis to combine surface water features from NLCD2006 and NHD Plus version 2;
then an approximate 100 meter buffer is placed around these features. The
combination of these two datasets and all cells with a distance of 108 meters or less
from surface water are included in the Riparian Zone (RZ). LC52_NLCD06_PCT_RZ
74 % Grassland/Herbaceous (2006) in Riparian Zone Ecological
RZ -Corridor Natural
Condition
The percent area of the HUC12 boundary that is within the Riparian Zone* and
classified as 'Grassland/Herbaceous' (code 71) by the 2006 National Land Cover
Database. Source data used was NLCD2006 version 1, downloaded February 2011
(see metadata for more information). Region 4 WSIO Version 1, October 2013. *The
Riparian Zone (RZ, see metadata for more information) is determined using grid
analysis to combine surface water features from NLCD2006 and NHD Plus version 2;
then an approximate 100 meter buffer is placed around these features. The
combination of these two datasets and all cells with a distance of 108 meters or less
from surface water are included in the Riparian Zone (RZ). LC71_NLCD06_PCT_RZ
75 Computed Topographic Index (Wetness) Mean WS Ecological
Hydrology Flow &
Channel
Mean value of Computed Topographic Index (wetness)* in a HUC12. Source data
used was flow accumulation determined from NHD Plus Version 2.1, downloaded
October 31, 2012 (see metadata for more information). Region 4 WSIO Version 1,
October 2013. *The Wetness Index (see metadata for more information) is a
Computed Topographic Index (CTI) derived from the NHD Plus flow accumulation and
slope of the DEM using the equation: grid wet_ndx = 100*(ln (flow
accumulation/tan(slope)) + 3x3 mean of ln (flow accumulation/tan(slope))/2. This
information was used to identify areas in the landscape likely to be wet. Values
greater than 800 have been determined to represent areas which are usually wet. COMPUTED_TOPO_INDEX_MEAN_WS
76 Computed Topographic Index Standard Deviation WS Ecological
Hydrology Flow &
Channel
Standard deviation value of Computed Topographic Index (wetness)* in a HUC12.
Source data used was flow accumulation determined from NHD Plus Version 2.1,
downloaded October 31, 2012 (see metadata for more information). Region 4 WSIO
Version 1, October 2013. *The Wetness Index (see metadata for more information) is
a Computed Topographic Index (CTI) derived from the NHD Plus flow accumulation
and slope of the DEM using the equation: grid wet_ndx = 100*(ln (flow
accumulation/tan(slope)) + 3x3 mean of ln (flow accumulation/tan(slope))/2. This
information was used to identify areas in the landscape likely to be wet. Values
greater than 800 have been determined to represent areas which are usually wet. COMPUTED_TOPO_INDEX_STD_WS
Page 14 of 57
Watershed Indicators WSIO version 1.3
Order Indicator_Name Type Component Description Field_Name
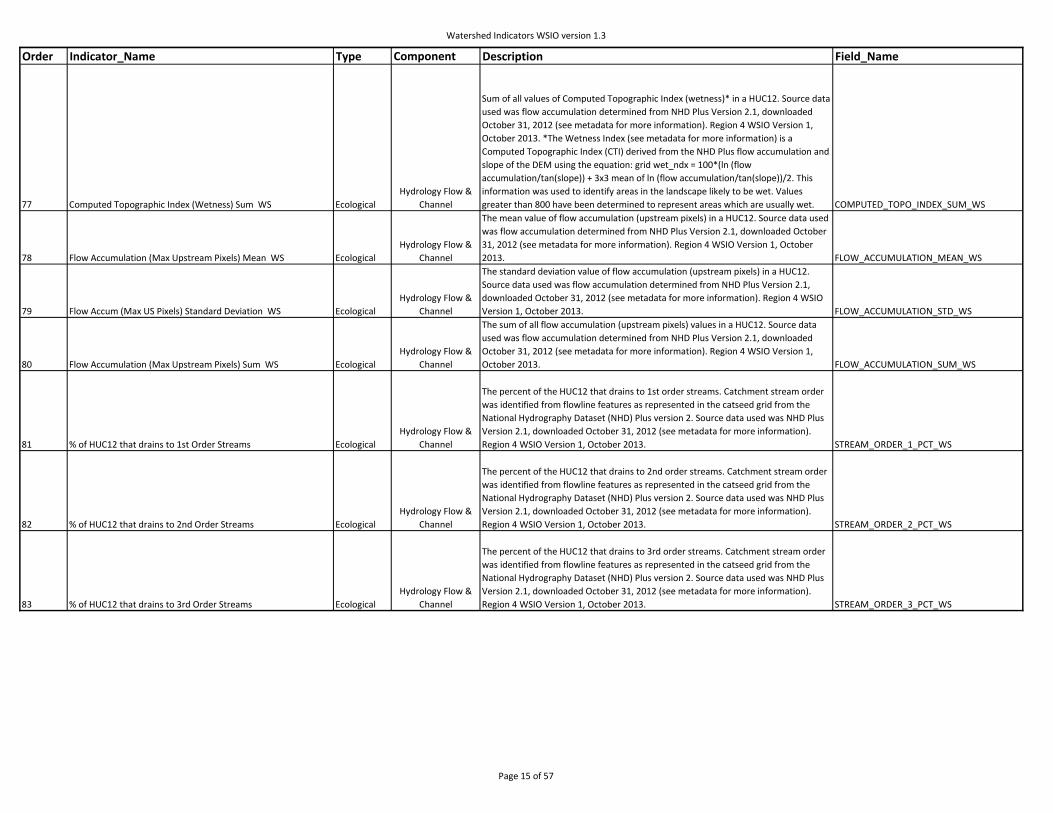
77 Computed Topographic Index (Wetness) Sum WS Ecological
Hydrology Flow &
Channel
Sum of all values of Computed Topographic Index (wetness)* in a HUC12. Source data
used was flow accumulation determined from NHD Plus Version 2.1, downloaded
October 31, 2012 (see metadata for more information). Region 4 WSIO Version 1,
October 2013. *The Wetness Index (see metadata for more information) is a
Computed Topographic Index (CTI) derived from the NHD Plus flow accumulation and
slope of the DEM using the equation: grid wet_ndx = 100*(ln (flow
accumulation/tan(slope)) + 3x3 mean of ln (flow accumulation/tan(slope))/2. This
information was used to identify areas in the landscape likely to be wet. Values
greater than 800 have been determined to represent areas which are usually wet. COMPUTED_TOPO_INDEX_SUM_WS
78 Flow Accumulation (Max Upstream Pixels) Mean WS Ecological
Hydrology Flow &
Channel
The mean value of flow accumulation (upstream pixels) in a HUC12. Source data used
was flow accumulation determined from NHD Plus Version 2.1, downloaded October
31, 2012 (see metadata for more information). Region 4 WSIO Version 1, October
2013. FLOW_ACCUMULATION_MEAN_WS
79 Flow Accum (Max US Pixels) Standard Deviation WS Ecological
Hydrology Flow &
Channel
The standard deviation value of flow accumulation (upstream pixels) in a HUC12.
Source data used was flow accumulation determined from NHD Plus Version 2.1,
downloaded October 31, 2012 (see metadata for more information). Region 4 WSIO
Version 1, October 2013. FLOW_ACCUMULATION_STD_WS
80 Flow Accumulation (Max Upstream Pixels) Sum WS Ecological
Hydrology Flow &
Channel
The sum of all flow accumulation (upstream pixels) values in a HUC12. Source data
used was flow accumulation determined from NHD Plus Version 2.1, downloaded
October 31, 2012 (see metadata for more information). Region 4 WSIO Version 1,
October 2013. FLOW_ACCUMULATION_SUM_WS
81 % of HUC12 that drains to 1st Order Streams Ecological
Hydrology Flow &
Channel
The percent of the HUC12 that drains to 1st order streams. Catchment stream order
was identified from flowline features as represented in the catseed grid from the
National Hydrography Dataset (NHD) Plus version 2. Source data used was NHD Plus
Version 2.1, downloaded October 31, 2012 (see metadata for more information).
Region 4 WSIO Version 1, October 2013. STREAM_ORDER_1_PCT_WS
82 % of HUC12 that drains to 2nd Order Streams Ecological
Hydrology Flow &
Channel
The percent of the HUC12 that drains to 2nd order streams. Catchment stream order
was identified from flowline features as represented in the catseed grid from the
National Hydrography Dataset (NHD) Plus version 2. Source data used was NHD Plus
Version 2.1, downloaded October 31, 2012 (see metadata for more information).
Region 4 WSIO Version 1, October 2013. STREAM_ORDER_2_PCT_WS
83 % of HUC12 that drains to 3rd Order Streams Ecological
Hydrology Flow &
Channel
The percent of the HUC12 that drains to 3rd order streams. Catchment stream order
was identified from flowline features as represented in the catseed grid from the
National Hydrography Dataset (NHD) Plus version 2. Source data used was NHD Plus
Version 2.1, downloaded October 31, 2012 (see metadata for more information).
Region 4 WSIO Version 1, October 2013. STREAM_ORDER_3_PCT_WS
Page 15 of 57

Watershed Indicators WSIO version 1.3
Order Indicator_Name Type Component Description Field_Name
84 % NEF2001, National Ecological Framework, WS Ecological
Aquatic Condition /
Connectivity
The percent of a HUC12 that is part of the 2001 National Ecological Framework
(NEF)*. The NEF is comprised of Hubs and Corridors. In the NEF, Hubs are defined as
Priority Ecological Areas that are greater than 5,000 acres in size. Corridors are
defined as linkages between Hubs and were determined using a cost surface analysis
to determine the least human disturbance pathway between individual Hubs. Region
4 WSIO Version 1, October 2013. *The National Ecological Framework (NEF, see
metadata for more information) is a GIS based model of the connectivity of natural
landscapes in the lower 48 United States. It was developed to provide a guide for the
protection of the natural ecosystem processes that give us clean air, pure water and
protected lands that are part of EPA’s mission to protect. NEF2001_PCT_WS
85 % HUBS, National Ecological Framework 2001, WS Ecological
Aquatic Condition /
Connectivity
The percent of a HUC12 that is categorized as a Hub by the 2001 National Ecological
Framework (NEF)*. In the NEF Hubs are defined as Priority Ecological Areas that are
greater than 5,000 acres in size. Region 4 WSIO Version 1, October 2013. *The
National Ecological Framework (NEF, see metadata for more information) is a GIS
based model of the connectivity of natural landscapes in the lower 48 United States.
It was developed to provide a guide for the protection of the natural ecosystem
processes that give us clean air, pure water and protected lands that are part of EPA’s
mission to protect. HUBS_NEF2001_PCT_WS
86 % CORRIDORS, National Ecological Framework2001, WS Ecological
Aquatic Condition /
Connectivity
The percent of a HUC12 that is categorized as a Corridor by the 2001 National
Ecological Framework (NEF)*. In the NEF Corridors are defined as linkages between
Hubs (Priority Ecological Areas greater than 5,000 acres). Corridors were determined
using a cost surface analysis to determine the least human disturbance pathway
between individual Hubs. Region 4 WSIO Version 1, October 2013. *The National
Ecological Framework (NEF, see metadata for more information) is a GIS based model
of the connectivity of natural landscapes in the lower 48 United States. It was
developed to provide a guide for the protection of the natural ecosystem processes
that give us clean air, pure water and protected lands that are part of EPA’s mission
to protect. CORRIDORS_NEF2001_PCT_WS
87 % Auxiliary Areas, NEF 2001, WS Ecological
Aquatic Condition /
Connectivity
The percent of a HUC12 that are auxiliary areas to the National Ecological Framework
(NEF)*. Auxiliary Areas are defined as natural land cover that are contiguous to the
NEF. Region 4 WSIO Version 1, October 2013. *The National Ecological Framework
(NEF, see metadata for more information) is a GIS based model of the connectivity of
natural landscapes in the lower 48 United States. It was developed to provide a guide
for the protection of the natural ecosystem processes that give us clean air, pure
water and protected lands that are part of EPA’s mission to protect. AUXAREA_NEF2001_PCT_WS
Page 16 of 57

Watershed Indicators WSIO version 1.3
Order Indicator_Name Type Component Description Field_Name
88 % N-Index06 Contiguous H2O, in Watershed Ecological
Aquatic Condition /
Connectivity
The percent of the HUC12 that is classified as natural cover, not urban or agricultural,
(N-index) and contiguous to water (as identified by the Water Mask*) in the
watershed. N-index land cover classifications include 'Barren Land (Rock/Sand/Clay)'
(code 31), 'Deciduous Forrest' (code 41), 'Evergreen Forest' (code 42), 'Mixed Forest'
(code 43), 'Shrub/Scrub' (code 52), 'Grassland/Herbaceous' (code 71), ' Woody
Wetlands' (code 90), and 'Emergent Herbaceous Wetlands' (code 95). Source data
used was NLCD2006 version 1, downloaded February 2011 (see metadata for more
information). N-index is consistent with the Analytical Tools Interface for Landscape
Assessments (ATtILA) version 2004. ATtILA user guide can be found here:
http://www.epa.gov/esd/land-sci/attila/pdf/user_guide.pdf. Region 4 WSIO Version
1, October 2013. *The Water Mask (see metadata for more information) is
determined using grid analysis to combine surface water features of NLCD2006 and
NHD Plus version 2. The combination of these two datasets represents surface water
and is referred to as the Water Mask. N_INDEX_06_CON_H2O_PCT_WS
89 % of Stream length contiguous to 2006 IC = 0% WS Ecological
Aquatic Condition /
Connectivity
The percent of HUC12 stream length contiguous to (flow through) zero percent
impervious cover. Source data used was NLCD2006 version 1 (see metadata for more
information) and NHD Plus Version 2 (http://www.horizon-
systems.com/NHDPlus/NHDPlusV2_home.php). Reference: Wickham, J. D.; Wade, T.
G.; Norton, D. J.; 2014; Spatial patterns of watershed impervious cover relative to
stream location; Ecological Indicators; Volume 40, May 2014, Pages 109–116. Region
4 WSIO Version 1, October 2013. STR_LGTH_PC_2006_IC_0_PC_WS
90 % Stream lgth contiguous 2006 IC; 0% < IC < 5% WS Ecological
Aquatic Condition /
Connectivity
The percent of HUC12 stream length contiguous to (flow through) impervious cover
greater than zero percent and less than 5 percent (0% < IC < 5%). Source data used
was NLCD2006 version 1 (see metadata for more information) and NHD Plus Version
2 (http://www.horizon-systems.com/NHDPlus/NHDPlusV2_home.php). Reference:
Wickham, J. D.; Wade, T. G.; Norton, D. J.; 2014; Spatial patterns of watershed
impervious cover relative to stream location; Ecological Indicators; Volume 40, May
2014, Pages 109–116. Region 4 WSIO Version 1, October 2013. STR_LGTH_PC_2006_IC_0_5PC_WS
91 % of Lake Shore Lgth within 30 m of 2006 IC =0% WS Ecological
Aquatic Condition /
Connectivity
The percent of HUC12 lake shore length within 30m of zero percent impervious
cover. Source data used was NLCD2006 version 1 (see metadata for more
information) and NHD Plus Version 2 (http://www.horizon-
systems.com/NHDPlus/NHDPlusV2_home.php). Reference: Wickham, J. D.; Wade, T.
G.; Norton, D. J.; 2014; Spatial patterns of watershed impervious cover relative to
stream location; Ecological Indicators; Volume 40, May 2014, Pages 109–116. Region
4 WSIO Version 1, October 2013. LAKE_SHORE_PC_2006_IC_0_PC_WS
92 % Lake Shore Lgth within 30 m, 2006 IC;0%<IC<5% WS Ecological
Aquatic Condition /
Connectivity
The percent of HUC12 lake shore length within 30m of impervious cover greater than
zero percent and less than 5 percent (0% < IC < 5%). Source data used was NLCD2006
version 1 (see metadata for more information) and NHD Plus Version 2
(http://www.horizon-systems.com/NHDPlus/NHDPlusV2_home.php). Reference:
Wickham, J. D.; Wade, T. G.; Norton, D. J.; 2014; Spatial patterns of watershed
impervious cover relative to stream location; Ecological Indicators; Volume 40, May
2014, Pages 109–116. Region 4 WSIO Version 1, October 2013. LAKE_SHORE_PC_2006_IC_0_5PC_WS
Page 17 of 57

Watershed Indicators WSIO version 1.3
Order Indicator_Name Type Component Description Field_Name
93 % Natural Cover Change,N-Index Chng 2001-06 WS Ecological
WS -Ecological
History
The percent of HUC12 change in natural land cover classifications, not urban or
agriculture, (N-index) from 2001 to 2006. Change was determined by comparing the
2001 and 2006 National Land Cover Change Datasets; version 1. N-index land cover
classifications include 'Barren Land (Rock/Sand/Clay)' (code 31), 'Deciduous Forrest'
(code 41), 'Evergreen Forest' (code 42), 'Mixed Forest' (code 43), 'Shrub/Scrub' (code
52), 'Grassland/Herbaceous' (code 71), ' Woody Wetlands' (code 90), and 'Emergent
Herbaceous Wetlands' (code 95). Source data used was NLCD2006 version 1,
downloaded February 2011. Citation: Fry, J., Xian, G., Jin, S., Dewitz, J., Homer, C.,
Yang, L., Barnes, C., Herold, N., and Wickham, J., 2011 (see metadata for more
information). N-index is consistent with the Analytical Tools Interface for Landscape
Assessments (ATtILA) version 2004. ATtILA user guide can be found here:
http://www.epa.gov/esd/land-sci/attila/pdf/user_guide.pdf. Region 4 WSIO Version
1, October 2013. N_INDEX_CHG_2001_06_PCT_WS
94 % Natural Cover Change,N-Index 2 Chng 2001-06 WS Ecological
WS -Ecological
History
The percent of HUC12 change in natural land cover classifications (not barren, urban,
or agriculture; N-index 2) from 2001 to 2006. Change was determined by comparing
the 2001 and 2006 National Land Cover Change Datasets; version 1. N-index 2 land
cover classifications include 'Deciduous Forrest' (code 41), 'Evergreen Forest' (code
42), 'Mixed Forest' (code 43), 'Shrub/Scrub' (code 52), 'Grassland/Herbaceous' (code
71), ' Woody Wetlands' (code 90), and 'Emergent Herbaceous Wetlands' (code 95).
Source data used was NLCD2006 version 1, downloaded February 2011. Citation: Fry,
J., Xian, G., Jin, S., Dewitz, J., Homer, C., Yang, L., Barnes, C., Herold, N., and Wickham,
J., 2011 (see metadata for more information). N-index 2 was modified from the
Analytical Tools Interface for Landscape Assessments (ATtILA) version 2004. ATtILA
user guide can be found here: http://www.epa.gov/esd/land-
sci/attila/pdf/user_guide.pdf. Region 4 WSIO Version 1, October 2013. N_INDEX2_CHG_2001_06_PCT_WS
95 % Wetlands Change 2001-06 WS Ecological
WS -Ecological
History
The percent of HUC12 change in wetland land cover classifications from 2001 to
2006. Change was determined by comparing the 2001 and 2006 National Land Cover
Change Datasets; version 1. Wetland land cover classifications include 'Woody
Wetlands' (code 90), and 'Emergent Herbaceous Wetlands' (code 95). Source data
used was NLCD2006 version 1, downloaded February 2011. Citation: Fry, J., Xian, G.,
Jin, S., Dewitz, J., Homer, C., Yang, L., Barnes, C., Herold, N., and Wickham, J., 2011
(see metadata for more information). Region 4 WSIO Version 1, October 2013. WETLAND_CHG_2001_06_PCT_WS
96 % Forest Change 2001-06 WS Ecological
WS -Ecological
History
The percent of HUC12 change in forest land cover classifications from 2001 to 2006.
Change was determined by comparing the 2001 and 2006 National Land Cover
Change Datasets; version 1. Forest land cover classifications include 'Deciduous
Forrest' (code 41), 'Evergreen Forest' (code 42), 'Mixed Forest' (code 43). Source data
used was NLCD2006 version 1, downloaded February 2011. Citation: Fry, J., Xian, G.,
Jin, S., Dewitz, J., Homer, C., Yang, L., Barnes, C., Herold, N., and Wickham, J., 2011
(see metadata for more information). Region 4 WSIO Version 1, October 2013. FOREST_CHG_2001_06_PCT_WS
Page 18 of 57

Watershed Indicators WSIO version 1.3
Order Indicator_Name Type Component Description Field_Name
97 % Woody Vegetation Change 2001-06 WS Ecological
WS -Ecological
History
The percent of HUC12 change in woody vegetation land cover classifications from
2001 to 2006. Change was determined by comparing the 2001 and 2006 National
Land Cover Change Datasets; version 1. Woody vegetation land cover classifications
include 'Deciduous Forrest' (code 41), 'Evergreen Forest' (code 42), 'Mixed Forest'
(code 43), 'Shrub/Scrub' (code 52), and 'Woody Wetlands' (code 90). Source data
used was NLCD2006 version 1, downloaded February 2011. Citation: Fry, J., Xian, G.,
Jin, S., Dewitz, J., Homer, C., Yang, L., Barnes, C., Herold, N., and Wickham, J., 2011
(see metadata for more information). Region 4 WSIO Version 1, October 2013. WOODY_CHG_2001_06_PCT_WS
98 % Natural Cover Change,N-Index Chng 2001-06 HCZ Ecological
HCZ -Ecological
History
The percent of HUC12 change in natural land cover classifications, not urban or
agriculture, (N-index) within the Hydrologically Connected Zone*. Change was
determined by comparing the 2001 and 2006 National Land Cover Change Datasets;
version 1. N-index land cover classifications include 'Barren Land (Rock/Sand/Clay)'
(code 31), 'Deciduous Forrest' (code 41), 'Evergreen Forest' (code 42), 'Mixed Forest'
(code 43), 'Shrub/Scrub' (code 52), 'Grassland/Herbaceous' (code 71), 'Woody
Wetlands' (code 90), and 'Emergent Herbaceous Wetlands' (code 95). Source data
used was NLCD2006 version 1, downloaded February 2011. Citation: Fry, J., Xian, G.,
Jin, S., Dewitz, J., Homer, C., Yang, L., Barnes, C., Herold, N., and Wickham, J., 2011
(see metadata for more information). N-index is consistent with the Analytical Tools
Interface for Landscape Assessments (ATtILA) version 2004. ATtILA user guide can be
found here: http://www.epa.gov/esd/land-sci/attila/pdf/user_guide.pdf. Region 4
WSIO Version 1, October 2013. *The Hydrologically Connected Zone (HCZ, see
metadata for more information) is determined using grid analysis to combine surface
water features from NLCD2006 and NHD Plus version 2. It also includes areas
contiguous to surface water that also has a wetness index value of 550 or greater.
The combination of these three datasets represents the Hydrologically Connected
Zone (HCZ). N_INDEX_CHG_2001_06_PCT_HZ
99 % Natural Cover Change,N-Index 2 Chng 2001-06 HCZ Ecological
HCZ -Ecological
History
The percent of HUC12 change in natural land cover classifications (not barren, urban,
or agriculture; N-index 2) within the Hydrologically Connected Zone*. Change was
determined by comparing the 2001 and 2006 National Land Cover Change Datasets;
version 1. N-index 2 land cover classifications include 'Deciduous Forrest' (code 41),
'Evergreen Forest' (code 42), 'Mixed Forest' (code 43), 'Shrub/Scrub' (code 52),
'Grassland/Herbaceous' (code 71), ' Woody Wetlands' (code 90), and 'Emergent
Herbaceous Wetlands' (code 95). Source data used was NLCD2006 version 1,
downloaded February 2011. Citation: Fry, J., Xian, G., Jin, S., Dewitz, J., Homer, C.,
Yang, L., Barnes, C., Herold, N., and Wickham, J., 2011 (see metadata for more
information). N-index 2 was modified from the Analytical Tools Interface for
Landscape Assessments (ATtILA) version 2004. ATtILA user guide can be found here:
http://www.epa.gov/esd/land-sci/attila/pdf/user_guide.pdf. Region 4 WSIO Version
1, October 2013. *The Hydrologically Connected Zone (HCZ, see metadata for more
information) is determined using grid analysis to combine surface water features
from NLCD2006 and NHD Plus version 2. It also includes areas contiguous to surface
water that also has a wetness index value of 550 or greater. The combination of these
three datasets represents the Hydrologically Connected Zone (HCZ). N_INDEX2_CHG_2001_06_PCT_HZ
Page 19 of 57
Watershed Indicators WSIO version 1.3
Order Indicator_Name Type Component Description Field_Name
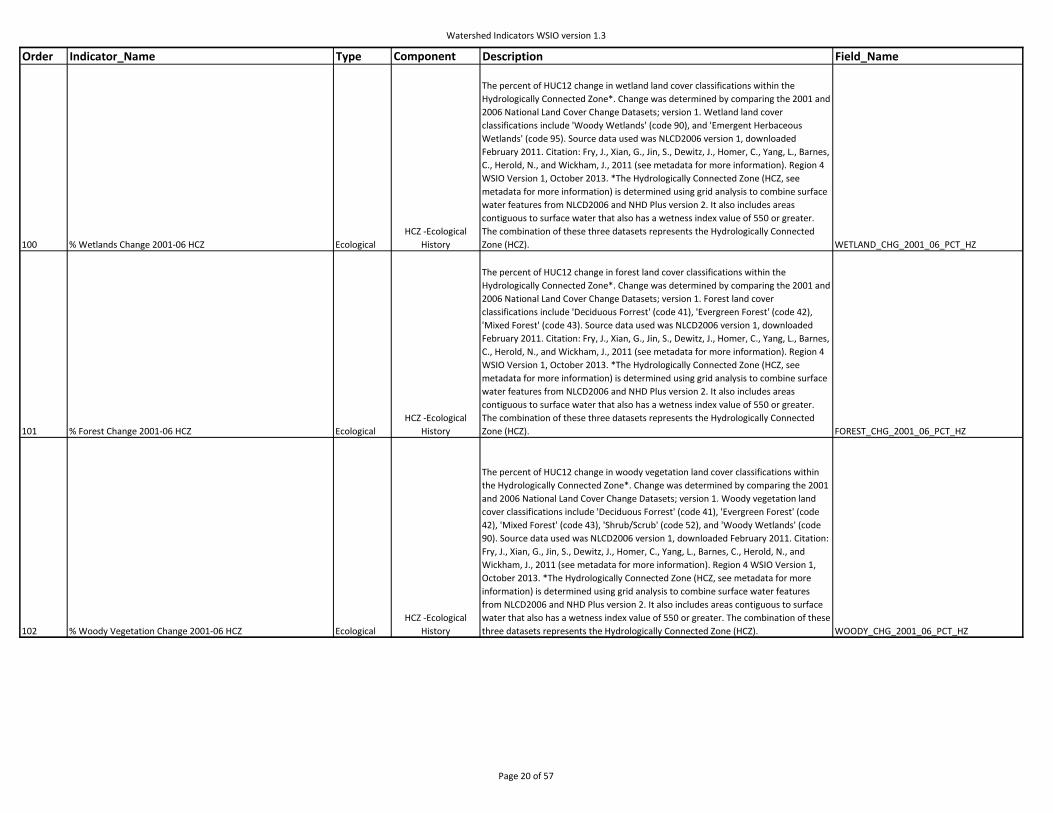
100 % Wetlands Change 2001-06 HCZ Ecological
HCZ -Ecological
History
The percent of HUC12 change in wetland land cover classifications within the
Hydrologically Connected Zone*. Change was determined by comparing the 2001 and
2006 National Land Cover Change Datasets; version 1. Wetland land cover
classifications include 'Woody Wetlands' (code 90), and 'Emergent Herbaceous
Wetlands' (code 95). Source data used was NLCD2006 version 1, downloaded
February 2011. Citation: Fry, J., Xian, G., Jin, S., Dewitz, J., Homer, C., Yang, L., Barnes,
C., Herold, N., and Wickham, J., 2011 (see metadata for more information). Region 4
WSIO Version 1, October 2013. *The Hydrologically Connected Zone (HCZ, see
metadata for more information) is determined using grid analysis to combine surface
water features from NLCD2006 and NHD Plus version 2. It also includes areas
contiguous to surface water that also has a wetness index value of 550 or greater.
The combination of these three datasets represents the Hydrologically Connected
Zone (HCZ). WETLAND_CHG_2001_06_PCT_HZ
101 % Forest Change 2001-06 HCZ Ecological
HCZ -Ecological
History
The percent of HUC12 change in forest land cover classifications within the
Hydrologically Connected Zone*. Change was determined by comparing the 2001 and
2006 National Land Cover Change Datasets; version 1. Forest land cover
classifications include 'Deciduous Forrest' (code 41), 'Evergreen Forest' (code 42),
'Mixed Forest' (code 43). Source data used was NLCD2006 version 1, downloaded
February 2011. Citation: Fry, J., Xian, G., Jin, S., Dewitz, J., Homer, C., Yang, L., Barnes,
C., Herold, N., and Wickham, J., 2011 (see metadata for more information). Region 4
WSIO Version 1, October 2013. *The Hydrologically Connected Zone (HCZ, see
metadata for more information) is determined using grid analysis to combine surface
water features from NLCD2006 and NHD Plus version 2. It also includes areas
contiguous to surface water that also has a wetness index value of 550 or greater.
The combination of these three datasets represents the Hydrologically Connected
Zone (HCZ). FOREST_CHG_2001_06_PCT_HZ
102 % Woody Vegetation Change 2001-06 HCZ Ecological
HCZ -Ecological
History
The percent of HUC12 change in woody vegetation land cover classifications within
the Hydrologically Connected Zone*. Change was determined by comparing the 2001
and 2006 National Land Cover Change Datasets; version 1. Woody vegetation land
cover classifications include 'Deciduous Forrest' (code 41), 'Evergreen Forest' (code
42), 'Mixed Forest' (code 43), 'Shrub/Scrub' (code 52), and 'Woody Wetlands' (code
90). Source data used was NLCD2006 version 1, downloaded February 2011. Citation:
Fry, J., Xian, G., Jin, S., Dewitz, J., Homer, C., Yang, L., Barnes, C., Herold, N., and
Wickham, J., 2011 (see metadata for more information). Region 4 WSIO Version 1,
October 2013. *The Hydrologically Connected Zone (HCZ, see metadata for more
information) is determined using grid analysis to combine surface water features
from NLCD2006 and NHD Plus version 2. It also includes areas contiguous to surface
water that also has a wetness index value of 550 or greater. The combination of these
three datasets represents the Hydrologically Connected Zone (HCZ). WOODY_CHG_2001_06_PCT_HZ
Page 20 of 57

Watershed Indicators WSIO version 1.3
Order Indicator_Name Type Component Description Field_Name
103 % Natural Cover Change,N-Index Chng 2001-06 RZ Ecological
RZ -Ecological
History
The percent of HUC12 change in natural land cover classifications, not urban or
agriculture, (N-index) within the Riparian Zone*. Change was determined by
comparing the 2001 and 2006 National Land Cover Change Datasets; version 1. N-
index land cover classifications include 'Barren Land (Rock/Sand/Clay)' (code 31),
'Deciduous Forrest' (code 41), 'Evergreen Forest' (code 42), 'Mixed Forest' (code 43),
'Shrub/Scrub' (code 52), 'Grassland/Herbaceous' (code 71), 'Woody Wetlands' (code
90), and 'Emergent Herbaceous Wetlands' (code 95). Source data used was
NLCD2006 version 1, downloaded February 2011. Citation: Fry, J., Xian, G., Jin, S.,
Dewitz, J., Homer, C., Yang, L., Barnes, C., Herold, N., and Wickham, J., 2011 (see
metadata for more information). N-index is consistent with the Analytical Tools
Interface for Landscape Assessments (ATtILA) version 2004. ATtILA user guide can be
found here: http://www.epa.gov/esd/land-sci/attila/pdf/user_guide.pdf. Region 4
WSIO Version 1, October 2013. *The Riparian Zone (RZ, see metadata for more
information) is determined using grid analysis to combine surface water features
from NLCD2006 and NHD Plus version 2; then an approximate 100 meter buffer is
placed around these features. The combination of these two datasets and all cells
with a distance of 108 meters or less from surface water are included in the Riparian
Zone (RZ). N_INDEX_CHG_2001_06_PCT_RZ
104 % Natural Cover Change,N-Index 2 Chng 2001-06 RZ Ecological
RZ -Ecological
History
The percent of HUC12 change in natural land cover classifications (not barren, urban,
or agriculture; N-index 2) within the Riparian Zone*. Change was determined by
comparing the 2001 and 2006 National Land Cover Change Datasets; version 1. N-
index 2 land cover classifications include 'Deciduous Forrest' (code 41), 'Evergreen
Forest' (code 42), 'Mixed Forest' (code 43), 'Shrub/Scrub' (code 52),
'Grassland/Herbaceous' (code 71), ' Woody Wetlands' (code 90), and 'Emergent
Herbaceous Wetlands' (code 95). Source data used was NLCD2006 version 1,
downloaded February 2011. Citation: Fry, J., Xian, G., Jin, S., Dewitz, J., Homer, C.,
Yang, L., Barnes, C., Herold, N., and Wickham, J., 2011 (see metadata for more
information). N-index 2 was modified from the Analytical Tools Interface for
Landscape Assessments (ATtILA) version 2004. ATtILA user guide can be found here:
http://www.epa.gov/esd/land-sci/attila/pdf/user_guide.pdf. Region 4 WSIO Version
1, October 2013. *The Riparian Zone (RZ, see metadata for more information) is
determined using grid analysis to combine surface water features from NLCD2006
and NHD Plus version 2; then an approximate 100 meter buffer is placed around
these features. The combination of these two datasets and all cells with a distance of
108 meters or less from surface water are included in the Riparian Zone (RZ). N_INDEX2_CHG_2001_06_PCT_RZ
Page 21 of 57

Watershed Indicators WSIO version 1.3
Order Indicator_Name Type Component Description Field_Name
105 % Wetlands Change 2001-06 RZ Ecological
RZ -Ecological
History
The percent of HUC12 change in wetland land cover classifications within the Riparian
Zone*. Change was determined by comparing the 2001 and 2006 National Land
Cover Change Datasets; version 1. Wetland land cover classifications include 'Woody
Wetlands' (code 90), and 'Emergent Herbaceous Wetlands' (code 95). Source data
used was NLCD2006 version 1, downloaded February 2011. Citation: Fry, J., Xian, G.,
Jin, S., Dewitz, J., Homer, C., Yang, L., Barnes, C., Herold, N., and Wickham, J., 2011
(see metadata for more information). Region 4 WSIO Version 1, October 2013. *The
Riparian Zone (RZ, see metadata for more information) is determined using grid
analysis to combine surface water features from NLCD2006 and NHD Plus version 2;
then an approximate 100 meter buffer is placed around these features. The
combination of these two datasets and all cells with a distance of 108 meters or less
from surface water are included in the Riparian Zone (RZ). WETLAND_CHG_2001_06_PCT_RZ
106 % Forest Change 2001-06 RZ Ecological
RZ -Ecological
History
The percent of HUC12 change in forest land cover classifications within the Riparian
Zone*. Change was determined by comparing the 2001 and 2006 National Land
Cover Change Datasets; version 1. Forest land cover classifications include 'Deciduous
Forrest' (code 41), 'Evergreen Forest' (code 42), 'Mixed Forest' (code 43). Source data
used was NLCD2006 version 1, downloaded February 2011. Citation: Fry, J., Xian, G.,
Jin, S., Dewitz, J., Homer, C., Yang, L., Barnes, C., Herold, N., and Wickham, J., 2011
(see metadata for more information). Region 4 WSIO Version 1, October 2013. *The
Riparian Zone (RZ, see metadata for more information) is determined using grid
analysis to combine surface water features from NLCD2006 and NHD Plus version 2;
then an approximate 100 meter buffer is placed around these features. The
combination of these two datasets and all cells with a distance of 108 meters or less
from surface water are included in the Riparian Zone (RZ). FOREST_CHG_2001_06_PCT_RZ
107 % Woody Vegetation Change 2001-06 RZ Ecological
RZ -Ecological
History
The percent of HUC12 change in woody vegetation land cover classifications within
the Riparian Zone*. Change was determined by comparing the 2001 and 2006
National Land Cover Change Datasets; version 1. Woody vegetation land cover
classifications include 'Deciduous Forrest' (code 41), 'Evergreen Forest' (code 42),
'Mixed Forest' (code 43), 'Shrub/Scrub' (code 52), and 'Woody Wetlands' (code 90).
Source data used was NLCD2006 version 1, downloaded February 2011. Citation: Fry,
J., Xian, G., Jin, S., Dewitz, J., Homer, C., Yang, L., Barnes, C., Herold, N., and Wickham,
J., 2011 (see metadata for more information). Region 4 WSIO Version 1, October
2013. *The Riparian Zone (RZ, see metadata for more information) is determined
using grid analysis to combine surface water features from NLCD2006 and NHD Plus
version 2; then an approximate 100 meter buffer is placed around these features.
The combination of these two datasets and all cells with a distance of 108 meters or
less from surface water are included in the Riparian Zone (RZ). WOODY_CHG_2001_06_PCT_RZ
108 Empower Density 2001, Median Value in Watershed Stressor
Watershed
Disturbance
The median empower density* value in a HUC12 area per year. *Empower density is
the non-renewable emergy flow through a watershed. Source data used was
NLCD2006 version 1, downloaded February 2011 (see metadata for more
information). Region 4 WSIO Version 1, October 2013. EMPOWER_DENSITY_2001_MEDIAN_WS
109 Empower Density 2001, Mean Value in Watershed Stressor
Watershed
Disturbance
The mean empower density* value of a HUC12 area per year. *Empower density is
the non-renewable emergy flow through a watershed. Source data used was
NLCD2006 version 1, downloaded February 2011 (see metadata for more
information). Region 4 WSIO Version 1, October 2013. EMPOWER_DENSITY_2001_MEAN_WS
Page 22 of 57
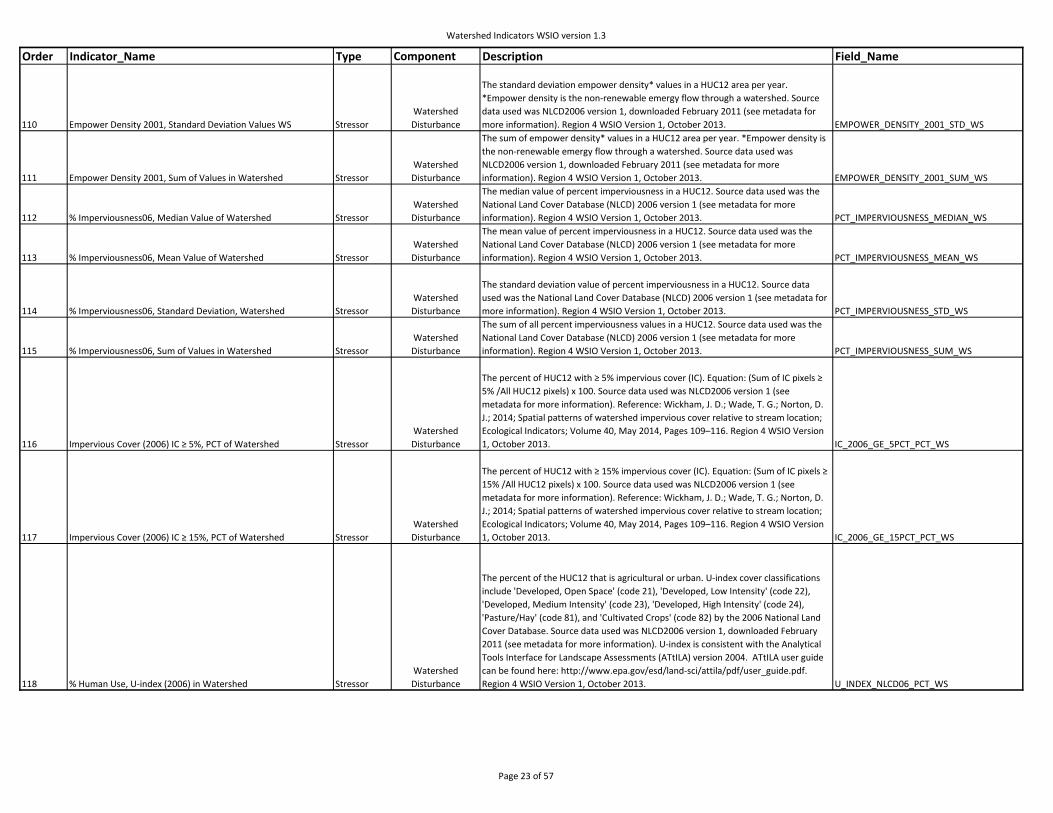
Watershed Indicators WSIO version 1.3
Order Indicator_Name Type Component Description Field_Name
110 Empower Density 2001, Standard Deviation Values WS Stressor
Watershed
Disturbance
The standard deviation empower density* values in a HUC12 area per year.
*Empower density is the non-renewable emergy flow through a watershed. Source
data used was NLCD2006 version 1, downloaded February 2011 (see metadata for
more information). Region 4 WSIO Version 1, October 2013. EMPOWER_DENSITY_2001_STD_WS
111 Empower Density 2001, Sum of Values in Watershed Stressor
Watershed
Disturbance
The sum of empower density* values in a HUC12 area per year. *Empower density is
the non-renewable emergy flow through a watershed. Source data used was
NLCD2006 version 1, downloaded February 2011 (see metadata for more
information). Region 4 WSIO Version 1, October 2013. EMPOWER_DENSITY_2001_SUM_WS
112 % Imperviousness06, Median Value of Watershed Stressor
Watershed
Disturbance
The median value of percent imperviousness in a HUC12. Source data used was the
National Land Cover Database (NLCD) 2006 version 1 (see metadata for more
information). Region 4 WSIO Version 1, October 2013. PCT_IMPERVIOUSNESS_MEDIAN_WS
113 % Imperviousness06, Mean Value of Watershed Stressor
Watershed
Disturbance
The mean value of percent imperviousness in a HUC12. Source data used was the
National Land Cover Database (NLCD) 2006 version 1 (see metadata for more
information). Region 4 WSIO Version 1, October 2013. PCT_IMPERVIOUSNESS_MEAN_WS
114 % Imperviousness06, Standard Deviation, Watershed Stressor
Watershed
Disturbance
The standard deviation value of percent imperviousness in a HUC12. Source data
used was the National Land Cover Database (NLCD) 2006 version 1 (see metadata for
more information). Region 4 WSIO Version 1, October 2013. PCT_IMPERVIOUSNESS_STD_WS
115 % Imperviousness06, Sum of Values in Watershed Stressor
Watershed
Disturbance
The sum of all percent imperviousness values in a HUC12. Source data used was the
National Land Cover Database (NLCD) 2006 version 1 (see metadata for more
information). Region 4 WSIO Version 1, October 2013. PCT_IMPERVIOUSNESS_SUM_WS
116 Impervious Cover (2006) IC ≥ 5%, PCT of Watershed Stressor
Watershed
Disturbance
The percent of HUC12 with ≥ 5% impervious cover (IC). Equation: (Sum of IC pixels ≥
5% /All HUC12 pixels) x 100. Source data used was NLCD2006 version 1 (see
metadata for more information). Reference: Wickham, J. D.; Wade, T. G.; Norton, D.
J.; 2014; Spatial patterns of watershed impervious cover relative to stream location;
Ecological Indicators; Volume 40, May 2014, Pages 109–116. Region 4 WSIO Version
1, October 2013. IC_2006_GE_5PCT_PCT_WS
117 Impervious Cover (2006) IC ≥ 15%, PCT of Watershed Stressor
Watershed
Disturbance
The percent of HUC12 with ≥ 15% impervious cover (IC). Equation: (Sum of IC pixels ≥
15% /All HUC12 pixels) x 100. Source data used was NLCD2006 version 1 (see
metadata for more information). Reference: Wickham, J. D.; Wade, T. G.; Norton, D.
J.; 2014; Spatial patterns of watershed impervious cover relative to stream location;
Ecological Indicators; Volume 40, May 2014, Pages 109–116. Region 4 WSIO Version
1, October 2013. IC_2006_GE_15PCT_PCT_WS
118 % Human Use, U-index (2006) in Watershed Stressor
Watershed
Disturbance
The percent of the HUC12 that is agricultural or urban. U-index cover classifications
include 'Developed, Open Space' (code 21), 'Developed, Low Intensity' (code 22),
'Developed, Medium Intensity' (code 23), 'Developed, High Intensity' (code 24),
'Pasture/Hay' (code 81), and 'Cultivated Crops' (code 82) by the 2006 National Land
Cover Database. Source data used was NLCD2006 version 1, downloaded February
2011 (see metadata for more information). U-index is consistent with the Analytical
Tools Interface for Landscape Assessments (ATtILA) version 2004. ATtILA user guide
can be found here: http://www.epa.gov/esd/land-sci/attila/pdf/user_guide.pdf.
Region 4 WSIO Version 1, October 2013. U_INDEX_NLCD06_PCT_WS
Page 23 of 57
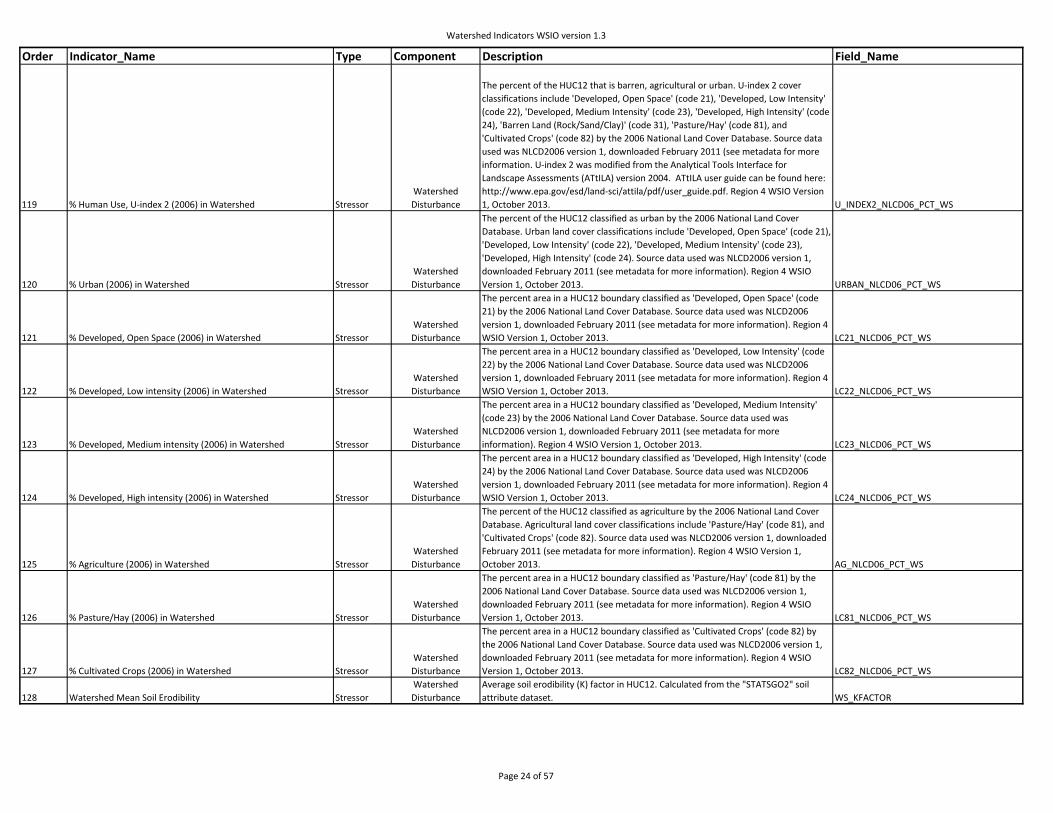
Watershed Indicators WSIO version 1.3
Order Indicator_Name Type Component Description Field_Name
119 % Human Use, U-index 2 (2006) in Watershed Stressor
Watershed
Disturbance
The percent of the HUC12 that is barren, agricultural or urban. U-index 2 cover
classifications include 'Developed, Open Space' (code 21), 'Developed, Low Intensity'
(code 22), 'Developed, Medium Intensity' (code 23), 'Developed, High Intensity' (code
24), 'Barren Land (Rock/Sand/Clay)' (code 31), 'Pasture/Hay' (code 81), and
'Cultivated Crops' (code 82) by the 2006 National Land Cover Database. Source data
used was NLCD2006 version 1, downloaded February 2011 (see metadata for more
information. U-index 2 was modified from the Analytical Tools Interface for
Landscape Assessments (ATtILA) version 2004. ATtILA user guide can be found here:
http://www.epa.gov/esd/land-sci/attila/pdf/user_guide.pdf. Region 4 WSIO Version
1, October 2013. U_INDEX2_NLCD06_PCT_WS
120 % Urban (2006) in Watershed Stressor
Watershed
Disturbance
The percent of the HUC12 classified as urban by the 2006 National Land Cover
Database. Urban land cover classifications include 'Developed, Open Space' (code 21),
'Developed, Low Intensity' (code 22), 'Developed, Medium Intensity' (code 23),
'Developed, High Intensity' (code 24). Source data used was NLCD2006 version 1,
downloaded February 2011 (see metadata for more information). Region 4 WSIO
Version 1, October 2013. URBAN_NLCD06_PCT_WS
121 % Developed, Open Space (2006) in Watershed Stressor
Watershed
Disturbance
The percent area in a HUC12 boundary classified as 'Developed, Open Space' (code
21) by the 2006 National Land Cover Database. Source data used was NLCD2006
version 1, downloaded February 2011 (see metadata for more information). Region 4
WSIO Version 1, October 2013. LC21_NLCD06_PCT_WS
122 % Developed, Low intensity (2006) in Watershed Stressor
Watershed
Disturbance
The percent area in a HUC12 boundary classified as 'Developed, Low Intensity' (code
22) by the 2006 National Land Cover Database. Source data used was NLCD2006
version 1, downloaded February 2011 (see metadata for more information). Region 4
WSIO Version 1, October 2013. LC22_NLCD06_PCT_WS
123 % Developed, Medium intensity (2006) in Watershed Stressor
Watershed
Disturbance
The percent area in a HUC12 boundary classified as 'Developed, Medium Intensity'
(code 23) by the 2006 National Land Cover Database. Source data used was
NLCD2006 version 1, downloaded February 2011 (see metadata for more
information). Region 4 WSIO Version 1, October 2013. LC23_NLCD06_PCT_WS
124 % Developed, High intensity (2006) in Watershed Stressor
Watershed
Disturbance
The percent area in a HUC12 boundary classified as 'Developed, High Intensity' (code
24) by the 2006 National Land Cover Database. Source data used was NLCD2006
version 1, downloaded February 2011 (see metadata for more information). Region 4
WSIO Version 1, October 2013. LC24_NLCD06_PCT_WS
125 % Agriculture (2006) in Watershed Stressor
Watershed
Disturbance
The percent of the HUC12 classified as agriculture by the 2006 National Land Cover
Database. Agricultural land cover classifications include 'Pasture/Hay' (code 81), and
'Cultivated Crops' (code 82). Source data used was NLCD2006 version 1, downloaded
February 2011 (see metadata for more information). Region 4 WSIO Version 1,
October 2013. AG_NLCD06_PCT_WS
126 % Pasture/Hay (2006) in Watershed Stressor
Watershed
Disturbance
The percent area in a HUC12 boundary classified as 'Pasture/Hay' (code 81) by the
2006 National Land Cover Database. Source data used was NLCD2006 version 1,
downloaded February 2011 (see metadata for more information). Region 4 WSIO
Version 1, October 2013. LC81_NLCD06_PCT_WS
127 % Cultivated Crops (2006) in Watershed Stressor
Watershed
Disturbance
The percent area in a HUC12 boundary classified as 'Cultivated Crops' (code 82) by
the 2006 National Land Cover Database. Source data used was NLCD2006 version 1,
downloaded February 2011 (see metadata for more information). Region 4 WSIO
Version 1, October 2013. LC82_NLCD06_PCT_WS
128 Watershed Mean Soil Erodibility Stressor
Watershed
Disturbance
Average soil erodibility (K) factor in HUC12. Calculated from the "STATSGO2" soil
attribute dataset. WS_KFACTOR
Page 24 of 57

Watershed Indicators WSIO version 1.3
Order Indicator_Name Type Component Description Field_Name
129 Percent agriculture on hydric soil WS Stressor
Watershed
Disturbance
The percentage of land managed for agriculture that has hydric soils within each
HUC12. This includes all land dedicated to the production of crops, but excludes land
managed for pasture. Metadata can be found here:
https://edg.epa.gov/metadata/catalog/search/resource/details.page?uuid=%7B1671
13DA-E941-4CB3-8E93-8FE2600C08DA%7D. This dataset was created through the
EnviroAtlas development effort. EnviroAtlas is a collection of interactive tools and
resources that allows users to explore the many benefits people receive from nature,
often referred to as ecosystem services. Additional information can be found here:
http://enviroatlas.epa.gov/enviroatlas/atlas.html and
http://enviroatlas.epa.gov/EnviroAtlas/DataFactSheets. Method: The EnviroAtlas
HUC12 table was translated to WBD HUC12s (August 2014). Region 4 WSIO Version 1. AG_HYDRIC_PCT_WS
130 Road Density 2003, Median Value (mi /sq mi) WS Stressor
Watershed
Disturbance
The median road density (mi/sqmi) value in a HUC12. Source data used was 2003
ESRI Streetmap (See metadata for more information). Region 4 WSIO Version 1,
October 2013. ROAD_DENSITY_2003_MEDIAN_WS
131 Road Density 2003, Mean Value (mi /sq mi) WS Stressor
Watershed
Disturbance
The mean road density (mi/sqmi) value in a HUC12. Source data used was 2003 ESRI
Streetmap (See metadata for more information). Region 4 WSIO Version 1, October
2013. ROAD_DENSITY_2003_MEAN_WS
132 Road Density 2003,Standard Deviation(mi /sq mi) WS Stressor
Watershed
Disturbance
The standard deviation road density (mi/sqmi) value in a HUC12. Source data used
was 2003 ESRI Streetmap. Region 4 WSIO Version 1, October 2013. ROAD_DENSITY_2003_STD_WS
133 Road Density 2003, Sum of Values (mi /sq mi) in WS Stressor
Watershed
Disturbance
The sum of all road density (mi/sqmi) values in a HUC12. Source data used was 2003
ESRI Streetmap (See metadata for more information). Region 4 WSIO Version 1,
October 2013. ROAD_DENSITY_2003_SUM_WS
134 Empower Density 2001, Mean Value in HCZ Stressor
HCZ -Corridor
Disturbance
The mean empower density value that occurs in the *Hydrologically Connected Zone
of a HUC12 per year. Empower density is the non-renewable emergy flow through a
watershed. *The Hydrologically Connected Zone (HCZ, see metadata for more
information) is determined using grid analysis to combine surface water features of
three datasets. First, the surface water features from the 2006 National Land Cover
Database (NLCD). Features included are 'Open Water' (code 11), 'Woody Wetlands'
(code 90) and 'Emergent Herbaceous Wetlands' (code 95). Source data used was the
NLCD2006 version 1 (see metadata for more information). Second, the flowline and
waterbody features as represented in the catseed grid from the National
Hydrography Dataset (NHD) Plus version 2. Source data used was NHD Plus Version
2.1, downloaded October 31, 2012 (see metadata for more information). The
combination of these two datasets represents surface water and is referred to as the
‘Water Mask’ (see metadata for more information). Third, all areas contiguous to
surface water that also has a wetness index value of 550 or greater. The wetness
index, also known as the compound topographic index (CTI), is a steady state wetness
index. It is commonly used to quantify topographic control on hydrological processes
(see metadata for more information). The combination of these three datasets
represents the Hydrologically Connected Zone (HCZ). Region 4 WSIO Version 1,
October 2013. EMPOWER_DENSITY_2001_MEAN_HZ
Page 25 of 57

Watershed Indicators WSIO version 1.3
Order Indicator_Name Type Component Description Field_Name
135 Empower Density 2001, Median Value in HCZ Stressor
HCZ -Corridor
Disturbance
The median empower density value that occurs in the *Hydrologically Connected
Zone of a HUC12 per year. Empower density is the non-renewable emergy flow
through a watershed. The Hydrologically Connected Zone (HCZ, see metadata for
more information) is determined using grid analysis to combine surface water
features of three datasets. First, the surface water features from the 2006 National
Land Cover Database (NLCD). Features included are 'Open Water' (code 11), 'Woody
Wetlands' (code 90) and 'Emergent Herbaceous Wetlands' (code 95). Source data
used was the NLCD2006 version 1 (see metadata for more information). Second, the
flowline and waterbody features as represented in the catseed grid from the National
Hydrography Dataset (NHD) Plus version 2. Source data used was NHD Plus Version
2.1, downloaded October 31, 2012 (see metadata for more information). The
combination of these two datasets represents surface water and is referred to as the
‘Water Mask’ (see metadata for more information). Third, all areas contiguous to
surface water that also has a wetness index value of 550 or greater. The wetness
index, also known as the compound topographic index (CTI), is a steady state wetness
index. It is commonly used to quantify topographic control on hydrological processes
(see metadata for more information). The combination of these three datasets
represents the Hydrologically Connected Zone (HCZ). Region 4 WSIO Version 1,
October 2013. EMPOWER_DENSITY_2001_MEDIAN_HZ
136 Empower Density 2001,Standard Deviation Values HCZ Stressor
HCZ -Corridor
Disturbance
The standard deviation empower density values that occur in the *Hydrologically
Connected Zone of a HUC12 per year. Empower density is the non-renewable emergy
flow through a watershed. The Hydrologically Connected Zone (HCZ, see metadata
for more information) is determined using grid analysis to combine surface water
features of three datasets. First, the surface water features from the 2006 National
Land Cover Database (NLCD). Features included are 'Open Water' (code 11), 'Woody
Wetlands' (code 90) and 'Emergent Herbaceous Wetlands' (code 95). Source data
used was the NLCD2006 version 1 (see metadata for more information). Second, the
flowline and waterbody features as represented in the catseed grid from the National
Hydrography Dataset (NHD) Plus version 2. Source data used was NHD Plus Version
2.1, downloaded October 31, 2012 (see metadata for more information). The
combination of these two datasets represents surface water and is referred to as the
‘Water Mask’ (see metadata for more information). Third, all areas contiguous to
surface water that also has a wetness index value of 550 or greater. The wetness
index, also known as the compound topographic index (CTI), is a steady state wetness
index. It is commonly used to quantify topographic control on hydrological processes
(see metadata for more information). The combination of these three datasets
represents the Hydrologically Connected Zone (HCZ). Region 4 WSIO Version 1,
October 2013. EMPOWER_DENSITY_2001_STD_HZ
Page 26 of 57

Watershed Indicators WSIO version 1.3
Order Indicator_Name Type Component Description Field_Name
137 Empower Density 2001, Sum of Values in HCZ Stressor
HCZ -Corridor
Disturbance
The sum of empower density values that occur in the *Hydrologically Connected
Zone of a HUC12 per year. Empower density is the non-renewable emergy flow
through a watershed. The Hydrologically Connected Zone (HCZ, see metadata for
more information) is determined using grid analysis to combine surface water
features of three datasets. First, the surface water features from the 2006 National
Land Cover Database (NLCD). Features included are 'Open Water' (code 11), 'Woody
Wetlands' (code 90) and 'Emergent Herbaceous Wetlands' (code 95). Source data
used was the NLCD2006 version 1 (see metadata for more information). Second, the
flowline and waterbody features as represented in the catseed grid from the National
Hydrography Dataset (NHD) Plus version 2. Source data used was NHD Plus Version
2.1, downloaded October 31, 2012 (see metadata for more information). The
combination of these two datasets represents surface water and is referred to as the
‘Water Mask’ (see metadata for more information). Third, all areas contiguous to
surface water that also has a wetness index value of 550 or greater. The wetness
index, also known as the compound topographic index (CTI), is a steady state wetness
index. It is commonly used to quantify topographic control on hydrological processes
(see metadata for more information). The combination of these three datasets
represents the Hydrologically Connected Zone (HCZ). Region 4 WSIO Version 1,
October 2013. EMPOWER_DENSITY_2001_SUM_HZ
138 % Human Use, U-index (2006) in HCZ Stressor
HCZ -Corridor
Disturbance
The percent of the HUC12 that is within the Hydrologically Connected Zone* and
classified as agricultural or urban. U-index cover classifications include 'Developed,
Open Space' (code 21), 'Developed, Low Intensity' (code 22), 'Developed, Medium
Intensity' (code 23), 'Developed, High Intensity' (code 24), 'Pasture/Hay' (code 81),
and 'Cultivated Crops' (code 82) by the 2006 National Land Cover Database. Source
data used was NLCD2006 version 1, downloaded February 2011 (see metadata for
more information). U-index is consistent with the Analytical Tools Interface for
Landscape Assessments (ATtILA) version 2004. ATtILA user guide can be found here:
http://www.epa.gov/esd/land-sci/attila/pdf/user_guide.pdf. Region 4 WSIO Version
1, October 2013. *The Hydrologically Connected Zone (HCZ, see metadata for more
information) is determined using grid analysis to combine surface water features
from NLCD2006 and NHD Plus version 2. It also includes areas contiguous to surface
water that also has a wetness index value of 550 or greater. The combination of these
three datasets represents the Hydrologically Connected Zone (HCZ). U_INDEX_NLCD06_PCT_HZ
Page 27 of 57

Watershed Indicators WSIO version 1.3
Order Indicator_Name Type Component Description Field_Name
139 % Human Use, U-index 2 (2006) in HCZ Stressor
HCZ -Corridor
Disturbance
The percent of the HUC12 that is within the Hydrologically Connected Zone* and
classified as barren, agricultural or urban. U-index 2 cover classifications include
'Developed, Open Space' (code 21), 'Developed, Low Intensity' (code 22), 'Developed,
Medium Intensity' (code 23), 'Developed, High Intensity' (code 24), 'Barren Land
(Rock/Sand/Clay)' (code 31), 'Pasture/Hay' (code 81), and 'Cultivated Crops' (code 82)
by the 2006 National Land Cover Database. Source data used was NLCD2006 version
1, downloaded February 2011 (see metadata for more information). U-index 2 was
modified from the Analytical Tools Interface for Landscape Assessments (ATtILA)
version 2004. ATtILA user guide can be found here: http://www.epa.gov/esd/land-
sci/attila/pdf/user_guide.pdf. Region 4 WSIO Version 1, October 2013. *The
Hydrologically Connected Zone (HCZ, see metadata for more information) is
determined using grid analysis to combine surface water features from NLCD2006
and NHD Plus version 2. It also includes areas contiguous to surface water that also
has a wetness index value of 550 or greater. The combination of these three datasets
represents the Hydrologically Connected Zone (HCZ). U_INDEX2_NLCD06_PCT_HZ
140 % Urban (2006) in HCZ Stressor
HCZ -Corridor
Disturbance
The percent of the HUC12 that is within the Hydrologically Connected Zone* and
classified as urban by the 2006 National Land Cover Database. Urban land cover
classifications include 'Developed, Open Space' (code 21), 'Developed, Low Intensity'
(code 22), 'Developed, Medium Intensity' (code 23), 'Developed, High Intensity' (code
24). Source data used was NLCD2006 version 1, downloaded February 2011 (see
metadata for more information). Region 4 WSIO Version 1, October 2013. *The
Hydrologically Connected Zone (HCZ, see metadata for more information) is
determined using grid analysis to combine surface water features from NLCD2006
and NHD Plus version 2. It also includes areas contiguous to surface water that also
has a wetness index value of 550 or greater. The combination of these three datasets
represents the Hydrologically Connected Zone (HCZ). URBAN_NLCD06_PCT_HZ
141 % Agriculture (2006) in HCZ Stressor
HCZ -Corridor
Disturbance
The percent of the HUC12 that is within the Hydrologically Connected Zone* and
classified as agriculture by the 2006 National Land Cover Database. Agricultural land
cover classifications include 'Pasture/Hay' (code 81), and 'Cultivated Crops' (code 82).
Source data used was NLCD2006 version 1, downloaded February 2011 (see
metadata for more information). Region 4 WSIO Version 1, October 2013. *The
Hydrologically Connected Zone (HCZ, see metadata for more information) is
determined using grid analysis to combine surface water features from NLCD2006
and NHD Plus version 2. It also includes areas contiguous to surface water that also
has a wetness index value of 550 or greater. The combination of these three datasets
represents the Hydrologically Connected Zone (HCZ). AG_NLCD06_PCT_HZ
Page 28 of 57

Watershed Indicators WSIO version 1.3
Order Indicator_Name Type Component Description Field_Name
142 % Pasture/Hay (2006) in HCZ Stressor
HCZ -Corridor
Disturbance
The percent area of the HUC12 boundary that is within the Hydrologically Connected
Zone* and classified as 'Pasture/Hay' (code 81) by the 2006 National Land Cover
Database. Source data used was NLCD2006 version 1, downloaded February 2011
(see metadata for more information). Region 4 WSIO Version 1, October 2013. *The
Hydrologically Connected Zone (HCZ, see metadata for more information) is
determined using grid analysis to combine surface water features from NLCD2006
and NHD Plus version 2. It also includes areas contiguous to surface water that also
has a wetness index value of 550 or greater. The combination of these three datasets
represents the Hydrologically Connected Zone (HCZ). LC81_NLCD06_PCT_HZ
143 % Cultivated Crops (2006) in HCZ Stressor
HCZ -Corridor
Disturbance
The percent area of the HUC12 boundary that is within the Hydrologically Connected
Zone* and classified as 'Cultivated Crops' (code 82) by the 2006 National Land Cover
Database. Source data used was NLCD2006 version 1, downloaded February 2011
(see metadata for more information). Region 4 WSIO Version 1, October 2013. *The
Hydrologically Connected Zone (HCZ, see metadata for more information) is
determined using grid analysis to combine surface water features from NLCD2006
and NHD Plus version 2. It also includes areas contiguous to surface water that also
has a wetness index value of 550 or greater. The combination of these three datasets
represents the Hydrologically Connected Zone (HCZ). LC82_NLCD06_PCT_HZ
144 HCZ Mean Soil Erodibility Stressor
HCZ -Corridor
Disturbance
Average soil erodibility (K) factor in HCZ. Calculated from the "STATSGO2 "soil
attribute dataset. HCZ_KFACTOR
145 Road Density 2003, Median Value (mi /sq mi) HCZ Stressor
HCZ -Corridor
Disturbance
The median value for road density (mi/sq mi) of a HUC12 that is within the
Hydrologically Connected Zone*. Source data used was 2010 ESRI Streetmap
downloaded August 2012 (metadata can be found here:
http://www.esri.com/library/whitepapers/pdfs/esri-data-and-maps.pdf); and NHD
Plus Version 2.1 downloaded October 2012 (see metadata for more information).
Region 4 WSIO Version 1, October 2013. *The Hydrologically Connected Zone (HCZ,
see metadata for more information) is determined using grid analysis to combine
surface water features from NLCD2006 and NHD Plus version 2. It also includes areas
contiguous to surface water that also has a wetness index value of 550 or greater.
The combination of these three datasets represents the Hydrologically Connected
Zone (HCZ). ROAD_DENSITY_2003_MEDIAN_HZ
146 Road Density 2003, Mean Value (mi /sq mi) HCZ Stressor
HCZ -Corridor
Disturbance
The mean road density value (mi/sq mi) of a HUC12 that is within the Hydrologically
Connected Zone*. Source data used was 2010 ESRI Streetmap downloaded August
2012; and NHD Plus Version 2.1 downloaded October 2012 (see metadata for more
information). Region 4 WSIO Version 1, October 2013. *The Hydrologically Connected
Zone (HCZ, see metadata for more information) is determined using grid analysis to
combine surface water features from NLCD2006 and NHD Plus version 2. It also
includes areas contiguous to surface water that also has a wetness index value of 550
or greater. The combination of these three datasets represents the Hydrologically
Connected Zone (HCZ). ROAD_DENSITY_2003_MEAN_HZ
Page 29 of 57

Watershed Indicators WSIO version 1.3
Order Indicator_Name Type Component Description Field_Name
147 Road Density 2003,Standard Deviation(mi /sq mi)HCZ Stressor
HCZ -Corridor
Disturbance
The standard deviation road density value (mi/sq mi) of a HUC12 that is within the
Hydrologically Connected Zone*. Source data used was 2010 ESRI Streetmap
downloaded August 2012; and NHD Plus Version 2.1 downloaded October 2012 (see
metadata for more information). Region 4 WSIO Version 1, October 2013. *The
Hydrologically Connected Zone (HCZ, see metadata for more information) is
determined using grid analysis to combine surface water features from NLCD2006
and NHD Plus version 2. It also includes areas contiguous to surface water that also
has a wetness index value of 550 or greater. The combination of these three datasets
represents the Hydrologically Connected Zone (HCZ). ROAD_DENSITY_2003_STD_HZ
148 Road Density 2003, Sum of Values (mi /sq mi) HCZ Stressor
HCZ -Corridor
Disturbance
The sum of all road density values (mi/sq mi) of a HUC12 that is within the
Hydrologically Connected Zone*. Source data used was 2010 ESRI Streetmap
downloaded August 2012; and NHD Plus Version 2.1 downloaded October 2012 (see
metadata for more information). Region 4 WSIO Version 1, October 2013. *The
Hydrologically Connected Zone (HCZ, see metadata for more information) is
determined using grid analysis to combine surface water features from NLCD2006
and NHD Plus version 2. It also includes areas contiguous to surface water that also
has a wetness index value of 550 or greater. The combination of these three datasets
represents the Hydrologically Connected Zone (HCZ). ROAD_DENSITY_2003_SUM_HZ
149 Empower Density 2001, Median Value in RZ Stressor
RZ -Corridor
Disturbance
The median empower density value that occurs in the *Riparian Zone of a HUC12 per
year. Empower density is the non-renewable emergy flow through a watershed. *The
Riparian Zone (RZ, see metadata for more information) is determined using grid
analysis to combine two surface water indicators and then place an approximate 100
meter buffer around these features. First, the surface water features from the 2006
National Land Cover Database (NLCD). Features included are 'Open Water' (code 11),
'Woody Wetlands' (code 90) and 'Emergent Herbaceous Wetlands' (code 95). Source
data used was NLCD2006 version 1, downloaded February 2011 (see metadata for
more information). Second, the flowline and waterbody features as represented in
the catseed grid from the National Hydrography Dataset (NHD) Plus version 2.
Source data used was NHD Plus Version 2.1, downloaded October 31, 2012 (see
metadata for more information). The combination of these two datasets represents
surface water and is referred to as the ‘Water Mask’ (see metadata for more
information). Last, distance from surface water is calculated using the ArcMap Spatial
Analyst Euclidean Distance tool. All cells with a distance of 108 meters or less are
included in the riparian zone. The combination of these two datasets and all cells
with a distance of 108 meters or less from surface water are included in the Riparian
Zone (RZ). Region 4 WSIO Version 1, October 2013. EMPOWER_DENSITY_2001_MEDIAN_RZ
Page 30 of 57

Watershed Indicators WSIO version 1.3
Order Indicator_Name Type Component Description Field_Name
150 Empower Density 2001, Mean Value in RZ Stressor
RZ -Corridor
Disturbance
The mean empower density value that occurs in the *Riparian Zone of a HUC12 per
year. Empower density is the non-renewable emergy flow through a watershed. *The
Riparian Zone (RZ, see metadata for more information) is determined using grid
analysis to combine two surface water indicators and then place an approximate 100
meter buffer around these features. First, the surface water features from the 2006
National Land Cover Database (NLCD). Features included are 'Open Water' (code 11),
'Woody Wetlands' (code 90) and 'Emergent Herbaceous Wetlands' (code 95). Source
data used was NLCD2006 version 1, downloaded February 2011 (see metadata for
more information). Second, the flowline and waterbody features as represented in
the catseed grid from the National Hydrography Dataset (NHD) Plus version 2.
Source data used was NHD Plus Version 2.1, downloaded October 31, 2012 (see
metadata for more information). The combination of these two datasets represents
surface water and is referred to as the ‘Water Mask’ (see metadata for more
information). Last, distance from surface water is calculated using the ArcMap Spatial
Analyst Euclidean Distance tool. All cells with a distance of 108 meters or less are
included in the riparian zone. The combination of these two datasets and all cells
with a distance of 108 meters or less from surface water are included in the Riparian
Zone (RZ). Region 4 WSIO Version 1, October 2013. EMPOWER_DENSITY_2001_MEAN_RZ
151 Empower Density 2001, Standard Deviation Values RZ Stressor
RZ -Corridor
Disturbance
The standard deviation empower density values that occur in the *Riparian Zone of a
HUC12 per year. Empower density is the non-renewable emergy flow through a
watershed. *The Riparian Zone (RZ, see metadata for more information) is
determined using grid analysis to combine two surface water indicators and then
place an approximate 100 meter buffer around these features. First, the surface
water features from the 2006 National Land Cover Database (NLCD). Features
included are 'Open Water' (code 11), 'Woody Wetlands' (code 90) and 'Emergent
Herbaceous Wetlands' (code 95). Source data used was NLCD2006 version 1,
downloaded February 2011 (see metadata for more information). Second, the
flowline and waterbody features as represented in the catseed grid from the National
Hydrography Dataset (NHD) Plus version 2. Source data used was NHD Plus Version
2.1, downloaded October 31, 2012 (see metadata for more information). The
combination of these two datasets represents surface water and is referred to as the
‘Water Mask’ (see metadata for more information). Last, distance from surface water
is calculated using the ArcMap Spatial Analyst Euclidean Distance tool. All cells with a
distance of 108 meters or less are included in the riparian zone. The combination of
these two datasets and all cells with a distance of 108 meters or less from surface
water are included in the Riparian Zone (RZ). Region 4 WSIO Version 1, October 2013. EMPOWER_DENSITY_2001_STD_RZ
Page 31 of 57

Watershed Indicators WSIO version 1.3
Order Indicator_Name Type Component Description Field_Name
152 Empower Density 2001, Sum of Values in RZ Stressor
RZ -Corridor
Disturbance
The sum of empower density values that occur in the *Riparian Zone of a HUC12 per
year. Empower density is the non-renewable emergy flow through a watershed. *The
Riparian Zone (RZ, see metadata for more information) is determined using grid
analysis to combine two surface water indicators and then place an approximate 100
meter buffer around these features. First, the surface water features from the 2006
National Land Cover Database (NLCD). Features included are 'Open Water' (code 11),
'Woody Wetlands' (code 90) and 'Emergent Herbaceous Wetlands' (code 95). Source
data used was NLCD2006 version 1, downloaded February 2011 (see metadata for
more information). Second, the flowline and waterbody features as represented in
the catseed grid from the National Hydrography Dataset (NHD) Plus version 2.
Source data used was NHD Plus Version 2.1, downloaded October 31, 2012 (see
metadata for more information). The combination of these two datasets represents
surface water and is referred to as the ‘Water Mask’ (see metadata for more
information). Last, distance from surface water is calculated using the ArcMap Spatial
Analyst Euclidean Distance tool. All cells with a distance of 108 meters or less are
included in the riparian zone. The combination of these two datasets and all cells
with a distance of 108 meters or less from surface water are included in the Riparian
Zone (RZ). Region 4 WSIO Version 1, October 2013. EMPOWER_DENSITY_2001_SUM_RZ
153 % Human Use, U-index (2006) in Riparian Zone Stressor
RZ -Corridor
Disturbance
The percent of the HUC12 that is within the Riparian Zone* and classified as
agricultural or urban. U-index cover classifications include 'Developed, Open Space'
(code 21), 'Developed, Low Intensity' (code 22), 'Developed, Medium Intensity' (code
23), 'Developed, High Intensity' (code 24), 'Pasture/Hay' (code 81), and 'Cultivated
Crops' (code 82) by the 2006 National Land Cover Database. Source data used was
NLCD2006 version 1, downloaded February 2011 (see metadata for more
information). U-index is consistent with the Analytical Tools Interface for Landscape
Assessments (ATtILA) version 2004. ATtILA user guide can be found here:
http://www.epa.gov/esd/land-sci/attila/pdf/user_guide.pdf. Region 4 WSIO Version
1, October 2013. *The Riparian Zone (RZ, see metadata for more information) is
determined using grid analysis to combine surface water features from NLCD2006
and NHD Plus version 2; then an approximate 100 meter buffer is placed around
these features. The combination of these two datasets and all cells with a distance of
108 meters or less from surface water are included in the Riparian Zone (RZ). U_INDEX_NLCD06_PCT_RZ
Page 32 of 57
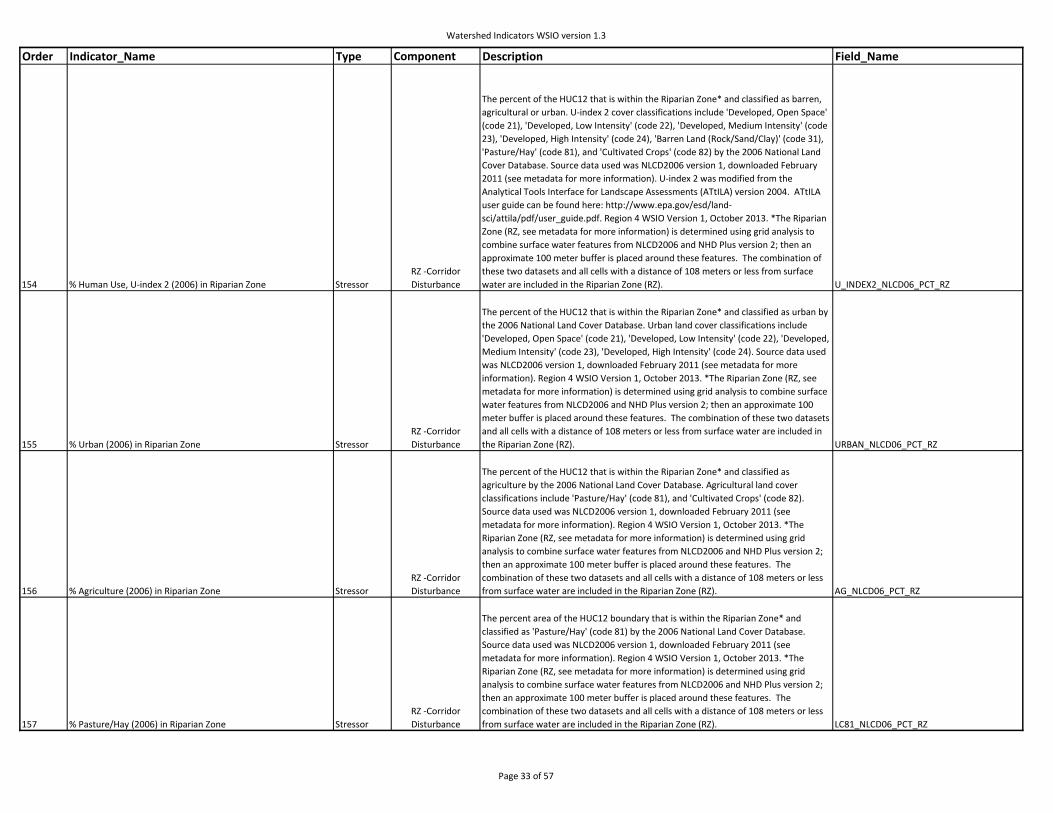
Watershed Indicators WSIO version 1.3
Order Indicator_Name Type Component Description Field_Name
154 % Human Use, U-index 2 (2006) in Riparian Zone Stressor
RZ -Corridor
Disturbance
The percent of the HUC12 that is within the Riparian Zone* and classified as barren,
agricultural or urban. U-index 2 cover classifications include 'Developed, Open Space'
(code 21), 'Developed, Low Intensity' (code 22), 'Developed, Medium Intensity' (code
23), 'Developed, High Intensity' (code 24), 'Barren Land (Rock/Sand/Clay)' (code 31),
'Pasture/Hay' (code 81), and 'Cultivated Crops' (code 82) by the 2006 National Land
Cover Database. Source data used was NLCD2006 version 1, downloaded February
2011 (see metadata for more information). U-index 2 was modified from the
Analytical Tools Interface for Landscape Assessments (ATtILA) version 2004. ATtILA
user guide can be found here: http://www.epa.gov/esd/land-
sci/attila/pdf/user_guide.pdf. Region 4 WSIO Version 1, October 2013. *The Riparian
Zone (RZ, see metadata for more information) is determined using grid analysis to
combine surface water features from NLCD2006 and NHD Plus version 2; then an
approximate 100 meter buffer is placed around these features. The combination of
these two datasets and all cells with a distance of 108 meters or less from surface
water are included in the Riparian Zone (RZ). U_INDEX2_NLCD06_PCT_RZ
155 % Urban (2006) in Riparian Zone Stressor
RZ -Corridor
Disturbance
The percent of the HUC12 that is within the Riparian Zone* and classified as urban by
the 2006 National Land Cover Database. Urban land cover classifications include
'Developed, Open Space' (code 21), 'Developed, Low Intensity' (code 22), 'Developed,
Medium Intensity' (code 23), 'Developed, High Intensity' (code 24). Source data used
was NLCD2006 version 1, downloaded February 2011 (see metadata for more
information). Region 4 WSIO Version 1, October 2013. *The Riparian Zone (RZ, see
metadata for more information) is determined using grid analysis to combine surface
water features from NLCD2006 and NHD Plus version 2; then an approximate 100
meter buffer is placed around these features. The combination of these two datasets
and all cells with a distance of 108 meters or less from surface water are included in
the Riparian Zone (RZ). URBAN_NLCD06_PCT_RZ
156 % Agriculture (2006) in Riparian Zone Stressor
RZ -Corridor
Disturbance
The percent of the HUC12 that is within the Riparian Zone* and classified as
agriculture by the 2006 National Land Cover Database. Agricultural land cover
classifications include 'Pasture/Hay' (code 81), and 'Cultivated Crops' (code 82).
Source data used was NLCD2006 version 1, downloaded February 2011 (see
metadata for more information). Region 4 WSIO Version 1, October 2013. *The
Riparian Zone (RZ, see metadata for more information) is determined using grid
analysis to combine surface water features from NLCD2006 and NHD Plus version 2;
then an approximate 100 meter buffer is placed around these features. The
combination of these two datasets and all cells with a distance of 108 meters or less
from surface water are included in the Riparian Zone (RZ). AG_NLCD06_PCT_RZ
157 % Pasture/Hay (2006) in Riparian Zone Stressor
RZ -Corridor
Disturbance
The percent area of the HUC12 boundary that is within the Riparian Zone* and
classified as 'Pasture/Hay' (code 81) by the 2006 National Land Cover Database.
Source data used was NLCD2006 version 1, downloaded February 2011 (see
metadata for more information). Region 4 WSIO Version 1, October 2013. *The
Riparian Zone (RZ, see metadata for more information) is determined using grid
analysis to combine surface water features from NLCD2006 and NHD Plus version 2;
then an approximate 100 meter buffer is placed around these features. The
combination of these two datasets and all cells with a distance of 108 meters or less
from surface water are included in the Riparian Zone (RZ). LC81_NLCD06_PCT_RZ
Page 33 of 57
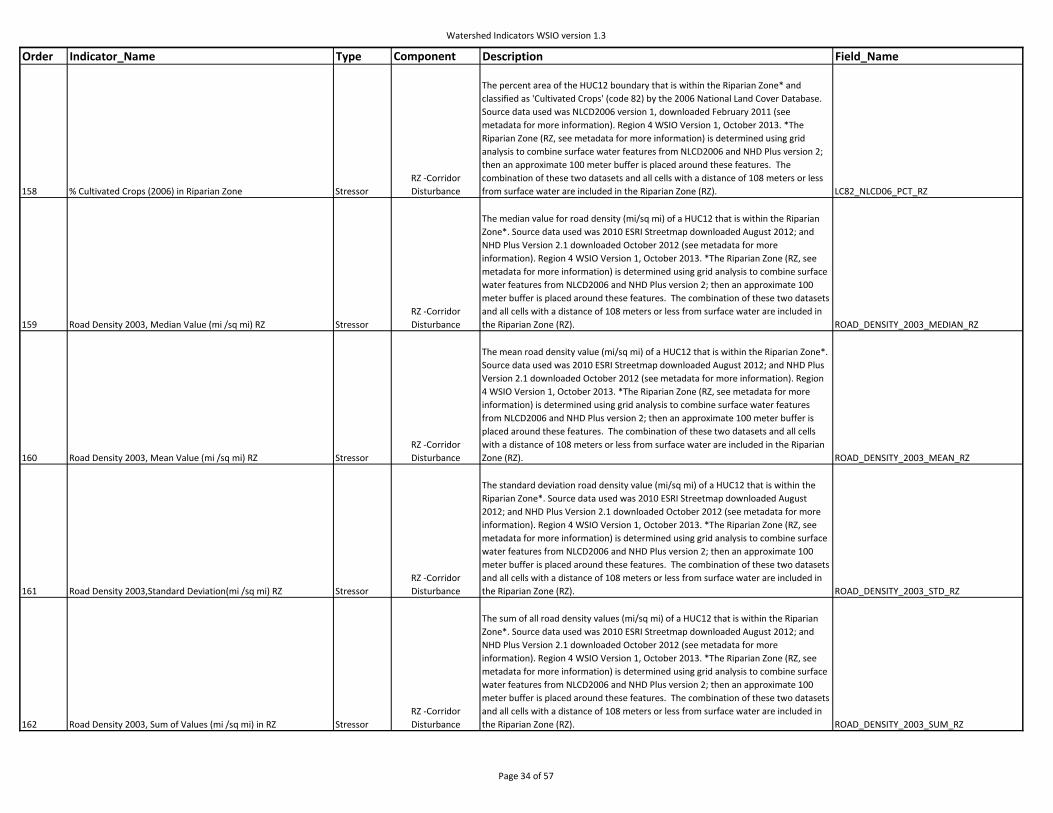
Watershed Indicators WSIO version 1.3
Order Indicator_Name Type Component Description Field_Name
158 % Cultivated Crops (2006) in Riparian Zone Stressor
RZ -Corridor
Disturbance
The percent area of the HUC12 boundary that is within the Riparian Zone* and
classified as 'Cultivated Crops' (code 82) by the 2006 National Land Cover Database.
Source data used was NLCD2006 version 1, downloaded February 2011 (see
metadata for more information). Region 4 WSIO Version 1, October 2013. *The
Riparian Zone (RZ, see metadata for more information) is determined using grid
analysis to combine surface water features from NLCD2006 and NHD Plus version 2;
then an approximate 100 meter buffer is placed around these features. The
combination of these two datasets and all cells with a distance of 108 meters or less
from surface water are included in the Riparian Zone (RZ). LC82_NLCD06_PCT_RZ
159 Road Density 2003, Median Value (mi /sq mi) RZ Stressor
RZ -Corridor
Disturbance
The median value for road density (mi/sq mi) of a HUC12 that is within the Riparian
Zone*. Source data used was 2010 ESRI Streetmap downloaded August 2012; and
NHD Plus Version 2.1 downloaded October 2012 (see metadata for more
information). Region 4 WSIO Version 1, October 2013. *The Riparian Zone (RZ, see
metadata for more information) is determined using grid analysis to combine surface
water features from NLCD2006 and NHD Plus version 2; then an approximate 100
meter buffer is placed around these features. The combination of these two datasets
and all cells with a distance of 108 meters or less from surface water are included in
the Riparian Zone (RZ). ROAD_DENSITY_2003_MEDIAN_RZ
160 Road Density 2003, Mean Value (mi /sq mi) RZ Stressor
RZ -Corridor
Disturbance
The mean road density value (mi/sq mi) of a HUC12 that is within the Riparian Zone*.
Source data used was 2010 ESRI Streetmap downloaded August 2012; and NHD Plus
Version 2.1 downloaded October 2012 (see metadata for more information). Region
4 WSIO Version 1, October 2013. *The Riparian Zone (RZ, see metadata for more
information) is determined using grid analysis to combine surface water features
from NLCD2006 and NHD Plus version 2; then an approximate 100 meter buffer is
placed around these features. The combination of these two datasets and all cells
with a distance of 108 meters or less from surface water are included in the Riparian
Zone (RZ). ROAD_DENSITY_2003_MEAN_RZ
161 Road Density 2003,Standard Deviation(mi /sq mi) RZ Stressor
RZ -Corridor
Disturbance
The standard deviation road density value (mi/sq mi) of a HUC12 that is within the
Riparian Zone*. Source data used was 2010 ESRI Streetmap downloaded August
2012; and NHD Plus Version 2.1 downloaded October 2012 (see metadata for more
information). Region 4 WSIO Version 1, October 2013. *The Riparian Zone (RZ, see
metadata for more information) is determined using grid analysis to combine surface
water features from NLCD2006 and NHD Plus version 2; then an approximate 100
meter buffer is placed around these features. The combination of these two datasets
and all cells with a distance of 108 meters or less from surface water are included in
the Riparian Zone (RZ). ROAD_DENSITY_2003_STD_RZ
162 Road Density 2003, Sum of Values (mi /sq mi) in RZ Stressor
RZ -Corridor
Disturbance
The sum of all road density values (mi/sq mi) of a HUC12 that is within the Riparian
Zone*. Source data used was 2010 ESRI Streetmap downloaded August 2012; and
NHD Plus Version 2.1 downloaded October 2012 (see metadata for more
information). Region 4 WSIO Version 1, October 2013. *The Riparian Zone (RZ, see
metadata for more information) is determined using grid analysis to combine surface
water features from NLCD2006 and NHD Plus version 2; then an approximate 100
meter buffer is placed around these features. The combination of these two datasets
and all cells with a distance of 108 meters or less from surface water are included in
the Riparian Zone (RZ). ROAD_DENSITY_2003_SUM_RZ
Page 34 of 57

Watershed Indicators WSIO version 1.3
Order Indicator_Name Type Component Description Field_Name
163 Proximity of 2006 IC ≥ 5% to water WS Stressor
Hydrologic
Alteration
The proximity of impervious cover (IC) that is greater than or equal to 5 percent to
water. The more proximal IC is to streams causes a higher value in this metric. 'Water'
includes streams, lakes and reservoirs as defined by the National Hydrography
Dataset. Source data used was NLCD2006 version 1 (see metadata for more
information) and NHD Plus Version 2 (http://www.horizon-
systems.com/NHDPlus/NHDPlusV2_home.php). Reference: Wickham, J. D.; Wade, T.
G.; Norton, D. J.; 2014; Spatial patterns of watershed impervious cover relative to
stream location; Ecological Indicators; Volume 40, May 2014, Pages 109–116. Region
4 WSIO Version 1, October 2013. PROX_WATER_2006_IC_GE5_PC_WS
164 Proximity of 2006 IC ≥ 15% to water WS Stressor
Hydrologic
Alteration
The proximity of impervious cover (IC) that is greater than or equal to 15 percent to
water. The more proximal IC is to streams causes a higher value in this metric. 'Water'
includes streams, lakes and reservoirs as defined by the National Hydrography
Dataset. Source data used was NLCD2006 version 1 (see metadata for more
information) and NHD Plus Version 2 (http://www.horizon-
systems.com/NHDPlus/NHDPlusV2_home.php). Reference: Wickham, J. D.; Wade, T.
G.; Norton, D. J.; 2014; Spatial patterns of watershed impervious cover relative to
stream location; Ecological Indicators; Volume 40, May 2014, Pages 109–116. Region
4 WSIO Version 1, October 2013. PROX_WATER_2006_IC_GE15_PC_WS
165 % Water, 2006 IC ≥5%;Weighted Sum Stream & Lake WS Stressor
Hydrologic
Alteration
The percent of HUC12 weighted sum of water contiguous to impervious cover that is
greater than or equal to 5 percent (IC ≥ 5%). 'Water contiguous to impervious cover'
is defined as stream length contiguous to and lake shore length within 30m of
impervious cover as defined by the 2006 National Land Cover Database. Source data
used was NLCD2006 version 1 (see metadata for more information) and NHD Plus
Version 2 (http://www.horizon-systems.com/NHDPlus/NHDPlusV2_home.php).
Reference: Wickham, J. D.; Wade, T. G.; Norton, D. J.; 2014; Spatial patterns of
watershed impervious cover relative to stream location; Ecological Indicators; Volume
40, May 2014, Pages 109–116. Region 4 WSIO Version 1, October 2013. WATER_PC_2006_IC_GE5_PC_WS
166 % Water,2006 IC ≥15%;Weighted Sum Stream & Lake WS Stressor
Hydrologic
Alteration
The percent of HUC12 weighted sum of water contiguous to impervious cover that is
greater than or equal to 15 percent (IC ≥ 15%). 'Water contiguous to impervious
cover' is defined as stream length contiguous to and lake shore length within 30m of
impervious cover as defined by the 2006 National Land Cover Database. Source data
used was NLCD2006 version 1 (see metadata for more information) and NHD Plus
Version 2 (http://www.horizon-systems.com/NHDPlus/NHDPlusV2_home.php).
Reference: Wickham, J. D.; Wade, T. G.; Norton, D. J.; 2014; Spatial patterns of
watershed impervious cover relative to stream location; Ecological Indicators; Volume
40, May 2014, Pages 109–116. Region 4 WSIO Version 1, October 2013. WATER_PC_2006_IC_GE15_PC_WS
Page 35 of 57
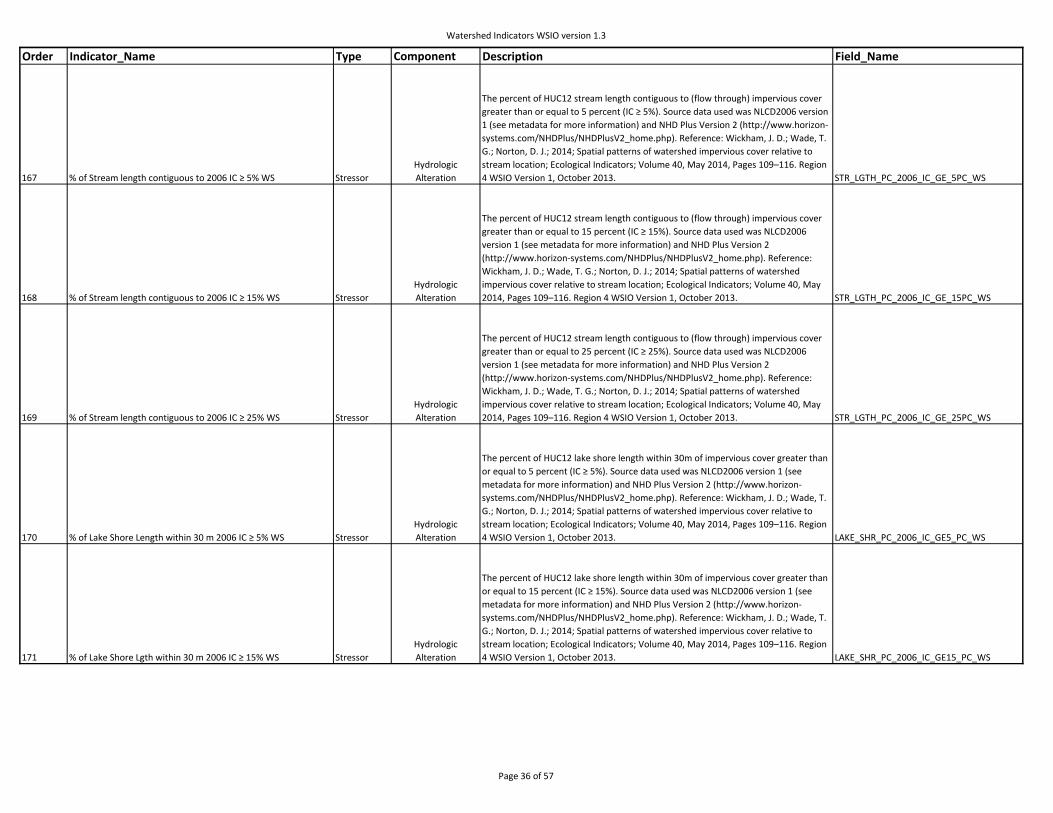
Watershed Indicators WSIO version 1.3
Order Indicator_Name Type Component Description Field_Name
167 % of Stream length contiguous to 2006 IC ≥ 5% WS Stressor
Hydrologic
Alteration
The percent of HUC12 stream length contiguous to (flow through) impervious cover
greater than or equal to 5 percent (IC ≥ 5%). Source data used was NLCD2006 version
1 (see metadata for more information) and NHD Plus Version 2 (http://www.horizon-
systems.com/NHDPlus/NHDPlusV2_home.php). Reference: Wickham, J. D.; Wade, T.
G.; Norton, D. J.; 2014; Spatial patterns of watershed impervious cover relative to
stream location; Ecological Indicators; Volume 40, May 2014, Pages 109–116. Region
4 WSIO Version 1, October 2013. STR_LGTH_PC_2006_IC_GE_5PC_WS
168 % of Stream length contiguous to 2006 IC ≥ 15% WS Stressor
Hydrologic
Alteration
The percent of HUC12 stream length contiguous to (flow through) impervious cover
greater than or equal to 15 percent (IC ≥ 15%). Source data used was NLCD2006
version 1 (see metadata for more information) and NHD Plus Version 2
(http://www.horizon-systems.com/NHDPlus/NHDPlusV2_home.php). Reference:
Wickham, J. D.; Wade, T. G.; Norton, D. J.; 2014; Spatial patterns of watershed
impervious cover relative to stream location; Ecological Indicators; Volume 40, May
2014, Pages 109–116. Region 4 WSIO Version 1, October 2013. STR_LGTH_PC_2006_IC_GE_15PC_WS
169 % of Stream length contiguous to 2006 IC ≥ 25% WS Stressor
Hydrologic
Alteration
The percent of HUC12 stream length contiguous to (flow through) impervious cover
greater than or equal to 25 percent (IC ≥ 25%). Source data used was NLCD2006
version 1 (see metadata for more information) and NHD Plus Version 2
(http://www.horizon-systems.com/NHDPlus/NHDPlusV2_home.php). Reference:
Wickham, J. D.; Wade, T. G.; Norton, D. J.; 2014; Spatial patterns of watershed
impervious cover relative to stream location; Ecological Indicators; Volume 40, May
2014, Pages 109–116. Region 4 WSIO Version 1, October 2013. STR_LGTH_PC_2006_IC_GE_25PC_WS
170 % of Lake Shore Length within 30 m 2006 IC ≥ 5% WS Stressor
Hydrologic
Alteration
The percent of HUC12 lake shore length within 30m of impervious cover greater than
or equal to 5 percent (IC ≥ 5%). Source data used was NLCD2006 version 1 (see
metadata for more information) and NHD Plus Version 2 (http://www.horizon-
systems.com/NHDPlus/NHDPlusV2_home.php). Reference: Wickham, J. D.; Wade, T.
G.; Norton, D. J.; 2014; Spatial patterns of watershed impervious cover relative to
stream location; Ecological Indicators; Volume 40, May 2014, Pages 109–116. Region
4 WSIO Version 1, October 2013. LAKE_SHR_PC_2006_IC_GE5_PC_WS
171 % of Lake Shore Lgth within 30 m 2006 IC ≥ 15% WS Stressor
Hydrologic
Alteration
The percent of HUC12 lake shore length within 30m of impervious cover greater than
or equal to 15 percent (IC ≥ 15%). Source data used was NLCD2006 version 1 (see
metadata for more information) and NHD Plus Version 2 (http://www.horizon-
systems.com/NHDPlus/NHDPlusV2_home.php). Reference: Wickham, J. D.; Wade, T.
G.; Norton, D. J.; 2014; Spatial patterns of watershed impervious cover relative to
stream location; Ecological Indicators; Volume 40, May 2014, Pages 109–116. Region
4 WSIO Version 1, October 2013. LAKE_SHR_PC_2006_IC_GE15_PC_WS
Page 36 of 57

Watershed Indicators WSIO version 1.3
Order Indicator_Name Type Component Description Field_Name
172 % of Lake Shore Lgth within 30 m 2006 IC ≥ 25% WS Stressor
Hydrologic
Alteration
The percent of HUC12 lake shore length within 30m of impervious cover greater than
or equal to 25 percent (IC ≥ 25%). Source data used was NLCD2006 version 1 (see
metadata for more information) and NHD Plus Version 2 (http://www.horizon-
systems.com/NHDPlus/NHDPlusV2_home.php). Reference: Wickham, J. D.; Wade, T.
G.; Norton, D. J.; 2014; Spatial patterns of watershed impervious cover relative to
stream location; Ecological Indicators; Volume 40, May 2014, Pages 109–116. Region
4 WSIO Version 1, October 2013. LAKE_SHR_PC_2006_IC_GE25_PC_WS
173 % U-Index06 Contiguous H2O, in Watershed Stressor
Hydrologic
Alteration
The percent of the HUC12 that is classified as agricultural or urban (U-index) and
contiguous to water (as identified by the Water Mask*) in the watershed. U-index
land cover classifications include 'Developed, Open Space' (code 21), 'Developed, Low
Intensity' (code 22), 'Developed, Medium Intensity' (code 23), 'Developed, High
Intensity' (code 24), 'Pasture/Hay' (code 81), and 'Cultivated Crops' (code 82) by the
2006 National Land Cover Database. Source data used was NLCD2006 version 1,
downloaded February 2011 (see metadata for more information). U-index is
consistent with the Analytical Tools Interface for Landscape Assessments (ATtILA)
version 2004. ATtILA user guide can be found here: http://www.epa.gov/esd/land-
sci/attila/pdf/user_guide.pdf. Region 4 WSIO Version 1, October 2013. *The Water
Mask (see metadata for more information) is determined using grid analysis to
combine surface water features of NLCD2006 and NHD Plus version 2. The
combination of these two datasets represents surface water and is referred to as the
Water Mask. U_INDEX_06_CON_H2O_PCT_WS
174 % Contiguous Urban (2006) in Watershed Stressor
Hydrologic
Alteration
The percent of the HUC12 that is classified as urban by the 2006 National Land Cover
Database and contiguous to surface water as identified by the Water Mask*. Urban
land cover classifications include 'Developed, Open Space' (code 21), 'Developed, Low
Intensity' (code 22), 'Developed, Medium Intensity' (code 23), 'Developed, High
Intensity' (code 24). Source data used was NLCD2006 version 1, downloaded
February 2011 (see metadata for more information). Region 4 WSIO Version 1,
October 2013. *The Water Mask (see metadata for more information) is determined
using grid analysis to combine surface water features of NLCD2006 and NHD Plus
version 2. The combination of these two datasets represents surface water and is
referred to as the Water Mask. URB_CONTIG_NLCD06_PC_WS
175 % Contiguous Agriculture (2006) in Watershed Stressor
Hydrologic
Alteration
The percent of the HUC12 that is classified as agriculture by the 2006 National Land
Cover Database and contiguous to surface water as identified by the Water Mask*.
Agricultural land cover classifications include 'Pasture/Hay' (code 81), and 'Cultivated
Crops' (code 82). Source data used was NLCD2006 version 1, downloaded February
2011 (see metadata for more information). Region 4 WSIO Version 1, October 2013.
*The Water Mask (see metadata for more information) is determined using grid
analysis to combine surface water features of NLCD2006 and NHD Plus version 2. The
combination of these two datasets represents surface water and is referred to as the
Water Mask. AG_CONTIG_NLCD06_PC_WS
Page 37 of 57
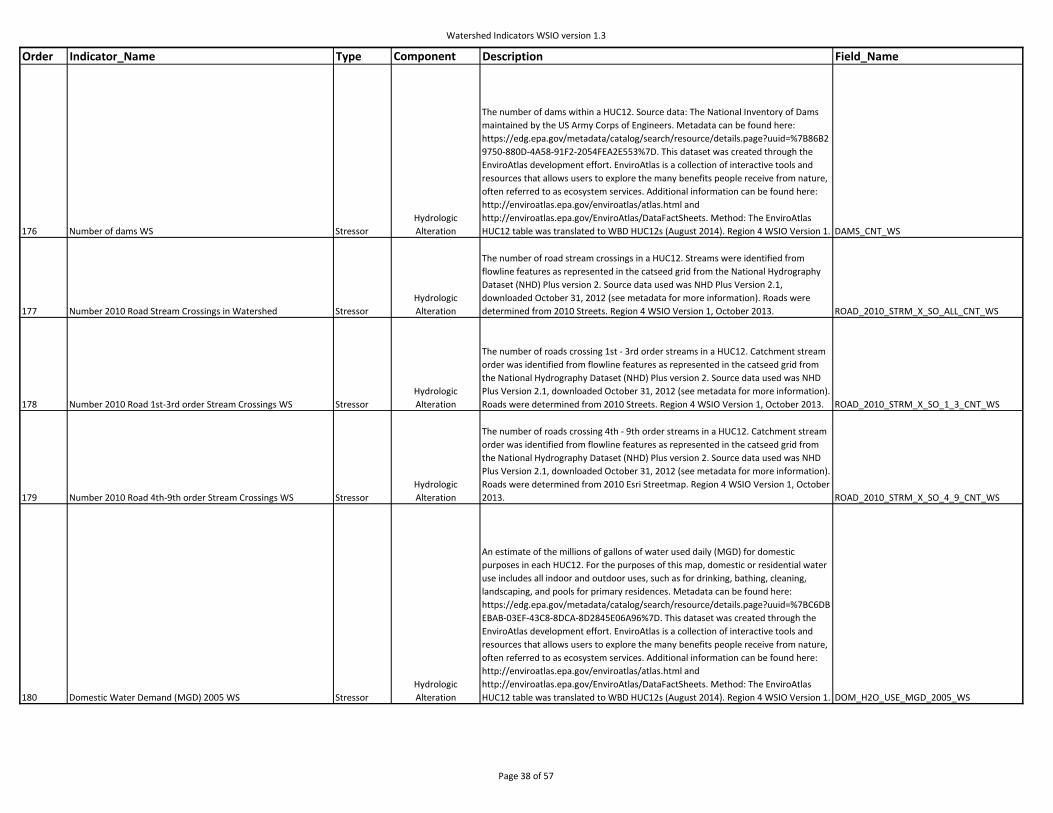
Watershed Indicators WSIO version 1.3
Order Indicator_Name Type Component Description Field_Name
176 Number of dams WS Stressor
Hydrologic
Alteration
The number of dams within a HUC12. Source data: The National Inventory of Dams
maintained by the US Army Corps of Engineers. Metadata can be found here:
https://edg.epa.gov/metadata/catalog/search/resource/details.page?uuid=%7B86B2
9750-880D-4A58-91F2-2054FEA2E553%7D. This dataset was created through the
EnviroAtlas development effort. EnviroAtlas is a collection of interactive tools and
resources that allows users to explore the many benefits people receive from nature,
often referred to as ecosystem services. Additional information can be found here:
http://enviroatlas.epa.gov/enviroatlas/atlas.html and
http://enviroatlas.epa.gov/EnviroAtlas/DataFactSheets. Method: The EnviroAtlas
HUC12 table was translated to WBD HUC12s (August 2014). Region 4 WSIO Version 1. DAMS_CNT_WS
177 Number 2010 Road Stream Crossings in Watershed Stressor
Hydrologic
Alteration
The number of road stream crossings in a HUC12. Streams were identified from
flowline features as represented in the catseed grid from the National Hydrography
Dataset (NHD) Plus version 2. Source data used was NHD Plus Version 2.1,
downloaded October 31, 2012 (see metadata for more information). Roads were
determined from 2010 Streets. Region 4 WSIO Version 1, October 2013. ROAD_2010_STRM_X_SO_ALL_CNT_WS
178 Number 2010 Road 1st-3rd order Stream Crossings WS Stressor
Hydrologic
Alteration
The number of roads crossing 1st - 3rd order streams in a HUC12. Catchment stream
order was identified from flowline features as represented in the catseed grid from
the National Hydrography Dataset (NHD) Plus version 2. Source data used was NHD
Plus Version 2.1, downloaded October 31, 2012 (see metadata for more information).
Roads were determined from 2010 Streets. Region 4 WSIO Version 1, October 2013. ROAD_2010_STRM_X_SO_1_3_CNT_WS
179 Number 2010 Road 4th-9th order Stream Crossings WS Stressor
Hydrologic
Alteration
The number of roads crossing 4th - 9th order streams in a HUC12. Catchment stream
order was identified from flowline features as represented in the catseed grid from
the National Hydrography Dataset (NHD) Plus version 2. Source data used was NHD
Plus Version 2.1, downloaded October 31, 2012 (see metadata for more information).
Roads were determined from 2010 Esri Streetmap. Region 4 WSIO Version 1, October
2013. ROAD_2010_STRM_X_SO_4_9_CNT_WS
180 Domestic Water Demand (MGD) 2005 WS Stressor
Hydrologic
Alteration
An estimate of the millions of gallons of water used daily (MGD) for domestic
purposes in each HUC12. For the purposes of this map, domestic or residential water
use includes all indoor and outdoor uses, such as for drinking, bathing, cleaning,
landscaping, and pools for primary residences. Metadata can be found here:
https://edg.epa.gov/metadata/catalog/search/resource/details.page?uuid=%7BC6DB
EBAB-03EF-43C8-8DCA-8D2845E06A96%7D. This dataset was created through the
EnviroAtlas development effort. EnviroAtlas is a collection of interactive tools and
resources that allows users to explore the many benefits people receive from nature,
often referred to as ecosystem services. Additional information can be found here:
http://enviroatlas.epa.gov/enviroatlas/atlas.html and
http://enviroatlas.epa.gov/EnviroAtlas/DataFactSheets. Method: The EnviroAtlas
HUC12 table was translated to WBD HUC12s (August 2014). Region 4 WSIO Version 1. DOM_H2O_USE_MGD_2005_WS
Page 38 of 57

Watershed Indicators WSIO version 1.3
Order Indicator_Name Type Component Description Field_Name
181 Agricultural water use in MGD 2005 WS Stressor
Hydrologic
Alteration
An estimate of the water used daily for agricultural irrigation for a HUC12 in the
contiguous United States (million gallons/day). Estimates include self-supplied surface
and groundwater, as well as water supplied by irrigation water providers, which may
include governments, companies, or other organizations. Metadata can be found
here:
https://edg.epa.gov/metadata/catalog/search/resource/details.page?uuid=%7BD511
3083-CFCD-48EC-BC24-0ADA5B9BDDB7%7D. This dataset was created through the
EnviroAtlas development effort. EnviroAtlas is a collection of interactive tools and
resources that allows users to explore the many benefits people receive from nature,
often referred to as ecosystem services. Additional information can be found here:
http://enviroatlas.epa.gov/enviroatlas/atlas.html and
http://enviroatlas.epa.gov/EnviroAtlas/DataFactSheets. Method: The EnviroAtlas
HUC12 table was translated to WBD HUC12s (August 2014). Region 4 WSIO Version 1. AG_H2O_USE_05_WS
182 Industrial Water Use (MGD) WS Stressor
Hydrologic
Alteration
An estimate of the millions of gallons of water used daily for industrial processes in
each HUC12. Estimates include self-supplied surface and groundwater, as well as
water supplied by water providers, which may include governments, companies, or
other organizations. Metadata can be found here:
https://edg.epa.gov/metadata/catalog/search/resource/details.page?uuid=%7B4E58
C04B-8A17-4B07-9EE4-1D9365D5B0D9%7D. This dataset was created through the
EnviroAtlas development effort. EnviroAtlas is a collection of interactive tools and
resources that allows users to explore the many benefits people receive from nature,
often referred to as ecosystem services. Additional information can be found here:
http://enviroatlas.epa.gov/enviroatlas/atlas.html and
http://enviroatlas.epa.gov/EnviroAtlas/DataFactSheets. Method: The EnviroAtlas
HUC12 table was translated to WBD HUC12s (August 2014). Region 4 WSIO Version 1. IND_H2O_USE_MGD_WS
183 Water use for Thermo Cooling Annually (MGY) Stressor
Hydrologic
Alteration
An estimate of the millions of gallons of water used annually (2009) for
thermoelectric power generation in each HUC12. Thermoelectric power creates
electricity through steam powered turbines. This map is based on water withdrawn
and does not include water that is returned to the watershed. Metadata can be found
here:
https://edg.epa.gov/metadata/catalog/search/resource/details.page?uuid=%7BA15B
D49A-0C75-4E64-902B-581D89F7B8AC%7D. This dataset was created through the
EnviroAtlas development effort. EnviroAtlas is a collection of interactive tools and
resources that allows users to explore the many benefits people receive from nature,
often referred to as ecosystem services. Additional information can be found here:
http://enviroatlas.epa.gov/enviroatlas/atlas.html and
http://enviroatlas.epa.gov/EnviroAtlas/DataFactSheets. Method: The EnviroAtlas
HUC12 table was translated to WBD HUC12s (August 2014). Region 4 WSIO Version 1. H2O_USE_THERMO_MGAL_YR
Page 39 of 57

Watershed Indicators WSIO version 1.3
Order Indicator_Name Type Component Description Field_Name
184 Water supply from reservoirs (million gallons) Stressor
Hydrologic
Alteration
An estimate of the millions of gallons of surface water in each HUC12 that is
contained in reservoirs and/or behind dams using the National Dams Inventory
survey data from 2009. This map only estimates volume and does not take into
account water rights, designated uses, or previous appropriations. Metadata can be
found here:
https://edg.epa.gov/metadata/catalog/search/resource/details.page?uuid=%7B86B2
9750-880D-4A58-91F2-2054FEA2E553%7D. This dataset was created through the
EnviroAtlas development effort. EnviroAtlas is a collection of interactive tools and
resources that allows users to explore the many benefits people receive from nature,
often referred to as ecosystem services. Additional information can be found here:
http://enviroatlas.epa.gov/enviroatlas/atlas.html and
http://enviroatlas.epa.gov/EnviroAtlas/DataFactSheets. Method: The EnviroAtlas
HUC12 table was translated to WBD HUC12s (August 2014). Region 4 WSIO Version 1. H2O_USE_RESV_MGAL
185 Watershed Streamlength 303d-Listed Stressor
Severity of Pollutant
Loading /
Fragmentation
Length of stream features listed as impaired and requiring a TMDL under Section
303(d) of the Clean Water Act in HUC12 (kilometers). Calculated from the EPA Office
of Water "303(d) Listed Impaired Waters" NHD-indexed dataset. Only includes length
of lines meeting criteria for classification as "streams". These criteria include: (1)
feature has NHD REACHCODE with FTYPE equal to StreamRiver, CanalDitch, or
Connector; (2) feature has NHD REACHCODE with FTYPE equal to Artificial Path and
FTYPE of corresponding NHDArea feature is StreamRiver; or (3) feature is custom-
added to the EPA Reach Address Database and is not in the NHD (blank NHD
REACHCODE). STREAMLGTH_303D
186 % Watershed Streamlength 303d-Listed Stressor
Severity of Pollutant
Loading /
Fragmentation
Percent of stream features in HUC12 listed as impaired and requiring a TMDL under
Section 303(d) of the Clean Water Act. Calculated as length of 303(d) listed impaired
streams (STREAMLGTH_303D) divided by total stream length (STREAMLGTH_NHD +
STREAMLGTH_303D_CUSTOM). STREAMLGTH_303D_PCT
187 Watershed Waterbody Area 303d-Listed Stressor
Severity of Pollutant
Loading /
Fragmentation
Area of lakes, estuaries, and other areal water features listed as impaired and
requiring a TMDL under Section 303(d) of the Clean Water Act in HUC12 (square
kilometers). Calculated from the EPA Office of Water "303(d) Listed Impaired Waters"
NHD-indexed dataset. WBAREA_303D
188 % Watershed Waterbody Area 303d-Listed Stressor
Severity of Pollutant
Loading /
Fragmentation
Percent of lakes, estuaries, and other areal water features in HUC12 listed as
impaired and requiring a TMDL under Section 303(d) of the Clean Water Act.
Calculated as area of 303(d) listed impaired waters (WBAREA_303D) divided by total
waterbody area (WBAREA_NHD + WBAREA_303D_CUSTOM). WBAREA_303D_PCT
189 Watershed Streamlength 303d-Listed + TMDLs Stressor
Severity of Pollutant
Loading /
Fragmentation
Total HUC12 length (km) of streams, rivers, and other linear water features that are
either listed as impaired and/or have one or more TMDLs. Calculated from the EPA
Office of Water "Impaired Waters with TMDLs" and "303(d) Listed Impaired Waters"
NHD-indexed datasets. STREAMLGTH_303DTMDL
190 % Watershed Streamlength 303d-Listed + TMDLs Stressor
Severity of Pollutant
Loading /
Fragmentation
Percent of HUC12's total length (km) of streams, rivers, and other linear water
features that are either listed as impaired and/or have one or more TMDLs.
Calculated from length of 303(d) listed impaired waters/waters with TMDLs
(STREAMLGTH_303DTMDL) and length of NHD stream features (STREAMLGTH_NHD). STREAMLGTH_303DTMDL_PCT
191 Watershed Waterbody Area 303d-Listed + TMDLs Stressor
Severity of Pollutant
Loading /
Fragmentation
Total HUC12 area (sq km) of lakes, estuaries, and other areal water features that are
either listed as impaired and/or have one or more TMDLs. Calculated from the EPA
Office of Water "Impaired Waters with TMDLs" and "303(d) Listed Impaired Waters"
NHD-indexed datasets. WBAREA_303DTMDL
Page 40 of 57

Watershed Indicators WSIO version 1.3
Order Indicator_Name Type Component Description Field_Name
192 % Watershed Waterbody Area 303d-Listed + TMDLs Stressor
Severity of Pollutant
Loading /
Fragmentation
Percent of HUC12's total area (sq km) of lakes, estuaries, and other areal water
features that are either listed as impaired and/or have one or more TMDLs.
Calculated from area of 303(d) listed impaired waters/waters with TMDLs
(WBAREA_303DTMDL) and area of NHD waterbody features (WBAREA_NHD). WBAREA_303DTMDL_PCT
193 Watershed 303d-Listed Segments Count Stressor
Severity of Pollutant
Loading /
Fragmentation
Count of waters listed as impaired and requiring a TMDL under Section 303(d) of the
Clean Water Act in HUC12. Calculated as the number of unique state-assigned water
segment IDs in the EPA Office of Water "303(d) Listed Impaired Waters" NHD-indexed
dataset. CNT_303D_WATERS
194 Watershed Segment-Cause Combinations Count Stressor
Severity of Pollutant
Loading /
Fragmentation
Count of impairments for waters listed as impaired and requiring a TMDL under
Section 303(d) of the Clean Water Act in HUC12. Calculated as the number of unique
water segment ID-parent cause of impairment combinations in the EPA Office of
Water "303(d) Listed Impaired Waters" NHD-indexed dataset. CNT_303D_IMPAIRMENTS
195 Watershed Impairment 303d and TMDL Segments Count Stressor
Severity of Pollutant
Loading /
Fragmentation
Count of waters with TMDLs or listed as impaired and requiring a TMDL under Section
303(d) of the Clean Water Act in HUC12. Calculated as the number of unique state-
assigned water segment IDs in the EPA Office of Water "Impaired Waters with
TMDLs" and "303(d) Listed Impaired Waters" NHD-indexed datasets. CNT_303DTMDL_WATERS
196 Watershed Cause-Segment Count 303d-Listed + TMDLs Stressor
Severity of Pollutant
Loading /
Fragmentation
Count of impairments for waters with TMDLs or waters listed as impaired and
requiring a TMDL under Section 303(d) of the Clean Water Act in HUC12. Calculated
as number of unique water segment ID-parent cause of impairment combinations in
the EPA Office of Water "Impaired Waters with TMDLs" and "303(d) Listed Impaired
Waters" NHD-indexed datasets. CNT_303DTMDL_IMPAIRMENTS
197 Watershed Streamlength 303d-Listed Nutrients Stressor
Severity of Pollutant
Loading /
Fragmentation
Length of stream features listed as impaired due to nutrient-related causes and
requiring a TMDL under Section 303(d) of the Clean Water Act in HUC12 (kilometers).
Calculated from the EPA Office of Water "303(d) Listed Impaired Waters" NHD-
indexed dataset. Only includes length of lines meeting criteria for classification as
"streams" and with "Nutrients", "Organic Enrichment/Oxygen Depletion", "Algal
Growth", or "Noxious Aquatic Plants" listed as a parent cause of impairment. Criteria
for stream classification include: (1) feature has NHD REACHCODE with FTYPE equal
to StreamRiver, CanalDitch, or Connector; (2) feature has NHD REACHCODE with
FTYPE equal to Artificial Path and FTYPE of corresponding NHDArea feature is
StreamRiver; or (3) feature is custom-added to the EPA Reach Address Database and
is not in the NHD (blank NHD REACHCODE). STREAMLGTH_303D_NUTRIENTS
198 %Watershed Streamlength 303d-Listed Nutrients Stressor
Severity of Pollutant
Loading /
Fragmentation
Percent of stream features in HUC12 listed as impaired due to nutrient-related
causes and requiring a TMDL under Section 303(d) of the Clean Water Act. Calculated
as length of 303(d) listed nutrient impaired streams
(STREAMLGTH_303D_NUTRIENTS) divided by total stream length
(STREAMLGTH_NHD + STREAMLGTH_303D_CUSTOM). STREAMLGTH_303D_NUTRIENTS_PCT
199 Watershed Waterbody Area 303d-Listed Nutrients Stressor
Severity of Pollutant
Loading /
Fragmentation
Area of lakes, estuaries, and other areal water features listed as impaired due to
nutrient-related causes and requiring a TMDL under Section 303(d) of the Clean
Water Act in HUC12 (kilometers). Calculated from the EPA Office of Water "303(d)
Listed Impaired Waters" NHD-indexed dataset. Only includes area of polygons with
"Nutrients", "Organic Enrichment/Oxygen Depletion", "Algal Growth", or "Noxious
Aquatic Plants" listed as a parent cause of impairment. WBAREA_303D_NUTRIENTS
Page 41 of 57

Watershed Indicators WSIO version 1.3
Order Indicator_Name Type Component Description Field_Name
200 % Watershed Waterbody Area 303d-Listed Nutrients Stressor
Severity of Pollutant
Loading /
Fragmentation
Percent of assessed lakes, estuaries, and other areal water features in HUC12 listed
as impaired due to nutrient-related causes and requiring a TMDL under Section
303(d) of the Clean Water Act. Calculated as area of 303(d) listed nutrient impaired
waterbodies (WBAREA_303D_NUTRIENTS) divided by total waterbody area
(WBAREA_NHD + WBAREA_303D_CUSTOM). WBAREA_303D_NUTRIENTS_PCT
201 Watershed Nutrients 303d-Listed Segments Count Stressor
Severity of Pollutant
Loading /
Fragmentation
Count of waters listed as impaired due to nutrients and requiring a TMDL under
Section 303(d) of the Clean Water Act in HUC12. Calculated as the number of unique
state-assigned water segment IDs in the EPA Office of Water "303(d) Listed Impaired
Waters" NHD-indexed dataset with "Nutrients", "Organic Enrichment/Oxygen
Depletion", "Algal Growth", or "Noxious Aquatic Plants" listed as a parent cause of
impairment. CNT_303D_WATERS_NUTRIENTS
202 Watershed Streamlength 303d-Listed Pathogens Stressor
Severity of Pollutant
Loading /
Fragmentation
Length of stream features listed as impaired due to pathogens and requiring a TMDL
under Section 303(d) of the Clean Water Act in HUC12 (kilometers). Calculated from
the EPA Office of Water "303(d) Listed Impaired Waters" NHD-indexed dataset. Only
includes length of lines meeting criteria for classification as "streams" and with
"Pathogens" listed as a parent cause of impairment. Criteria for stream classification
include: (1) feature has NHD REACHCODE with FTYPE equal to StreamRiver,
CanalDitch, or Connector; (2) feature has NHD REACHCODE with FTYPE equal to
Artificial Path and FTYPE of corresponding NHDArea feature is StreamRiver; or (3)
feature is custom-added to the EPA Reach Address Database and is not in the NHD
(blank NHD REACHCODE). STREAMLGTH_303D_PATHOGENS
203 %Watershed Streamlength 303d-Listed Pathogens Stressor
Severity of Pollutant
Loading /
Fragmentation
Percent of stream features in HUC12 listed as impaired due to pathogens and
requiring a TMDL under Section 303(d) of the Clean Water Act. Calculated as length
of 303(d) listed pathogen impaired streams (STREAMLGTH_303D_PATHOGENS)
divided by total stream length (STREAMLGTH_NHD + STREAMLGTH_303D_CUSTOM). STREAMLGTH_303D_PATHOGENS_PCT
204 Watershed Waterbody Area 303d-Listed Pathogens Stressor
Severity of Pollutant
Loading /
Fragmentation
Area of lakes, estuaries, and other areal water features listed as impaired due to
pathogens and requiring a TMDL under Section 303(d) of the Clean Water Act in
HUC12 (kilometers). Calculated from the EPA Office of Water "303(d) Listed Impaired
Waters" NHD-indexed dataset. Only includes area of polygons with "Pathogens"
listed as a parent cause of impairment. WBAREA_303D_PATHOGENS
205 % Watershed Waterbody Area 303d-Listed Pathogens Stressor
Severity of Pollutant
Loading /
Fragmentation
Area of lakes, estuaries, and other areal water features in HUC12 listed as impaired
due to pathogens and requiring a TMDL under Section 303(d) of the Clean Water Act.
Calculated as area of 303(d) listed pathogen impaired waterbodies
(WBAREA_303D_PATHOGENS) divided by total waterbody area (WBAREA_NHD +
WBAREA_303D_CUSTOM). WBAREA_303D_PATHOGENS_PCT
206 Watershed Pathogen 303d-Listed Segments Count Stressor
Severity of Pollutant
Loading /
Fragmentation
Count of waters listed as impaired due to pathogens and requiring a TMDL under
Section 303(d) of the Clean Water Act in HUC12. Calculated as the number of unique
state-assigned water segment IDs in the EPA Office of Water "303(d) Listed Impaired
Waters" NHD-indexed dataset with "Pathogens" listed as a parent cause of
impairment. CNT_303D_WATERS_PATHOGENS
Page 42 of 57
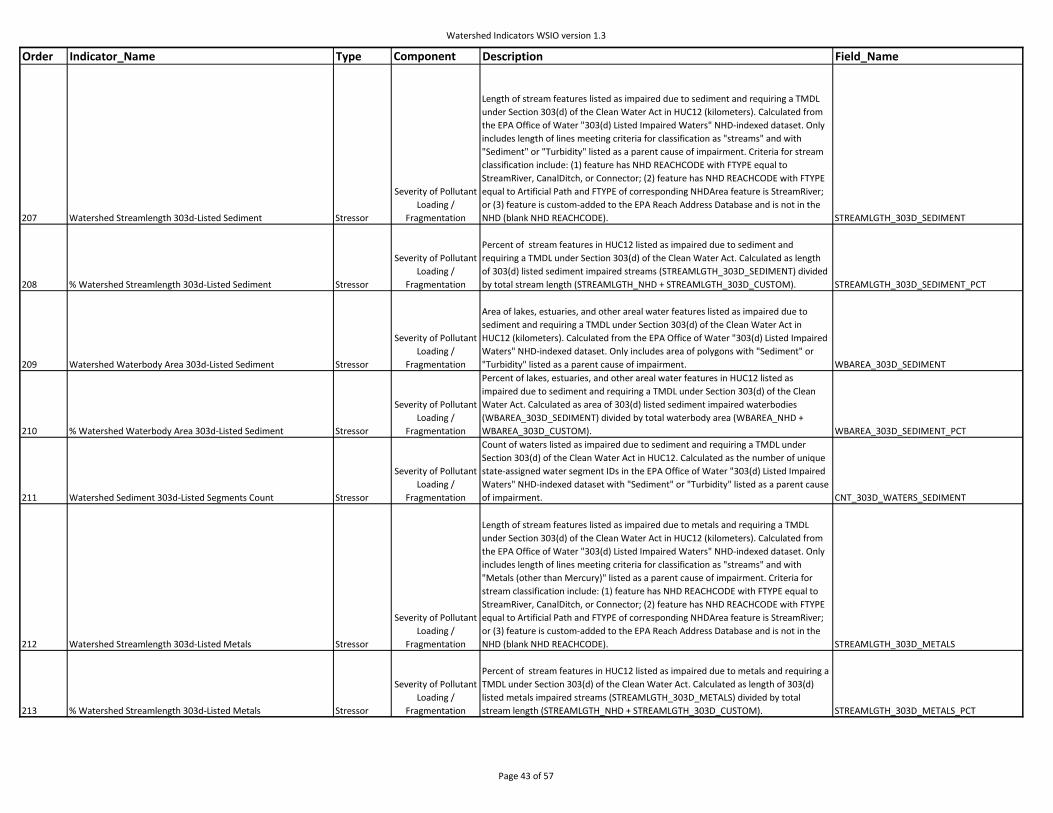
Watershed Indicators WSIO version 1.3
Order Indicator_Name Type Component Description Field_Name
207 Watershed Streamlength 303d-Listed Sediment Stressor
Severity of Pollutant
Loading /
Fragmentation
Length of stream features listed as impaired due to sediment and requiring a TMDL
under Section 303(d) of the Clean Water Act in HUC12 (kilometers). Calculated from
the EPA Office of Water "303(d) Listed Impaired Waters" NHD-indexed dataset. Only
includes length of lines meeting criteria for classification as "streams" and with
"Sediment" or "Turbidity" listed as a parent cause of impairment. Criteria for stream
classification include: (1) feature has NHD REACHCODE with FTYPE equal to
StreamRiver, CanalDitch, or Connector; (2) feature has NHD REACHCODE with FTYPE
equal to Artificial Path and FTYPE of corresponding NHDArea feature is StreamRiver;
or (3) feature is custom-added to the EPA Reach Address Database and is not in the
NHD (blank NHD REACHCODE). STREAMLGTH_303D_SEDIMENT
208 % Watershed Streamlength 303d-Listed Sediment Stressor
Severity of Pollutant
Loading /
Fragmentation
Percent of stream features in HUC12 listed as impaired due to sediment and
requiring a TMDL under Section 303(d) of the Clean Water Act. Calculated as length
of 303(d) listed sediment impaired streams (STREAMLGTH_303D_SEDIMENT) divided
by total stream length (STREAMLGTH_NHD + STREAMLGTH_303D_CUSTOM). STREAMLGTH_303D_SEDIMENT_PCT
209 Watershed Waterbody Area 303d-Listed Sediment Stressor
Severity of Pollutant
Loading /
Fragmentation
Area of lakes, estuaries, and other areal water features listed as impaired due to
sediment and requiring a TMDL under Section 303(d) of the Clean Water Act in
HUC12 (kilometers). Calculated from the EPA Office of Water "303(d) Listed Impaired
Waters" NHD-indexed dataset. Only includes area of polygons with "Sediment" or
"Turbidity" listed as a parent cause of impairment. WBAREA_303D_SEDIMENT
210 % Watershed Waterbody Area 303d-Listed Sediment Stressor
Severity of Pollutant
Loading /
Fragmentation
Percent of lakes, estuaries, and other areal water features in HUC12 listed as
impaired due to sediment and requiring a TMDL under Section 303(d) of the Clean
Water Act. Calculated as area of 303(d) listed sediment impaired waterbodies
(WBAREA_303D_SEDIMENT) divided by total waterbody area (WBAREA_NHD +
WBAREA_303D_CUSTOM). WBAREA_303D_SEDIMENT_PCT
211 Watershed Sediment 303d-Listed Segments Count Stressor
Severity of Pollutant
Loading /
Fragmentation
Count of waters listed as impaired due to sediment and requiring a TMDL under
Section 303(d) of the Clean Water Act in HUC12. Calculated as the number of unique
state-assigned water segment IDs in the EPA Office of Water "303(d) Listed Impaired
Waters" NHD-indexed dataset with "Sediment" or "Turbidity" listed as a parent cause
of impairment. CNT_303D_WATERS_SEDIMENT
212 Watershed Streamlength 303d-Listed Metals Stressor
Severity of Pollutant
Loading /
Fragmentation
Length of stream features listed as impaired due to metals and requiring a TMDL
under Section 303(d) of the Clean Water Act in HUC12 (kilometers). Calculated from
the EPA Office of Water "303(d) Listed Impaired Waters" NHD-indexed dataset. Only
includes length of lines meeting criteria for classification as "streams" and with
"Metals (other than Mercury)" listed as a parent cause of impairment. Criteria for
stream classification include: (1) feature has NHD REACHCODE with FTYPE equal to
StreamRiver, CanalDitch, or Connector; (2) feature has NHD REACHCODE with FTYPE
equal to Artificial Path and FTYPE of corresponding NHDArea feature is StreamRiver;
or (3) feature is custom-added to the EPA Reach Address Database and is not in the
NHD (blank NHD REACHCODE). STREAMLGTH_303D_METALS
213 % Watershed Streamlength 303d-Listed Metals Stressor
Severity of Pollutant
Loading /
Fragmentation
Percent of stream features in HUC12 listed as impaired due to metals and requiring a
TMDL under Section 303(d) of the Clean Water Act. Calculated as length of 303(d)
listed metals impaired streams (STREAMLGTH_303D_METALS) divided by total
stream length (STREAMLGTH_NHD + STREAMLGTH_303D_CUSTOM). STREAMLGTH_303D_METALS_PCT
Page 43 of 57

Watershed Indicators WSIO version 1.3
Order Indicator_Name Type Component Description Field_Name
214 Watershed Waterbody Area 303d-Listed Metals Stressor
Severity of Pollutant
Loading /
Fragmentation
Area of lakes, estuaries, and other areal water features listed as impaired due to
metals and requiring a TMDL under Section 303(d) of the Clean Water Act in HUC12
(kilometers). Calculated from the EPA Office of Water "303(d) Listed Impaired
Waters" NHD-indexed dataset. Only includes area of polygons with "Metals (other
than Mercury)" listed as a parent cause of impairment. WBAREA_303D_METALS
215 % Watershed Waterbody Area 303d-Listed Metals Stressor
Severity of Pollutant
Loading /
Fragmentation
Percent of lakes, estuaries, and other areal water features in HUC12 listed as
impaired due to metals and requiring a TMDL under Section 303(d) of the Clean
Water Act. Calculated as area of 303(d) listed metals impaired waterbodies
(WBAREA_303D_METALS) divided by total waterbody area (WBAREA_NHD +
WBAREA_303D_CUSTOM). WBAREA_303D_METALS_PCT
216 Watershed Metals 303d-Listed Segments Count Stressor
Severity of Pollutant
Loading /
Fragmentation
Count of waters listed as impaired due to metals and requiring a TMDL under Section
303(d) of the Clean Water Act in HUC12. Calculated as the number of unique state-
assigned water segment IDs in the EPA Office of Water "303(d) Listed Impaired
Waters" NHD-indexed dataset with "Metals (other than Mercury)" listed as a parent
cause of impairment. CNT_303D_WATERS_METALS
217 Manure application (kg N/ha/yr) Stressor
Severity of Pollutant
Loading /
Fragmentation
The mean rate of manure application to agricultural lands from confined animal
feeding operations (CAFOs) within each HUC12 (kg N/ha/yr). Metadata can be found
here:
https://edg.epa.gov/metadata/catalog/search/resource/details.page?uuid=%7B0A4E
7DDE-5F54-4DB5-8688-6AB2B1C8AFE5%7D. This dataset was created through the
EnviroAtlas development effort. EnviroAtlas is a collection of interactive tools and
resources that allows users to explore the many benefits people receive from nature,
often referred to as ecosystem services. Additional information can be found here:
http://enviroatlas.epa.gov/enviroatlas/atlas.html and
http://enviroatlas.epa.gov/EnviroAtlas/DataFactSheets. Method: The EnviroAtlas
HUC12 table was translated to WBD HUC12s (August 2014). Region 4 WSIO Version 1. MANURE_APP_WS
218 Synthetic N fertilizer application06(kg N/ha/yr)WS Stressor
Severity of Pollutant
Loading /
Fragmentation
The mean rate of synthetic nitrogen fertilizer application to agricultural lands within a
HUC12 (kg N/ha/yr). Metadata can be found here:
https://edg.epa.gov/metadata/catalog/search/resource/details.page?uuid=%7B09DF
9B39-6CC8-4DFF-A14D-1BA14C06321F%7D. This dataset was created through the
EnviroAtlas development effort. EnviroAtlas is a collection of interactive tools and
resources that allows users to explore the many benefits people receive from nature,
often referred to as ecosystem services. Additional information can be found here:
http://enviroatlas.epa.gov/enviroatlas/atlas.html and
http://enviroatlas.epa.gov/EnviroAtlas/DataFactSheets. Method: The EnviroAtlas
HUC12 table was translated to WBD HUC12s (August 2014). Region 4 WSIO Version 1. N_SYNTH_FERT_APL_MEAN_WS
Page 44 of 57

Watershed Indicators WSIO version 1.3
Order Indicator_Name Type Component Description Field_Name
219 Total nitrogen deposition 2006 (kg/ha) Stressor
Severity of Pollutant
Loading /
Fragmentation
An estimate of the 2006 annual deposition of reduced nitrogen a HUC12 (kilograms
per hectare). This map includes both dry and wet deposition of reduced nitrogen.
Metadata can be found here:
https://edg.epa.gov/metadata/catalog/search/resource/details.page?uuid=%7B07E5
D507-E1DA-40F6-8357-5A62990B0667%7D. This dataset was created through the
EnviroAtlas development effort. EnviroAtlas is a collection of interactive tools and
resources that allows users to explore the many benefits people receive from nature,
often referred to as ecosystem services. Additional information can be found here:
http://enviroatlas.epa.gov/enviroatlas/atlas.html and
http://enviroatlas.epa.gov/EnviroAtlas/DataFactSheets. Method: The EnviroAtlas
HUC12 table was translated to WBD HUC12s (August 2014). Region 4 WSIO Version 1. N_DEP_TOTAL_06_WS
220 Total nitrogen deposition 2002 (kg/ha) Stressor
Severity of Pollutant
Loading /
Fragmentation
An estimate of the 2002 total annual deposition of nitrogen in a HUC12 (kilograms
per hectare). This map includes both dry and wet deposition of oxidized and reduced
nitrogen. This dataset was created through the EnviroAtlas development effort.
EnviroAtlas is a collection of interactive tools and resources that allows users to
explore the many benefits people receive from nature, often referred to as
ecosystem services. Additional information can be found here:
http://enviroatlas.epa.gov/enviroatlas/atlas.html and
http://enviroatlas.epa.gov/EnviroAtlas/DataFactSheets. Method: The EnviroAtlas
HUC12 table was translated to WBD HUC12s (August 2014). Region 4 WSIO Version 1. N_DEP_TOTAL_02_WS
221 Total reduced nitrogen deposition 2006 (kg/ha) Stressor
Severity of Pollutant
Loading /
Fragmentation
An estimate of the annual deposition of oxidized nitrogen within a HUC12 (kilograms
per hectare). This map includes both dry and wet deposition of oxidized nitrogen.
Metadata can be found here:
https://edg.epa.gov/metadata/catalog/search/resource/details.page?uuid=%7B07E5
D507-E1DA-40F6-8357-5A62990B0667%7D. This dataset was created through the
EnviroAtlas development effort. EnviroAtlas is a collection of interactive tools and
resources that allows users to explore the many benefits people receive from nature,
often referred to as ecosystem services. Additional information can be found here:
http://enviroatlas.epa.gov/enviroatlas/atlas.html and
http://enviroatlas.epa.gov/EnviroAtlas/DataFactSheets. Method: The EnviroAtlas
HUC12 table was translated to WBD HUC12s (August 2014). Region 4 WSIO Version 1. N_RED_DEP_TOTAL_06_WS
222 Total reduced nitrogen deposition 2002 (kg/ha) Stressor
Severity of Pollutant
Loading /
Fragmentation
An estimate of the 2002 annual deposition of reduced nitrogen in a HUC12 (kilograms
per hectare). This map includes both dry and wet deposition of reduced nitrogen.
This dataset was created through the EnviroAtlas development effort. EnviroAtlas is a
collection of interactive tools and resources that allows users to explore the many
benefits people receive from nature, often referred to as ecosystem services.
Additional information can be found here:
http://enviroatlas.epa.gov/enviroatlas/atlas.html and
http://enviroatlas.epa.gov/EnviroAtlas/DataFactSheets. Method: The EnviroAtlas
HUC12 table was translated to WBD HUC12s (August 2014). Region 4 WSIO Version 1. N_RED_DEP_TOTAL_02_WS
Page 45 of 57

Watershed Indicators WSIO version 1.3
Order Indicator_Name Type Component Description Field_Name
223 Total oxidized nitrogen deposition 2006 (kg/ha) Stressor
Severity of Pollutant
Loading /
Fragmentation
An estimate of the total annual deposition of nitrogen within a HUC12 (kilograms per
hectare). This map includes both dry and wet deposition of oxidized and reduced
nitrogen. Metadata can be found here:
https://edg.epa.gov/metadata/catalog/search/resource/details.page?uuid=%7B07E5
D507-E1DA-40F6-8357-5A62990B0667%7D. This dataset was created through the
EnviroAtlas development effort. EnviroAtlas is a collection of interactive tools and
resources that allows users to explore the many benefits people receive from nature,
often referred to as ecosystem services. Additional information can be found here:
http://enviroatlas.epa.gov/enviroatlas/atlas.html and
http://enviroatlas.epa.gov/EnviroAtlas/DataFactSheets. Method: The EnviroAtlas
HUC12 table was translated to WBD HUC12s (August 2014). Region 4 WSIO Version 1. N_OX_DEP_TOTAL_06_WS
224 Total oxidized nitrogen deposition 2002 (kg/ha) Stressor
Severity of Pollutant
Loading /
Fragmentation
An estimate of the 2002 annual deposition of oxidized nitrogen within each HUC12
(Kilograms per hectare). This map includes both dry and wet deposition of oxidized
nitrogen. This dataset was created through the EnviroAtlas development effort.
EnviroAtlas is a collection of interactive tools and resources that allows users to
explore the many benefits people receive from nature, often referred to as
ecosystem services. Additional information can be found here:
http://enviroatlas.epa.gov/enviroatlas/atlas.html and
http://enviroatlas.epa.gov/EnviroAtlas/DataFactSheets. Method: The EnviroAtlas
HUC12 table was translated to WBD HUC12s (August 2014). Region 4 WSIO Version 1. N_OX_DEP_TOTAL_02_WS
225 Total sulfur deposition 2006 (kg/ha) Stressor
Severity of Pollutant
Loading /
Fragmentation
An estimate of the 2006 annual deposition of sulfur within each HUC12 (kilograms
per hectare). This map includes both dry and wet deposition of sulfur. Metadata can
be found here:
https://edg.epa.gov/metadata/catalog/search/resource/details.page?uuid=%7B07E5
D507-E1DA-40F6-8357-5A62990B0667%7D. This dataset was created through the
EnviroAtlas development effort. EnviroAtlas is a collection of interactive tools and
resources that allows users to explore the many benefits people receive from nature,
often referred to as ecosystem services. Additional information can be found here:
http://enviroatlas.epa.gov/enviroatlas/atlas.html and
http://enviroatlas.epa.gov/EnviroAtlas/DataFactSheets. Method: The EnviroAtlas
HUC12 table was translated to WBD HUC12s (August 2014). Region 4 WSIO Version 1. SLF_DEP_TOTAL_06_WS
226 Total sulfur deposition 2002 (kg/ha) Stressor
Severity of Pollutant
Loading /
Fragmentation
An estimate of the total annual deposition of sulfur within each HUC12 (kilograms per
hectare). This map includes both dry and wet deposition of sulfur. This dataset was
created through the EnviroAtlas development effort. EnviroAtlas is a collection of
interactive tools and resources that allows users to explore the many benefits people
receive from nature, often referred to as ecosystem services. Additional information
can be found here: http://enviroatlas.epa.gov/enviroatlas/atlas.html and
http://enviroatlas.epa.gov/EnviroAtlas/DataFactSheets. Method: The EnviroAtlas
HUC12 table was translated to WBD HUC12s (August 2014). Region 4 WSIO Version 1. SLF_DEP_TOTAL_02_WS
Page 46 of 57

Watershed Indicators WSIO version 1.3
Order Indicator_Name Type Component Description Field_Name
227 % Human Use Change, U-Index Change 2001-06 WS Stressor
WS -History, Legacy
of past, trajectory of
future land use
The percent of HUC12 change in agricultural or urban classifications (U-index) from
2001 to 2006. Change was determined by comparing the 2001 and 2006 National
Land Cover Change Datasets; version 1. U-index land cover classifications include
'Developed, Open Space' (code 21), 'Developed, Low Intensity' (code 22), 'Developed,
Medium Intensity' (code 23), 'Developed, High Intensity' (code 24), 'Pasture/Hay'
(code 81), and 'Cultivated Crops' (code 82) by the 2006 National Land Cover
Database. Source data used was NLCD2006 version 1, downloaded February 2011
(see metadata for more information). U-index is consistent with the Analytical Tools
Interface for Landscape Assessments (ATtILA) version 2004. ATtILA user guide can be
found here: http://www.epa.gov/esd/land-sci/attila/pdf/user_guide.pdf. Region 4
WSIO Version 1, October 2013. U_INDEX_CHG_2001_06_PCT_WS
228 % Human Use Change, U-Index 2 Change 2001-06 WS Stressor
WS -History, Legacy
of past, trajectory of
future land use
The percent of HUC12 change in barren, agricultural or urban classifications (U-index
2) from 2001 to 2006. Change was determined by comparing the 2001 and 2006
National Land Cover Change Datasets; version 1. U-index 2 cover classifications
include 'Developed, Open Space' (code 21), 'Developed, Low Intensity' (code 22),
'Developed, Medium Intensity' (code 23), 'Developed, High Intensity' (code 24),
'Barren Land (Rock/Sand/Clay)' (code 31), 'Pasture/Hay' (code 81), and 'Cultivated
Crops' (code 82) by the 2006 National Land Cover Database. Source data used was
NLCD2006 version 1, downloaded February 2011 (see metadata for more
information). U-index 2 was modified from the Analytical Tools Interface for
Landscape Assessments (ATtILA) version 2004. ATtILA user guide can be found here:
http://www.epa.gov/esd/land-sci/attila/pdf/user_guide.pdf. Region 4 WSIO Version
1, October 2013. U_INDEX2_CHG_2001_06_PCT_WS
229 % Urban Change 2001-06 WS Stressor
WS -History, Legacy
of past, trajectory of
future land use
The percent of HUC12 change in urban classifications from 2001 to 2006. Change was
determined by comparing the 2001 and 2006 National Land Cover Change Datasets;
version 1. Urban land cover classifications include 'Developed, Open Space' (code 21),
'Developed, Low Intensity' (code 22), 'Developed, Medium Intensity' (code 23), and
'Developed, High Intensity' (code 24) by the 2006 National Land Cover Database.
Source data used was NLCD2006 version 1, downloaded February 2011 (see
metadata for more information). Region 4 WSIO Version 1, October 2013. URBAN_CHG_2001_06_PCT_WS
230 % Agriculture Change 2001-06 WS Stressor
WS -History, Legacy
of past, trajectory of
future land use
The percent of HUC12 change in agricultural classifications from 2001 to 2006.
Change was determined by comparing the 2001 and 2006 National Land Cover
Change Datasets; version 1. Agricultural land cover classifications include
'Pasture/Hay' (code 81) and 'Cultivated Crops' (code 82) by the 2006 National Land
Cover Database. Source data used was NLCD2006 version 1, downloaded February
2011 (see metadata for more information). U-index is consistent with the Analytical
Tools Interface for Landscape Assessments (ATtILA) version 2004. ATtILA user guide
can be found here: http://www.epa.gov/esd/land-sci/attila/pdf/user_guide.pdf.
Region 4 WSIO Version 1, October 2013. AG_CHG_2001_06_PCT_WS
Page 47 of 57

Watershed Indicators WSIO version 1.3
Order Indicator_Name Type Component Description Field_Name
231 % Human Use Change, U-Index Change 2001-06 HCZ Stressor
HCZ -History, Legacy
of past, trajectory of
future land use
The percent of HUC12 change in agricultural or urban classifications (U-index) within
the Hydrologically Connected Zone*. Change was determined by comparing the 2001
and 2006 National Land Cover Change Datasets; version 1. U-index land cover
classifications include 'Developed, Open Space' (code 21), 'Developed, Low Intensity'
(code 22), 'Developed, Medium Intensity' (code 23), 'Developed, High Intensity' (code
24), 'Pasture/Hay' (code 81), and 'Cultivated Crops' (code 82) by the 2006 National
Land Cover Database. Source data used was NLCD2006 version 1, downloaded
February 2011 (see metadata for more information). U-index is consistent with the
Analytical Tools Interface for Landscape Assessments (ATtILA) version 2004. ATtILA
user guide can be found here: http://www.epa.gov/esd/land-
sci/attila/pdf/user_guide.pdf. Region 4 WSIO Version 1, October 2013. *The
Hydrologically Connected Zone (HCZ, see metadata for more information) is
determined using grid analysis to combine surface water features from NLCD2006
and NHD Plus version 2. It also includes areas contiguous to surface water that also
has a wetness index value of 550 or greater. The combination of these three datasets
represents the Hydrologically Connected Zone (HCZ). U_INDEX_CHG_2001_06_PCT_HZ
232 % Human Use Change, U-Index 2 Change 2001-06 HCZ Stressor
HCZ -History, Legacy
of past, trajectory of
future land use
The percent of HUC12 change in barren, agricultural or urban classifications (U-index
2) within the Hydrologically Connected Zone*. Change was determined by comparing
the 2001 and 2006 National Land Cover Change Datasets; version 1. U-index 2 cover
classifications include 'Developed, Open Space' (code 21), 'Developed, Low Intensity'
(code 22), 'Developed, Medium Intensity' (code 23), 'Developed, High Intensity' (code
24), 'Barren Land (Rock/Sand/Clay)' (code 31), 'Pasture/Hay' (code 81), and
'Cultivated Crops' (code 82) by the 2006 National Land Cover Database. Source data
used was NLCD2006 version 1, downloaded February 2011 (see metadata for more
information). U-index 2 was modified from the Analytical Tools Interface for
Landscape Assessments (ATtILA) version 2004. ATtILA user guide can be found here:
http://www.epa.gov/esd/land-sci/attila/pdf/user_guide.pdf. Region 4 WSIO Version
1, October 2013. *The Hydrologically Connected Zone (HCZ, see metadata for more
information) is determined using grid analysis to combine surface water features
from NLCD2006 and NHD Plus version 2. It also includes areas contiguous to surface
water that also has a wetness index value of 550 or greater. The combination of these
three datasets represents the Hydrologically Connected Zone (HCZ). U_INDEX2_CHG_2001_06_PCT_HZ
233 % Urban Change 2001-06 HCZ Stressor
HCZ -History, Legacy
of past, trajectory of
future land use
The percent of HUC12 change in urban classifications within the Hydrologically
Connected Zone*. Change was determined by comparing the 2001 and 2006 National
Land Cover Change Datasets; version 1. Urban land cover classifications include
'Developed, Open Space' (code 21), 'Developed, Low Intensity' (code 22), 'Developed,
Medium Intensity' (code 23), and 'Developed, High Intensity' (code 24) by the 2006
National Land Cover Database. Source data used was NLCD2006 version 1,
downloaded February 2011 (see metadata for more information). Region 4 WSIO
Version 1, October 2013. *The Hydrologically Connected Zone (HCZ, see metadata for
more information) is determined using grid analysis to combine surface water
features from NLCD2006 and NHD Plus version 2. It also includes areas contiguous to
surface water that also has a wetness index value of 550 or greater. The combination
of these three datasets represents the Hydrologically Connected Zone (HCZ). URBAN_CHG_2001_06_PCT_HZ
Page 48 of 57

Watershed Indicators WSIO version 1.3
Order Indicator_Name Type Component Description Field_Name
234 % Agriculture Change 2001-06 HCZ Stressor
HCZ -History, Legacy
of past, trajectory of
future land use
The percent of HUC12 change in agricultural classifications within the Hydrologically
Connected Zone*. Change was determined by comparing the 2001 and 2006 National
Land Cover Change Datasets; version 1. Agricultural land cover classifications include
'Pasture/Hay' (code 81) and 'Cultivated Crops' (code 82) by the 2006 National Land
Cover Database. Source data used was NLCD2006 version 1, downloaded February
2011 (see metadata for more information). U-index is consistent with the Analytical
Tools Interface for Landscape Assessments (ATtILA) version 2004. ATtILA user guide
can be found here: http://www.epa.gov/esd/land-sci/attila/pdf/user_guide.pdf.
Region 4 WSIO Version 1, October 2013. *The Hydrologically Connected Zone (HCZ,
see metadata for more information) is determined using grid analysis to combine
surface water features from NLCD2006 and NHD Plus version 2. It also includes areas
contiguous to surface water that also has a wetness index value of 550 or greater.
The combination of these three datasets represents the Hydrologically Connected
Zone (HCZ). AG_CHG_2001_06_PCT_HZ
235 % Human Use Change, U-Index Change 2001-06 RZ Stressor
RZ -History, Legacy
of past, trajectory of
future land use
The percent of HUC12 change in agricultural or urban classifications (U-index) within
the Riparian Zone*. Change was determined by comparing the 2001 and 2006
National Land Cover Change Datasets; version 1. U-index land cover classifications
include 'Developed, Open Space' (code 21), 'Developed, Low Intensity' (code 22),
'Developed, Medium Intensity' (code 23), 'Developed, High Intensity' (code 24),
'Pasture/Hay' (code 81), and 'Cultivated Crops' (code 82) by the 2006 National Land
Cover Database. Source data used was NLCD2006 version 1, downloaded February
2011 (see metadata for more information). U-index is consistent with the Analytical
Tools Interface for Landscape Assessments (ATtILA) version 2004. ATtILA user guide
can be found here: http://www.epa.gov/esd/land-sci/attila/pdf/user_guide.pdf.
Region 4 WSIO Version 1, October 2013. *The Riparian Zone (RZ, see metadata for
more information) is determined using grid analysis to combine surface water
features from NLCD2006 and NHD Plus version 2; then an approximate 100 meter
buffer is placed around these features. The combination of these two datasets and
all cells with a distance of 108 meters or less from surface water are included in the
Riparian Zone (RZ). U_INDEX_CHG_2001_06_PCT_RZ
Page 49 of 57

Watershed Indicators WSIO version 1.3
Order Indicator_Name Type Component Description Field_Name
236 % Human Use Change, U-Index 2 Change 2001-06 RZ Stressor
RZ -History, Legacy
of past, trajectory of
future land use
The percent of HUC12 change in barren, agricultural or urban classifications (U-index
2) within the Riparian Zone*. Change was determined by comparing the 2001 and
2006 National Land Cover Change Datasets; version 1. U-index 2 cover classifications
include 'Developed, Open Space' (code 21), 'Developed, Low Intensity' (code 22),
'Developed, Medium Intensity' (code 23), 'Developed, High Intensity' (code 24),
'Barren Land (Rock/Sand/Clay)' (code 31), 'Pasture/Hay' (code 81), and 'Cultivated
Crops' (code 82) by the 2006 National Land Cover Database. Source data used was
NLCD2006 version 1, downloaded February 2011 (see metadata for more
information). U-index 2 was modified from the Analytical Tools Interface for
Landscape Assessments (ATtILA) version 2004. ATtILA user guide can be found here:
http://www.epa.gov/esd/land-sci/attila/pdf/user_guide.pdf. Region 4 WSIO Version
1, October 2013. *The Riparian Zone (RZ, see metadata for more information) is
determined using grid analysis to combine surface water features from NLCD2006
and NHD Plus version 2; then an approximate 100 meter buffer is placed around
these features. The combination of these two datasets and all cells with a distance of
108 meters or less from surface water are included in the Riparian Zone (RZ). U_INDEX2_CHG_2001_06_PCT_RZ
237 % Urban Change 2001-06 RZ Stressor
RZ -History, Legacy
of past, trajectory of
future land use
The percent of HUC12 change in urban classifications within the Riparian Zone*.
Change was determined by comparing the 2001 and 2006 National Land Cover
Change Datasets; version 1. Urban land cover classifications include 'Developed,
Open Space' (code 21), 'Developed, Low Intensity' (code 22), 'Developed, Medium
Intensity' (code 23), and 'Developed, High Intensity' (code 24) by the 2006 National
Land Cover Database. Source data used was NLCD2006 version 1, downloaded
February 2011 (see metadata for more information). Region 4 WSIO Version 1,
October 2013. *The Riparian Zone (RZ, see metadata for more information) is
determined using grid analysis to combine surface water features from NLCD2006
and NHD Plus version 2; then an approximate 100 meter buffer is placed around
these features. The combination of these two datasets and all cells with a distance of
108 meters or less from surface water are included in the Riparian Zone (RZ). URBAN_CHG_2001_06_PCT_RZ
238 % Agriculture Change 2001-06 RZ Stressor
RZ -History, Legacy
of past, trajectory of
future land use
The percent of HUC12 change in agricultural classifications within the Riparian Zone*.
Change was determined by comparing the 2001 and 2006 National Land Cover
Change Datasets; version 1. Agricultural land cover classifications include
'Pasture/Hay' (code 81) and 'Cultivated Crops' (code 82) by the 2006 National Land
Cover Database. Source data used was NLCD2006 version 1, downloaded February
2011 (see metadata for more information). U-index is consistent with the Analytical
Tools Interface for Landscape Assessments (ATtILA) version 2004. ATtILA user guide
can be found here: http://www.epa.gov/esd/land-sci/attila/pdf/user_guide.pdf.
Region 4 WSIO Version 1, October 2013. *The Riparian Zone (RZ, see metadata for
more information) is determined using grid analysis to combine surface water
features from NLCD2006 and NHD Plus version 2; then an approximate 100 meter
buffer is placed around these features. The combination of these two datasets and
all cells with a distance of 108 meters or less from surface water are included in the
Riparian Zone (RZ). AG_CHG_2001_06_PCT_RZ
Page 50 of 57

Watershed Indicators WSIO version 1.3
Order Indicator_Name Type Component Description Field_Name
239 Single State HUC12 Flag Social Flags
Classifies HUC12 watershed as located entirely in one single US state or overlapping
multiple states. Value of 1 if HUC12 is located in a single state. Value of 0 if HUC12
overlaps multiple states. Calculated from the US Census Bureau 2013 TIGER state
boundaries (downloaded July 2014) and the "NHDPlus2 WBD Snapshot” (downloaded
March 2014). INSTATE_14_15
240 Watershed Streamlength Assessed Social Level of Information
Length of stream features assessed under Section 305(b) of the Clean Water Act in
HUC12 (kilometers). Represents only the most recent assessment cycle that the state
has provided to EPA as geospatial data. Calculated from the EPA Office of Water
"305(b) Waters as Assessed" NHD-indexed dataset. Only includes length of lines
meeting criteria for classification as "streams". These criteria include: (1) feature has
NHD REACHCODE with FTYPE equal to StreamRiver, CanalDitch, or Connector; (2)
feature has NHD REACHCODE with FTYPE equal to Artificial Path and FTYPE of
corresponding NHDArea feature is StreamRiver; or (3) feature is custom-added to the
EPA Reach Address Database and is not in the NHD (blank NHD REACHCODE). STREAMLGTH_305B
241 % Watershed Streamlength Assessed Social Level of Information
Percent of stream features in HUC12 assessed under Section 305(b) of the Clean
Water Act. Calculated as length of assessed streams (STREAMLGTH_305B) divided by
total stream length (STREAMLGTH_NHD + STREAMLGTH_305B_CUSTOM). STREAMLGTH_305B_PCT
242 Watershed Waterbody Area Assessed Social Level of Information
Area of lakes, estuaries, and other areal water features assessed under Section 305(b)
of the Clean Water Act in HUC12 (square kilometers). Calculated from the EPA Office
of Water "305(b) Waters as Assessed" NHD-indexed dataset. WBAREA_305B
243 % Watershed Waterbody Area Assessed Social Level of Information
Percent of lakes, estuaries, and other areal water features in HUC12 assessed under
Section 305(b) of the Clean Water Act. Calculated as area of assessed waterbodies
(WBAREA_305B) divided by total waterbody area (WBAREA_NHD +
WBAREA_305B_CUSTOM). WBAREA_305B_PCT
244 Watershed Segments with TMDLs Count Social Level of Information
Count of waters with TMDLs in HUC12. Calculated as the number of unique state-
assigned water segment IDs the EPA Office of Water "Impaired Waters with TMDLs"
NHD-indexed dataset. CNT_TMDL_WATERS
245 Watershed TMDL-Segment-Cause Count Social Level of Information
Count of impairments with TMDLs in HUC12. Calculated as the number of unique
water segment ID-parent cause of impairment combinations in the EPA Office of
Water "Impaired Waters with TMDLs" NHD-indexed dataset. CNT_TMDL_IMPAIRMENTS
246 Watershed TMDL-Segment-Pollutant Count Social Level of Information
Count of TMDLs in HUC12. Calculated as the number of unique water segment ID-
TMDL pollutant combinations in the EPA Office of Water "Impaired Waters with
TMDLs" NHD-indexed dataset. CNT_TMDLS
247 Watershed Count Ratio TMDLs to Impairments Social Level of Information
Ratio of number of TMDLs to impairments in HUC12. Calculated from TMDL count
(CNT_TMDLS) and count of impairments for 303(d) listed waters/waters with TMDLs
(CNT_303DTMDL_IMPAIRMENTS). TMDL_IMPAIRMENT_RAT
248 Watershed Streamlength with TMDLs Social Level of Information
Length of stream features with TMDLs in HUC12 (kilometers). Calculated from the
EPA Office of Water "Impaired Waters with TMDLs" NHD-indexed dataset. Only
includes length of lines meeting criteria for classification as "streams" and with
"Sediment" or "Turbidity" listed as a parent cause of impairment. Criteria for stream
classification include: (1) feature has NHD REACHCODE with FTYPE equal to
StreamRiver, CanalDitch, or Connector; (2) feature has NHD REACHCODE with FTYPE
equal to Artificial Path and FTYPE of corresponding NHDArea feature is StreamRiver;
or (3) feature is custom-added to the EPA Reach Address Database and is not in the
NHD (blank NHD REACHCODE). STREAMLGTH_TMDL
Page 51 of 57

Watershed Indicators WSIO version 1.3
Order Indicator_Name Type Component Description Field_Name
249 % Watershed Streamlength with TMDLs Social Level of Information
Percent of stream features in HUC12 with TMDLs. Calculated as length of streams
with TMDLs (STREAMLGTH_TMDL) divided by total stream length
(STREAMLGTH_NHD + STREAMLGTH_TMDL_CUSTOM). STREAMLGTH_TMDL_PCT
250 Watershed Waterbody Area with TMDLs Social Level of Information
Area of lakes, estuaries, and other areal water features with TMDLs in HUC12 (square
kilometers). Calculated from the EPA Office of Water "Impaired Waters with TMDLs"
NHD-indexed dataset. WBAREA_TMDL
251 % Watershed Waterbody Area with TMDLs Social Level of Information
Percent of lakes, estuaries, and other areal water features in HUC12 with TMDLs.
Calculated from area of waterbodies with TMDLs (WBAREA_303D) and total
waterbody area (WBAREA_NHD + WBAREA_TMDL_CUSTOM). WBAREA_TMDL_PCT
252 Watershed Streamlength with Nutrient TMDLs Social Level of Information
Length of stream features with a nutrient-related TMDL in HUC12 (kilometers).
Calculated from the EPA Office of Water "Impaired Waters with TMDLs" NHD-indexed
dataset. Only includes length of lines meeting criteria for classification as "streams"
and with "Nutrients", "Organic Enrichment/Oxygen Depletion", "Algal Growth", or
"Noxious Aquatic Plants" listed as a parent TMDL pollutant. Criteria for stream
classification include: (1) feature has NHD REACHCODE with FTYPE equal to
StreamRiver, CanalDitch, or Connector; (2) feature has NHD REACHCODE with FTYPE
equal to Artificial Path and FTYPE of corresponding NHDArea feature is StreamRiver;
or (3) feature is custom-added to the EPA Reach Address Database and is not in the
NHD (blank NHD REACHCODE). STREAMLGTH_TMDL_NUTRIENTS
253 % Watershed Streamlength with Nutrient TMDLs Social Level of Information
Percent of stream features in HUC12 with a nutrient-related TMDL. Calculated as
length of 303(d) listed nutrient impaired streams (STREAMLGTH_TMDL_NUTRIENTS)
divided by total stream length (STREAMLGTH_NHD + STREAMLGTH_TMDL_CUSTOM). STREAMLGTH_TMDL_NUTRIENTS_PCT
254 Watershed Waterbody Area with Nutrient TMDLs Social Level of Information
Area of lakes, estuaries, and other areal water features with a nutrient-related TMDL
in HUC12 (kilometers). Calculated from the EPA Office of Water "Impaired Waters
with TMDLs" NHD-indexed dataset. Only includes area of polygons with "Nutrients",
"Organic Enrichment/Oxygen Depletion", "Algal Growth", or "Noxious Aquatic Plants"
listed as a parent TMDL pollutant. WBAREA_TMDL_NUTRIENTS
255 % Watershed Waterbody Area with Nutrient TMDLs Social Level of Information
Percent of assessed lakes, estuaries, and other areal water features in HUC12 with a
nutrient-related TMDL. Calculated as area of waterbodies with a nutrient-related
TMDL (WBAREA_TMDL_NUTRIENTS) divided by total waterbody area (WBAREA_NHD
+ WBAREA_TMDL_CUSTOM). WBAREA_TMDL_NUTRIENTS_PCT
256 Watershed Segments with Nutrient TMDLs Count Social Level of Information
Count of waters with a nutrient-related TMDL in HUC12. Calculated as the number of
unique state-assigned water segment IDs the EPA Office of Water "Impaired Waters
with TMDLs" NHD-indexed dataset with "Nutrients", "Organic Enrichment/Oxygen
Depletion", "Algal Growth", or "Noxious Aquatic Plants" listed as a parent TMDL
pollutant. CNT_TMDL_WATERS_NUTRIENTS
257 Watershed Streamlength with Pathogen TMDLs Social Level of Information
Length of stream features with a pathogen TMDL in HUC12 (kilometers). Calculated
from the EPA Office of Water "Impaired Waters with TMDLs" NHD-indexed dataset.
Only includes length of lines meeting criteria for classification as "streams" and with
"Pathogens" listed as a parent TMDL pollutant. Criteria for stream classification
include: (1) feature has NHD REACHCODE with FTYPE equal to StreamRiver,
CanalDitch, or Connector; (2) feature has NHD REACHCODE with FTYPE equal to
Artificial Path and FTYPE of corresponding NHDArea feature is StreamRiver; or (3)
feature is custom-added to the EPA Reach Address Database and is not in the NHD
(blank NHD REACHCODE). STREAMLGTH_TMDL_PATHOGENS
Page 52 of 57

Watershed Indicators WSIO version 1.3
Order Indicator_Name Type Component Description Field_Name
258 % Watershed Streamlength with Pathogen TMDLs Social Level of Information
Percent of stream features in HUC12 with a pathogen TMDL. Calculated as length of
303(d) listed pathogen impaired streams (STREAMLGTH_TMDL_PATHOGENS) divided
by total stream length (STREAMLGTH_NHD + STREAMLGTH_TMDL_CUSTOM). STREAMLGTH_TMDL_PATHOGENS_PCT
259 Watershed Waterbody Area with Pathogen TMDLs Social Level of Information
Area of lakes, estuaries, and other areal water features with a pathogens TMDL in
HUC12 (kilometers). Calculated from the EPA Office of Water "Impaired Waters with
TMDLs" NHD-indexed dataset. Only includes area of polygons with "Pathogens" listed
as a parent TMDL pollutant. WBAREA_TMDL_PATHOGENS
260 % Watershed Waterbody Area with Pathogen TMDLs Social Level of Information
Area of lakes, estuaries, and other areal water features in HUC12 with a pathogens
TMDL. Calculated as area of waterbodies with a pathogens TMDL
(WBAREA_TMDL_PATHOGENS) divided by total waterbody area (WBAREA_NHD +
WBAREA_TMDL_CUSTOM). WBAREA_TMDL_PATHOGENS_PCT
261 Watershed Segments with Pathogen TMDLs Count Social Level of Information
Count of waters with a pathogens TMDL in HUC12. Calculated as the number of
unique state-assigned water segment IDs the EPA Office of Water "Impaired Waters
with TMDLs" NHD-indexed dataset with "Pathogens" listed as a parent TMDL
pollutant. CNT_TMDL_WATERS_PATHOGENS
262 Watershed Streamlength with Sediment TMDLs Social Level of Information
Length of stream features with a sediment TMDL in HUC12 (kilometers). Calculated
from the EPA Office of Water "Impaired Waters with TMDLs" NHD-indexed dataset.
Only includes length of lines meeting criteria for classification as "streams" and with
"Sediment" or "Turbidity" listed as a parent TMDL pollutant. Criteria for stream
classification include: (1) feature has NHD REACHCODE with FTYPE equal to
StreamRiver, CanalDitch, or Connector; (2) feature has NHD REACHCODE with FTYPE
equal to Artificial Path and FTYPE of corresponding NHDArea feature is StreamRiver;
or (3) feature is custom-added to the EPA Reach Address Database and is not in the
NHD (blank NHD REACHCODE). STREAMLGTH_TMDL_SEDIMENT
263 % Watershed Streamlength with Sediment TMDLs Social Level of Information
Percent of stream features in HUC12 with a sediment TMDL. Calculated as length of
streams with sediment TMDLs (STREAMLGTH_TMDL_SEDIMENT) divided by total
stream length (STREAMLGTH_NHD + STREAMLGTH_TMDL_CUSTOM). STREAMLGTH_TMDL_SEDIMENT_PCT
264 Watershed Waterbody Area with Sediment TMDLs Social Level of Information
Area of lakes, estuaries, and other areal water features with a sediment TMDL in
HUC12 (kilometers). Calculated from the EPA Office of Water "Impaired Waters with
TMDLs" NHD-indexed dataset. Only includes area of polygons with "Sediment" or
"Turbidity" listed as a parent TMDL pollutant. WBAREA_TMDL_SEDIMENT
265 % Watershed Waterbody Area with Sediment TMDLs Social Level of Information
Percent of lakes, estuaries, and other areal water features in HUC12 with a sediment
TMDL. Calculated as area of waterbodies with sediment a TMDL
(WBAREA_TMDL_SEDIMENT) divided by total waterbody area (WBAREA_NHD +
WBAREA_TMDL_CUSTOM). WBAREA_TMDL_SEDIMENT_PCT
266 Watershed Segments with Sediment TMDLs Count Social Level of Information
Count of waters with a sediment TMDL in HUC12. Calculated as the number of unique
state-assigned water segment IDs the EPA Office of Water "Impaired Waters with
TMDLs" NHD-indexed dataset with "Sediment" or "Turbidity" listed as a parent TMDL
pollutant. CNT_TMDL_WATERS_SEDIMENT
Page 53 of 57

Watershed Indicators WSIO version 1.3
Order Indicator_Name Type Component Description Field_Name
267 Watershed Streamlength with Metals TMDLs Social Level of Information
Length of stream features with a metals TMDL in HUC12 (kilometers). Calculated from
the EPA Office of Water "Impaired Waters with TMDLs" NHD-indexed dataset. Only
includes length of lines meeting criteria for classification as "streams" and with
"Metals (other than Mercury)" listed as a parent TMDL pollutant. Criteria for stream
classification include: (1) feature has NHD REACHCODE with FTYPE equal to
StreamRiver, CanalDitch, or Connector; (2) feature has NHD REACHCODE with FTYPE
equal to Artificial Path and FTYPE of corresponding NHDArea feature is StreamRiver;
or (3) feature is custom-added to the EPA Reach Address Database and is not in the
NHD (blank NHD REACHCODE). STREAMLGTH_TMDL_METALS
268 % Watershed Streamlength with Metals TMDLs Social Level of Information
Percent of stream features in HUC12 with a metals TMDL. Calculated as length of
303(d) listed metals impaired streams (STREAMLGTH_TMDL_METALS) divided by
total stream length (STREAMLGTH_NHD + STREAMLGTH_TMDL_CUSTOM). STREAMLGTH_TMDL_METALS_PCT
269 Watershed Waterbody Area with Metals TMDLs Social Level of Information
Area of lakes, estuaries, and other areal water features with a metals TMDL in HUC12
(kilometers). Calculated from the EPA Office of Water "Impaired Waters with TMDLs"
NHD-indexed dataset. Only includes area of polygons with "Metals (other than
Mercury)" listed as a parent TMDL pollutant. WBAREA_TMDL_METALS
270 % Watershed Waterbody Area with Metals TMDLs Social Level of Information
Percent of lakes, estuaries, and other areal water features in HUC12 with a metals
TMDL. Calculated as area of waterbodies with a metals TMDL
(WBAREA_TMDL_METALS) divided by total waterbody area (WBAREA_NHD +
WBAREA_TMDL_CUSTOM). WBAREA_TMDL_METALS_PCT
271 Watershed Segments with Metals TMDLs Count Social Level of Information
Count of waters with a metals TMDL in HUC12. Calculated as the number of unique
state-assigned water segment IDs the EPA Office of Water "Impaired Waters with
TMDLs" NHD-indexed dataset with "Metals (other than Mercury)" listed as a parent
TMDL pollutant. CNT_TMDL_WATERS_METALS
272 Percent potentially restorable wetlands WS Social
Complexity /
Suitability
An estimate of the percent of land within a HUC12 that may be suitable for wetland
restoration. Metadata can be found here:
https://edg.epa.gov/metadata/catalog/search/resource/details.page?uuid=%7B80AF
CF1D-0C2B-4E4A-B07A-B2B57E6772D5%7D. This dataset was created through the
EnviroAtlas development effort. EnviroAtlas is a collection of interactive tools and
resources that allows users to explore the many benefits people receive from nature,
often referred to as ecosystem services. Additional information can be found here:
http://enviroatlas.epa.gov/enviroatlas/atlas.html and
http://enviroatlas.epa.gov/EnviroAtlas/DataFactSheets. Method: The EnviroAtlas
HUC12 table was translated to WBD HUC12s (August 2014). Region 4 WSIO Version 1. WTLD_REST_POT_PCT_WS
273 Watershed NPDES Permit Count Social
Complexity /
Suitability
Count of National Permit Discharge Elimination System (NPDES) permits in the HUC12
watershed, including both active and expired NPDES permits. Provides an estimate of
the prevalence of point sources of pollution in the HUC12 watershed. Calculated from
the EPA Office of Water "NPDES Permitted Facilities" NHD-indexed dataset
(downloaded February 2014) and the "NHDPlus2 WBD Snapshot" (downloaded
March 2014). Calculated as the number of NPDES permit features in each HUC12
polygon. NPDES_PERMIT_CNT
Page 54 of 57

Watershed Indicators WSIO version 1.3
Order Indicator_Name Type Component Description Field_Name
274 Percent small natural areas WS Social
Complexity /
Suitability
The percent of land within a HUC12 that are covered by small patches of natural
areas. Small natural areas are less 500 acres and covered by forests, shrubs,
grasslands, barren land, or wetlands. It excludes areas that are covered by agriculture
and developed land. Metadata can be found here:
https://edg.epa.gov/metadata/catalog/search/resource/details.page?uuid=%7BB803
EDB7-3BE0-4ADF-870C-2EB9733310AE%7D. This dataset was created through the
EnviroAtlas development effort. EnviroAtlas is a collection of interactive tools and
resources that allows users to explore the many benefits people receive from nature,
often referred to as ecosystem services. Additional information can be found here:
http://enviroatlas.epa.gov/enviroatlas/atlas.html and
http://enviroatlas.epa.gov/EnviroAtlas/DataFactSheets. Method: The EnviroAtlas
HUC12 table was translated to WBD HUC12s (August 2014). Region 4 WSIO Version 1. NAT_SM_AREA_PCT_WS
275 Percent medium natural areas WS Social
Complexity /
Suitability
The percent of land within each HUC12 that are covered by medium sized natural
areas. Medium natural areas are areas less than 25,000 acres but greater than 500
acres and are covered by forests, shrubs, grasslands, barren land, or wetlands. It
excludes areas that are covered by agriculture and developed land. Metadata can be
found here:
https://edg.epa.gov/metadata/catalog/search/resource/details.page?uuid=%7BB803
EDB7-3BE0-4ADF-870C-2EB9733310AE%7D. This dataset was created through the
EnviroAtlas development effort. EnviroAtlas is a collection of interactive tools and
resources that allows users to explore the many benefits people receive from nature,
often referred to as ecosystem services. Additional information can be found here:
http://enviroatlas.epa.gov/enviroatlas/atlas.html and
http://enviroatlas.epa.gov/EnviroAtlas/DataFactSheets. Method: The EnviroAtlas
HUC12 table was translated to WBD HUC12s (August 2014). Region 4 WSIO Version 1. NAT_MD_AREA_PCT_WS
276 Percent large natural areas WS Social
Complexity /
Suitability
The percent of land within each HUC12 that are covered by large natural areas. Large
natural areas are greater than 25,000 acres and covered by forests, shrubs,
grasslands, barren land, or wetlands. It excludes areas that are covered by agriculture
and developed land. Metadata can be found here:
https://edg.epa.gov/metadata/catalog/search/resource/details.page?uuid=%7BB803
EDB7-3BE0-4ADF-870C-2EB9733310AE%7D. This dataset was created through the
EnviroAtlas development effort. EnviroAtlas is a collection of interactive tools and
resources that allows users to explore the many benefits people receive from nature,
often referred to as ecosystem services. Additional information can be found here:
http://enviroatlas.epa.gov/enviroatlas/atlas.html and
http://enviroatlas.epa.gov/EnviroAtlas/DataFactSheets. Method: The EnviroAtlas
HUC12 table was translated to WBD HUC12s (August 2014). Region 4 WSIO Version 1. NAT_LG_AREA_PCT_WS
Page 55 of 57
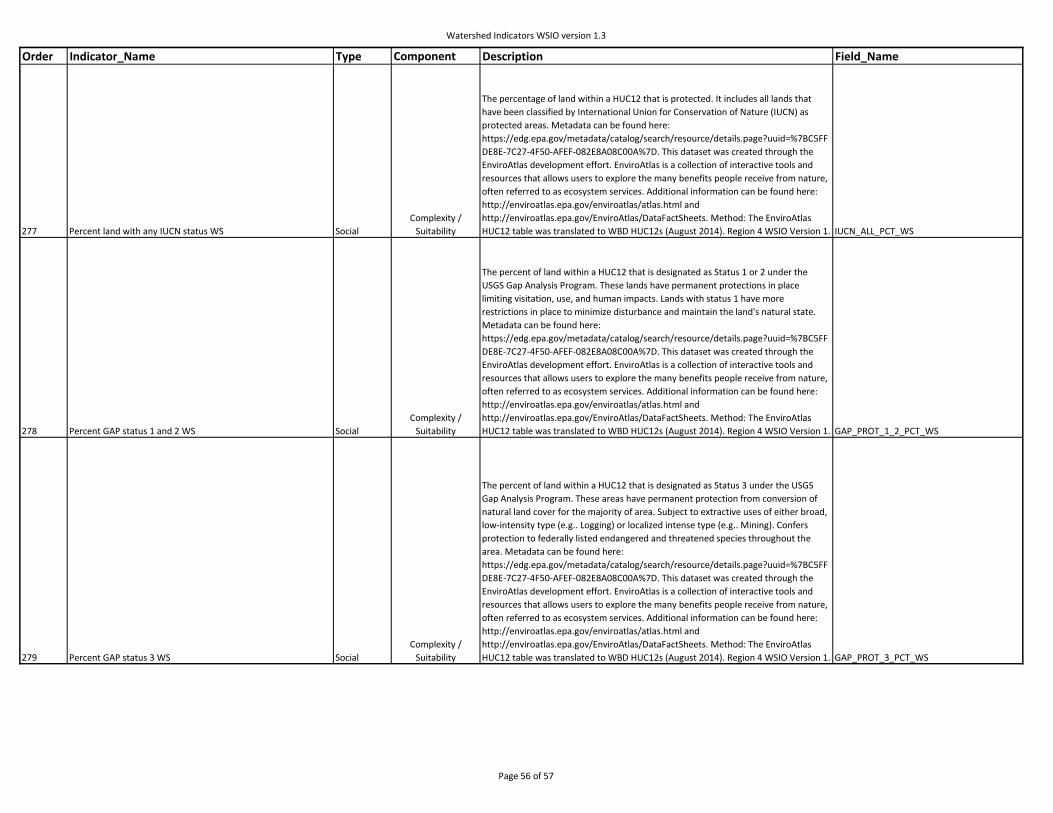
Watershed Indicators WSIO version 1.3
Order Indicator_Name Type Component Description Field_Name
277 Percent land with any IUCN status WS Social
Complexity /
Suitability
The percentage of land within a HUC12 that is protected. It includes all lands that
have been classified by International Union for Conservation of Nature (IUCN) as
protected areas. Metadata can be found here:
https://edg.epa.gov/metadata/catalog/search/resource/details.page?uuid=%7BC5FF
DE8E-7C27-4F50-AFEF-082E8A08C00A%7D. This dataset was created through the
EnviroAtlas development effort. EnviroAtlas is a collection of interactive tools and
resources that allows users to explore the many benefits people receive from nature,
often referred to as ecosystem services. Additional information can be found here:
http://enviroatlas.epa.gov/enviroatlas/atlas.html and
http://enviroatlas.epa.gov/EnviroAtlas/DataFactSheets. Method: The EnviroAtlas
HUC12 table was translated to WBD HUC12s (August 2014). Region 4 WSIO Version 1. IUCN_ALL_PCT_WS
278 Percent GAP status 1 and 2 WS Social
Complexity /
Suitability
The percent of land within a HUC12 that is designated as Status 1 or 2 under the
USGS Gap Analysis Program. These lands have permanent protections in place
limiting visitation, use, and human impacts. Lands with status 1 have more
restrictions in place to minimize disturbance and maintain the land's natural state.
Metadata can be found here:
https://edg.epa.gov/metadata/catalog/search/resource/details.page?uuid=%7BC5FF
DE8E-7C27-4F50-AFEF-082E8A08C00A%7D. This dataset was created through the
EnviroAtlas development effort. EnviroAtlas is a collection of interactive tools and
resources that allows users to explore the many benefits people receive from nature,
often referred to as ecosystem services. Additional information can be found here:
http://enviroatlas.epa.gov/enviroatlas/atlas.html and
http://enviroatlas.epa.gov/EnviroAtlas/DataFactSheets. Method: The EnviroAtlas
HUC12 table was translated to WBD HUC12s (August 2014). Region 4 WSIO Version 1. GAP_PROT_1_2_PCT_WS
279 Percent GAP status 3 WS Social
Complexity /
Suitability
The percent of land within a HUC12 that is designated as Status 3 under the USGS
Gap Analysis Program. These areas have permanent protection from conversion of
natural land cover for the majority of area. Subject to extractive uses of either broad,
low-intensity type (e.g.. Logging) or localized intense type (e.g.. Mining). Confers
protection to federally listed endangered and threatened species throughout the
area. Metadata can be found here:
https://edg.epa.gov/metadata/catalog/search/resource/details.page?uuid=%7BC5FF
DE8E-7C27-4F50-AFEF-082E8A08C00A%7D. This dataset was created through the
EnviroAtlas development effort. EnviroAtlas is a collection of interactive tools and
resources that allows users to explore the many benefits people receive from nature,
often referred to as ecosystem services. Additional information can be found here:
http://enviroatlas.epa.gov/enviroatlas/atlas.html and
http://enviroatlas.epa.gov/EnviroAtlas/DataFactSheets. Method: The EnviroAtlas
HUC12 table was translated to WBD HUC12s (August 2014). Region 4 WSIO Version 1. GAP_PROT_3_PCT_WS
Page 56 of 57
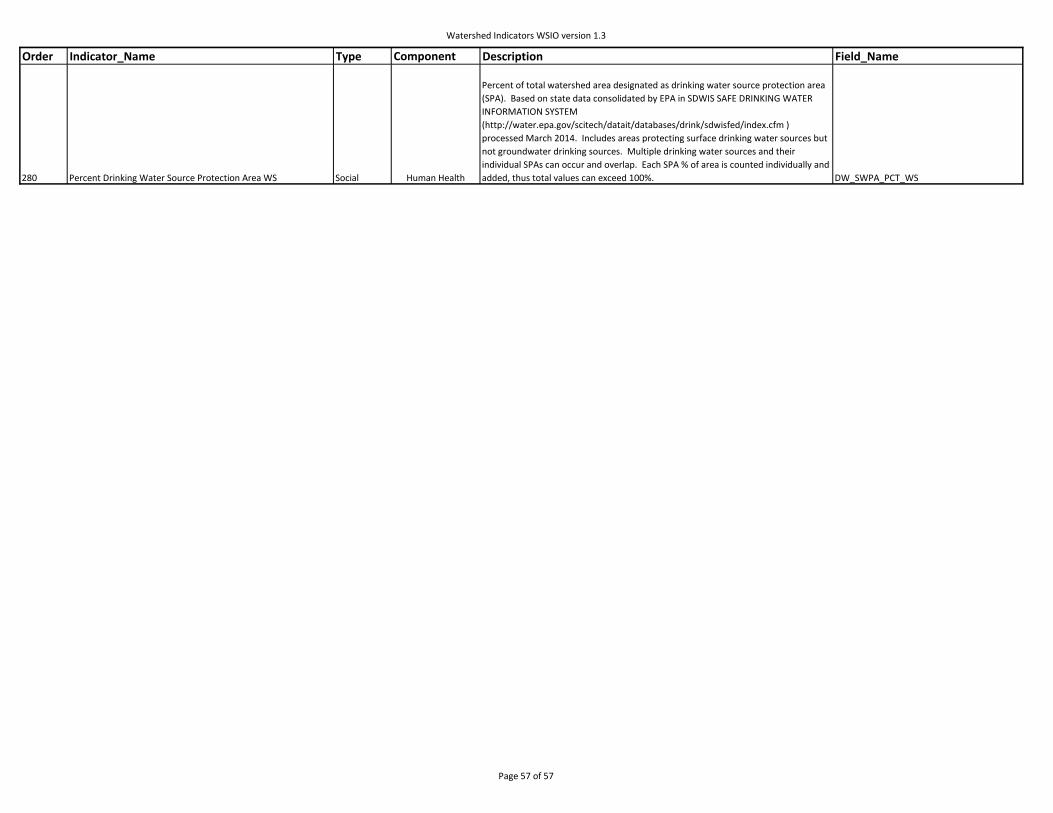
Watershed Indicators WSIO version 1.3
Order Indicator_Name Type Component Description Field_Name
280 Percent Drinking Water Source Protection Area WS Social Human Health
Percent of total watershed area designated as drinking water source protection area
(SPA). Based on state data consolidated by EPA in SDWIS SAFE DRINKING WATER
INFORMATION SYSTEM
(http://water.epa.gov/scitech/datait/databases/drink/sdwisfed/index.cfm )
processed March 2014. Includes areas protecting surface drinking water sources but
not groundwater drinking sources. Multiple drinking water sources and their
individual SPAs can occur and overlap. Each SPA % of area is counted individually and
added, thus total values can exceed 100%. DW_SWPA_PCT_WS
Page 57 of 57