watershed scale response to climate change—feather river ... · generation within the basin...
TRANSCRIPT

Study AreaIntroduction
U.S. Department of the InteriorU.S. Geological Survey
Fact Sheet 2011–3125March 2012
Introduction
General Circulation Model (GCM) simulations of future climate through 2099 project a wide range of possible scenarios (Intergovernmental Panel on Climate Change, 2007). To deter-mine the sensitivity and potential effect of long-term climate change on the freshwater resources of the United States, the U.S. Geological Survey Global Change study, “An integrated watershed scale response to global change in selected basins across the United States” was started in 2008. The long-term goal of this national study is to provide the foundation for hydrologically based climate-change studies across the nation.
Fourteen basins for which the Precipitation Runoff Model-ing System (PRMS) has been calibrated and evaluated were selected as study sites. PRMS is a deterministic, distributed-parameter watershed model developed to evaluate the effects of various combinations of precipitation, temperature, and land use on streamflow and general basin hydrology. Output from five GCMs and four emission scenarios were used to develop an ensemble of climate-change scenarios for each basin. These ensembles were simulated with the corresponding PRMS model. This fact sheet summarizes the hydrologic effect and sensitivity of the PRMS simulations to climate change for the Feather River Basin in California (fig. 1) presented in the proj-ect summary report (Markstrom and others, 2012) and a journal article (Hay and others, 2011).
Study Area
The Feather River Basin, California, is a valuable hydrologic resource for California (Koczot and others, 2005). The basin is a major contributor to the California State Water Project (SWP), which distributes water throughout California for domestic use, irrigation, and hydropower production. The basin outlet reservoir, Lake Oroville, holds 8 percent of the state’s reservoir capacity and plays an important role in flood management, water quality, and the health of fisheries, affecting areas down-stream at least as far south as the Sacramento/San Joaquin River Delta. The climate is Mediterranean, with warm dry summers and cool wet winters. Spring snowmelt from the basin is relied upon to meet the SWP’s summer water demands.
The Feather River Basin is senstive to slight changes in temperature which affect the formation and melting of snow. The 9,324-square-kilometer (km2) basin ranges in elevation from 325 to 2,212 meters and includes large areas that are at or near the historical snowline; winter rain or rain-on-snow occurrences are common. This basin is recognized as one of the first in California anticipated to be affected by climate-induced change to the snowpack. Changes to the snowpack will have large effects on the timing and quantity of streamflow (Free-man, 2008).
Previous studies focused on seasonal (3 to 9 month) and medium-range (1 week to 1 month) streamflow forecasts
(Koczot and others, 2005). In the Feather River Basin, the California Department of Water Resources makes seasonal and medium-range forecasts of total streamflow into Lake Oroville, and hydroelectric power operators use their own suite of statistical models to manage power generation within the basin (David Rizzardo, California Department of Water Resources Division of Flood Management Hydrology Branch, written commun., 2010). Agricultural, fishery, logging, and local user groups may benefit from improved forecasts of long term climatological trends. Improved understand-ing of how the Feather River Basin responds to changing climatic conditions will help water managers safeguard this resource.
Watershed Scale Response to Climate Change—Feather River Basin, California

General Circulation ModelsGeneral Circulation Models
Given the uncertainty in climate modeling, it is desirable to use more than one GCM to obtain a range of potential future climatic conditions. Monthly precipitation and temperature output from five GCMs were processed (table 1).
High 4,314
Low -79
EXPLANATION
Base from U.S. Geological Survey digital data, 2011 1:100,000Albers Equal-Area Conic projectionStandard parallels 29°30'N and 45°30'NCentral meridian 96°00'W, Latitude of origin 23°00'N
Horizontal coordinate information is referenced to theWorld Geodetic System of 1984 (WGS 84)
Elevation in metersLakeOroville
Feather River
0 126 18 24 MILES
0 12 186 24 KILOMETERS
120°15’
39°30’
121°30’
121°
15’
45’
30’
40°15’
45’
40°
INDEX MAP
Study area
CALIFORNIA
N:\Jeff\den11_hwcg00_0118_sir_markstrom\fs\working_files\FeatherRiverBasin\feather_river_fig.ai
Figure 1. Precipitation Runoff Modeling System study locations and location of the Feather River Basin, California, with a drainage area of 9,324 square kilometers and elevation range from 325 to 2,212 meters.
Table 1. General Circulation Model (GCM) projections used in this study.
GCM Center and country of origin
BCC–BCM2.0 Bjerknes Centre for Climate Research, NorwayCSIRO–Mk3.0 Australia’s Commonwealth Scientific and Industrial Research Organization, AustraliaCSIRO–Mk3.5 Australia’s Commonwealth Scientific and Industrial Research Organization, AustraliaINM–CM3.0 Institute for Numerical Mathematics, RussiaMIROC3.2 National Institute for Environmental Studies, Japan

Results
Climate-change fields were derived by calculating the change in climate from current (water years 1988–1999) to future conditions simulated by each GCM. The 20C3M simula-tion for water years 1988–1999 was used to represent current climatic conditions. This 12-year period of record was chosen based on the overlap of the available historical records from the 14 basins included in the national study. Climate change fields (percentage changes in precipitation and degree changes in temperature) were computed for 12-year moving window periods (from 2001–2099) using the 20C3M (1988–1999) and the A1B, B1, and A2 emission scenarios. A 12-year moving window, starting in 2001 and ending in 2099, results in 1,320 future scenarios [(88, 12-year climatologies, 1 per year starting with 2001–2012 and ending with 2088–2099) x (3 emission scenarios) x (5 GCMs)].
Climate-change scenarios were generated for PRMS by modifying PRMS precipitation and temperature inputs with the mean monthly climate change fields derived from the GCMs, resulting in 1,320 PRMS-input files. Table 3 shows the change (slope) and adjusted R2 (adjR2) for the least squares fit to the trend line for selected output variables from the PRMS projec-tions. The slope indicates the change in the selected variable by year. The adjusted R2 value gives an indication of the variability in the central tendency of the trend line.
Figure 2 shows a summary of the projected range in 11-year moving mean daily values of maximum temperature (fig. 2A), minimum temperature (fig. 2B), and precipitation (fig. 2C) by emission scenario. The first year of each 12-year simulation was used as PRMS initialization and is not included in the results. The three solid-colored lines indicate the 11-year moving mean values (x-axis indicates center of 11-year window) for the three future emission scenarios (central tendency of the five GCMs for each emission scenario). The projected range shown for each
emission scenario indicates the range of potential future climatic conditions simulated by the five GCMs. All GCM simulations project steady increases in maximum and minimum tempera-ture (table 3), with uncertainties associated with these GCM projections increasing with time. Both maximum and minimum temperatures show the smallest projected changes for the B1 emission scenario. Projections of mean annual precipitation for the Feather River Basin are highly variable, with no significant overall positive or negative trend (table 3). The wide range in the precipitation projections indicates a large amount of uncertainty. For the Feather River Basin area, the GCM models simulate precipitation as decadal oscillations of wetter and drier cycles, as seen in the central tendency lines for each scenario (fig. 2C).
Results
PRMS simulates spatially distributed streamflow, compo-nents of flow (surface, subsurface, and groundwater), snowpack conditions, and many other hydrologic components of interest. Figure 3 shows the projected range in 11-year moving mean daily values of streamflow (fig. 3A) and the components of flow (figs. 3B-3D) by emission scenario. In all plots, especially in GCM simulations made using the A2 scenario (red), decadal oscillations of higher and lower flows are evident. These cor-respond with the wetter and drier precipitation oscillation cycles in figure 2C. No significant overall trends are detected in the central tendencies of streamflow and components of flow with the exception of a negative trend in the A1B emission scenario for the groundwater flow component (table 3).
Projected changes in simulated monthly snowmelt are shown in figure 4. The solid-red lines in figure 4 show PRMS-simulated mean monthly baseline conditions (1989–1999) for snowmelt. The boxplots represent the range in the projected
The GCM outputs were obtained from the World Climate Research Programme’s Coupled Model Intercomparison Project phase 3 multi-model dataset archive, which was referenced in the Intergovernmental Panel on Climate Change Fourth Assessment Special Report on Emission scenarios (Intergovernmental Panel on Climate Change, 2007). For each GCM, one current (water years 1988–1999) and three future emission scenarios were used and are described in table 2.
Table 2. Climate-change emission scenarios simulated by the General Circulation Models in this study.
Emission scenario Description/assumptions
20C3M 20th century climate used to determine baseline (1989–1999) conditionsA1B Rapid economic growth, a global population that peaks in mid-21st century and rapid introduction of new and
more efficient technologies with a balanced emphasis on all energy sourcesB1 Convergent world, with the same global population as Emission scenario A1B, but with more rapid changes in
economic structures toward a service and information economy that is more ecologically friendlyA2 Heterogeneous world with high population growth, slow economic development, and slow technological change
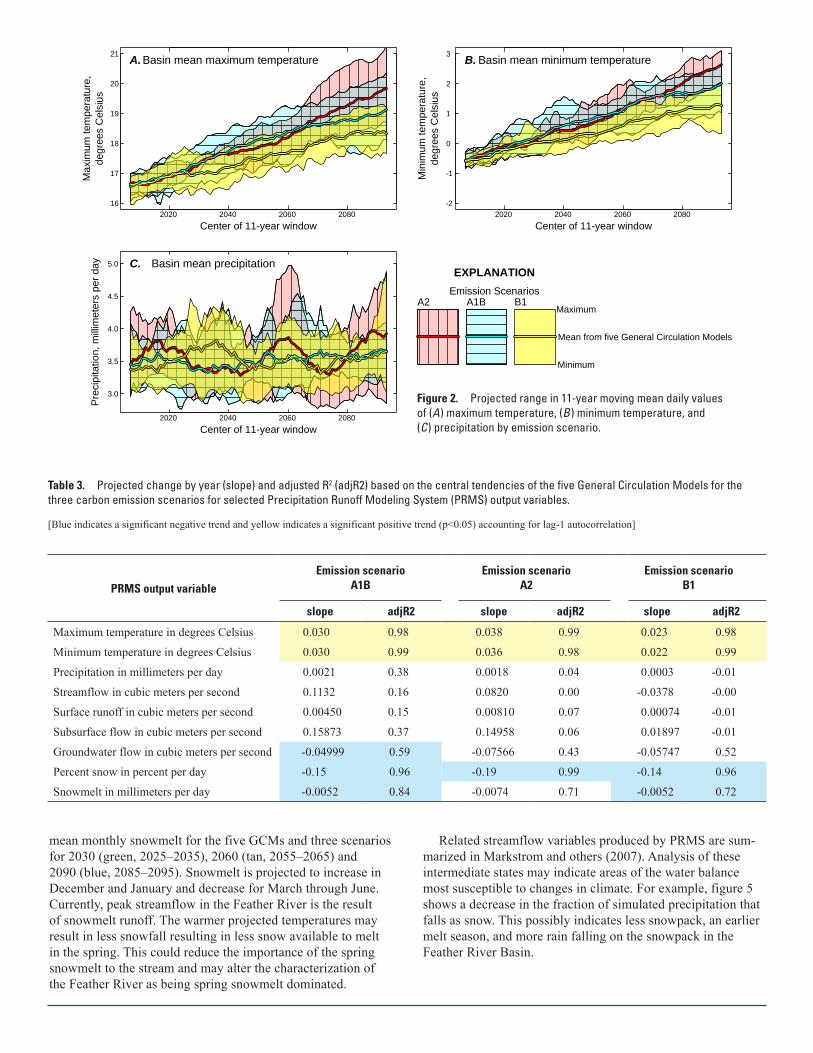
mean monthly snowmelt for the five GCMs and three scenarios for 2030 (green, 2025–2035), 2060 (tan, 2055–2065) and 2090 (blue, 2085–2095). Snowmelt is projected to increase in December and January and decrease for March through June. Currently, peak streamflow in the Feather River is the result of snowmelt runoff. The warmer projected temperatures may result in less snowfall resulting in less snow available to melt in the spring. This could reduce the importance of the spring snowmelt to the stream and may alter the characterization of the Feather River as being spring snowmelt dominated.
Related streamflow variables produced by PRMS are sum-marized in Markstrom and others (2007). Analysis of these intermediate states may indicate areas of the water balance most susceptible to changes in climate. For example, figure 5 shows a decrease in the fraction of simulated precipitation that falls as snow. This possibly indicates less snowpack, an earlier melt season, and more rain falling on the snowpack in the Feather River Basin.
Center of 11-year window
Max
imum
tem
pera
ture
,de
gree
s C
elsi
us
Basin mean maximum temperatureA.
2020 2040 2060 208016
17
18
19
20
21
16
17
18
19
20
21
Center of 11-year window
Min
imum
tem
pera
ture
,de
gree
s C
elsi
us
Basin mean minimum temperatureB.
2020 2040 2060 2080-2
-1
0
1
2
3
-2
-1
0
1
2
3
Center of 11-year window
Pre
cipi
tatio
n, m
illim
eter
s pe
r da
y Basin mean precipitationC.
2020 2040 2060 2080
3.0
3.5
4.0
4.5
5.0
3.0
3.5
4.0
4.5
5.0EXPLANATION
Emission ScenariosA2 A1B B1
Maximum
Mean from five General Circulation Models
Minimum
Figure 2. Projected range in 11-year moving mean daily values of (A) maximum temperature, (B) minimum temperature, and (C) precipitation by emission scenario.
Table 3. Projected change by year (slope) and adjusted R2 (adjR2) based on the central tendencies of the five General Circulation Models for the three carbon emission scenarios for selected Precipitation Runoff Modeling System (PRMS) output variables.
[Blue indicates a significant negative trend and yellow indicates a significant positive trend (p<0.05) accounting for lag-1 autocorrelation]
PRMS output variableEmission scenario
A1BEmission scenario
A2Emission scenario
B1
slope adjR2 slope adjR2 slope adjR2
Maximum temperature in degrees Celsius 0.030 0.98 0.038 0.99 0.023 0.98
Minimum temperature in degrees Celsius 0.030 0.99 0.036 0.98 0.022 0.99
Precipitation in millimeters per day 0.0021 0.38 0.0018 0.04 0.0003 -0.01
Streamflow in cubic meters per second 0.1132 0.16 0.0820 0.00 -0.0378 -0.00
Surface runoff in cubic meters per second 0.00450 0.15 0.00810 0.07 0.00074 -0.01
Subsurface flow in cubic meters per second 0.15873 0.37 0.14958 0.06 0.01897 -0.01
Groundwater flow in cubic meters per second -0.04999 0.59 -0.07566 0.43 -0.05747 0.52
Percent snow in percent per day -0.15 0.96 -0.19 0.99 -0.14 0.96
Snowmelt in millimeters per day -0.0052 0.84 -0.0074 0.71 -0.0052 0.72

Figure 3. Projected range in 11-year moving mean daily values of (A) streamflow, (B) surface runoff, (C) subsurface flow, and (D) ground-water flow by emission scenario.
Center of 11-year window
Str
eam
flow
,cu
bic
met
ers
per
seco
nd
Basin mean streamflowA.
2020 2040 2060 2080150
200
250
300
350
150
200
250
300
350
Center of 11-year window
Sur
face
run
off,
cubi
c m
eter
s pe
r se
cond
Basin mean surface runoffB.
2020 2040 2060 20802
4
6
8
10
2
4
6
8
10
Center of 11-year window
Sub
surf
ace
flow
,cu
bic
met
ers
per
seco
nd
Basin mean subsurface flowC.
2020 2040 2060 2080100
150
200
250
100
150
200
250
Center of 11-year windowG
roun
dwat
er fl
ow,
cubi
c m
eter
s pe
r se
cond
Basin mean groundwater flowD.
2020 2040 2060 208035
40
45
50
55
60
65
35
40
45
50
55
60
65
Month
Sno
wm
elt,
mill
imet
ers
per
day Basin mean snowmelt
Feb. Apr. June Aug. Oct. Dec.0
2
4
6
8
0
2
4
6
8
Month
Per
cent
sno
w
Basin mean percent snow
Feb. Apr. June Aug. Oct. Dec.0
10
20
30
40
50
60
0
10
20
30
40
50
60
EXPLANATIONBaseline
Conditions(1989-1999)
2030(2025-2035)
2060(2055-2065)
2090(2085-2095)
Whisker, 90th percentile
Upper quartile line, 75th percentile
Median line, 50th percentile
Lower quartile line, 25th percentile
Whisker, 10th percentile
Outlier
Figure 4. Mean daily snowmelt values by month for baseline conditions and projected range (2030, 2060, and 2090) using the five General Circulation Models and three emission scenarios.
Figure 5. Mean daily values of precipitation that falls as snow by month for baseline conditions and projected range (2030, 2060, and 2090) using the five General Circulation Models and three emission scenarios.

Conclusion and Discussion
Selected ReferencesConclusion and Discussion
For the Feather River Basin, GCM scenario simulations indicate that basin temperatures are to increase over the next century, and precipitation in the basin is to follow cycles of wetter and drier decadal oscillations. Because large areas of this basin straddle the historical snowline, slight changes in temperature will affect precipitation form. The GCM and PRMS simulations indicate that the cumulative effect of climatic effects on the basin will produce more winter run-off, earlier peak streamflow, and less spring snowmelt. The broader-scale effects of climate change on the flow regime of the Feather River project no significant overall trend in mean annual streamflow in the basin, but the uncertainty associated with this is large. These results did not consider many of the important feedback mechanisms which act between the land surface and the atmosphere.
The effects of climate change in the vicinity of the Feather River Basin may alter both the quantity and timing of stream-flow. These changes potentially could affect management strategies that currently affect water availability in summer for the SWP, winter high flows, and water quality and quantity for fisheries. This research has implications for the management of the watershed and reservoir operations at Lake Oroville. The scientific techniques described in the fact sheet can be aug-mented with other techniques in developing the science needed to address these complicated dynamics.
Selected References
Freeman, G., 2008, Runoff impacts of climate change on northern California’s watersheds as influenced by geology and elevation—a mountain hydroelectric system perspective: proceedings Western Snow Conference, v. 76, 12 p.
Hay, L.E., Markstrom, S.L., and Ward-Garrison, C.D., 2011, Watershed-scale response to climate change through the twenty-first century for selected basins across the United States, Earth Interactions, v. 15, 37 p.
Intergovernmental Panel on Climate Change, 2007, Summary for policymakers, in Climate change 2007—The physi-cal science basis, Contributions of Working Group 1 to the Fourth Assessment Report of the Intergovernmental Panel on Climate Change: Cambridge and New York, Cambridge University Press, 18 p.
Koczot, K.M., Jeton, A.E., McGurk, B.J., and Dettinger, M.D., 2005, Precipitation-runoff processes in the Feather River Basin, northeastern California, with prospects for streamflow predictability, water years 1971–97: U.S. Geological Survey Scientific Investigations Report 2004–5202, 82 p.
Markstrom, S.L., Hay, L.E., Ward-Garrison, C.D., Risley, J.C., Battaglin, W.A., Bjerklie, D.M., Chase, K.J., Christiansen, D.E., Dudley, R.W., Hunt, R.J., Koczot, K.M., Mastin, M.C., Regan, R.S., Viger, R.J., Vining, K.C., and Walker, J.F., 2012, An integrated watershed scale response to climate change for selected basins across the United States: U.S. Geological Survey Scientific Investigations Report 2011–5077, 142 p.
By Kathryn M. Koczot, Steven L. Markstrom, and Lauren E. HayFor more information visit the following Web sites: http://wwwbrr.cr.usgs.gov/projects/SW_MoWS/ http://pubs.usgs.gov/sir/2004/5202/ http://ca.water.usgs.gov/ http://www.usgs.gov/climate_landuse/