watershed selection for the aesa stream water quality...
TRANSCRIPT

Alberta Environmentally Sustainable AgricultureResource Monitoring
Water Quality
Watershed Selection for theAESA Stream Water Quality
Monitoring Program
Anne-Marie Anderson1, Sandra E. Cooke2, and Neil MacAlpine2
1 Alberta Environment, Water Sciences Branch, Edmonton, Alberta2 Alberta Agriculture, Food and Rural Development, Edmonton, Alberta

Executive Summary
A provincial stream survey conducted under the Canada-Alberta EnvironmentallySustainable Agriculture (CAESA) agreement described the existence of relationshipsbetween agricultural intensity of small agricultural watersheds and stream water quality.A strong commitment was made under the new Alberta Environmentally SustainableAgriculture (AESA) agreement to continue to monitor water quality in small agriculturalwatersheds as the industry grows and practices change.
The AESA Water Quality Monitoring Committee revisited the watershed selectionprocess under the CAESA program as new technology (e.g GIS) and databases wereavailable to select representative watersheds across Alberta. New databases, such asAgricultural Region of Alberta Soil Inventory Database (AGRASID), PFRA annual unitrunoff digital maps and 1996 Canada census data, were used to define overland runoffpotential and agricultural intensity. All data were rolled up and mapped according toPFRA gross watersheds of Alberta.
Watersheds were ranked according to agricultural intensity. Agricultural intensityindicators included manure production (tonnes/acre), fertilizer expenses ($/acre) andchemical expenses ($/acre) to represent the livestock and cropping sectors. Runoffpotential was determined according to landform and soil characteristics that facilitateoverland runoff.
Twenty-three watersheds were selected to cover the range of agricultural intensity thattypifies the province. Most of these watersheds have soil and landscape features thatpromote runoff. The report describes how representative these watersheds are in aprovincial and regional context.

Acknowledgements
The following individuals contributed expertise and advice in the selection of thewatersheds for the AESA Water Quality Monitoring Program: David Neilson, ConnyTomas (AAFRD), and Dave Kiely (PFRA).
Members of the AESA Water Quality Monitoring Committee are acknowledged for theirsupport in developing the water quality monitoring program. Review comments fromDave Kiely and Rod Bennett helped improve the report substantially.
The Irrigation Branch (AAFRD) supplied some of the initial databases that wereassembled in an effort to develop a comprehensive geographic information system.
Natasha Carle (AAFRD) and Bridgette Halbig (AENV) provided technical assistancewith data organization and presentation.
John Kirtz and Ian Johnson conducted the initial data compilation, analysis, andinterpretation for the site selection process.
Carolyn King’s assistance in reviewing and editing the various versions of this report isgratefully acknowledged.

Table of ContentsExecutive Summary ............................................................................................................. iAcknowledgements .............................................................................................................iiTable of Contents ...............................................................................................................iiiList of Tables...................................................................................................................... ivList of Figures ..................................................................................................................... v1. Introduction ................................................................................................................... 82. Methods......................................................................................................................... 9
2.1 Databases used in the Watershed Selection Process ............................................... 92.2. Software, basic GIS and other Data Handling Methods ........................................ 172.3 Watershed Selection Criteria................................................................................... 182.4. Definition of Runoff Potential................................................................................ 18
2.4.1 Potential for surface runoff based on landform................................................ 182.4.2 Potential for Surface Runoff based on Soil Type............................................. 20
2.5. Definition of Agricultural Intensity........................................................................ 222.6 Watershed Selection................................................................................................ 29
3. Selected Watersheds...................................................................................................... 303.1 Provincial Perspective ........................................................................................... 303.2 Regional Perspective ............................................................................................. 43
4. Conclusions ................................................................................................................. 455. Literature Cited ........................................................................................................... 46Appendix 1: AGRASID criteria to define landscape and soils with different runoff
potential....................................................................................................................... 49Appendix 2: Agricultural intensity, runoff potential characteristics for Alberta
watersheds ................................................................................................................... 56Appendix 3: Dominant soil and landform characteristics for the AESAAppendix 4: Distribution of agricultural intensity, manure production, fertilizer expenses
and chemical expenses in Alberta watersheds grouped by ecoregion and compared toselected AESA watersheds..............................................................................................
Appendix 5: SAS code and data used to assemble integrated watersheds...........................Appendix 6: SAS Code Used to Import and Parse AGRASID Soil and Landscape
Information......................................................................................................................Appendix 7: SAS Code Used to Classify Soil Polygons by Landscape and Soil
Characteristics (Potential for Runoff) .............................................................................

List of Tables
1. Distribution of runoff classes based on landform across the ecoregions. ................... 132. Distribution of runoff classes based on soil type across the ecoregions. .................... 173. Agricultural intensity indicator values for reference percentiles for the distribution of
provincial watersheds. ................................................................................................. 224. Basic hydrological reference data for AESA watersheds. .......................................... 255. Agricultural Intensity data for AESA watersheds....................................................... 29

List of Figures
1. PFRA gross watershed boundaries in Alberta (Cherneski and Ackerman 1998) ......... 32. Provincial annual unit runoff yield (dam3/km2), 50% probability of exceedance. ....... 53. (a) Provincial annual unit runoff (AUR) zones............................................................ 63 (b) Provincial watersheds ranked according to low, moderate and high annual unit runoff............................................................................................................................. 74. Ecoregions in Alberta ................................................................................................... 85. Agricultural zones in Alberta ........................................................................................ 96. Irrigation districts of southern Alberta ........................................................................ 107. Watersheds that meet size criteria used in the AESA site selection process .............. 128. Watershed runoff potential classification based on landforms ................................... 149. Watershed runoff potential classification based on soil types and textures................ 1610. Watersheds ranked according to agricultural intensity based on 1996 census data.... 1811. Watersheds ranked according to manure production based on 1996 census data....... 1912. Watersheds ranked according to fertilizer expenses based on 1996 census data........ 2013. Watersheds ranked according to chemical expenses based on 1996 census data ....... 2114. Location of the AESA watersheds in Alberta. .......................................................... 2415. Runoff potential for the AESA watersheds based on landforms ................................ 2716. Runoff potential for the AESA watersheds based on soil types and textures ............. 2817. Agricultural intensity for AESA watersheds based on 1996 Canada census data ...... 3018. Manure production for AESA watersheds as compared to provincial intensity
values........................................................................................................................... 3119. Fertilizer expenses for AESA watersheds as compared to provincial intensity
values........................................................................................................................... 3220. Chemical expenses for AESA watersheds as compared to provincial intensity
values........................................................................................................................... 3321. Distribution of agricultural intensity in watersheds of the Aspen Parkland ecoregion
compared to AESA watersheds................................................................................... 35A4.1a. Agricultural intensity in watersheds of the Aspen Parkland Ecoregion compared
to the AESA watersheds.............................................................................................. 63A4.1b. Manure production in watersheds of the Aspen Parkland Ecoregion compared to
the AESA watersheds.................................................................................................. 64A4.1c. fertilizer expenses in watersheds of the Aspen Parkland Ecoregion compared to
the AESA watersheds.................................................................................................. 65A4.1d. Chemical expenses in watersheds of the Aspen Parkland Ecoregion compared to
the AESA watersheds ................................................................................................. 66A4.2a. Agricultural intensity in watersheds of the Boreal Transition/Peace Lowland
Ecoregions compared to the AESA watersheds.......................................................... 67A4.2b. Manure production in watersheds of the Boreal Transition/Peace Lowland
Ecoregions compared to the AESA watersheds. ......................................................... 68A4.2c. fertilizer expenses in watersheds of the Boreal Transition/Peace Lowland
Ecoregions compared to the AESA watersheds. ......................................................... 69A4.2d. Chemical expenses in watersheds of the Boreal Transition/Peace Lowland
Ecoregions compared to the AESA watersheds. ......................................................... 70

List of Figures (continued)
A4.3a. Agricultural intensity in watersheds of the Fescue Grassland/Cypress HillsEcoregions compared to the AESA watersheds. ......................................................... 71
A4.3b. Manure production in watersheds of the Fescue Grassland/Cypress HillsEcoregions compared to the AESA watersheds. ......................................................... 72
A4.3c. Fertilizer expenses in watersheds of the Fescue Grassland/Cypress HillsEcoregions compared to the AESA watersheds. ......................................................... 73
A4.3d. Chemical expenses in watersheds of the Fescue Grassland/Cypress HillsEcoregions compared to the AESA watersheds. ......................................................... 74
A4.4a. Agricultural intensity in watersheds of the Mixed Boreal Uplands Ecoregioncompared to the AESA watersheds............................................................................. 75
A4.4b. Manure production in watersheds of the Mixed Boreal Uplands Ecoregioncompared to the AESA watersheds. ............................................................................ 76
A4.4c. Fertilizer expenses in watersheds of the Mixed Boreal Uplands Ecoregioncompared to the AESA watersheds. ............................................................................ 77
A4.4d. Chemical expenses in watersheds of the Mixed Boreal Uplands Ecoregioncompared to the AESA watersheds. ............................................................................ 78
A4.5a. Agricultural intensity in watersheds of the Mixed Grassland Ecoregion comparedto the AESA watersheds.............................................................................................. 79
A4.5b. Manure production in watersheds of the Mixed Grassland Ecoregion compared tothe AESA watersheds.................................................................................................. 80
A4.5c. Fertilizer expenses in watersheds of the Mixed Grassland Ecoregion compared tothe AESA watersheds.................................................................................................. 81
A4.5d. Chemical expenses in watersheds of the Mixed Grassland Ecoregion compared tothe AESA watersheds.................................................................................................. 82
A4.6a. Agricultural intensity in watersheds of the Moist Mixed Grassland Ecoregioncompared to the AESA watersheds. ............................................................................ 83
A4.6b. Manure production in watersheds of the Moist Mixed Grassland Ecoregioncompared to the AESA watersheds. ............................................................................ 84
A4.6c. Fertilizer expenses in watersheds of the Moist Mixed Grassland Ecoregioncompared to the AESA watersheds. ............................................................................ 85
A4.6d. Chemical expenses in watersheds of the Moist Mixed Grassland Ecoregioncompared to the AESA watersheds. ............................................................................ 86
A4.7a. Agricultural intensity in watersheds of the Subalpine/Alpine Ecoregion comparedto the AESA watersheds. .............................................................................................. 87
A4.7b. Manure production in watersheds of the Subalpine/Alpine Ecoregion comparedto the AESA watersheds.............................................................................................. 88
A4.7c. Fertilizer expenses in watersheds of the Subalpine/Alpine Ecoregion compared tothe AESA watersheds.................................................................................................. 89
A4.7d. Chemical expenses in watersheds of the Subalpine/Alpine Ecoregion comparedto the AESA watersheds.............................................................................................. 90
A4.8a. Agricultural intensity in watersheds of the Western Alberta Upland/Clear HillsUpland Ecoregions compared to the AESA watersheds. ............................................ 91
A4.8b. Manure production in watersheds of the Western Alberta Upland/Clear HillsUpland Ecoregions compared to the AESA watersheds............................................... 92

List of Figures (continued)
A4.8c. Fertilizer expenses in watersheds of the Western Alberta Upland/Clear HillsUpland Ecoregions compared to the AESA watersheds. ............................................ 93
A4.8d. Chemical expenses in watersheds of the Western Alberta Upland/Clear HillsUpland Ecoregions compared to the AESA watersheds. ............................................ 94

1. Introduction
Water quality studies conducted under the Canada-Alberta Environmentally SustainableAgriculture (CAESA) agreement described the existence of relationships betweenagricultural intensity of small agricultural watersheds and stream water quality(Anderson et al. 1998 a, b), and highlighted the need for integrated management of waterand land resources.
One of the CAESA recommendations was to develop a comprehensive, integrated, long-term water quality monitoring program to determine trends and assess water qualityimpacts associated with agriculture as the industry grows and practices change (CAESA1998).
The Alberta Environmentally Sustainable Agriculture (AESA) agreement, which wasstruck in 1997, followed up on this recommendation by making water quality monitoringof small agricultural watersheds one of the priorities of the program.
The selection of streams that were monitored under CAESA was carried out in 1994.Since that time, new agricultural databases have become available and geographicinformation system (GIS) technology has improved substantially. Consequently, it wasdesirable to revisit the site selection process and validate the site selection in light ofthese new data bases. Furthermore, changes in the goal of the monitoring programwarranted the re-validation of the sampling sites, as outlined below.
The purpose of the CAESA stream monitoring studies was to compare water quality ofstreams in agricultural basins with a different level of farming intensity. The purpose ofthe AESA stream monitoring studies is different. The AESA stream monitoring isintended to follow trends in water quality of agricultural watersheds which encompass therange of agricultural intensities across the province, including reference watersheds withlow agricultural intensity, watersheds that already have intensive agriculture, andwatersheds with a high potential for intensification of agriculture. Furthermore, therewas a need to include watersheds from irrigated areas and watersheds from the GrandePrairie – Peace River area in the monitoring program. These important agricultural areashad not been part of the assessments conducted under CAESA.
In the AESA watershed, trends in water quality will be influenced by the rate of materialmovement from land to water. Therefore it becomes important to depict and understandtrends in descriptors of material movement (i.e. mass load, export coefficient and flowweighted mean concentrations). Because these descriptors can be influenced by factorssuch as climatic conditions, watershed features and activities on the land, the potentialinfluence of all of these factors needed to be considered in the site selection process.
The objectives of this report are to document the process that led to the selection ofwatersheds being monitored under the AESA program and to describe the selected

watersheds in relation to provincial and regional variability in agricultural productionintensity, as well as soil, landscape and climate conditions.
2. Methods
2.1 Databases used in the Watershed Selection Process
1. Canada Census Agricultural Data for 1996 (Statistics Canada 1996)� This database summarises 1996 census data for a wide variety of agricultural
variables by SLC (Soil Landscape of Canada polygon as defined by Shields et al.1991). The average size of SLC polygons is 600,000 km2.
� While evaluating specific information pertaining to types of crops and the natureof the livestock industry, Johnson and Kirtz (1999) confirmed that manureproduction, fertilizer expenses and chemical expenses were good indicators ofagricultural intensity.
� This database replaces the 1991 Census data used in the watershed site selectionfor the CAESA program (Anderson et al. 1996). In the CAESA program, animalunit density was used in conjunction with fertilizer and chemical expenses todefine agricultural intensity. Animal unit density was calculated from differentlivestock density data. In some instances, original density data were suppressedfor privacy reasons and as a result density was likely underestimated. StatisticsCanada calculates fresh manure production from livestock numbers, species andage distribution without suppressing any data. In the AESA program, manureproduction was used as one of the measures of agricultural intensity instead ofanimal unit density
2. Agricultural Region Of Alberta Soil Inventory Database (AGRASID) (CAESA-Soil Inventory Project Working Group 1998)� This database summarises soil and landform data by AGRASID polygon. The
average size of the AGRASID polygons is 6,000 km2.� This database was preferred over the Soil Landscape of Canada database used in
the CAESA program because it is more recent, and it has received more extensivesite-specific validation. Furthermore the smaller average polygon size of theAGRASID data offers a better spatial resolution. However, the AGRASIDdatabase does not provide information outside of the agricultural (‘white’) zone(e.g. ‘green’ zone).
3. Prairie Farm Rehabilitation Administration (PFRA) Gross Watersheds(Cherneski and Ackerman 1998).� The digital map defines gross watershed polygons for 865 watersheds (Figure 1).� Census data and AGRASID data were projected at the scale of watershed
polygons by area-weighting data by SLC and AGRASID polygons.� In the CAESA program agricultural and soil landscape information was projected
at the scale of soil landscape units. Polygons were ranked and watersheds that metspecific criteria were located by visually comparing ranked polygons andwatershed maps.

Figure 1. PFRA gross watershed boundaries in Alberta (Cherneski and Ackerman 1998).

4. Provincial Annual Unit Runoff (Bell 1994)� Runoff yield is reported as a series of ten maps, each representing a specific
probability of annual unit runoff (AUR) in the form ofisopleths. It is derived bydividing the total annual stream discharge by the active drainage area and isexpressed in mm of runoff per year. The 50th percentile or median runoff map(Figure 2) was used as a reference to define three runoff zones in the province:high runoff zone (>50mm annual runoff), medium runoff zone (>20 and < 50 mmannual unit runoff) and low runoff zone (< 20 mm annual runoff) (Figure 3). Bydefinition (50th percentile) there is a one chance in two that these runoff valueswill be exceeded in any given year.
� Runoff data used in the AESA program are similar to the information used in theCAESA program (i.e. PFRA 1994), but had the advantage of being available in anelectronic form which could readily be incorporated in GIS.
5. Ecoregions (Ecological Stratification Working Group 1995)� Ecoregions share similar climate, landscape, soils and natural vegetation
characteristics (Figure 4); they are sub-divided into eco-districts, which areuniform spatial units with respect to climate, soils and landscapes.
� Because natural physical and climatic characteristics are fairly uniform withinecoregions, they can be a valid spatial unit to compare effects of agriculturalintensity and trends on stream water quality.
� Ecoregions were not incorporated in digital files in the CAESA program.
6. Agricultural Zones (Johnson and Kirtz 1998)� Eco-districts can be lumped into 15 zones based on agricultural production
patterns (i.e. cow/calf production, intensive livestock production and grain and oilseed production) (Figure 5).
� Agricultural zones may straddle two or more ecoregions.� Agricultural zones are also valid spatial units to compare effects of agricultural
intensity and trends on stream water quality.� The identification of agricultural zones in Alberta was a new process initiated
under the AESA program and was not considered under CAESA.
7. List of Gauging Stations maintained by Water Survey of Canada (EnvironmentCanada 1997)
� The list of active gauging stations in Alberta is associated with site descriptions, sitecodes and geographical co-ordinates (latitude and longitude). Active stations werelinked to the watershed polygons. Active drainage stations generally have theadvantage of having a historical record of many years of flow data.

Figure 2. Provincial annual unit runoff yield (dam3/km2), 50% probability of exceedance.Numbers on isobars indicate annual unit runoff yield (Bell1994).

Annual Unit Runoff
High
Medium
Low
Figure 3a. Provincial annual unit runoff (AUR) zones. (High > 50 mm AUR; Medium 20– 50 mm AUR; Low < 20 mm AUR).

Annual Unit RunoffHigh (> 50mm)Medium (20 - 50 mm)Low (< 20 mm)
Figure 3b. Provincial watersheds ranked according to low, moderate andhigh annual unit runoff. AESA watersheds outlined in red.

Ecoregions of AlbertaAspen ParklandAthabasca Plain, Tazin Lake UplandsFescue Grasslands, Cypress HillsMixed Boreal Uplands, Slave River Lowland, Wabasca LowlandMixed GrasslandMoist Mixed GrasslandNorthern Alberta UplandsPeace Lowland, Boreal TransitionSubalpine, AlpineWestern Alberta Uplands, Clear Hills Upland
Figure 4. Ecoregions of Alberta (Ecological Stratification Working Group 1995).

14
15 8
1
72
6 3
5 4
1311
12
109
Figure 5. Agricultural zones of Alberta (Johnson and Kirtz 1998).

8 Irrigation District Information (Irrigation Branch, AAFRD) Information supplied included:� The irrigation district boundaries and geographical watersheds within them
(Figure 6)� Cropping information by irrigation district� Irrigation information provided by the irrigation districts, with the type of
irrigation system and acres irrigated by that system
2.2. Software, basic GIS and other Data Handling Methods
Canada Census data, AGRISID data and watershed maps, were imported into MapInfousing ArcLink. Runoff yield and eco-districts maps were projected as 10TM NAD27 andexported as drawing exchange format (*.DXF extension) for import into StrategicAnalysis Systems (SAS) software (Statistical Analysis Systems Institute Inc. 1988) andsaved as SAS data sets.
Data sets representing census data and AGRISID data by watershed, SLC polygon andeco-district were downloaded as dBASE (Borland International Inc. 1992) files fromSAS.
Figure 6. Irrigation districts of southern Alberta (Irrigation Branch, AlbertaAgriculture, Food and Rural Development).

SLC polygons (Census data) and AGRISID polygons (AGRISID data) were apportionedaccording to the relative contribution of their respective polygon to the watershed surfacearea (i.e. area weighted).
SAS code, developed to derive variables or convert data to other spatial units, isdocumented in Appendix 5, 6 and 7.
2.3 Watershed Selection CriteriaThe main restrictions that were placed on the watershed database were related to the needto :
� Restrict the size of the drainage basin to the range 50 km2 - 1500 km2 so thatwatersheds with towns and industries could easily be identified and avoided (Figure7);
� Have an active gauging station with historical and ongoing stream flowmeasurements according to Water Survey of Canada.
2.4. Definition of Runoff Potential
Surface landform and soil type characteristics as described in AGRASID were used toevaluate the potential for surface runoff in the watersheds.
2.4.1 Potential for surface runoff based on landform
Land forms were evaluated for their ability to deliver runoff and were divided into 3types which include:
Type I – Landforms with well developed natural drainage, having a high potentialto deliver runoff to streams. Landforms listed in AGRASID which are of thistype are of the rolling, undulating, ridged, inclined and valley types.
Type II – Landforms with closed, poorly developed natural drainage (knob andkettle, potholes) which will trap runoff and have a low potential to deliver runoff.To be conservative, hummocky landscapes including low relief was interpreted asType II landscapes.
Type III – landforms that are flat to low undulating with poorly drainedlandscapes, but fine textured soils. In agricultural areas these are likely to beartificially drained.
Appendix 1 describes the criteria used to classify landforms according to runoff potentialcategory. Type classification was considered dominant if the total basin area was morethan 40%. Watersheds with two type categories having > 40% area were classified asco-dominant mixed while watersheds that had a mixture of type categories less than 40%were categorized as sub-dominant mixed.
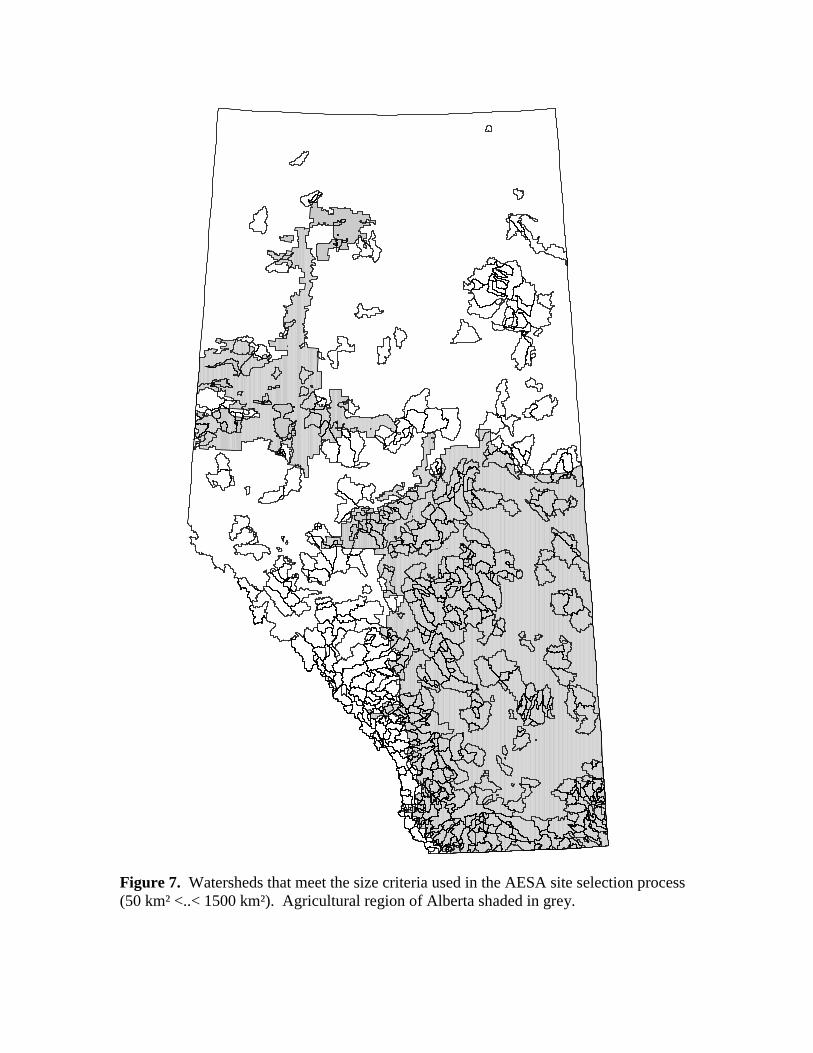
Figure 7. Watersheds that meet the size criteria used in the AESA site selection process(50 km² <..< 1500 km²). Agricultural region of Alberta shaded in grey.

Alberta watersheds showing runoff potential based on landform types are shown inFigure 8. The percentage of each runoff class based on landform type for each ecoregionis listed in Table 1.
Landform data for all provincial watersheds are presented in Appendix 2.
Table 1. Distribution of runoff classes based on landforms acrossecoregions
Runoff Potential Type Based on Landform(percent of area)
Ecoregion Type I Type II Type III UnknownAspen Parkland 53.3 32.1 7.5 7.0Boreal Transition 43.7 30.1 19.2 7.1Clear Hills Upland 66.7 6.5 24.1 2.7Cypress Upland 67.6 29.3 3.0 0.1Eastern Continental Ranges 88.7 8.8 0.0 2.5Fescue Grassland 67.4 20.3 6.9 5.4Hay River Lowland 9.8 0.3 70.2 19.7Mid-Boreal Uplands 40.0 30.0 21.1 8.9Mixed Grassland 57.3 30.4 8.0 4.3Moist Mixed Grassland 52.8 34.4 7.7 5.1Northern Continental Divide 61.3 30.1 4.3 4.3Peace Lowland 45.2 6.4 44.2 4.2Wabasca Lowland 9.8 0.0 88.9 1.3Western Alberta Upland 47.4 28.5 22.1 2.0Western Boreal 68.0 6.8 21.5 3.7
2.4.2 Potential for Surface Runoff based on Soil Type
Soil types were evaluated with respect to their potential to deliver runoff. This involvedidentifying surface soil types where soil texture and structure would form restrictivelayers, which would prevent infiltration. AGRASID polygons were assigned to one ofthe three classes.
High potential for runoff – Soils with restrictive layers and soils with shallowAh or Ap horizons, and fine soil textures (silt, clay loam). Soils that typically fellinto this type were luvisolic, solonetzic and their derivatives.
Moderate potential for runoff – Soils with a moderately deep Ah or Ap horizonand a moderately fine soil texture (loam, silt loam, fine sandy loam). Somederivates of solonetzic and luvisol soils fit this class (solods, dark gray soils).
Low potential for runoff – Soils with a deep Ah or Ap horizon, and a moderateto coarse soil texture (loams, sandy loams and sands). B horizon has the samepermeability as A horizon. Soils, which typically fell into this type, wereregosolics and chernozems with good profile development.

Landform Runoff PotentialNo DataType IType IIType IIICo-Dominant MixedSubdominant Mixed
Figure 8. Watershed runoff potential classification based on landforms. AESAwatersheds outlined in red.

Appendix 1 describes the criteria used to classify soils according to runoff potentialcategory. Categories were considered dominant if the total basin area was more than40%. Watersheds with two categories having > 40% area were classified as co-dominantmixed while watersheds that had a mixture of type categories less than 40% werecategorized as sub-dominant mixed.
Runoff potential based on soil type for Alberta watersheds is shown in Figure 9. Thepercentage of each runoff class based on soil type for each ecoregion is listed in Table 2.
Soil type data for all provincial watersheds are presented in Appendix 2.
2.5. Definition of Agricultural Intensity
In the context of the stream water quality monitoring program, agricultural intensity isdefined by indicators which describe agricultural intensity, and which are highlycorrelated to the presence of agricultural contaminants in surface water (Anderson et al1998 a, b). Therefore, in this report, agricultural intensity is not specifically or solelydefined in an economic or agronomic context. Manure production, fertilizer expensesand chemical expenses are indicators of potential nutrient and microbial contaminationfrom livestock; nutrient contamination from inorganic fertilizers; and pesticidecontamination mainly from the use of herbicides.
Although a strong correlation was described in the 1996 census data between fertilizerand chemical expenses (Johnson and Kirtz 1998) there is no guarantee that thisrelationship will persist in the future. Hence, even from an agronomic perspective, it isjustified to incorporate both measures in the present definition of agricultural intensity.
Chemical expenses, fertilizer expenses and manure production per unit area weredetermined for each watershed and ranked individually for the population of watersheds.The sum of these ranks was ranked again. This ultimate rank represents the measure ofagricultural intensity (AI) as defined for the AESA stream program. Streams with noagricultural activity or no data for chemical and fertilizer expenses or manure production(i.e. receiving an initial rank of “0”) were not included in the final ranking.
Data pertaining to agricultural intensity in all provincial watersheds are presented inAppendix 2.

Soils Runoff PotentialNo DataHighModerateLowCo-Dominant MixedSubDominant Mixed
Figure 9. Watershed runoff potential based on soil types and textures. AESAwatersheds outlined in red.

Agricultural intensity classes based on stream basin percentile ranking are definedas follows:
Non-agricultural: rank = 00 < Low Agricultural Intensity < 40
40 < Moderate Agricultural Intensity < 75High Agricultural Intensity> 75
Table 2. Distribution of Runoff Classes based on Soil Types across theEcoregions
Runoff Potential Class Based on Soil Type (percentof area)
Ecoregion High Moderate Low UnknownAspen Parkland 32.8 21.5 38.1 7.2Boreal Transition 53.1 18.8 6.5 21.4Clear Hills Upland 89.2 1.2 9.4Cypress Upland 73.1 12.1 12.3 2.4
Eastern Continental Ranges 50.2 0.1 41.8 7.9Fescue Grassland 68.3 4.7 23.7 3.3Hay River Lowland 59.0 1.4 39.0Mid-Boreal Uplands 62.9 1.9 4.0 31.1Mixed Grassland 58.5 20.5 17.6 3.3Moist Mixed Grassland 69.4 12.1 14.0 4.4Northern Continental Divide 68.7 3.4 18.5 9.2Peace Lowland 79.3 0.6 9.0 11.0Wabasca Lowland 73.3 0.2 2.7 23.8Western Alberta Upland 62.0 5.1 7.5 25.1Western Boreal 82.5 0.1 3.0 14.4
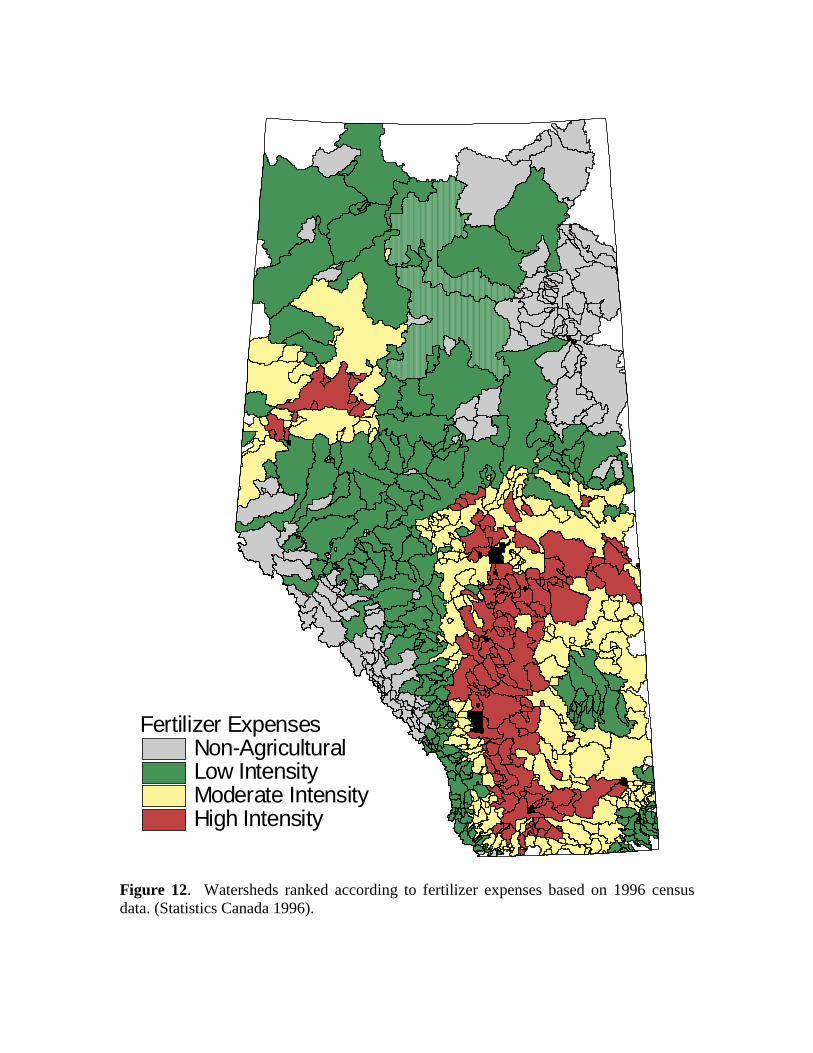
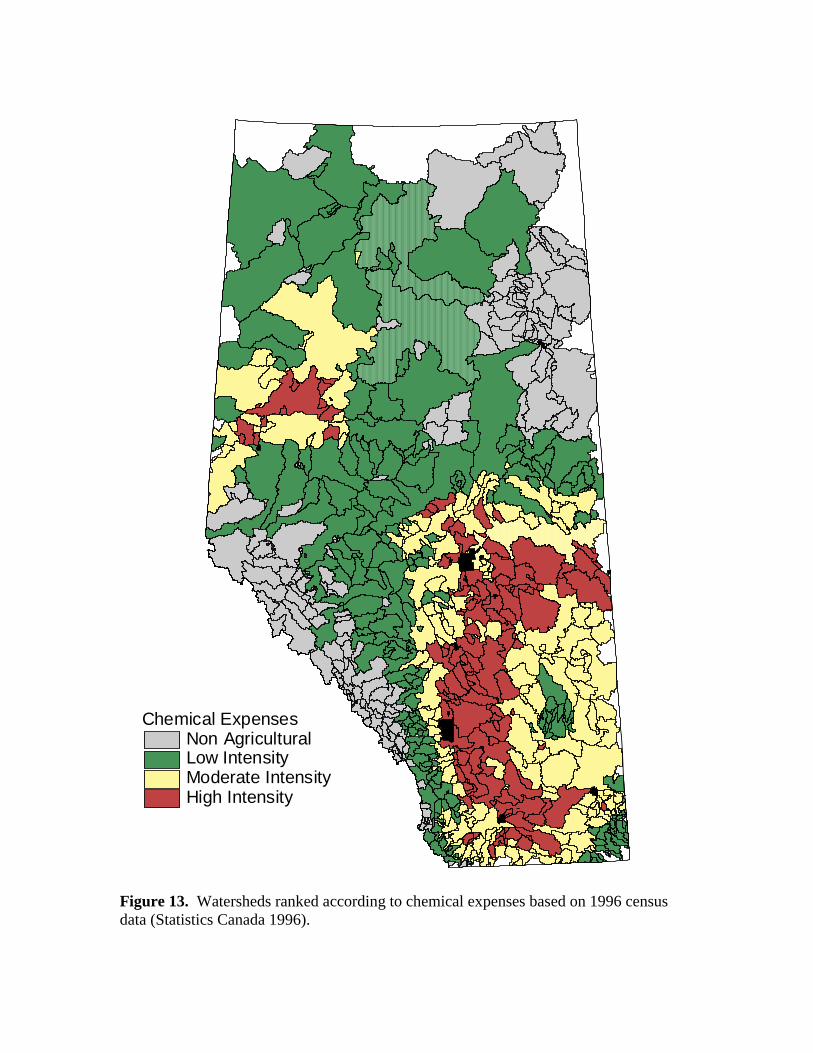
Table 3 – shows actual agricultural intensity values which correspond to criticalpercentiles for the provincial distribution. Figures 10 to 13 show the provincialwatersheds ranked according to agricultural intensity manure production, fertilizerexpenses and chemical expenses, respectively. (Note that these maps depict aspects ofagricultural intensity only; they do not take into account other aspects of watershedselection criteria discussed under 2.3.). Watersheds with high agricultural intensity areconcentrated in southern and central Alberta, along the Lethbridge – Edmonton andEdmonton – Lloydminster transportation corridors and North West of Edmonton. In allof these watersheds, the intensity of agriculture is high as a result of intensive livestock(manure production) and crop production (fertilizer and chemical expenses). In contrast,agricultural intensity in northwestern Alberta is currently dominated by crop production(high fertilizer and chemical expenses), as opposed to livestock production (low tomoderate manure production). Overall, the data base comprises 194 watersheds with noagricultural activity, and 255, 219 and 166 where agricultural activity is low, moderateand high, respectively.

Agriculture IntensityNon-AgriculturalLow IntensityModerate IntensityHigh Intensity
Figure 10. Watersheds ranked according to agricultural intensity based on 1996 censusdata (Statistics Canada 1996).

Manure ProductionNon-AgriculturalLow IntensityModerate IntensityHigh Intensity
Figure 11. Watersheds ranked according to manure production (tonnes per acre) basedon the 1996 census data (Statistics Canada 1996).
Fertilizer ExpensesNon-AgriculturalLow IntensityModerate IntensityHigh Intensity
Figure 12. Watersheds ranked according to fertilizer expenses based on 1996 censusdata. (Statistics Canada 1996).
Chemical ExpensesNon Agricultural Low IntensityModerate IntensityHigh Intensity
Figure 13. Watersheds ranked according to chemical expenses based on 1996 censusdata (Statistics Canada 1996).

Note that the definition of agricultural intensity under AESA differs from that used in theCAESA study in the following ways:
� In the CAESA study, fertilizer expenses, chemical expenses, and animal unit densityper polygon were each classified into three classes “High”, “Medium” and “Low”.Polygons were assigned an intensity class only if they ranked high, medium and lowfor each of the three factors. Consequently, polygons that did not rank high, mediumor low for all three criteria could not be ranked based on overall agricultural intensity.
� The intensity class for Low in the CAESA study was defined as <25th percentile rank.
The definitions used for the AESA study allow the ranking of all watersheds. Theaddition of a class for non-agricultural watersheds and the expansion of the upperboundary for the low agricultural intensity class provide a better indication of thedistribution of agricultural intensity in Alberta streams.
Table 3. Agricultural intensity indicators: actual values for referencepercentiles1
Percentiles Total Manure Production(tonnes per acre)2
Total FertilizerExpenses
($ per acre)2
Total ChemicalExpenses
($ per acre)2
1.00 4.948 $31.21 $16.020.90 1.656 $14.41 $6.800.80 1.196 $10.84 $4.910.75 1.073 $9.38 $4.180.70 0.947 $7.29 $3.480.60 0.740 $4.44 $1.970.50 0.553 $2.69 $1.130.40 0.381 $1.50 $0.530.30 0.243 $0.67 $0.270.20 0.092 $0.28 $0.110.10 0.025 $0.05 $0.010.00 0.000 $0.00 $0.00
1Percentiles derived from the distribution of all agricultural watersheds2Based on 1996 Census Data.
2.6 Watershed Selection
The final selection of watersheds involved the following steps:
1. Retain watersheds with a drainage area < 1500 km2 and >50 km2 that have a gaugingstation, but have no major urban or industrial development.
2. Retain watersheds, which cover the typical range of agricultural intensity for theprovince as a whole and for individual ecoregions recognizing that some of thewatersheds are or may become important for agricultural production.
3. Retain streams that have primarily Type I landscapes and a high soil runoff potential.

In situations where several streams were regarded as representative, preference was givento streams that had been monitored under CAESA or AESA before. In several instances,ground-truthing was used to eliminate or retain some watersheds.
3. Selected Watersheds
3.1 Provincial PerspectiveTwenty-three watersheds were selected across Alberta for the long-term monitoring ofwater quality in agricultural watersheds. The location of the watersheds is shown inFigure 14. Sixteen of these watersheds were part of the CAESA monitoring program.New watersheds include Hines Creek, Grande Prairie Creek and Kleskun Hills MainDrain in north western Alberta; Wabash Creek, north west of Edmonton; and New WestCoulee, Drain S-6, and the Battersea Drain in the irrigated, southern portion of theprovince. These new watersheds will provide water quality data from agricultural areasthat had not been sampled under CAESA.
Table 4 provides hydrometric and water quality station codes for the 23 watersheds aswell as information on drainage basin size, and the year when hydrometric measurementsstarted. Gross (total) and active drainage basin sizes are extracted from The Hydatdatabase (Environment Canada 1997); total drainage basin size was determined fromdigital terrain maps in ARCview. Both Hydat and digital terrain maps provide fairlyreliable estimates of drainage basin size, but each has some specific advantages. Hydatspecifies the active portion of the drainage basin (the size of the drainage basin thatcontributes runoff to the stream), whereas digital terrain maps were used to definedrainage basin boundaries electronically.
The gross drainage basin size for the 23 watersheds averages 312 km2 and ranges from42.5 km2 (Ray Creek) to 1360 km2 (Crowfoot Creek). The drainage basin size for someof the irrigation streams (Drain S-6, Battersea Drain) is not defined by Hydat, but hasbeen determined from digital terrain maps. For most basins, the effective drainage basinis very similar in size to the gross drainage basin based on topographic features. Thisconfirms that well-drained basins were selected where most of the basin potentially cancontribute to stream loading. Some noteworthy exceptions include Buffalo and Crowfootcreeks where a fairly substantial portion of the basin is non-contributing. Calculations ofexport coefficients should apply to the effective portion of the basin. The definition ofthe contributing or effective watershed is considerably more complex for irrigationwatersheds where canal systems can convey water in and out of the topographicallydefined basin boundaries at one or more locations. The current monitoring program doesnot allow for accurate estimates of export coefficients in such watersheds.
No attempt was made to select watersheds in areas of low runoff and low runoff potential(e.g. south-eastern portion of the province). The likelihood of identifying trends in waterquality that would be linked to basin-wide agricultural activities was considered lowrelative to that elsewhere in the province.

Edmonton
Calgary
Figure 14. Location of AESA watersheds in Alberta.

Table 4. Basic hydrological reference data for AESA watersheds
Drainage Basin Size (km2)EnviroDat Station
CodeHydrometric Station
Code Watershed Name Major River Basin Total(from DEM)
Gross(EC 1997)
Active(EC 1997)
Starting date ofhydrometric records
Annual Unit RunoffZone 1
Aspen Parkland
Agriculture Zone 61 AB05CE0710 05CE010 Ray Creek near Innisfail Red Deer River 44.3 42.5 42.5 1967 Low2 AB05CD0600 05CD006 Haynes Creek near Haynes Red Deer River 166.0 166 166 1978 High3 AB05CD0730 05CE018 Threehills Creek below Ray Creek Red Deer River 154.9 197 154 1971 Low4 AB05CE0720 05CE011 Renwick Creek near Threehills Creek Red Deer River 58.8 57.2 57.2 1967 Low
Agriculture zone 25 AB05EE0550 05EE005 Stretton Creek near Marwayne North Saskatchewan River 81.9 82.1 78.5 1978 Low6 AB05FE0060 05FE002 Buffalo Creek at Hwy 41 Battle River 714.4 714 248 1972 Low
Boreal Transition
Agriculture zone 77 AB05DF0020 05DF004 Strawberry Creek near the mouth North Saskatchewan River Basin 581.9 584 582 1966 Medium8 AB05CC0470 05CC008 Blindman River near Bluffton Red Deer River 351.4 352 352 1965 Medium9 AB05DE0550 05DE009 Tomahawk Creek near Tomahawk North Saskatchewan River Basin 105.3 105 105 1984 High
Agriculture Zone 810 AB07BC0540 07BC007 Wabash Creek near Pibroch Athabasca River 321.4 339 339 1979 Medium
Clear Hills Upland
No Agriculture Zone classified11 AB07FD1390 07FD011 Hines Creek above Gerry Lake Peace River and Slave River 368.4 374 374 1974 Medium
Fescue Grassland
Agriculture zone 912 AB05AB0240 05AB029 Meadow Creek near mouth Oldman River 130.1 130 130 1966 High13 AB05AB0230 05AB005 Trout Creek near Granum Oldman River 440.2 440 440 1908 High14 AB05AD0290 05AD035 Prairie Blood Coulee near Lethbridge Oldman River 225.6 227 227 1970 Medium
Mixed Grassland
Agriculture Zone 1215 AB05BN0970 05BN006 New West Coulee near the mouth Bow River 318.2 312 NA 1957 Low
Agriculture zone 1116 AB05AJ0410 05AJ004 Drain S-6 near Bow Island South Saskatchewan River 90.6 NA NA 1985 Low
Moist Mixed Grassland
Agriculture Zone 517 AB05BM0620 05BM008 Crowfoot Creek near Cluny Bow River 1079.0 1360 959 1951 Low
Agriculture Zone 1018 AB05AG0030 05AD038 Battersea Drain near the mouth Oldman River 71.1 NA NA 1973 Low
Northern Continental Divide
Agriculture zone 919 AB05AB0265 05AB040 Willow Creek at secondary 532 Oldman River 65.2 65.3 NA 1996 High
Peace Lowland
Agriculture zone 1420 AB07GE0940 07GE003 Grande Prairie Creek near Sexsmith Peace River and Slave River 151.1 152 152 1969 Medium21 AB07GE0930 07GE002 Kleskun Hills Main Drain near Grande
PrairiePeace River and Slave River 32.3 31.6 NA 1966 Medium

Western Alberta Upland
Agriculture zone 722 AB05DE0010 05DE007 Rose Creek near Alder Flats North Saskatchewan River 558.5 551 551 1972 High23 AB07BB0060 07BB011 Paddle River near Anselmo Athabasca River 258.5 261 261 1980 High
Of the 23 AESA watersheds, 22 watersheds have some AGRASID coverage; WillowCreek at Hwy 532 has no coverage and there is only partial coverage for the Hines, Roseand Grande Prairie Creek watersheds (Figures 15, 16; Appendix 3). Most of thewatersheds (15) are ranked as having primarily type I landform characteristics (welldeveloped drainage based on having >40% classified as type I). Although TomahawkCreek does not have type I landform characteristics, it does have soils that have a highrunoff potential. Three watersheds (Threehills, Buffalo, Tomahawk) have type IIlandform characteristics. Four watersheds (Rose, Hines, Haynes Creeks and BlindmanRiver) have a mixture of well developed to poorly developed landform runoffcharacteristics.
Soils and landform information is limited to the white zone in the AGRASID database.Fifteen of the 22 watersheds with AGRASID coverage are classified as having moderateto high potential for runoff based on soil types, textures and depth of the Ah horizon.Three watersheds (Renwick, Stretton and Buffalo Creek watersheds) are ranked as havinglow soil runoff potential while four watersheds have a mixture of high, moderate and lowrunoff potential (Hines, Wabash, Rose Creeks and Battersea Drain).
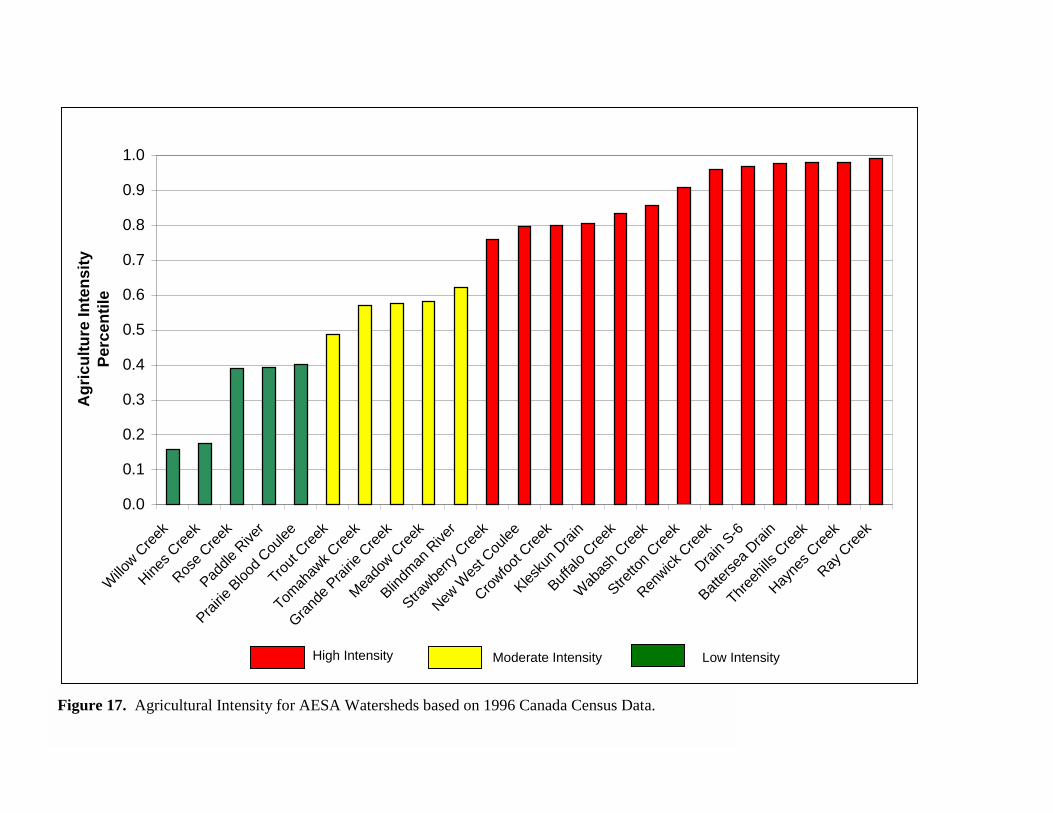
Table 5 provides actual agricultural intensity data as well as the ranking achieved by eachof the 23 watersheds relative to the provincial distribution. Of the 23 basins chosen, 13,5, and 5 drain areas of high, moderate and low agricultural intensity, respectively; non-agricultural streams are not included among the AESA streams. Figures 17, 18, 19 and20 further illustrate how individual streams rank relative to the provincial percentiledistribution for overall agriculture intensity, manure production, and fertilizer andchemical expenses, respectively.
• Generally, streams that rank in the high agricultural intensity class rank in the upper25 percentiles for each agricultural intensity indicator. There are some exceptions.Strawberry Creek ranks lower for chemical and fertilizer expenses, while New WestCoulee, Crowfoot Creek, Kleskun Hills Main Drain and Buffalo Creek rank lower formanure production.
• Among the streams that have basins in areas of medium agricultural intensity, all,except Trout Creek rank in the 40 to 75th percentile range for chemical and fertilizerexpenses. Trout Creek ranks somewhat lower. With respect to manure production,Grande Prairie Creek ranks in the 40 to 75th percentile range, while Trout, Meadowand Tomahawk Creeks and the Blindman River are in the upper 25th percentile range.
• Chemical expenses in all streams that drain land farmed with low intensity rank in thelower 40th percentiles. However, manure production in the Rose Creek and PaddleRiver basins and fertilizer expenses in the Prairie Blood Coulee basin rank in the 40to 75th percentile range.

Landform Runoff PotentialType IType IIType IIIMixed
Figure 15. Runoff potential for AESA watersheds based on landforms

Soil Runoff PotentialHighModerateLowMixed
Figure 16. Runoff potential for AESA watersheds based on soil types and textures.
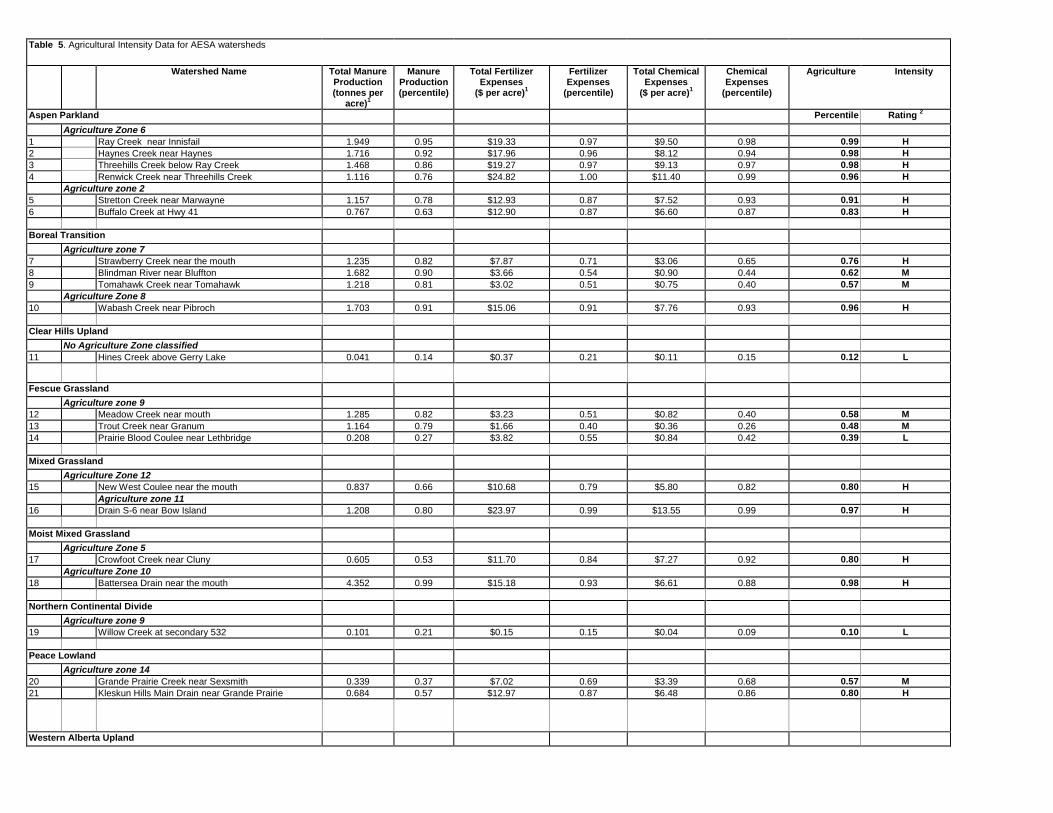
Table 5. Agricultural Intensity Data for AESA watersheds
Watershed Name Total ManureProduction(tonnes per
acre)1
ManureProduction(percentile)
Total FertilizerExpenses
($ per acre)1
FertilizerExpenses
(percentile)
Total ChemicalExpenses
($ per acre)1
ChemicalExpenses
(percentile)
Agriculture Intensity
Aspen Parkland Percentile Rating 2
Agriculture Zone 61 Ray Creek near Innisfail 1.949 0.95 $19.33 0.97 $9.50 0.98 0.99 H2 Haynes Creek near Haynes 1.716 0.92 $17.96 0.96 $8.12 0.94 0.98 H3 Threehills Creek below Ray Creek 1.468 0.86 $19.27 0.97 $9.13 0.97 0.98 H4 Renwick Creek near Threehills Creek 1.116 0.76 $24.82 1.00 $11.40 0.99 0.96 H
Agriculture zone 25 Stretton Creek near Marwayne 1.157 0.78 $12.93 0.87 $7.52 0.93 0.91 H6 Buffalo Creek at Hwy 41 0.767 0.63 $12.90 0.87 $6.60 0.87 0.83 H
Boreal TransitionAgriculture zone 7
7 Strawberry Creek near the mouth 1.235 0.82 $7.87 0.71 $3.06 0.65 0.76 H8 Blindman River near Bluffton 1.682 0.90 $3.66 0.54 $0.90 0.44 0.62 M9 Tomahawk Creek near Tomahawk 1.218 0.81 $3.02 0.51 $0.75 0.40 0.57 M
Agriculture Zone 810 Wabash Creek near Pibroch 1.703 0.91 $15.06 0.91 $7.76 0.93 0.96 H
Clear Hills UplandNo Agriculture Zone classified
11 Hines Creek above Gerry Lake 0.041 0.14 $0.37 0.21 $0.11 0.15 0.12 L
Fescue GrasslandAgriculture zone 9
12 Meadow Creek near mouth 1.285 0.82 $3.23 0.51 $0.82 0.40 0.58 M13 Trout Creek near Granum 1.164 0.79 $1.66 0.40 $0.36 0.26 0.48 M14 Prairie Blood Coulee near Lethbridge 0.208 0.27 $3.82 0.55 $0.84 0.42 0.39 L
Mixed GrasslandAgriculture Zone 12
15 New West Coulee near the mouth 0.837 0.66 $10.68 0.79 $5.80 0.82 0.80 HAgriculture zone 11
16 Drain S-6 near Bow Island 1.208 0.80 $23.97 0.99 $13.55 0.99 0.97 H
Moist Mixed GrasslandAgriculture Zone 5
17 Crowfoot Creek near Cluny 0.605 0.53 $11.70 0.84 $7.27 0.92 0.80 HAgriculture Zone 10
18 Battersea Drain near the mouth 4.352 0.99 $15.18 0.93 $6.61 0.88 0.98 H
Northern Continental DivideAgriculture zone 9
19 Willow Creek at secondary 532 0.101 0.21 $0.15 0.15 $0.04 0.09 0.10 L
Peace LowlandAgriculture zone 14
20 Grande Prairie Creek near Sexsmith 0.339 0.37 $7.02 0.69 $3.39 0.68 0.57 M21 Kleskun Hills Main Drain near Grande Prairie 0.684 0.57 $12.97 0.87 $6.48 0.86 0.80 H
Western Alberta Upland
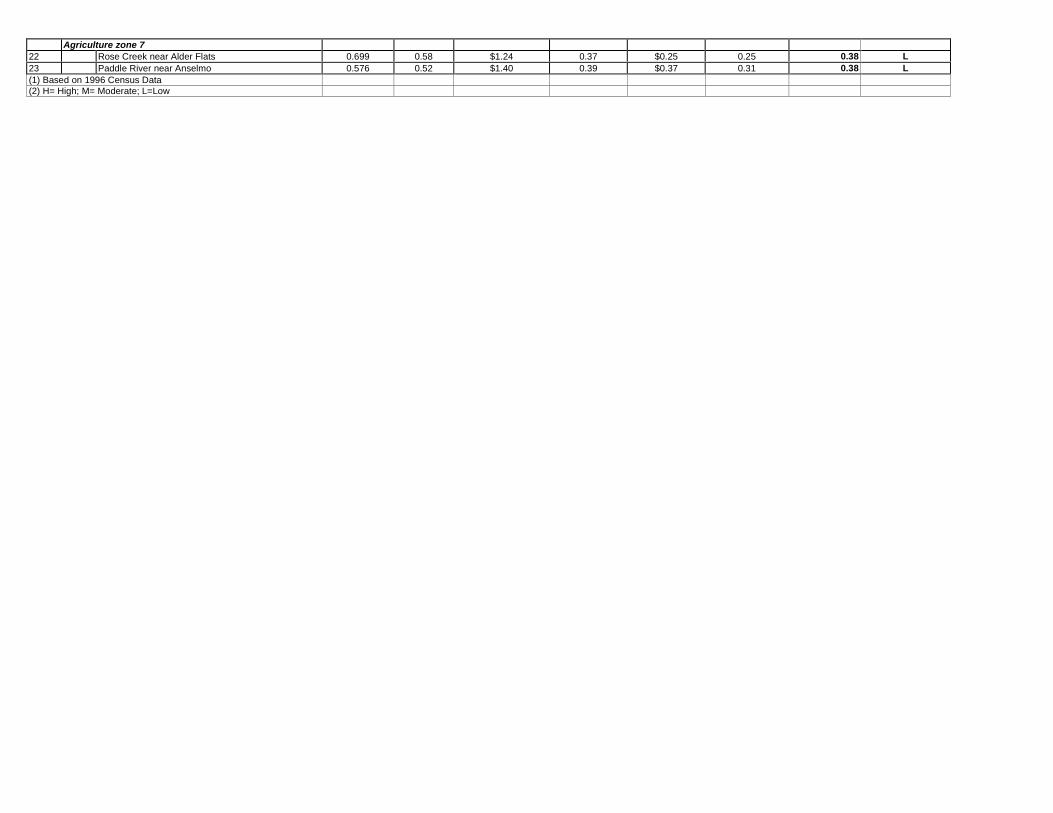
Agriculture zone 722 Rose Creek near Alder Flats 0.699 0.58 $1.24 0.37 $0.25 0.25 0.38 L23 Paddle River near Anselmo 0.576 0.52 $1.40 0.39 $0.37 0.31 0.38 L(1) Based on 1996 Census Data(2) H= High; M= Moderate; L=Low
0.0
0.1
0.2
0.3
0.4
0.5
0.6
0.7
0.8
0.9
1.0
Willow C
reek
Hines C
reek
Rose C
reek
Paddle
Rive
r
Prairie
Blood C
oulee
Trout C
reek
Tomah
awk C
reek
Grande
Prairie
Cree
k
Meado
w Cree
k
Blindm
an R
iver
Strawbe
rry C
reek
New W
est C
oulee
Crowfoo
t Cree
k
Klesku
n Drai
nBuff
alo C
reek
Wabas
h Cree
k
Stretto
n Cree
k
Renwick
Cree
k Drai
n S-6
Batters
ea D
rain
Threeh
ills C
reek
Hayne
s Cree
k Ray
Cree
k
Agr
icul
ture
Inte
nsity
Pe
rcen
tile
High Intensity Moderate Intensity Low Intensity
Figure 17. Agricultural Intensity for AESA Watersheds based on 1996 Canada Census Data.

0.0
1.0
2.0
3.0
4.0
5.0
Hines C
reek
Willow C
reek
Prairie
Blood C
oulee
Grande
Prairie
Cree
k
Paddle
Rive
r
Crowfoo
t Cree
k
Klesku
n Drai
nRos
e Cree
k
Buffalo
Cree
k
New W
est C
oulee
Renwick
Cree
k
Stretto
n Cree
k Trou
t Cree
k Drai
n S-6
Tomah
awk C
reek
Strawbe
rry C
reek
Meado
w Cree
k
Threeh
ills C
reek
Wabas
h Cree
k
Blindm
an R
iver
Hayne
s Cree
k Ray
Cree
k
Batters
ea D
rain
Man
ure
Prod
uctio
n (to
nnes
/acr
e)
Maximum
75th Percentile
40th Percentile
Provincial Distribution of Watersheds
Figure 18. Manure production for AESA watersheds as compared to provincial values.

0.0
5.0
10.0
15.0
20.0
25.0
30.0
35.0
Willow C
reek
Hines C
reek
Rose C
reek
Paddle
Rive
rTrou
t Cree
k
Tomah
awk C
reek
Meado
w Cree
k
Blindm
an R
iver
Prairie
Blood C
oulee
Grande
Prairie
Cree
k
Strawbe
rry C
reek
Wabas
h Cree
k
New W
est C
oulee
Crowfoo
t Cree
k
Buffalo
Cree
k
Stretto
n Cree
k
Klesku
n Drai
n
Batters
ea D
rain
Hayne
s Cree
k
Threeh
ills C
reek
Ray C
reek
Drain S
-6
Renwick
Cree
k
Fert
ilize
r Exp
ense
s (d
olla
rs/a
cre)
Maximum
75th Percentile
40th Percentile
Provincial Distribution of Watersheds
Figure 19. Fertilizer expenses for AESA watersheds as compared to provincial intensity values.

0.0
2.0
4.0
6.0
8.0
10.0
12.0
14.0
16.0
18.0
Willow C
reek
Hines C
reek
Rose C
reek
Trout C
reek
Paddle
Rive
r
Tomah
awk C
reek
Meado
w Cree
k
Prairie
Blood C
oulee
Blindm
an R
iver
Strawbe
rry C
reek
Grande
Prairie
Cree
k
Wabas
h Cree
k
New W
est C
oulee
Klesku
n Drai
n
Buffalo
Cree
k
Batters
ea D
rain
Crowfoo
t Cree
k
Stretto
n Cree
k
Hayne
s Cree
k
Threeh
ills C
reek
Ray C
reek
Renwick
Cree
k Drai
n S-6
Che
mic
al E
xpen
ses
(dol
lars
/acr
e)
Maximum
75th Percentile
40th Percentile
Provincial Distribution of Watersheds
Figure 20. Chemical expenses for AESA watersheds as compared to provincial intensity values.

3.2 Regional Perspective
Ecoregions integrate aspects of natural spatial variability in climate, geology and physicalcharacteristics and provide a logical framework to define attainable water quality goalsand to describe and understand broad-scale regional differences in water quality (Hughesand Larsen 1988).
Ecoregions are appropriate spatial units in a program such as the AESA streammonitoring program because climate, geology and physical characteristics are morehomogenous within than among ecoregions. Natural characteristics, are therefore, lesslikely to account for differences among streams in the same ecoregion, making it easier tostudy influences from man’s activities. Agricultural zones within ecoregions define sub-units that have been standardized further based on the nature of agricultural production.
Ideally, trends in water quality would be followed in basins that cover the range ofagricultural intensity typical for each ecoregion and each agricultural zone. However, insome instances, the entire range of agricultural intensity may not have been covered forsome ecoregions or agricultural zones because the basins did not meet specified criteriafor landscapes, soils and runoff potential. Furthermore, logistic factors (i.e. which definethe cost of the program) become a significant consideration when a large number ofstreams need to be considered for monitoring. Finally, drainage basins in areas of verylow runoff were avoided in the selection process because the lack of runoff wouldconsiderably reduce transport processes from the watershed to the stream. Consequently,it would be difficult to relate trends in water quality with trends in agricultural intensityfor the entire basin (see above).
Streams have been selected in 6 out of the 8 ecoregions that support agriculture in theprovince (no streams were selected in the mixed boreal upland or the sub-alpine/alpineecoregion) (Table 5). At least one stream was selected in 9 out of the 15 agriculturalzones (no streams were selected in zones 1, 3, 4 and 13, which are areas of very lowrunoff, and in zones 8 and 15, which currently, have a very low level of agriculturaldevelopment).
Figure 21 identifies streams selected for the AESA program in the Aspen ParklandRegion and compares their agricultural intensity with that from other streams in thatecoregion. Streams are further grouped by agricultural zone.
Figure 21 illustrates how well selected streams cover the range of agricultural intensitieswithin each ecoregion and agricultural zone. Over half of the streams in the AspenParkland drain land farmed with high intensity; these are well represented by the 6streams selected in that ecoregion.

0.0
0.2
0.4
0.6
0.8
1.0
Watersheds
Agr
icul
tura
l Int
ensi
ty P
erce
ntile
Buffalo Creek Stretton CreekHaynes CreekThreehills Creek
Ray CreekRenwick Creek
AESA Watersheds
Ag Zone 2 Ag Zone 6 Ag Zone 7Ag Zone 5
Figure 21. Distribution of agriucltural intensity in watersheds of the Aspen Parkland ecoregion compared to the AESA watersheds.

Some streams in the Aspen Parkland drain land farmed with moderate and low intensity,but none were selected for monitoring. Some agricultural regions straddle the Parklandregion and neighbouring ecoregions. In such instances, streams from nearby ecoregionscould be used as surrogates. For example, there are no low intensity streams selected inthe Aspen Parkland portion of zone 7, but Rose Creek and Paddle River in the WesternAlberta Upland portion of zone 7 would provide background data, and Tomahawk Creekand the Blindman River in the Boreal Transition portion of zone 7 would provide data formedium intensity streams. Similar evaluations of how representative selected drainagebasins are in other ecoregions can be made based on graphs presented in Appendix 4 foragricultural intensity, manure production, chemical and fertilizer expenses.
4. Conclusions
An intensive watershed selection process was undertaken to identify representative smallagricultural watersheds across Alberta. Numerous large databases (e.g. AGRASID,Canada census) were queried to establish watershed profiles for agriculture intensity andrunoff potential. As a result, 23 watersheds were selected for the AESA Water QualityMonitoring program.
The selected watersheds cover the range of agricultural intensity and patterns ofproduction, which, based on 1996 census data, typify the white zone of the province.Water quality monitoring data from these AESA watersheds are considered to berepresentative of water quality conditions in other watersheds within the same ecoregionand agricultural zone and with similar agricultural intensity characteristics.
As the agricultural sector in Alberta grows and practices change to include BeneficialManagement Practices (BMPs) to reduce impacts on water quality it is expected thattrends in surface water quality may become apparent over time. Trends in water qualityof the AESA watersheds will serve as surrogate for trends in other watersheds, regionallyand provincially.
Although the influence of agricultural activity on the landscape is the predominanthuman influence in the AESA watersheds, it is important to recognise that factorsunrelated to changes in agricultural intensity can influence the interpretation andextrapolation of the data. Following are some specific examples of factors that caninfluence trends in water quality:
- Climatic and hydrological influences must be considered carefully, both in theevaluation of temporal and spatial trends. Hydrological events (runoff fromsnowmelt or rainfall) are the main drivers of material movement from land to water;their intensity can vary from year-to-year within a watershed and among watersheds.
Most of the AESA watersheds that have moderate and low agricultural intensity tendto be located in areas of moderate to high runoff, whereas most streams that drainintensively farmed land tend to be located in low runoff zones. The runoff volume
could have significant implications on the response time of water quality to changesin agricultural intensity in the watershed: streams in low runoff areas can be expectedto respond more slowly than streams in high runoff areas. Trends may be delayed inhigh intensity watersheds in low runoff areas and the absence of trends may bemisleading or unnecessarily disappointing.
- The AESA watersheds offer a good cross-section of current agricultural developmentand distribution in the province. However, over time, the nature and distribution ofagriculture in the province could change. Regular reviews of Canada Census datawill be critical to ensure that AESA watersheds remain representative of agriculturein the future.
For example, relatively few streams have been selected in higher runoff areas.Future census data will need to be reviewed promptly to ensure that thesewatersheds remain representative and to determine the need to expand the AESAprogram to higher runoff zones
- Similarly it will be necessary to follow the evolution of human population densitiesand non-agricultural activities in the province and within the AESA watersheds.
- The importance of communicating results of the monitoring program to landownersliving and farming within the AESA watersheds is unquestioned. However, there isa possibility that by doing so landowners will become aware sooner of the need toimplement beneficial management practices (BMP) to protect water quality and willact sooner than the rest of the farming community. While the implementation ofBMP is an essential outcome of the AESA program in general, greater activity in thisregard in AESA watersheds would make these watersheds less representative oftrends and impacts of agriculture in the province.
The AESA water quality-monitoring program is an industry-supported initiative that willhelp to report on the industry’s progress towards environmental sustainability. Data forthe 23 watersheds will assist scientists, technical specialists and the agriculturalcommunity to depict trends over time as well as to identify water quality concerns facingthe industry.
5. Literature Cited
Anderson, A.-M. D.O. Trew, R.D. Neilson, N.D. MacAlpine, and R. Borg. 1998a.Impacts of agriculture on surface water quality in Alberta. Part II: Provincialstream survey. Prepared for the CAESA Water Quality Committee. Published byAlberta Agriculture, Food and Rural Development, Edmonton. 91 pp.
Anderson, A.-M., K.A. Saffran, G. Byrtus, D.O. Trew, R.D. Neilson, N.D. MacAlpine,and R. Borg. 1998b. Impacts of agriculture on surface water quality in Alberta.
Part III: Pesticides in small streams and lakes. Prepared for the CAESA WaterQuality Committee. Published by Alberta Agriculture, Food and RuralDevelopment, Edmonton. 84 pp.
Anderson, A.-M., MacAlpine, and surface water quality in Alberta: provincial streamand standing water bodies surveys – site selection and study design. Prepared forCAESA Water Quality Committee. Published by Alberta Agriculture, Food andRural Development, Edmonton. 15 pp.
Bell, B.J. 1994. Annual unit runoff on the Canadian Prairies. Reviewed and edited byF.R.J. Martin. Hydrology Report #135. Engineering and Sustainability Services.Prairie Farm Rehabilitation Administration, Regina, Saskatchewan.
CAESA. 1998. Agricultural impacts on water quality in Alberta – An initial assessment–Published on behalf of the Canada – Alberta Environmentally SustainableAgriculture Water Quality Committee by Alberta Food and Rural Development,Lethbridge, Alberta.
CAESA-Soil Inventory Project Working Group. 1998. AGRASID: Agricultural Regionof Alberta Soil Inventory Database (Version 1.0). J.A. Brierly, B.D. Walker, P.E.Smith, and W.L. Nikiforuk [eds], Alberta Agriculture, Food and RuralDevelopment, Edmonton, Alberta. CD-ROM.
Cherneski, P.L., and D. L. Ackerman. 1998. The PFRA Watershed Project, Regina,Saskatchewan. 7 pp. [July 31, 2000 http://www.agr.ca/pfra/gis/download.htm]
DBASE. 1992. Borland International Inc., Scotts Valley, CA.
Ecological Stratification Working Group. 1995. A national ecological framework forCanada. Agriculture and Agri-Food Canada, Research Branch, Centre for Landand Biological Resources Research and Environment Canada, State of theEnvironment Directorate, Ecozone Analysis Branch, Ottawa/Hull. Report andnational map at 1: 7 500 000 scale.
Environment Canada. 1997. Canadian hydrological data. HyDat database. EnvironmentCanada, Ottawa, Ontario. CD-ROM
Hughes, R.M. and D.P. Larsen. 1988. Ecoregions: an approach to surface waterprotection. Journal WPCF 60: 487-493.
Johnson, C.I. and J. Kirtz. 1998. Agricultural intensity in Alberta, 1996 and changessince 1991. Prepared for the AESA Water Quality Monitoring Committee.Alberta Agriculture Food and Rural Development, Edmonton, Alberta.
Statistics Canada. 1996. Census of agriculture. Custom tabulation.

Shields, J.A., C. Tarnocai, K.W.G. Valentine, and K.B. MacDonald. 1991. Soillandscapes of Canada. Procedures manual and user'’ handbook. AgricultureCanada Publication 1868/E. Communications Branch, Agriculture Canada,Ottawa, Ontario.
Statistical Analysis Systems Institute Inc. 1988. SAS Version 6.08. SAS Institute Inc.,Cary, NC.

Appendix 1
AGRASID criteria to define landscape and soils with differentrunoff potential

Landscape Criteria, Likelihood to Deliver Runoff from Field to Creeks
Landscape characteristics in the AGRASID database as described in the Soil InventoryProject Procedures Manual (CAESA-Soil Inventory Project Working Group 1998) wereclassified according to runoff likelihood and classified as the following:
Type I – Landforms with well developed natural drainage, having a high potentialto deliver runoff to streams. Landforms listed in AGRASID which are of thistype are of the rolling, undulating, ridged, inclined and valley types.
Type II – Landforms with closed, poorly developed natural drainage (knob andkettle, potholes) which will trap runoff and have a low potential to deliver runoff.To be conservative, hummocky landscapes including low relief was interpreted asType II landscapes.
Type III – landforms that are flat to low undulating with poorly drainedlandscapes, but fine textured soils. In agricultural areas these are likely to beartificially drained.
Type I. Open, well developed natural drainage:AGRASID
CODEDescription
M1 Rolling, moderate and high reliefR2 Ridged, moderate and high reliefU1 Undulating, high reliefSC1 Valley with confined flood plain, high relief (steep sides)SC2 Wide valley with terracesSC3 V-shaped valley, no flood plain or terracesSC4 Sub-glacial channelI1 Low relief, inclined plainI2 No description here?I3 Inclined to steep single slope landform, low, moderate, high reliefI4 Inclined to steep single slope with >10% exposed bedrockI5 Inclined steep landforms with extensive failure slumpsIU Inclined and undulating, low and high relief

Type II. Closed, poorly developed natural drainage (knob and kettle, potholes):
AGRASIDCODE
Description
H1 Hummocky, low, moderate and high reliefH5 Hummocky draped moraine over soft rock, low, moderate and high
reliefHP1 Hummocky stagnation moraine with nearly level lacustrine plateaus
(not sure whether this belongs in Type 2 or Type 3.HR2 Hummocky and Ridged, moderate and high reliefNOTE: Hummocky landscapes, including low relief will be interpreted as type IIlandscapes.
Type 3 Flat to low undulating with poorly drained landscapes but heavy textured soils,likely artificially drained
AGRASIDCODE
Description
L1 Level PlainL2 Level and Closed BasinL3 Level and terraced Not within modern stream channelsR2 Ridged, low relief (may be well drained in some cases)U1 Undulating, low relief
These landscapes combined with an identifier of parent material being glacial-lacustrineshould give us old ‘laking’ basins where these landscapes are likely to occur.Soils that have a Gleyed modifier in the subgroup category usually are soils in level ordepressional landscapes. Consequently, gleyed soils should not be found in Type 1landscapes, to a minor extent they should be found around potholes and sloughs in Type2 landscapes. They should be common in Type 3 landscapes, up to 30% of the landscape.
Soils Criteria, Runoff Event Likelihood:
High Likelihood:
There is a high likelihood of runoff from soils with a shallow depth of the Ah or Aphorizons and soil textures that include silt, or clay loam. High runoff likelihood alsoexists with a B-horizon that has higher clay content than A horizon or has high sodiumcontent. Luvisol, solonetzic and their derivatives are soil development classes that wouldfacilitate higher likelihood of runoff.

Heavy Soil Textures in A or B horizon that promote higher runoff likelihood include:
AGRASIDCODE
Description
SI SiltSCL Sandy Clay LoamSICL Silty Clay LoamCL Clay LoamSC Sandy ClaySIC Silty ClayC ClayHC Heavy Clay
High runoff likelihood may also be present as a result of the parent material texture andthe layered materials that experience changes between 30 and 100 cm depth. (refer to :Table 4.7; CAESA-Soil Inventory Project Working Group 1998)
AGRASIDCODE
Description
L1 Gravel or gravelly coarse over medium or fine textured till (includescobbly and stony variations)
L2 Coarse textured (S, LS, SL) over medium or fine textured tillL3 Medium textured (VFSL, L, SiCL, CL) over medium or fine textured tillL6 Till (Till name) over soft rockL7 Coarse (not till) over soft rock L8 – Medium (not till) over sof trockL9 Coarse (not till) textured over fine or very fine (not till)L10 Medium (not till) textured over fine or very fine (not till)L17 Gravelly (includes stony variations) medium textured material over
medium or fine textured tillL19 Gravelly medium textured material over soft rockL20 Coarse textured over medium or moderately fine (not till)L21 Gravelly coarse textured over medium or moderately fine (not till)

Other specific characteristics that would facilitate a high likelihood of runoff include thefollowing
AGRASIDCODE
Description
ZT Solonetzic B HorizonXL Lithic (bedrock close to surface)
Line needed?TA Thin A horizonYc Clay at 100 to 200 cmYL Lithic at 100 to 200 cm (bedrock close to surface)ZS SolodicZT Solonetzic
Order, Great Group and Subgroups
Gleyed subgroups are usually found in areas of poor surface drainage. Hence thesecategories fit with Type 3 landscapes. However, they also represent frequently saturatedsoils, consequently they also are soils with a higher runoff potential. The followingChernozemic soils would be classified as facilitating high runoff likelihood:
BrownSZ.B. = Solonetzic BrownGL.B = Gleyed BrownGLR.B = Gleyed Rego BrownGLCA.B = Gleyed Calcerous BrownGLSZ.B = Gleyed Solonetzic Brown
Dark BrownSZ.DB = Solonetzic Dark BrownGL.DB = Gleyed Dark BrownGLR.DB = Gleyed Rego Dark BrownGLCA.DB = Gleyed Calcareous Dark BrownGLSZ.DB = Gleyed Solonetzic Dark Brown
BlackSZ.BL = Solonetzic BlackGL.BL = Gleyed BlackGLR.BL = Gleyed Rego BlackGLCA.BL = Gleyed Calcareous BlackGLE.BL = Gleyed Eluviated BlackGLSZ.BL = Gleyed Solonetzic Black
Dark GraysSZ.DG = Solonetzic Dark GrayGL.DG = Gleyed Dark Gray
GLR.DG = Gleyed Rego Dark GrayGLCA.DG = Gleyed Calcareous Dark GrayGLE.DG = Gleyed Eluviated Dark GrayGLSZ.DG = Gleyed Solonetzic Dark Grey
NOTE: Dark Gray soils should be checked for changes in Ksat between A and Bhorizons; Dark Gray Soils series with significant changes should be considered as havinghigh runoff potential.
Regosolic (Rego) lack a B Horizon which means they are either a new soil (fromsediment or extremely sandy. Consequently, they should be in the Low runoff classexcept for gleyed sub-groups.
All Gleysolic, Luvisolic and Solonetzic soils were classified as high runoff potentialsoils.
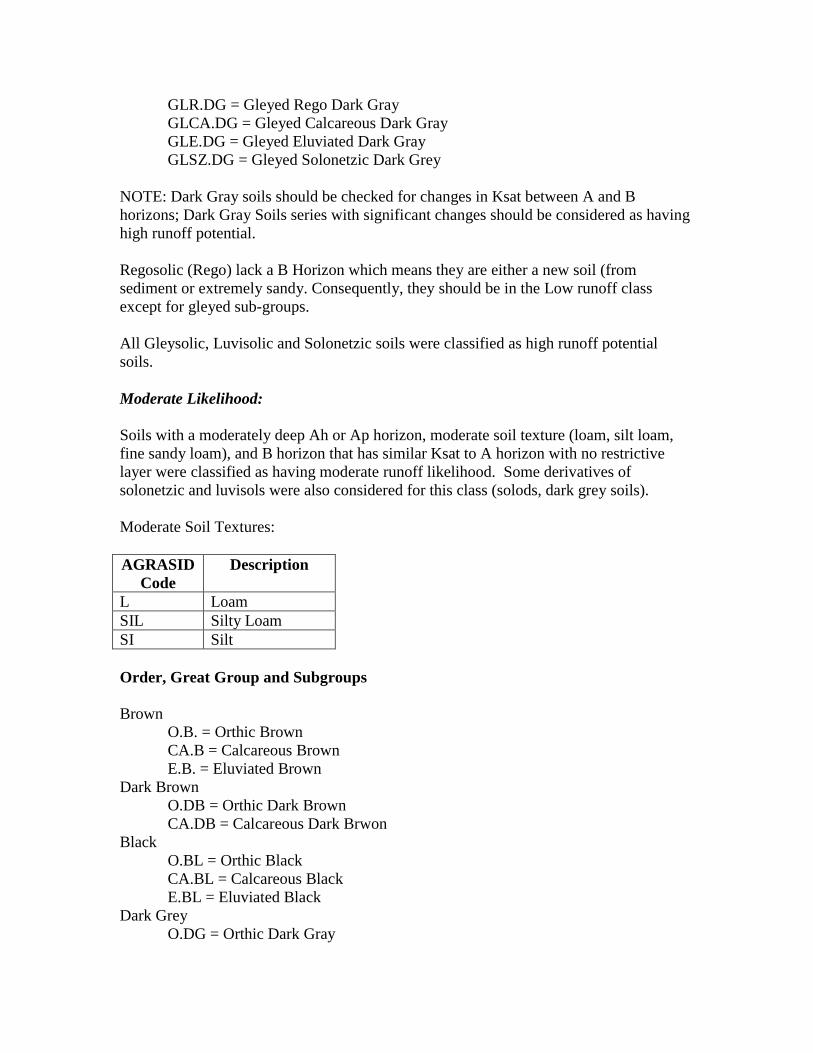
Moderate Likelihood:
Soils with a moderately deep Ah or Ap horizon, moderate soil texture (loam, silt loam,fine sandy loam), and B horizon that has similar Ksat to A horizon with no restrictivelayer were classified as having moderate runoff likelihood. Some derivatives ofsolonetzic and luvisols were also considered for this class (solods, dark grey soils).
Moderate Soil Textures:
AGRASIDCode
Description
L LoamSIL Silty LoamSI Silt
Order, Great Group and Subgroups
BrownO.B. = Orthic BrownCA.B = Calcareous BrownE.B. = Eluviated Brown
Dark BrownO.DB = Orthic Dark BrownCA.DB = Calcareous Dark Brwon
BlackO.BL = Orthic BlackCA.BL = Calcareous BlackE.BL = Eluviated Black
Dark GreyO.DG = Orthic Dark Gray

CA.DG = Calcareous Dark GrayLuvisolic
DG.L = Dark Gray Luvisolic
Low likelihood
Soils with deep Ah or Ap horizon, moderate to coarse soil texture (loams, sandy loamsand sands) and B horizons that have the same permeability as A horizon were classifiedas having low runoff potential. Regosolics were considered as having low runoffpotential in terms of the soil development. Chernozems with good profile developmentalso fit this category.
Moderate to Coarse Soil Textures
AGRASIDCode
Description
S SandLS Loamy SandSL Sandy LoamL Loam
Order, Great Group and Subgroup
Regosolic soils in any group unless modified by gleyed soils were classified as havinglow runoff potential as they should be well-drained soils.

Appendix 2:
Agricultural intensity, runoff potential characteristics for Albertawatersheds

Ecoregion: SubAlpine, AlpineRunoff Potential
Agricultural Indicators Landform Characteristics Soil Characteristics
WatershedCode
Watershed Name Area (km²) ManureProduction(tonne per
acre)
ManureProduction(Percentile)
FertilizerExpenses
(dollars peracre)
FertilizerExpenses
(Percentile)
ChemicalExpenses(dollar per
acre)
ChemicalExpenses
(percentile)
AgricultureIntensityOverall
Percentile
Type I Type II Type III High (%) Moderate (%) Low (%) Unknown (%)
1 05BE999 GHOST TRAIL 187.8 0.36546 0.393 0.88506 0.326 0.19529 0.212 0.30300 0.300276 0.326318 0.147204 0.620092 0.11352093 0.019222 0.087324212 05BJ003 ELBOW RIVER AT
FULLERTON'SRANCH
302.0 0.21873 0.279 0.54755 0.251 0.13778 0.173 0.22500 0.009554 0.052829 0.038676 0.01232227 0.008242 0.00314316
3 05BJ006 ELBOW RIVERABOVE ELBOWFALLS
307.5 0.05734 0.161 0.14048 0.143 0.03465 0.081 0.14500
4 05BL018 SHEEP RIVER ATBUCK RANCH
453.1 0.15955 0.244 0.23767 0.178 0.06224 0.113 0.18700 0.005891 0.003407 0.002485
5 05BL019 HIGHWOODRIVER ATDIEBEL'S RANCH
483.2 0.02671 0.116 0.03287 0.082 0.00149 0.02 0.10100 0.00844 0.001197 4.347E-05 0.001588 0.00561172
6 05BL027 TRAP CREEKNEAR LONGVIEW
137.1 0.10905 0.216 0.16246 0.148 0.04262 0.091 0.16700 0.209173 0.000415 0.180043 0.021547 0.00799791
05AA002 CROWSNESTRIVER NEARLUNDBRECK
208.8 0.53197 0.491 1.14878 0.358 0.4203 0.332 0.37300 0.572913 0.181876 0.020747 0.503593 0.01195774 0.271566 0.02256012
05AA003 CASTLE RIVERNEAR COWLEY
57.6 1.65345 0.9 5.83511 0.66 2.2445 0.608 0.74800 0.422308 0.299106 0.547892 0.00774081 0.479159 0.03754763
05AA004 PINCHER CREEKAT PINCHERCREEK
157.2 0.81507 0.654 1.74252 0.425 0.87062 0.433 0.49800 0.480888 0.31136 0.001251 0.602968 0.0075952 0.12611 0.06892662
7 05AA005 COW CREEKNEAR COWLEY
93.6 0.35397 0.383 0.78213 0.312 0.23964 0.242 0.30800 0.554943 0.203639 0.029573 0.719681 0.00470192 0.047364 0.01640887
8 05AA007 CONNELLYCREEK NEARLUNDBRECK
51.3 0.5015 0.472 2.2303 0.462 0.78282 0.413 0.44000 0.562861 0.307775 0.690202 0.01527036 0.146524 0.01863942
9 05AA010 BEAVER MINESCREEK NEARBEAVER MINES
63.0 0.78161 0.639 0.8421 0.322 0.67256 0.391 0.44500 0.396386 0.25689 0.589078 0.02579836 0.07246 0.06352235
10 05AA011 MILL CREEKNEAR THEMOUTH
178.6 0.34445 0.374 0.33943 0.197 0.29501 0.272 0.27400 0.255678 0.144876 0.010972 0.299122 0.00329148 0.090382 0.02017773
11 05AA015 CASTLE RIVERAT MCDONALD'SRANCH
74.4 0.687 0.568 0.59597 0.264 0.58485 0.376 0.39000 0.260468 0.07865 0.310037 0.075446 0.02179941
12 05AA016 CARBONDALECREEK ATEVAN'S RANCH
309.2 0.25775 0.309 0.2236 0.175 0.21943 0.229 0.22700 0.004518 0.002894 0.007034 0.008631 0.00037836
13 05AA021 OLDMAN RIVERAT THE GAP
843.7 0.03686 0.137 0.04789 0.092 0.00532 0.026 0.11200
14 05AA022 CASTLE RIVERNEAR BEAVERMINES
65.3 1.05022 0.737 1.83214 0.433 0.93433 0.453 0.53900 0.37357 0.315577 0.090029 0.596236 0.02724629 0.313493 0.03184974
15 05AA023 OLDMAN RIVERNEARWALDRON'SCORNER
240.3 0.37972 0.401 0.56652 0.253 0.14943 0.178 0.26300 0.312002 0.061684 0.060335 0.302427 0.00561489 0.120028 0.00595028
16 05AA028 CASTLE RIVERAT RANGERSTATION
374.7 0.10415 0.206 0.09035 0.116 0.08867 0.128 0.16400
17 05AA029 CALLUM CREEKAT WALDRON'SRANCH
188.2 0.86906 0.677 2.05187 0.449 0.62511 0.379 0.49800 0.681601 0.191893 0.657468 0.00821138 0.112267 0.09554689

16 05AA909 TODD CREEKNEAR HIGHWAYNO.22
73.9 0.18398 0.257 0.27019 0.189 0.06685 0.115 0.18900 0.331352 0.132166 0.108763 0.445767 0.104097 0.01385342
17 05AB003 418.3 1.16397 0.786 1.65598 0.414 0.36383 0.304 0.47100 0.983371 0.014666 0.709427 0.02500686 0.118872 0.1447303418 05AB022 WEST STREETER
CREEK NEARNANTON
1.3 1.12221 0.769 1.17299 0.36 0.20684 0.219 0.44900 0.987748 0.98774828
19 05AB023 MIDDLESTREETERCREEK NEARNANTON
0.8 1.12264 0.774 1.17344 0.365 0.20692 0.224 0.46200 1.003533 1.00353255
20 05AB024 EAST STREETERCREEK NEARNANTON
0.6 1.12225 0.77 1.17304 0.362 0.20685 0.22 0.44800 0.997732 0.475134 0.52259816
21 05AB028 WILLOW CREEKABOVE CHAINLAKES
161.4 0.26301 0.319 0.39378 0.22 0.1053 0.147 0.22000 0.176395 0.051074 0.192193 0.028417 0.00686013
22 05AB030 STREETERCREEK (MAINSTEM) NEARNANTO
3.5 1.12231 0.772 1.1731 0.363 0.20686 0.222 0.45100 0.89272 0.106291 0.542367 0.031887 0.42475682
23 05AD001 MAMI CREEK ATMOUNTAIN VIEW
21.6 1.50341 0.875 3.70985 0.551 1.38503 0.515 0.63900 0.152837 0.845211 0.80719 0.14016 0.05069863
24 05AD003 WATERTONRIVER NEARWATERTONPARK
209.0 0.25955 0.311 0.64046 0.279 0.23911 0.24 0.26100 0.019944 0.011073 0.021045 0.00997178
25 05AD004 CROOKEDCREEK NEARWATERTONPARK
49.3 1.08823 0.755 2.68532 0.499 1.00254 0.459 0.56700 0.398021 0.238282 0.019896 0.52331 0.04449288 0.078684 0.00971231
26 05AD005 BELLY RIVERNEAR MOUNTAINVIEW
101.5 0 0 0 0 0 0 0.00000 0.06467 0.06565 0.124843 0.025838 0.00306687
27 05AD010 DRYWOODCREEK NEARTHE MOUTH
156.7 0.47544 0.459 0.71603 0.306 0.41802 0.331 0.36200 0.214768 0.331832 0.007771 0.312778 0.00149499 0.196101 0.03207686
28 05AD014 SPRING CREEKNEARWATERTONPARK
0.2 1.73267 0.925 4.27557 0.59 1.59624 0.546 0.66900
29 05AD016 DRYWOODCREEK NEARTWIN BUTTE
30.5 0.10553 0.21 0.09155 0.119 0.08984 0.132 0.16800 0.034368 0.045943 0.042597 0.038282
30 05AD024 MAMI CREEKBELOW LEAVITT-AETNA DIVERS
35.0 0.27702 0.331 0.68358 0.296 0.25521 0.255 0.28800 0.237814 0.667408 0.83908 0.079286 0.05113424
31 05AD036 DRYWOODCREEK BELOWSOUTHDRYWOOD CRE
51.1 0.32714 0.364 0.28379 0.192 0.2785 0.264 0.26000 0.070082 0.164173 0.14143 0.147318 0.00551145
32 05AD039 LONESOME LAKEAT WATERTONPARK
3.6 0 0 0 0 0 0 0.00000
33 05AD903 COTTONWOODCREEK NEARTWIN BUTTE
34.8 0.47546 0.461 0.45955 0.231 0.40683 0.326 0.34000 0.269507 0.314869 0.118166 0.407565 0.162342 0.13781705
34 05AD904 GALWEY BROOKNEARWATERTONPARK
20.5 0.01372 0.078 0.03385 0.084 0.01264 0.046 0.09600 0.017192 0.002011 0.008596 0.044993
35 05AE023 LEE CREEKNEAR BEAZER
13.1 0.26283 0.317 0.64856 0.283 0.24213 0.244 0.27400 0.869313 0.12896 0.590231 0.13838612 0.26956 9.5487E-05

36 05AE037 LEE CREEK ATBEAZER
29.0 1.6986 0.911 4.1915 0.578 1.56485 0.541 0.67600 0.407392 0.590614 0.719992 0.266407 0.01160807
37 05AE039 TOUGH CREEKNEAR BEAZER
38.8 0.04658 0.153 0.11494 0.129 0.04291 0.093 0.14000 0.704266 0.276309 0.894946 0.0206045 0.078565 0.00401211
38 05AA008 CROWSNESTRIVER AT FRANK
160.3 0.0336 0.131 0.00609 0.025 0 0 0.05900 0.218829 0.0225 0.182012 0.071352 0.04001924
39 05AA009 CROWSNESTRIVER NEARCOLEMAN
102.1 0.04006 0.14 0.00019 0.004 0 0 0.05500 0.20224 0.004013 0.086434 0.060454 0.07174301
40 05AA012 SUMMIT CREEKAT CROWSNEST
12.4 0.08155 0.186 0 0 0 0 0.08100
05AA013 MCGILLIVRAYCREEK NEARCOLEMAN
32.4 0.02928 0.121 0.02852 0.059 0 0 0.07600 0.06089 0.003415 0.046533 0.008707 0.01215436
05AA018 ALLISON CREEKNEAR SENTINEL
47.4 0.03066 0.123 0.02781 0.057 0 0 0.07600 0.050012 0.005001 0.02724 0.01777147
05AA020 BLAIRMORECREEK NEARBLAIRMORE
47.7 0.03262 0.127 0.0269 0.055 0 0 0.07900 0.401053 0.378823 0.000122 0.02210789
41 05AA026 DUTCH CREEKNEAR THEMOUTH
142.4 0.02534 0.105 0.03009 0.07 0 0 0.07300
42 05AA027 RACEHORSECREEK NEARTHE MOUTH
217.3 0.02547 0.107 0.03025 0.071 0 0 0.07700
43 05AA030 GOLD CREEKNEAR FRANK
63.2 0.03831 0.139 0.0303 0.073 0.0013 0.016 0.10600 0.587397 0.449243 0.094298 0.04456756
44 05AD006 CAMERONCREEK ATWATERTONPARK
79.5 0 0 0 0 0 0 0.00000
45 05BA001 BOW RIVER ATLAKE LOUISE
6.1 0 0 0 0 0 0 0.00000
46 05BA002 PIPESTONERIVER NEARLAKE LOUISE
306.2 0 0 0 0 0 0 0.00000
47 05BA003 BATH CREEKNEAR LAKELOUISE
68.9 0 0 0 0 0 0 0.00000
48 05BA004 LOUISE CREEKNEAR LAKELOUISE
25.4 0 0 0 0 0 0 0.00000
49 05BA005 BOW RIVERABOVE BATHCREEK
67.8 0 0 0 0 0 0 0.00000
50 05BA006 JOHNSTONCREEK NEARTHE MOUTH
122.8 0 0 0 0 0 0 0.00000
51 05BA007 BAKER CREEKNEAR THEMOUTH
125.6 0 0 0 0 0 0 0.00000
52 05BA008 BOW RIVERBELOW HECTORLAKE
50.6 0 0 0 0 0 0 0.00000
53 05BA009 BOW GLACIEROUTFLOW
25.8 0 0 0 0 0 0 0.00000
54 05BA010 BOW RIVERABOVE HECTORLAKE
164.1 0 0 0 0 0 0 0.00000
55 05BA011 BALFOUR CREEKNEAR THEMOUTH
38.6 0 0 0 0 0 0 0.00000
56 05BB001 BOW RIVER ATBANFF
807.4 0 0 0 0 0 0 0.00000

57 05BB003 FORTY MILECREEK NEARBANFF
136.7 0 0 0 0 0 0 0.00000
58 05BB004 BREWSTERCREEK NEARBANFF
110.0 0 0 0 0 0 0 0.00000
59 05BB005 REDEARTHCREEK NEARTHE MOUTH
150.4 0 0 0 0 0 0 0.00000
60 05BC001 SPRAY RIVER ATBANFF
230.6 0 0 0 0 0 0 0.00000 0.000684 0.000342 0.000342
61 05BC002 SPRAY RIVERNEAR SPRAYLAKES
361.6 0 0 0 0 0 0 0.00000
62 05BC006 SPRAYRESERVOIR ATTHREE SISTERSDAM
117.7 0 0 0 0 0 0 0.00000 0.001707 0.000854 0.000854
63 05BC008 GOAT CREEK ATBANFF PARKBOUNDARY
39.5 0 0 0 0 0 0 0.00000 0.012016 0.006008 0.006008
64 05BD002 CASCADE RIVERNEAR BANFF
16.8 0 0 0 0 0 0 0.00000
65 05BD003 LAKEMINNEWANKANEAR BANFF
191.8 0 0 0 0 0 0 0.00000
66 05BD005 CASCADE RIVERABOVE LAKEMINNEWANKA
451.4 0 0 0 0 0 0 0.00000
67 05BE001 BOW RIVERNEAR MORLEY
207.6 0.19443 0.268 0.44906 0.229 0.07836 0.122 0.21100 0.263216 0.279959 0.169715 0.38166 0.13083745 0.055065 0.14896521
68 05BE003 BOW RIVERNEARKANANASKIS
322.5 0 0 0 0 0 0 0.00000 0.266484 0.056045 0.143366 0.00916778 0.248851 0.02950255
69 05BE004 BOW RIVERNEAR SEEBE
76.6 0.18121 0.254 0.44396 0.226 0.10282 0.143 0.21200 0.167361 0.352004 0.151719 0.157354 0.19605522 0.238582 0.10142791
70 05BE006 BOW RIVERBELOW GHOSTDAM
77.1 0.28668 0.341 0.65721 0.288 0.11083 0.157 0.25200 0.309509 0.160092 0.017195 0.218727 0.259882 0.00818767
71 05BE008 BOW RIVER ATCANMORE
216.4 0 0 0 0 0 0 0.00000 0.109956 0.001341 0.053203 0.068091 0.02655097
72 05BF001 KANANASKISRIVER NEARSEEBE
34.2 0.15573 0.241 0.38983 0.218 0.09809 0.14 0.20100
73 05BF002 KANANASKISRIVER ABOVELOWER LAKE
0.2 0.02554 0.109 0.03033 0.074 0 0 0.07000
74 05BF003 KANANASKISRIVER ABOVEPOCATERRACREE
2.8 0.02556 0.113 0.03035 0.079 0 0 0.08400
75 05BF004 POCATERRACREEK NEARMOUTH
62.9 0.02555 0.112 0.03034 0.078 0 0 0.08200
76 05BF008 SMITH-DORRIENCREEK NEARMOUTH
100.9 0.00016 0.009 0.00019 0.006 0 0 0.00700
77 05BF009 LOWERKANANASKISLAKE
21.3 0.0045 0.052 0.00535 0.023 0 0 0.03500
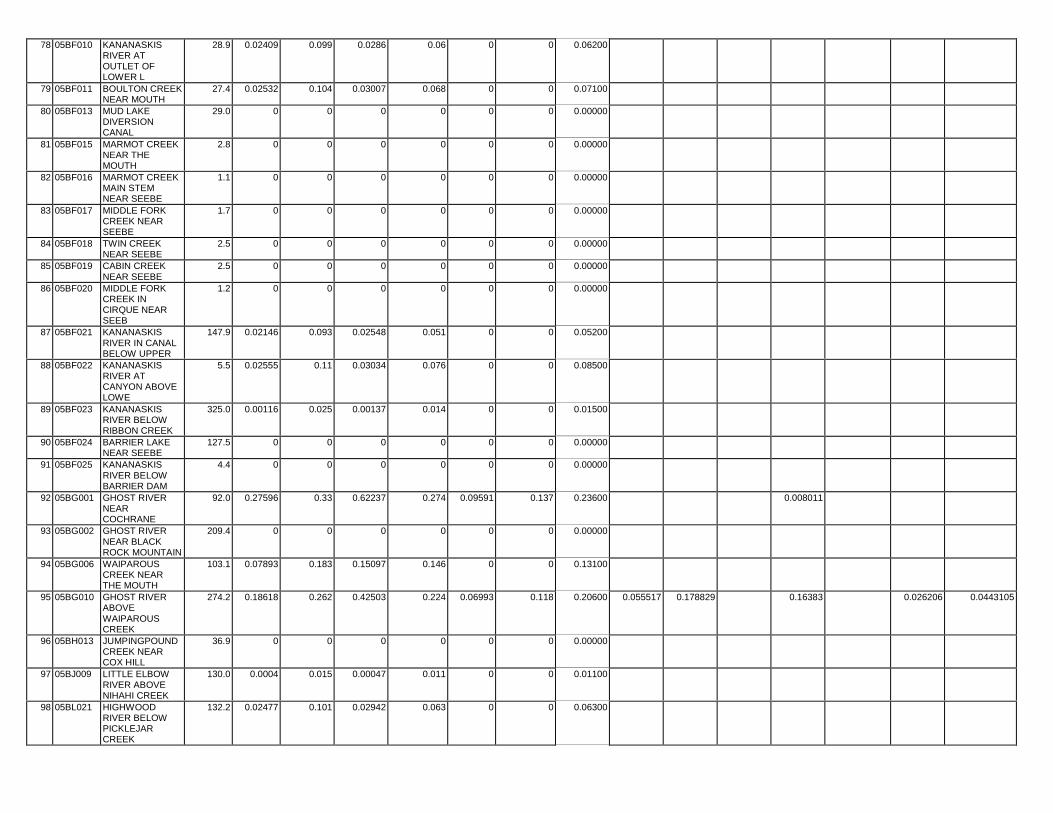
78 05BF010 KANANASKISRIVER ATOUTLET OFLOWER L
28.9 0.02409 0.099 0.0286 0.06 0 0 0.06200
79 05BF011 BOULTON CREEKNEAR MOUTH
27.4 0.02532 0.104 0.03007 0.068 0 0 0.07100
80 05BF013 MUD LAKEDIVERSIONCANAL
29.0 0 0 0 0 0 0 0.00000
81 05BF015 MARMOT CREEKNEAR THEMOUTH
2.8 0 0 0 0 0 0 0.00000
82 05BF016 MARMOT CREEKMAIN STEMNEAR SEEBE
1.1 0 0 0 0 0 0 0.00000
83 05BF017 MIDDLE FORKCREEK NEARSEEBE
1.7 0 0 0 0 0 0 0.00000
84 05BF018 TWIN CREEKNEAR SEEBE
2.5 0 0 0 0 0 0 0.00000
85 05BF019 CABIN CREEKNEAR SEEBE
2.5 0 0 0 0 0 0 0.00000
86 05BF020 MIDDLE FORKCREEK INCIRQUE NEARSEEB
1.2 0 0 0 0 0 0 0.00000
87 05BF021 KANANASKISRIVER IN CANALBELOW UPPER
147.9 0.02146 0.093 0.02548 0.051 0 0 0.05200
88 05BF022 KANANASKISRIVER ATCANYON ABOVELOWE
5.5 0.02555 0.11 0.03034 0.076 0 0 0.08500
89 05BF023 KANANASKISRIVER BELOWRIBBON CREEK
325.0 0.00116 0.025 0.00137 0.014 0 0 0.01500
90 05BF024 BARRIER LAKENEAR SEEBE
127.5 0 0 0 0 0 0 0.00000
91 05BF025 KANANASKISRIVER BELOWBARRIER DAM
4.4 0 0 0 0 0 0 0.00000
92 05BG001 GHOST RIVERNEARCOCHRANE
92.0 0.27596 0.33 0.62237 0.274 0.09591 0.137 0.23600 0.008011
93 05BG002 GHOST RIVERNEAR BLACKROCK MOUNTAIN
209.4 0 0 0 0 0 0 0.00000
94 05BG006 WAIPAROUSCREEK NEARTHE MOUTH
103.1 0.07893 0.183 0.15097 0.146 0 0 0.13100
95 05BG010 GHOST RIVERABOVEWAIPAROUSCREEK
274.2 0.18618 0.262 0.42503 0.224 0.06993 0.118 0.20600 0.055517 0.178829 0.16383 0.026206 0.0443105
96 05BH013 JUMPINGPOUNDCREEK NEARCOX HILL
36.9 0 0 0 0 0 0 0.00000
97 05BJ009 LITTLE ELBOWRIVER ABOVENIHAHI CREEK
130.0 0.0004 0.015 0.00047 0.011 0 0 0.01100
98 05BL021 HIGHWOODRIVER BELOWPICKLEJARCREEK
132.2 0.02477 0.101 0.02942 0.063 0 0 0.06300

99 05BL022 CATARACTCREEK NEARFORESTRYROAD
165.2 0.02522 0.102 0.02995 0.066 0 0 0.06800
100 05CA004 RED DEER RIVERABOVE PANTHERRIVER
939.9 0 0 0 0 0 0 0.00000
101 05CA008 RED DEER RIVERAT FORESTRYROAD
713.1 0.00202 0.031 0.00387 0.02 0 0 0.02200
102 05DA001 WHITERABBITCREEK NEARWILSON'SRANCH
118.9 0 0 0 0 0 0 0.00000
103 05DA002 SIFFLEUR RIVERNEAR THEMOUTH
514.0 0 0 0 0 0 0 0.00000
104 05DA003 NORTHSASKATCHEWANRIVER ATWILSON'S
121.0 0 0 0 0 0 0 0.00000
105 05DA004 CLINE RIVERNEAR THEMOUTH
819.6 0 0 0 0 0 0 0.00000
106 05DA005 MISTAYA RIVERNEAR THEMOUTH
67.3 0 0 0 0 0 0 0.00000
107 05DA006 NORTHSASKATCHEWANRIVER ATSASKATCHE
1285.8 0 0 0 0 0 0 0.00000
108 05DA007 MISTAYA RIVERNEARSASKATCHEWANCROSS
204.0 0 0 0 0 0 0 0.00000
109 05DA008 PEYTO CREEKAT PEYTOGLACIER
22.7 0 0 0 0 0 0 0.00000
110 05DA009 NORTHSASKATCHEWANRIVER ATWHIRLPOOL
320.1 0 0 0 0 0 0 0.00000
111 05DA010 SILVERHORNCREEK NEARTHE MOUTH
21.0 0 0 0 0 0 0 0.00000
112 05DB003 CLEARWATERRIVER ABOVELIMESTONECREE
1340.7 0 0 0 0 0 0 0.00000
113 05DC005 BIGHORN RIVERNEAR THEMOUTH
334.9 0 0 0 0 0 0 0.00000
114 05DC007 NORTHSASKATCHEWANRIVER BELOWTERSHI
397.8 0 0 0 0 0 0 0.00000
115 05DC008 RAM RIVER ATRAM GLACIER
3.7 0 0 0 0 0 0 0.00000
116 05DD001 SOUTHESKRIVER NEARFORESTRY FORD
432.5 0 0 0 0 0 0 0.00000
117 05DD002 BLACKSTONERIVER NEARGRASSMOUNTAIN
779.4 0 0 0 0 0 0 0.00000
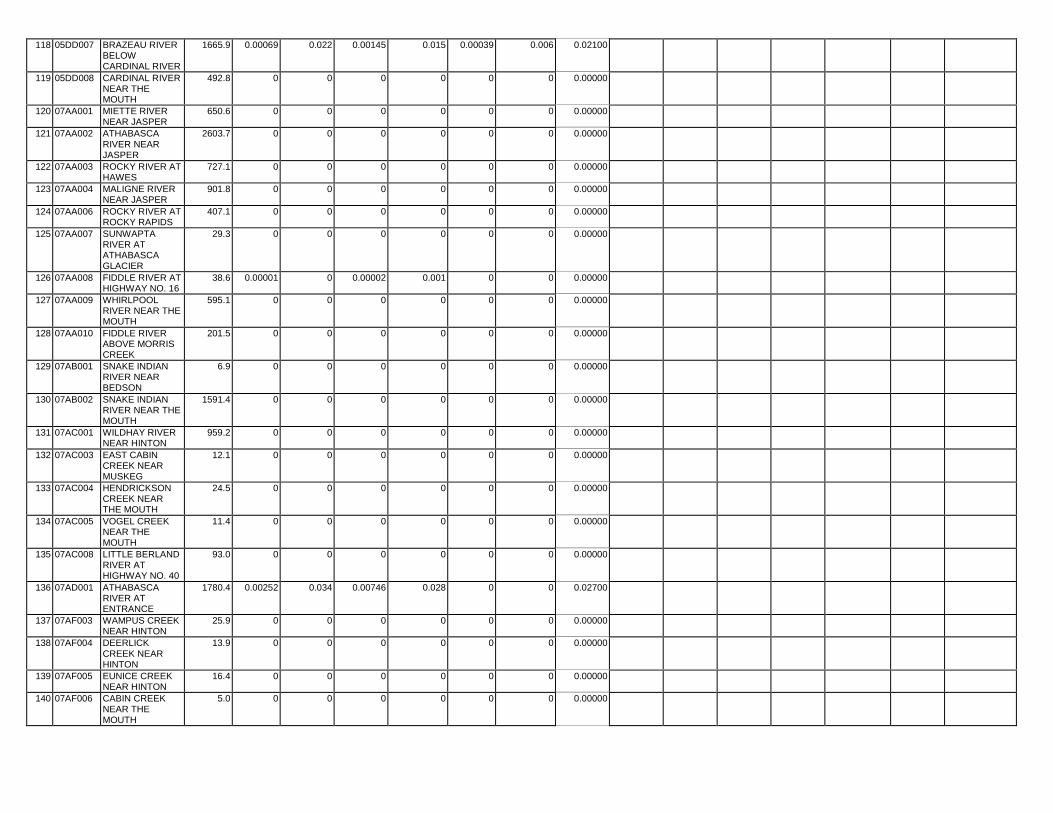
118 05DD007 BRAZEAU RIVERBELOWCARDINAL RIVER
1665.9 0.00069 0.022 0.00145 0.015 0.00039 0.006 0.02100
119 05DD008 CARDINAL RIVERNEAR THEMOUTH
492.8 0 0 0 0 0 0 0.00000
120 07AA001 MIETTE RIVERNEAR JASPER
650.6 0 0 0 0 0 0 0.00000
121 07AA002 ATHABASCARIVER NEARJASPER
2603.7 0 0 0 0 0 0 0.00000
122 07AA003 ROCKY RIVER ATHAWES
727.1 0 0 0 0 0 0 0.00000
123 07AA004 MALIGNE RIVERNEAR JASPER
901.8 0 0 0 0 0 0 0.00000
124 07AA006 ROCKY RIVER ATROCKY RAPIDS
407.1 0 0 0 0 0 0 0.00000
125 07AA007 SUNWAPTARIVER ATATHABASCAGLACIER
29.3 0 0 0 0 0 0 0.00000
126 07AA008 FIDDLE RIVER ATHIGHWAY NO. 16
38.6 0.00001 0 0.00002 0.001 0 0 0.00000
127 07AA009 WHIRLPOOLRIVER NEAR THEMOUTH
595.1 0 0 0 0 0 0 0.00000
128 07AA010 FIDDLE RIVERABOVE MORRISCREEK
201.5 0 0 0 0 0 0 0.00000
129 07AB001 SNAKE INDIANRIVER NEARBEDSON
6.9 0 0 0 0 0 0 0.00000
130 07AB002 SNAKE INDIANRIVER NEAR THEMOUTH
1591.4 0 0 0 0 0 0 0.00000
131 07AC001 WILDHAY RIVERNEAR HINTON
959.2 0 0 0 0 0 0 0.00000
132 07AC003 EAST CABINCREEK NEARMUSKEG
12.1 0 0 0 0 0 0 0.00000
133 07AC004 HENDRICKSONCREEK NEARTHE MOUTH
24.5 0 0 0 0 0 0 0.00000
134 07AC005 VOGEL CREEKNEAR THEMOUTH
11.4 0 0 0 0 0 0 0.00000
135 07AC008 LITTLE BERLANDRIVER ATHIGHWAY NO. 40
93.0 0 0 0 0 0 0 0.00000
136 07AD001 ATHABASCARIVER ATENTRANCE
1780.4 0.00252 0.034 0.00746 0.028 0 0 0.02700
137 07AF003 WAMPUS CREEKNEAR HINTON
25.9 0 0 0 0 0 0 0.00000
138 07AF004 DEERLICKCREEK NEARHINTON
13.9 0 0 0 0 0 0 0.00000
139 07AF005 EUNICE CREEKNEAR HINTON
16.4 0 0 0 0 0 0 0.00000
140 07AF006 CABIN CREEKNEAR THEMOUTH
5.0 0 0 0 0 0 0 0.00000
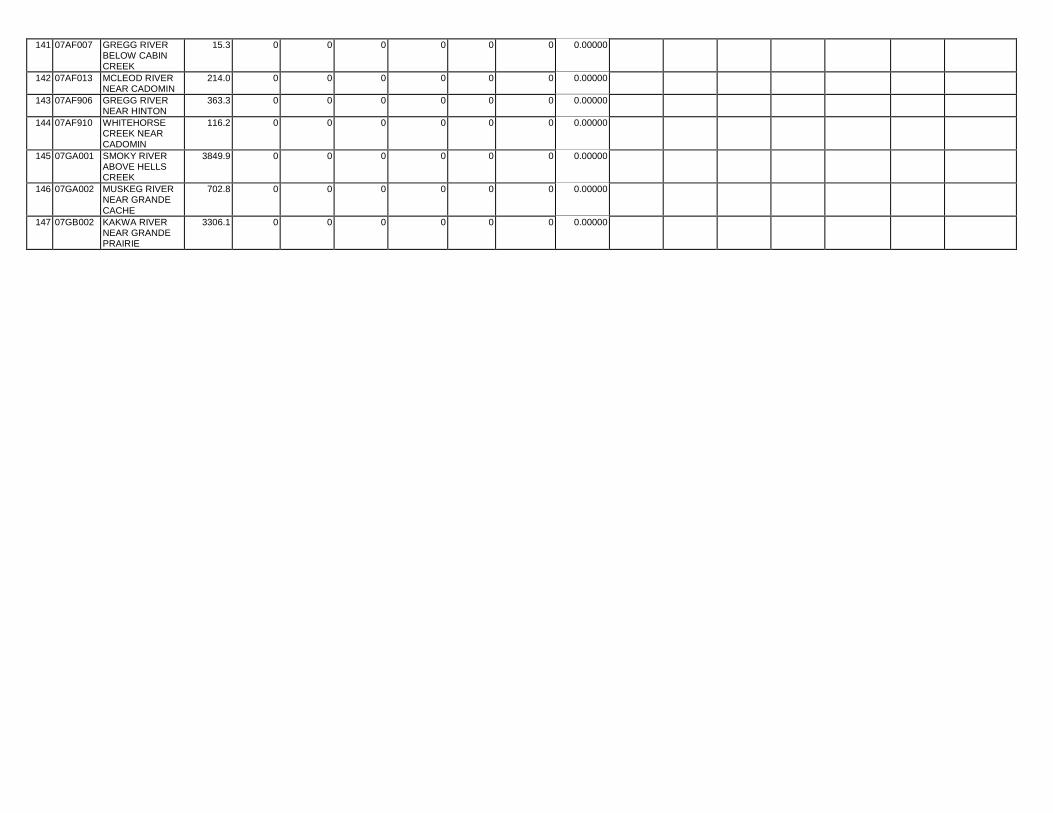
141 07AF007 GREGG RIVERBELOW CABINCREEK
15.3 0 0 0 0 0 0 0.00000
142 07AF013 MCLEOD RIVERNEAR CADOMIN
214.0 0 0 0 0 0 0 0.00000
143 07AF906 GREGG RIVERNEAR HINTON
363.3 0 0 0 0 0 0 0.00000
144 07AF910 WHITEHORSECREEK NEARCADOMIN
116.2 0 0 0 0 0 0 0.00000
145 07GA001 SMOKY RIVERABOVE HELLSCREEK
3849.9 0 0 0 0 0 0 0.00000
146 07GA002 MUSKEG RIVERNEAR GRANDECACHE
702.8 0 0 0 0 0 0 0.00000
147 07GB002 KAKWA RIVERNEAR GRANDEPRAIRIE
3306.1 0 0 0 0 0 0 0.00000

Ecoregion: Boreal Transition,Peace Lowland
Runoff PotentialAgricultural Indicators Agriculture
IntensityLandform Characteristics Soil Characteristics
WatershedCode
Watershed Name Area (km²) ManureProduction(tonne per
acre)
ManureProduction(Percentile)
FertilizerExpenses
(dollars peracre)
FertilizerExpenses
(Percentile)
ChemicalExpenses(dollar per
acre)
ChemicalExpenses
(percentile)
OverallPercentile
Type I Type II Type III High (%) Moderate (%) Low (%) Unknown (%)
1 05EC002 311.9 0.79063 0.646 8.67789 0.738 3.62581 0.697 0.70100 0.834893 0.000172 0.161645 0.452051 0.20541518 0.01248 0.326764555
2 05EC003 REDWATERRIVER NEARREDWATER
1020.7 0.83761 0.665 9.40167 0.755 4.17903 0.742 0.74600 0.621194 0.109861 0.177132 0.396117 0.14807931 0.121605 0.328009299
3 05EC004 NAMEPI CREEKNEAR THEMOUTH
715.9 0.76743 0.627 9.6771 0.763 4.53189 0.772 0.74500 0.847121 0.013987 0.133835 0.747639 0.0034795 0.009928 0.230617899
4 05EC006 WHITE EARTHCREEK NEARSMOKY LAKE
1009.6 0.27376 0.328 2.31595 0.465 1.00875 0.463 0.40400 0.326755 0.454479 0.157664 0.420883 0.2282976 0.079598 0.266170322
5 05ED001 STONY CREEKNEAR SADDLELAKE
539.6 0.7466 0.611 3.13867 0.519 1.49917 0.536 0.54700 0.500382 0.372582 0.097716 0.385096 0.46058478 0.017664 0.129257312
6 05ED002 ATIMOSWECREEK NEARELK POINT
361.8 0.92276 0.693 7.31351 0.704 2.51468 0.632 0.67200 0.54544 0.210978 0.158897 0.577084 0.22206222 0.102495 0.094067914
7 05ED003 MOOSEHILLSCREEK NEARELK POINT
37.0 0.34845 0.379 2.02234 0.444 0.35534 0.295 0.36500 0.190167 0.709839 0.095351 0.639439 0.06238326 0.07642 0.217114955
8 05EF003 NORTHSASKATCHEWAN RIVER AT LEAPARK
8588.4 0.73059 0.592 8.40622 0.728 4.24352 0.754 0.69300 0.395247 0.380336 0.114158 0.300807 0.3709245 0.197964 0.12339393
9 06AA001 BEAVER RIVERNEARGOODRIDGE
1870.3 0.59894 0.532 2.40823 0.476 0.77065 0.408 0.46800 0.472745 0.157408 0.257341 0.696153 0.04727343 0.053038 0.151429644
10 06AA002 AMISK RIVERAT HIGHWAYNO. 36
2494.9 0.26628 0.322 0.65124 0.285 0.23386 0.235 0.26700 0.23946 0.491472 0.187102 0.676018 0.05223077 0.029186 0.238717919
11 06AA901 COLUMBINECREEK NEARGLENDON
241.1 1.54772 0.881 12.41088 0.866 3.75223 0.709 0.84500 0.318521 0.012264 0.643365 0.578314 0.27395104 0.02914 0.1126711
12 06AC006 MOOSELAKERIVER NEARFRANCHERE
1017.7 0.71539 0.584 4.25228 0.588 1.48933 0.53 0.55800 0.446704 0.204968 0.217635 0.731968 0.06536247 0.060142 0.113206611
13 06AC009 MANATOKANCREEK NEARIRON RIVER
441.7 0.23723 0.292 0.62226 0.272 0.2532 0.254 0.25800 0.43415 0.143125 0.123971 0.459619 0.07328454 0.062143 0.154643357
14 06AD006 BEAVER RIVERAT COLD LAKERESERVE
1664.8 0.57349 0.518 2.17519 0.459 0.93446 0.454 0.47000 0.498661 0.176397 0.280813 0.683553 0.06459221 0.091522 0.169678832
15 06AD013 REITA CREEKNEAR OUTLETOF ANGLINGLAKE
161.9 0.22582 0.285 0.48438 0.236 0.3007 0.274 0.25300 0.306834 0.447598 0.177011 0.859538 0.04558221 0.012264 0.077544806
16 07BC006 DAPP CREEKAT HIGHWAYNO. 44
562.9 0.64036 0.549 5.69249 0.652 2.37397 0.625 0.60300 0.41218 0.094292 0.473557 0.469872 0.08209094 0.009889 0.430766075
17 07BE004 STONY CREEKNEARTAWATINAW
128.1 0.50544 0.475 3.8027 0.556 1.61496 0.553 0.51500 0.599828 0.094765 0.302338 0.582044 0.02606392 0.03497 0.34611447
18 07CA*** 712.3 0.63037 0.543 4.54295 0.607 1.84886 0.575 0.56300 0.698567 0.102021 0.138329 0.504066 0.07055061 0.131353 0.279859445

19 07CA001 FLAT CREEKNEARDONATVILLE
11.3 0.47092 0.454 9.87344 0.77 4.15551 0.739 0.64700 0.581374 0.414943 0.500144 0.023092 0.47308078
20 07CA003 FLAT CREEKNEAR BOYLE
183.4 0.5093 0.478 1.55436 0.405 0.40833 0.327 0.39000 0.445132 0.291076 0.260463 0.577603 0.01740514 0.015467 0.380035052
21 07CA005 PINE CREEKNEARGRASSLAND
312.6 0.56919 0.515 6.16241 0.671 2.30815 0.622 0.59500 0.575383 0.00289 0.386038 0.544606 0.00501222 0.007406 0.439597347
22 07CA007 LA BICHE RIVERNEARPLAMONDON
465.1 0.06565 0.175 0.3325 0.194 0.13107 0.167 0.18600 0.130555 0.349614 0.120091 0.035085 0.320129281
23 07CA008 BABETTECREEK NEARCOLINTON
219.1 0.44841 0.442 2.33473 0.467 0.77647 0.411 0.43400 0.250989 0.71768 0.327266 0.665347095
24 07CA009 OWL RIVERNEAR THEMOUTH
281.4 0.03543 0.135 0.04822 0.094 0.0346 0.08 0.12300 0.080623 0.048206 0.038195 0.116905 0.005623 0.077725705
25 07CA011 LA BICHE RIVERAT HIGHWAYNO. 63
68.2 0.30825 0.353 2.07043 0.451 0.7599 0.404 0.38400 0.472289 0.421409 0.518934 0.477494985
26 07CA901 PINE CREEKNEARCOLINTON
251.1 0.5273 0.488 3.90038 0.567 1.38865 0.516 0.50900 0.466285 0.202485 0.324047 0.615782 0.01333252 0.020915 0.343674364
27 FLATLAK FLAT LAKENEAR STOCKS
471.8 0.45872 0.445 3.33045 0.531 1.10365 0.471 0.47500 0.452665 0.192742 0.264708 0.619717 0.00140017 0.002715 0.367201409
28 LACLABI LAC LA BICHEAT LAC LABICHE
961.2 0.27982 0.334 1.28414 0.377 0.46394 0.359 0.35400 0.379739 0.162965 0.082203 0.736401 0.014538 0.143288538
29 MOORELA MOORE LAKENEAR COLDLAKE
42.0 0.10503 0.208 0.16762 0.151 0.12298 0.162 0.17800 0.189245 0.398629 0.159598 0.759282 0.01165747 0.001861 0.222303792
30 MURIELL MURIEL LAKEATGURNEYVILLE
453.3 0.26174 0.315 1.05659 0.355 0.37985 0.317 0.32400 0.272755 0.450567 0.072505 0.848784 0.011699 0.030777 0.103937229
31 SMOKYLK SMOKY LAKENEARWARSPITE
231.1 0.74588 0.609 13.17647 0.881 6.11348 0.846 0.82000 0.684127 0.117784 0.104353 0.245504 0.59958474 4.62E-05 0.151521218
32 05CB003 RED DEERRIVER ATGARRINGTONBRIDGE
244.6 0.85294 0.671 2.64021 0.496 0.6725 0.389 0.51200 0.452539 0.292807 0.139405 0.508786 0.13216944 0.070232 0.249031843
33 05CB004 RAVEN RIVERNEAR RAVEN
643.4 1.36541 0.838 3.51333 0.542 0.87586 0.434 0.60200 0.332691 0.21369 0.113343 0.335322 0.10323974 0.027492 0.243618474
34 05CB006 GLENIFFERRESERVOIRNEAR DICKSON
429.1 1.7224 0.919 6.35237 0.677 1.63177 0.556 0.74000 0.466263 0.231147 0.135788 0.497731 0.20646029 0.053508 0.217016306
35 05CC001 BLINDMANRIVER NEARBLACKFALDS
899.7 2.13464 0.963 12.23656 0.858 4.12895 0.735 0.89800 0.670897 0.268572 0.054491 0.317273 0.41830928 0.167656 0.092330443
36 05CC004 SYLVAN CREEKNEAR SYLVANLAKE
152.7 1.19715 0.802 7.8861 0.719 3.07761 0.662 0.75100 0.635228 0.058794 0.311165 0.64844217 0.029117 0.008823273
37 05CC007 MEDICINERIVER NEARECKVILLE
1856.3 1.44474 0.859 4.35373 0.598 1.1447 0.479 0.63800 0.444638 0.24557 0.167055 0.417897 0.18671131 0.035029 0.242682806
38 05CC008 BLINDMANRIVER NEARBLUFFTON
351.4 1.68224 0.901 3.65679 0.54 0.89732 0.435 0.62200 0.423222 0.44031 0.131576 0.374492 0.34385818 0.015017 0.254667878
39 05CC009 LLOYD CREEKNEARBLUFFTON
238.0 1.9662 0.955 4.57469 0.612 1.12476 0.474 0.68200 0.458372 0.399512 0.074813 0.474923 0.25606795 0.035278 0.231030298
40 05CC010 BLOCK CREEKNEAR LEEDALE
56.7 1.04355 0.734 1.72981 0.424 0.42893 0.342 0.49300 0.185052 0.718079 0.094419 0.534221 0.32668264 0.135324588

41 05DB001 CLEARWATERRIVER NEARROCKYMOUNTAIN
130.4 1.91383 0.951 4.25106 0.586 0.64842 0.384 0.63500 0.617635 0.052709 0.306087 0.554323 0.00256251 0.080896 0.35979896
42 05DE001 NORTHSASKATCHEWAN RIVER ATROCKY RAP
99.6 0.7404 0.601 1.51512 0.398 0.37198 0.312 0.43500 0.653327 0.264541 0.618361 0.0960346 0.175923 0.107027263
43 05DE002 WABAMUNLAKE ATWABAMUN
355.0 0.95059 0.703 1.75486 0.427 0.4538 0.354 0.48900 0.148675 0.3971 0.041346 0.687084 0.03592666 0.214268 0.060064563
44 05DE003 WABAMUNCREEK NEARDUFFIELD
156.0 1.05612 0.742 3.33717 0.532 1.15993 0.489 0.58900 0.114901 0.723188 0.069797 0.38635 0.34311671 0.014583 0.253292342
45 05DE009 TOMAHAWKCREEK NEARTOMAHAWK
105.3 1.2176 0.806 3.02125 0.507 0.74764 0.398 0.57000 0.171275 0.465757 0.310287 0.587474 0.00026258 0.018523 0.391072772
46 05DF002 CONJURINGCREEK NEARWIZARD LAKE
32.2 1.57627 0.886 5.64656 0.649 1.82159 0.573 0.71600 0.582926 0.134023 0.178768 0.48377 0.43523156 0.004392 0.058793846
47 05DF004 STRAWBERRYCREEK NEARTHE MOUTH
581.9 1.23475 0.816 7.87255 0.711 3.06112 0.652 0.76000 0.820314 0.107495 0.068169 0.669793 0.13251946 0.054719 0.140341054
48 05DF005 NORTHSASKATCHEWAN RIVER ATEDMONTON
3588.5 1.08504 0.753 6.50014 0.684 2.8297 0.645 0.70200 0.505039 0.253215 0.144198 0.529869 0.18674288 0.152688 0.123608065
49 05EA003 STURGEONRIVER NEARDARWELL
44.5 0.90429 0.688 1.60329 0.408 0.39892 0.319 0.47300 0.002175 0.867792 0.127044 0.658946 0.02865664 0.082536 0.22713584
50 05EA004 STURGEONRIVER NEARONOWAY
35.8 1.05302 0.74 3.79934 0.555 0.91617 0.446 0.57800 0.069115 0.887908 0.366939 0.19759757 0.079362 0.353064343
51 05EA005 STURGEONRIVER NEARVILLENEUVE
1168.6 1.19035 0.799 9.44139 0.757 3.49812 0.69 0.77600 0.436044 0.364679 0.14 0.604477 0.20694323 0.039179 0.144034216
52 05EA009 ATIM CREEKNEAR SPRUCEGROVE
291.5 1.09351 0.758 11.96343 0.851 6.45341 0.866 0.85300 0.244006 0.627251 0.096649 0.518831 0.28240071 0.078537 0.098523811
53 05EA010 STURGEONRIVER NEARMAGNOLIABRIDGE
121.1 1.06325 0.747 1.53384 0.403 0.44879 0.346 0.49500 0.092694 0.790062 0.078721 0.765027 0.03611138 0.028355 0.167818037
54 05FA002 PIGEON LAKECREEK NEARWESTEROSE
283.0 0.74457 0.606 1.37342 0.382 0.31523 0.279 0.41700 0.437893 0.211436 0.005053 0.628491 0.31962599 0.009353 0.039897606
55 05FA019 PIGEON LAKECREEK NEARUSONA
93.9 1.70177 0.913 4.23658 0.583 1.34503 0.51 0.66500 0.825804 0.116081 0.055466 0.079984 0.78032808 0.063469 0.063264006
56 05FA912 MUSKEGCREEK NEARWESTEROSE
97.6 1.01741 0.721 1.66077 0.419 0.40646 0.324 0.47900 0.265691 0.67009 0.061665 0.456629 0.45262331 0.009809 0.076850715
57 07BB001 LOBSTICKRIVER NEARENTWISTLE
77.4 0.87832 0.679 2.85576 0.505 0.8073 0.416 0.53300 0.2648 0.058116 0.645112 0.584816 0.06999868 0.079239 0.263275936
58 07BB003 LOBSTICKRIVER NEARSTYAL
362.5 0.48636 0.47 0.8873 0.328 0.15842 0.187 0.32700 0.358032 0.076695 0.549288 0.543241 0.04900548 0.02333 0.381739979
59 07BB004 PADDLE RIVERNEARROCHFORTBRIDGE
362.5 1.04068 0.731 3.74903 0.553 1.1478 0.481 0.58900 0.700941 0.187627 0.101454 0.733163 0.0821782 0.034817 0.146234013
60 07BB006 PADDLE RIVERAT BARRHEAD
606.9 1.73127 0.922 6.00406 0.668 2.21392 0.603 0.75900 0.483575 0.354995 0.104236 0.597755 0.15625247 0.008088 0.234645033

61 07BB009 CONNORCREEK NEARSANGUDO
99.4 1.1009 0.759 4.09351 0.577 1.28169 0.505 0.60800 0.177109 0.820097 0.84334 0.00878007 0.140898549
62 07BB010 CONNORCREEK NEARROCHFORTBRIDGE
65.0 1.04256 0.733 3.8508 0.562 1.20569 0.493 0.59400 0.374714 0.568895 0.053676 0.730477 0.06982495 0.187092944
63 07BB012 PADDLE RIVERNEARSANGUDO
215.4 1.47656 0.87 5.64376 0.645 1.76539 0.568 0.70100 0.331155 0.63044 0.031465 0.840938 0.01104715 0.053536 0.223654098
64 07BB013 PADDLE RIVERAT HIGHWAYNO. 764
288.9 1.46741 0.867 4.6613 0.615 1.4935 0.531 0.66600 0.068969 0.718604 0.038716 0.623992 0.04052601 0.016222 0.315398829
65 07BB014 COYOTECREEK NEARCHERHILL
57.8 1.21998 0.808 3.38123 0.537 0.85668 0.429 0.59200 0.653372 0.288605 0.055138 0.589305 0.28634231 0.020204 0.101264472
66 07BB903 ROMEO CREEKABOVE ROMEOLAKE
113.6 0.66862 0.557 1.9914 0.443 0.62533 0.381 0.45700 0.039995 0.942637 0.889452 0.107766244
67 07BB908 07BB908 1.1 1.51388 0.878 8.5955 0.736 3.44765 0.685 0.80300 0.893948 0.09932759168 07BC001 PEMBINA RIVER
NEAR DAPP2350.1 1.3842 0.843 8.41896 0.73 3.3785 0.68 0.77900 0.404217 0.299144 0.215028 0.55908 0.22396971 0.044032 0.164201944
69 ISLELAK ISLE LAKE ATEUREKA BEACH
154.0 0.76397 0.617 1.18408 0.366 0.30506 0.275 0.41500 0.084072 0.625453 0.130225 0.746263 0.03504575 0.077405 0.138599786
70 LACLANO LAC LA NONNEAT LAC LANONNE
259.6 1.12396 0.775 1.49355 0.393 0.47822 0.362 0.50600 0.436042 0.402342 0.051732 0.820926 0.07136783 0.005239 0.095213472
71 NAKAMUN NAKAMUN 53.8 1.28108 0.823 5.31763 0.636 2.01217 0.586 0.67900 0.634107 0.284418 0.710553 0.2095933 0.000647 0.07570794972 STEANNE LAC STE. ANNE
AT ALBERTABEACH
383.5 1.00194 0.717 2.84364 0.503 0.7065 0.396 0.54100 0.137667 0.551018 0.112588 0.514984 0.18781243 0.06108 0.233428689
73 THUNDER THUNDER 35.8 1.60309 0.892 4.4568 0.604 1.42294 0.518 0.66800 0.744246 0.04486276 0.19587635774 07BC002 PEMBINA RIVER
AT JARVIE585.0 0.92881 0.695 11.72777 0.845 4.9685 0.799 0.82200 0.194694 0.090981 0.610069 0.478412 0.11062247 0.005763 0.350018095
75 07BC003 WABASHCREEK NEARWESTLOCK
321.8 1.67714 0.903 10.33487 0.781 4.75393 0.784 0.85100 0.681207 0.051992 0.249694 0.414148 0.48606953 0.01421 0.069031325
76 07BC004 SHOAL CREEKNEAR LINARIA
231.0 1.75931 0.933 20.3795 0.982 8.35169 0.951 0.98500 0.444179 0.547019 0.428564 0.32791662 0.240642286
77 07BC007 WABASHCREEK NEARPIBROCH
18.2 1.70331 0.912 15.05831 0.914 7.75537 0.931 0.96400 0.015495 0.981402 0.865605 0.12165929 0.009632606
78 SHOALLA SHOAL LAKE 210.7 1.64271 0.898 12.6023 0.869 4.62277 0.777 0.89200 0.671293 0.074169 0.211141 0.437492 0.23776069 0.32192379579 WABASH WABASH
CREEK (AESA)340.0 0.89800 0.78100 0.78500 0.85700
80 07FD003 PEACE RIVERAT DUNVEGANBRIDGE
6374.5 0.23387 0.289 5.65256 0.65 2.64219 0.64 0.51100 0.370506 0.045411 0.303079 0.583111 0.00152216 0.111891 0.026538519
81 07FD008 HINES CREEKNEAR FAIRVIEW
878.5 0.23428 0.29 6.69828 0.688 3.25327 0.673 0.54200 0.402493 0.141513 0.29903 0.696317 0.00909527 0.035839 0.135007498
82 07FD009 CLEAR RIVERNEAR BEARCANYON
2124.1 0.09885 0.203 1.92647 0.44 0.72293 0.397 0.34100 0.128038 0.005525 0.185486 0.269618 0.025284 0.024610229
83 07FD013 EUREKA RIVERNEARWORSLEY
755.0 0.26619 0.32 4.74174 0.617 1.95271 0.578 0.49000 0.442318 0.005764 0.277141 0.690235 0.016751 0.018237496
84 07FD014 WAINSCOTTCOULEE NEARBROWNVALE
149.4 0.46793 0.45 12.04996 0.853 6.51698 0.874 0.74900 0.200093 0.791038 0.914836 0.00665838 0.012291 0.060749199
85 07FD913 YOUNGDRAINAGEPROJECT NEARSPIRIT RIVER
31.7 0.13278 0.232 20.45656 0.984 15.5582 0.996 0.76500 0.512284 0.041117 0.441882 0.967639 0.027643594

86 07FD921 VIXEN CREEKNEAR BELLOY
126.2 0.22149 0.281 10.42748 0.786 6.24763 0.851 0.62400 0.505606 0.168469 0.321796 0.949487 0.02743387 0.01895073
87 07GD001 BEAVERLODGERIVER NEARBEAVERLODGE
944.4 0.38185 0.402 7.05588 0.7 3.06935 0.66 0.58300 0.550175 0.021833 0.16798 0.655525 0.00171902 0.01715 0.101290635
88 07GD003 REDWILLOWRIVER NEARBEAVERLODGE
359.5 0.43734 0.436 8.27849 0.727 3.71695 0.707 0.61400 0.655082 0.002531 0.155467 0.712871 0.043625 0.082214159
89 07GE005 BEAR RIVERNEAR GRANDEPRAIRIE
176.6 0.51319 0.48 16.48097 0.95 7.58454 0.931 0.82900 0.596733 0.07315 0.284051 0.912172 0.083303529
90 07GE006 COLQUHOUNCREEK NEARGRANDEPRAIRIE
131.5 0.52785 0.489 10.81343 0.802 4.72838 0.782 0.69000 0.782217 0.078844 0.123646 0.925425 0.01207961 0.057671598
91 07GE007 BEAR RIVERNEARVALHALLACENTRE
183.0 0.24767 0.304 7.63521 0.714 3.1839 0.668 0.55000 0.678301 0.028147 0.051268 0.698359 0.05935688
92 07GJ001 SMOKY RIVERAT WATINO
4684.3 0.28581 0.339 6.41633 0.681 3.45314 0.687 0.55500 0.457502 0.090315 0.16627 0.58979 0.01590057 0.073959 0.046070463
93 07GJ005 LALBY CREEKNEARGIROUXVILLE
159.5 0.05856 0.162 16.19197 0.945 8.49865 0.959 0.68500 0.536023 0.430811 0.896069 0.100281039
94 07HA001 PEACE RIVERAT PEACERIVER
5429.5 0.24033 0.298 11.15287 0.814 6.37926 0.864 0.64900 0.496118 0.091867 0.352767 0.759717 0.00497519 0.136094 0.06506266
95 07HA002 HEART RIVERAT PEACERIVER
288.5 0.08956 0.197 10.19628 0.778 5.23099 0.807 0.58900 0.412336 0.58399 0.796399 0.156879 0.043046807
96 07HA004 WHITEMUDRIVER ATHIGHWAY NO.35
2.3 0.31757 0.36 3.9926 0.569 1.67325 0.561 0.47900 0.511033 0.621884 0.374915204
97 07HC002 BUCHANANCREEK NEARMANNING
232.0 0.06346 0.172 4.22696 0.582 1.97517 0.583 0.43200 0.348321 0.381714 0.597926 0.074459 0.057649167
98 07HD001 PEACE RIVERNEARCARCAJOU
14564.8 0.04655 0.151 1.87852 0.437 0.90296 0.444 0.33600 0.145462 0.006731 0.170059 0.254523 0.0009445 0.04019 0.04143933
99 BEARLAK BEAR LAKENEARCLAIRMONT
890.5 0.33893 0.369 9.81541 0.768 4.43296 0.767 0.62100 0.572615 0.086662 0.103881 0.774845 0.00613017 0.066104561
100 KLESKUN KLESKUNDRAIN
32.3 0.68426 0.568 12.97403 0.871 6.47626 0.862 0.80400
101 07BF003 IROQUOISCREEK NEARAGGIE
243.8 0.29676 0.349 2.15299 0.457 1.003 0.461 0.41300 0.489509 0.023787 0.483378 0.943548 0.053125686
102 07BF004 SOUTH HEARTRIVER NEARHIGH PRAIRIE
471.4 0.24352 0.301 4.01964 0.572 2.29504 0.617 0.47600 0.357603 0.091352 0.374989 0.602564 0.000733 0.357942787
103 07BF005 WINAGAMILAKE SPILLWAYTO HEARTRIVER
1.4 0.07951 0.184 0.99443 0.349 0.8928 0.439 0.31400 0.205225 0.788498 0.898525 0.09519878
104 07BF006 WINAGAMILAKE ATPROVINCIALPARK
265.6 0.08266 0.191 1.70446 0.422 1.22262 0.496 0.35800 0.145223 0.069883 0.183327 0.485955 0.086768957
105 07BF007 BRIDGE CREEKNEAR ENILDA
5.2 1.32056 0.83 14.39876 0.901 6.6908 0.882 0.91700 0.935397 0.062253477
106 07BH001 ARCADIACREEK NEARARCADIA
177.9 0.11004 0.219 0.60803 0.269 0.26223 0.259 0.23800 0.07661 0.028814 0.1151 0.127032 0.093492847

107 07BK001 LESSER SLAVERIVER ATSLAVE LAKE
4503.1 0.1056 0.211 0.83164 0.318 0.45298 0.351 0.28600 0.080995 0.019364 0.20134 0.248634 0.001911 0.071200971
108 07GH002 LITTLE SMOKYRIVER NEARGUY
513.0 0.19644 0.27 9.1616 0.751 4.95584 0.795 0.59700 0.462402 0.121822 0.405654 0.847645 0.101316 0.047606436
109 07GH004 PEAVINECREEK NEARFALHER
537.5 0.11415 0.222 12.40885 0.864 6.86308 0.901 0.65400 0.255366 0.027945 0.498877 0.80383 0.002857 0.054875642
110 07HA003 HEART RIVERNEAR NAMPA
1949.4 0.04605 0.15 3.02188 0.511 1.56844 0.543 0.37600 0.160436 0.027634 0.195673 0.321803 0.004504 0.05743569
111 07HA902 KRAWCHUKDRAINAGENEARMCLENNAN
13.0 0.06048 0.165 10.53609 0.791 5.2873 0.809 0.58000 0.712 0.284511 0.7184 0.278111055
112 07HB002 ELDER CREEKAT HIGHWAYNO. 686
64.0 0.01096 0.072 0.17199 0.156 0.16581 0.197 0.14800 0.07023 0.047214648
113 07HF001 PEACE RIVERAT FORTVERMILION
9671.4 0.0149 0.082 0.48188 0.234 0.30985 0.277 0.19700 0.066062 0.024458 0.084634 0.148047 0.00155403 0.013064 0.031687903
114 07JD004 TEEPEE CREEKNEAR LACRETE
134.8 0.05891 0.164 2.40081 0.475 1.49747 0.535 0.37100 0.041256 0.769027 0.668432 0.021941 0.122174775
115 07JF002 BOYER RIVERNEAR FORTVERMILION
6553.8 0.02225 0.096 0.60662 0.267 0.32043 0.28 0.21400 0.025313 0.004485 0.310308 0.291506 0.00182301 0.008105 0.047530908
116 07JF004 BOYER RIVERNEAR PADDLEPRAIRIE
93.7 0 0 0 0 0 0 0.00000 0.245655 0.750084 0.871131 0.049883 0.074725846
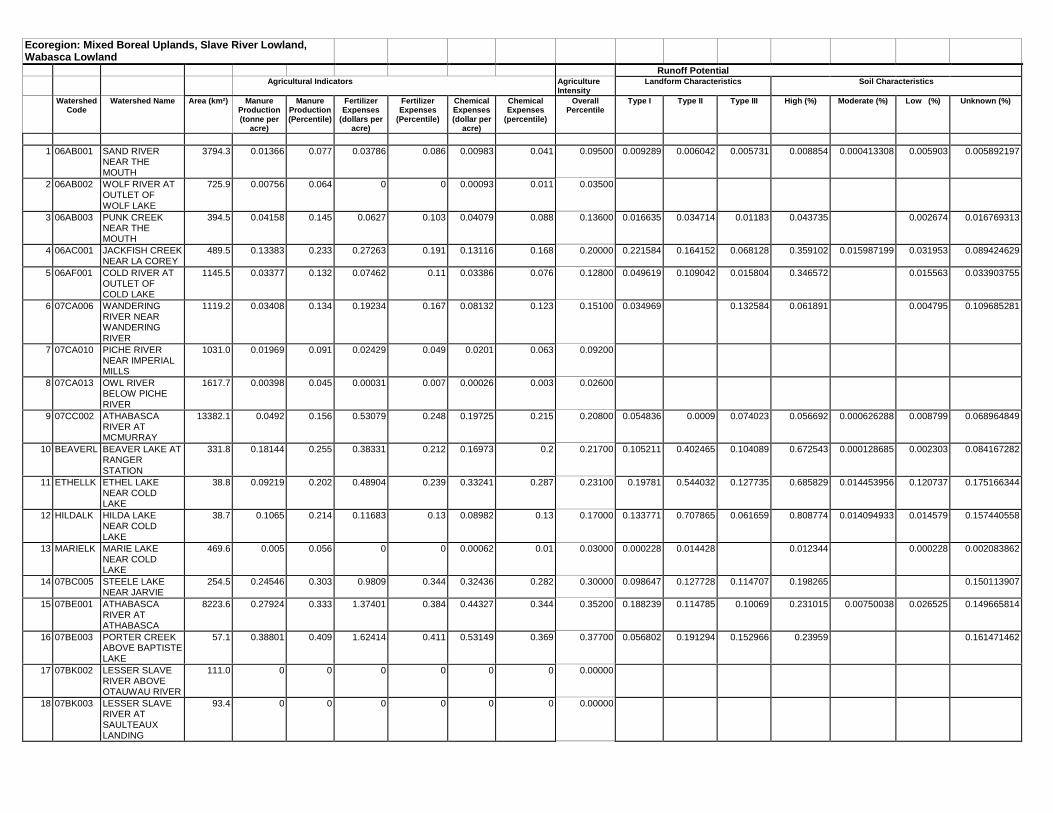
Ecoregion: Mixed Boreal Uplands, Slave River Lowland,Wabasca Lowland
Runoff PotentialAgricultural Indicators Agriculture
IntensityLandform Characteristics Soil Characteristics
WatershedCode
Watershed Name Area (km²) ManureProduction(tonne per
acre)
ManureProduction(Percentile)
FertilizerExpenses
(dollars peracre)
FertilizerExpenses
(Percentile)
ChemicalExpenses(dollar per
acre)
ChemicalExpenses
(percentile)
OverallPercentile
Type I Type II Type III High (%) Moderate (%) Low (%) Unknown (%)
1 06AB001 SAND RIVERNEAR THEMOUTH
3794.3 0.01366 0.077 0.03786 0.086 0.00983 0.041 0.09500 0.009289 0.006042 0.005731 0.008854 0.000413308 0.005903 0.005892197
2 06AB002 WOLF RIVER ATOUTLET OFWOLF LAKE
725.9 0.00756 0.064 0 0 0.00093 0.011 0.03500
3 06AB003 PUNK CREEKNEAR THEMOUTH
394.5 0.04158 0.145 0.0627 0.103 0.04079 0.088 0.13600 0.016635 0.034714 0.01183 0.043735 0.002674 0.016769313
4 06AC001 JACKFISH CREEKNEAR LA COREY
489.5 0.13383 0.233 0.27263 0.191 0.13116 0.168 0.20000 0.221584 0.164152 0.068128 0.359102 0.015987199 0.031953 0.089424629
5 06AF001 COLD RIVER ATOUTLET OFCOLD LAKE
1145.5 0.03377 0.132 0.07462 0.11 0.03386 0.076 0.12800 0.049619 0.109042 0.015804 0.346572 0.015563 0.033903755
6 07CA006 WANDERINGRIVER NEARWANDERINGRIVER
1119.2 0.03408 0.134 0.19234 0.167 0.08132 0.123 0.15100 0.034969 0.132584 0.061891 0.004795 0.109685281
7 07CA010 PICHE RIVERNEAR IMPERIALMILLS
1031.0 0.01969 0.091 0.02429 0.049 0.0201 0.063 0.09200
8 07CA013 OWL RIVERBELOW PICHERIVER
1617.7 0.00398 0.045 0.00031 0.007 0.00026 0.003 0.02600
9 07CC002 ATHABASCARIVER ATMCMURRAY
13382.1 0.0492 0.156 0.53079 0.248 0.19725 0.215 0.20800 0.054836 0.0009 0.074023 0.056692 0.000626288 0.008799 0.068964849
10 BEAVERL BEAVER LAKE ATRANGERSTATION
331.8 0.18144 0.255 0.38331 0.212 0.16973 0.2 0.21700 0.105211 0.402465 0.104089 0.672543 0.000128685 0.002303 0.084167282
11 ETHELLK ETHEL LAKENEAR COLDLAKE
38.8 0.09219 0.202 0.48904 0.239 0.33241 0.287 0.23100 0.19781 0.544032 0.127735 0.685829 0.014453956 0.120737 0.175166344
12 HILDALK HILDA LAKENEAR COLDLAKE
38.7 0.1065 0.214 0.11683 0.13 0.08982 0.13 0.17000 0.133771 0.707865 0.061659 0.808774 0.014094933 0.014579 0.157440558
13 MARIELK MARIE LAKENEAR COLDLAKE
469.6 0.005 0.056 0 0 0.00062 0.01 0.03000 0.000228 0.014428 0.012344 0.000228 0.002083862
14 07BC005 STEELE LAKENEAR JARVIE
254.5 0.24546 0.303 0.9809 0.344 0.32436 0.282 0.30000 0.098647 0.127728 0.114707 0.198265 0.150113907
15 07BE001 ATHABASCARIVER ATATHABASCA
8223.6 0.27924 0.333 1.37401 0.384 0.44327 0.344 0.35200 0.188239 0.114785 0.10069 0.231015 0.00750038 0.026525 0.149665814
16 07BE003 PORTER CREEKABOVE BAPTISTELAKE
57.1 0.38801 0.409 1.62414 0.411 0.53149 0.369 0.37700 0.056802 0.191294 0.152966 0.23959 0.161471462
17 07BK002 LESSER SLAVERIVER ABOVEOTAUWAU RIVER
111.0 0 0 0 0 0 0 0.00000
18 07BK003 LESSER SLAVERIVER ATSAULTEAUXLANDING
93.4 0 0 0 0 0 0 0.00000

19 07BK006 LESSER SLAVERIVER ATHIGHWAY NO. 2A
588.3 0.00063 0.018 0.00421 0.022 0.00119 0.015 0.02400 0.012872 0.001059 0.010224 0.020166 0.003989536
20 07BK007 DRIFTWOODRIVER NEAR THEMOUTH
855.0 0 0 0 0 0 0 0.00000
21 BAPTIST BAPTISTE LAKENEARATHABASCA
248.5 0.25445 0.308 0.60863 0.271 0.23216 0.234 0.25600 0.115116 0.339059 0.036134 0.432266 0.002628809 0.098082521
22 CALLING CALLING LAKEAT RANGERSTATION
1223.6 0.00073 0.023 0.01033 0.038 0.00415 0.025 0.04000
23 FAWCETT
FAWCETT LAKENEAR SMITH
1242.2 0 0 0 0 0 0 0.00000 0.001527 0.001539414
24 07BF008 SOUTH HEARTRESERVOIRNEARMCLENNAN
2070.1 0.04383 0.146 0.36816 0.207 0.23471 0.237 0.19500 0.127517 0.106061 0.032179 0.227631 0.052509679
25 07BF009 SALT CREEKNEAR GROUARD
426.3 0.02746 0.118 0.19756 0.169 0.09971 0.142 0.15400 0.096194 0.170002 0.060535 0.266451 0.007247 0.053076233
26 07BG004 LILY CREEKNEAR SLAVELAKE
23.7 0 0 0 0 0 0 0.00000
27 07GD002 BEAVERTAILCREEK NEARHYTHE
663.3 0.19214 0.266 1.07442 0.357 0.45131 0.347 0.31600 0.365002 0.054103 0.389773 0.000195319 0.005013 0.055021801
28 07GF002 SPRING CREEKNEARVALLEYVIEW
28.3 0.04986 0.157 0.13204 0.137 0.03593 0.085 0.14300 0.55373 0.237884 0.204626 0.880099 0.044131 0.072009364
29 07GF003 WOLVERINECREEK NEARVALLEYVIEW
11.2 0 0 0 0 0 0 0.00000 0.954323 0.041509 0.897553 0.098278318
30 07GF004 SPRING CREEK(UPPER) NEARVALLEYVIEW
33.8 0.06662 0.176 0.17644 0.164 0.04802 0.103 0.16100 0.561174 0.384908 0.869934 0.076147126
31 07GF005 BRIDLEBITCREEK NEARVALLEYVIEW
20.7 0 0 0 0 0 0 0.00000 0.781411 0.213864 0.758014 0.237262007
32 07GF006 ROCKY CREEKNEARVALLEYVIEW
19.0 0 0 0 0 0 0 0.00000 0.633807 0.034333 0.241642 0.695681 0.277404405
33 07GF007 HORSE CREEKNEARVALLEYVIEW
4.3 0 0 0 0 0 0 0.00000 0.781299 0.21511 0.855799 0.045522 0.095088746
34 07GG003 IOSEGUN RIVERNEAR LITTLESMOKY
1952.0 0.05484 0.159 0.16839 0.153 0.06103 0.108 0.14800 0.036824 0.002728 0.010308 0.036904 6.81E-06 0.012908645
35 07GH001 LITTLE SMOKYRIVER NEARTRIANGLE
3941.0 0.14658 0.238 1.00955 0.352 0.50206 0.366 0.31300 0.39199 0.033742 0.156589 0.464302 0.001985701 0.043981 0.08282446
36 07GH005 WABATANISKCREEK ATHIGHWAY NO.676
125.9 0.22385 0.282 2.037 0.448 1.09926 0.469 0.37400 0.19833 0.014012 0.044928 0.204766 0.007937 0.044567062
37 STURGEO
STURGEON LAKEAT WILLIAMSONPARK
640.4 0.18489 0.26 0.90639 0.333 0.42807 0.341 0.29700 0.209866 0.085974 0.072744 0.392785 0.003549822 0.003096 0.0441305
38 07CA012 LOGAN RIVERNEAR THEMOUTH
428.2 0.00411 0.047 0 0 0 0 0.02100
39 07CB002 HOUSE RIVER ATHIGHWAY NO. 63
780.0 0.00296 0.041 0 0 0 0 0.01500
40 07CC001 HORSE RIVER ATABASANDS PARK
2131.8 0 0 0 0 0 0 0.00000

41 07CD001 CLEARWATERRIVER ATDRAPER
8255.2 0 0 0 0 0 0 0.00000
42 07CD002 CLEARWATERRIVER BELOWWATERWAYS
120.0 0 0 0 0 0 0 0.00000
43 07CD003 CLEARWATERRIVER AT UPPERWINGDAM
29.8 0 0 0 0 0 0 0.00000
44 07CD004 HANGINGSTONERIVER AT FORTMCMURRAY
955.4 0 0 0 0 0 0 0.00000
45 07CD005 CLEARWATERRIVER ABOVECHRISTINARIVER
97.3 0 0 0 0 0 0 0.00000
46 07CE001 GREGOIRE LAKENEAR FORTMCMURRAY
262.3 0 0 0 0 0 0 0.00000
47 07CE002 CHRISTINARIVER NEARCHARD
3572.4 0.00053 0.017 0 0 0 0 0.00700
48 07CE003 PONY CREEKNEAR CHARD
279.2 0 0 0 0 0 0 0.00000
49 07CE004 ROBERT CREEKNEAR ANZAC
53.9 0 0 0 0 0 0 0.00000
50 07CE005 JACKFISH RIVERBELOWCHRISTINA LAKE
1057.3 0 0 0 0 0 0 0.00000
51 07CE006 BIRCH CREEKNEAR CONKLIN
231.8 0 0 0 0 0 0 0.00000
52 07DA001 ATHABASCARIVER BELOWMCMURRAY
286.8 0 0 0 0 0 0 0.00000
53 07DA002 ATHABASCARIVER NEARMILDRED LAKE
448.0 0 0 0 0 0 0 0.00000
54 07DA003 ATHABASCARIVER NEARFORT MACKAY
263.3 0 0 0 0 0 0 0.00000
55 07DA004 ATHABASCARIVER AT SHOTTISLAND
1257.1 0 0 0 0 0 0 0.00000
56 07DA005 BEAVER RIVERNEAR FORTMACKAY
288.5 0 0 0 0 0 0 0.00000
57 07DA006 STEEPBANKRIVER NEARFORTMCMURRAY
1320.1 0 0 0 0 0 0 0.00000
58 07DA007 POPLAR CREEKNEAR FORTMCMURRAY
150.9 0 0 0 0 0 0 0.00000
59 07DA008 MUSKEG RIVERNEAR FORTMACKAY
1098.1 0 0 0 0 0 0 0.00000
60 07DA009 HARTLEY CREEKNEAR FORTMACKAY
358.4 0 0 0 0 0 0 0.00000
61 07DA011 UNNAMEDCREEK NEARFORT MACKAY
277.9 0 0 0 0 0 0 0.00000
62 07DA012 ASPHALT CREEKNEAR FORTMACKAY
144.2 0 0 0 0 0 0 0.00000

63 07DA013 PIERRE RIVERNEAR FORTMACKAY
122.3 0 0 0 0 0 0 0.00000
64 07DA014 CALUMET RIVERNEAR FORTMACKAY
180.6 0 0 0 0 0 0 0.00000
65 07DA015 TAR RIVER NEARFORT MACKAY
198.6 0 0 0 0 0 0 0.00000
66 07DA016 JOSLYN CREEKNEAR FORTMACKAY
255.0 0 0 0 0 0 0 0.00000
67 07DA017 ELLS RIVERNEAR THEMOUTH
1071.1 0 0 0 0 0 0 0.00000
68 07DA018 BEAVER RIVERABOVESYNCRUDE
164.7 0 0 0 0 0 0 0.00000
69 07DA019 TAR RIVER NEARFORT MACKAY(UPPERSTATION)
103.3 0 0 0 0 0 0 0.00000
70 07DA022 07DA022 126.6 0 0 0 0 0 0 0.0000071 07DB001 MACKAY RIVER
NEAR FORTMACKAY
1846.8 0 0 0 0 0 0 0.00000
72 07DB002 DOVER RIVERNEAR THEMOUTH
961.1 0 0 0 0 0 0 0.00000
73 07DB003 DUNKIRK RIVERNEAR FORTMACKAY
1564.3 0 0 0 0 0 0 0.00000
74 07DB004 THICKWOODCREEK NEARFORT MACKAY
176.9 0 0 0 0 0 0 0.00000
75 07DB005 MACKAY RIVERABOVE DUNKIRKRIVER
1014.2 0 0 0 0 0 0 0.00000
76 07DC001 FIREBAG RIVERNEAR THEMOUTH
5570.6 0 0 0 0 0 0 0.00000
77 07DC002 LOST CREEKNEAR THEMOUTH
418.5 0 0 0 0 0 0 0.00000
78 07DD001 ATHABASCARIVER ATEMBARRASAIRPORT
1952.1 0 0 0 0 0 0 0.00000
79 07DD002 RICHARDSONRIVER NEAR THEMOUTH
2732.4 0 0 0 0 0 0 0.00000
80 07DD003 EMBARRASRIVER BELOWDIVERGENCE
26.8 0 0 0 0 0 0 0.00000
81 07DD007 ATHABASCARIVER ABOVEJACKFISH CREEK
5.4 0 0 0 0 0 0 0.00000
82 07DD009 JACKFISH CREEKABOVEATHABASCARIVER
31.9 0 0 0 0 0 0 0.00000
83 07DD010 ATHABASCARIVER ABOVEFLETCHERCHANNEL
335.4 0 0 0 0 0 0 0.00000
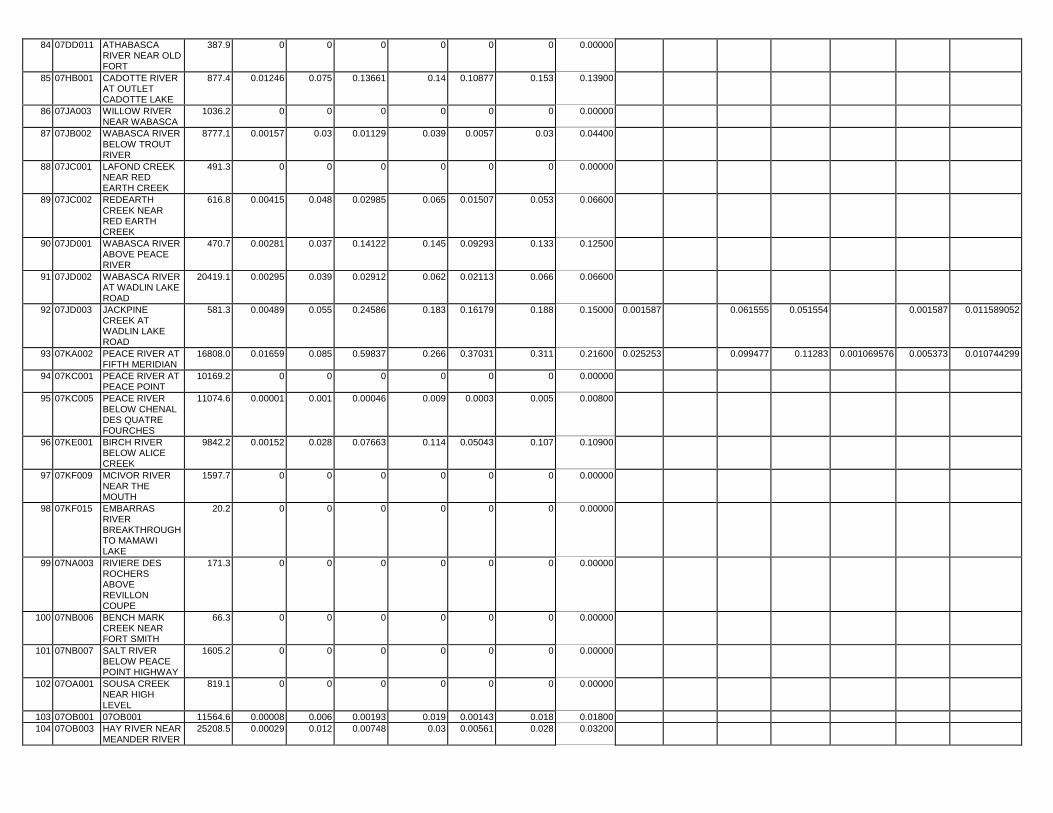
84 07DD011 ATHABASCARIVER NEAR OLDFORT
387.9 0 0 0 0 0 0 0.00000
85 07HB001 CADOTTE RIVERAT OUTLETCADOTTE LAKE
877.4 0.01246 0.075 0.13661 0.14 0.10877 0.153 0.13900
86 07JA003 WILLOW RIVERNEAR WABASCA
1036.2 0 0 0 0 0 0 0.00000
87 07JB002 WABASCA RIVERBELOW TROUTRIVER
8777.1 0.00157 0.03 0.01129 0.039 0.0057 0.03 0.04400
88 07JC001 LAFOND CREEKNEAR REDEARTH CREEK
491.3 0 0 0 0 0 0 0.00000
89 07JC002 REDEARTHCREEK NEARRED EARTHCREEK
616.8 0.00415 0.048 0.02985 0.065 0.01507 0.053 0.06600
90 07JD001 WABASCA RIVERABOVE PEACERIVER
470.7 0.00281 0.037 0.14122 0.145 0.09293 0.133 0.12500
91 07JD002 WABASCA RIVERAT WADLIN LAKEROAD
20419.1 0.00295 0.039 0.02912 0.062 0.02113 0.066 0.06600
92 07JD003 JACKPINECREEK ATWADLIN LAKEROAD
581.3 0.00489 0.055 0.24586 0.183 0.16179 0.188 0.15000 0.001587 0.061555 0.051554 0.001587 0.011589052
93 07KA002 PEACE RIVER ATFIFTH MERIDIAN
16808.0 0.01659 0.085 0.59837 0.266 0.37031 0.311 0.21600 0.025253 0.099477 0.11283 0.001069576 0.005373 0.010744299
94 07KC001 PEACE RIVER ATPEACE POINT
10169.2 0 0 0 0 0 0 0.00000
95 07KC005 PEACE RIVERBELOW CHENALDES QUATREFOURCHES
11074.6 0.00001 0.001 0.00046 0.009 0.0003 0.005 0.00800
96 07KE001 BIRCH RIVERBELOW ALICECREEK
9842.2 0.00152 0.028 0.07663 0.114 0.05043 0.107 0.10900
97 07KF009 MCIVOR RIVERNEAR THEMOUTH
1597.7 0 0 0 0 0 0 0.00000
98 07KF015 EMBARRASRIVERBREAKTHROUGHTO MAMAWILAKE
20.2 0 0 0 0 0 0 0.00000
99 07NA003 RIVIERE DESROCHERSABOVEREVILLONCOUPE
171.3 0 0 0 0 0 0 0.00000
100 07NB006 BENCH MARKCREEK NEARFORT SMITH
66.3 0 0 0 0 0 0 0.00000
101 07NB007 SALT RIVERBELOW PEACEPOINT HIGHWAY
1605.2 0 0 0 0 0 0 0.00000
102 07OA001 SOUSA CREEKNEAR HIGHLEVEL
819.1 0 0 0 0 0 0 0.00000
103 07OB001 07OB001 11564.6 0.00008 0.006 0.00193 0.019 0.00143 0.018 0.01800104 07OB003 HAY RIVER NEAR
MEANDER RIVER25208.5 0.00029 0.012 0.00748 0.03 0.00561 0.028 0.03200

105 07OB004 STEEN RIVERNEAR STEENRIVER
2595.4 0 0 0 0 0 0 0.00000
106 07OB005 MEANDER RIVERAT OUTLETHUTCH LAKE
402.2 0.00244 0.033 0.05012 0.095 0.03396 0.078 0.09500 0.068151 0.002197982
107 07OB006 LUTOSE CREEKNEAR STEENRIVER
291.7 0.00035 0.014 0.00889 0.036 0.00668 0.035 0.03800
108 07OB007 HUTCH LAKETRIBUTARYNEAR HIGHLEVEL
103.1 0.00067 0.02 0.01368 0.046 0.00924 0.04 0.04600 0.013279 0.000897226
109 EAGLENE
EAGLENESTLAKE NEAR THEOUTLET
883.2 0 0 0 0 0 0 0.00000
110 GARDINE GARDINER LAKE(UPPER) INBIRCHMOUNTAINS
195.7 0 0 0 0 0 0 0.00000
111 NAMURLA
NAMUR LAKE ATBIRCHMOUNTAINSLODGE
176.5 0 0 0 0 0 0 0.00000
112 PEERLES PEERLESS LAKENEAR PEERLESSLAKE
426.7 0 0 0 0 0 0 0.00000
113 SWABASC
SWABASC 1601.9 0 0 0 0 0 0 0.00000
114 UTIKUMA UTIKUMA LAKENEAR NIPISI
2477.6 0.00355 0.044 0.02557 0.052 0.01291 0.05 0.05500 0.000202 2.24774E-05

Ecoregion: Western AlbertaUplands, Clear Hills Upland
Runoff PotentialAgricultural Indicators Agriculture
IntensityLandform Characteristics Soil Characteristics
WatershedCode
Watershed Name Area (km²) ManureProduction(tonne per
acre)
ManureProduction(Percentile)
FertilizerExpenses
(dollars peracre)
FertilizerExpenses
(Percentile)
ChemicalExpenses(dollar per
acre)
ChemicalExpenses
(percentile)
OverallPercentile
Type I Type II Type III High (%) Moderate (%) Low (%) Unknown (%)
1 05BH006 JUMPINGPOUND CREEK NEARJUMPINGPOUND
214.1 0.56712 0.513 1.42678 0.389 0.361 0.299 0.38700 0.42633 0.45048 0.03806 0.69045 0.012067 0.08436 0.1279917
2 05BH009 JUMPINGPOUND CREEK NEARTHE MOUTH
114.7 0.57704 0.521 1.4608 0.392 0.37213 0.314 0.39600 0.84486 0.08519 0.06787 0.81189 0.09765 0.088382
3 05BH011 JUMPINGPOUND CREEK ATBATEMAN'SRANCH
204.1 0.35172 0.382 0.88047 0.325 0.22155 0.232 0.31000 0.02884 0.13923 0.11376 0.04899 0.0053114
4 05BJ004 ELBOW RIVERAT BRAGGCREEK
0.5 2.75163 31.0244 0.19258 22.5222 5.9081666 2.43275 3.1055427
5 05BJ007 ELBOW RIVER(RESEARCH) ATBRAGG CREEK
49.7 0.44300
6 05BJ011 ELBOW RIVERAT CLEMGARDINERBRIDGE
80.6 0.67073 0.559 1.75578 0.429 0.46325 0.357 0.44300 0.2653 0.64756 0.08496 0.6039 0.1179578 0.16851 0.1074594
7 05BK001 FISH CREEKNEAR PRIDDIS
260.1 0.63163 0.545 1.63161 0.413 0.42466 0.334 0.42300 0.3555 0.44808 0.57343 0.0967707 0.06413 0.0687236
8 05BL013 THREEPOINTCREEK NEARMILLARVILLE
506.4 0.61288 0.535 1.57501 0.406 0.42601 0.337 0.41800 0.28529 0.15686 0.33796 0.0142709 0.06783 0.0208082
9 05BL026 SULLIVANCREEK NEARLONGVIEW
124.4 0.38419 0.404 0.57521 0.258 0.15381 0.182 0.27500 0.47888 0.38639 0.0887 0.0037953
10 05CA001 RED DEERRIVER NEARSUNDRE
255.3 0.08172 0.187 0.17024 0.154 0.04489 0.096 0.15600
11 05CA002 JAMES RIVERNEAR SUNDRE
820.9 0.1239 0.229 0.25976 0.186 0.06968 0.117 0.18600 0.02206 0.01965 0.00475 0.02742 0.0036797 0.00747 0.0076337
12 05CA009 RED DEERRIVER BELOWBURNT TIMBERCREEK
584.3 0.03168 0.124 0.06059 0.102 0 0 0.10400
13 05CA010 RED DEERRIVER ATSUNDRE
233.6 0.29659 0.347 0.65253 0.287 0.172 0.204 0.26600 0.37542 0.10797 0.20535 0.29654 0.2026321 0.10913 0.1447869
14 05CA011 BEARBERRYCREEK NEARSUNDRE
226.4 0.2804 0.336 0.58496 0.259 0.15675 0.185 0.24700 0.25827 0.30138 0.03499 0.43878 0.04232 0.1135474
15 05CA012 FALLENTIMBERCREEK NEARSUNDRE
487.2 0.16955 0.249 0.34669 0.2 0.07218 0.12 0.19400 0.20297 0.0458 0.00658 0.13472 0.0361046 0.00077 0.0837549
16 05CB002 LITTLE REDDEER RIVERNEAR WATERVALL
450.7 0.12235 0.227 0.2445 0.181 0.03374 0.073 0.17200 0.00583 0.03358 0.02116 0.0025031 0.00288 0.012861
17 05DB002 PRAIRIE CREEKNEAR ROCKYMOUNTAIN HOU
642.2 0.48216 0.464 0.90745 0.334 0.19128 0.21 0.34000 0.09152 0.01268 0.02168 0.06045 0.02746 0.0664771
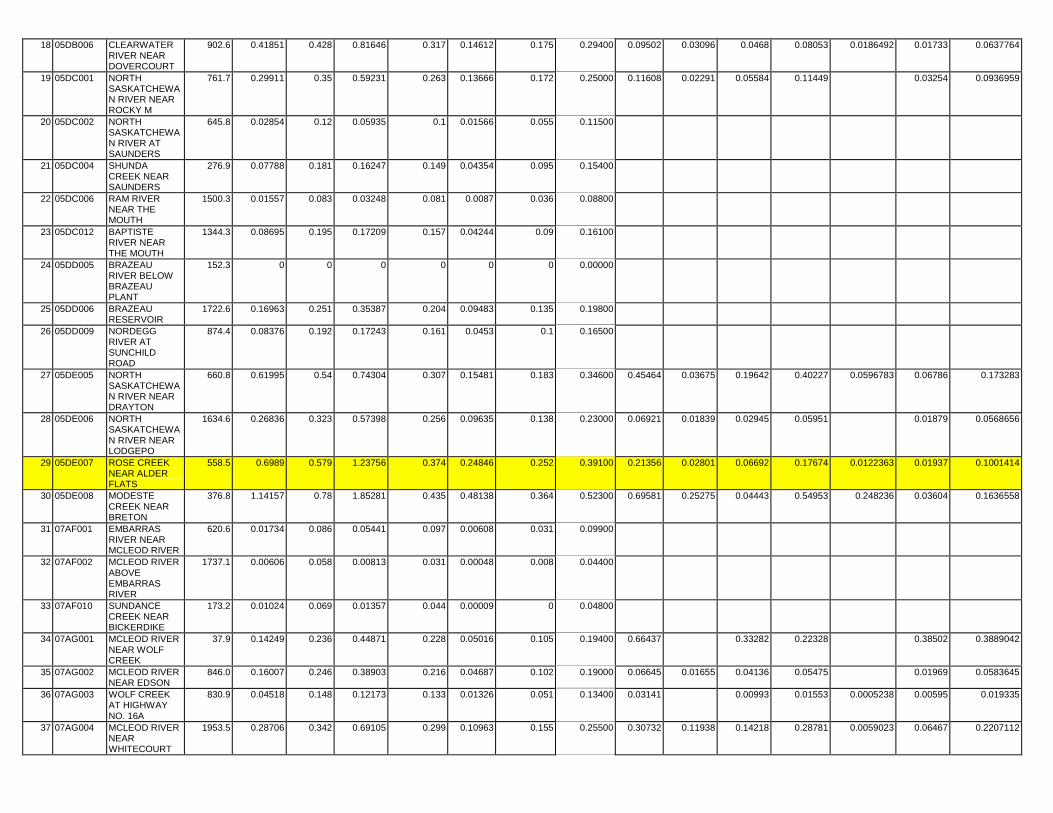
18 05DB006 CLEARWATERRIVER NEARDOVERCOURT
902.6 0.41851 0.428 0.81646 0.317 0.14612 0.175 0.29400 0.09502 0.03096 0.0468 0.08053 0.0186492 0.01733 0.0637764
19 05DC001 NORTHSASKATCHEWAN RIVER NEARROCKY M
761.7 0.29911 0.35 0.59231 0.263 0.13666 0.172 0.25000 0.11608 0.02291 0.05584 0.11449 0.03254 0.0936959
20 05DC002 NORTHSASKATCHEWAN RIVER ATSAUNDERS
645.8 0.02854 0.12 0.05935 0.1 0.01566 0.055 0.11500
21 05DC004 SHUNDACREEK NEARSAUNDERS
276.9 0.07788 0.181 0.16247 0.149 0.04354 0.095 0.15400
22 05DC006 RAM RIVERNEAR THEMOUTH
1500.3 0.01557 0.083 0.03248 0.081 0.0087 0.036 0.08800
23 05DC012 BAPTISTERIVER NEARTHE MOUTH
1344.3 0.08695 0.195 0.17209 0.157 0.04244 0.09 0.16100
24 05DD005 BRAZEAURIVER BELOWBRAZEAUPLANT
152.3 0 0 0 0 0 0 0.00000
25 05DD006 BRAZEAURESERVOIR
1722.6 0.16963 0.251 0.35387 0.204 0.09483 0.135 0.19800
26 05DD009 NORDEGGRIVER ATSUNCHILDROAD
874.4 0.08376 0.192 0.17243 0.161 0.0453 0.1 0.16500
27 05DE005 NORTHSASKATCHEWAN RIVER NEARDRAYTON
660.8 0.61995 0.54 0.74304 0.307 0.15481 0.183 0.34600 0.45464 0.03675 0.19642 0.40227 0.0596783 0.06786 0.173283
28 05DE006 NORTHSASKATCHEWAN RIVER NEARLODGEPO
1634.6 0.26836 0.323 0.57398 0.256 0.09635 0.138 0.23000 0.06921 0.01839 0.02945 0.05951 0.01879 0.0568656
29 05DE007 ROSE CREEKNEAR ALDERFLATS
558.5 0.6989 0.579 1.23756 0.374 0.24846 0.252 0.39100 0.21356 0.02801 0.06692 0.17674 0.0122363 0.01937 0.1001414
30 05DE008 MODESTECREEK NEARBRETON
376.8 1.14157 0.78 1.85281 0.435 0.48138 0.364 0.52300 0.69581 0.25275 0.04443 0.54953 0.248236 0.03604 0.1636558
31 07AF001 EMBARRASRIVER NEARMCLEOD RIVER
620.6 0.01734 0.086 0.05441 0.097 0.00608 0.031 0.09900
32 07AF002 MCLEOD RIVERABOVEEMBARRASRIVER
1737.1 0.00606 0.058 0.00813 0.031 0.00048 0.008 0.04400
33 07AF010 SUNDANCECREEK NEARBICKERDIKE
173.2 0.01024 0.069 0.01357 0.044 0.00009 0 0.04800
34 07AG001 MCLEOD RIVERNEAR WOLFCREEK
37.9 0.14249 0.236 0.44871 0.228 0.05016 0.105 0.19400 0.66437 0.33282 0.22328 0.38502 0.3889042
35 07AG002 MCLEOD RIVERNEAR EDSON
846.0 0.16007 0.246 0.38903 0.216 0.04687 0.102 0.19000 0.06645 0.01655 0.04136 0.05475 0.01969 0.0583645
36 07AG003 WOLF CREEKAT HIGHWAYNO. 16A
830.9 0.04518 0.148 0.12173 0.133 0.01326 0.051 0.13400 0.03141 0.00993 0.01553 0.0005238 0.00595 0.019335
37 07AG004 MCLEOD RIVERNEARWHITECOURT
1953.5 0.28706 0.342 0.69105 0.299 0.10963 0.155 0.25500 0.30732 0.11938 0.14218 0.28781 0.0059023 0.06467 0.2207112

38 07AG007 MCLEOD RIVERNEARROSEVEAR
804.9 0.2245 0.284 0.58787 0.261 0.08466 0.125 0.21900 0.20418 0.01855 0.12641 0.17061 0.0009471 0.05781 0.1389984
39 07AG008 GROAT CREEKNEARWHITECOURT
132.3 0.00021 0.011 0.00067 0.012 0.00013 0.001 0.01100 0.0698 0.00186 0.00056 0.04418 0.02229 0.0057519
40 07BA001 PEMBINA RIVERBELOW PADDYCREEK
2188.3 0.04118 0.142 0.09246 0.122 0.01581 0.056 0.12900
41 07BA002 RAT CREEKNEAR CYNTHIA
603.2 0.1503 0.24 0.36087 0.205 0.03844 0.086 0.18600
42 07BB002 PEMBINA RIVERNEARENTWISTLE
1504.2 0.37933 0.399 1.00996 0.354 0.2493 0.252 0.33500 0.13355 0.01272 0.20989 0.18791 0.0041309 0.05089 0.1135819
43 07BB005 LITTLE PADDLERIVER NEARMAYERTHORPE
323.4 0.7197 0.587 2.44322 0.481 0.73259 0.399 0.48100 0.3225 0.37663 0.13877 0.65835 0.0098106 0.01732 0.1232336
44 07BB008 CHIP LAKENEARNORTHVILLE
1208.3 0.34654 0.375 0.56762 0.255 0.10538 0.148 0.24700 0.19387 0.11648 0.45762 0.46849 0.0167865 0.03334 0.3193152
45 07BB011 PADDLE RIVERNEARANSELMO
258.5 0.57619 0.518 1.40413 0.388 0.3676 0.305 0.39300 0.59546 0.31729 0.08448 0.76973 0.0249594 0.03373 0.1660365
46 07BK004 OTAUWAURIVER NEARSLAVE LAKE
512.0 0.01044 0.071 0.0419 0.089 0.01096 0.043 0.09200
47 07BK005 SAULTEAUXRIVER NEARSPURFIELD
2597.8 0.02275 0.097 0.09177 0.121 0.02414 0.07 0.12000
48 07BK009 SAWRIDGECREEK NEARSLAVE LAKE
234.1 0.00347 0.042 0.02322 0.047 0.00658 0.033 0.04900 0.00802 0.00153 0.00543 0.0041299
49 07FD006 SADDLE RIVERNEAR WOKING
540.2 0.18778 0.263 3.8479 0.561 1.97379 0.581 0.46200 0.36914 0.0682 0.01853 0.42267 0.03103 0.0021644
50 07FD007 07FD007 2075.7 0.08495 0.194 1.50569 0.397 0.66429 0.387 0.31900 0.07583 7.9E-05 0.05812 0.12262 0.0096 0.001810751 07FD011 HINES CREEK
ABOVE GERRYLAKE
368.4 0.04142 0.142 0.37246 0.209 0.10553 0.151 0.17500 0.01633 0.00029 0.05303 0.06179 0.0220871
52 07FD012 MONTAGNEUSERIVER NEARHINES CREEK
228.2 0.16014 0.248 2.68505 0.497 1.16967 0.491 0.39500 0.24991 0.04941 0.10655 0.36129 0.0445833
53 07GE003 GRANDEPRAIRIE CREEKNEARSEXSMITH
151.1 0.33904 0.37 7.02174 0.69 3.38947 0.676 0.57700 0.34556 0.15264 0.02806 0.47221 0.0048814 0.0491706
54 07GJ004 BAD HEARTRIVER NEARHEART VALLEY
191.4 0.15907 0.243 3.18047 0.524 1.64044 0.558 0.43100 0.23194 0.05633 0.00585 0.27109 0.00695 0.0160703
55 07HA005 WHITEMUDRIVER NEARDIXONVILLE
2014.5 0.06277 0.169 0.70565 0.303 0.29194 0.27 0.23400 0.16087 0.00081 0.03515 0.17202 0.0035068 0.0637199
56 07HC001 NOTIKEWINRIVER ATMANNING
4677.2 0.00466 0.053 0.2229 0.173 0.10772 0.152 0.14200 0.01279 0.00584 0.0137 0.00283 0.0022589
57 07BF001 EAST PRAIRIERIVER NEARENILDA
1459.0 0.12583 0.23 0.67184 0.293 0.28027 0.265 0.25000 0.03796 0.00091 0.13668 0.10848 0.0913018
58 07BF002 WEST PRAIRIERIVER NEARHIGH PRAIRIE
1156.9 0.11639 0.225 0.64365 0.28 0.24578 0.245 0.23900 0.10732 0.02639 0.13813 0.21994 0.00127 0.0774857
59 07BH003 DRIFTPILERIVER NEARDRIFTPILE
836.7 0.06107 0.167 0.20583 0.17 0.06221 0.112 0.16200 0.05056 0.00867 0.00204 0.06558 0.00084 0.0127212
60 07BJ001 SWAN RIVERNEAR KINUSO
1606.1 0.02611 0.115 0.07395 0.108 0.02333 0.068 0.12100 0.03031 0.00882 0.01331 0.04979 3.9E-05 0.0171135

61 07BJ004 ADAMS CREEKNEAR KINUSO
139.1 0.01881 0.09 0.10091 0.125 0.02906 0.071 0.11800 0.01917 0.02604 0.002893
62 07GC002 PINTO CREEKNEAR GRANDEPRAIRIE
493.9 0.00682 0.063 0.05673 0.098 0.02106 0.065 0.10300
63 07GE001 WAPITI RIVERNEAR GRANDEPRAIRIE
5158.9 0.08959 0.199 1.82663 0.432 0.83121 0.424 0.34400 0.13881 0.00558 0.05745 0.15614 0.0016589 0.0228 0.0378379
64 07GF001 SIMONETTERIVER NEARGOODWIN
4292.2 0.10589 0.213 0.77457 0.309 0.40393 0.322 0.26400 0.12565 0.026 0.02989 0.14199 0.01771 0.0222322
65 07GG001 WASKAHIGANRIVER NEARTHE MOUTH
1036.2 0.01466 0.08 0.0388 0.087 0.01286 0.048 0.09900 0.02256 0.00755 0.02145 0.00386 0.0047965
66 07GG002 LITTLE SMOKYRIVER ATLITTLE SMOKY
3006.4 0.00959 0.067 0.02652 0.054 0.00911 0.038 0.06200 0.01604 0.00133 0.00617 0.01533 0.00506 0.0031193
67 07GJ002 SMOKY RIVERNEARBEZANSON
6955.4 0.063 0.17 1.21096 0.371 0.58497 0.377 0.29200 0.07376 0.02686 0.03036 0.09361 0.0049113 0.01585 0.0353801
68 05BG009 WAIPAROUSCREEK BELOWMEADOWCREEK
228.9 0.04906 0.154 0.09384 0.124 0 0 0.11700
69 05CA003 DEER CREEK(MAIN STEM)NEAR SUNDRE
4.6 0 0 0 0 0 0 0.00000
70 05CA005 DEER CREEKEAST BRANCH
0.9 0 0 0 0 0 0 0.00000
71 05DB004 PRAIRIE CREEKNEAR RANGERSTATION
96.2 0.1105 0.221 0.23052 0.177 0.06177 0.11 0.17600
72 05DB005 PRAIRIE CREEKBELOW LICKCREEK
111.5 0.1848 0.259 0.38551 0.213 0.1033 0.145 0.20900
73 05DC003 MARTIN CREEKNEARNORDEGG
3.1 0 0 0 0 0 0 0.00000
74 05DC010 NORTHSASKATCHEWAN RIVERBELOW BIGHOR
0.6 0 0 0 0 0 0 0.00000
75 05DC011 NORTH RAMRIVER ATFORESTRYROAD
346.8 0 0 0 0 0 0 0.00000
76 05DD003 CHUNGOCREEK NEARTHE MOUTH
187.5 0 0 0 0 0 0 0.00000
77 05DD004 BROWN CREEKAT FORESTRYROAD
218.4 0 0 0 0 0 0 0.00000
78 07AC002 NORTH FOXCREEK NEARMUSKEG
17.2 0 0 0 0 0 0 0.00000
79 07AC006 HINTON STUDYBASIN NO.14
13.2 0 0 0 0 0 0 0.00000
80 07AC007 BERLANDRIVER NEARTHE MOUTH
4520.5 0.00003 0.004 0.00009 0.003 0 0 0.00400
81 07AD002 ATHABASCARIVER ATHINTON
249.9 0.0222 0.094 0.06569 0.106 0 0 0.08800

82 07AD003 CACHEPERCOTTECREEK NEARHINTON
4.3 0 0 0 0 0 0 0.00000
83 07AD004 WHISKEYJACKCREEK NEARHINTON
3.2 0 0 0 0 0 0 0.00000
84 07AD005 FISH CREEKNEAR HINTON
25.2 0 0 0 0 0 0 0.00000
85 07AD006 OLDMANCREEK NEARHINTON
17.7 0 0 0 0 0 0 0.00000
86 07AD007 CACHEPERCOTTECREEK (NORTHFORK) NEARHINTON
2.6 0 0 0 0 0 0 0.00000
87 07AD008 HINTON STUDYBASIN NO.1
17.5 0 0 0 0 0 0 0.00000
88 07AD009 HINTON STUDYBASIN NO.2
14.6 0 0 0 0 0 0 0.00000
89 07AD010 HINTON STUDYBASIN NO.5
19.2 0 0 0 0 0 0 0.00000
90 07AE001 ATHABASCARIVER NEARWINDFALL
4841.1 0.00273 0.036 0.0074 0.027 0.00103 0.013 0.03700
91 07AE002 HINTON STUDYBASIN NO.6
23.5 0 0 0 0 0 0 0.00000
92 07AE003 HINTON STUDYBASIN NO.7
22.0 0 0 0 0 0 0 0.00000
93 07AF008 QUIGLEYCREEK NEARHINTON
15.5 0 0 0 0 0 0 0.00000
94 07AF009 NORTHANDERSONCREEK NEARHINTON
11.0 0 0 0 0 0 0 0.00000
95 07AF011 HINTON STUDYBASIN NO.15
20.2 0 0 0 0 0 0 0.00000
96 07AF012 HINTON STUDYBASIN NO.16
8.0 0.00137 0.026 0.00178 0.017 0 0 0.01800
97 07AF014 EMBARRASRIVER NEARWEALD
520.3 0.0065 0.06 0.00848 0.035 0 0 0.04100
98 07AF015 GREGG RIVERNEAR THEMOUTH
0.0 0 0 0 0 0 0 0.00000
99 07AF907 ERITH RIVERBELOWHANLAN CREEK
592.0 0 0 0 0 0 0 0.00000
100 07AF909 EMBARRASRIVER AT ROBB
123.0 0.00001 0.003 0.00001 0 0 0 0.00200
101 07AG005 HINTON STUDYBASIN NO.8
23.5 0 0 0 0 0 0 0.00000
102 07AG006 HINTON STUDYBASIN NO.9
7.7 0 0 0 0 0 0 0.00000
103 07AH001 FREEMANRIVER NEARFORTASSINIBOINE
1658.8 0.0117 0.074 0.09051 0.118 0.01665 0.058 0.11000 0.00844 0.00116 0.00079 0.00614 9.737E-05 0.00214 0.0020215
104 07AH002 CHRISTMASCREEK NEARBLUE RIDGE
422.5 0.03227 0.126 0.11692 0.132 0.03381 0.075 0.13200
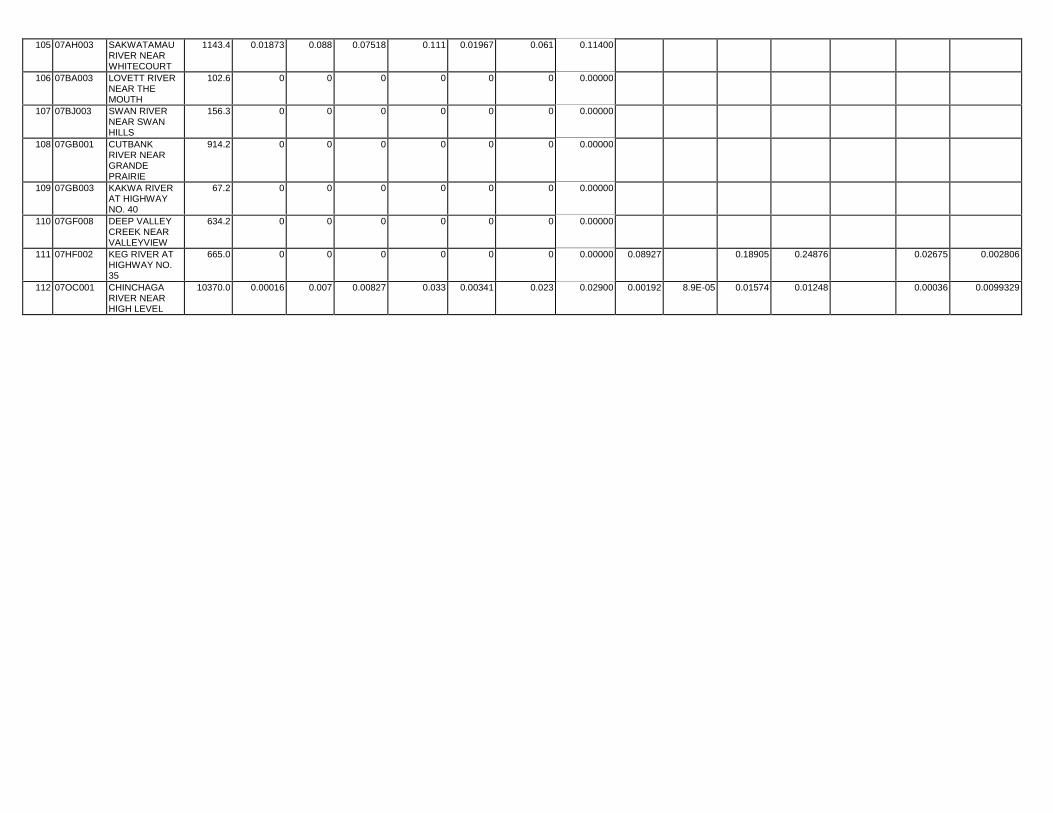
105 07AH003 SAKWATAMAURIVER NEARWHITECOURT
1143.4 0.01873 0.088 0.07518 0.111 0.01967 0.061 0.11400
106 07BA003 LOVETT RIVERNEAR THEMOUTH
102.6 0 0 0 0 0 0 0.00000
107 07BJ003 SWAN RIVERNEAR SWANHILLS
156.3 0 0 0 0 0 0 0.00000
108 07GB001 CUTBANKRIVER NEARGRANDEPRAIRIE
914.2 0 0 0 0 0 0 0.00000
109 07GB003 KAKWA RIVERAT HIGHWAYNO. 40
67.2 0 0 0 0 0 0 0.00000
110 07GF008 DEEP VALLEYCREEK NEARVALLEYVIEW
634.2 0 0 0 0 0 0 0.00000
111 07HF002 KEG RIVER ATHIGHWAY NO.35
665.0 0 0 0 0 0 0 0.00000 0.08927 0.18905 0.24876 0.02675 0.002806
112 07OC001 CHINCHAGARIVER NEARHIGH LEVEL
10370.0 0.00016 0.007 0.00827 0.033 0.00341 0.023 0.02900 0.00192 8.9E-05 0.01574 0.01248 0.00036 0.0099329

Ecoregion: Aspen ParklandRunoff Potential
Agricultural Indicators AgricultureIntensity
Landform Characteristics Soil Characteristics
WatershedCode
Watershed Name Area (km²) ManureProduction(tonne per
acre)
ManureProduction(Percentile)
FertilizerExpenses
(dollars peracre)
FertilizerExpenses
(Percentile)
ChemicalExpenses(dollar per
acre)
ChemicalExpenses
(percentile)
OverallPercentile
Type I Type II Type III High (%) Moderate (%) Low (%) Unknown (%)
1 05EB005 SISIB LAKE NEARNORTH COOKINGLAKE
9.7 0.67334 0.562 2.2642 0.464 1.02046 0.464 0.48700 0.754502 0.241293 0.550414 0.262429 0.03467938
2 05EB006 COOKING LAKECREEK NEARNORTH COOKING
0.6 0.76483 0.624 2.57182 0.494 1.15911 0.488 0.52200 0.992928 0.893635 0.09929282
3 MIQUELO MIQUELON LAKEAT PROVINCIALPARK
37.8 0.76482 0.622 2.57178 0.492 1.15909 0.486 0.52500 0.639543 0.250616 0.09614873
4 HASTING HASTINGS LAKENEAR DEVILLE
73.0 0.7648 0.619 2.57174 0.489 1.15907 0.483 0.52600 0.265309 0.589623 0.705661 0.175256 0.08015151
5 05EB001 HASTINGSCREEK NEARLINDBROOK
16.0 0.76481 0.62 2.57176 0.491 1.15908 0.484 0.53100 0.024724 0.972188 0.532212 0.299468 0.07887825
6 MINISTI MINISTIK LAKENEAR NEWSAREPTA
55.0 0.85636 0.676 2.74641 0.502 1.14382 0.478 0.54500 0.13963 0.460992 0.62962 0.264155 0.05714263
7 05EB010 KATCHEMUTCREEK NEARTOFIELD
99.0 0.85 0.669 3.06152 0.518 1.24713 0.5 0.55300 0.173222 0.711146 0.697717 0.16427 0.06545741
8 COOKING 195.1 1.10909 0.763 3.04415 0.515 0.88848 0.438 0.56900 0.314148 0.481605 0.594835 0.286867 0 0.044653819 05EB909 POINTE-AUX-
PINS TRIBUTARYNO. 1 NEAR
18.1 0.8307 0.657 3.4056 0.54 1.57266 0.545 0.57700 0.127628 0.869464 0.375429 0.521648 0.09499197
10 05DF001 NORTHSASKATCHEWANRIVER ATEDMONTON
2.0 0.38662 0.407 6.29157 0.676 3.4222 0.683 0.58300 0.995937
11 05FD003 RIBSTONECREEK NEARRIBSTONE
799.3 0.64186 0.551 5.34882 0.637 2.96087 0.652 0.60600 0.394886 0.343385 5.69E-05 0.243038 0.078763 0.610735 0.06269221
12 05FC004 PAINTEARTHCREEK NEARHALKIRK
191.0 0.74572 0.608 5.31684 0.634 3.63042 0.698 0.63800 0.849933 0.032205 0.079541 0.701868 0.241556 0.05333394
13 05FD005 RIBSTONECREEK NEARCZAR
1747.4 0.89569 0.682 4.90567 0.623 2.75583 0.643 0.64300 0.311625 0.557199 0.0046 0.449421 0.060376 0.420632 0.06239789
14 05FE003 BATTLE RIVERAT HIGHWAY NO.41
4468.9 0.71381 0.582 7.37587 0.706 4.2042 0.745 0.67200 0.503646 0.415892 0.021128 0.327551 0.024894 0.584926 0.0584222
15 05FE005 BLACKFOOTCREEK NEARTHESASKATCHEWAN
709.2 0.59771 0.53 8.92643 0.744 4.5929 0.775 0.67700 0.306279 0.459719 0.032353 0.005934 0.667473 0.05969055
16 05GA010 KILLARNEY LAKETRIBUTARYNEAR CHAUVIN
1008.9 0.74419 0.605 8.55497 0.735 3.84819 0.717 0.68500 0.583446 0.337443 0.023277 0.39721 0.358161 0.175703 0.04907006
17 05FD001 RIBSTONECREEK NEAREDGERTON
153.8 0.7102 0.579 8.72901 0.741 4.16579 0.74 0.68700 0.54801 0.380052 0.1279 0.049069 0.753997 0.06435477
18 05EB902 POINTE-AUX-PINS CREEKNEARARDROSSAN
75.6 1.48882 0.873 5.42235 0.639 1.91923 0.576 0.70500 0.164999 0.821559 0.010441 0.38833 0.511912 0.04755302

19 RIBSTON RIBSTONE LAKENEAR HEATH
826.5 1.23315 0.813 5.08911 0.626 2.89541 0.65 0.70700 0.239782 0.475727 0.002885 0.196842 0.034964 0.699491 0.06426386
20 BEAVERH
BEAVERHILLLAKE NEARMUNDARE
1240.3 0.73095 0.593 8.91724 0.743 4.96741 0.797 0.72300 0.37131 0.37408 0.128331 0.629228 0.198835 0.052025 0.09848816
21 05EE006 VERMILIONRIVERTRIBUTARYNEAR BRUCE
48.5 0.67737 0.565 9.73558 0.765 5.36015 0.811 0.72600 0.557718 0.019894 0.414568 0.92518 0.0064 0.003437 0.06145988
22 05FE004 BATTLE RIVERNEAR THESASKATCHEWANBO
2967.1 0.67803 0.567 10.42424 0.784 5.02189 0.802 0.73500 0.406105 0.482891 0.029839 0.047348 0.013989 0.845173 0.06300984
23 05EB002 BEAVERHILLCREEK NEARMUNDARE
41.9 0.69779 0.576 10.56137 0.792 5.72537 0.826 0.75200 0.727834 0.268873 0.872007 0.052924 0.007376 0.05134508
24 05EB910 POINTE-AUX-PINS TRIBUTARYNO. 2 NEAR
8.2 0.79518 0.649 9.08026 0.748 5.02126 0.801 0.75900 0.333775 0.659942 0.003687 0.124837 0.788576 0.06636291
25 05FC002 BIGKNIFE CREEKNEAR GADSBY
225.1 0.84567 0.668 8.14751 0.724 5.7057 0.822 0.76700 0.85348 0.115429 0.015801 0.832955 0.009613 0.06633 0.08790192
26 05EB015 BEAVERHILLCREEK NEARTHE MOUTH
821.4 0.72815 0.59 11.02939 0.81 5.64811 0.821 0.76800 0.552035 0.233063 0.159058 0.497737 0.309748 0.081902 0.10056617
27 05EE007 VERMILIONRIVER NEARMARWAYNE
1131.4 0.75735 0.612 10.64706 0.797 5.60815 0.819 0.77100 0.283581 0.662061 0.03477 0.288109 0.072765 0.578635 0.05235383
28 05EE002 VERMILIONRIVER AT LEAPARK
54.4 1.04733 0.736 9.2544 0.752 4.78267 0.785 0.78700 0.88382 0.023535 0.087632 0.007353 0.279487 0.663761 0.04275397
29 05EE008 VERMILION PARKLAKE NEARVERMILION
399.5 0.78448 0.641 11.87087 0.848 5.70972 0.824 0.80700 0.574881 0.281263 0.086337 0.035238 0.163458 0.664161 0.11848114
30 05EE004 VERMILIONRIVER NEARHAZELDINE
478.5 0.9582 0.707 10.63293 0.795 5.83456 0.829 0.81700 0.608717 0.191775 0.196357 0.065359 0.206449 0.688723 0.04117469
31 05EB911 POINTE-AUX-PINS TRIBUTARYNO. 3 NEAR
3.6 0.8066 0.652 11.51751 0.838 6.46751 0.869 0.82500 0.04816 0.94884 0.028896 0.868404 0.09488399
32 05EE001 VERMILIONRIVER NEARMANNVILLE
4112.4 0.77679 0.636 12.34194 0.862 6.35688 0.862 0.82800 0.489729 0.346382 0.096051 0.214069 0.449468 0.226328 0.10164044
33 05FC005 REDWILLOWCREEK NEARRED WILLOW
854.8 1.02549 0.723 9.78556 0.767 6.4817 0.871 0.82800 0.594044 0.319661 0.05996 0.570426 0.044064 0.314554 0.06331121
34 05FE002 BUFFALO CREEKAT HIGHWAY NO.41
714.4 0.76651 0.626 12.89531 0.866 6.60209 0.87 0.83400 0.32029 0.624 0.025648 0.018062 0.046536 0.850821 0.0667498
35 05FB003 IRON CREEKNEAR VIKING
122.0 0.73438 0.598 12.98983 0.877 6.79454 0.896 0.83400 0.751814 0.244649 0.917176 0.018584 0.06070302
36 05FB002 IRON CREEKNEAR HARDISTY
3377.1 0.60772 0.533 15.44389 0.936 8.3213 0.946 0.83700 0.789148 0.179035 0.012881 0.501554 0.008221 0.413115 0.07323953
37 05EE003 VERMILIONRIVER NEARVEGREVILLE
1098.8 0.66516 0.554 15.09045 0.921 8.44075 0.954 0.83900 0.830712 0.031672 0.115603 0.852483 0.046988 0.025753 0.07072905
38 05EC005 REDWATERRIVER NEAR THEMOUTH
64.4 0.71357 0.581 15.26108 0.933 8.33209 0.948 0.84700 0.57125 0.08784 0.029146 0.254926 0.270822 0.4418957
39 05FA010 CAMROSECREEK ATCAMROSE
457.1 0.9125 0.691 12.45242 0.867 6.88513 0.904 0.84800 0.601119 0.25276 0.118798 0.582687 0.294681 0.013593 0.09674481
40 05FA021 BATTLE RIVERBELOWPIPESTONECREEK
631.6 1.23466 0.815 11.63061 0.842 5.95243 0.837 0.86200 0.482068 0.299269 0.102843 0.384451 0.378221 0.101555 0.11376156

41 05EE913 VERMILIONRIVER DRAINAGENEAR HOLDEN
55.8 0.7311 0.597 15.74412 0.939 8.849 0.964 0.86500 0.99667 0.698143 0.237621 0.06090598
42 05EB016 AMISK CREEKNEAR SHONTS
377.2 0.82869 0.655 14.48767 0.902 8.19236 0.944 0.86700 0.74925 0.078395 0.15824 0.800804 0.119901 0.001173 0.07000766
43 05EE915 VERMILIONRIVER DRAINAGENEAR BRUCE
384.3 0.74266 0.603 16.00036 0.944 8.84675 0.963 0.87300 0.904824 0.007901 0.07691 0.924887 0.015302 0.005896 0.05055905
44 05DF003 BLACKMUDCREEK NEARELLERSLIE
647.6 1.53798 0.879 11.39977 0.83 5.39091 0.812 0.87500 0.587402 0.309922 0.045691 0.285595 0.545766 0.070427 0.07845098
45 05FA018 DRIEDMEATCREEK NEARTHE MOUTH
1151.7 0.73989 0.6 17.19396 0.96 9.47663 0.976 0.88600 0.874151 0.015275 0.098853 0.839417 0.064152 0.032025 0.05642609
46 THOMASL
THOMAS LAKENEAR VIKING
126.0 0.77628 0.635 16.40336 0.948 8.43892 0.953 0.88700 0.484786 0.37537 0.086183 0.668783 0.00094 0.289498 0.03705363
47 05FA022 PIPESTONECREEK BELOWBIGSTONECREEK
59.4 1.98978 0.957 11.84832 0.846 4.22491 0.747 0.89700 0.664064 0.031357 0.049545 0.106452 0.74676 0.09447992
48 05FA007 PIPESTONECREEK NEARMILLET
303.3 1.77384 0.938 11.35066 0.826 4.85828 0.79 0.89700 0.936525 0.011501 0.043124 0.145781 0.570145 0.143212 0.12102337
49 05FA023 BATTLE RIVERABOVEPIPESTONECREEK
951.6 1.35918 0.835 13.03445 0.878 6.32232 0.859 0.90200 0.498131 0.261992 0.177067 0.237467 0.455963 0.208878 0.09464991
50 05FC001 BATTLE RIVERNEARFORESTBURG
446.6 1.01345 0.72 14.25976 0.899 8.443 0.956 0.90600 0.75052 0.15563 0.455842 0.217778 0.273814 0.04651542
51 05FA012 PIPESTONECREEK NEARWETASKIWIN
10.9 2.04245 0.958 12.07024 0.854 4.32564 0.76 0.90800 0.653772 0.043027 0.882032 0.07111678
52 05EE005 STRETTONCREEK NEARMARWAYNE
81.9 1.15661 0.784 12.92548 0.868 7.51762 0.926 0.90900 0.951358 0.000523 0.041724 0.008001 0.855052 0.04710494
53 BIGLAKE BIG LAKE NEARST. ALBERT
416.4 0.95566 0.704 16.85481 0.953 8.49082 0.958 0.91900 0.51085 0.129505 0.220067 0.567032 0.159794 0.139979 0.12391377
54 05EE009 VERMILIONRIVER ATVEGREVILLE
36.1 0.96282 0.712 15.88966 0.942 8.87377 0.966 0.92000 0.861361 0.045531 0.519548 0.215091 0.084766 0.1771386
55 05DF006 WHITEMUDCREEK NEARELLERSLIE
270.9 1.27542 0.821 15.01036 0.913 6.91108 0.906 0.92800 0.44425 0.496928 0.55946 0.30438 0.076564 0.04198204
56 05EA001 STURGEONRIVER NEARFORTSASKATCHEWAN
697.6 0.93195 0.696 20.0605 0.979 9.09288 0.971 0.93000 0.487305 0.066632 0.38609 0.563321 0.234955 0.126324 0.07196965
57 05FA024 WEILLER CREEKNEARWETASKIWIN
235.2 1.20491 0.804 15.44044 0.934 7.20142 0.914 0.93100 0.586383 0.027267 0.355864 0.418254 0.480237 0.060659 0.03417114
58 05FA020 DRIEDMEATLAKE ATOUTFLOW
573.3 1.00084 0.715 17.51208 0.963 10.46425 0.986 0.93500 0.818194 0.080059 0.051062 0.371539 0.420349 0.128211 0.07116846
59 05DF007 WESTWHITEMUDCREEK NEARIRETON
63.9 1.56963 0.884 15.03919 0.918 6.78762 0.891 0.94600 0.476613 0.520689 0.494739 0.466048 0.001359 0.02980579
60 05EA002 STURGEONRIVER AT ST.ALBERT
9.6 1.08051 0.751 16.92494 0.956 9.85641 0.983 0.94700 0.996476
61 05EC007 REDWATERRIVER NEARVIMY
468.2 1.18349 0.797 18.27227 0.966 7.82713 0.936 0.94900 0.395593 0.007313 0.585547 0.413596 0.498482 0.007542 0.04887945

62 05FA016 COAL LAKERESERVOIRNEARWETASKIWIN
175.5 1.79266 0.941 12.93735 0.875 6.75999 0.886 0.95000 0.635338 0.26354 0.141416 0.673999 0.126241 0.0355281
63 05FA011 BATTLE RIVERAT DUHAMEL
149.6 1.12783 0.778 17.4975 0.961 10.38073 0.984 0.95500 0.588226 0.390742 0.01802 0.097625 0.71658 0.051281 0.12833953
64 BUFFALO BUFFALO LAKENEAR ERSKINE
699.5 0.9562 0.706 8.68352 0.74 4.2462 0.755 0.76300 0.136255 0.644561 0.031857 0.221589 0.394068 0.305836 0.07508539
65 05CE001 RED DEER RIVERAT DRUMHELLER
2970.2 0.95911 0.71 10.50937 0.789 5.509 0.816 0.80900 0.49603 0.46832 0.010124 0.395604 0.195688 0.352744 0.05750146
66 05FC003 MEETING CREEKNEAR THEMOUTH
206.4 0.8992 0.685 10.26284 0.779 6.33688 0.861 0.81400 0.240098 0.718222 0.292934 0.048752 0.572656 0.08259099
67 05FC006 MEETING CREEKNEAR DONALDA
474.9 1.1249 0.777 17.03466 0.958 9.71968 0.979 0.95300 0.287111 0.60057 0.0104 0.224886 0.566427 0.136784 0.06535225
68 GULLLAK GULL LAKE ATASPEN BEACH
293.6 1.36621 0.84 6.9634 0.695 2.30114 0.62 0.73800 0.29835 0.26254 0.145464 0.399444 0.33977 0.165624 0.09060892
69 05FA017 PIGEON LAKECREEK NEARTHE MOUTH
5.8 2.3003 0.971 6.54761 0.685 2.25112 0.61 0.78500 0.99679 0.860846 0.057917 0.02944578
70 05CD902 PARLBY CREEKNEAR MIRROR
352.2 1.3128 0.829 9.60054 0.759 3.50709 0.692 0.79200 0.246737 0.635084 0.065293 0.07163 0.496146 0.344182 0.08409884
71 05FA001 BATTLE RIVERNEAR PONOKA
1354.3 2.57883 0.979 10.02945 0.775 3.84977 0.719 0.85500 0.562701 0.285167 0.069267 0.120342 0.552278 0.251776 0.06812468
72 05FA008 BIGSTONECREEK NEARBIGSTONE
547.4 3.08484 0.988 10.00861 0.773 3.9664 0.727 0.86200 0.79193 0.087023 0.032826 0.092954 0.637293 0.165854 0.08154455
73 05CD001 UPPER CHAINLAKE OUTLETNEAR PONOKA
76.5 1.87193 0.947 11.4073 0.832 4.18713 0.744 0.88000 0.704518 0.2928 0.059883 0.567894 0.337459 0.02830541
74 05CD004 RED DEER RIVERNEAR NEVIS
1059.4 1.69283 0.908 13.40981 0.883 5.59108 0.817 0.91600 0.329621 0.6217 0.016284 0.023896 0.640414 0.275139 0.05738171
75 05FA015 MASKWA CREEKNO. 2 ABOVEBEARHILLS LA
30.1 3.54766 0.99 12.29459 0.861 4.58973 0.774 0.92200 0.792346 0.030633 0.142116 0.057316 0.785717 0.070257 0.07004649
76 05CE012 GHOSTPINECREEK NEARHUXLEY
512.0 1.21043 0.805 15.14935 0.928 6.98876 0.908 0.92500 0.292204 0.688373 0.007362 0.039034 0.522532 0.370243 0.0653466
77 05FA014 MASKWA CREEKNO. 1 ABOVEBEARHILLS LA
79.0 4.94751 1 12.29262 0.859 4.66328 0.779 0.92800 0.778941 0.100799 0.117578 0.022513 0.769902 0.143242 0.04001207
78 05CD007 PARLBY CREEKAT ALIX
436.3 1.5913 0.89 15.10474 0.925 6.3219 0.857 0.93600 0.470704 0.491421 0.02273 0.057756 0.722975 0.178172 0.03578075
79 05CE007 THREEHILLSCREEK NEARCARBON
557.0 0.9909 0.714 20.79526 0.987 10.59455 0.989 0.94600 0.750223 0.233706 0.008946 0.506802 0.113681 0.361991 0.01497943
80 CYGNETL
CYGNET LAKENEAR SYLVANLAKE
89.3 2.39303 0.977 13.94943 0.891 6.46481 0.867 0.95700 0.73852 0.225711 0.158888 0.404709 0.179946 0.2539777
81 05CE901 BIGELOWRESERVOIRNEARWIMBORNE
196.0 1.12165 0.767 22.03743 0.99 10.57168 0.988 0.95800 0.315251 0.618471 0.075155 0.670417 0.204056 0.04782355
82 05CE019 SHEEP COULEENEARCARSTAIRS
39.0 1.42526 0.854 19.86039 0.977 7.36075 0.923 0.96100 0.969081 0.068858 0.863384 0.06556619
83 05CE011 RENWICK CREEKNEAR THREEHILLS
58.8 1.11643 0.764 24.8242 0.995 11.40298 0.998 0.96100 0.637616 0.359911 0.471981 0.007833 0.517713
84 05CE004 ROSEBUD RIVERNEARCROSSFIELD
427.9 1.5814 0.887 18.82617 0.971 7.08117 0.909 0.96300 0.932087 0.000837 0.058065 0.157813 0.774287 0.06525322

85 05CE015 THREEHILLSCREEK NEARTROCHU
65.7 1.16088 0.785 24.10443 0.995 11.90006 0.993 0.96800 0.252353 0.745182 0.078077 0.151149 0.689371 0.07893783
86 05CC002 RED DEER RIVERAT RED DEER
1136.5 2.13597 0.965 16.6048 0.952 6.76987 0.887 0.97700 0.692064 0.128189 0.121766 0.1824 0.294131 0.450701 0.06880707
87 05CE018 THREEHILLSCREEK BELOWRAY CREEK
154.9 1.46812 0.863 19.26562 0.969 9.13007 0.97 0.97900 0.225839 0.72259 0.050769 0.829518 0.072433 0.04476979
88 05CD006 HAYNES CREEKNEAR HAYNES
166.0 1.71634 0.915 17.96417 0.961 8.12251 0.94 0.98000 0.470536 0.526841 0.063241 0.776476 0.090855 0.06447186
89 05CC012 TINDASTOLLCREEK NEARMARKERVILLE
140.7 1.95427 0.954 18.53237 0.969 8.56354 0.961 0.98600 0.886339 0.111198 0.256907 0.463887 0.224402 0.05234153
90 05CE013 LONEPINECREEK NEARLINDEN
885.9 1.76486 0.936 20.59046 0.985 8.95747 0.968 0.98800 0.754068 0.038889 0.200002 0.207843 0.003483 0.729401 0.0567344
91 05CE010 RAY CREEKNEAR INNISFAIL
44.3 1.94881 0.949 19.33206 0.971 9.49833 0.975 0.99100 0.75807 0.239183 0.861777 0.133724 0.00175315
92 05CC011 WASKASOOCREEK AT REDDEER
485.9 2.08659 0.962 20.12565 0.98 9.42327 0.974 0.99300 0.662101 0.209654 0.067108 0.11939 0.223212 0.570643 0.07553106
93 05CE016 KNEEHILLSCREEK NEARLINDEN
645.1 1.84813 0.946 22.45617 0.992 9.81428 0.981 0.99400 0.696348 0.297008 0.002674 0.064328 0.254611 0.621439 0.0554895
94 05BL006 PEKISKO CREEKAT PEKISKO
202.5 0.31751 0.358 0.48462 0.237 0.12994 0.165 0.24100 0.581644 0.026585 0.362805 0.146035 0.0993891
95 05AB037 CHAIN LAKESRESERVOIRNEAR NANTON
24.9 0.76973 0.631 0.93254 0.336 0.20305 0.217 0.38200 0.818897 0.089155 0.842286 0.00633 0.077495 0.07203199
96 05AB039 WILLOW CREEKBELOW LANECREEK
534.6 0.85409 0.672 0.97422 0.341 0.19635 0.214 0.40100 0.746382 0.087171 0.002554 0.679617 0.004327 0.114571 0.03759248
97 05BL008 HIGHWOODRIVER ATBROWN'S RANCH
152.5 0.68945 0.57 1.42777 0.39 0.40158 0.321 0.42000 0.829355 0.000955 0.024727 0.566413 9.07E-05 0.278487 0.10569218
98 05BL007 STIMSON CREEKNEAR PEKISKO
262.4 0.76799 0.628 1.50111 0.395 0.40904 0.329 0.44600 0.80193 0.055993 0.665181 0.001146 0.142588 0.05270475
99 05BL023 PEKISKO CREEKNEAR LONGVIEW
29.1 0.89991 0.687 2.20723 0.46 0.63324 0.382 0.50100 0.997978 0.578745 0.387851 0.03138233
100 05BL014 SHEEP RIVER ATBLACK DIAMOND
140.3 0.93686 0.698 2.34195 0.468 0.67323 0.394 0.51500 0.834055 0.029594 0.029142 0.637664 0.27599 0.01321197
101 05BH005 BOW RIVERNEARCOCHRANE
464.4 1.23492 0.818 3.875 0.564 0.91952 0.448 0.60500 0.439107 0.544106 0.706187 0.00733 0.215836 0.05770079
102 05BH008 BOW RIVERBELOWBEARSPAW DAM
192.0 1.43363 0.857 4.48942 0.606 1.43735 0.52 0.65500 0.514012 0.389078 0.010234 0.562094 0.020734 0.384465 0.02876349
103 05CB005 BEAVERDAMCREEK NEARCOCHRANE
46.0 1.73248 0.924 5.83981 0.661 0.962 0.456 0.68200 0.605819 0.39203 0.696849 0.087112 0.183211 0.03067751
104 05BL012 SHEEP RIVER ATOKOTOKS
393.5 1.64015 0.897 5.84848 0.665 2.14143 0.596 0.73800 0.577542 0.371923 0.017949 0.716028 0.246691 0.03336045
105 05BJ010 ELBOW RIVER ATSARCEE BRIDGE
317.5 1.70632 0.916 5.77834 0.657 2.00908 0.585 0.74100 0.699166 0.235817 0.03478 0.585994 0.007331 0.362777 0.0417749
106 05BK002 FISH CREEKNEARMIDNAPORE
164.6 1.83493 0.944 6.62077 0.687 2.41059 0.627 0.78400 0.536061 0.35285 0.479927 0.011273 0.477415 0.02797981
107 05BH004 BOW RIVER ATCALGARY
89.0 1.50419 0.876 8.04154 0.72 3.36761 0.678 0.78900 0.130167 0.155775 0.21883 0.029499 0.737151 0.00881161
108 05BL016 TONGUEFLAGCREEK NEARHIGH RIVER
266.3 1.72772 0.921 7.55182 0.711 2.87381 0.647 0.79300 0.960279 0.037649 0.651102 0.340423 0.00640225

109 05BH904 BEDDINGTONCREEK NEARCALGARY
241.8 1.45938 0.865 8.98046 0.746 3.93099 0.724 0.82000 0.410904 0.586927 0.436645 0.018501 0.453033 0.08620751
110 05BL020 SHEEP RIVERNEARALDERSYDE
71.9 2.19231 0.966 9.37608 0.754 3.70357 0.704 0.84000 0.807935 0.116831 0.004813 0.547977 0.002406 0.405462 0.03842752
111 05CB001 LITTLE REDDEER RIVERNEAR THEMOUTH
2078.5 1.75601 0.932 11.49726 0.835 3.78857 0.715 0.85800 0.542478 0.339555 0.039743 0.266213 0.189869 0.408691 0.08784509
112 05BJ005 ELBOW RIVERABOVEGLENMORE DAM
34.0 1.90925 0.949 10.4552 0.787 4.39939 0.765 0.87000 0.299345 0.149696 0.281457 0.698475 0.01798896
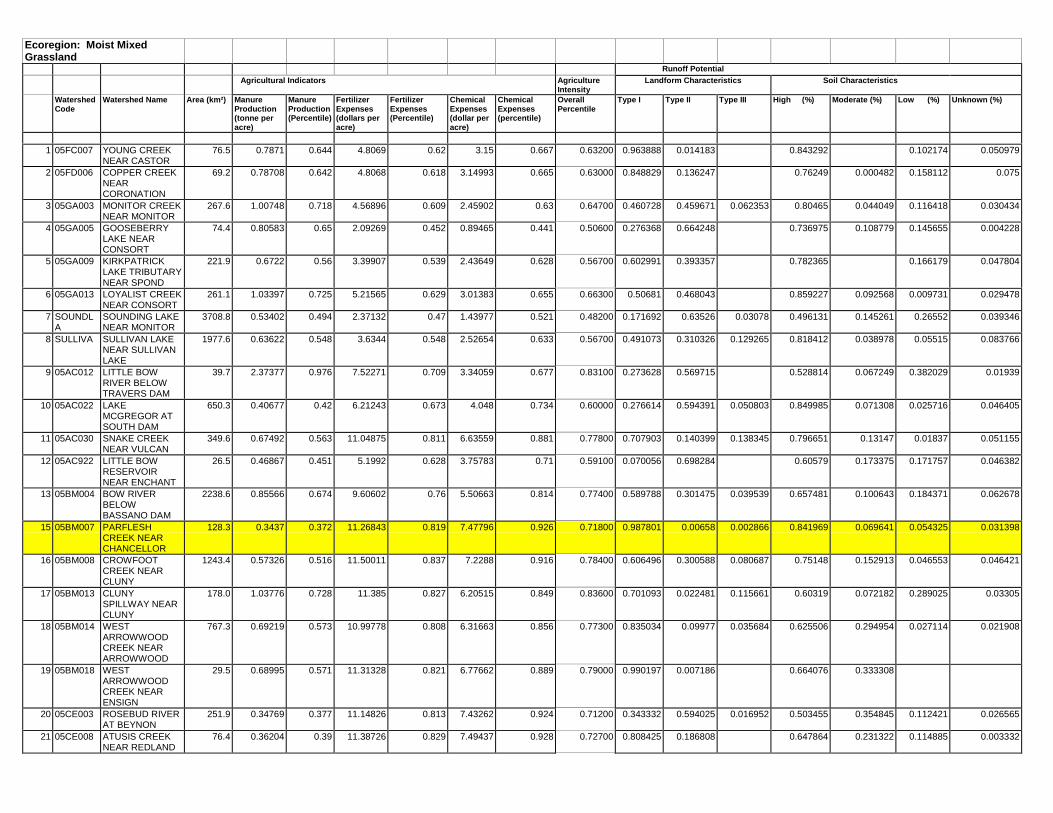
Ecoregion: Moist MixedGrassland
Runoff PotentialAgricultural Indicators Agriculture
IntensityLandform Characteristics Soil Characteristics
WatershedCode
Watershed Name Area (km²) ManureProduction(tonne peracre)
ManureProduction(Percentile)
FertilizerExpenses(dollars peracre)
FertilizerExpenses(Percentile)
ChemicalExpenses(dollar peracre)
ChemicalExpenses(percentile)
OverallPercentile
Type I Type II Type III High (%) Moderate (%) Low (%) Unknown (%)
1 05FC007 YOUNG CREEKNEAR CASTOR
76.5 0.7871 0.644 4.8069 0.62 3.15 0.667 0.63200 0.963888 0.014183 0.843292 0.102174 0.050979
2 05FD006 COPPER CREEKNEARCORONATION
69.2 0.78708 0.642 4.8068 0.618 3.14993 0.665 0.63000 0.848829 0.136247 0.76249 0.000482 0.158112 0.075
3 05GA003 MONITOR CREEKNEAR MONITOR
267.6 1.00748 0.718 4.56896 0.609 2.45902 0.63 0.64700 0.460728 0.459671 0.062353 0.80465 0.044049 0.116418 0.030434
4 05GA005 GOOSEBERRYLAKE NEARCONSORT
74.4 0.80583 0.65 2.09269 0.452 0.89465 0.441 0.50600 0.276368 0.664248 0.736975 0.108779 0.145655 0.004228
5 05GA009 KIRKPATRICKLAKE TRIBUTARYNEAR SPOND
221.9 0.6722 0.56 3.39907 0.539 2.43649 0.628 0.56700 0.602991 0.393357 0.782365 0.166179 0.047804
6 05GA013 LOYALIST CREEKNEAR CONSORT
261.1 1.03397 0.725 5.21565 0.629 3.01383 0.655 0.66300 0.50681 0.468043 0.859227 0.092568 0.009731 0.029478
7 SOUNDLA
SOUNDING LAKENEAR MONITOR
3708.8 0.53402 0.494 2.37132 0.47 1.43977 0.521 0.48200 0.171692 0.63526 0.03078 0.496131 0.145261 0.26552 0.039346
8 SULLIVA SULLIVAN LAKENEAR SULLIVANLAKE
1977.6 0.63622 0.548 3.6344 0.548 2.52654 0.633 0.56700 0.491073 0.310326 0.129265 0.818412 0.038978 0.05515 0.083766
9 05AC012 LITTLE BOWRIVER BELOWTRAVERS DAM
39.7 2.37377 0.976 7.52271 0.709 3.34059 0.677 0.83100 0.273628 0.569715 0.528814 0.067249 0.382029 0.01939
10 05AC022 LAKEMCGREGOR ATSOUTH DAM
650.3 0.40677 0.42 6.21243 0.673 4.048 0.734 0.60000 0.276614 0.594391 0.050803 0.849985 0.071308 0.025716 0.046405
11 05AC030 SNAKE CREEKNEAR VULCAN
349.6 0.67492 0.563 11.04875 0.811 6.63559 0.881 0.77800 0.707903 0.140399 0.138345 0.796651 0.13147 0.01837 0.051155
12 05AC922 LITTLE BOWRESERVOIRNEAR ENCHANT
26.5 0.46867 0.451 5.1992 0.628 3.75783 0.71 0.59100 0.070056 0.698284 0.60579 0.173375 0.171757 0.046382
13 05BM004 BOW RIVERBELOWBASSANO DAM
2238.6 0.85566 0.674 9.60602 0.76 5.50663 0.814 0.77400 0.589788 0.301475 0.039539 0.657481 0.100643 0.184371 0.062678
15 05BM007 PARFLESHCREEK NEARCHANCELLOR
128.3 0.3437 0.372 11.26843 0.819 7.47796 0.926 0.71800 0.987801 0.00658 0.002866 0.841969 0.069641 0.054325 0.031398
16 05BM008 CROWFOOTCREEK NEARCLUNY
1243.4 0.57326 0.516 11.50011 0.837 7.2288 0.916 0.78400 0.606496 0.300588 0.080687 0.75148 0.152913 0.046553 0.046421
17 05BM013 CLUNYSPILLWAY NEARCLUNY
178.0 1.03776 0.728 11.385 0.827 6.20515 0.849 0.83600 0.701093 0.022481 0.115661 0.60319 0.072182 0.289025 0.03305
18 05BM014 WESTARROWWOODCREEK NEARARROWWOOD
767.3 0.69219 0.573 10.99778 0.808 6.31663 0.856 0.77300 0.835034 0.09977 0.035684 0.625506 0.294954 0.027114 0.021908
19 05BM018 WESTARROWWOODCREEK NEARENSIGN
29.5 0.68995 0.571 11.31328 0.821 6.77662 0.889 0.79000 0.990197 0.007186 0.664076 0.333308
20 05CE003 ROSEBUD RIVERAT BEYNON
251.9 0.34769 0.377 11.14826 0.813 7.43262 0.924 0.71200 0.343332 0.594025 0.016952 0.503455 0.354845 0.112421 0.026565
21 05CE008 ATUSIS CREEKNEAR REDLAND
76.4 0.36204 0.39 11.38726 0.829 7.49437 0.928 0.72700 0.808425 0.186808 0.647864 0.231322 0.114885 0.003332

22 05CE009 SEVERN CREEKNEAR ROSEBUD
158.0 0.35792 0.385 10.92943 0.807 7.34636 0.921 0.71000 0.49702 0.473144 0.027186 0.322194 0.558669 0.104298 0.012189
23 05CE020 MICHICHI CREEKAT DRUMHELLER
1167.7 0.42931 0.431 10.06545 0.776 5.99326 0.839 0.67400 0.503968 0.471206 0.015345 0.698893 0.163818 0.075419 0.057089
24 05CG002 BULLPOUNDCREEK NEARHANNA
12.7 0.51599 0.483 2.92192 0.507 2.60857 0.635 0.53600 0.035756 0.877793 0.786293 0.115787 0.024357 0.064365
25 05CG004 BULLPOUNDCREEK NEARWATTS
199.9 0.5938 0.529 6.44911 0.682 4.23472 0.749 0.64400 0.242317 0.682105 0.619555 0.090585 0.256427 0.026599
26 05CG005 ATLAS MINECOULEE ATWESTERNMONARCH
51.3 0.35819 0.387 10.91411 0.805 7.33683 0.919 0.70900 0.2942 0.702898 0.54704 0.24832 0.122788 0.075773
27 05CG006 FISH CREEKABOVE LITTLEFISH LAKE
117.7 0.69409 0.575 3.89066 0.566 1.55369 0.54 0.54800 0.858012 0.123597 0.015296 0.772982 0.099277 0.110712 0.013933
28 DOWLING
DOWLING LAKENEAR DOWLING
1179.9 0.56228 0.507 5.47988 0.641 3.92844 0.722 0.61300 0.364357 0.52873 0.025846 0.641094 0.123471 0.167198 0.063285
29 05AB002 WILLOW CREEKNEAR NOLAN
98.6 2.71718 0.981 10.6886 0.8 4.14398 0.737 0.87600 0.807032 0.076538 0.107475 0.674319 0.18015 0.138128 0.005242
30 05AB007 OLDMAN RIVERNEAR FORTMACLEOD
168.4 1.24686 0.819 6.89801 0.692 2.16101 0.598 0.71900 0.486525 0.211277 0.143894 0.491789 0.225138 0.255367 0.025689
31 05AB015 WILLOW CREEKNEAR GRANUM
277.8 2.97408 0.985 10.59698 0.794 4.3022 0.759 0.88900 0.760212 0.02669 0.171715 0.575868 0.134607 0.258816 0.028608
32 05AC003 LITTLE BOWRIVER ATCARMANGAY
1077.8 1.39481 0.846 11.34843 0.824 5.92943 0.834 0.86400 0.729057 0.082613 0.166594 0.545532 0.102356 0.303127 0.046792
33 05AC006 KEHO LAKERESERVOIRNEAR ALBIONRIDGE
77.4 4.34654 0.993 15.16666 0.929 6.60235 0.877 0.97200 0.737359 0.032499 0.021559 0.943364 0.032313 0.018155 0.003833
34 05AC023 LITTLE BOWRIVER NEAR THEMOUTH
544.3 3.06898 0.987 11.22347 0.816 5.02581 0.804 0.91400 0.398596 0.391302 0.163018 0.710981 0.06899 0.204086 0.013446
35 05AC032 CLEAR LAKENEAR STAVELY
163.4 4.10369 0.992 14.70567 0.909 6.51178 0.872 0.96600 0.614838 0.245999 0.122839 0.596641 0.156189 0.193208 0.051835
36 05AC033 CLEAR BROOKNEAR STAVELY
180.7 4.3536 0.995 15.17315 0.931 6.60294 0.879 0.97400 0.780642 0.086198 0.13101 0.813152 0.130785 0.035295 0.018617
37 05AC921 TRAVERSRESERVOIRNEAR ENCHANT
1555.4 2.32213 0.974 12.1692 0.856 6.03088 0.841 0.93800 0.676296 0.087662 0.192351 0.732957 0.067933 0.16104 0.035746
38 05AD007 OLDMAN RIVERNEARLETHBRIDGE
1437.6 1.23005 0.812 10.8157 0.803 3.60777 0.695 0.81100 0.523857 0.210426 0.150637 0.68952 0.073565 0.216714 0.017976
39 05AD019 OLDMAN RIVERNEAR MONARCH
822.8 2.72788 0.982 11.46856 0.834 4.2433 0.752 0.90500 0.726556 0.056149 0.112836 0.634647 0.169538 0.170639 0.023054
40 05AD034 NOLAN COULEENEAR COALDALE
114.1 4.89177 0.998 31.20619 1 16.00435 0.998 0.99900 0.383846 0.579254 0.946317 0.001307 0.043842 0.006093
41 05AE016 POTHOLE CREEKAT RUSSELL'SRANCH
71.7 2.04666 0.96 21.21646 0.988 8.35104 0.949 0.99000 0.928497 0.001869 0.063856 0.735653 0.065486 0.196283 0.000187
42 05AE042 NINE MILECOULEE NEARLETHBRIDGE
158.7 1.69397 0.909 18.32933 0.968 7.26454 0.918 0.97100 0.446398 0.29891 0.252267 0.854938 0.092961 0.029918 0.019758
43 05AF029 STIRLING LAKEOUTFLOW NEARSTIRLING
410.1 1.76469 0.935 19.76741 0.976 7.9211 0.941 0.98300 0.633842 0.189901 0.15225 0.908153 0.013201 0.041618 0.034566
44 05AG008 BOUNTIFULCOULEE NEARCRANFORD
795.2 2.77913 0.984 22.64921 0.993 11.99432 0.994 0.99600 0.536819 0.139267 0.287021 0.830206 0.119726 0.027299 0.020023
45 11AA004 MILK RIVER ATMACKIE'S RANCH
142.2 0.44813 0.44 2.55553 0.488 1.13499 0.476 0.46400 0.292157 0.523316 0.312758 0.375111 0.008622 0.118982

46 11AA005 MILK RIVER ATMILK RIVER
421.6 0.42996 0.432 2.52393 0.483 1.10719 0.473 0.45600 0.184077 0.801347 0.003922 0.193112 0.521712 0.186528 0.093015
47 11AA039 VERDIGRIS LAKETRIBUTARYNEAR MILKRIVER
72.7 0.61611 0.537 6.77033 0.69 3.05113 0.657 0.61900 0.32421 0.673145 0.919566 0.046796 0.024933 0.00606
48 TYRELLL TYRRELL LAKENEAR WARNER
465.3 0.89861 0.684 11.34437 0.822 4.7189 0.78 0.79800 0.571429 0.370103 0.038221 0.800117 0.111551 0.065483 0.020258
49 BATTERSEA
BATTERSEADRAIN
71.1 4.35207 0.992 15.17856 0.927 6.60639 0.875 0.97700
50 CROWFOOT
CROWFOOTCREEK
1079.0 0.60476 0.532 11.7021 0.838 7.26545 0.915 0.80000
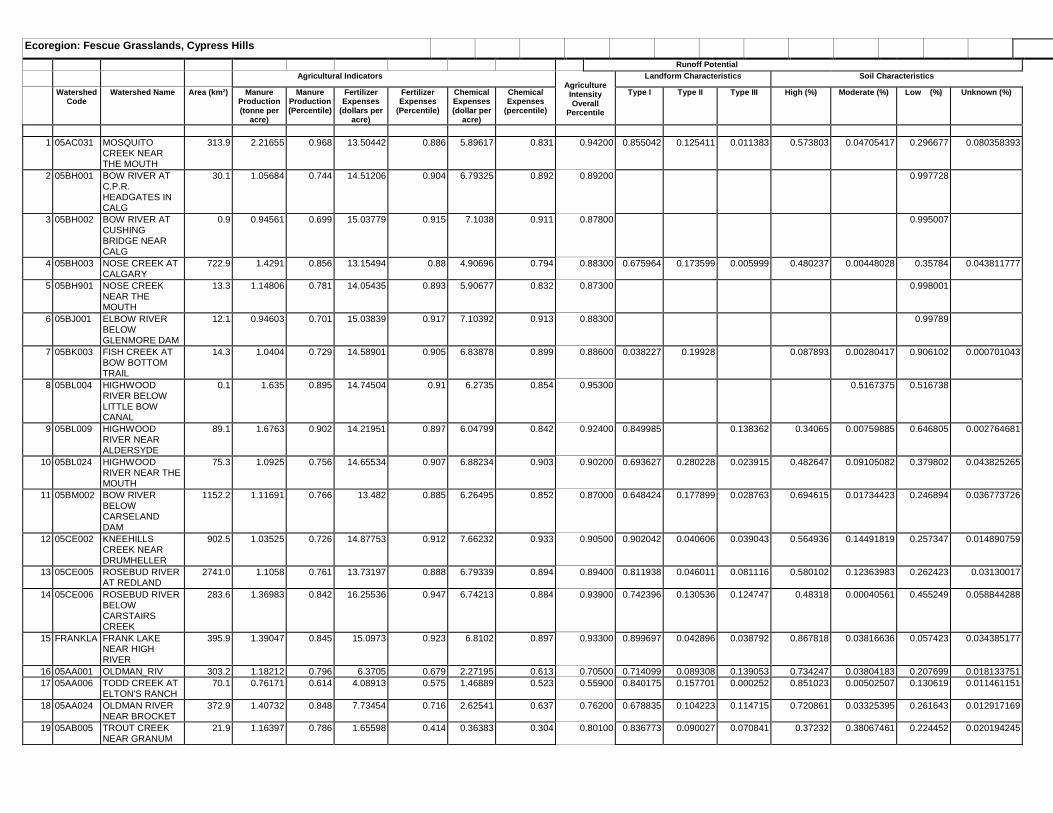
Ecoregion: Fescue Grasslands, Cypress HillsRunoff Potential
Agricultural Indicators Landform Characteristics Soil Characteristics
WatershedCode
Watershed Name Area (km²) ManureProduction(tonne per
acre)
ManureProduction(Percentile)
FertilizerExpenses
(dollars peracre)
FertilizerExpenses
(Percentile)
ChemicalExpenses(dollar per
acre)
ChemicalExpenses
(percentile)
AgricultureIntensityOverall
Percentile
Type I Type II Type III High (%) Moderate (%) Low (%) Unknown (%)
1 05AC031 MOSQUITOCREEK NEARTHE MOUTH
313.9 2.21655 0.968 13.50442 0.886 5.89617 0.831 0.94200 0.855042 0.125411 0.011383 0.573803 0.04705417 0.296677 0.080358393
2 05BH001 BOW RIVER ATC.P.R.HEADGATES INCALG
30.1 1.05684 0.744 14.51206 0.904 6.79325 0.892 0.89200 0.997728
3 05BH002 BOW RIVER ATCUSHINGBRIDGE NEARCALG
0.9 0.94561 0.699 15.03779 0.915 7.1038 0.911 0.87800 0.995007
4 05BH003 NOSE CREEK ATCALGARY
722.9 1.4291 0.856 13.15494 0.88 4.90696 0.794 0.88300 0.675964 0.173599 0.005999 0.480237 0.00448028 0.35784 0.043811777
5 05BH901 NOSE CREEKNEAR THEMOUTH
13.3 1.14806 0.781 14.05435 0.893 5.90677 0.832 0.87300 0.998001
6 05BJ001 ELBOW RIVERBELOWGLENMORE DAM
12.1 0.94603 0.701 15.03839 0.917 7.10392 0.913 0.88300 0.99789
7 05BK003 FISH CREEK ATBOW BOTTOMTRAIL
14.3 1.0404 0.729 14.58901 0.905 6.83878 0.899 0.88600 0.038227 0.19928 0.087893 0.00280417 0.906102 0.000701043
8 05BL004 HIGHWOODRIVER BELOWLITTLE BOWCANAL
0.1 1.635 0.895 14.74504 0.91 6.2735 0.854 0.95300 0.5167375 0.516738
9 05BL009 HIGHWOODRIVER NEARALDERSYDE
89.1 1.6763 0.902 14.21951 0.897 6.04799 0.842 0.92400 0.849985 0.138362 0.34065 0.00759885 0.646805 0.002764681
10 05BL024 HIGHWOODRIVER NEAR THEMOUTH
75.3 1.0925 0.756 14.65534 0.907 6.88234 0.903 0.90200 0.693627 0.280228 0.023915 0.482647 0.09105082 0.379802 0.043825265
11 05BM002 BOW RIVERBELOWCARSELANDDAM
1152.2 1.11691 0.766 13.482 0.885 6.26495 0.852 0.87000 0.648424 0.177899 0.028763 0.694615 0.01734423 0.246894 0.036773726
12 05CE002 KNEEHILLSCREEK NEARDRUMHELLER
902.5 1.03525 0.726 14.87753 0.912 7.66232 0.933 0.90500 0.902042 0.040606 0.039043 0.564936 0.14491819 0.257347 0.014890759
13 05CE005 ROSEBUD RIVERAT REDLAND
2741.0 1.1058 0.761 13.73197 0.888 6.79339 0.894 0.89400 0.811938 0.046011 0.081116 0.580102 0.12363983 0.262423 0.03130017
14 05CE006 ROSEBUD RIVERBELOWCARSTAIRSCREEK
283.6 1.36983 0.842 16.25536 0.947 6.74213 0.884 0.93900 0.742396 0.130536 0.124747 0.48318 0.00040561 0.455249 0.058844288
15 FRANKLA FRANK LAKENEAR HIGHRIVER
395.9 1.39047 0.845 15.0973 0.923 6.8102 0.897 0.93300 0.899697 0.042896 0.038792 0.867818 0.03816636 0.057423 0.034385177
16 05AA001 OLDMAN_RIV 303.2 1.18212 0.796 6.3705 0.679 2.27195 0.613 0.70500 0.714099 0.089308 0.139053 0.734247 0.03804183 0.207699 0.01813375117 05AA006 TODD CREEK AT
ELTON'S RANCH70.1 0.76171 0.614 4.08913 0.575 1.46889 0.523 0.55900 0.840175 0.157701 0.000252 0.851023 0.00502507 0.130619 0.011461151
18 05AA024 OLDMAN RIVERNEAR BROCKET
372.9 1.40732 0.848 7.73454 0.716 2.62541 0.637 0.76200 0.678835 0.104223 0.114715 0.720861 0.03325395 0.261643 0.012917169
19 05AB005 TROUT CREEKNEAR GRANUM
21.9 1.16397 0.786 1.65598 0.414 0.36383 0.304 0.80100 0.836773 0.090027 0.070841 0.37232 0.38067461 0.224452 0.020194245

20 05AB006 MEADOW CREEKAT HART'SRANCH
101.6 1.28557 0.824 3.22527 0.526 0.82098 0.418 0.53400 0.926833 0.060643 0.010528 0.874295 0.02484936 0.074625 0.024233557
21 05AB012 OLDMAN RIVERAT CANALINTAKE
780.1 1.41938 0.851 8.09498 0.722 2.87944 0.648 0.77000 0.630412 0.207476 0.101213 0.815349 0.03884414 0.126575 0.017319811
22 05AB013 BEAVER CREEKNEAR BROCKET
202.3 1.19517 0.8 2.37209 0.472 0.4757 0.361 0.54400 0.855337 0.130432 0.005005 0.862061 0.0239349 0.070215 0.041841051
23 05AB014 FIVE MILE CREEKNEAR SPRINGPOINT
53.1 1.16842 0.791 1.93053 0.441 0.37669 0.316 0.50800 0.998091 0.81813 0.153152 0.026810123
24 05AB021 WILLOW CREEKNEARCLARESHOLM
424.9 1.80331 0.943 4.43953 0.601 1.65409 0.56 0.71600 0.671923 0.290585 0.035451 0.72073 0.0857241 0.158958 0.032547172
25 05AB029 MEADOW CREEKNEAR THEMOUTH
28.5 1.28557 0.824 3.22527 0.526 0.82098 0.418 0.75400 0.560304 0.180968 0.256217 0.534283 0.43020224 0.008588 0.024416893
26 05AB038 KYISKAP CREEKNEAR GRANUM
188.5 1.42009 0.853 4.64193 0.614 1.33235 0.508 0.65200 0.560453 0.346103 0.091419 0.832021 0.10970714 0.047302 0.008944647
27 05AC001 MOSQUITOCREEK NEARNANTON
522.4 1.68113 0.905 5.64499 0.647 2.04874 0.59 0.72900 0.756699 0.238828 0.002436 0.733245 0.02475375 0.223681 0.016283189
28 05AC002 NANTON CREEKNEAR NANTON
119.0 1.58774 0.889 4.20637 0.58 1.4792 0.525 0.66000 0.630478 0.367462 0.652879 0.02000362 0.309631 0.015426464
29 05AD002 BELLY RIVERNEAR STANDOFF
431.8 0.89487 0.68 9.66409 0.762 3.68126 0.7 0.73200 0.749123 0.112442 0.112821 0.79332 0.0235352 0.159127 0.021990838
30 05AD008 WATERTONRIVER NEARSTAND OFF
103.5 1.17124 0.793 14.18855 0.894 5.1094 0.806 0.86200 0.541826 0.108253 0.347949 0.747858 0.0192802 0.229951 0.000938331
31 05AD018 BULLHORNCOULEE NEARCARDSTON
118.1 1.73528 0.928 4.28202 0.591 1.59865 0.548 0.69600 0.440074 0.509183 0.899027 0.058938 0.040046143
32 05AD026 WATERTONRESERVOIR
312.0 1.33432 0.832 3.05059 0.516 1.21867 0.494 0.61000 0.34757 0.502185 0.012434 0.60687 0.00034396 0.242522 0.038474735
33 05AD028 WATERTONRIVER NEARGLENWOOD
226.5 1.4577 0.864 11.54081 0.84 4.34304 0.762 0.85000 0.610766 0.127741 0.215371 0.767644 0.01669909 0.204991 0.008646598
34 05AD035 PRAIRIE BLOODCOULEE NEARLETHBRIDGE
225.6 0.20752 0.274 3.8243 0.548 0.84256 0.42 0.40200 0.535476 0.183887 0.278494 0.802439 0.07870574 0.078158 0.038554359
35 05AD041 BELLY RIVERNEARGLENWOOD
280.6 1.45205 0.862 6.92955 0.693 2.62971 0.638 0.75600 0.38068 0.367903 0.11014 0.734648 0.00075311 0.216463 0.04624754
36 05AD901 FOOTHILLSCREEK NEARPINCHER CREEK
132.3 1.47716 0.872 3.35095 0.535 1.34799 0.511 0.62800 0.427855 0.55778 0.008748 0.840414 0.00160445 0.085142 0.070986481
37 05AE002 LEE CREEK ATCARDSTON
77.0 1.62141 0.894 5.63431 0.644 2.12432 0.593 0.72100 0.633778 0.301354 0.791083 0.00934132 0.189812 0.007820877
38 05AE006 ST. MARY RIVERNEARLETHBRIDGE
209.4 0.48306 0.466 5.62678 0.642 2.17037 0.6 0.55600 0.647427 0.055558 0.016677 0.588385 0.08223041 0.307076 0.017166022
39 05AE008 LEE CREEK ATLAYTON'SRANCH
54.9 1.73531 0.93 4.28207 0.593 1.59867 0.55 0.69100 0.645631 0.352371 0.804371 0.00066859 0.17352 0.019443221
40 05AE009 PINEPOUNDCREEK NEARSPRING COULEE
206.8 0.79163 0.647 11.64619 0.843 4.45095 0.769 0.78100 0.313169 0.684693 0.849219 0.04390905 0.039038 0.065696497
41 05AE011 POTHOLE CREEKNEAR MAGRATH
45.5 0.8319 0.66 12.64198 0.87 4.84203 0.787 0.81200 0.581213 0.416447 0.723517 0.19265834 0.077539 0.003945146
42 05AE012 POTHOLE CREEKNEAR MAGRATH(LOWER STA
166.2 1.22453 0.81 15.79653 0.94 6.12471 0.847 0.91300 0.543809 0.406082 0.012146 0.85861 0.061983 0.074885 2.26676E-05

43 05AE020 ROLPH CREEKNEARTAYLORVILLE
29.1 0.77937 0.638 5.8668 0.666 2.2404 0.607 0.62500 0.248289 0.359343 0.382607 0.00082046 0.196835 0.008808767
44 05AE025 ST. MARYRESERVOIRNEAR SPRINGCOULEE
511.0 0.83763 0.666 8.25776 0.725 3.21572 0.672 0.69000 0.457359 0.327151 0.014588 0.77996 0.01278772 0.15651 0.026990336
45 05AE041 DRY COULEENEAR MAGRATH
54.9 1.36255 0.837 15.1225 0.926 5.95096 0.836 0.91100 0.79071 0.206199 0.000809 0.800632 0.13695497 0.044605
46 05AE912 AETNA CREEKAT HIGHWAY NO.501
33.5 1.73518 0.927 4.28284 0.594 1.59897 0.551 0.69600 0.652864 0.345063 0.9519 0.03424438 0.00964 0.002142321
47 05BL003 HIGHWOODRIVER AT HIGHRIVER
289.1 1.41232 0.849 6.28453 0.674 2.36792 0.623 0.73500 0.81909 0.08408 0.570139 0.03772244 0.36222 0.027870127
48 05AE005 ROLPH CREEKNEAR KIMBALL
105.7 0.73101 0.595 10.4082 0.783 3.9688 0.729 0.71600 0.258934 0.706111 0.849434 0.01875515 0.042202 0.051994842
49 05AE024 POTHOLECOULEERESERVOIRNEAR MAGRATH
325.8 0.55108 0.5 5.69679 0.653 2.11444 0.591 0.57300 0.41969 0.559145 0.82085 0.03832474 0.114594 0.023981193
50 05AF030 MILK RIVERRIDGERESERVOIR
180.3 0.83164 0.658 9.88486 0.771 4.01035 0.73 0.74500 0.177684 0.738819 0.755383 0.17903488 0.039913 0.023202867
51 11AA003 NORTH BRANCHOF MILK RIVERNEAR MACKIE'SRANCH
486.2 0.50233 0.473 4.24002 0.585 1.62003 0.555 0.53000 0.181394 0.788317 0.00506 0.457655 0.24166902 0.183396 0.095146637
52 05AF010 MANYBERRIESCREEK ATBRODIN'S FARM
338.3 0.40202 0.417 0.89215 0.33 0.45172 0.349 0.36000 0.679616 0.296406 0.019747 0.842287 0.0349115 0.100203 0.018368154
53 05AH002 MACKAY CREEKAT WALSH
65.0 0.45893 0.447 1.525 0.4 0.75294 0.403 0.40900 0.718499 0.133964 0.044183 0.62093 0.12051535 0.107952 0.038657719
54 05AH003 ROSS CREEKNEAR IRVINE
345.0 0.71605 0.586 4.42091 0.599 3.20939 0.67 0.61100 0.563417 0.287302 0.14476 0.752375 0.07092875 0.150087 0.022088187
55 05AH006 MACKAY CREEKAT GRANT'SRANCH
170.5 0.55481 0.503 3.03998 0.513 2.13213 0.595 0.53000 0.566028 0.198352 0.011393 0.637334 0.04702155 0.076219 0.015198877
56 05AH007 MCALPINECREEK ATSCHNELL'SRANCH
104.9 0.7637 0.616 4.97229 0.625 3.70759 0.705 0.64100 0.623129 0.344866 0.027254 0.786216 0.07042209 0.072893 0.065718034
57 05AH009 GROS VENTRECREEK ATTOTHILL'SRANCH
94.2 0.55584 0.505 2.38793 0.473 1.70982 0.563 0.50000 0.531999 0.463521 0.779812 0.12175731 0.052731 0.041220237
58 05AH010 BULLSHEADCREEK ATCLARK'S RANCH
205.7 0.62556 0.541 3.16363 0.521 2.30011 0.618 0.55200 0.664211 0.320155 0.008544 0.730496 0.14402333 0.088676 0.032416557
59 05AH013 BULLSHEADCREEK NEARWOOLCHESTER
111.3 0.77355 0.633 5.26291 0.633 3.93109 0.725 0.65700 0.81917 0.176634 0.825983 0.05402278 0.110293 0.00550462
60 05AH036 ROSS CREEK ATKOENIG'SRANCH
59.3 0.56466 0.508 2.42672 0.478 1.71585 0.565 0.50300 0.475394 0.476223 0.043778 0.679479 0.08889958 0.156394 0.070622017
61 05AH037 GROS VENTRECREEK NEARDUNMORE
121.2 0.83326 0.661 5.83286 0.658 4.37345 0.764 0.69800 0.614026 0.381586 0.789283 0.05702625 0.102997 0.046304976
62 05AH038 PARADISECREEK NEARSEVEN PERSONS
223.7 0.71991 0.589 4.57024 0.61 3.28618 0.675 0.61700 0.594576 0.366348 0.035037 0.829241 0.05337127 0.097172 0.014929355
63 05AH041 PEIGAN CREEKNEAR PAKOWKIROAD
438.2 0.47198 0.456 1.32848 0.381 0.79316 0.414 0.40900 0.457618 0.513215 0.025044 0.852114 0.03382694 0.091039 0.018621792

64 05AH042 MACKAY CREEKNEAR GRABURNGAP
77.0 0.45696 0.443 0.66871 0.291 0.16567 0.195 0.30300 0.548119 0.447085 0.658603 0.14617458 0.177304 0.013123011
65 05AH043 EAST MCALPINECREEK NEARELKWATER LAK
20.1 0.76857 0.63 5.22724 0.631 4.01185 0.732 0.65800 0.35041 0.644737 0.910704 0.01674712 0.067695575
66 05AH046 ROSS CREEK ATOUTLET OFELKWATER LAKE
28.8 0.39467 0.412 0.6722 0.295 0.1188 0.16 0.28300 0.871681 0.017087 0.329838 0.55083149 0.112378 0.002399398
67 11AB007 LODGE CREEKAT HARTT'SRANCH
127.2 0.45975 0.448 0.79891 0.314 0.13431 0.17 0.30700 0.990926 0.004557 0.387117 0.32394202 0.265273 0.019150457
68 11AB009 MIDDLE CREEKNEAR THESASKATCHEWANBOUNDARY
244.5 0.41819 0.426 0.77604 0.311 0.16414 0.19 0.30000 0.80709 0.160644 0.027556 0.510907 0.28953001 0.148608 0.040523437
69 11AB023 LODGE CREEKAT HESTER'SRANCH
215.6 0.23741 0.293 0.64389 0.282 0.28654 0.269 0.27400 0.63982 0.274625 0.041541 0.64636 0.06086449 0.24399 0.004771194
70 11AB063 THELMA CREEKAT ENGLISH'SRANCH
33.0 0.00652 0.061 0.01133 0.041 0.0019 0.021 0.05100 0.995532 0.397666 0.47225191 0.099002 0.026612317
71 11AB080 66.6 0.29303 0.344 0.5092 0.245 0.0856 0.127 0.22800 0.374133 0.29341 0.389977 0.15489139 0.111266 0.01140948172 11AB090 REESOR
RESERVOIRNEAR ELKWATER
3.7 0.56697 0.511 0.98523 0.347 0.16563 0.193 0.35200 0.988874 0.005179 0.135443 0.32423787 0.508511 0.025861183
73 11AB091 MICHELRESERVOIRNEAR ELKWATER
23.0 0.4784 0.462 0.7004 0.301 0.17336 0.205 0.32100 0.802093 0.193111 0.505842 0.22813407 0.260509 0.00071864
74 11AB092 GREASEWOODRESERVOIRNEAR ELKWATER
9.6 0.50929 0.477 0.79976 0.315 0.17066 0.202 0.33000 0.99584 0.973345 0.02171507 0.000639 0.000141937
75 11AB093 YEASTRESERVOIRNEAR ELKWATER
2.6 0.56691 0.51 0.98513 0.346 0.16562 0.192 0.34900 0.993725 0.676006 0.317718
76 11AB094 BARE CREEKRESERVOIRNEAR ELKWATER
24.2 0.40208 0.418 0.50608 0.244 0.22025 0.23 0.28900 0.873894 0.121778 0.847717 0.0604319 0.086621 0.000903423
77 11AB099 MITCHELLRESERVOIRNEAR ELKWATER
60.5 0.52019 0.484 0.90393 0.331 0.15196 0.18 0.33200 0.984497 0.007875 0.467833 0.41295687 0.0702 0.040808133
78 11AB104 MASSYRESERVOIRNEAR ELKWATER
13.2 0.5517 0.502 0.93615 0.338 0.16696 0.198 0.34700 0.995453 0.453262 0.25134799 0.239344 0.051498419
79 11AB111 GRABURNCREEK NEARTHE MOUTH
41.8 0 0 0 0 0 0 0.00000 0.995214 0.710107 0.27408262 0.009921 0.00110237
80 11AB117 65.3 0.06531 0.173 0.11349 0.127 0.01908 0.06 0.13700 0.987119 0.620012 0.2516257 0.10749 0.00799152981 11AB902 LODGE CREEK
AT HIGHWAY NO.41
81.5 0.5475 0.499 0.97674 0.342 0.20989 0.227 0.35500 0.908126 0.074735 0.012678 0.423603 0.20420099 0.333984 0.033751582
82 MEADOW MEADOW CREEK 130.1 1.28549 0.816 3.22508 0.506 0.82093 0.396 0.5820083 TROUT TROUT CREEK 440.2 1.16396 0.788 1.65597 0.397 0.36382 0.264 0.4870084 WILLOW UPPER WILLOW
CREEK65.2 0.1014 0.205 0.15181 0.147 0.0406 0.088 0.15700
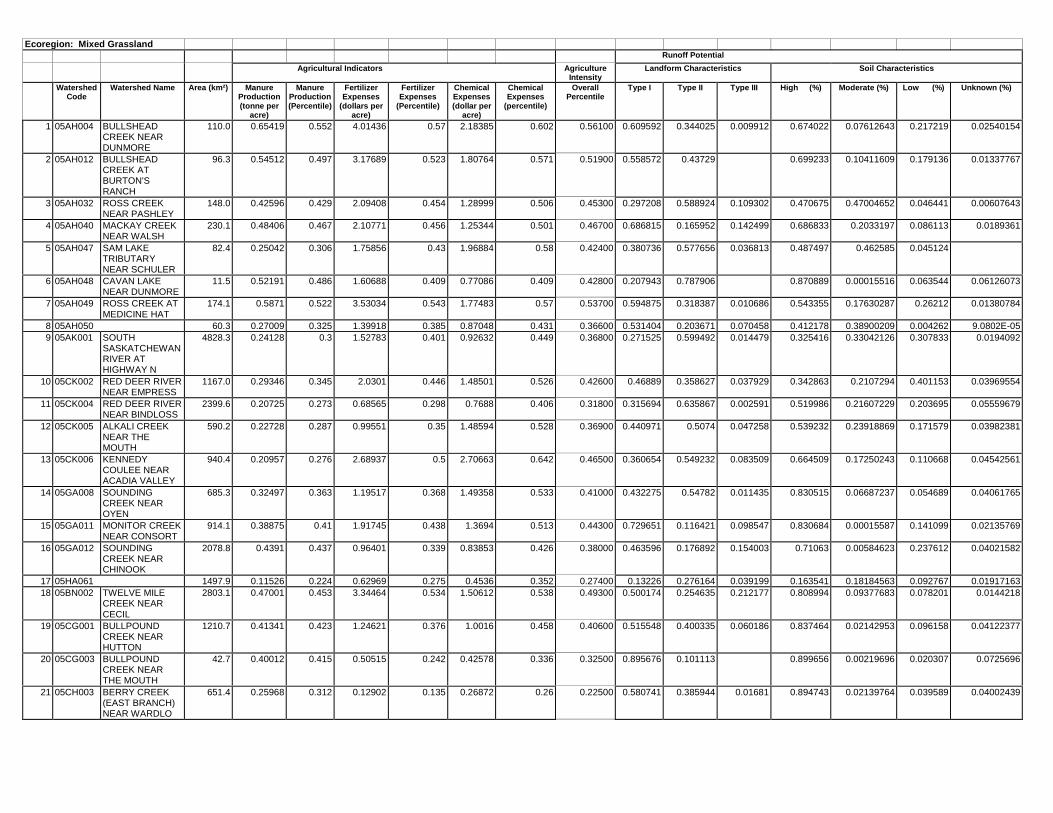
Ecoregion: Mixed GrasslandRunoff Potential
Agricultural Indicators AgricultureIntensity
Landform Characteristics Soil Characteristics
WatershedCode
Watershed Name Area (km²) ManureProduction(tonne per
acre)
ManureProduction(Percentile)
FertilizerExpenses
(dollars peracre)
FertilizerExpenses
(Percentile)
ChemicalExpenses(dollar per
acre)
ChemicalExpenses
(percentile)
OverallPercentile
Type I Type II Type III High (%) Moderate (%) Low (%) Unknown (%)
1 05AH004 BULLSHEADCREEK NEARDUNMORE
110.0 0.65419 0.552 4.01436 0.57 2.18385 0.602 0.56100 0.609592 0.344025 0.009912 0.674022 0.07612643 0.217219 0.02540154
2 05AH012 BULLSHEADCREEK ATBURTON'SRANCH
96.3 0.54512 0.497 3.17689 0.523 1.80764 0.571 0.51900 0.558572 0.43729 0.699233 0.10411609 0.179136 0.01337767
3 05AH032 ROSS CREEKNEAR PASHLEY
148.0 0.42596 0.429 2.09408 0.454 1.28999 0.506 0.45300 0.297208 0.588924 0.109302 0.470675 0.47004652 0.046441 0.00607643
4 05AH040 MACKAY CREEKNEAR WALSH
230.1 0.48406 0.467 2.10771 0.456 1.25344 0.501 0.46700 0.686815 0.165952 0.142499 0.686833 0.2033197 0.086113 0.0189361
5 05AH047 SAM LAKETRIBUTARYNEAR SCHULER
82.4 0.25042 0.306 1.75856 0.43 1.96884 0.58 0.42400 0.380736 0.577656 0.036813 0.487497 0.462585 0.045124
6 05AH048 CAVAN LAKENEAR DUNMORE
11.5 0.52191 0.486 1.60688 0.409 0.77086 0.409 0.42800 0.207943 0.787906 0.870889 0.00015516 0.063544 0.06126073
7 05AH049 ROSS CREEK ATMEDICINE HAT
174.1 0.5871 0.522 3.53034 0.543 1.77483 0.57 0.53700 0.594875 0.318387 0.010686 0.543355 0.17630287 0.26212 0.01380784
8 05AH050 60.3 0.27009 0.325 1.39918 0.385 0.87048 0.431 0.36600 0.531404 0.203671 0.070458 0.412178 0.38900209 0.004262 9.0802E-059 05AK001 SOUTH
SASKATCHEWANRIVER ATHIGHWAY N
4828.3 0.24128 0.3 1.52783 0.401 0.92632 0.449 0.36800 0.271525 0.599492 0.014479 0.325416 0.33042126 0.307833 0.0194092
10 05CK002 RED DEER RIVERNEAR EMPRESS
1167.0 0.29346 0.345 2.0301 0.446 1.48501 0.526 0.42600 0.46889 0.358627 0.037929 0.342863 0.2107294 0.401153 0.03969554
11 05CK004 RED DEER RIVERNEAR BINDLOSS
2399.6 0.20725 0.273 0.68565 0.298 0.7688 0.406 0.31800 0.315694 0.635867 0.002591 0.519986 0.21607229 0.203695 0.05559679
12 05CK005 ALKALI CREEKNEAR THEMOUTH
590.2 0.22728 0.287 0.99551 0.35 1.48594 0.528 0.36900 0.440971 0.5074 0.047258 0.539232 0.23918869 0.171579 0.03982381
13 05CK006 KENNEDYCOULEE NEARACADIA VALLEY
940.4 0.20957 0.276 2.68937 0.5 2.70663 0.642 0.46500 0.360654 0.549232 0.083509 0.664509 0.17250243 0.110668 0.04542561
14 05GA008 SOUNDINGCREEK NEAROYEN
685.3 0.32497 0.363 1.19517 0.368 1.49358 0.533 0.41000 0.432275 0.54782 0.011435 0.830515 0.06687237 0.054689 0.04061765
15 05GA011 MONITOR CREEKNEAR CONSORT
914.1 0.38875 0.41 1.91745 0.438 1.3694 0.513 0.44300 0.729651 0.116421 0.098547 0.830684 0.00015587 0.141099 0.02135769
16 05GA012 SOUNDINGCREEK NEARCHINOOK
2078.8 0.4391 0.437 0.96401 0.339 0.83853 0.426 0.38000 0.463596 0.176892 0.154003 0.71063 0.00584623 0.237612 0.04021582
17 05HA061 1497.9 0.11526 0.224 0.62969 0.275 0.4536 0.352 0.27400 0.13226 0.276164 0.039199 0.163541 0.18184563 0.092767 0.0191716318 05BN002 TWELVE MILE
CREEK NEARCECIL
2803.1 0.47001 0.453 3.34464 0.534 1.50612 0.538 0.49300 0.500174 0.254635 0.212177 0.808994 0.09377683 0.078201 0.0144218
19 05CG001 BULLPOUNDCREEK NEARHUTTON
1210.7 0.41341 0.423 1.24621 0.376 1.0016 0.458 0.40600 0.515548 0.400335 0.060186 0.837464 0.02142953 0.096158 0.04122377
20 05CG003 BULLPOUNDCREEK NEARTHE MOUTH
42.7 0.40012 0.415 0.50515 0.242 0.42578 0.336 0.32500 0.895676 0.101113 0.899656 0.00219696 0.020307 0.0725696
21 05CH003 BERRY CREEK(EAST BRANCH)NEAR WARDLO
651.4 0.25968 0.312 0.12902 0.135 0.26872 0.26 0.22500 0.580741 0.385944 0.01681 0.894743 0.02139764 0.039589 0.04002439

22 05CH005 DEAD FISHCREEK NEARHUTTON
270.2 0.41515 0.424 0.38564 0.215 0.35979 0.297 0.30500 0.97897 0.017184 0.00052 0.943126 0.00861419 0.024514 0.01723039
23 05CH006 BARTMANRESERVOIR ONEAST BERRYCREEK
221.3 0.35919 0.388 0.34452 0.199 0.32859 0.284 0.28500 0.673589 0.320484 0.002257 0.988021 0.00162556 0.00668358
24 05CH008 BERRY CREEKNEAR ROSELYNN
1550.4 0.43124 0.434 0.65796 0.29 0.67272 0.392 0.36300 0.793934 0.109382 0.090052 0.915635 0.00728387 0.058066 0.01520829
25 05CH009 NATURAL FLOWA NEARPOLLOCKVILLE
3.2 0.39768 0.413 0.38144 0.21 0.3638 0.302 0.29600 0.995325 0.995325
26 05CH010 BERRY CREEKNEARPOLLOCKVILLE
132.6 0.53432 0.496 0.40032 0.221 0.32953 0.285 0.33300 0.945324 0.002951 0.048239 0.671554 0.04157405 0.201408 0.0819775
27 05CH011 BERRY CREEKRESERVOIROUTLET
33.8 0.35159 0.38 0.26933 0.188 0.34663 0.294 0.28200 0.866798 0.129636 0.907299 0.02622602 0.02518 0.03772866
28 05CH014 BERRY CREEKRESERVOIRNEARSUNNYNOOK
349.5 0.33042 0.366 0.35222 0.202 0.34501 0.292 0.28000 0.677701 0.305394 0.95408 0.00456799 0.007137 0.0306885
29 05CJ009 RED DEER RIVERNEAR JENNER
3584.5 0.44411 0.439 2.94376 0.508 1.74293 0.566 0.49200 0.496669 0.405761 0.03236 0.585649 0.11701291 0.253196 0.0400484
30 05CJ011 NATURAL FLOWB NEARPRINCESS
2.3 0.06976 0.18 0.41947 0.223 0.17829 0.207 0.20500 0.124869 0.870643 0.89596 0.09955115
31 05CK001 BLOOD INDIANCREEK NEARTHE MOUTH
130.0 0.28319 0.338 0.0754 0.113 0.33378 0.289 0.23300 0.384912 0.602208 0.009009 0.850581 0.00599219 0.093251 0.04630521
32 05CK003 BLOOD INDIANCREEK ATHOGARTH'SRANCH
247.7 0.30978 0.355 0.21009 0.172 0.42756 0.339 0.27800 0.464519 0.520225 0.007762 0.971122 0.00045158 6.58E-06 0.02457093
33 05CK007 BLOOD INDIANCREEK NEARCABIN LAKE
321.7 0.30681 0.352 0.13631 0.138 0.33882 0.29 0.24400 0.545808 0.443975 0.006394 0.926313 0.04457152 0.005456 0.00941127
34 05AB*** 736.9 1.0695 0.748 16.85813 0.955 8.98096 0.969 0.94100 0.597133 0.158619 0.191223 0.553061 0.1701653 0.259861 0.0139604435 05AF006 ETZIKOM
COULEE NEARGODDARD
1478.6 0.38474 0.406 9.15412 0.749 4.84441 0.789 0.63300 0.660797 0.288716 0.037943 0.897333 0.04672551 0.027803 0.02513799
36 05AF011 ERICKSONCOULEE AT E.C.BENNETT'S FAR
24.5 0.51323 0.481 1.28956 0.379 0.87923 0.436 0.42100 0.906593 0.089396 0.499263 0.31679884 0.166844 0.01188741
37 05AF021 COAL CREEKNEAR ORION
53.3 0.48421 0.469 1.20099 0.37 0.82601 0.423 0.41300 0.442249 0.378054 0.175713 0.780934 0.06533349 0.137002 0.0106603
39 05AF027 ETZIKOMCOULEE NEARNEMISCAM
452.3 0.23914 0.295 7.27848 0.703 4.23892 0.75 0.57200 0.69058 0.2995 0.006644 0.894564 0.03079286 0.053999 0.01710654
38 05AF022 GRAYBACKCOULEE NEARORION
77.0 0.47286 0.458 1.69396 0.421 1.0614 0.468 0.43800 0.39498 0.461908 0.139312 0.926102 0.02391814 0.020805 0.02482735
40 05AF031 RUSH LAKEDRAIN NEARNEW DAYTON
53.6 1.05099 0.739 14.20254 0.896 6.08341 0.844 0.85600 0.830122 0.060421 0.106523 0.993554 0.003512
41 05AG024 NATURAL FLOWD NEAR CHIN
3.1 4.60389 0.996 31.03284 0.998 16.0201 1 0.99700 0.713276 0.282776 0.055448 0.15647743 0.780667 0.00345939
42 05AH005 SEVEN PERSONSCREEK ATMEDICINE HAT
501.4 1.35323 0.834 11.89502 0.85 4.27293 0.757 0.84200 0.661503 0.142906 0.162991 0.72365 0.11827896 0.14045 0.00464032
43 05AH033 SEVEN PERSONSCREEK NEARSEVEN PERSON
265.4 0.61916 0.538 6.1056 0.669 3.13132 0.663 0.61600 0.680804 0.141654 0.100417 0.657776 0.16750414 0.149593 0.02128615

44 05AH039 SEVEN PERSONSCREEK NEARWHITLA
1849.4 0.41198 0.421 5.84625 0.663 3.50769 0.693 0.58900 0.721331 0.237626 0.027011 0.758212 0.11978873 0.091553 0.02518739
45 05AJ001 SOUTHSASKATCHEWANRIVER ATMEDICINE
2488.9 0.58837 0.526 13.90742 0.889 7.86171 0.938 0.82300 0.721805 0.156827 0.090631 0.594957 0.1964413 0.175946 0.02821437
46 11AA006 MILK RIVER ATWRITING-ON-STONE POLICEDETACHME
595.3 0.32211 0.361 4.80952 0.622 2.22923 0.605 0.51700 0.402887 0.341324 0.003076 0.521229 0.03391421 0.130117 0.06259186
47 11AA007 MILK RIVER ATPENDANTD'OREILLEPOLICEDETACHM
654.9 0.1802 0.252 3.84458 0.559 2.01274 0.588 0.45600 0.470948 0.254517 0.002406 0.501946 0.14709631 0.074723 0.00410469
48 11AA036 MILK RIVER ATHIGHWAY NO.880
458.0 0.23952 0.296 4.31638 0.596 2.25352 0.612 0.48700 0.571691 0.376322 0.002774 0.620768 0.19204512 0.10717 0.03080364
49 11AA038 VERDIGRISCOULEE NEARTHE MOUTH
283.4 0.36578 0.394 7.47426 0.708 3.788 0.714 0.59900 0.73782 0.220366 0.829496 0.00330072 0.130124 0.03425016
50 PAKOWKI PAKOWKI LAKENEAR PAKOWKI
1072.4 0.26163 0.314 4.06775 0.574 2.28389 0.615 0.48400 0.473173 0.313841 0.149207 0.748233 0.0716833 0.144312 0.03139407
51 05AG003 EXPANSECOULEE NEARTHE MOUTH
1843.6 0.5337 0.492 8.42311 0.732 4.88144 0.792 0.66100 0.598181 0.332221 0.044931 0.697011 0.13741447 0.13535 0.0213486
52 05AG006 OLDMAN RIVERNEAR THEMOUTH
1712.7 2.30774 0.973 15.61303 0.937 7.87956 0.939 0.98300 0.559976 0.139278 0.202282 0.466499 0.16912888 0.362125 0.00547785
53 05BN*** 333.2 0.66698 0.556 7.15187 0.701 3.90793 0.72 0.65000 0.762657 0.156056 0.196397 0.14973599 0.643444 0.0072234654 05BN006 NEW WEST
COULEE NEARTHE MOUTH
318.2 0.83668 0.664 10.67753 0.792 5.79716 0.82 0.79800 0.878048 0.098882 0.817103 0.10878988 0.056544 0.01474056
55 05BN012 BOW RIVERNEAR THEMOUTH
1811.1 1.05717 0.745 6.97203 0.696 3.68357 0.702 0.73200 0.576581 0.232133 0.126484 0.618379 0.10610052 0.261603 0.01032541
56 05BN014 COAL CREEK ATBOW CITY
88.0 2.26375 0.969 2.52692 0.484 0.9308 0.451 0.62700 0.562735 0.434425 0.899348 0.06611958 0.031693
57 05BN024 NATURAL FLOWC NEAR BOWCITY
3.1 1.54983 0.883 8.43774 0.733 3.78147 0.712 0.81500 0.997599 0.997599
58 05CH001 BERRY CREEKAT FORSTER'SRANCH
91.9 0.90507 0.69 0.50333 0.24 0.24718 0.247 0.37900 0.974781 0.020461 0.437132 0.429189 0.13027112
59 05CH002 BERRY CREEKNEAR WARDLOW
306.4 0.63609 0.546 0.33673 0.196 0.24808 0.249 0.32900 0.7304 0.217919 0.498846 0.02932984 0.427269 0.04095484
60 05CH007 BERRY CREEKNEAR THEMOUTH
56.6 0.58711 0.524 0.25754 0.185 0.2705 0.262 0.32200 0.840962 0.038561 0.03457 0.14779084 0.743037 0.07112326
61 05CH013 FORSTERRESERVOIRNEARCESSFORD
35.8 0.95846 0.709 0.51615 0.247 0.2349 0.239 0.38500 0.653014 0.355452 0.640412 0.00090421
62 05CH016 BERRY CREEKBELOWDEADFISHCREEK
24.4 1.07067 0.75 0.54311 0.25 0.20911 0.225 0.39800 0.51243 0.009255 0.89393 0.09340922
63 05CJ005 MATZHIWINCREEK NEARDUCHESS
0.0 0.37741 0.396 3.53457 0.545 0.57465 0.371 0.46200 1.132734 1.132734
64 05CJ006 ONETREE CREEKNEAR PATRICIA
498.2 1.78059 0.939 7.61186 0.712 3.00326 0.653 0.80600 0.437959 0.154526 0.377306 0.688238 0.15512398 0.133469 0.01999174

65 05CJ007 MATZHIWINCREEK ABOVEWARE COULEE
2458.7 1.17663 0.794 5.73833 0.655 3.46861 0.688 0.72600 0.385661 0.435047 0.147289 0.709454 0.08369954 0.170364 0.03273436
66 05CJ008 WARE COULEEABOVEMATZHIWINCREEK
91.0 1.45169 0.86 11.2249 0.818 4.45706 0.77 0.84400 0.49644 0.135191 0.36506 0.755455 0.17853818 0.059001 0.00369721
67 05CJ010 SPRING CREEKNEAR VERGER
87.2 0.37894 0.398 3.53765 0.547 0.58053 0.374 0.42900 0.614293 0.020577 0.218078 0.180775 0.08202926 0.70985 0.02425094
68 05CJ012 MATZHIWINCREEK BELOWWARE COULEE
72.5 0.59273 0.527 4.44209 0.602 1.03479 0.466 0.52200 0.795645 0.050171 0.082797 0.221291 0.04013905 0.731723 0.00361212
69 05AF007 KETCHUMCREEK NEARORION
185.6 0.33048 0.368 0.70985 0.304 0.51685 0.367 0.34300 0.53178 0.211002 0.244357 0.811827 0.09129267 0.066173 0.02640961
70 05AF008 IRRIGATIONCREEK NEARORION
204.8 0.36385 0.391 0.83371 0.32 0.57771 0.372 0.35700 0.73047 0.207632 0.05789 0.928318 0.02243805 0.030738 0.01449901
71 05AF009 CANAL CREEKNEARMANYBERRIES
178.0 0.06861 0.178 0.17239 0.159 0.11754 0.158 0.17300 0.611955 0.084051 0.296526 0.572346 0.14038022 0.236004 0.0438021
72 11AA009 SAGE CREEK ATBJORDALS NEARWILD HORSE
112.2 0.03345 0.129 0.04246 0.09 0.0452 0.098 0.12800 0.735636 0.152992 0.10688 0.839229 0.011205 0.123109 0.02196427
73 11AA011 DEER CREEK ATDEER CREEKCATTLE CO.'SRANCH
8.1 0.31419 0.357 2.43695 0.48 1.25477 0.503 0.43700 0.261016 0.735574 0.487379 0.26139605 0.234894 0.01292062
74 11AA023 LINDSAYCOULEE NEARONEFOUR POSTOFFICE
26.9 0.13728 0.235 0.17424 0.162 0.18552 0.209 0.20300 0.768416 0.227438 0.762717 0.15889566 0.05798 0.01626269
75 11AA024 MAYNARDCOULEE NEARONEFOUR POSTOFFICE
20.4 0.10973 0.218 0.13928 0.141 0.1483 0.177 0.18600 0.516066 0.479427 0.879358 0.02688511 0.041307 0.04794266
76 11AA026 SAGE CREEK ATQ RANCH NEARWILDHORSE
457.7 0.27288 0.327 0.63162 0.277 0.36246 0.301 0.29100 0.72559 0.159267 0.110727 0.743103 0.05893425 0.178482 0.01506557
77 11AA027 SAGE CREEKNEARINTERNATIONALBOUNDARY
22.5 0 0 0 0 0 0 0.00000 0.3835 0.611961 0.578596 0.26680611 0.10425 0.0458079
78 11AA031 MILK RIVER ATEASTERNCROSSING OFINTERNATIONA
446.0 0.09022 0.2 1.22944 0.373 0.6559 0.386 0.31300 0.237185 0.109732 0.313962 0.356863 0.12592098 0.162018 0.01323032
79 11AA034 MILK RIVERNEAR WRITING-ON-STONE PARK
128.7 0.19852 0.271 2.54555 0.486 1.23516 0.498 0.40100 0.269035 0.365348 0.253467 0.18916228 0.168971 0.02278405
80 11AA035 MILK RIVERNEAR PENDANTD'OREILLE
312.2 0.08233 0.189 0.85907 0.323 0.45583 0.356 0.27800 0.305025 0.441265 0.164738 0.402332 0.33746451 0.143818 0.02528824
81 11AB082 260.1 0.10091 0.205 0.18464 0.165 0.12576 0.163 0.17900 0.678372 0.170612 0.111945 0.858582 0.02597226 0.074952 0.0014227582 11AB086 WALBURGER
COULEE BELOWDIVERSIONS
84.5 0.00933 0.066 0.01185 0.043 0.01261 0.045 0.05700 0.306901 0.456771 0.59561 0.05061649 0.073715 0.04373043
83 11AB097 CRESSDAYRESERVOIRNEAR CRESSDAY
32.9 0.21149 0.278 0.48143 0.232 0.28441 0.267 0.24200 0.741963 0.237849 0.015705 0.948495 0.04272026 0.00430151
84 11AB098 JAYDOTRESERVOIRNEAR JAYDOT
19.7 0.18898 0.265 0.23986 0.18 0.25539 0.257 0.22200 0.76669 0.222596 0.927642 0.03217471 0.02946879
85 DRAINS6 Drain S-6 90.6 1.20806 0.803 23.96689 0.992 13.55359 0.993 0.96900


0.0
0.2
0.4
0.6
0.8
1.0
Watersheds
Agr
icul
tura
l Int
ensi
ty P
erce
ntile
Buffalo Creek Stretton CreekHaynes CreekThreehills Creek
Ray CreekRenwick Creek
AESA Watersheds
Ag Zone 2 Ag Zone 6 Ag Zone 7Ag Zone 5
Figure A4.1a. Agricultural intensity in watersheds of the Aspen Parkland Ecoregion compared to the AESA watersheds.

0.0
0.5
1.0
1.5
2.0
2.5
3.0
3.5
4.0
4.5
5.0
Watersheds
Man
ure
Prod
uctio
n (to
nnes
per
acr
e)
Ag Zone 2 Ag Zone 5 Ag Zone 6 Ag Zone 7
Maximum
75th Percentile
40th Percentile
Buffalo Creek Stretton CreekHaynes CreekThreehills Creek
Ray CreekRenwick Creek
AESA WatershedsFigure A4.1b. Manure production in watersheds of the Aspen Parkland Ecoregion compared to the AESA watersheds.
Horizontal lines indicate the maximum, 75th and 40th percentile of the provincial distribution.

0.0
5.0
10.0
15.0
20.0
25.0
30.0
35.0
Watersheds
Fert
ilize
r Exp
ense
s (d
olla
rs p
er a
cre)
Ag Zone 5 Ag Zone 6 Ag Zone 7
Maximum
75th Percentile
40th Percentile
Ag Zone 2
Buffalo Creek Stretton Creek
AESA WatershedsFigure A4.1c. Fertilizer expenses in watersheds of the Aspen Parkland Ecoregion compared to the AESA watersheds.
Haynes Creek
Threehills Creek Ray Creek
Renwick Creek
Horizontal lines indicate the maximum, 75th and 40th percentile of the provincial distribution.
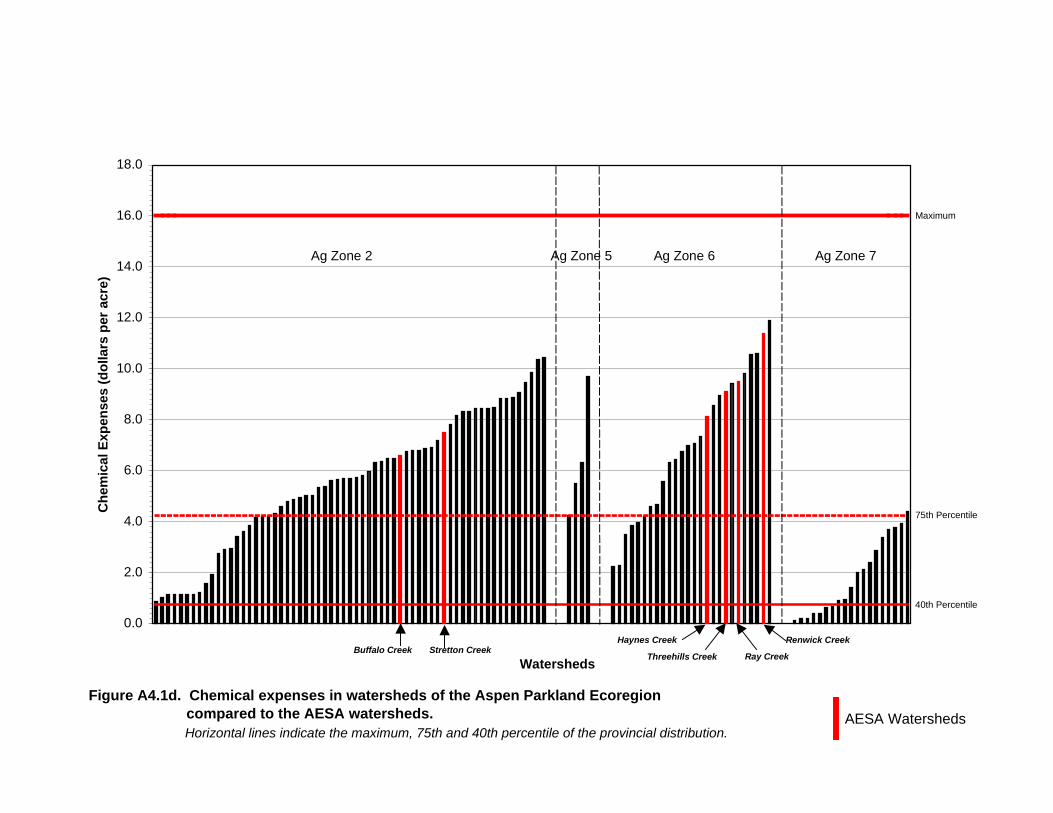
0.0
2.0
4.0
6.0
8.0
10.0
12.0
14.0
16.0
18.0
Watersheds
Che
mic
al E
xpen
ses
(dol
lars
per
acr
e)
Ag Zone 2 Ag Zone 5 Ag Zone 6 Ag Zone 7
Maximum
75th Percentile
40th Percentile
Buffalo Creek Stretton Creek
AESA WatershedsFigure A4.1d. Chemical expenses in watersheds of the Aspen Parkland Ecoregion compared to the AESA watersheds.
Haynes Creek
Threehills Creek Ray Creek
Renwick Creek
Horizontal lines indicate the maximum, 75th and 40th percentile of the provincial distribution.

0.0
0.1
0.2
0.3
0.4
0.5
0.6
0.7
0.8
0.9
1.0
Watersheds
Agr
icul
tura
l Int
ensi
ty P
erce
ntile
Ag Zone 1 Ag Zone 7Ag Zone 8
Ag Zone 14 Ag Zone 15
Blindman RiverTomahawk Creek Strawberry Creek Wabash Creek Kleskun Drain
No Ag Zone Classified
AESA WatershedsFigure A4.2a. Agricultural intensity in watersheds of the Boreal Transition/Peace Lowland Ecoregions compared to the AESA watersheds.

0.0
1.0
2.0
3.0
4.0
5.0
Watersheds
Man
ure
Prod
uctio
n (to
nnes
per
acr
e)
Ag Zone 1 Ag Zone 7Ag
Zone 8 Ag Zone 14 Ag Zone 15
No AgZone
Classified
AESA Watersheds
Figure A4.2b. Manure production in watersheds of the Boreal Transition/Peace Lowland Ecoregions compared to the AESA watersheds.
Horizontal lines indicate the maximum, 75th and 40th percentile of the provincial distribution.
Maximum
75th Percentile
40th Percentile
Blindman RiverTomahawk Creek Strawberry Creek Wabash Creek Kleskun Drain

0.0
5.0
10.0
15.0
20.0
25.0
30.0
35.0
Watersheds
Fert
ilize
r Exp
ense
s (d
olla
rs p
er a
cre) Ag Zone 1 Ag Zone 7
AgZone 8 Ag Zone 14 Ag Zone 15
No AgZone
Classified
AESA Watersheds
Maximum
75th Percentile
40th Percentile
Figure A4.2c. Fertilizer expenses in watersheds of the Boreal Transition/Peace Lowland Ecoregions compared to the AESA watersheds.
Horizontal lines indicate the maximum, 75th and 40th percentile of the provincial distribution.
Blindman RiverTomahawk Creek Strawberry Creek Wabash Creek Kleskun Drain

0.0
2.0
4.0
6.0
8.0
10.0
12.0
14.0
16.0
18.0
Watersheds
Che
mic
al E
xpen
ses
(dol
lars
per
acr
e)
Ag Zone 1 Ag Zone 7Ag
Zone 8 Ag Zone 14 Ag Zone 15
No Ag Zone Classified
AESA Watersheds
Maximum
75th Percentile
40th Percentile
Figure A4.2d. Chemical expenses in watersheds of the Boreal Transition/Peace Lowland Ecoregions compared to the AESA watersheds.
Horizontal lines indicate the maximum, 75th and 40th percentile of the provincial distribution.
Blindman RiverTomahawk Creek Strawberry Creek Wabash Creek Kleskun Drain
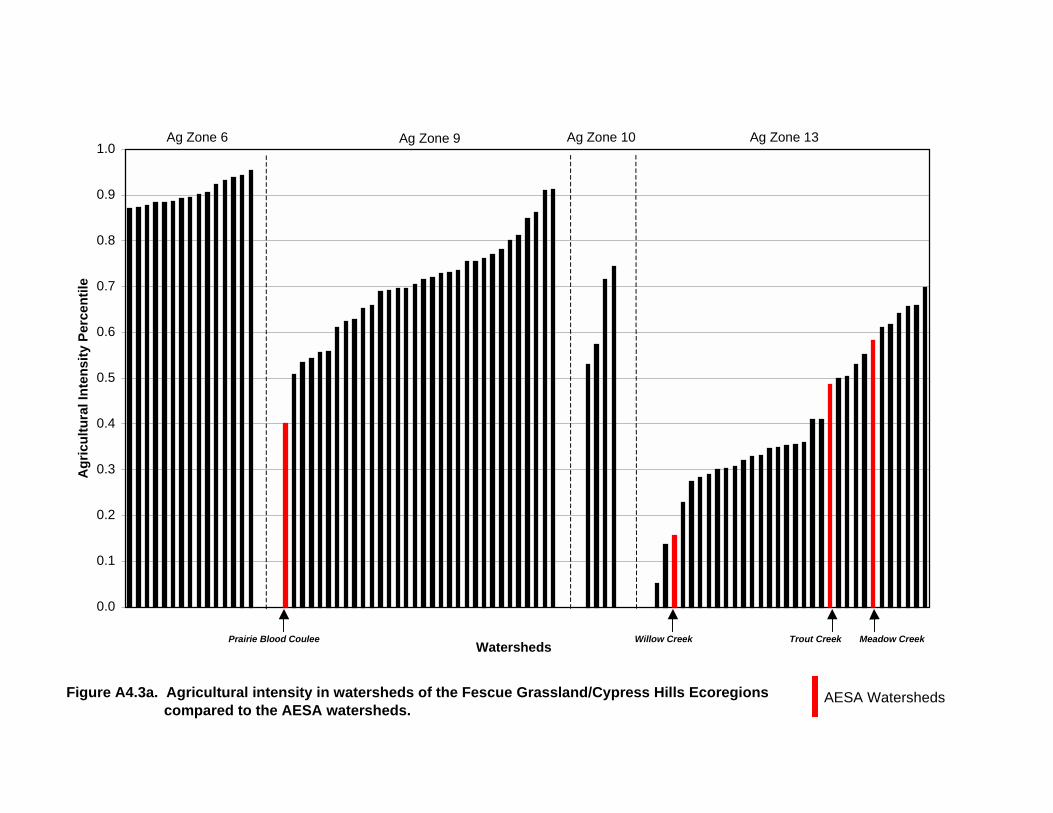
0.0
0.1
0.2
0.3
0.4
0.5
0.6
0.7
0.8
0.9
1.0
Watersheds
Agr
icul
tura
l Int
ensi
ty P
erce
ntile
Ag Zone 6 Ag Zone 9 Ag Zone 10 Ag Zone 13
Trout Creek Meadow CreekPrairie Blood Coulee Willow Creek
AESA WatershedsFigure A4.3a. Agricultural intensity in watersheds of the Fescue Grassland/Cypress Hills Ecoregions compared to the AESA watersheds.

0.0
1.0
2.0
3.0
4.0
5.0
Watersheds
Man
ure
Prod
uctio
n (to
nnes
per
acr
e)
Ag Zone 9 Ag Zone 10 Ag Zone 13Ag Zone 6
Maximum
75th Percentile
40th Percentile
Trout Creek Meadow CreekPrairie Blood Coulee Willow Creek
AESA Watersheds
Figure A4.3b. Manure production in watersheds of the Fescue Grassland/Cypress Hills Ecoregions compared to the AESA watersheds.
Horizontal lines indicate the maximum, 75th and 40th percentile of the provincial distribution.

0.0
5.0
10.0
15.0
20.0
25.0
30.0
35.0
Watersheds
Fert
ilize
r Exp
ense
s (d
olla
rs p
er a
cre) Ag Zone 6 Ag Zone 9 Ag Zone 10 Ag Zone 13
Maximum
75th Percentile
40th Percentile
Trout Creek Meadow CreekPrairie Blood Coulee Willow Creek
AESA Watersheds
Figure A4.3c. Fertilizer expenses in watersheds of the Fescue Grassland/Cypress Hills Ecoregions compared to the AESA watersheds.
Horizontal lines indicate the maximum, 75th and 40th percentile of the provincial distribution.
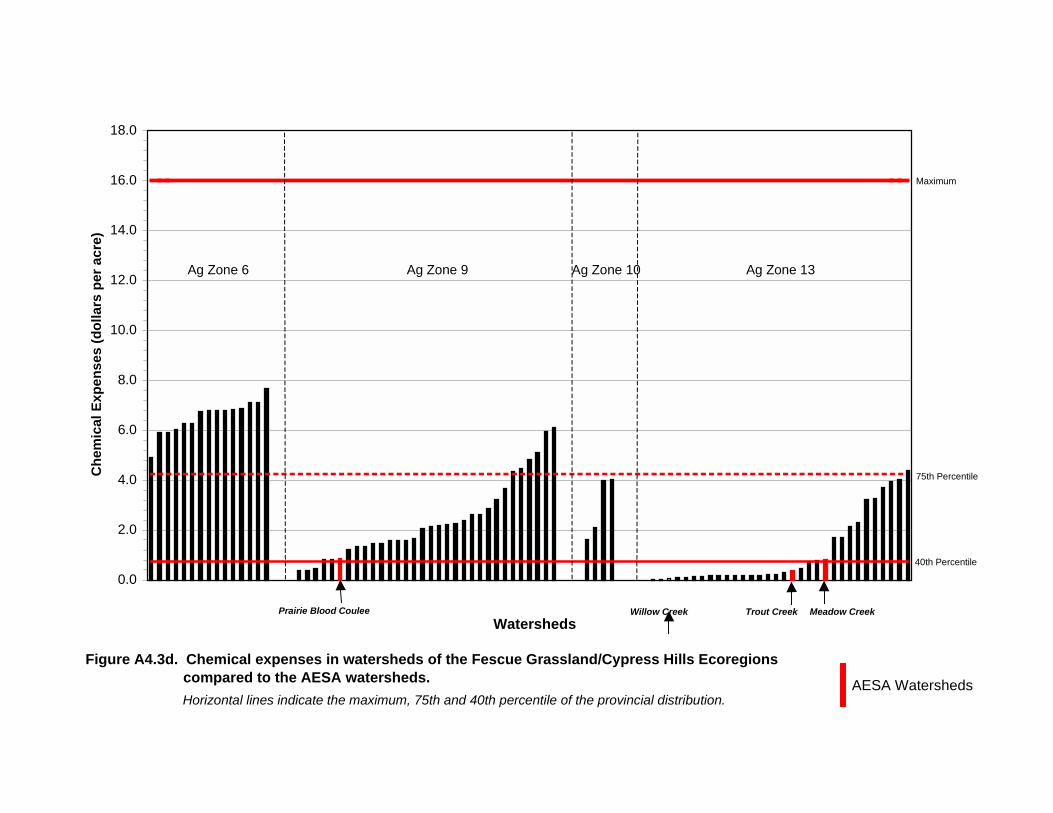
0.0
2.0
4.0
6.0
8.0
10.0
12.0
14.0
16.0
18.0
Watersheds
Che
mic
al E
xpen
ses
(dol
lars
per
acr
e)
Ag Zone 6 Ag Zone 9 Ag Zone 10 Ag Zone 13
Maximum
75th Percentile
40th Percentile
Trout Creek Meadow CreekPrairie Blood Coulee Willow Creek
AESA Watersheds
Figure A4.3d. Chemical expenses in watersheds of the Fescue Grassland/Cypress Hills Ecoregions compared to the AESA watersheds.
Horizontal lines indicate the maximum, 75th and 40th percentile of the provincial distribution.

0.00
0.10
0.20
0.30
0.40
0.50
0.60
0.70
0.80
0.90
1.00
Watersheds
Agr
icul
tura
l Int
ensi
ty P
erce
ntile
Ag Zone 1 Ag Zone 8 Ag Zone 15 No Ag Zone Classification
Figure A4.4a. Agricultural intensity in watersheds of the Mixed Boreal Uplands Ecoregion compared to the AESA watersheds.

0.00
1.00
2.00
3.00
4.00
5.00
Watersheds
Man
ure
Prod
uctio
n (to
nnes
per
acr
e)
Ag Zone 1 Ag Zone 8 Ag Zone 15 No Ag Zone Classification
Figure A4.4b. Manure production in watersheds of the Mixed Boreal Uplands Ecoregion compared to the AESA watersheds.
Horizontal lines indicate the maximum, 75th and 40th percentile of the provincial distribution.
Maximum
75th Percentile
40th Percentile

0.00
5.00
10.00
15.00
20.00
25.00
30.00
35.00
Watersheds
Fert
ilize
r Exp
ense
s (d
olla
rs p
er a
cre)
Ag Zone 1 Ag Zone 8 Ag Zone 15 No Ag Zone Classification
Figure A4.4c. Fertilizer expenses in watersheds of the Mixed Boreal Uplands Ecoregion compared to the AESA watersheds.
Horizontal lines indicate the maximum, 75th and 40th percentile of the provincial distribution.
Maximum
75th Percentile
40th Percentile

0.00
2.00
4.00
6.00
8.00
10.00
12.00
14.00
16.00
18.00
Watersheds
Che
mic
al E
xpen
ses
(dol
lars
per
acr
e)
Ag Zone 1 Ag Zone 8 Ag Zone 15 No Ag Zone Classification
Figure A4.4d. Chemical expenses in watersheds of the Mixed Boreal Uplands Ecoregion compared to the AESA watersheds.
Horizontal lines indicate the maximum, 75th and 40th percentile of the provincial distribution.
Maximum
75th Percentile
40th Percentile
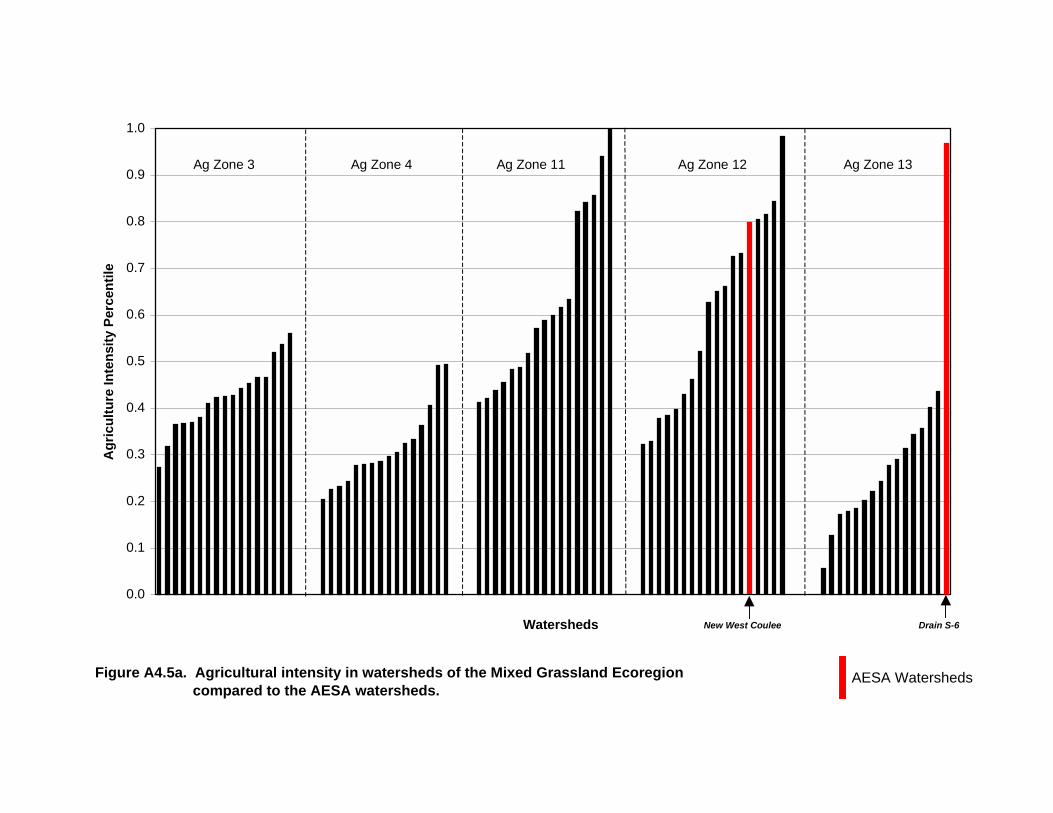
0.0
0.1
0.2
0.3
0.4
0.5
0.6
0.7
0.8
0.9
1.0
Watersheds
Agr
icul
ture
Inte
nsity
Per
cent
ile
Ag Zone 3 Ag Zone 4 Ag Zone 11 Ag Zone 12 Ag Zone 13
New West Coulee Drain S-6
AESA WatershedsFigure A4.5a. Agricultural intensity in watersheds of the Mixed Grassland Ecoregion compared to the AESA watersheds.

0.0
0.5
1.0
1.5
2.0
2.5
3.0
3.5
4.0
4.5
5.0
Watersheds
Man
ure
Prod
uctio
n (to
nnes
per
acr
e)
Ag Zone 3 Ag Zone 4 Ag Zone 11 Ag Zone 12 Ag Zone 13
Maximum
75th Percentile
40th Percentile
AESA WatershedsFigure A4.5b. Manure production in watersheds of the Mixed Grassland Ecoregion compared to the AESA watersheds.
Horizontal lines indicate the maximum, 75th and 40th percentile of the provincial distribution.
New West Coulee Drain S-6
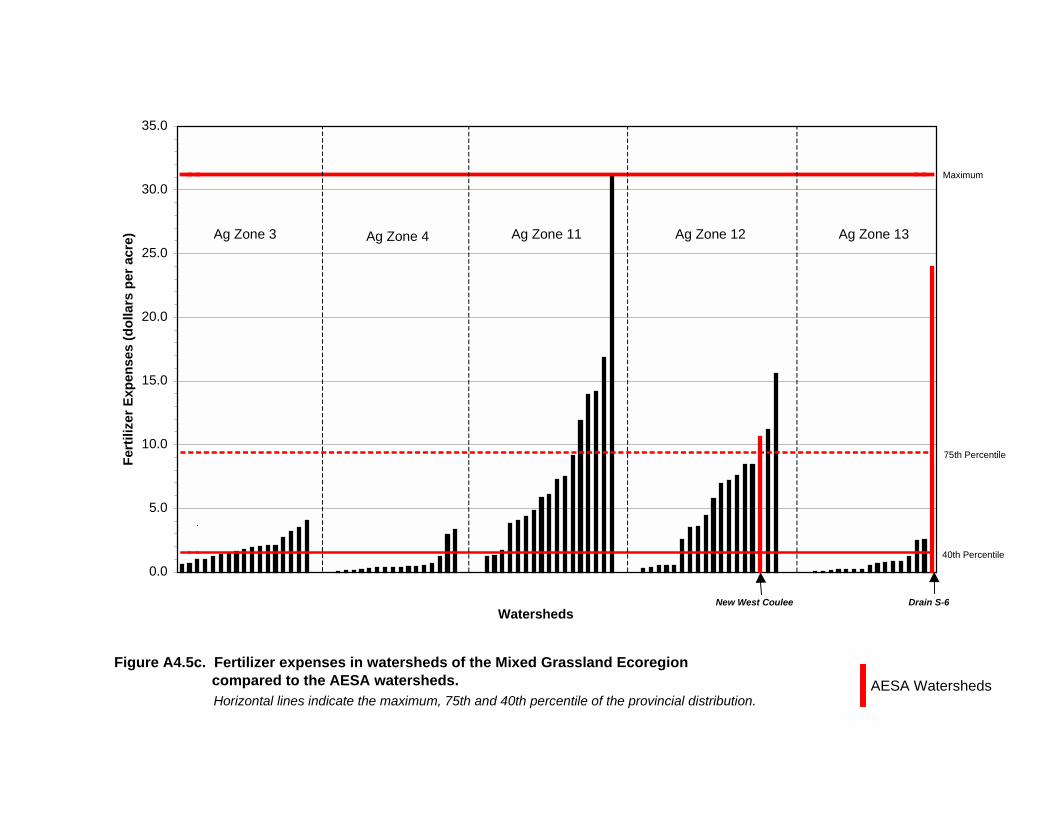
0.0
5.0
10.0
15.0
20.0
25.0
30.0
35.0
Watersheds
Fert
ilize
r Exp
ense
s (d
olla
rs p
er a
cre) Ag Zone 3 Ag Zone 4 Ag Zone 11 Ag Zone 12 Ag Zone 13
Maximum
75th Percentile
40th Percentile
AESA WatershedsFigure A4.5c. Fertilizer expenses in watersheds of the Mixed Grassland Ecoregion compared to the AESA watersheds.
Horizontal lines indicate the maximum, 75th and 40th percentile of the provincial distribution.
New West Coulee Drain S-6

0.0
2.0
4.0
6.0
8.0
10.0
12.0
14.0
16.0
18.0
Watersheds
Che
mic
al E
xpen
ses
(dol
lars
per
acr
e)
Ag Zone 3 Ag Zone 4 Ag Zone 11 Ag Zone 12 Ag Zone 13
Maximum
75th Percentile
40th Percentile
AESA WatershedsFigure A4.5d. Chemical expenses in watersheds of the Mixed Grassland Ecoregion compared to the AESA watersheds.
Horizontal lines indicate the maximum, 75th and 40th percentile of the provincial distribution.
New West Coulee Drain S-6

0.0
0.1
0.2
0.3
0.4
0.5
0.6
0.7
0.8
0.9
1.0
Watersheds
Agr
icul
tura
l Int
ensi
ty P
erce
ntile
Ag Zone 3 Ag Zone 5
Crowfoot Creek
Ag Zone 10
Battersea Drain
AESA WatershedsFigure A4.6a. Agricultural intensity in watersheds of the Moist Mixed Grassland Ecoregion compared to the AESA watersheds.

0.0
0.5
1.0
1.5
2.0
2.5
3.0
3.5
4.0
4.5
5.0
Watersheds
Man
ure
Prod
uctio
n (to
nnes
per
acr
e)
Crowfoot Creek
Ag Zone 3 Ag Zone 5 Ag Zone 10
Battersea Drain
Maximum
75th Percentile
40th Percentile
AESA WatershedsFigure A4.6b. Manure production in watersheds of the Moist Mixed Grassland Ecoregion compared to the AESA watersheds.
Horizontal lines indicate the maximum, 75th and 40th percentile of the provincial distribution.

0
5
10
15
20
25
30
35
Watersheds
Fert
ilize
r Exp
ense
s (d
olla
rs p
er a
cre) Ag Zone 3 Ag Zone 5 Ag Zone
Crowfoot Creek Battersea Drain
Maximum
75th Percentile
40th Percentile
AESA WatershedsFigure A4.6c. Fertilizer expenses in watersheds of the Moist Mixed Grassland Ecoregion compared to the AESA watersheds.
Horizontal lines indicate the maximum, 75th and 40th percentile of the provincial distribution.

0
2
4
6
8
10
12
14
16
18
Watersheds
Che
mic
al E
xpen
ses
(dol
lars
per
acr
e)
Ag Zone 3 Ag Zone 5 Ag Zone 10
Crowfoot Creek Battersea Drain
Maximum
75th Percentile
40th Percentile
AESA WatershedsFigure A4.6d. Chemical expenses in watersheds of the Moist Mixed Grassland Ecoregion compared to the AESA watersheds.
Horizontal lines indicate the maximum, 75th and 40th percentile of the provincial distribution.

0.0
0.1
0.2
0.3
0.4
0.5
0.6
0.7
0.8
0.9
1.0
Watersheds
Agr
icul
tura
l Int
ensi
ty P
erce
ntile
AgZone 7 Ag Zone 8 No Agriculture Zone Classification
Figure A4.7a. Agricultural intensity in watersheds of the Subalpine/Alpine Ecoregion compared to the AESA watersheds.

0
1
2
3
4
5
Watersheds
Man
ure
Prod
uctio
n (to
nnes
per
acr
e)
AgZone 7 Ag Zone 8 No Agriculture Zone Classification
Maximum
75th Percentile
40th Percentile
Figure A4.7b. Manure production in watersheds of the Subalpine/Alpine Ecoregion compared to the AESA watersheds.
Horizontal lines indicate the maximum, 75th and 40th percentile of the provincial distribution.
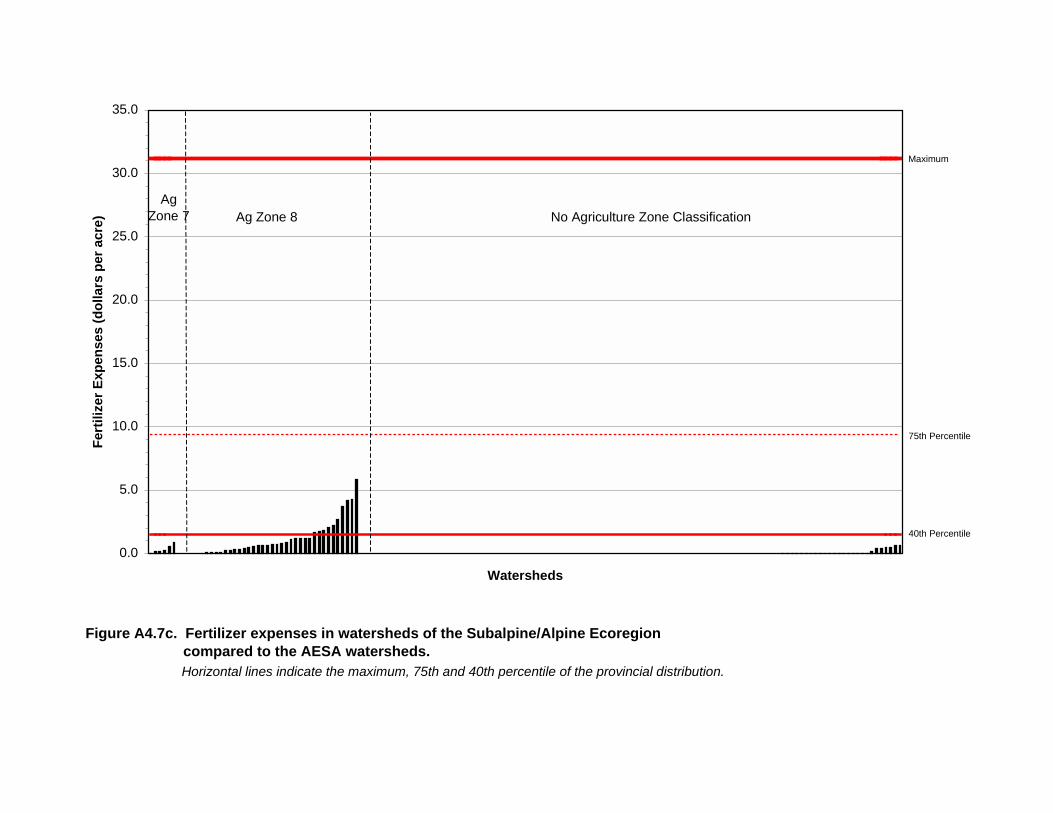
0.0
5.0
10.0
15.0
20.0
25.0
30.0
35.0
Watersheds
Fert
ilize
r Exp
ense
s (d
olla
rs p
er a
cre)
AgZone 7 Ag Zone 8 No Agriculture Zone Classification
Maximum
75th Percentile
40th Percentile
Figure A4.7c. Fertilizer expenses in watersheds of the Subalpine/Alpine Ecoregion compared to the AESA watersheds.
Horizontal lines indicate the maximum, 75th and 40th percentile of the provincial distribution.
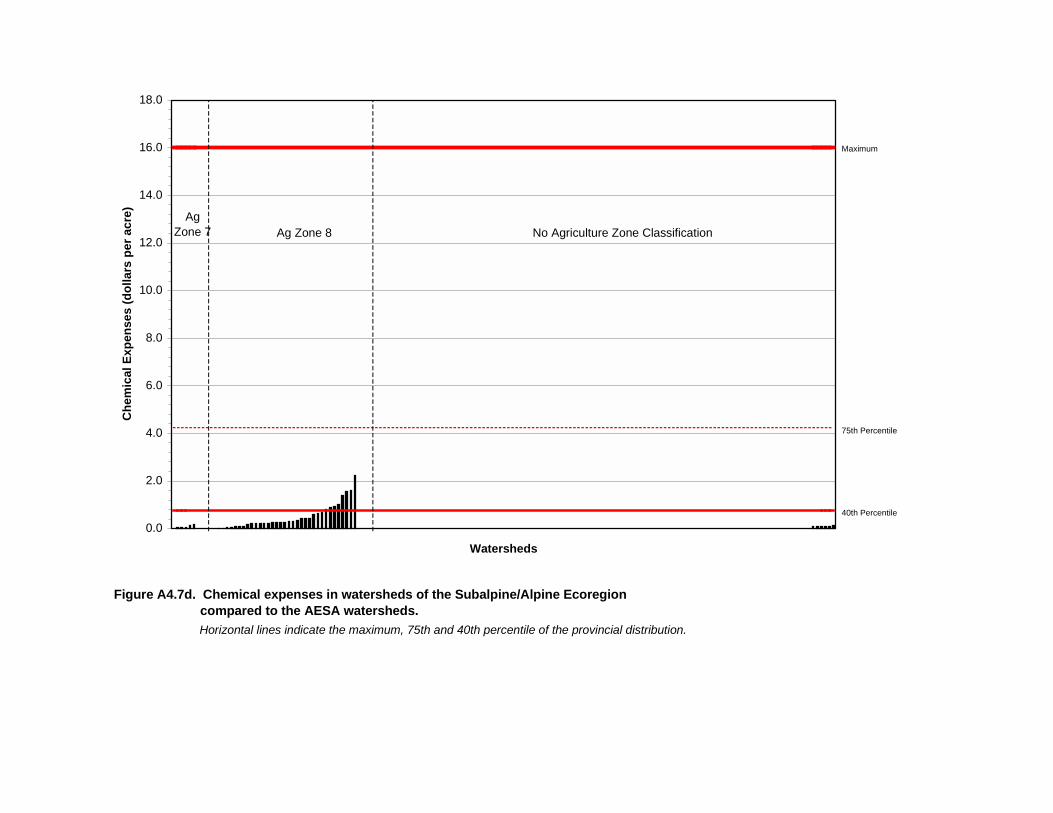
0.0
2.0
4.0
6.0
8.0
10.0
12.0
14.0
16.0
18.0
Watersheds
Che
mic
al E
xpen
ses
(dol
lars
per
acr
e) AgZone 7 Ag Zone 8 No Agriculture Zone Classification
Maximum
75th Percentile
40th Percentile
Figure A4.7d. Chemical expenses in watersheds of the Subalpine/Alpine Ecoregion compared to the AESA watersheds.
Horizontal lines indicate the maximum, 75th and 40th percentile of the provincial distribution.

0.0
0.1
0.2
0.3
0.4
0.5
0.6
Watersheds
Agr
icul
tura
l Int
ensi
ty P
erce
ntile
Ag Zone 7Ag
Zone 8Ag
Zone 14 No Ag Zone ClassificationAg
Zone 15
Rose Creek Paddle River Hines Creek Grande Prairie Creek
AESA Watersheds
Figure A4.8a. Agricultural intensity in watersheds of the Western Alberta Upland/Clear Hills Upland Ecoregions compared to the AESA watersheds.

0.0
0.5
1.0
1.5
2.0
2.5
3.0
3.5
4.0
4.5
5.0
Watersheds
Man
ure
Prod
uctio
n (to
nnes
per
acr
e)
Ag Zone 7Ag
Zone 8Ag
Zone 14 No Ag Zone ClassificationAg
Zone 15
Paddle River Hines Creek Grande Prairie Creek
AESA Watersheds
Figure A4.8b. Manure production in watersheds of the Western Alberta Upland/Clear Hills Upland Ecoregions compared to the AESA watersheds.
Horizontal lines indicate the maximum, 75th and 40th percentile of the provincial distribution.
Maximum
75th Percentile
40th Percentile
Rose Creek

0.0
5.0
10.0
15.0
20.0
25.0
30.0
35.0
Watersheds
Fert
ilize
r Exp
ense
s (d
olla
rs p
er a
cre) Ag Zone 7
AgZone 8
AgZone 14 No Ag Zone Classification
AgZone 15
Paddle River Hines Creek Grande Prairie Creek
AESA Watersheds
Figure A4.8c. Fertilizer expenses in watersheds of the Western Alberta Upland/Clear Hills Upland Ecoregions compared to the AESA watersheds.
Horizontal lines indicate the maximum, 75th and 40th percentile of the provincial distribution.
Maximum
75th Percentile
40th Percentile
Rose Creek

0.0
2.0
4.0
6.0
8.0
10.0
12.0
14.0
16.0
18.0
Watersheds
Che
mic
al E
xpen
ses
(dol
lars
per
acr
e) AgZone 8
AgZone 14 No Ag Zone ClassificationAg Zone 7
AgZone 15
AESA Watersheds
Maximum
75th Percentile
40th Percentile
Paddle River Hines Creek Grande Prairie Creek
Figure A4.8d. Chemical expenses in watersheds of the Western Alberta Upland/Clear Hills Upland Ecoregions compared to the AESA watersheds.
Horizontal lines indicate the maximum, 75th and 40th percentile of the provincial distribution.
Rose Creek

Appendix 5
SAS code and data used to assemble integrated watersheds
The PFRA watersheds are reported as segments of watersheds, with each segmentdraining to a stream gauging station. Watersheds comprise the segment draining to thecorresponding gauging station and all segments draining to upstream gauging stations.The following SAS program and table of watershed segment relationships (the watershedsegment and the segment it drains directly into) were used to assemble the integratedwatersheds, reported as a table with the gauge station code and all the watershedsegments which drain into it.

options NOsource NOnotes nosymbolgen;FILENAME DBINFILE 'D:\Site Selection Report\Alberta Basins.dbf';
%MACRO ASSMBAS(NAME, filenm, clr_flg);
%IF %UPCASE(&clr_flg) = YES %THEN%DO;proc datasets library=work;
delete &filenm;run; quit;%END;
%LET i = 1;proc sql;%DO %UNTIL (&sqlobs = 0);
proc sql;CREATE TABLE sub_basn AS
SELECT * FROM layer&iWHERE Name = &name;
%LET i = %EVAL(&i+1); quit;Proc Append base = &filenm data = sub_basn; run;
%END; quit;%MEND;
%MACRO MK_LAYER(Rel_Tbl);data layer1;set &Rel_Tbl;
subbasin = name;keep name subbasin;
run;%LET i = 1;Proc SQL;%DO %UNTIL (&sqlobs = 0);
%let j = %eval(&i);%let i = %eval(&i+1);CREATE TABLE LAYER&i AS
SELECTA.NAME AS NAME,B.NAME AS SUBBASIN label="sub * &i basin"
FROMlayer&j AS A,&Rel_Tbl AS B
WHERE A.Subbasin=B.flowintoORDER BY name;
%END;QUIT;
%MEND;
proc dbf db4=dbinfile out=basins.alb_basn;run;
data Pars_bas;set BASINS.alb_basn;
if name NE receive;drop perimete select ws_maj12 hw1gxpf_ hw1gxpf0;
run;
Proc Sort data=pars_bas nodupkey; by name; run;

data Basn_rel;set Pars_bas(rename=(receive=flowinto));
keep name flowinto area ws_maj33;run;
%Mk_Layer(Basn_rel);
proc datasets library=basins;delete roll_up;
run; quit;
Data _null_;file 'P';set Basn_Rel;
txt = '%ASSMBAS("' || Name ||'", BASINS.ROLL_UP,);';put txt;
run;
%include 'P';
PROC SQL;CREATE TABLE Temp_tbl ASSELECT
A.Name,A.Subbasin,B.area
FROMBasins.Roll_up AS A,Basins.alb_basn AS B
WHEREA.Subbasin=B.Name
ORDER BY name;
CREATE TABLE Bas_area ASSELECT
Name label='Gauge Station Code',sum(area) AS Tot_Area label='Total effective drainage area - sq
km' format = 8.2FROM
Temp_TblGROUP BY nameORDER BY name;
quit;
proc sort data=basins.stat_loc; by NAME; run;proc sort data=bas_area; by name; run;
data basins.verify;format tot_area area_dif perc_dif 8.2;merge bas_area (in=ina) basins.stat_loc;by name;
if ina;area_dif = grs_area-tot_area;perc_dif = (area_dif/grs_area)*100;

run;
FILENAME DBverify 'D:\Site Selection Report\Alberta Basinsverify.dbf';
proc dbf db4=DBverify data=basins.verify; run;

NAME RECEIVE05AA001 05AA02405AA002 05AA00205AA002 05AA00205AA002 05AA02405AA003 05AA00305AA003 05AA02405AA004 05AB01205AA005 05AA02405AA006 05AA02405AA007 05AA02405AA008 05AA00205AA010 05AA00305AA011 05AA00305AA013 05AA00805AA015 05AA02205AA016 05AA01505AA018 05AA00805AA020 05AA00805AA021 05AA02305AA022 05AA00305AA022 05AA02205AA023 05AA00105AA024 05AA02405AA024 05AB01205AA026 05AA02105AA027 05AA02105AA028 05AA01505AA029 05AA00105AA030 05AA00205AA909 05AA00605AB*** 05AJ00105AB002 05AD01905AB003 05AB00505AB005 05AB01505AB006 05AB02905AB007 05AD01905AB012 05AB00705AB013 05AB01205AB014 05AB01305AB015 05AB00205AB021 05AB01505AB022 05AB03005AB023 05AB03005AB024 05AB03005AB028 05AB03705AB029 05AB01505AB030 05AB03905AB037 05AB03905AB038 05AB00205AB039 05AB021
NAME RECEIVE05AC001 05AC03105AC002 05AC03105AC003 05AC92105AC006 05AG00605AC012 05AC02305AC022 05AC92105AC023 05AG00605AC030 05AC02205AC031 05AC00305AC032 05AC00305AC033 05AC03205AC921 05AC01205AC921 05AC92105AD001 05AD04105AD002 05AD00705AD003 05AD02605AD004 05AD02605AD005 05AD04105AD006 WATERTO05AD007 05AG00605AD008 05AD00705AD010 05AD02605AD014 05AD02605AD016 05AD03605AD018 05AD00205AD019 05AD00705AD024 05AD00105AD026 05AD02805AD028 05AD00805AD034 05AG00605AD035 05AD00705AD036 05AD01005AD039 05AD00305AD041 05AD00205AD901 05AD02805AD903 05AD02605AD904 05AD02605AE002 05AE02505AE005 05AE02505AE006 05AD00705AE008 05AE00205AE009 05AE00605AE011 05AE01205AE012 05AE01605AE016 05AE00605AE020 05AE00505AE023 05AE03705AE024 05AE01105AE025 05AE00605AE037 05AE008
NAME RECEIVE05AE039 05AE03705AE041 05AE00605AE042 05AE01605AE912 05AE02505AF006 05AF02705AF007 PAKOWKI05AF008 PAKOWKI05AF009 PAKOWKI05AF010 05AF01105AF011 PAKOWKI05AF021 PAKOWKI05AF022 05AF02105AF027 PAKOWKI05AF029 05AF00605AF030 05AF02905AF031 05AF00605AG003 05AG00605AG006 05AB***05AG006 05AG00605AG006 05AG00605AG008 05AG00605AG024 05AG00605AH002 05AH04005AH003 05AH03205AH003 05AH03205AH004 05AH04905AH005 05AK00105AH006 05AH00205AH007 05AH00205AH009 05AH03705AH010 05AH01305AH012 05AH00405AH013 05AH01205AH032 05AH04905AH033 05AH00505AH036 05AH00305AH037 05AH00305AH038 05AH00505AH039 05AH03305AH040 05AH05005AH041 05AH03905AH042 05AH00605AH043 05AH00705AH046 05AH03605AH047 05HA06105AH048 05AH00305AH049 05AK00105AH050 05HA06105AJ001 05AK00105AK001 05AK001

NAME RECEIVE05AK001 OUT05BA001 05BB00105BA002 05BB00105BA003 05BA00105BA005 05BA00105BA006 05BB00105BA007 05BB00105BA008 05BA00505BA009 05BA01005BA010 05BA00805BB001 05BB00105BB001 05BB00105BB001 05BE00805BB003 05BB00105BB004 05BB00105BB005 05BB00105BC001 05BE00805BC002 05BC00105BC006 05BC00805BC008 05BC00105BD002 05BE00805BD003 05BG01005BD005 05BD00305BE001 05BE99905BE003 05BE00405BE004 05BE00105BE006 05BH00505BE008 05BE00305BE999 05BH00505BF001 05BE00405BF002 05BF01005BF003 05BF02205BF004 05BF02305BF008 05BF00905BF009 05BF00305BF010 05BF00905BF011 05BF01005BF013 05BF00805BF015 05BF02405BF016 05BF01505BF017 05BF01605BF018 05BF01605BF019 05BF01605BF020 05BF01705BF021 05BF00205BF022 05BF02305BF023 05BF02405BF024 05BF02505BF025 05BF00105BG001 05BE006
NAME RECEIVE05BG002 05BG01005BG006 05BG00105BG009 05BG00605BG010 05BG00105BH001 05BH00205BH002 05BM00205BH003 05BH90905BH004 05BH00105BH005 05BH00805BH006 05BH00905BH008 05BH00405BH009 05BH00505BH011 05BH00605BH013 05BH01105BH901 05BH00105BH904 05BH00305BH909 05BH90105BJ001 05BH00105BJ003 05BJ00405BJ004 05BJ01105BJ004 05BJ01105BJ005 05BJ00105BJ006 05BJ00305BJ009 05BJ00605BJ010 05BJ00505BJ011 05BJ01005BK001 05BK00205BK002 05BK00305BK003 05BM00205BL003 05BL00405BL004 05BL00905BL006 05BL02305BL007 05BL00305BL008 05BL00305BL008 05BL00805BL009 05BL02405BL012 05BL02005BL013 05BL01205BL014 05BL01205BL014 05BL01205BL016 05BL00905BL018 05BL01405BL019 05BL00805BL020 05BL02405BL021 05BL01905BL022 05BL01905BL023 05BL00305BL024 05BM00205BL026 05BL00805BL027 05BL008
NAME RECEIVE05BM002 05BM00405BM004 05BM00405BM004 05BN01205BM007 05BM00805BM007 05BM00805BM008 05BM00405BM013 05BM00405BM014 05BM00405BM018 05BM01405BN*** 05AJ00105BN002 05BN01205BN006 05BN01205BN012 05BN***05BN014 05BN01205BN024 05BN01205CA001 05CA01005CA002 05CB00305CA003 05CA00905CA004 05CA00805CA005 05CA00305CA008 05CA00905CA009 05CA00105CA009 05CA00105CA010 05CB00305CA011 05CA01005CA012 05CA01005CB001 05CC00205CB002 05CB00105CB003 05CB00605CB004 05CB00605CB005 05CB00105CB006 05CC00205CC001 05CD00405CC002 05CD00405CC004 CYGNETL05CC007 05CC00205CC008 05CC00105CC009 05CC00105CC010 05CC00705CC010 05CC00705CC011 05CD00405CC012 05CC00205CD001 05CD00705CD004 05CE00105CD006 05CD00405CD007 05CD90205CD902 BUFFALO05CE001 05CE00105CE001 05CJ00905CE002 05CE001

NAME RECEIVE05CE003 05CJ00905CE004 05CE00605CE005 05CE00305CE006 05CE00505CE007 05CE00105CE008 05CE00505CE009 05CE00305CE010 05CE01805CE011 05CE00705CE011 05CE00705CE012 05CE00105CE013 05CE00205CE015 05CE00705CE016 05CE00205CE018 05CE90105CE019 05CE00405CE020 05CE00105CE901 05CE01505CG001 05CG00305CG002 05CG00105CG003 05CJ00905CG004 05CG00205CG005 05CJ00905CG006 05CJ00905CH001 05CH01605CH002 05CH00705CH003 05CH00705CH005 05CH01305CH006 05CH00305CH007 05CJ00905CH008 05CH01405CH009 05CH00505CH010 05CH00105CH011 05CH01005CH013 05CH00105CH014 05CH01105CH016 05CH00205CJ005 05CJ00905CJ006 05CH00905CJ007 05CJ01205CJ008 05CJ00905CJ009 05CK00405CJ010 05CJ00905CJ011 05CJ00905CJ012 05CJ00505CK001 05CK00405CK002 OUT05CK003 05CK00105CK004 05CK00205CK005 05CK004
NAME RECEIVE05CK006 05CK00205CK007 05CK00305DA001 05DC00705DA002 05DA00305DA003 05DC00705DA004 05DC00705DA005 05DA00905DA006 05DA00905DA007 05DA00505DA009 05DA00305DA010 05DA00705DB001 05DC00105DB002 05DB00105DB003 05DB00605DB004 05DB00505DB005 05DB00205DB006 05DB00105DC001 05DE00605DC002 05DC00105DC003 05DC00405DC004 05DC00205DC005 05DC00205DC006 05DC00105DC007 05DC00205DC008 05DC00605DC010 05DC00205DC011 05DC00605DC012 05DE00605DD001 05DD00705DD002 05DD00605DD003 05DD00605DD004 05DD00605DD005 05DE00605DD006 05DD00505DD007 05DD00605DD008 05DD00705DD009 05DE00605DE001 05DF00505DE002 05DE00305DE003 05DF00505DE005 05DE00105DE006 05DE00505DE007 05DE00505DE008 05DF00505DE009 05DF00505DF001 05EF00305DF002 0RDF00505DF003 05DF00505DF003 05DF00505DF004 05DF005
NAME RECEIVE05DF005 05DF00105DF006 05DF00505DF007 05DF00605EA001 05EF00305EA002 05EA00105EA003 STEANNE05EA004 05EA00505EA005 BIGLAKE05EA009 BIGLAKE05EA010 ISLELAK05EB001 BEAVERH05EB002 05EB01505EB005 HASTING05EB006 HASTING05EB010 BEAVERH05EB015 05EF00305EB016 BEAVERH05EB902 05EF00305EB909 05EB90205EB910 05EB90205EB911 05EB90205EC002 05EF00305EC003 05EC00505EC004 05EF00305EC005 05EF00305EC006 05EF00305EC007 05EC00305ED001 05EF00305FD001 05FD00305ED002 05EF00305ED003 05EF00305EE001 05EE00805EE002 05EF00305EE003 05EE00905EE004 05EE00205EE004 05EE00405EE005 05EE00405EE006 05EE00305EE007 05EE00405EE008 05EE00705EE009 05EE00105EE913 05EE91505EE915 05EE00305EF003 OUT05FA001 05FA02305FA001 05FA02305FA002 05FA01905FA007 05FA02205FA008 05FA02205FA010 05FA020

NAME RECEIVE05FA011 05FA02005FA012 05FA02105FA014 05FA01505FA015 05FA00805FA016 05FA02105FA017 05FA00105FA018 05FA02005FA019 05FA01705FA020 05FC00105FA021 05FA01105FA022 05FA01205FA023 05FA02105FA024 05FA02105FA912 05FA00105FB002 05FE00305FB003 05FB00205FC001 05FE00305FC002 05FE00305FC003 05FE00305FC004 05FE00305FC005 05FC00305FC006 05FC00305FC007 05FE00305FD003 05FE00405FD005 RIBSTON05FD006 05FD00505FE002 05FE00305FE003 05FE00405FE004 OUT05FE005 OUT05GA003 SOUNDLA05GA005 SOUNDLA05GA008 SOUNDLA05GA009 05GA01205GA010 OUT05GA011 05GA00305GA012 05GA00805GA013 05GA00305HA061 OUT06AA001 06AD00606AA002 06AA00106AA901 06AD00606AB001 06AD00606AB002 06AB00106AB003 06AB00106AC001 06AD00606AC006 06AD00606AC009 06AD00606AD006 06AD00606AD006 06AD006
NAME RECEIVE06AD006 OUT CHU06AD013 OUT CHU06AF001 06AD00607AA001 07AA00207AA002 07AA00207AA002 07AD00107AA003 07AD00107AA004 07AD00107AA006 07AA00307AA007 07AA00207AA008 07AD00107AA009 07AA00207AA010 07AD00807AB001 07AD00107AB002 07AB00107AC001 07AC00707AC002 07AC00707AC003 07AC00707AC004 07AC00707AC005 07AC00407AC006 07AC00707AC007 07AE00107AC008 07AC00707AD001 07AD00207AD002 07AE00107AD003 07AE00107AD004 07AE00107AD005 07AE00107AD006 07AE00107AD007 07AD00307AD008 07AE00107AD009 07AE00107AD010 07AE00107AE001 07BE00107AE001 07BE00107AE002 07AE00107AE003 07AE00107AF001 07AG00207AF002 07AG00207AF003 07AF00207AF004 07AF00207AF005 07AF00207AF006 07AF00707AF007 07AF90607AF008 07AF00207AF009 07AF00207AF010 07AG00207AF011 07AF00207AF012 07AF00207AF013 07AF002
NAME RECEIVE07AF014 07AF00107AF015 07AF00207AF906 07AF01507AF907 07AF00107AF909 07AF01407AF910 07AF01307AG001 07AG00707AG002 07AG00107AG003 07AG00107AG004 07BE00107AG005 07AG00507AG006 07AG00607AG007 07AG00407AG008 07BE00107AH001 07BE00107AH002 07BE00107AH003 07BE00107BA001 07BB00207BA002 07BA00107BA003 07BA00107BA003 07BA00107BB001 07BC00107BB002 07BC00107BB003 07BB00107BB004 07BB01207BB005 07BB01207BB005 07BB01207BB006 07BC00107BB008 07BB00307BB009 07BB01307BB010 07BB00907BB011 07BB00407BB012 07BB01307BB013 07BB00607BB014 07BC00107BB903 07BB01307BB908 07BC00107BC001 07BC00207BC002 07BE00107BC003 07BC00707BC004 07BC00207BC005 07BE00107BC006 07BC00107BC007 07BC00107BE001 07CC00207BE003 BAPTIST07BE004 07CA***07BF001 07BK00107BF002 07BF00407BF002 07BF004

NAME RECEIVE07BF002 07BF00407BF003 07BF00407BF004 07BK00107BF005 07BF00407BF006 07BF00507BF007 07BK00107BF008 07BF00407BF009 07BK00107BG004 07BK00107BH001 07BK00107BH003 07BK00107BJ001 07BK00107BJ003 07BJ00407BJ004 07BJ00107BK001 07BK00107BK001 07BK00607BK001 07BK00107BK002 07BK00307BK003 07BE00107BK004 07BK00307BK005 07BE00107BK006 07BK00207BK006 07BK00607BK007 07BE00107BK009 07BK00707CA*** 07CC00207CA001 07CA00507CA003 FLATLAK07CA005 07CC00207CA006 07CC00207CA007 07CA01107CA008 07CA00507CA009 LACLABI07CA010 07CA01307CA010 07CA01307CA011 07CC00207CA012 07CA01307CA013 07CA00907CA901 07BE00407CB002 07CC00207CC001 07DA00107CC002 07DA00107CD001 07CD00307CD001 07CD00107CD002 07DA00107CD003 07CD00207CD004 07CD00207CD005 07CD00107CE001 07CD00107CE002 07CE001
NAME RECEIVE07CE003 07CD00107CE004 07CD00107CE005 07CE00207CE006 07CE00507DA001 07DA00207DA002 07DA00307DA003 07DA00407DA004 07DD00107DA005 07DA00307DA006 07DA00207DA007 07DA00207DA008 07DA00307DA009 07DA00807DA011 07DA00407DA012 07DA00407DA013 07DA00407DA014 07DA00407DA015 07DA00407DA016 07DA00407DA017 07DA00407DA018 07DA00507DA019 07DA01507DA022 EAGLENE07DB001 07DA00307DB002 07DB00107DB003 07DB00507DB004 07DB00107DB005 07DB00107DC001 07DD00107DC002 07DC00107DD001 07DD01107DD002 07DD01007DD003 07KF01507DD007 OUT07DD009 OUT07DD010 07DD00707DD011 07DD01007FD003 07AH00107FD006 07HA00107FD007 07FD00307FD008 07FD00307FD009 07FD00307FD011 07FD00807FD012 07FD00307FD013 07FD00907FD014 07HA00107FD913 07FD00307FD921 07HA00107GA001 07GJ00207GA002 07GJ002
NAME RECEIVE07GB001 07GJ00207GB001 07GJ00207GB002 07GB00307GB003 07GJ00207GC002 07GE00107GD001 07GE00107GD002 07GD00107GD003 07GE00107GE001 07GJ00207GE003 07GE00507GE005 07GJ00207GE006 BEARLAK07GE007 BEARLAK07GF001 07GJ00207GF002 07GF00107GF003 07GF00207GF004 07GF00207GF005 07GF00207GF006 07GF00207GF007 07GF00207GF008 07GF00107GG001 07GH00107GG002 07GH00107GG003 07GH00107GH001 07GH00207GH002 07GJ00107GH004 07GJ00107GH005 07GJ00107GJ001 07AH00107GJ002 07GJ00107GJ002 07GJ00207GJ004 07GJ00107GJ005 07HA00107HA001 07HD00107HA002 07HD00107HA003 07HA00207HA004 07HD00107HA005 07HA00407HA902 07HA00307HB001 07HD00107HB002 07HD00107HC001 07HD00107HC002 07HD00107HD001 07HF00107HF001 07KA00207HF002 07HF00107JA003 07JB00207JB002 07JD00207JC001 07JD00207JC002 07JD002

NAME RECEIVE07JD001 07KA00207JD002 07JD00407JD003 07KA00207JD004 07KA00207JF002 07KA00207JF003 07KA00207JF004 07JF00207KA002 07KC00107KC001 07KC00507KC005 OUT07KE001 07KC00507KF009 07KC00507KF015 OUT07NA003 OUT07NB001 07NA00307NB006 07NB00707NB007 OUT07NB008 OUT07OA001 07OB00307OB001 OUT07OB003 07OB00107OB004 07OB00107OB005 07OB00307OB006 07OB00107OB007 07OB00507OC001 07OB00311AA002 11AA00311AA003 11AA005
11AA004 11AA00511AA005 11AA00611AA006 11AA03411AA007 11AA03511AA009 11AA02711AA011 11AA03611AA023 OUT11AA024 OUT11AA026 11AA00911AA027 OUT11AA031 OUT11AA031 OUT11AA034 11AA03611AA035 11AA03111AA036 11AA00711AA038 11AA00611AA039 11AA03811AB007 11AB90211AB009 11AB08011AB023 11AB08211AB063 11AB007
NAME RECEIVE11AB080 OUT11AB081 OUT11AB082 OUT11AB082 OUT11AB086 11AB02311AB090 11AB11711AB091 11AB00711AB092 11AB10411AB093 11AB90211AB094 11AB08211AB097 11AA02611AB098 OUT11AB099 11AB00911AB104 11AB90211AB111 11AB11711AB117 11AB08111AB902 11AB023BAPTIST 07BE001BEARLAK 07GE005BEAVERH 05EB002BEAVERL 06AA001BIGLAKE 05EA002BUFFALO 05CE001CALLING 07CC002COOKING HASTINGCYGNETL 05CC002DOWLING 05CG001EAGLENE GARDINE
ETHELLK 06AD006ETHELLK 06AD006FAWCETT 07BK007FLATLAK 07CA005FRANKLA 05AC003GARDINE 07DA017GULLLAK 05CC001HASTING 05EB001HILDALK ETHELLKISLELAK 05EA003LACLABI BEAVERLLACLANO 07BC001MARIELK ETHELLKMINISTI 05EB010MIQUELO 05EB010MOORELA HILDALKMURIELL 06AD006NAKAMUN LACLANONAMURLA 07DB003PAKOWKI 05AH039PEERLES 07JB002
NAME RECEIVERIBSTON 05FD001RICHARD 07DD009SHOALLA 07BC004SMOKYLK 05EF003SOUNDLA OUTSTEANNE 05EA004STURGEO 07GH001SULLIVA DOWLINGSWABASC 07JB002THOMASL 05FE003THUNDER 07BB006TYRELLL 05AF031UTIKUMA 07JB002WATERTO 05AD003

Appendix 6
SAS Code Used to Import and Parse AGRASID Soil and LandscapeInformation

The SAS code used to import AGRASID soil and landscape information into SAS datatables, organized for access for AERES follows. Note that AERES uses the Soil Polygonnumber as the key index variable to retrieve data.
libname agradata 'd:\agrasid\sas';
*1. create views of dbf data ;*2. process pc-mas and cn-mas into allmasjk ;* - put mas_ext of signifigant soils into s1 to s5 order;* - filter aa in new_symb;* - assign area factor to each mas_ext;
*3. process pc-sl and cn-sl into allsl;*4. process snf - drop 'N' land use if 'A' landuse exists;* - filter aa in new_symb, drop dup codes after;*5. process slf - drop 'N' land use if 'A' landuse exists;* - filter aa in new_symb, drop dup codes after;
** section 1 ;proc access dbms=dbf ;
create work.pc_mas.access;path='d:\agrasid\dbf\pc-mas.dbf';
create work.pc_mas.view;select all;
run;
proc access dbms=dbf ;create work.cn_mas.access;path='d:\agrasid\dbf\cn-mas.dbf';
create work.cn_mas.view;select all;
run;
proc access dbms=dbf ;create work.pc_sl.access;path='d:\agrasid\dbf\pc-sl.dbf';
create work.pc_sl.view;select all;
run;
proc access dbms=dbf ;create work.cn_sl.access;path='d:\agrasid\dbf\cn-sl.dbf';
create work.cn_sl.view;select all;
run;
proc access dbms=dbf ;create work.slf.access;path='d:\agrasid\dbf\slf.dbf';

create work.slf.view;select all;
run;
proc access dbms=dbf ;create work.snf.access;path='d:\agrasid\dbf\snf.dbf';
create work.snf.view;select all;
run;
**********************************************************************;** section 2 - a ;* need to estimate the area of each soil(new_symb) assigned
to a soilpoly ;* cleanup data;
data all_mas;set pc_mas cn_mas ;new_symb=compress(new_symb,'a');if upcase(mas_ext) eq 'SL' then MAS_EXT='S1'; * data coding error;mas_ext=upcase(mas_ext);* aa code used to indicate out of area for soil, props the same;drop delete_f;
if soilpoly in (42004824,42105353) then put '0 ' soilpoly= new_symb=mas_ext= ;run;
proc sort data=all_mas ;by soilpoly mas_ext ;run;
* need to handle s1 and s4 filled in, but not s2 and s3. affectsarea fact calcs if not in filled in 1,2,34;
* 2 pass should get most, may need 3 passes;data all_mas;set all_mas;by soilpoly mas_ext;last_ext = lag1(mas_ext);
if soilpoly in (42004824,42105353) then put '0 ' soilpoly= new_symb=mas_ext= last_ext=;if mas_ext in ('S1' 'S2' 'S3' 'S4') THEN DO;
if mas_ext='S1' and last_ext eq 'S1' then do;mas_ext='S3';
end;elseif mas_ext='S2' and last_ext eq 'S2' then do;
mas_ext='S4';end;elseif mas_ext='S2' and last_ext ne 'S1' then do;
mas_ext='S1';
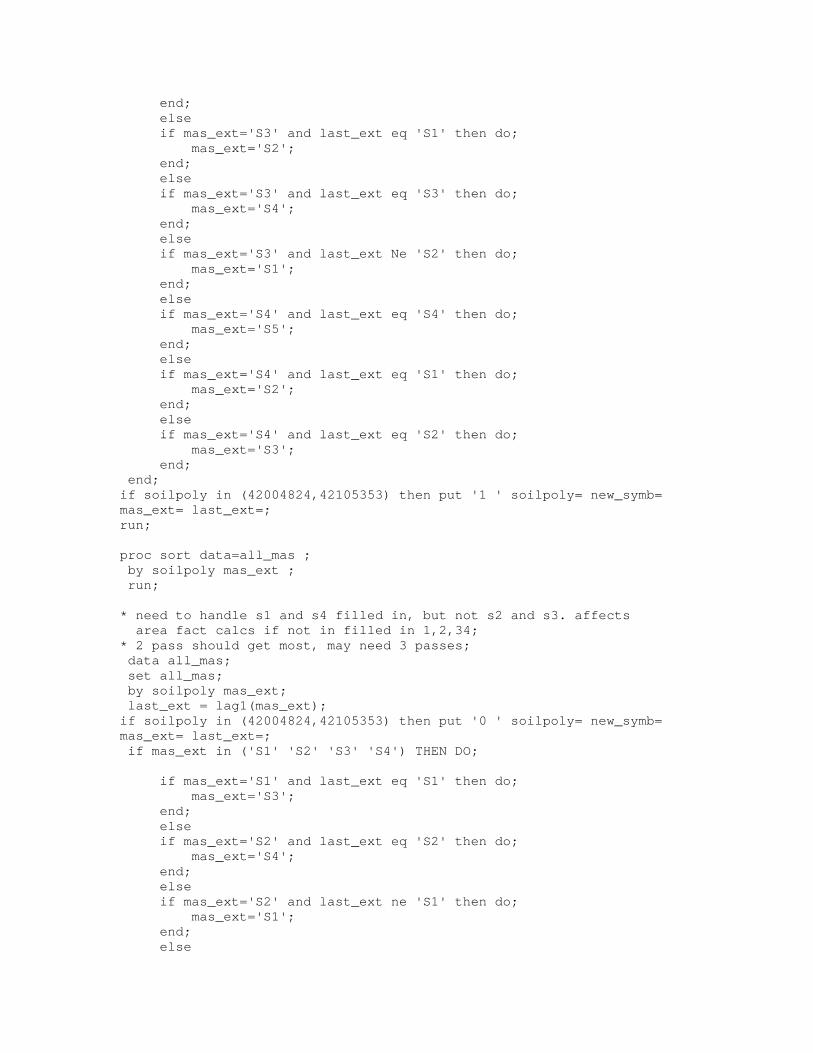
end;elseif mas_ext='S3' and last_ext eq 'S1' then do;
mas_ext='S2';end;elseif mas_ext='S3' and last_ext eq 'S3' then do;
mas_ext='S4';end;elseif mas_ext='S3' and last_ext Ne 'S2' then do;
mas_ext='S1';end;elseif mas_ext='S4' and last_ext eq 'S4' then do;
mas_ext='S5';end;elseif mas_ext='S4' and last_ext eq 'S1' then do;
mas_ext='S2';end;elseif mas_ext='S4' and last_ext eq 'S2' then do;
mas_ext='S3';end;
end;if soilpoly in (42004824,42105353) then put '1 ' soilpoly= new_symb=mas_ext= last_ext=;run;
proc sort data=all_mas ;by soilpoly mas_ext ;run;
* need to handle s1 and s4 filled in, but not s2 and s3. affectsarea fact calcs if not in filled in 1,2,34;
* 2 pass should get most, may need 3 passes;data all_mas;set all_mas;by soilpoly mas_ext;last_ext = lag1(mas_ext);
if soilpoly in (42004824,42105353) then put '0 ' soilpoly= new_symb=mas_ext= last_ext=;if mas_ext in ('S1' 'S2' 'S3' 'S4') THEN DO;
if mas_ext='S1' and last_ext eq 'S1' then do;mas_ext='S3';
end;elseif mas_ext='S2' and last_ext eq 'S2' then do;
mas_ext='S4';end;elseif mas_ext='S2' and last_ext ne 'S1' then do;
mas_ext='S1';end;else

if mas_ext='S3' and last_ext eq 'S1' then do;mas_ext='S2';
end;elseif mas_ext='S3' and last_ext eq 'S3' then do;
mas_ext='S4';end;elseif mas_ext='S3' and last_ext Ne 'S2' then do;
mas_ext='S1';end;elseif mas_ext='S4' and last_ext eq 'S4' then do;
mas_ext='S5';end;elseif mas_ext='S4' and last_ext eq 'S1' then do;
mas_ext='S2';end;elseif mas_ext='S4' and last_ext eq 'S2' then do;
mas_ext='S3';end;
end;if soilpoly in (42004824,42105353) then put '1 ' new_symb= mas_ext=last_ext=;run;
proc sort data=all_mas ;by soilpoly mas_ext ;run;
* need to handle s1 and s4 filled in, but not s2 and s3. affectsarea fact calcs if not in filled in 1,2,34;
* 2 pass should get most, may need 3 passes;data all_mas;set all_mas;by soilpoly mas_ext;last_ext = lag1(mas_ext);
if soilpoly in (42004824,42105353) then put '0 ' soilpoly= new_symb=mas_ext= last_ext=;if mas_ext in ('S1' 'S2' 'S3' 'S4') THEN DO;
if mas_ext='S1' and last_ext eq 'S1' then do;mas_ext='S3';
end;elseif mas_ext='S2' and last_ext eq 'S2' then do;
mas_ext='S4';end;elseif mas_ext='S2' and last_ext ne 'S1' then do;
mas_ext='S1';end;else
if mas_ext='S3' and last_ext eq 'S1' then do;mas_ext='S2';
end;elseif mas_ext='S3' and last_ext eq 'S3' then do;
mas_ext='S4';end;elseif mas_ext='S3' and last_ext Ne 'S2' then do;
mas_ext='S1';end;elseif mas_ext='S4' and last_ext eq 'S4' then do;
mas_ext='S5';end;elseif mas_ext='S4' and last_ext eq 'S1' then do;
mas_ext='S2';end;elseif mas_ext='S4' and last_ext eq 'S2' then do;
mas_ext='S3';end;
end;if soilpoly in (42004824,42105353) then put '1 ' new_symb= mas_ext=last_ext=;run;
* note need to access all new_symb for a soilpoly at the same time;data q;
set all_mas;by soilpoly;retain factor 0 D C1 C2 C3 c4 S1 S2 S3 S4 S5 0;if first.soilpoly then do;
factor=0;D=0; C1=0; C2=0; C3=0; S1=0; S2=0; S3=0; S4=0; s5=0;c4=0;
end;
if upcase(mas_ext) eq 'D' then D=1;if upcase(mas_ext) eq 'C1' then C1=1;if upcase(mas_ext) eq 'C2' then C2=1;if upcase(mas_ext) eq 'C3' then C3=1;if upcase(mas_ext) eq 'C4' then C4=1;if upcase(mas_ext) eq 'S1' then S1=1;if upcase(mas_ext) eq 'S2' then S2=1;if upcase(mas_ext) eq 'S3' then S3=1;if upcase(mas_ext) eq 'S4' then S4=1;if upcase(mas_ext) eq 'S5' then S5=1;
if last.soilpoly then do;* estimate the area of each soil(new_symb) assigned
to a soilpoly by handling all logical combinations of mas_ext;
if d then do;select(sum(s1,s2,s3,s4));when('4') do;

d=.6; c1=0; c2=0; c3=0; s1=.1; s2=.1; s3=.1; s4=.1; s5=0;end;
when('3') do;d=.7; c1=0; c2=0; c3=0; s1=.1; s2=.1; s3=.1; s4=0; s5=0;end;
when('2') do;d=.8; c1=0; c2=0; c3=0; s1=.1; s2=.1; s3=0 ; s4=0; s5=0;end;
when('1') do;d=.9; c1=0; c2=0; c3=0; s1=.1; s2=0 ; s3=0 ; s4=0; s5=0;end;
when('0') do;d=1.0; c1=0; c2=0; c3=0; s1=0; s2=0 ; s3=0 ; s4=0; s5=0;end;
otherwise;end;
end;if c1 then do;
select(sum(s1,s2,s3,s4));when('4') do;
d=0 ; c1=.3; c2=0.3; c3=0; s1=.1; s2=.1; s3=.1; s4=.1; s5=0;end;
when('3') do;d=0 ; c1=0.35; c2=0.35; c3=0; s1=.1; s2=.1; s3=.1; s4=0;
s5=0;end;
when('2') do;d=0 ; c1=0.4; c2=0.4; c3=0; s1=.1; s2=.1; s3=0 ; s4=0; s5=0;end;
when('1') do;if c3=0 then do;
d=0; c1=0.45; c2=0.45; c3=0; s1=0.1; s2=0 ; s3=0 ; s4=0;s5=0;
end;else do;
d=0; c1=.3; c2=0.3; c3=0.3; s1=0.1; s2=0 ; s3=0 ; s4=0;s5=0;
end;end;
when('0') do;if c3=0 then do;
d=0; c1=0.5; c2=0.5; c3=0; s1=0; s2=0 ; s3=0 ; s4=0; s5=0;end;else do;
d=0; c1=.3334; c2=0.3333; c3=0.3333; s1=0; s2=0 ; s3=0 ;s4=0; s5=0;
end;end;otherwise;end;
end;if not(c1) and not(d) then do;
select(sum(s1,s2,s3,s4,s5));when('4') do;
d=0 ; c1=0; c2=0; c3=0; s1=.25; s2=.25; s3=.25; s4=.25; s5=0;end;
when('5') do;

d=0 ; c1=0; c2=0; c3=0; s1=.2; s2=.2; s3=.2; s4=.2; s5=0.2;end;
otherwise;end;
end;x=sum(d,c1,c2,c3,c4,s1,s2,s3,s4,s5);if not(0.99< x < 1.01) then put x= d c1 c2 c3 s1= s2= s3= s4= s5=;if soilpoly in (42004824,42105353) then put soilpoly= x= d c1 c2 c3
s1= s2= s3= s4= s5=;output;
end; * lastpoly;
keep soilpoly new_symb d c1 c2 c3 c4 s1 s2 s3 s4 s5;run;* restructure for merge;
data z;length mas_ext $2;set q;
if soilpoly in (42004824,42105353) then put soilpoly= x= d c1 c2 c3s1= s2= s3= s4= s5=;
mas_ext='D';areafact=d; output;mas_ext='C1';areafact=C1; output;mas_ext='C2';areafact=C2; output;mas_ext='C3';areafact=C3; output;mas_ext='C4';areafact=C4; output;mas_ext='S1';areafact=S1; output;mas_ext='S2';areafact=S2; output;mas_ext='S3';areafact=S3; output;mas_ext='S4';areafact=S4; output;mas_ext='S5';areafact=S5; output;
KEEP SOILPOLY MAS_EXT AREAFACT;RUN;
* check for deleted obs in log, dup data in source dbf;proc sort data=z out=qq nodupkey ;by soilpoly mas_ext; run;
* check for deleted obs in log, dup data in source dbf;proc sort data=all_mas out=xxx NODUPKEY ;by soilpoly mas_ext; run;
data agradata.allmasjk;merge QQ(IN=INB) xxx(in=ina);by soilpoly mas_ext;* check for problems ;IF INA AND NOT(INB) THEN PUT SOILPOLY= NEW_SYMB= MAS_EXT=;
if soilpoly in (42004824,42105353) then put soilpoly= mas_ext=areafact=;
if ina;run;
* check for deleted obs in log, dup data in source dbf;proc sort data=agradata.allmasjk nodupkey;by soilpoly new_symb mas_ext;run;
* check for problems ;proc summary data=agradata.allmasjk(keep=soilpoly areafact) nway;class soilpoly;
var areafact;output out=t sum=sum;run;
proc print;where sum >1.000 or sum < 0.9;run;*************************************************************************************;*** section 3 - process sl data;
data agradata.all_sljk;set pc_sl cn_sl ;drop delete_f;
run;
*************************************************************************************;*** section 4 - process snf data;* snf has A for ag profile, N for natural. Take A as per connie;*remove aa from new_symb;data snf1;set snf;
new_symb=compress(new_symb,'a');run;* note 'A' code will be taken if both exist;proc sort data=snf1 ;by new_symb lu;
run;
data agradata.snfjk;set snf1;by new_symb lu;if first.lu then output;
run;
*************************************************************************************;*** section 5 - process slf data;* snf has A for ag profile, N for natural. Take A as per connie;*remove aa from new_symb;data slf1;set slf;
new_symb=compress(new_symb,'a');run;
proc sort ; by new_symb lu layer_no; run;* check this dataset to insure deleting aa loses no data;* ie records are identical except for variant column;data checkdup;set slf1;by new_symb lu layer_no;if first.layer_no ne last.layer_no;
run;

proc sort data=slf1 nodupkey; by new_symb lu layer_no; run;
* use snf table to filter whether A or N lu kept;proc sql;create table slf2 asselect a.*from slf1 as a, agradata.snfjk as bwhere a.new_symb=b.new_symb and a.lu=b.lu ;
quit;
proc sort data=slf2 nodupkey out=agradata.slfjk;by new_symb lu layer_no;
run;

Appendix 7
SAS Code Used to Classify Soil Polygons by Landscape and SoilCharacteristics (Potential for Runoff)

Soil Polygon Landscape Characteristics for Runoff Potential Type
data agradata.splylscp;set agradata.all_sljk(keep=soilpoly sl_lmode sl_lmod);length lmodemod $6 lscaptyp $1;lmodemod=compress( sl_lmode || '-' || sl_lmod);
;lscaptyp ='4';if upcase(SL_lmode) in ('M1M','M1H','R2M','R2H','U1H','SC1','SC1L','SC1H','SC2','SC3','SC4''I3','I3L','I3M','I3H','I4','I4L','I4M','I4H','I5','I5L','I5M','I5H''I1','I1L','I1M','I1H','I2','I2L','I2M','I2H','IUL','IUH'
) THEN lscaptyp='1';
if upcase(SL_lmode) in ('H1L','H1M','H1H''H5L','H5M','H5H'
,'HP1','HP1H','HP1M','HR2','HR2H','HR2M') THEN lscaptyp='2';
if upcase(SL_lmode) in ('L1','L2','L3'
,'R2L','U1L','O1','O2','O3','O4','O5') THEN lscaptyp='3';run;
Soil Textures and Restrictive Layers for Runoff Potential Class
libname agradata 'd:\agrasid\sas';
/*objective is to create a dataset at soilpoly resolution
note the following column definitionshigh - percent of soilpoly in high runoff classmed - percent of soilpoly in med runoff classlow - percent of soilpoly in low runoff classunkn - percent of soilpoly not assigned to a runoff class
A2 - percent of soilpoly with restrictive layer based on criteria 2A3 - percent of soilpoly with restrictive layer based on criteria 3A4 - percent of soilpoly with restrictive layer based on criteria 4UK - percent of soilpoly not assigned to a restrictive layer class*/
*CODE FOR RESTRICTIVE LAYERS;data t;set agradata.slfjk;

length texture $4 REST_LAY $2;new_symb=compress(new_symb,'a');
* CALC SOIL TEXTURE;TEXTURE=' ';if tsand >85 and tsilt+(tclay*1.5) <=15then texture='S';if tsand >=85 and tsand <=90 and tsilt+(tclay*1.5) >15then texture='LS';if tsand >=70 and tsand <85 and tsilt+(tclay*2.0) <=30then texture='LS';if tclay <=20 and tsilt+(tclay*2) >30 and tsand >=52then texture='SL';if tclay <7 and tsilt <50 and tsand >=43 and tsand <=52then texture='SL';if tclay >=7 and tclay <=27 and tsilt >=28 and tsilt <50 and tsand <52then texture='L';if tsilt >=50 and tclay >=12 and tclay <=27then texture='SIL';if tsilt >=50 and tsilt <=80 and tclay <12then texture='SIL';if tsilt >=80 and tclay <12then texture='SI';if tclay >20 and tclay <=35 and tsilt <28 and tsand >45then texture='SCL';if tclay >27 and tclay <=40 and tsand >=20 and tsand <=45then texture='CL';if tclay >27 and tclay <=40 and tsand <20then texture='SICL';if tclay >=35 and tsand >45then texture='SC';if tclay >40 and tsilt >=40then texture='SIC';if tclay >40 and tclay<=60 and tsand <45 and tsilt <40then texture='C';if tclay >60then texture='HC';if texture='' then put layer_no= tsand= tsilt= tclay= NEW_SYMB=;* CALC RESTRICTIVE HORIZONS;rest_lay='UK';if KSAT<10.000 then rest_lay='A4';if upcase(variant)='XP' and upcase(hzn_mas) = 'C' then rest_lay='A3';if upcase(variant)='XP' and upcase(hzn_mas) = 'R' then rest_lay='A3';if upcase(variant)='XL' and upcase(hzn_mas) = 'C' then rest_lay='A3';if upcase(variant)='XL' and upcase(hzn_mas) = 'R' then rest_lay='A3';IF UPCASE(HZN_SUF)='N' THEN REST_LAY='A2';IF UPCASE(HZN_SUF)='NT' THEN REST_LAY='A2';IF UPCASE(HZN_SUF)='NJT' THEN REST_LAY='A2';IF UPCASE(HZN_SUF)='NTJ' THEN REST_LAY='A2';IF UPCASE(HZN_SUF)='NJTJ' THEN REST_LAY='A2';if upcase(hzn_mas)="O" then rest_lay='UK';if udepth>50 then rest_lay='UK';*if layer_no=1 then output;keep new_symb rest_lay layer_no texture lu VARIANT; run;run;
proc sort nodupkey;

by new_symb lu layer_no;run;
data t1;set t;length orestlay stexture $4;retain orestlay stexture'';by new_symb lu;if first.lu then do; stexture=texture; orestlay='UK'; end;if rest_lay IN ('A2','A3','A4') and orestlay eq 'UK' then
orestlay=rest_lay;if last.lu then do;
restrlay=orestlay;output;
end;drop orestlay rest_lay layer_no ;run;
proc sort nodupkey;by new_symb lu;run;
data symrest1;set t1;by new_symb;if first.new_symb then output;
run;
* merge with area factor and soilpoly info ;proc sort data=agradata.allmasjk; by new_symb; run;
*CODE FOR RUNOFF ASSIGNMENT;
data symrestr;length runoff srunoff $4;merge agradata.allmasjk(in=ina) symrest1(in=inb);by new_symb;* if restrlay IN ('A2','A3','A4') then put restrlay=;if soilpoly eq . then delete; * only need codes appearing in mas file;if restrlay='' then restrlay='UK'; * not in soils file;*if not(ina and inb) then put ina= inb= new_symb= lu= ;srunoff='UNKN';* set runoff based on mas_order and texture;select(upcase(mas_orde)) ;when ('BRUN') do;
end;when ('VERT') do;
end;when ('SOLO') do;
end;when ('CHER') do;
if STEXTURE in ('SI','SIL','SCL','SIC','C','HC') thensrunoff='HIGH';
if STEXTURE in ('L','CL','SICL') then srunoff='MED';if STEXTURE in ('S','SL','LS') then srunoff='LOW';end;
when ('LUVI') do;
if STEXTURE in ('SI','SIL','SCL','SIC','C','HC') thensrunoff='HIGH';
if STEXTURE in ('S','SL','LS') then srunoff='MED';end;
when ('REGO') do;end;
otherwise;end;* set runoff by using mas_sg, independant of mas_orde;*brun;
if upcase(mas_sg) eq 'E.DYB' then srunoff='HIGH';*vert;
if upcase(mas_sg) in ('O.HV','O.V') then srunoff='HIGH';*solo;
if upcase(mas_sg) in ('B.SO''B.SS''B.SZ''DB.SO''DB.SS''DB.SZ''BL.SO''BL.SS''BL.SZ') then srunoff='HIGH';
* cher;if upcase(mas_sg) eq 'O.BL' and variant ne 'TA' then
srunoff='LOW';if upcase(mas_sg) eq 'O.BL' and STEXTURE in ('L','CL','SICL') then
srunoff='LOW';if upcase(mas_sg) in (
'SZ.B''SZ.DB''SZ.BL'
) then srunoff='MED';*luvi;if upcase(mas_sg) in (
'O.GL''SZ.GL''GLD.GL''GLSZ.GL'
) then srunoff='HIGH';if upcase(mas_sg) in (
'D.GL') then srunoff='MED';*rego;if upcase(mas_sg) in ('O.R','O.HR') then srunoff='LOW';*IF UPCASE(MAS_ORDE)='CHER' AND SRUNOFF='UNKN' THEN PUT MAS_SG=STEXTURE=;runoff=srunoff;if restrlay IN ('A2','A3','A4') then runoff='HIGH';run;
proc sort;by soilpoly descending areafact mas_ext;run;
* create the runoff risk columns;

proc summary data=symrestr nway;class soilpoly runoff;var areafact;output out=xruno sum=areafact;run;
proc transpose out=zruno;by soilpoly;id runoff;var areafact;run;
* create the restrictive layer columns;proc summary data=symrestr nway;class soilpoly restrlay;var areafact;output out=xrest sum=areafact;run;
proc transpose out=zrest;by soilpoly;id restrlay;var areafact;run;
* combine the columns at soilpoly level ;data z;
merge zruno(in=ina) zrest(in=inb);by soilpoly;if not(ina and inb) then put ina= inb= ;
run;
* final dataset soilpoly runoff/ restrictive layer percentages;data agradata.splyruno;set z;high=100*high;unkn=100*unkn;low =100*low;med =100*med;uk =100*uk;a2 =100*a2;a3 =100*a3 ;a4 =100*a4;
run;