watt smart wireless single phase power monitoring system (wpms) kamyar g. osgoei glen nogayev titus...
Post on 20-Dec-2015
213 views
TRANSCRIPT

Watt SmartWireless Single Phase Power
Monitoring System(WPMS)
• Kamyar G. Osgoei
• Glen Nogayev
• Titus Cheund
• Wenqi Sun
• Babak Sobhani

Outline• Introduction• Motivation• Existing Products• System Overview• Product Design• Test Measurements• Budget and Timeline• Business Opportunities• Problems Encountered• Future Development

Introduction

Watt Smart Inc.
• Kamyar: CEO– R&D, HW, Documentation, Wireless
• Titus: CFO– Funding request, R&D, Documentation, Wireless
• Glen: COO– Documentation, Wireless, R&D, HW
• Wenqi: CSO– HW, SW, PC Interface, Q/A
• Babak: CTO– HW, SW, R&D, Q/A

Motivation
• Improve the efficiency of your home
• Consumers: save energy and money
• Average household power consumption in BC is 11,000 kWh/year
• BC Hydro to become energy self-sufficient by 2016
Existing Products
• Some devices perform only basic measurements
• Most products don’t have wireless option
• Not accurate!
• Eg. Kill-a-Watt and Blue Planet

Our Solution
• Low cost, portable power monitor
• Measure power/energy/power factor
• High accuracy
• Wireless capability
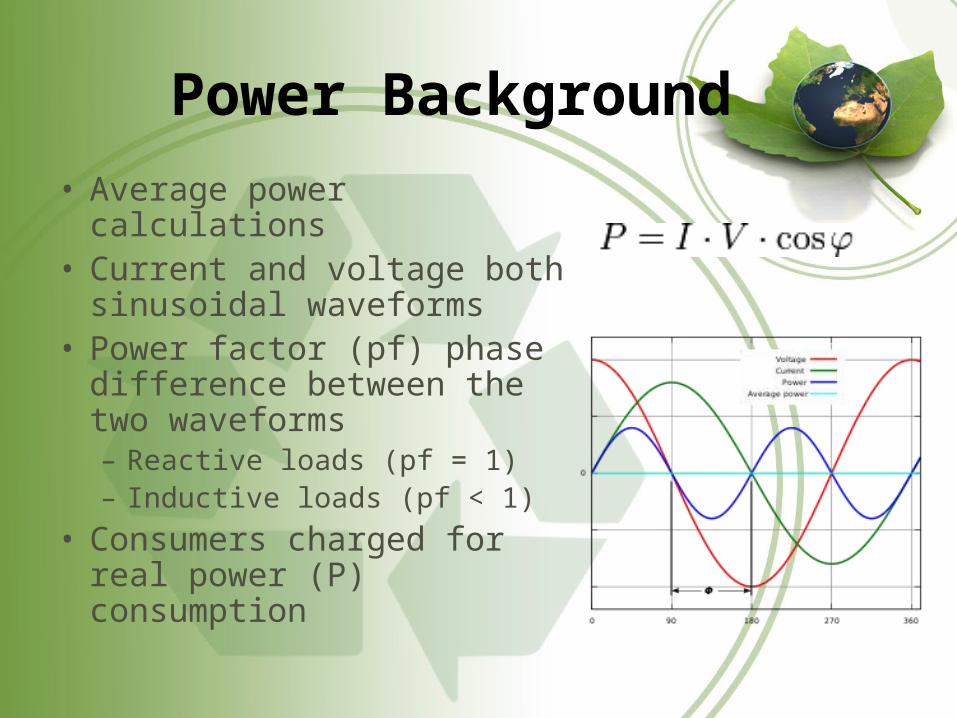
Power Background
• Average power calculations• Current and voltage both
sinusoidal waveforms• Power factor (pf) phase
difference between the two waveforms– Reactive loads (pf = 1)– Inductive loads (pf < 1)
• Consumers charged for real power (P) consumption
System Overview
– Consists of sensing and PC interface units
– Easy to install and maintain
– Wireless communication with PC
– Capable of monitoring several units
– Provides kW, kWh, and electricity cost

System Overview
– High level system design
– Current and voltage inputs
– Power, energy and power factor outputs
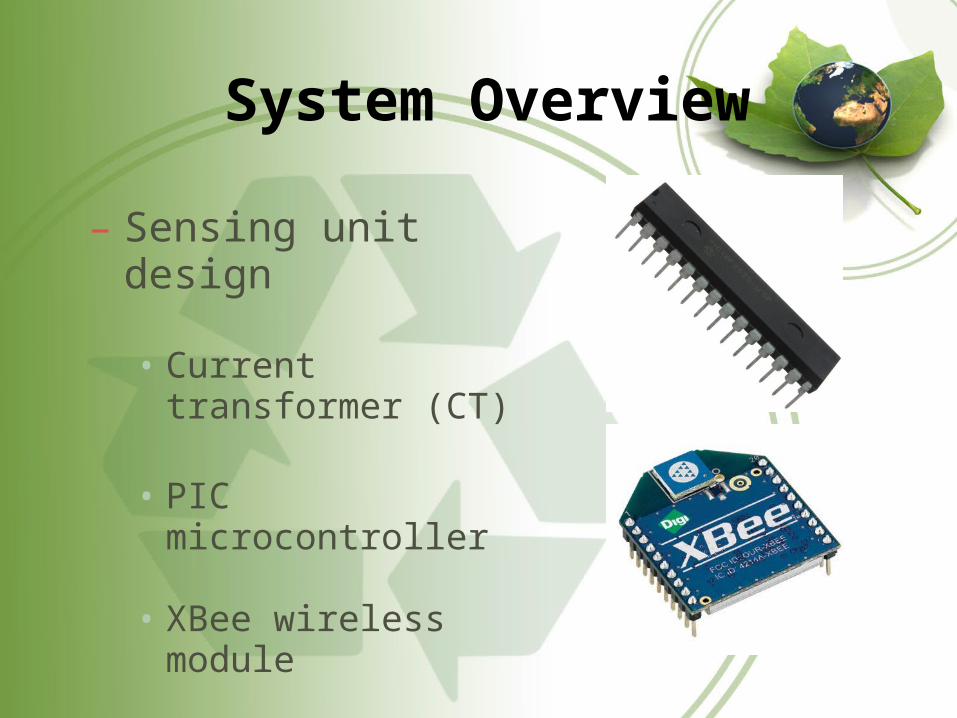
System Overview
– Sensing unit design
• Current transformer (CT)
• PIC microcontroller
• XBee wireless module
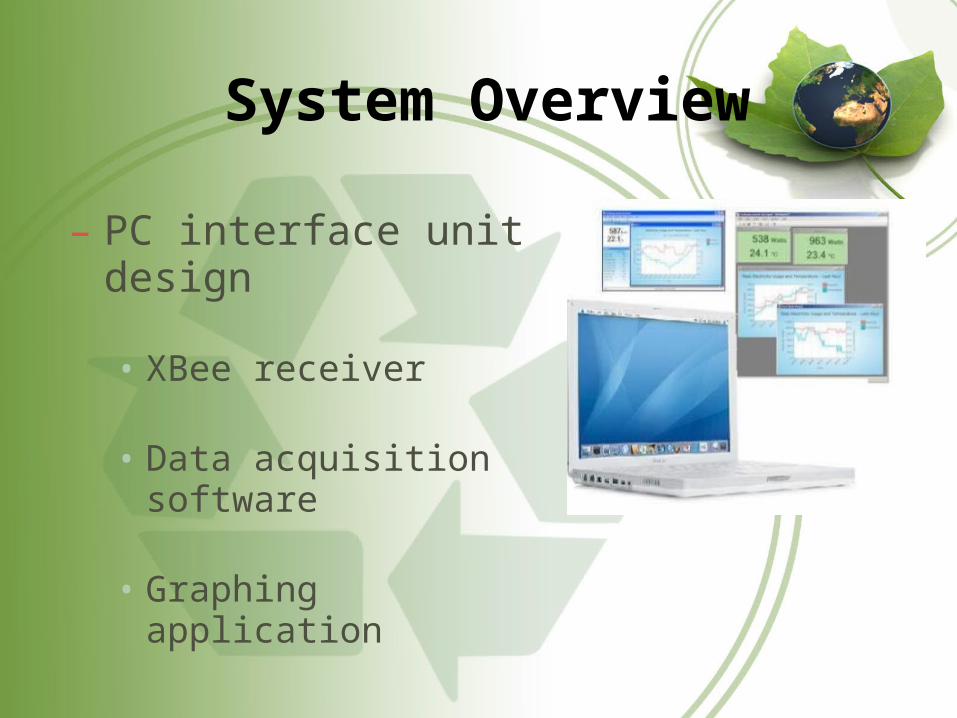
System Overview
– PC interface unit design
• XBee receiver
• Data acquisition software
• Graphing application

What is measured? Why?
What?
Power, measured in kW.
Why?
It gives us a sense of the rate at which we are consuming energy (J/S).

What is measured? Why?
What?
Power Factor
Why?
It a measure of real power consumption to reactive power flow.

What is measured? Why?
What?
Real time energy consumption cost, shown in Canadian dollars.
Why?
You tell me!

Power Theory and Technical Implementation:
1-Theory behind calculations
2-Hardware (Sensing Unit)
3-Software (PC Interface Unit)

Theory
Process of calculating power factor, power and real time cost:
1-Data acquisition (Voltage and Current).2-Filtering voltage and Fourier transforming
current.3-Calculating THD factor.4-Calculating PF.5-Calculating Power.6-Calculating real time cost.

Theory (Data Acquisition)

Theory (Data Acquisition)

Theory (Filtering Voltage)

Theory (DFT of Current)

Theory (DFT of Current)

True Power Factor or Not So Much True Power Factor, That Is The
Question!!

Theory (Calculating Power)
P=Vrms*Irms*PF

Theory (Calculating Real Time Cost)
• Real time cost=(Power in kW)*1h*($ per kWh)
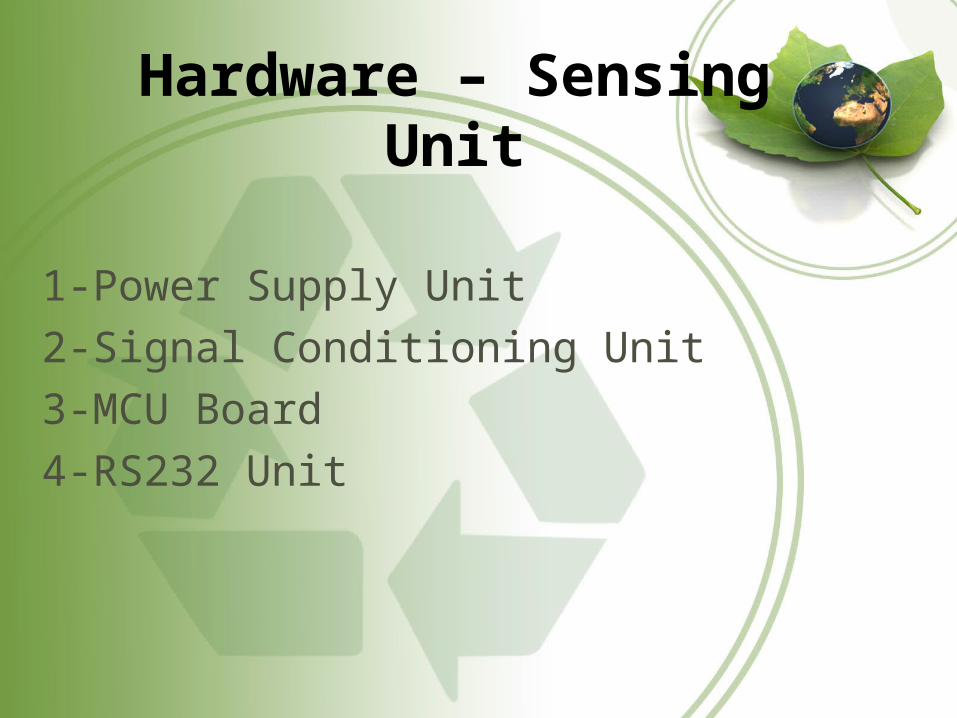
Hardware – Sensing Unit
1-Power Supply Unit
2-Signal Conditioning Unit
3-MCU Board
4-RS232 Unit
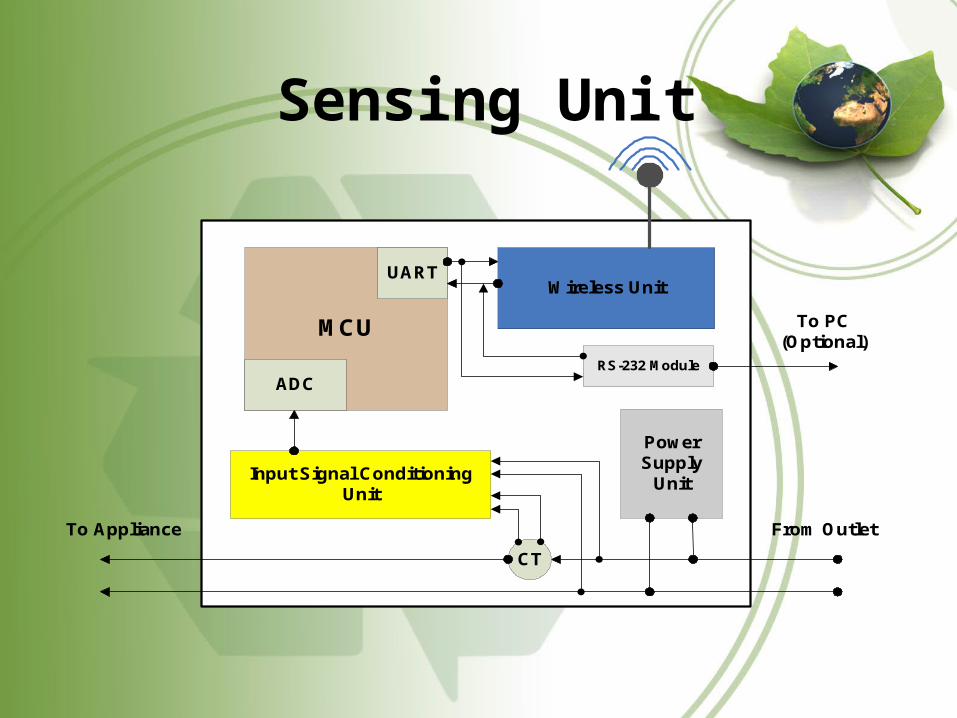
Sensing Unit
Wireless Unit
Input Signal Conditioning Unit
MCU
Power Supply
Unit
CT
ADC
UART
From OutletTo Appliance
RS-232 Module
To PC (Optional)

Hardware (Power Supply Unit)
• Supplies +12V, -12V to Opamps
• Supplies +5V to MCU, RS232 and Signal Conditioning Unit
• Real Scenario
Hardware (Signal Conditioning Unit)
• Converts voltage and current’s range to 0-5V.

Hardware (MCU Board & RS232)
• MCU ADC (12 bits) unit performs the sampling and send them off to RS232 unit.
• RS232 unit sends data to the laptop.
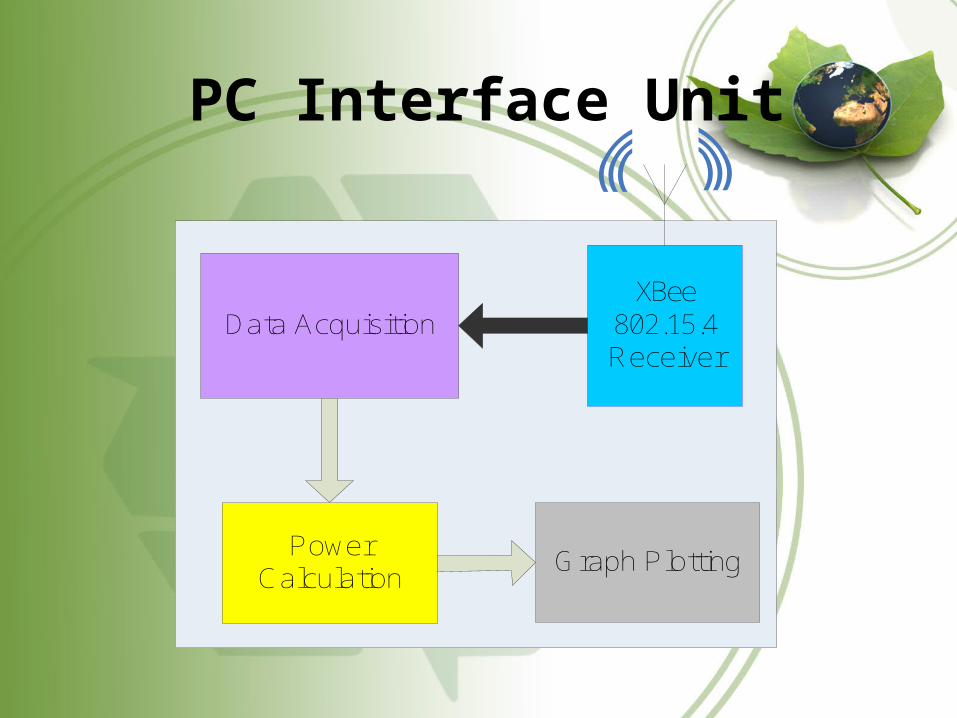
PC Interface Unit
XBee 802.15.4Receiver
Data Acquisition
Power Calculation
Graph Plotting

PC Interface
• Why we choose PC Interface– Easy Accessibility– Easy to use– Faster calculation– Database support available– More functionality– High compatibility with industry

PC Interface
• How to make a good Interface– User’s need is the first thing we consider– Structure Principle– Simplicity Principle– Feedback Principle– Tolerance Principle– Reuse Principle

PC Interface
• MDI (Multiple-document interface)
PC Interface
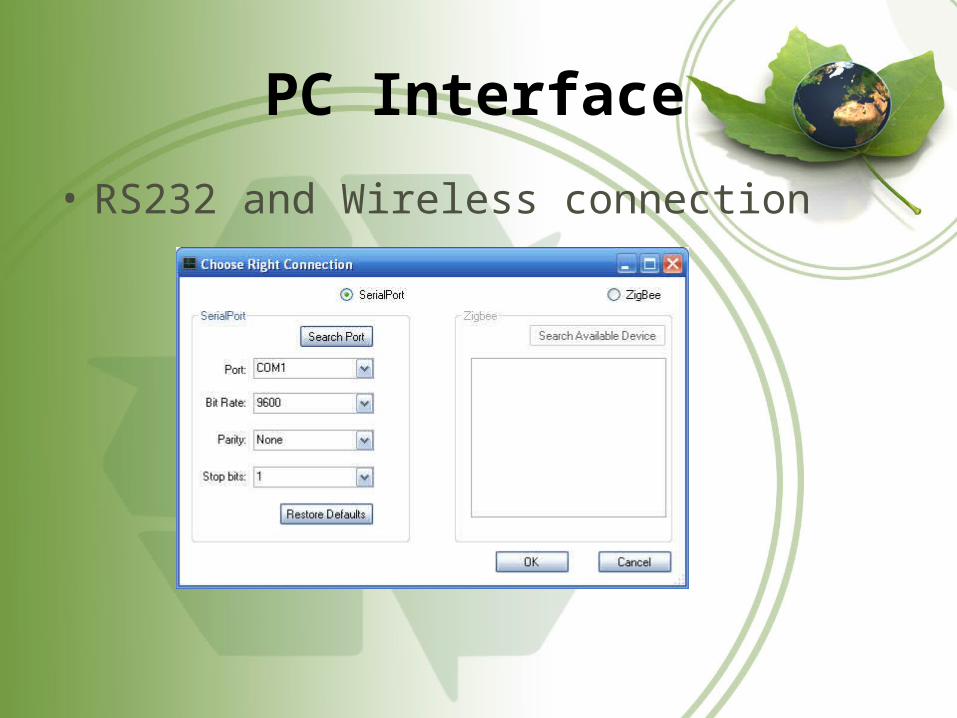
• RS232 and Wireless connection

PC Interface
• Main Monitor Panel

Software Implementation
• Communication via RS232(Serial Port)• Communication via Xbee• Discrete Fourier transform• Inverse Discrete Fourier transform
• Plot Graphs

Results (From 2007 Similar Project)
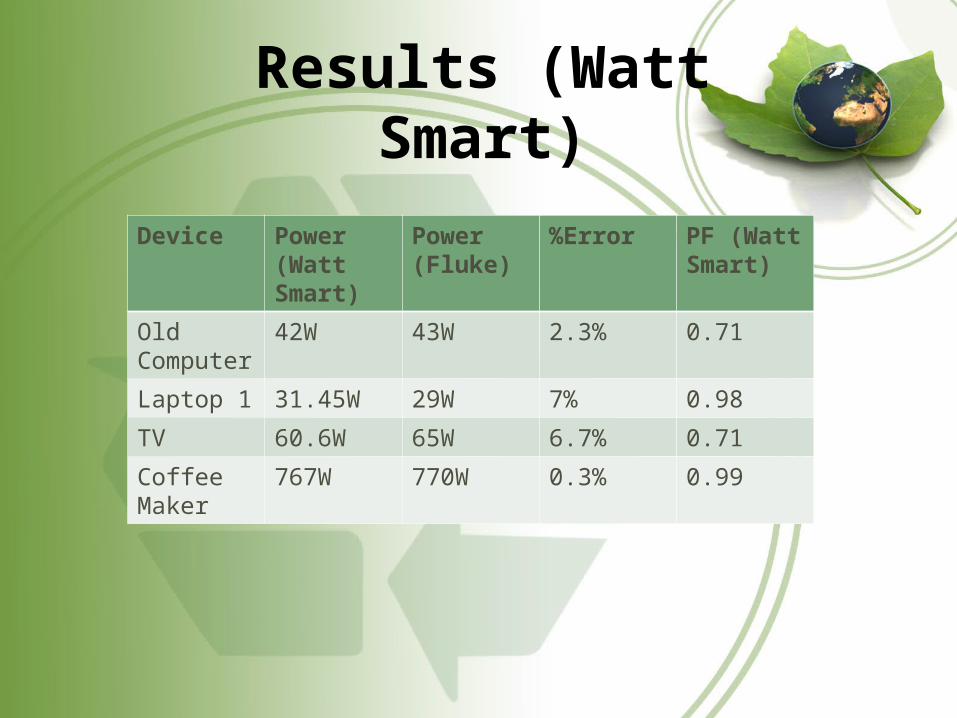
Results (Watt Smart)
Device Power (Watt Smart)
Power (Fluke)
%Error PF (Watt Smart)
Old Computer
42W 43W 2.3% 0.71
Laptop 1 31.45W 29W 7% 0.98
TV 60.6W 65W 6.7% 0.71
Coffee Maker
767W 770W 0.3% 0.99

Possible Improvements
• Investigate and include the phase shift caused by circuit components.
• Voltage Regulation for all power supplies.• Quality of voltage signal capture.• Not base everything on Fluke power meter.• An alternative way of measuring real power• And the last and the most important:
Continuous Research on Power Analysis!

Budget
Component Expected Actual
Wireless Module 150 170.93
Current Transformer 50 250
Voltage Probe 50 0
MCU-development board
200 242.63
Enclosure 50 0
AC/DC transformer 30 0
10% contingency 53 68
Total required 583 731.56
ESSEF Funding 0 500

Timeline

Business Opportunities
– Replace manual meter reading from utility companies.
– Introduce two-way communication with utilities companies
– Integration with home automation systems.
Problems Encountered
– MCU replacement• TI MSP430 MCU too complex to implement• Insufficient information in data sheet• Replaced with PIC MCU
– Wireless module• Zigbee features not critical in project• Higher costs for Zigbee• Replaced with XBee module

Future Development
• Home Automation– Control appliances from PC
• Internet Connectivity– Remote monitoring/controlling
– Data collection by Hydro companies
• Business/Industrial monitoring

Conclusion
•Great project
•Great Team
•Home electricity usage can be reduced
•Goals met

Questions?