wave hub hydrographic survey for archaeological assessment · halcrow group limited wave hub...
TRANSCRIPT

Emu Limited Head Office 1 Mill Court The Sawmills Durley Southampton SO32 2EJ UK Tel: +44 (0)1489 860050 Fax: +44 (0)1489 860051 www.emulimited.com
Wave Hub Hydrographic Survey for Archaeological Assessment
for
Halcrow Group Limited
REPORT NO. 08/J/1/02/1329/0829
January 2009 Job No J/1/02/1329

Halcrow Group Limited Wave Hub Geophysical Survey for
Archaeological Assessment
Report 08/J/1/02/1329/0829-DRAFT Emu Ltd
i
AUDIT INFORMATION
Title: Wave Hub Hydrographic Survey for Archaeological Assessment
Report Number : 08/J/1/02/1329/0829
Job Number : J/1/02/1329
Client Name : Halcrow Group Limited
Client Contact : Helen Needham
Project Manager : Rob Penrose
Project Surveyor(s) : Rob Penrose, Alex Elliott, Ed Henden, Ben Rainbow, Jess Hanham
Data Processor(s) : Rob Penrose, Alex Elliott, Ben Rainbow
Signature Date
Report written by Rob Penrose
Report checked by Richard Cooke
Report authorised by Huw Powell
Report Status Final
Issue Date January 2009

Halcrow Group Limited Wave Hub Geophysical Survey for
Archaeological Assessment
Report 08/J/1/02/1329/0829-DRAFT Emu Ltd
ii
EXECUTIVE SUMMARY
Emu Ltd was commissioned by Halcrow Group Limited to undertake a hydrographic survey
of the proposed wave hub site, located approximately 18 km from St Ives, Cornwall. The
survey included the collection of multibeam bathymetry, sidescan sonar and magnetometer
data throughout the proposed wave hub site and cable route. The primary objective of the
survey was to provide data for archaeological analysis by a third party contracted by the
client.
The survey was carried out using the vessel FPV Morven between 28th August and 20th
September, 2008. The equipment used included a Geometrics G882 marine magnetometer, a
fully motion-aided Reson 8101 multibeam system and an Edgetech 4200 dual frequency
sidescan sonar system. A Coda Octopus F180 motion reference unit with EGNOS differential
corrections was used for horizontal positioning of the vessel. Tides were acquired using a
Leica GX1230 system and post-processed with RINEX data.
Survey lines were run at 50 m spacing with the sidescan and magnetometer systems deployed
off the port and starboard sides respectively. The Reson 8101 swath transducer head was
attached by a pole to the port side of the vessel throughout. Forty-one approximately north-
south lines were run in the main proposed wave hub area, with a further 11 lines run along the
cable corridor. Cross lines were also completed inshore to ensure sufficient coverage was
acquired.
All datasets have been cross referenced with each other for quality assurance and positional
accuracy.
Water depths along the cable corridor increase from the beach to a maximum of
approximately 53.5 m Chart Datum (CD). In the wave hub site water depths range between
approximately 44 m to 60 m CD. Throughout the wave hub development area, sand ripples
are orientated approximately north south. In the south of the main site, there is an area of
outcropping bedrock which extends from approximately 800m from the south to the centre
and to the east of the site. Outside this area, bedrock outcrops are occasionally present. The
rest of the area is relatively featureless with some slight changes in the recorded intensity of
the sonar pulse indicating coarse sediment intersected with finer sediments in a banding
formation associated with the tidal movements.
The cable corridor comprises a mixture of fine sediment inshore, outcropping bedrock
through the majority of the corridor with coarser sediment offshore. An area of outcropping
bedrock is present from approximately 6 km to 20 km offshore. The northern end of the cable
corridor also has occasional outcropping bedrock which coincides with the type of features
seen in the main site. Sand ripples are also observed towards the northern extents of the cable
corridor.
Numerous contacts which are thought to be boulders and cobbles were found within the main
site and cable corridor. No new wrecks or contacts of any significant size were located within
the main site area, however a wreck was located in the cable corridor and this can be seen in
the sidescan sonar, bathymetry and magnetometer datasets. A number of magnetic anomalies
of between 0.1 nT and 20 nT were highlighted at the inshore section of the cable corridor.
Two of the anomalies were identified in a region of fishing gear near the inshore end of the
cable route. Although some other small magnetometer anomalies were found in the area,
these did not coincide with anything on the sidescan sonar or bathymetric records suggesting
they are buried.
The magnetometer survey identified a total of 52 magnetic anomalies in the data collected at
the proposed wave hub site and cable route.

Halcrow Group Limited Wave Hub Geophysical Survey for
Archaeological Assessment
Report 08/J/1/02/1329/0829-DRAFT Emu Ltd
iii
TABLE OF CONTENTS Page
AUDIT INFORMATION
EXECUTIVE SUMMARY
CONTENTS
1. Introduction & Objectives 1.1 Scope of Work 1.2 Summary of Events 1.3 Key Personnel
2. Methodology
2.1 Horizontal Positioning 2.2 Swath Bathymetry Survey 2.3 Sidescan Sonar Survey 2.4 Magnetometer Survey
3. Results
3.1 Positional Accuracy and Data Quality 3.2 Swath Bathymetry Data 3.3 Sidescan Sonar Data 3.4 Magnetometer Data 3.5 Interpreting Magnetometer Data
4. Discussion
5. Recommendations and Conclusions
6. Health and Safety
7. References
APPENDIX A Service Constraints
APPENDIX B Daily Progress Reports
APPENDIX C Tidal Data
APPENDIX D Sidescan Sonar Contacts
APPENDIX E Table of Significant Magnetic Anomalies
APPENDIX F Drawings Part 1
Drawings Part 2 (supplied in a separate folder)
All Digital Data has been provided on the enclosed data CD
i ii iii 1
1 3 3
4
4 5 6 7
8
8 8 9 10
13
18
19 20

Halcrow Group Limited Wave Hub Geophysical Survey for
Archaeological Assessment
Report 08/J/1/02/1329/0829-DRAFT Emu Ltd
iv
List of Tables Table 1.1 Timeline of Survey Events
Table 1.2 Key Personnel
Table 2.1 Summary of Navigation settings
Table 3.1 Typical detection range for common objects with G-881
Magnetometer
Table 3.2 Possible Magnetometer target sizes
List of Figures
Figure 1.1 Overview Map showing the survey lines
Figure 3.1 The boundary between coarse and fine sediments
Figure 4.1 Banding of coarse and fine material
Figure 4.2 Sand ripples indicative of sediment movements
Figure 4.3 Outcropping bedrock at the main wave hub site
Figure 4.4 Outcropping bedrock within the cable corridor
Figure 4.5 Image 1 of the wreck
Figure 4.6 Image 2 of the wreck
Figure 4.7 Image 3 of the wreck
List of Drawings – Part 1
J.1.02.1329.01a Sidescan Sonar Mosaic of Main Site
J.1.02.1329.01b Sidescan Sonar Mosaic of Offshore Area
J.1.02.1329.01c Sidescan Sonar Mosaic of Inshore Area

Halcrow Group Limited Wave Hub Geophysical Survey for
Archaeological Assessment
Report 08/J/1/02/1329/0829-DRAFT Emu Ltd
v
List of Drawings – Part 2 (supplied in a separate folder)
J.1.02.1329.02a Seabed Classification at the Main Site
J.1.02.1329.02b Seabed Classification at the Cable Corridor Offshore
J.1.02.1329.02c Seabed Classification at the Cable Corridor Inshore
J.1.02.1329.03a Bathymetric Contours of the Main Site
J.1.02.1329.03b Bathymetric Contours of the Cable Corridor Offshore
J.1.02.1329.03c Bathymetric Contours of the Cable Corridor Inshore
J.1.02.1329.04a Shaded Colour Bathymetry of the Main Site
J.1.02.1329.04b Shaded Colour Bathymetry of the Cable Route Offshore
J.1.02.1329.04c Shaded Colour Bathymetry of the Cable Route Inshore
J.1.02.1329.04d Shaded Colour Bathymetry of the Main Site
J.1.02.1329.05a Magnetometer Trackplot with Anomalies at the Main Site
J.1.02.1329.05b Magnetometer Trackplot with Anomalies at the Cable
Route Offshore
J.1.02.1329.05c Magnetometer Trackplot with Anomalies at the Cable
Route Inshore

Halcrow Group Limited Wave Hub Geophysical Survey for
Archaeological Assessment
Report 08/J/1/02/1329/0829-DRAFT Emu Ltd
1
1.0 INTRODUCTION AND OBJECTIVES
Emu Ltd was commissioned by Halcrow Limited to undertake a hydrographical survey of the
proposed wave hub site and cable corridor. The primary objective of the survey was to
determine water depths, seabed bathymetry and to provide data for an archaeological
assessment of the site.
The survey was carried out using the vessel FPV Morven between 28th August and 20th
September 2008. Data were collected using an Edgetech 4200 Sidescan Sonar, a Reson 8101
multibeam system and a Geometrics G882 magnetometer. Software used during the survey
allowed for online quality assurance of data. Navigation information was derived from a
DGPS system and tides were acquired using a Leica GX1230 system and post-processed with
RINEX data.
1.1 Scope of work
The scope of work was outlined in proposal No. P/1/02/08/0671 and submitted for approval in
July 2008.
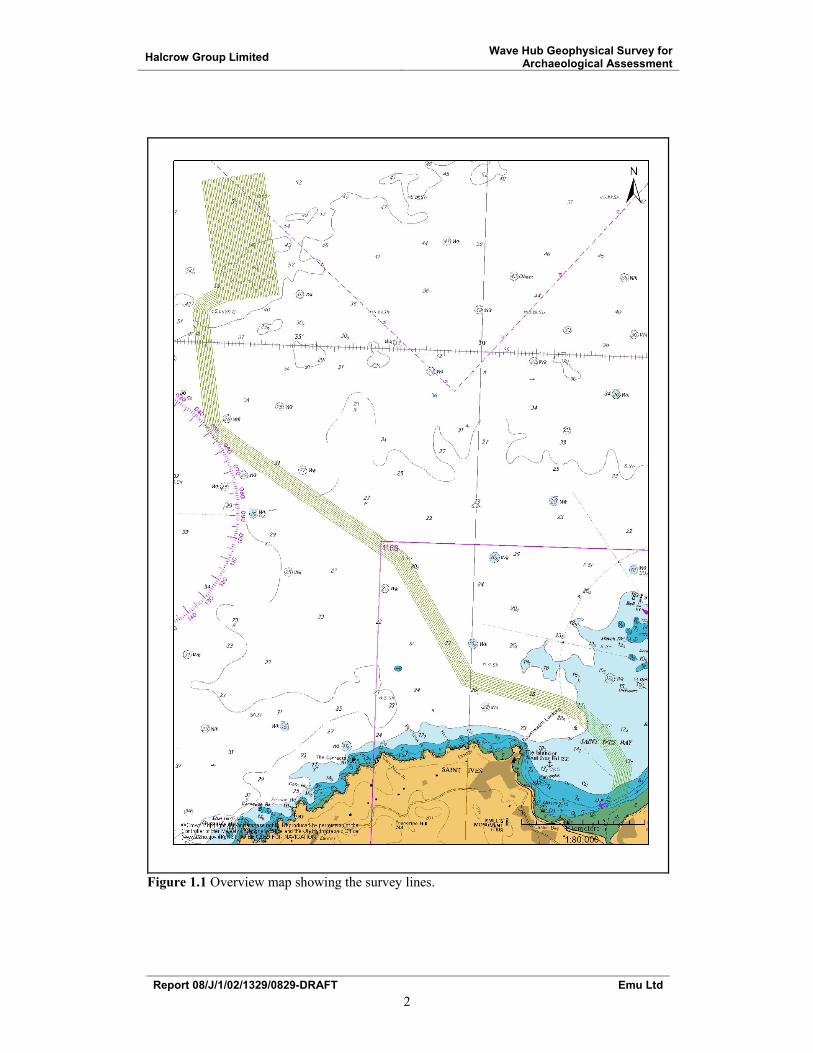
The scope of work specified the collection of simultaneous multibeam bathymetry, sidescan
sonar, and magnetometer data throughout the proposed survey area. It required data to be
collected along the proposed cable route and main site, with 50m line separations and infill to
provide bathymetric data of a quality to meet IHO Sp44 Order 1. Paper charts have been
produced for contoured and colour shaded bathymetry, sidescan sonar mosaic, seabed features
with sidescan targets and magnetometer trackplot with anomaly size and location.
All relevant digital data have also been provided with this report.
Halcrow Group Limited Wave Hub Geophysical Survey for
Archaeological Assessment
Report 08/J/1/02/1329/0829-DRAFT Emu Ltd
2
Figure 1.1 Overview map showing the survey lines.
Halcrow Group Limited Wave Hub Geophysical Survey for
Archaeological Assessment
Report 08/J/1/02/1329/0829-DRAFT Emu Ltd
3
1.2 Summary of events
The vessel FPV Morven was mobilised on 28th August, 2008 to begin the survey on the next
available period of good weather. The survey was completed on 20th September, 2008 and all
survey operations with FPV Morven were completed with the vessel demobilised on the 20th
September, 2008.
Timeline of Events Date
Vessel mobilisation: 28/08/2008
Survey: 08/09/2008 – 09/09/2008,
16/09/2008 – 20/09/2008
Standby: 29/08/2008, 30/08/2008 –
07/09/2008, 10/09/2008 –
15/09/2008
Vessel demobilisation: 20/09/2008
Table 1.1 Timeline of Survey Events
1.3 Key Personnel
Personnel Name
Project Manager Rob Penrose
Hydrographic Surveyors Rob Penrose, Jess Hanham, Ben Rainbow
Geophysicists Edward Henden, Alex Elliot
Data Processors Rob Penrose, Alex Elliott, Ben Rainbow
GIS John Lonsdale, Helen Cole
Reporting Rob Penrose, Alex Elliott
Table 1.2 Key Personnel

Halcrow Group Limited Wave Hub Geophysical Survey for
Archaeological Assessment
Report 08/J/1/02/1329/0829-DRAFT Emu Ltd
4
2.0 METHODOLOGY
This section includes a brief factual description of the methods used to achieve the project
objectives.
2.1 Horizontal Positioning
For the purpose of the survey, navigation information was required to an accuracy of 1-5m.
Positioning information was obtained using a Coda Octopus F180 motion reference unit with
built in vector GPS. The DGPS signal was acquired through the Crescent Hemisphere R120
DGPS and sent to the Coda F180 via an RTCM data string. The receiver was configured to
receive differential corrections from the EGNOS differential network via satellite. A
navigation error check was performed during mobilisation and calibration. Details of this can
be found in the Daily Progress Reports in Appendix B. All relevant instrument offsets were
measured before the survey commenced and entered into the QINSy (version 8) hydrographic
navigation software. Navigation settings are given below in table 2.1.
Navigation Settings
Geodetic Parameters System Source Projection Parameters
Spheroid WGS 1984 System UTM
Semi-major axis 6378137.000000 Zone 30 North
Semi-minor axis 6356752.314245 Central Meridian 3° W
Inverse Flattening 298.257223563 False Easting 500000
Scale Factor 0.9996
Table 2.1 Summary of Navigation settings
2.2 Multibeam Bathymetric Survey In order to measure the depth of all parts of the seabed a Reson Seabat 8101 swath
bathymetry system was employed. The Reson Seabat 8101 swath bathymetry system emitted
a series of 101 equally spaced pulses of acoustic energy across the track of the vessel to
achieve 100% insonification of the seabed throughout the swath. The time it took for each
beam to return to the system was accurately measured to derive the seabed depth at each point
of insonification. The resulting swath soundings provided high resolution information on the
bathymetry of the seabed across the whole area. The seabed bathymetry was measured
throughout the development site and the cable corridor to shore.
Attitude and motion were measured by the Coda Octopus F180 system giving heave, roll,
pitch and yaw data. This information was fed directly into the QINSy system for real time
correction of the bathymetric data. The swath system was calibrated prior to the survey with a
standard patch test operation. This revealed the fixed errors in heading, pitch and roll and also
the time delay in the position data. Sound velocity profiles through the water column were
taken at the start and end of the survey and at regular 12 hour intervals. The sound velocity
profiles were applied online during acquisition of the data.
Post-processing was performed at Emu Ltd’s Durley office using QINSy software. At this
stage all corrections and filters were applied including the patch test calibration results,

Halcrow Group Limited Wave Hub Geophysical Survey for
Archaeological Assessment
Report 08/J/1/02/1329/0829-DRAFT Emu Ltd
5
removal of outliers with automatic and manual filtering and tides. The cleaned data were then
gridded using a 0.5m bin size and exported in XYZ format.
All bathymetric data were reduced to Chart Datum at St.Ives (3.4 metres below Ordnance
Datum Newlyn). WGS84 elipsoidal heights were recorded on board the survey vessel by
using a Leica GX 1230 RTK GPS system configured to collect post processed kinematic
(PPK) data. Once the survey was completed the PPK GPS heights were processed in Leica
Geo Office at 5 second intervals using the five nearest Ordnance Survey Active RINEX
stations. All data with a height quality of under ±0.2m were selected and imported into
Microsoft Excel for further processing. Elipsoid heights were converted to Ordnance Datum
(Newlyn) and then reduced to Chart Datum at St.Ives. A smooth curve was then fitted through
the PPK data and compared with observed tide gauge data at St Ives. Good agreement was
obtained and it was decided that the smoothed PPK data were a reasonable representation of
the tide levels recorded on board the survey vessel (tidal data has been presented in Appendix
E).
Bathymetric sounding data were reduced using the PPK tidal data for September 16th to 20th.
On September 9th GPS tidal heights were not available due to equipment failure of the GPS
unit. Therefore, for September 9th tidal levels were obtained from the Environment Agency
(EA) tide gauge at St. Ives. For quality control purposes the St. Ives tide gauge values have
been plotted against GPS tide values recorded on board the survey vessel on the 16th to 20
th
September (shown in Appendix E). These plots showed that the EA tide gauge data agreed
closely with GPS tide levels recorded during this period.
Details of when each line was surveyed have been provided in the swath bathymetry logs in
Appendix B. These logs can be cross referenced with the Magnetometer Track plot to give
precise information on the vessel track (drawings J.1.02.1329.05a – c).
2.3 Sidescan Sonar Survey High resolution sidescan sonar data was collected in order to identify any objects that may be
of archaeological interest. An Edgetech 4200 Dual Frequency (nominally 120kHz and
400kHz) sidescan towfish was deployed from the survey vessel. The configuration of the
system, with wide vertical and narrow horizontal beam angles, enabled a swath of the seabed
to be imaged by each pulse. Qualitative interpretation of the strength of the acoustic response
enabled the identification of both topographic and sediment changes within the surveyed area
and indicated the presence of seabed anomalies such as bedrock or large boulders. Further
quantitative interpretation of the sediment class can differentiate areas with different sediment
content.
Throughout the survey the sonar was operated on a 100 metre range for high frequency and
200m for low frequency data collection. The 50m line spacing allowed for a maximum of
200% ground coverage in high frequency, and 400% coverage in low frequency.
Survey data was acquired on board the survey vessel using Discover acquisition software.
SonarWiz was used for post-processing where optimum gain settings were selected, laybacks
applied and the data mosaiced for presentation in GIS. Full QC procedures were adhered to
throughout data collection and processing.
2.4 Magnetometer Survey
A magnetometer survey was undertaken in order to detect the presence of ferrous objects on
or just below the seabed. A Geometrics G882 caesium vapour marine magnetometer was
Halcrow Group Limited Wave Hub Geophysical Survey for
Archaeological Assessment
Report 08/J/1/02/1329/0829-DRAFT Emu Ltd
6
utilised for this aspect of the survey. The system incorporates a towed fish which houses a
total magnetic field sensor. The unit provides absolute readings of total magnetic field, with a
resolution of 0.01 nT (nanotesla), which is more than sufficient for this type of survey. These
readings are ‘point-specific’ i.e. taken individually they do not give any directional indication
of where any feature causing anomalous magnetic field values may lie.
In operation, the magnetometer is towed with navigation supplied from the Coda Octopus
F180 to a specific tow point on the vessel. The cable is then laid out and recorded with the
magnetometer layback entered manually online into the MagLog acquisition software.

Halcrow Group Limited Wave Hub Geophysical Survey for
Archaeological Assessment
Report 08/J/1/02/1329/0829-DRAFT Emu Ltd
7
3.0 RESULTS
Results from the survey are presented in this section. Reference is made to supporting
information presented in the appendices and on the drawings. All water depths are referenced
to Chart Datum (CD) at St. Ives (3.4 metres below Ordnance Datum Newlyn).
3.1 Positional Accuracy and Data Quality
The horizontal positioning data from the DGPS system were of good quality throughout the
duration of the survey, with a positional accuracy of greater than 2 m. The sea bed features
identified in the sidescan sonar data are estimated to have an accuracy of approximately ±10
m across track due to the manual layback method and the influence of environmental factors
such as currents. The magnetometer will have a similar accuracy of approximately ± 10 m, as
it would be affected by the manual layback method and environmental influences.
All datasets are found to be of very good quality, this being assisted by generally good sea
conditions at the time of survey, despite strong south/westerly winds. The bathymetric data
were reduced using GPS tidal data measured onboard the survey vessel with the exception of
tidal data collected on the 16th September which was acquired from the EA tide gauge at St.
Ives.
Fishing gear onsite made obtaining full coverage difficult. However full coverage was
obtained with the use of infill lines where necessary.
3.2 Swath Bathymetry Data
A Reson 8101 multibeam echo sounder was used to map the bathymetry of the proposed
wave hub site. The data has also been cross referenced against the other data sets to provide
information on items of debris and seabed types. The processed data is presented in the form
of a colour shaded relief chart; Drawings J.1.02.1329.04a, J.1.02.1329.04b and
J.1.02.1329.04c and a 0.5m contoured relief chart; Drawings J.1.02.1329.03a, J.1.02.1329.03b
and J.1.02.1329.03c. Digital data in XYZ format, suitable for use in archaeological analysis,
has been provided on the enclosed data CD.
The swath dataset achieved full coverage using the line plan approved by the client, except in
the inshore shallow water. Infill lines were run to ensure full coverage of this area. Adjacent
lines, surveyed at the southern end of the cable route do show some variations in depth
(approximately 0.3m variation when compared to adjacent lines). These variations were an
artefact of the vessel movement and tidal effects, which were less well resolved in the inshore
section of the survey area. This section of the cable route was found to be relatively flat and
no noticeable sand dunes or bedform features were found in the swath or sidescan sonar
record.
Cable Corridor
Depths throughout the cable corridor range from approximately 3 m at the inshore extent of
the survey to approximately 53.5 m offshore at the northern extent. The swath bathymetry
dataset closely matches the seabed features depicted in the sidescan sonar dataset.
Between the inshore extent of the survey and 6 km offshore the seabed gently shoals from a
depth of approximately 3 m to 26 m below CD. The seafloor is relatively smooth increasing
Halcrow Group Limited Wave Hub Geophysical Survey for
Archaeological Assessment
Report 08/J/1/02/1329/0829-DRAFT Emu Ltd
8
in depth with occasional patches of exposed bedrock showing a comparatively low relief of
up to approximately 1 m.
From approximately 6 km to 20 km offshore outcropping bedrock dominates. This
outcropping bedrock has a comparatively high relief of up to approximately 3.5 m. These rock
outcrops generally have their perimeters at a depth of approximately 23 m to the south
increasing to 33 m in the north. Within the areas of outcropping bedrock, there are occasional
isolated pockets of sediment.
From approximately 20 km to 21.5 km offshore at the northern extent, the seabed returns to
be dominated by mainly course sediments with occasional outcropping bedrock. Depths in
this area range from approximately 49 m to 53.5 m below.
A wreck was observed in the swath record at approximately 50º;17.2086’ N 005º;34.1721’ W.
It is approximately 2.4 m high and 14 m in length. It appears to be in two pieces and lies at a
depth of approximately 30.5 m below CD on an area of uneven ground.
Main Site
Depths through the wave hub site range from approximately 44.4 m to 60 m below CD. An
area of outcropping bedrock is present approximately 800m from the south to the centre and
to the east of the site. These outcrops rise up to approximately 3m above the surrounding
seafloor. Throughout the site, areas of occasional outcropping bedrock are observed within a
mainly sediment dominated seabed.
3.3 Sidescan Sonar Data
High resolution sidescan sonar data was acquired with an Edgetch 4200 sidescan sonar. The
dataset has been used to classify the seabed as well as to identify any items of debris, wrecks
or other seabed features. The processed data have been mosaiced and presented in Drawings
J.1.02.1329.01a, J.1.02.1329.02b and J.1.02.1329.01.c. A seabed features chart has been
produced using the sidescan sonar data and presented in Drawings J.1.02.1329.02a,
J.1.02.1329.02b and J.1.02.1329.02c. A digital copy of the sidescan sonar mosaic in geotif
format has been provided on the enclosed CD.
Numerous contacts were picked with a minimum target size of approximately 1.0 m or
features which looked out of place with the surrounding seabed. In areas of outcropping
bedrock, targets were difficult to identify due to the nature of the sidescan record.
Due to the large amount of fishing gear in the area, it was necessary at times to fly the
sidescan fish close to the sea surface to ensure that fishing and survey equipment was not
damaged. On the sidescan mosaic, these areas appear relatively darker. The sidescan sonar
mosaic will also show some areas which did not follow the line plan, as fishing gear made it
unsafe to do so, though full coverage was still acquired.
Cable Corridor
A wreck was observed in the cable corridor. This coincides with the wreck identified during
the previous geophysical survey of the wave hub cable corridor. This wreck is potentially the
charted wreck Helene. The wreck appears to be in two pieces, with an overall approximate
length of 14 m. The wreck protrudes approximately 4.5 m above the seabed and is lying on a
bearing of approximately 106° as shown in Figure 4.5, 4.6, 4.7. The wreck is a different
height from the bathymetry because the height on the sidescan sonar record is calculated from
the contacts shadow. The wreck is examined further in the discussion, section 4.
Halcrow Group Limited Wave Hub Geophysical Survey for
Archaeological Assessment
Report 08/J/1/02/1329/0829-DRAFT Emu Ltd
9
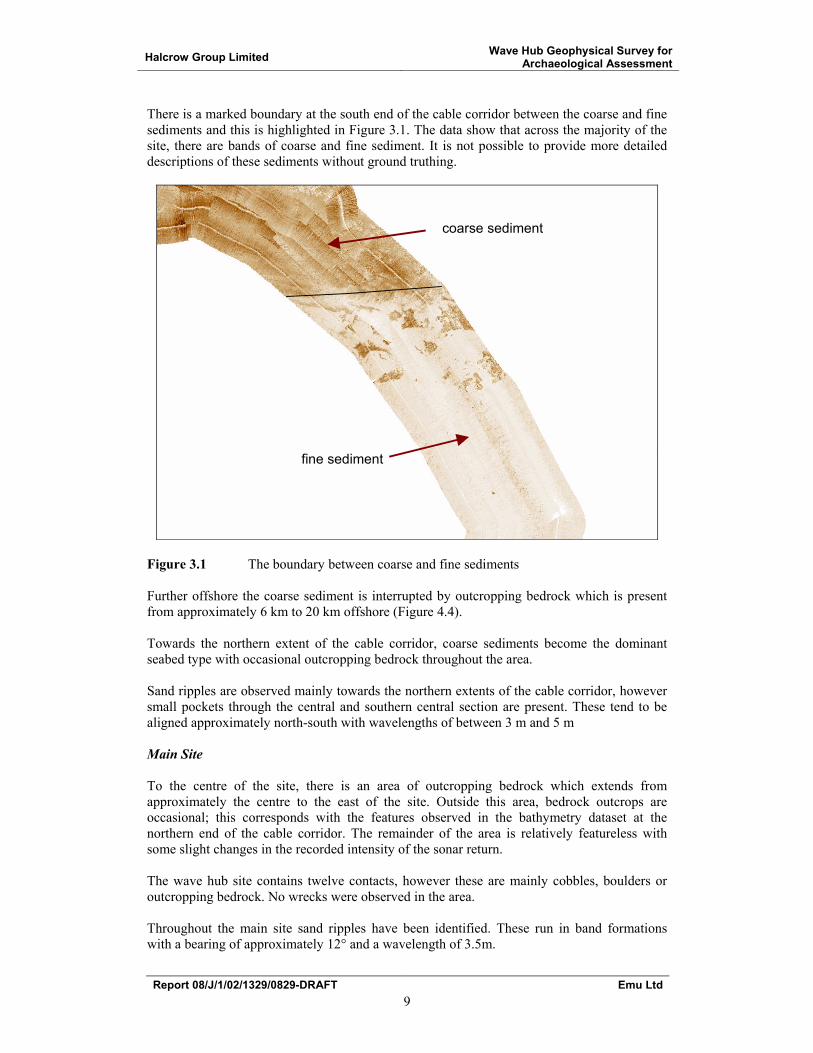
There is a marked boundary at the south end of the cable corridor between the coarse and fine
sediments and this is highlighted in Figure 3.1. The data show that across the majority of the
site, there are bands of coarse and fine sediment. It is not possible to provide more detailed
descriptions of these sediments without ground truthing.
Figure 3.1 The boundary between coarse and fine sediments
Further offshore the coarse sediment is interrupted by outcropping bedrock which is present
from approximately 6 km to 20 km offshore (Figure 4.4).
Towards the northern extent of the cable corridor, coarse sediments become the dominant
seabed type with occasional outcropping bedrock throughout the area.
Sand ripples are observed mainly towards the northern extents of the cable corridor, however
small pockets through the central and southern central section are present. These tend to be
aligned approximately north-south with wavelengths of between 3 m and 5 m
Main Site
To the centre of the site, there is an area of outcropping bedrock which extends from
approximately the centre to the east of the site. Outside this area, bedrock outcrops are
occasional; this corresponds with the features observed in the bathymetry dataset at the
northern end of the cable corridor. The remainder of the area is relatively featureless with
some slight changes in the recorded intensity of the sonar return.
The wave hub site contains twelve contacts, however these are mainly cobbles, boulders or
outcropping bedrock. No wrecks were observed in the area.
Throughout the main site sand ripples have been identified. These run in band formations
with a bearing of approximately 12° and a wavelength of 3.5m.
fine sediment
coarse sediment

Halcrow Group Limited Wave Hub Geophysical Survey for
Archaeological Assessment
Report 08/J/1/02/1329/0829-DRAFT Emu Ltd
10
3.4 Magnetometer Data
Magnetometer data have been acquired along the proposed cable route and potential wave
hub area. Data were recorded using Geometrics Maglog data acquisition software and
processed using Geometrics magnetometer software MagPick. Layback was applied to each
profile line in real time using Maglog according to the cable length used during the survey
and recorded in the survey logs. Corrected magnetic profile data were then checked for
magnetic anomalies. As part of the quality assurance the magnetometer anomalies were cross-
correlated with the other datasets for the area.
Overall, 52 significant targets have been identified from the magnetometer data. These
anomalies are detailed in Appendix E and shown on magnetometer survey trackplots
presented in Drawings J.1.02.1329.05a, J.1.02.1329.05b and J.1.02.1329.05c. Targets have
been identified by anomalous spikes in the data and separated from background noise through
comparison with adjacent lines.
The geology of the site is dominated by recently reworked soft Quaternary sediments
overlying the Devonian bedrock consisting of siltstones, sandstones, slate and limestones.
These sedimentary rocks are unlikely to cause significant interference and deleterious effects
on the accuracy of interpretations in magnetic surveying. The quality of the interpretations has
been maintained through careful data processing and rigorous quality assurance checks.
Cable Corridor
The magnetometer data identified 47 magnetic anomalies within the cable route. One area
along the central section of the cable route had a large cluster of magnetic anomalies ranging
between 320 nT and 420 nT. This coincides with the approximate position of the wreck.
At the southern end of the cable corridor magnetic anomalies of between 6nT and 20nT were
common, with eleven identified. These did not correspond to any sidescan sonar targets, so it
is likely that the anomalies are buried. One small magnetic anomaly did correspond with the
fishing gear at the inshore end of the cable route, with another small anomaly close by.
Main Site
Within the main wave hub site 5 targets were identified, however these were only between .01
nT and 3.00 nT, suggesting no contacts of any significant size. After comparing with the other
data sets, these did not correspond with any features.
3.5 Interpreting Magnetometer Results
In order to interpret the magnetic anomaly results it is important to understand that the
magnetic anomaly from a given object can vary greatly. Both the size and the shape of a
magnetic anomaly vary with magnetic latitude, the shape of the magnetic body, its attitude
and its orientation with respect to magnetic north (Sheriff, 1978). However the greatest effect
on the anomaly size from a given object is the distance between the object and the sensor.
Magnetic field strength (from a dipole) declines inversely with the cube of the distance from
the objects centre (Breiner, 1999). Table 3.1 below shows typical detection ranges for
common objects with a G-881 magnetometer, and Figure 3.1 below shows the decline in
anomaly size with distance for various ferrous targets.

Halcrow Group Limited Wave Hub Geophysical Survey for
Archaeological Assessment
Report 08/J/1/02/1329/0829-DRAFT Emu Ltd
11
Typical Detection Range For Common Objects
Ship 1000 tons 0.5 to 1 nT at 244 m
Anchor 20 tons 0.8 to 1.25 nT at 120 m
Automobile 1 to 2 nT at 30 m
Light Aircraft 0.5 to 2 nT at 12 m
Pipeline (12 inch) 1 to 2 nT at 60 m
Pipeline (6 inch) 1 to 2 nT at 30 m
100 kg of iron 1 to 2 nT at 15 m
100 lbs of iron 0.5 to 1 nT at 6 m
10 lbs of iron 0.5 to 1 nT at 3 m
Screwdriver 5 inch 0.5 to 2 nT at 4 m
1000 lb bomb 1 to 5 nT at 30 m
500 lb bomb 0.5 to 5 nT at 16 m
Grenade 0.5 to 2 nT at 3 m
20 mm Shell 0.5 to 2 nT at 1.8m
Table 3.1 Typical detection range for common objects with G-881 magnetometer
(from G-882 Cesium marine magnetometer operations manual, 2005)
Figure 3.1 Graph of detection depths versus magnetic signal strength for various
ferrous UXO targets (Stanley, 2003)

Halcrow Group Limited Wave Hub Geophysical Survey for
Archaeological Assessment
Report 08/J/1/02/1329/0829-DRAFT Emu Ltd
12
During the magnetometer survey the magnetometer fish depth was measured with onboard
pressure sensors. Over the site, magnetometer fish height varied between approximately 2 to
10 m above the seabed. Targets can be combined with the height range above seabed to give a
range of possible target sizes as shown in Table 3.2 below. This is assuming targets are on the
seabed; buried targets would have an added distance from the sensor and so would appear as
smaller anomalies.
Anomaly Size (nT) Possible target sizes (based on fish height 2-14.2 m)
0-0.5 <0.5 kg iron – 1 kg iron, Bar Magnet (5000 cgs units)
0-1 Bar Magnet (5000 cgs units) – 45 kg iron
1-2 - 50 kg iron
2-5 - 100 kg iron
5-10 > 100kg iron, 6 inch pipeline
10-20 >>100kg, > 6 inch pipeline (<1000 kg iron)
Table 3.2 Possible Magnetometer target sizes (after Breiner, 1999)
It should also be noted that magnetic anomalies can also arise from variation in the chemistry
of the rocks and soil from one position to another. Even at any one place, the Earth's field is
forever changing by a small amount with time. For the purpose of target detection anomalies
due to changes in the ground geology or due to temporal sources are termed "magnetic noise".
Many of the identified targets were identified on more than one line due to their anomaly size.
These have been filtered down to one anomaly where possible by observing similarities in the
shape of the anomaly on each line and taking the largest anomaly as being closest to the
source.
Halcrow Group Limited Wave Hub Geophysical Survey for
Archaeological Assessment
Report 08/J/1/02/1329/0829-DRAFT Emu Ltd
13
4.0 DISCUSSION
Four main seabed types have been classified from the combined datasets as listed below:
• Outcropping bedrock with patches of coarse sediment
• Coarse Sediment with boulders and cobbles
• Coarse Sediments
• Fine Sediments
These classifications have been presented on Drawings J.1.02.1329.02a, J.1.02.1329.02b and
J.1.02.1329.02c.
The cable corridor comprises a mixture of fine sediment inshore, pro-grading into coarser
sediment offshore. This boundary coincides with the outer extent of St Ives Bay where the
two headlands end and the water becomes deeper.
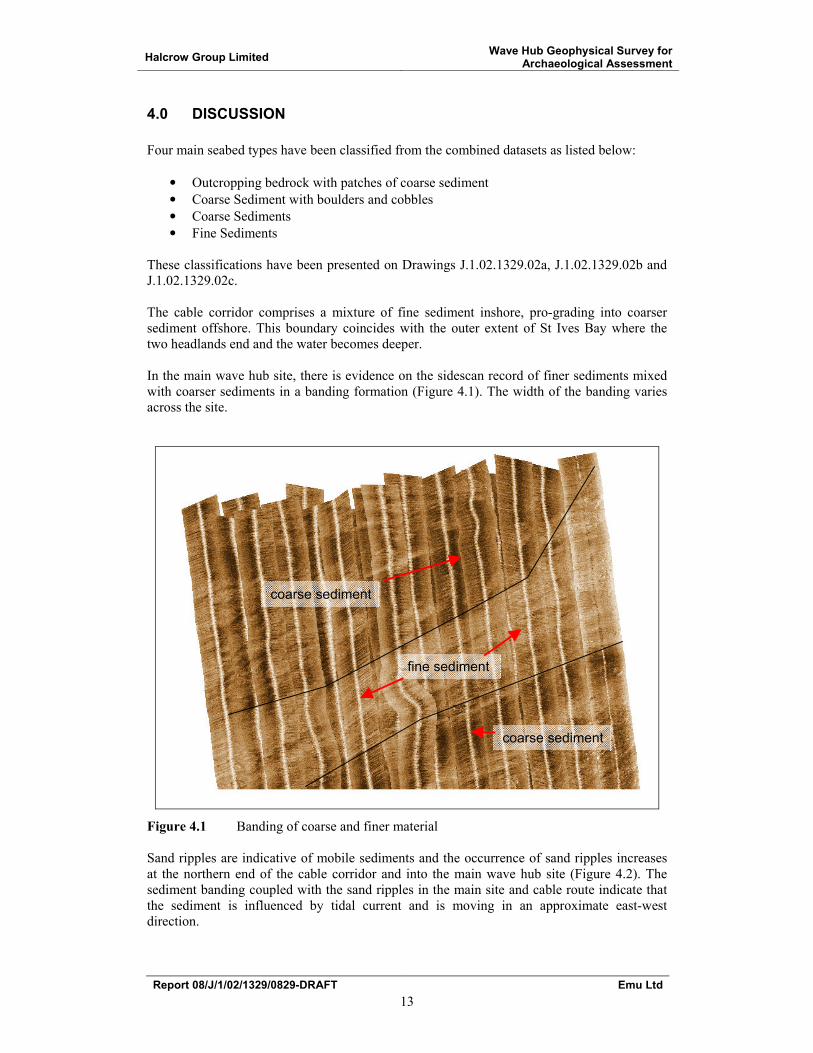
In the main wave hub site, there is evidence on the sidescan record of finer sediments mixed
with coarser sediments in a banding formation (Figure 4.1). The width of the banding varies
across the site.
Figure 4.1 Banding of coarse and finer material
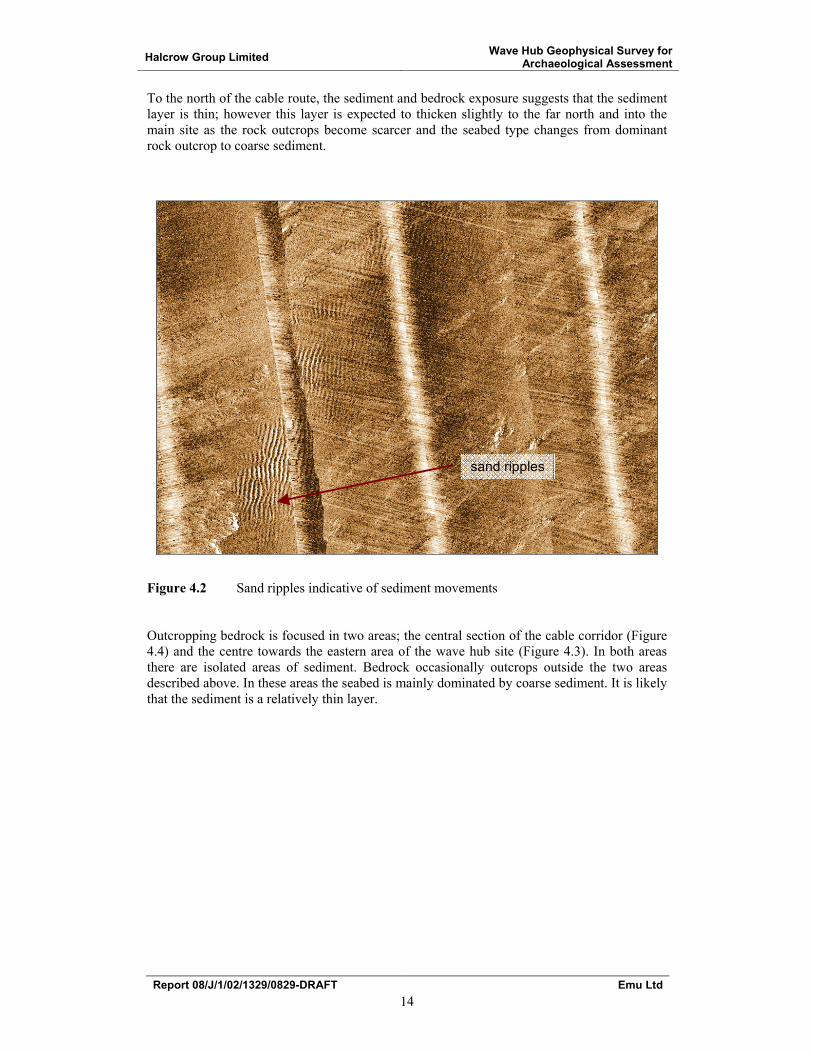
Sand ripples are indicative of mobile sediments and the occurrence of sand ripples increases
at the northern end of the cable corridor and into the main wave hub site (Figure 4.2). The
sediment banding coupled with the sand ripples in the main site and cable route indicate that
the sediment is influenced by tidal current and is moving in an approximate east-west
direction.
fine sediment
coarse sediment
coarse sediment
Halcrow Group Limited Wave Hub Geophysical Survey for
Archaeological Assessment
Report 08/J/1/02/1329/0829-DRAFT Emu Ltd
14
To the north of the cable route, the sediment and bedrock exposure suggests that the sediment
layer is thin; however this layer is expected to thicken slightly to the far north and into the
main site as the rock outcrops become scarcer and the seabed type changes from dominant
rock outcrop to coarse sediment.
Figure 4.2 Sand ripples indicative of sediment movements
Outcropping bedrock is focused in two areas; the central section of the cable corridor (Figure
4.4) and the centre towards the eastern area of the wave hub site (Figure 4.3). In both areas
there are isolated areas of sediment. Bedrock occasionally outcrops outside the two areas
described above. In these areas the seabed is mainly dominated by coarse sediment. It is likely
that the sediment is a relatively thin layer.
sand ripples

Halcrow Group Limited Wave Hub Geophysical Survey for
Archaeological Assessment
Report 08/J/1/02/1329/0829-DRAFT Emu Ltd
15
Figure 4.3 Outcropping bedrock at the main wave hub site.
Figure 4.4 Outcropping bedrock within the cable corridor.
outcropping bedrock
outcropping bedrock
sediment

Halcrow Group Limited Wave Hub Geophysical Survey for
Archaeological Assessment
Report 08/J/1/02/1329/0829-DRAFT Emu Ltd
16
No new wrecks or contacts of any significant size were located within the main wave hub site,
however a wreck was located in the cable corridor. This has been identified in approximately
the same position for all the datasets and can be seen in the sidescan sonar data as shown in
Figures 4.5, 4.6, 4.7. The wrecks position also coincides with the nearby charted wreck
Helene. The UKHO have its position as approximate and have charted this wreck at 50°
17.034’ 005° 36.060’, approximately 1.5 km away from the actual site. This wreck was also
identified in a previous geophysical survey of the cable corridor.
The Helene is a riveted iron steamer built in 1896 and was sunk in 1918 by a U boat. The
vessel was 73m in length, had twin boilers and a single screw. Further investigation of this
site is needed to clarify if this wreck is the Helene.
At the southern end of the cable corridor, the intensity of magnetic anomalies increased. It is
not uncommon for magnetic anomalies to be concentrated inshore as targets may be related to
human activity from Hayle harbour. The size of the targets in this area ranged from 0.01nT to
20nT. The only target that corresponds with the sidescan record is a small anomaly in an area
of fishing gear, with another small anomaly close by. It is therefore likely that the other
anomalies are buried. The magnetometer fish would have also been flying very low to the
ground meaning the size of the targets compared to the rest of the site would be exaggerated.
Due to the large amount of fishing gear in the area, the anomalies are possibly related to this.
Due to the inaccuracies of both the sidescan sonar fish and magnetometer fish being
approximately ± 10 m, this may have also offset magnetometer anomalies from sidescan
sonar targets.
Figure 4.5 Image 1 of wreck on cable route.
wreck

Halcrow Group Limited Wave Hub Geophysical Survey for
Archaeological Assessment
Report 08/J/1/02/1329/0829-DRAFT Emu Ltd
17
Figure 4.6 Image 2 of wreck on cable route.
Figure 4.7 Image 3 of wreck on cable route.
wreck
wreck

Halcrow Group Limited Wave Hub Geophysical Survey for
Archaeological Assessment
Report 08/J/1/02/1329/0829-DRAFT Emu Ltd
18
5.0 RECOMMENDATIONS AND CONCLUSIONS
Water depths range from approximately 3 m to 53.5 m and 44.4 m to 60 m throughout the
cable corridor and wave hub site respectively. The southern end of the cable corridor changes
from fine sediments to coarse sediments at a noticeable boundary moving further offshore. An
area of outcropping bedrock dominates the cable corridor. At the northern extent of the cable
corridor, coarser sediments return. An area of outcropping bedrock dominates the centre of
the wave hub site while the rest of the wave hub site remains relatively featureless with
occasional rock outcrops with banding of coarse and fine sediments.
Sand ripples are evident in the cable corridor and wave hub site indicating a mobile seabed.
Throughout the areas of coarse and fine sediments, sand ripples run in bands with their axis
orientated approximately north to south with the predominant direction of sediment transport
being from west to east.
Numerous contacts and boulders were found within both the cable corridor and wave hub site.
52 magnetic anomalies were identified within the magnetometer data collected at the
proposed wave hub site and cable corridor. 5 magnetic anomalies were identified within the
proposed wave hub site. One possible wreck was also located within the cable corridor lying
in an area of outcropping bedrock which coincides with 5 magnetic anomalies and a contact
on the sidescan sonar record. A number of magnetic anomalies of between 0.1 nT and 20 nT
were highlighted at the inshore section of the cable corridor. Two anomalies were identified
in the region of fishing gear. No other targets corresponding with anomalies were identified in
the area, suggesting the unidentified anomalies are buried. No other magnetic anomalies
related to features in the other datasets were present.
The survey data acquired offshore were of sufficient quality and in all cases deemed to satisfy
the requirements of the contract. Data processing was also performed to Emu’s QA standards
(ISO 9001: 2000).
As part of Emu’s Quality Assurance procedures and in the interests of our ongoing
development, every contract undergoes a comprehensive review on completion. This process
is designed to identify any areas where improvements can be made. No significant
deficiencies or suggested improvements were identified.

Halcrow Group Limited Wave Hub Geophysical Survey for
Archaeological Assessment
Report 08/J/1/02/1329/0829-DRAFT Emu Ltd
19
6.0 HEALTH & SAFETY
On the commencement of the survey a safety briefing was attended by all survey personnel
whereupon the emergency procedures were explained and emergency equipment
demonstrated. The briefing was repeated for any new staff.
A safety plan and risk assessment was completed prior to survey commencement and can be
viewed on request. All survey and crew members were required to read and sign the safety
plan. Toolbox talks were given regularly to familiarise all personnel with the equipment and
vessel.

Halcrow Group Limited Wave Hub Geophysical Survey for
Archaeological Assessment
Report 08/J/1/02/1329/0829-DRAFT Emu Ltd
20
7.0 REFERENCES Breiner, S., 1999, Applications Manual for portable magnetometers
G-882 Cesium marine magnetometer operations manual, 2005, Geometrics
Sheriff, R., 1978. A First Course in Geophysical Exploration and Interpretation.
Stanley, J.M., 2003, Achieving 100% quality assurance in ferrous explosive ordnance
disposal, Geophysical Research Institute, University of New England, Australia.

APPENDIX A Service Constraints

Service Constraints This report and the data were compiled and carried out by Emu Limited (Emu), in accordance with
Proposal No. P/1/02/08/0671. The services were performed by Emu with the skill and care ordinarily
exercised by a reasonable hydrographic survey specialist at the time the services were performed.
Further, and in particular, the services were performed by Emu taking into account the limits of the
scope of works required by the Client, the time scale involved and the resources, including financial
and manpower resources, agreed between Emu and the Client.
Other than that expressly contained in paragraph 1 above Emu provides no other representation or
warranty whether express or implied, in relation to the services.
The services were performed by Emu exclusively for the purposes of the client. Emu is not aware of
any interest of or reliance by any party other than the client in or on the services. Unless expressly
provided in writing, Emu does not authorise, consent or condone any party other than the client relying
upon the services. Should this report or any part of this report, or otherwise, details of the services or
any part of the services be made known to any such party, and such party relies thereon that party does
so wholly at its own and sole risk and Emu disclaims any liability to such party. Any such party would
be well advised to seek independent advice from a competent hydrographic survey specialist and / or
lawyer.
It is Emu’s understanding that this report is to be used for the purpose described in Section 1.1 of this
report. That purpose was a significant factor in determining the scope and level of the services. Should
the purpose for which the report is used, and / or should the clients proposed development or use of the
site change (including in particular any change in any design and / or specification relating to the
proposed use or development of the site), this report may no longer be valid or appropriate and any
further use of or reliance upon the report in those circumstances by the Client without Emu’s review
and advice shall be at the clients sole and own risk. Should Emu be requested, and Emu agree, to
review the report after the date hereof, Emu shall be entitled to additional payment at the then existing
rates or such other terms as may be agreed between Emu and the client.
The passage of time may result in changes (whether man-made or otherwise) in site conditions and
changes in regulatory or other legal provisions, technology, methods of analysis, or economic
conditions which could render the report inaccurate or unreliable. The information, recommendations
and conclusions contained in this report should not be relied upon if any such changes have occurred or
after the period of 2 years from the date of this report or such other period as may be expressly stated in
the report, without the written agreement of Emu. In the absence of such written agreement of Emu,
reliance on the report after any such changes have occurred or after the period of 2 years has expired,
shall be at the clients own sole risk. Should Emu agree to review the report after the period of 2 years
has expired, Emu shall be entitled to additional payment at the existing rates or such other terms as
maybe agreed between Emu and the client.
The observations, recommendations and conclusions in this report are based solely upon the services
which were provided pursuant to the contract between the client and Emu. Emu has not performed any
observations, investigations, studies or testing not specifically set out or required by the contract
between the client and Emu. Emu is not liable for the existence of any condition, the discovery of
which would require performance of services not otherwise contained in the services.
Where the services have involved Emu’s interpretation and / or other use of any information (including
documentation or materials, analysis, recommendations and conclusions) provided by third parties
(including independent testing and / or information services / laboratories) or the client and upon which
Emu was reasonably entitled to rely or involved Emu’s observations of existing physical conditions of
any site involved in the services, then the services clearly are limited by the accuracy of such
information and the observations which were reasonably possible of the said site. Unless otherwise
stated, Emu was not authorised and did not attempt to independently verify the accuracy or
completeness of such information, received from the client or third parties during the performance of
the services. Emu is not liable for any inaccuracies (including any incompleteness) in the said
information, the discovery of which inaccuracies required the doing of any act including the gathering
of any information which it was not reasonably possible for Emu to do including the doing of any
independent investigation of the information provided to Emu save as otherwise provided in the term’s
of the contract between client and Emu.

APPENDIX B Daily Progress Reports

APPENDIX C Tidal Data

APPENDIX D Sidescan Sonar Contacts

APPENDIX E Table of Significant Magnetic Anomalies

Positions are given in metres Easting and Northing to projection WGS84 UTM Zone
30 North.
No: Easting Northing Intensity of Anomaly (nT)
1 324264.7 5567098 1.12
2 326293.8 5564118 8.42
3 326172.7 5564036 2.9
4 326654.1 5565641 1.73
5 326299.6 5564119 13.52
6 326342.9 5565360 5.1
7 325789.9 5566230 9.39
8 325404.9 5566583 1.92
9 326334.2 5564309 2.69
10 323694.2 5567329 0.79
11 321575.7 5567926 0.49
12 326708.2 5564305 0.72
13 326741.3 5564545 6.78
14 326644.3 5565556 0.79
15 326442.2 5565914 2.29
16 326412.2 5564469 4.74
17 326425.7 5564536 6.25
18 326514.2 5564928 6.81
19 326385.9 5564314 2.45
20 326069.1 5565893 0.76
21 326128.3 5565803 0.67
22 326743.8 5564858 15.11
23 326739.3 5564818 9.34
24 326749.1 5564941 7.24
25 326735.3 5565294 2
26 326531.5 5565648 8
27 326238.7 5566108 2.96
28 326620.2 5564445 10.3
29 326640.2 5564537 2.87
30 325902.9 5566485 11.53
31 326656.2 5564617 1.33
32 326483 5565630 1.52
33 326018.1 5566141 3.58
34 326546.4 5564469 6
35 326614.8 5565294 3.95
36 326405.1 5565669 3.08
37 325908.2 5566480 4.94
38 316937.9 5573656 320.48
39 316941.2 5573701 351.52
40 316976 5573750 13.07
41 324869.4 5567254 1.99
42 325291 5566967 0.53
43 321770.7 5568253 1.3

No: Easting Northing Intensity of Anomaly (nT)
44 313750.5 5576240 0.78
45 316461.5 5574340 1.35
46 317738 5573473 1.41
47 314619.8 5582219 0.5
48 313971.4 5580527 0.75
49 313744.6 5582324 0.97
50 316892.2 5573615 452.72
51 316856 5573591 17.01
52 313277.1 5583315 0.93

APPENDIX F Drawings