wave systems corp. - faculty directory · 9/30/1999 · wave systems corp. ... shares outstanding...
TRANSCRIPT
3582985
Wave Systems Corp.
Financial InformationServices
18 Febuary 1900
MERGENT FIS - COMPANY REPORT
Investment Research
Thomson Financial
Copyright

Billable page 1
Stock Price Data
Wave Systems Corp. Wave Systems Corp. Symbol WAVX (OTC) Fiscal Year Ends December, 1998 Updated 02/18/00 Priced as of 01/31/00 ISSUE DATA Price $ 12.75 Dividend Rate $ 0.00 52W Range $29.00-7.50 Dividend Yield 0.00% Shares Outstanding 31.54 Mil Book Value $ N.M. Debt/Equity N.M. Price/Book N.M. Cash $ 0.03 Beta 0.15 Revenue $ 0.00 Money Volume 181.22 Mil TTM EPS $ -0.44 Pretax Int Cov N.M. Float N.M. SIC Industry Group: Industrial Machinery and Equipment SIC CODE(S): 3577 8731 CORPORATE OFFICE: CONTACT: Investor Relations 480 PLEASANT St. Lee, MA 01238 PHONE: 413-243-1600
BUSINESS DESCRIPTIONBUSINESS DESCRIPTION: Co. is creating a new electronic commerce model for digital information and services based on client-side security, transactions and trust. Co. has devoted substantially all of its efforts and resources to research, feasibility studies, design, development, and market testing of a distributed trust system that enables client based transactions, including the metered usage of electronic content and services (the "Wave System"). Electronic content and services refers to any data, graphic software, video or audio sequence that can be digitally transmitted and/or stored. The Wave System consists of an EMBedded Application Security SYstem ("EMBASSY") in consumer devices that provide the basis for a multi-party trusted system using both hardware and software. The EMBASSY is a programmable, low cost "system within a system" that can perform independent transactions such as meter content usage, store sensitive information such as identities and account balances and run secure applications for access to services. The EMBASSY is an open system based on secure smart card hardware technology that can be integrated into PCs, peripherals, set top boxes or used as an independent component. The WaveMeter application running in the EMBASSY allows transactions to occur without the expense of a real-time network connection for every transaction. The EMBASSY securely stores electronic funds and transaction information about the usage of electronic content to be

Billable page 1
transmitted securely to a central transaction processing center ("WaveNet") periodically. WaveNet manages encryption and decryption keys, processes credit and usage charges, automatically obtains credit authorization, calculates royalty distributions, and can provide user and usage data to electronic content owners. The Wave System is designed to be compatible with every existing content delivery system such as CD-ROM, the Internet, and digital broadcast. PC OEMs, content providers and services providers such as telecommunications companies have expressed interest in the Wave System and Co. believes that once there is a broad installed base of the EMBASSY, electronic content and service providers from other market segments are likely to be attracted to the Wave System. Copyright 2000 Financial Information Services, Inc. FIS is a third party beneficiary to Investext. Under no circumstances shall FIS have any liability relating to the use of this report.

Billable page 2
Quarterly Summary 1996-99
HISTORICAL QUARTERLY RESULTS EARNINGS PER SHARE (U.S. Dollars per share) 1999 1998 1997 1996 1st Qtr MARCH -.11 -.08 -.13 2nd Qtr JUNE -.12 -.09 -.17 -.17 3rd Qtr SEPT -.21 -.09 -.20 -.14 4th Qtr DEC -.18 -.20 REVENUE (Thousands of U.S. Dollars) 1st Qtr MARCH 2 9 1 2nd Qtr JUNE 2 4 2 3rd Qtr SEPT 51 3 4 4th Qtr DEC -5 EBIT (Thousands of U.S. Dollars) 1st Qtr MARCH -2,843 -1,946 -1,829 2nd Qtr JUNE -4,162 -1,822 -2,575 -2,407 3rd Qtr SEPT -8,309 -2,717 -4,378 -1,864 4th Qtr DEC -5,127 -2,573
Equity And Debt Breakdown
[Part 1 of 2] EQUITY AND DEBT BREAKDOWN: 1) non-voting series A cumulative redeemable preferred par US$ 0.01 AUTH - 2000000.0 SHR OUTSTG - Dec. 31, 1998, 360.0 2) class A common par US$ 0.01 AUTH - 75000000.0 SHR OUTSTG - Dec. 31, 1998, 28402149.0 Options- A summary of option activity through December 31, 1998 follows: Shares Outstanding at Dec 31, 1997 1,944,790 Granted 5,665,278 Canceled (701,267) Exercised (77,558) Outstanding at Dec. 31, 1998 6,831,243 Exercisable at Dec. 31, 1998 1,760,568 In September 1991, the Board of Directors authorized the establishment of a stock option plan (the "1991 Plan"). The total number of shares of Class B common stock subject to the Plan is 2,700,000. In January 1994, the Board of Directors authorized the establishment of the 1994 Employee Stock Option Plan (the "1994 Plan"). The initial number of shares of Class A common stock subject to the 1994 Plan was 1,000,000. In May 1996, July 1997, and November 1998 the Board of Directors approved an amendment to Co.'s 1994 Plan to increase the number of shares of Class A common stock reserved for issuance thereunder by 1,000,000, 1,000,000 and 5,000,000, respectively.
-- Continued on next page

Billable page 2
-- Continued from previous page
Therefore, the 1994 Plan number of shares of Class A common stock reserved for issuance is 8,000,000 shares. In January 1994, the Board of Directors authorized the establishment of the Non-Employee Directors Stock Option Plan (the "Directors' Plan"). The total number of shares of Class A common stock subject to the Directors' Plan was 200,000. In February 1995, the Board of Directors authorized certain changes to the Directors' Plan. The annual option grant for directors was increased from a total of 2,000 shares of Class A common stock to 10,000 shares of Class A common stock. In July 1995, the stockholders of Co. authorized an increase to the total number of shares subject to the Directors' Plan from 200,000 shares to 500,000 shares. In November 1998, the stockholders of Co. authorized an increase to the total number of shares subject to the Directors' Plan from 500,000 shares to 1,000,000 shares. In September 1996, the Board of Directors authorized the establishment of the 1996 Performance Stock Option Plan ( the "1996 Plan"). The initial number of shares of Class A common stock subject to the 1996 Plan was 800,000. At December 31, 1998, there were approximately 3,360,000 additional shares available for grant under the 1994 Plan. Offered- (3,600,000 shs.) at $5.00 per share (proceeds to Co., $4.65 per share) on Aug. 31, 1994 thru Dickinson & Co. and associates. Offering contains an option to purchase 540,000 shs. to cover over-allotments. Proceeds Copyright 2000 Financial Information Services, Inc. FIS is a third party beneficiary to Investext. Under no circumstances shall FIS have any liability relating to the use of this report.

Billable page 3
Equity And Debt Breakdown
[Part 2 of 2] to be used for ongoing research and development, expansion of Co.'s marketing operations, to develop an administrative system for WaveNet and for working capital and general corporate purposes, including rent for expanded facilities. 3) class B common par US$ 0.01 AUTH - 13000000.0 SHR OUTSTG - Dec. 31, 1998, 3140665.0
Historical Price Performance
HISTORICAL PRICE PERFORMANCE 4 Week 13 Week 26 Week 52 Week YTD Week 3 Year % Change % Change % Change % Change % Change % Change Price 6.80 34.21 13.33 52.24 6.80 397.46 Rel. Price 1.01 0.97 0.96 0.94 1.01 0.86 Current PE N.M. Monthly Return 6.80 5 Year High PE N.M. 1 Year Monthly Return 142.25 5 Year Low PE N.M. 3 Year Monthly Return 418.45
Institutional Ownership & Insider Trading Data
INSTITUTIONAL OWNERSHIP Percent Shares Outstanding Owned 8.12 Number of Institutions 40.00 Total Shares held 3096394.00 3 Month Purchases/Sales 2171613.00 3 Month Shares Purchased 2313099.00 3 Month Shares Sold 141486.00 INSIDER TRADING (Previous month) Purchasers (Net) -1.00 Number of Buyers 0.00 Number of Sellers 1.00 Shares Bought/Sold -20000.00 Number of Shares Bought 0.00 Number of Shares Sold 20000.00
Peer Group Comparison - Company, S&P500, Industry Ratios
PEER GROUP RATIOS COMPANY S&P 500 INDUSTRY AS OF AS OF AS OF 02/18/00 02/18/00 02/18/00 P/E N.M. 14.32 4.42 DIV YIELD 0.00 2.09 1.05 PRICE/BOOK N.M. 3.96 6.24
-- Continued on next page

Billable page 3
-- Continued from previous page
PRICE/CASH FLOW N.M. N.M. 19.81 PRICE/TANG. BOOK N.M. 10.21 7.53 3 YR REV GROWTH N.M. 12.41 21.74 3 YR EPS GROWTH N.M. 73.94 46.12 3 YR DIV GROWTH N.M. 10.06 8.33 NET INC GROWTH N.M. 154.39 59.69 REINVESTMENT RATE N.M. 9.65 9.74 NET PROFIT MARGIN -116706.99 7.39 6.39 OPER PROFIT MARGIN -131197.30 13.18 10.19 ROE N.M. 17.97 19.89 ROA -578.09 5.59 6.80 FIXED CHARGE COVERAGE -10.16 16.31 26.15 CURRENT RATIO 0.22 1.78 2.10 LG-TM DEBT TO EQUITY N.M. 84.01 59.59 TOTAL DEBT TO EQUITY N.M. 90.40 61.10
Quarterly Income Statement 09/30/98 and 09/30/99
[Part 1 of 2] TABLE: QUARTERLY INCOME STATEMENT 09/30/98 and 09/30/99 Wave Systems Corp. Ticker: WAVX DETAILED QUARTERLY INCOME STATEMENT (Thousands of U.S. Dollars) 3 MONTHS 3 MONTHS 9 MONTHS 9 MONTHS ENDING ENDING ENDING ENDING 09/30/99 09/30/98R 09/30/99 09/30/98R Net Income -8,310 -3,953 -18,908 -9,999 Total Revenues 51 11 70 48 Cost of Revenues 24 8 35 32 Outstanding Shares 40,073 40,073 Income before Taxes -8,310 -3,953 -18,908 -9,999 EPS fr Net Inc-Prim -.21 -.12 -.50 -.35 Research & Development 2,967 1,967 7,281 4,589 Copyright 2000 Financial Information Services, Inc. FIS is a third party beneficiary to Investext. Under no circumstances shall FIS have any liability relating to the use of this report.

Billable page 4
Quarterly Income Statement 09/30/98 and 09/30/99
[Part 2 of 2] 3 MONTHS 3 MONTHS 9 MONTHS 9 MONTHS ENDING ENDING ENDING ENDING 09/30/99 09/30/98R 09/30/99 09/30/98R Interest Income (Exp), Net 189 64 -331 82 Average Shares Outstanding 39,930 32,571 37,490 30,919 EPS fr Cont Oper-Prim -.21 -.12 -.50 -.35 General & Administrative 4,065 2,677 11,087 7,633 Total Oth Inc & Exp, Net 625 1,250 2,125 Gross Profit 27 3 35 16 Net Income Appl to Common Shs -8,313 -4,003 -18,921 -10,862 Income after Tax -8,310 -3,953 -18,908 -9,999 Preferred Stock & Oth Adj 2 50 13 864 Operating Income -8,500 -4,642 -19,826 -12,206 Other Operating Expenses 1,494 1,494
Quarterly Balance Sheet 09/30/98 - 09/30/99
TABLE: QUARTERLY BALANCE SHEET 09/30/98 - 09/30/99 Wave Systems Corp. Ticker: WAVX DETAILED QUARTERLY BALANCE SHEET (Thousands of U.S. Dollars) As of As of As of As of 09/30/99 06/30/99 03/31/99 12/31/98 Liabilities: Total Assets 16,910 22,414 22,720 2,058 Fixed Assets 1,978 1,357 1,106 888 Common Stock 401 364 346 315 Preferred Stock 348 Accounts Payable 4,290 3,458 2,634 3,591 Retained Earnings -84,123 -65,057 -60,894 -57,220 Total Current Assets 14,738 20,918 21,506 1,062 Cash & Short Term Inv 13,123 19,989 21,355 1,057 Total Current Liabilities 4,290 3,458 3,259 4,841 Other Assets 195 139 107 107 Other Current Assets 1,615 929 151 5 Total Stockholders' Equity 12,620 18,452 18,962 -3,276 Total Liabilities 4,290 3,962 3,758 5,334 Other Current Liabilities 625 1,250 Other Stockholders' Equity 96,342 83,145 79,510 53,281

Billable page 4
Quarterly Balance Sheet 09/30/98 - 09/30/99
As of 09/30/98R Liabilities: Total Assets 4,602 Fixed Assets 865 Common Stock 306 Preferred Stock 1,642 Accounts Payable 2,571 Retained Earnings -51,847 Total Current Assets 3,634 Cash & Short Term Inv 3,634 Total Current Liabilities 4,493 Other Assets 103 Total Stockholders' Equity -379 Total Liabilities 4,981 Other Current Liabilities 1,922 Other Stockholders' Equity 49,520 Copyright 2000 Financial Information Services, Inc. FIS is a third party beneficiary to Investext. Under no circumstances shall FIS have any liability relating to the use of this report.
Billable page 5
Quarterly Cash Flows 09/30/98 and 09/30/99
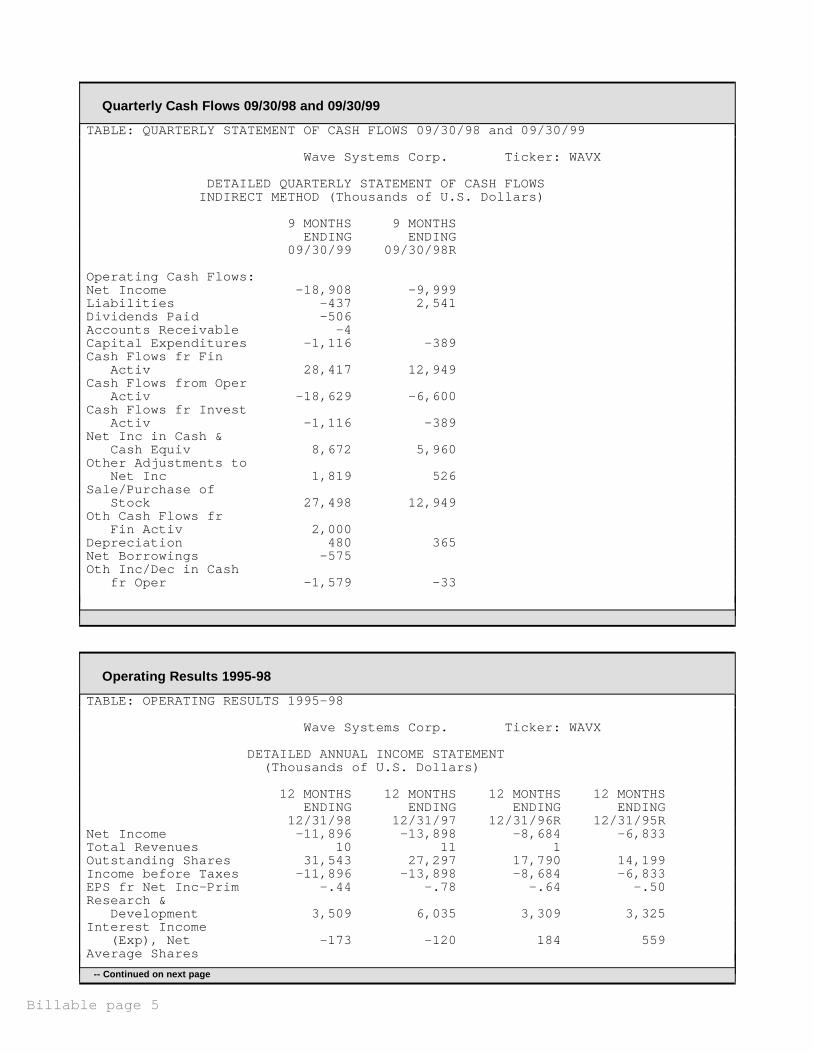
TABLE: QUARTERLY STATEMENT OF CASH FLOWS 09/30/98 and 09/30/99 Wave Systems Corp. Ticker: WAVX DETAILED QUARTERLY STATEMENT OF CASH FLOWS INDIRECT METHOD (Thousands of U.S. Dollars) 9 MONTHS 9 MONTHS ENDING ENDING 09/30/99 09/30/98R Operating Cash Flows: Net Income -18,908 -9,999 Liabilities -437 2,541 Dividends Paid -506 Accounts Receivable -4 Capital Expenditures -1,116 -389 Cash Flows fr Fin Activ 28,417 12,949 Cash Flows from Oper Activ -18,629 -6,600 Cash Flows fr Invest Activ -1,116 -389 Net Inc in Cash & Cash Equiv 8,672 5,960 Other Adjustments to Net Inc 1,819 526 Sale/Purchase of Stock 27,498 12,949 Oth Cash Flows fr Fin Activ 2,000 Depreciation 480 365 Net Borrowings -575 Oth Inc/Dec in Cash fr Oper -1,579 -33
Operating Results 1995-98
TABLE: OPERATING RESULTS 1995-98 Wave Systems Corp. Ticker: WAVX DETAILED ANNUAL INCOME STATEMENT (Thousands of U.S. Dollars) 12 MONTHS 12 MONTHS 12 MONTHS 12 MONTHS ENDING ENDING ENDING ENDING 12/31/98 12/31/97 12/31/96R 12/31/95R Net Income -11,896 -13,898 -8,684 -6,833 Total Revenues 10 11 1 Outstanding Shares 31,543 27,297 17,790 14,199 Income before Taxes -11,896 -13,898 -8,684 -6,833 EPS fr Net Inc-Prim -.44 -.78 -.64 -.50 Research & Development 3,509 6,035 3,309 3,325 Interest Income (Exp), Net -173 -120 184 559 Average Shares
-- Continued on next page
Billable page 5
-- Continued from previous page
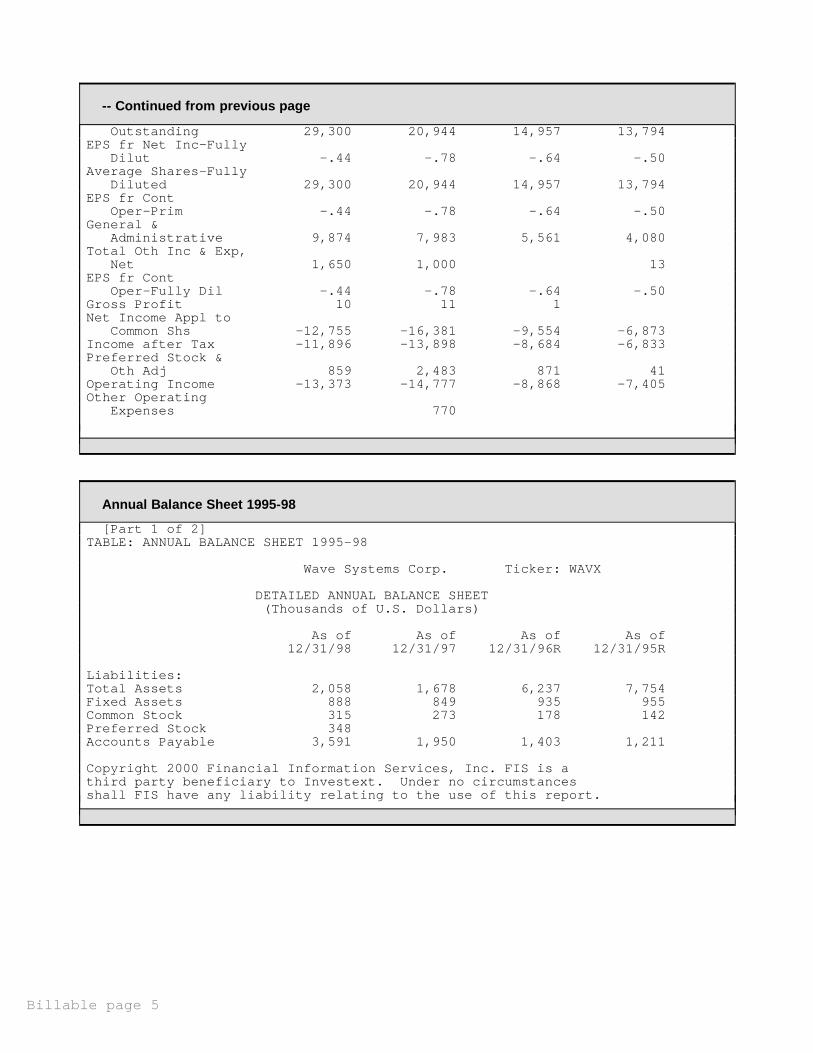
Outstanding 29,300 20,944 14,957 13,794 EPS fr Net Inc-Fully Dilut -.44 -.78 -.64 -.50 Average Shares-Fully Diluted 29,300 20,944 14,957 13,794 EPS fr Cont Oper-Prim -.44 -.78 -.64 -.50 General & Administrative 9,874 7,983 5,561 4,080 Total Oth Inc & Exp, Net 1,650 1,000 13 EPS fr Cont Oper-Fully Dil -.44 -.78 -.64 -.50 Gross Profit 10 11 1 Net Income Appl to Common Shs -12,755 -16,381 -9,554 -6,873 Income after Tax -11,896 -13,898 -8,684 -6,833 Preferred Stock & Oth Adj 859 2,483 871 41 Operating Income -13,373 -14,777 -8,868 -7,405 Other Operating Expenses 770
Annual Balance Sheet 1995-98
[Part 1 of 2] TABLE: ANNUAL BALANCE SHEET 1995-98 Wave Systems Corp. Ticker: WAVX DETAILED ANNUAL BALANCE SHEET (Thousands of U.S. Dollars) As of As of As of As of 12/31/98 12/31/97 12/31/96R 12/31/95R Liabilities: Total Assets 2,058 1,678 6,237 7,754 Fixed Assets 888 849 935 955 Common Stock 315 273 178 142 Preferred Stock 348 Accounts Payable 3,591 1,950 1,403 1,211 Copyright 2000 Financial Information Services, Inc. FIS is a third party beneficiary to Investext. Under no circumstances shall FIS have any liability relating to the use of this report.

Billable page 6
Annual Balance Sheet 1995-98
[Part 2 of 2] As of As of As of As of 12/31/98 12/31/97 12/31/96R 12/31/95R Retained Earnings -57,220 -45,324 -31,427 -22,743 Total Current Assets 1,062 759 4,135 6,593 Cash & Short Term Inv 1,057 759 4,064 6,458 Total Current Liabilities 4,841 1,950 1,403 1,211 Other Assets 107 70 1,168 207 Other Current Assets 5 70 135 Total Stockholders' Equity -3,276 -743 1,559 6,153 Total Liabilities 5,334 2,421 4,678 1,601 Other Current Liabilities 1,250 Other Stockholders' Equity 53,281 44,308 32,808 28,754
Annual Statement Of Cash Flows 1995-98
TABLE: ANNUAL STATEMENT OF CASH FLOWS 1995-98 Wave Systems Corp. Ticker: WAVX DETAILED ANNUAL STATEMENT OF CASH FLOWS INDIRECT METHOD (Thousands of U.S. Dollars) 12 MONTHS 12 MONTHS 12 MONTHS 12 MONTHS ENDING ENDING ENDING ENDING 12/31/98 12/31/97 12/31/96R 12/31/95R Operating Cash Flows: Net Income -11,896 -13,898 -8,684 -6,833 Liabilities 1,601 491 -191 344 Accounts Receivable -12 -17 -17 -17 Capital Expenditures -372 -256 -252 -814 Cash Flows fr Fin Activ 6,967 5,443 6,373 436 Cash Flows from Oper Activ -6,297 -8,493 -7,460 -5,811 Cash Flows fr Invest Activ -372 -256 2,640 2,727 Investments 3,898 4,209 Net Inc in Cash & Cash Equiv 298 -3,306 1,552 -2,648 Other Adjustments to Net Inc 2,470 4,190 1,104 677 Sale/Purchase of Stock 6,892 5,393 6,373 436 Oth Cash Flows fr Fin Activ 75 50 Depreciation 333 487 317 177 Oth Inc/Dec in Cash fr Oper 1,208 255 11 -159 Oth Cash Flows fr Invest Activ -1,005 -668

Billable page 6
OFFICERSOFFICERS: Peter J. Sprague, Chmn., C.E.O., Steven Sprague, Pres., C.O.O., Gerard T. Feeney, Sr. V.P., Fin. & Admin., C.F.O., Sec., James R. Franklin, V.P., Product Devel., Thomas R. Dilk, V.P., John R. Michener, V.P., Chief Scientist, Sanders Smith, V.P., John J. Valentine, V.P., David B.G. Kopans, Contr. DIRECTORS: Peter J. Sprague, Chmn., John E. Bagalay Jr., Phillippe Bertin, Nolan Bushnell, George Gilder, John E. McConnaughy Jr., Steven Sprague
Auditor
Auditor: KPMG Peat Marwick L.L.P. Employees: 80 Sales/Employee: 127.41 Net Income/Employee: N.M. TRANSFER AGENT: American Stock Transfer & Trust Co Company incorporated 1988 in DE. Direct inquiries to: Investor Relations, 243-1600. Copyright 2000 Financial Information Services, Inc. FIS is a third party beneficiary to Investext. Under no circumstances shall FIS have any liability relating to the use of this report.