wave transmission on submerged rubble mound breakwater ...ipcbee.com/vol6/no1/55-f00108.pdf · wave...
TRANSCRIPT

Wave Transmission on Submerged Rubble Mound Breakwater Using L-Blocks
Dayat Indri Yuliastuti PhD Candidate, Department of Civil Engineering Universiti Teknologi PETRONAS, 31750 Tronoh
Perak, MALAYSIA Email: [email protected]
Ahmad Mustafa Hashim Associate Professor, Department of Civil Engineering
Universiti Teknologi PETRONAS, 31750 Tronoh Perak, MALAYSIA
Email: [email protected]
Abstract—Laboratory tests on a permeable submerged rubble mound breakwater (SRMB) constructed using L-Blocks armour unit with 40 tests for wave transmission were analyzed and the available empirical equations for wave transmission coefficient (Kt) were evaluated. The ranges of variation were 0.23< ds /d<0.38, 0.001< Hi /(gT2) <0.022, 0.011< Hi /L<0.139, and 0.769<B/d<0.625 where B is the top width of the breakwater and L is the incident wave length. The design parameters varied systemically to investigate the impact of incident wave height (Hi), wave period (T), water depth (d), and submergence depth (ds) on the values of Kt. The tests were performed in a wave flume 23 m long and 2 m wide. The armor units were L-Block artificial armour unit with the relative density of 2.4. The results showed that for various relative submergence depth, ds/d, (i) little correlation was found when Kt correlate with B/d. (ii) Kt correlates well with wave steepness Hi /L and with Hi /(gT2). Four commonly used predictors of Kt have been assessed against the new data among which the one is regarded to fit the data better.
Keywords-Submerged Rubble Mound Breakwater; Wave Transmission Coefficient; L-Block Armor Unit; Coastal Engineering
I. INTRODUCTION Rubble mound breakwater (RMB) is the most common
breakwater used for shore protection. It consists of several armor layers with different densities. The armor unit can be random placed, uniform placed, selective placed or special placed adjusting with the design [1]. RMB is conventionally designed with the top part emerged from water as shown in Fig. 1, referred to emerged rubble mound breakwater (ERMB) here. Only minor overtopping degree is permitted, therefore this structure must be massive to withstand the impact force of breaking waves. However, even though calm condition in the leeside (breakwater shoreward) can be achieved, several major issues like degradation of water quality, concerns for natural habits partly enclosed inside the bay, and aesthetic considerations can be regarded as downsides of this type of breakwater. Limited water circulation and high concentration of water pollution from moored ship inside the marina could intensify some of the above-mentioned problems.
To overcome some problems associated with ERMB, engineers have designed submerged rubble mound breakwater (SRMB). As indicated by the name, this structure is constructed below a specified water design level as shown in Fig. 2. This structure permits the passage of
some wave energies and, in turn, allows some water circulation to replace the reduction of protection level. The objective of this experimental study is to investigate wave transmission through SRMB.
The L-Block, a new interlocking concrete armor unit has been developed at University of Malaya in 2006. Originally, the L-Block had been designed to protect slopes and banks against erosion, but for the first practical experience after applying slight changes to optimize the design of the modified L-Block has been introduced as an armor unit to a rubble mound breakwater. Construction of the first Modified L-Block breakwater on the west coast of Peninsular Malaysia was successfully completed in July 2008 [2].
Sea Side Lee Side
Crest
Seabed
Figure 1. Typical Emerged Rubble Mound Breakwater (ERMB)
Mean Water Level
Incident Wave
d
B
hsCore Layer
HiT
ds
Seabed
THtTransmitted Wave
HV
Figure 2. Typical Submerged Rubble Mound Breakwater (SRMB)
II. PREVIOUS INVESTIGATIONS The wave transmission coefficient (Kt) is defined as the
ratio of the transmitted wave height (Ht) at the leeside to the incident wave height (Hi) at the breakwater seaward.
i
tt H
HK = (1)
V1-243
2011 2nd International Conference on Environmental Science and Technology IPCBEE vol.6 (2011) © (2011) IACSIT Press, Singapore

The value of Kt indicates the effectiveness of a SRMB to attenuate waves. It varies as 0<Kt <1. Value of zero implies that there is no transmission such in the case of high or impermeable breakwaters. Value of 1 means no reduction in wave height as if there is no barrier in front of the wave.
Transmission of wave energy through breakwaters has been studied by several researchers in different ways (Abdul Khader and Rai [3], Allsop [4], Van der Meer and Daemen [5], among others). Most investigations suggested that submergence depth and structure geometry are the most significant parameters affecting the wave transmission. Wave characteristics (Hi, T) and permeability of the breakwater were also found to influence the wave transmission.
The studies of Dick and Brebner [6] on solid and permeable submerged breakwaters indicated that these breakwaters with near zero submergence were capable of reducing the incident wave energy by 50%. Raman et al. [7] investigated the damping action of rectangular and rigid vertical submerged barriers and expressed Kt in terms of the transmitted energy to the total power of the incident wave. It was stated that in the case of rectangular submerged barrier, top width of the barrier played an important role in controlling Kt. The test on wave transmission and reflection characteristics of model breakwater conducted by Seelig [8] indicated that both ds and B were important in determining the performance of the breakwater and it was suggested that near zero submergence of submerged breakwater was efficient in reducing the transmission.
Kobayashi and Wurjanto [9] presented a numerical approach based on finite amplitude shallow water equation for determination of wave transmission through submerged breakwater. Design equations for wave transmission over a submerged breakwater with mild slope were detailed by Rojanakamthorn et al. [10]. The results suggested that when the height of submerged breakwater was 50% of the water depth, Kt varied between 0.4 and 0.7. Carevic et al. [11] studied transmission of irregular waves through submerged breakwater as employed in the computer software, MIKE21-BW-1D. The results were compared with laboratory measurements in physical model tests as reported by Johnson [12]. The wave breaking was calculated with modified breaking angle parameters of surface roller concept. Transmission coefficients obtained from the numerical model showed good agreement with measured data.
Several empirical equations have been obtained from laboratory tests on SRMB. In what follows the formulae suggested for Kt by four independent investigations are given.
Seabrook and Hall [13] introduced equation in which F is the freeboard (m) as denoted by ds in Fig. 2.
⎟⎟⎠
⎞⎜⎜⎝
⎛−⎟⎟
⎠
⎞⎜⎜⎝
⎛+⎟⎟
⎠
⎞⎜⎜⎝
⎛−−−=
5050067.0047.009.165.0exp1
BDFH
LDBF
BH
HFK ii
it
(2)
D’Angremond [14] came up with two relations for Kt depending on the ratio of top width to the wave height as in (3) and (4). ξ is the self-similarity parameter.
( )ξ5.031.0
164.04.0 −−
−×⎟⎟⎠
⎞⎜⎜⎝
⎛+−= e
HB
HFK
iit
if B/Hi ≤8 (3)
( )ξ41.065.0
151.035.0 −−
−×⎟⎟⎠
⎞⎜⎜⎝
⎛+−= e
HB
HFK
iit
if B/Hi ≥12 (4)
For 8<B/Hi <12, linear interpolation can be used. Based on the value of F/Hi, Buccino [15] suggested that
Kt can be obtained from equation (5) and (6).
LHB
FH
FH
K
i
iit 5.112.0
33.018.1
1
⎟⎟⎠
⎞⎜⎜⎝
⎛+⎟⎟⎠
⎞⎜⎜⎝
⎛=
if 2>(F/Hi)>0.83 (5)
( )2
17.0 ;2.2min25.062.0;74.0min⎥⎥⎦
⎤
⎢⎢⎣
⎡
⎟⎟
⎠
⎞
⎜⎜
⎝
⎛−=
LHBK
it ξ if F=0 (6)
Linear interpolation can be applied for 0.8>F/Hi >0. Friebel et al , 1999 [16] suggested the following
equation:
0905.11359.0log0696.04257.00292.04969.0 +⎟⎟⎠
⎞⎜⎜⎝
⎛+⎟⎟⎠
⎞⎜⎜⎝
⎛−⎟⎟⎠
⎞⎜⎜⎝
⎛−⎟⎟⎠
⎞⎜⎜⎝
⎛+−=BF
LB
dd
dB
HFK s
it
(7)
In the present paper, experimental data are compared
versus the above-mentioned empirical equations.
III. EXPERIMENTAL SETUP AND PROCEDURE The selection of breakwater material was based on the
necessity of breakwater armor unit to withstand numerous wave conditions. A model breakwater was constructed in a wave flume with 1.8 m depth, 23 m length and 2 m width in Coastal Laboratory of Civil Engineering Department in Universiti Teknologi PETRONAS (UTP), Malaysia. The armor units were L-Blocks artificial armor with the relative density of 2.3, average mass of 840 g, and Dn of 0.0629 m. Fig. 3 shows sections of the breakwater when submerged in the flume. Fig. 4 presents views from the flume and the SRMB as built. Fig. 5 shows isometric view of the L-Block and Fig. 6 shows characteristic dimension of L-Block unit.
Important parameters affecting the design and operation of SRMB varied systematically as listed in Table 1. Placement of the armor units followed the real life practice. The core was placed by shovel, trowelled and washed in place to naturally compact. Each armor unit was placed individually and properly by hand. An armor unit was ensured to be in contact with armor next to it without being pushed into core layer material.
V1-244

Figure 3. SRMB Model
a. Core Layer b. Armor Layer
c. Coastal Laboratory d. SRMB Model with d =0.65m
Figure 4. The Model Construction and Equipment Installation
Figure 5. Isometric view of the Modified L-Block
Figure 6. Characteristic dimensions of L-Block unit
All tests were performed with regular waves of various
height and period. Wave heights at both sides of the breakwater were measured using wave probes and the values were double checked by video clips played in pause mode or slow motion. Sixth wave probes were used, three at each side placed at 1-m distance from each other, the first one near the toe of the breakwater. The average of the transmitted wave heights as captured by the first two probes downstream of the breakwater was taken as Ht.
Table 1. Breakwater Structure Configuration
Series Code
Submergence Depth, ds (m)
Crest Width, B (m) Cot θ
A1 0.15 0.5 1.5B1 0.20 0.5 1.5C1 0.30 0.5 1.5
IV. RESULTS AND DISCUSSION Fig. 7a shows the wave data with 650 mm water depth,
wave height of 10 cm and T of 1.5 s. The following data from the figure are noteworthy: Hi,max=0.11 m, Hi,min=0.09 m, Hi=0.10 m, Ht,max=0.10 m, Ht,min=0.08 m, and Ht=0.09 m. The incident and transmitted waves for 650 mm water depth, wave height of 11 cm and T of 2 s are shown in Fig. 7b from which the following data are noted: Hi,max=0.12 m and Hi,min=0.10 m, Hi=0.11 m and Ht,max=0.11 m, Ht,min=0.09 m, Ht=0.10 m. The pattern of the fluctuations is fairly regular showing the data and measurement methods were reliable.
Under water depth of 800 mm, the breakwater performed better with T=2.0 s compared to T=1.0 s as Kt=0.73<Kt=0.86. Additionally, with water depth of 650 mm and T=2.0 s, the performance of the breakwater was better than that for T=2.0 s and d=700 mm, as Kt=0.70< Kt=0.73.
V1-245

a.Wave Data, Hi =10cm, T=1.5s b.Wave Data, Hi =11cm, T=2s
Figure 7. Wave Data d=0.65m with different Hi and T
Figure 8. Variation of Kt with Hi /gT2
Figure 9. Variation of Kt with Hi /L
Variation of Kt versus Hi /(gT2) and Hi/L for different
values of relative submergence, ds /d, are shown in Fig. 8 and 9, respectively. The horizontal axes are the indication of the wave steepness, the second being the actual wave steepness
and the first is a representative of the steepness. For example, in deepwater conditions, L=1.56×T2. The plots show that when submergence is greater than 40%, the breakwater does not attenuate the waves significantly. The performance with low submergence is further improved as the wave steepness increases. For near zero submergence, a transmission coefficient of Kt=0.70 will result that is fairly independent of the wave steepness.
Figure 10. Influence of relative crest height on transmission
(variable wave height, T=2 s) Fig. 10 is a plot of transmission coefficient versus the
relative submergence for five wave heights. As expected, the attenuation decreases with increase of submergence. The interesting observation is that the curves show a fairly linear variation. Within the limits of the experimental data, the following linear regression equation will result.
⎟⎠⎞
⎜⎝⎛+=
ddK s
t 53.17.0 (8)
Figure 11. Effect of crest width on wave transmission
In a numerical prediction of performance of SRMB,
Rambabu and Mani [17] compared their numerical solution with the experimental data of Hall and Seabrook [13] in a graph showing the variation of Kt versus hs/d. The data relate to a permeable SRMB with porosity of 0.3. The plot contains 7 data points in the range of 0.25<hs/d<0.56 to which a linear fit is applied here as
)(81.085.0dh
K st −= (9)
Noting hs=d-ds, the relation can be converted to
V1-246
⎟⎠⎞
⎜⎝⎛+=
ddK s
t 81.004.0 (10)
However, the present form (8) is comparable with the
experimental data presented by Abdul Khader and Rai [3] for impermeable SRMB. The best fit line to their experimental data is
⎟⎠⎞
⎜⎝⎛+=
ddK s
t 75.017.0 (11)
In the later stages of this ongoing investigation, this equation will be improved to involve the effect of other influencing parameters such as the breakwater top width B, breakwater height hs, breakwater slope and permeability.
Fig. 11 illustrates a plot of the transmission coefficient, Kt against the dimensionless parameter B/d. As expected, a strong correlation cannot be observed because other influencing properties such as submergence and wave characteristics are not captured in the variable B/d. Regular patterns in the graphs presented by some authors (see Rambabu and Mani [17] or Sidek and Abdul Wahab [18]) should be interpreted with care. In the former, Hi/(gT2) involves the wave characteristics and the latter dealt only with a single submergence depth. However, within the range of the present data, the following linear fit can show the overall pattern.
⎟⎠⎞
⎜⎝⎛+=
dBKt 5.082.0 (12)
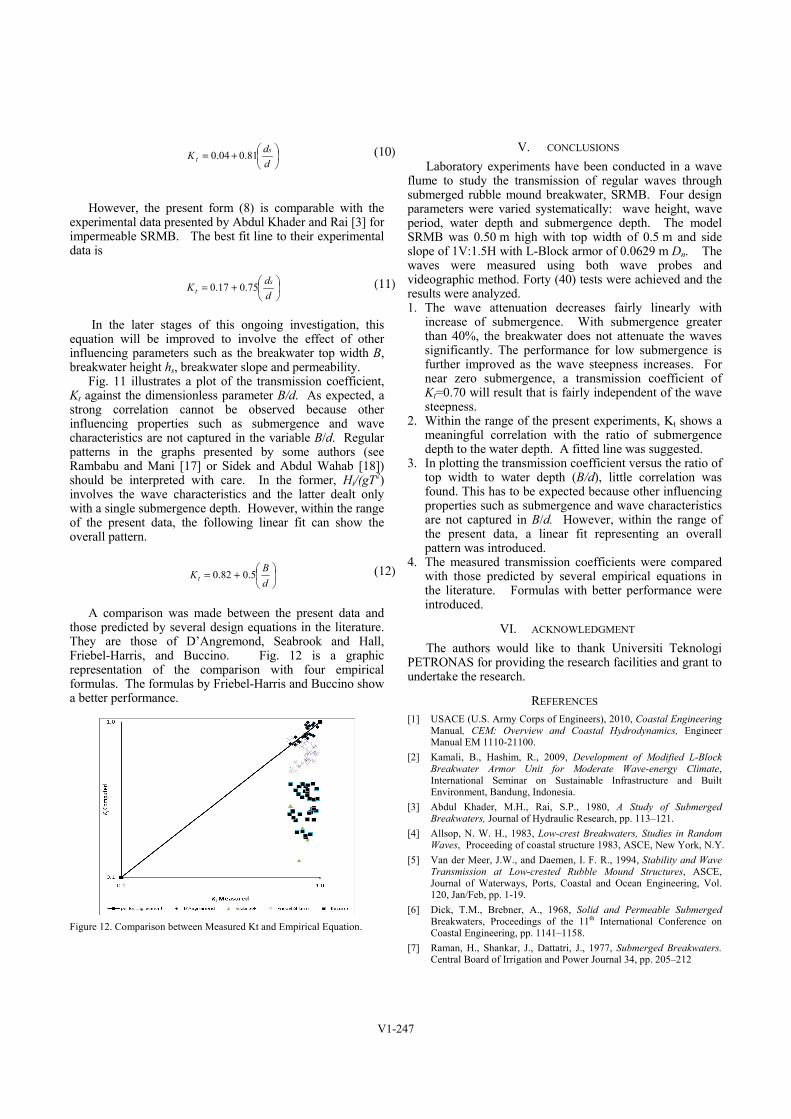
A comparison was made between the present data and those predicted by several design equations in the literature. They are those of D’Angremond, Seabrook and Hall, Friebel-Harris, and Buccino. Fig. 12 is a graphic representation of the comparison with four empirical formulas. The formulas by Friebel-Harris and Buccino show a better performance.
Figure 12. Comparison between Measured Kt and Empirical Equation.
V. CONCLUSIONS Laboratory experiments have been conducted in a wave
flume to study the transmission of regular waves through submerged rubble mound breakwater, SRMB. Four design parameters were varied systematically: wave height, wave period, water depth and submergence depth. The model SRMB was 0.50 m high with top width of 0.5 m and side slope of 1V:1.5H with L-Block armor of 0.0629 m Dn. The waves were measured using both wave probes and videographic method. Forty (40) tests were achieved and the results were analyzed. 1. The wave attenuation decreases fairly linearly with
increase of submergence. With submergence greater than 40%, the breakwater does not attenuate the waves significantly. The performance for low submergence is further improved as the wave steepness increases. For near zero submergence, a transmission coefficient of Kt=0.70 will result that is fairly independent of the wave steepness.
2. Within the range of the present experiments, Kt shows a meaningful correlation with the ratio of submergence depth to the water depth. A fitted line was suggested.
3. In plotting the transmission coefficient versus the ratio of top width to water depth (B/d), little correlation was found. This has to be expected because other influencing properties such as submergence and wave characteristics are not captured in B/d. However, within the range of the present data, a linear fit representing an overall pattern was introduced.
4. The measured transmission coefficients were compared with those predicted by several empirical equations in the literature. Formulas with better performance were introduced.
VI. ACKNOWLEDGMENT The authors would like to thank Universiti Teknologi
PETRONAS for providing the research facilities and grant to undertake the research.
REFERENCES [1] USACE (U.S. Army Corps of Engineers), 2010, Coastal Engineering
Manual, CEM: Overview and Coastal Hydrodynamics, Engineer Manual EM 1110-21100.
[2] Kamali, B., Hashim, R., 2009, Development of Modified L-Block Breakwater Armor Unit for Moderate Wave-energy Climate, International Seminar on Sustainable Infrastructure and Built Environment, Bandung, Indonesia.
[3] Abdul Khader, M.H., Rai, S.P., 1980, A Study of Submerged Breakwaters, Journal of Hydraulic Research, pp. 113–121.
[4] Allsop, N. W. H., 1983, Low-crest Breakwaters, Studies in Random Waves, Proceeding of coastal structure 1983, ASCE, New York, N.Y.
[5] Van der Meer, J.W., and Daemen, I. F. R., 1994, Stability and Wave Transmission at Low-crested Rubble Mound Structures, ASCE, Journal of Waterways, Ports, Coastal and Ocean Engineering, Vol. 120, Jan/Feb, pp. 1-19.
[6] Dick, T.M., Brebner, A., 1968, Solid and Permeable Submerged Breakwaters, Proceedings of the 11th International Conference on Coastal Engineering, pp. 1141–1158.
[7] Raman, H., Shankar, J., Dattatri, J., 1977, Submerged Breakwaters. Central Board of Irrigation and Power Journal 34, pp. 205–212
V1-247

[8] Seelig, W.N., 1980, Two-dimensional Tests of Wave Transmission and Reflection Characteristics of Laboratory Breakwaters, Tech. Rept. No. 80-1, US Army Coast. Engrg. Res. Ctr., Fort Belvoir, VA
[9] Kobayashi, N., Wurjanto, A., 1989, Wave Transmission Over Submerged Breakwaters. Journal of Waterway, Port Coastal and Ocean Engineering 115, pp. 662–680
[10] Rojanakamthorn, S., Isobe, M., Watanabe, A., 1989, Design Equation for Transmission at Submerged Rubblemound Breakwaters. Coastal Engineering in Japan 32, pp. 209–234.
[11] Carevic.D., Marko, P., Ocvirk, E., 2009, Modeling of wave Interaction with Submerged Breakwater using Mike 21 BW, International Symposium on Water Management and Hydraulic Engineering, Ohrid/Macedonia.
[12] Johnson, H. K., 2006, Wave Modeling in The Vicinity of Submerged Breakwaters, Journal of Coastal engineering 53, pp.39-48.
[13] Seabrook, S.R., Hall, K.R., 1998, Wave Transmission at Submerged Rubble Mound Breakwaters, Proceedings of the 26th International Conference Coastastal Engineering, pp. 2000– 2013. Copenhagen, Denmark.
[14] D’Angremond, K., Van der Meer, J.W., De Jong, R.J., 1996, Wave Transmission at Low-crested Structures, Proceedings of the 25th Int. Conf. Coast.Engineering, pp. 2418–2427.
[15] Buccino, M., Calabrese, M., 2007, Conceptual Approach for Prediction of Wave Transmission at Low-crested Breakwater, Journal of waterway, port, coastal, and ocean engineering , ASCE.
[16] Friebel, H. C., Harris, L. E., 1999, Re-evaluation of Wave Transmission Coeffcient Formulae from Submerged Breakwater Physical Model, Florida.
[17] Rambambu, A. C., Mani, J. S., 2005, Numerical Prediction of Performance of Submerged Breakwaters, Journal of Ocean Engineering 32 (2005) 1235-1246.
[18] Sidek, F. J., Abdul Wahab., 2007, The Effect of Submerged Breakwater Structures on Non- Breaking Wave Transformations, Malaysian Journal of Civil Engineering 19 (1): 17-25.
V1-248