waxy crude oil well surveillance journal of engineering and technology vol. 6 no. 2, 2018 issn...
TRANSCRIPT

European Journal of Engineering and Technology Vol. 6 No. 2, 2018 ISSN 2056-5860
Progressive Academic Publishing, UK Page 10 www.idpublications.org
WAXY CRUDE OIL WELL SURVEILLANCE
Amieibibama Joseph
University of Port Harcourt
NIGERIA
Joseph Atubokiki Ajienka
University of Port Harcourt
NIGERIA
Essien E. E
SPDC
NIGERIA
ABSTRACT
Generally, waxy crude oils are difficult to handle because of their high pour points compared
to the ambient temperature. Waxy crude oils exhibit non-Newtonian flow behaviour at
temperatures below the cloud point because of wax crystallization, which cause production
problems. In order to manage waxy crude oils field profitably, a well surveillance process
has been developed to enable field engineers to monitor and troubleshoot well problems and
recommend timely remedial actions such as wax cutting, solvent soaking and injection of
wax inhibitors. The surveillance process includes problem diagnostic charts developed
through modeling the temperature profile. With these, the point of deposition in the
production tubing can be predicted as well as the critical rate below which severe deposition
will take place. Case studies on the application of the process are presented
Keywords: Diagnostic plots, pour-point, Wax appearance temperature, Well surveillance,
Waxy crude oil, Wax deposition.
INTRODUCTION
Waxy crude oils are crude oils that precipitate hydrocarbon deposits. There are basically two
types of such deposits: paraffins and asphaltenes. Generally, these crude oils are difficult-to-
handle because of their high pour points compared to the ambient temperature. They exhibit
non-Newtonian flow behaviour at temperatures below the cloud point because of wax
crystallization. On further cooling and successive crystallization, gelling occurs at the critical
pour point. The pour point is the temperature below which the oil ceases to flow (pour). The
pour point is usually about 10 - 20oF lower than the cloud point (Wax Appearance
Temperature), which is the temperature at which paraffin particles begin to precipitate out of
solution. However, darker crude oils may mask the cloud. In this case, the cloud point is
estimated from measurements or observation of the inflection point on a cooling curve.
Depending on the flow regime, wax deposition begins on any surface (called cold spot)
where temperature is below the critical cloud point and that of the bulk oil.
Of the two kinds of organic deposits, paraffin deposition is the most widespread and more
easily handled, whereas asphaltene deposition is much more difficult to treat because of the
complex depositional relationship between the crude oil composition, pressure, and
temperature (Benallal et al, 2008, Hirchberg et al, 1984). Asphaltenes are insoluble in
distillates such as kerosene and diesel oil, and other low molecular weight hydrocarbons such
as propane and butane. They are soluble in aromatic solvents such as benzene, toluene and
xylene and have some solubility in common solvents, such as carbon tetrachloride and carbon
disulfide. Asphaltenes melt slowly, gradually softening to a thick viscous liquid. They burn
with a smoky flame, leaving a thin ash or carbonaceous ball. In this work, a surveillance
procedure is developed that help operators effectively monitor deposition to prevent
unexpected downtime in production operations.

European Journal of Engineering and Technology Vol. 6 No. 2, 2018 ISSN 2056-5860
Progressive Academic Publishing, UK Page 11 www.idpublications.org
LITERATURE REVIEW
Allen and Roberts (1993) observed that paraffin and asphaltene deposits might resemble each
other after a few days. However, paraffins melt over a narrow temperature range, and the hot
liquid has a low viscosity. They burn rapidly with less smoke and leave little residue while
asphaltenes melt slowly, gradually softening to a thick viscous liquid. They burn with a
smoky flame, leaving a thin ash or carbonaceous ball.
In order to prevent complete or partial loss of pipelines due to wax deposition, several works
has been carried out by various researchers to ensure the flow of waxy crude oil in pipelines.
Pannu and Sariman (2013) studied the thixotropic behaviour of a waxy crude oil from the
Malay basin and also explored the effects of temperature. From their study, it was inferred
that the extent of thixotropy increases with the reduction in temperature below the Wax
Appearance Temperature of the crude oil. Luthi (2013) characterized waxy crude oils and as
well conducted an experimental study of the restart of a line blocked with gelled waxy crude
and it was shown that the restart of waxy crude flowlines has close connection with the
complex rheological properties of gelled crudes and startup pressure propagation. Wax
deposition characteristics were also studied by Dwivedi and Sarica (2012), where it was
discovered experimentally that paraffin deposition is highly dependent on the thermal
effective driving force which is the temperature difference between oil bulk and initial inner
pipe wall and also on turbulence effects.
The problem of waxy crude oils can vary from very minor to extremely severe and can affect
both the production history and economics of production operations. The severity of the
problem may worsen with the age of the field. Progressive deposition and accumulation of
paraffin wax at the sand face and perforations, production tubing, surface flowlines and
storage vessels can limit the production capacity of a well. Deposition leads to loss of
production, increase in downtime and locked-in potential due to waxed up tubing in some
wells. It also leads to increase in operating expenses and minimization of profitability.
Mechanical means of handling, for instance, wax cutting, can lead to wear and tear of
production tubing and other problems. The most severe problems are gelling and start-up
pressure requirements after shut down, as well as blockage of pore space. These problems
are more severe offshore where it is difficult to pressurize the system at intermediate points,
thus leading to loss of flowlines and abandonment of wells. Apart from these problems, waxy
crude oils are desirable because of their low sulphur content and lightness (generally >30
API).
Similar to global trend of occurrence, the most prevalent of the types of depositional
problems in Nigeria is paraffin deposition. It is a problem in almost all the producing
companies. In Nigeria, pipelines have been known to wax up beyond recovery. Production
tubings have also been known to wax up, necessitating frequent wax cutting, which is
expensive.
There are many fields in the Niger Delta producing high pour point crude oils. Some of these
crude oils have pour points greater than 77oF, the average ambient temperature. Thus wax
deposition takes place in the production tubing. These fields are located onshore, swamp and
offshore environments. The most common method of handling the situation is by wax
cutting, using mechanical scrapper and solvent stimulation. The frequency of wax cutting
depends on the pour point and severity of the problem.

European Journal of Engineering and Technology Vol. 6 No. 2, 2018 ISSN 2056-5860
Progressive Academic Publishing, UK Page 12 www.idpublications.org
There are basically two methods of handling waxy crude oils, removal and preventive
methods. Removal methods allow some deposition to take place before removal. These
include mechanical, thermal, chemical control techniques and a combination of the three.
While the preventive methods retard wax deposition and improve pumpability. They work
best when chemicals are injected about the cloud-point and when well is flowing (Price,
1971). Preventive methods are economical because they minimize downtime and downhole
problems. These methods include chemical methods, use of emulsion, heat treatment and
production/completion techniques.
The objectives of this study are to develop waxy crude oil diagnostic charts with which the
depth at which wax deposition is expected in the production tubing can be predicted. This
will help in completion design of new wells in the reservoir. The diagnostic charts are also
useful in estimating the critical rate region below which wax deposition is expected to take
place. Finally, the study is aimed at developing a surveillance flowchart to improve on the
methods of monitoring and handling waxy crude oil wells and to optimize productivity.
CAUSES OF DEPOSITION
The primary cause of wax deposition is reduced solubility due to changes in the equilibrium
condition of the solution as a result of temperature reduction. Allen and Roberts [3] also
reported that paraffin could precipitate from crude oil when equilibrium conditions change
slightly, causing a loss of solubility of the paraffin in the crude. Points of deposition are
nucleating materials such as formation fines and corrosion products.
Holder and Winkler (1965), established that just 2% waxes in a hydrocarbon stream can give
rise to a high pour point. Tuttle (1983) confirmed this. Loss of gas and light hydrocarbons
from crude oil and drop in pressure can also decrease paraffin solubility. Reistle (1927)
reported that the presence of water also enhances wax precipitation. Newberry et al (1986)
reported that the total dissolved solid (TDS) of produced water in the range of 1000,000 to
400,000 ppm aggravated paraffin problems in the North Michigan Niagara field. Allen and
Roberts (1993) also reported that water-oil ratio has some effect on paraffin deposition.
Other causes of precipitation particularly at the wellbore and pore spaces are the alternate
wetting and drying of sand surfaces in pumping wells in which expanding gases tend to chill
the sand face. Causes of deposition have also been investigated (Bilderback and McDougall
1969; Jeffries- Harris and Coppel, 1969; Barker, 1987).
MECHANISM OF DEPOSITION
The severity of paraffin deposition depends predominantly on the composition (wax content)
of the crude oil, the cloud and pour points. It also depends on the rate of evolution of gas,
well depth, formation temperature, the ambient and operating temperatures, pressure drop,
previous shear history, pipe roughness and production practices (Reistle, 1927, Brewster,
1927, Perkins 1971). Hunt (1962) reported that the mechanism of paraffin deposition
involves direct precipitation of paraffin wax on or adjacent to the pipe wall and growth of the
deposit by diffusion of paraffin molecules from solution. Burger et al (1981) reported the
most detailed study on the mechanism of paraffin deposition. On the mechanism of
asphaltene deposition, Hirschberg et al (1984) reported that this was due to the flocculation of
the colloidal particles in a complex relationship of temperature, pressure, and composition.

European Journal of Engineering and Technology Vol. 6 No. 2, 2018 ISSN 2056-5860
Progressive Academic Publishing, UK Page 13 www.idpublications.org
METHODS OF DETECTING DEPOSITION
Apart from the knowledge of the pour point and the wax content, an indicator to watch on the
onset of paraffin deposition is accumulation of paraffin deposits in stock tanks. This is an
indication that paraffin deposition may be expected soon in the flowline, tubing and possibly
later in the wellbore (Allen and Roberts, 1993).
Other field methods of detecting wax deposition are:
i. Visual analysis of produced crude oils and wireline equipment to detect the type of
deposit. Knowledge of the type of crude oil can be helpful. Jeffries-Harris and
Coppel (1969) used this approach to confirm asphaltene deposition in the wellbore.
ii. Unusual drop both in wellhead pressure and temperature.
iii. Unusual drop in production rate and unexpected quit in production.
Experience in the handling of waxy crude oils has shown that there is no alternative to
experimental study with the actual crude oil to predict if wax deposition will take place and
the feasibility of chemical injection. This fact is illustrated in Table 1.
Table 1: Comparison of Three Waxy Crude Oils (Sifferman, 1979)
Sample API Pour Point Average
Crude Oil Gravity (oF)
(oC) Carbon
Number
Observations
Amna
36
75
24
21.6
Unloading problems in the
tanker at the North Sea
temperature of 45oF.
Dickinson
34
95
35
18.5
Flows at room temperature of
about 70oF.
Udang
40
100
38
20
Solid at room temperature of
about 70oF.
Note: No correlation between API gravity and pour point. Pour point is not a sole
indicator of a crude oil's flow properties (Sifferman, 1979). Viscosity, gel strength
and pour point are better used to characterize a crude oil's rheology.
EVALUATION OF METHODS OF HANDLING WAXY CRUDE
There has been no universally successful treatment of wax. Each method has been applied
with limited success. The handling of waxy crude is an individual field problem. The
composition and texture of the deposit, the point of deposition in the flow system, the type of
problem such as start-up or gelling and the operational and environmental conditions dictate
the type of handling methods.
There are basically two types of methods of handling waxy crude oils: removal methods and
preventive methods. While the preventive methods prevent wax precipitation and thus
prevent downtime but increase production cost, the removal methods result in production
downtime and also increase production cost.
Uhde and Kopp (1971) observed that the ideal method to handle waxy crude would be to
change the non-Newtonian flow behaviour to Newtonian flow with minimum expenditure
European Journal of Engineering and Technology Vol. 6 No. 2, 2018 ISSN 2056-5860
Progressive Academic Publishing, UK Page 14 www.idpublications.org
and minimum disturbance of production operations without undesirable side-effects and a
resultant reduction in operational risks.
Removal methods
Removal methods are methods in which paraffin wax is allowed to build up for periodic
removal. The frequency of removal depends on the severity of the problem. These methods
include:
i. Mechanical methods of wireline wax cutting and pigging. Wireline wax cutting is
commonly used in Shell Petroleum Development Company (SPDC). Pig traps are
recommended on flowlines likely to handle waxy crude oils. Wax cutting leads to
production downtime. On the long run, frequent wax cutting can be very expensive.
It is difficult to achieve complete clearing of the tubing and wireline failures are
common.
ii. Thermal Methods. These involve heat tracing of pipeline, hot oiling and tubing-tubing
connection of high temperature non-waxy crude oil well with waxy crude oil well
(Uhde and Kopp, 1971). The limitations include cost of energy, impracticability of
heating in hostile environments, and possibility of formation damage due to re-
precipitation of wax in low temperature formation (Baker, 1987).
iii. Chemical Methods. These involve the use of organic solvents to dissolve wax deposit
and diluents to reduce the concentration of wax. A major handicap of these methods
is the volume and thus cost of chemicals.
iv. Combination Methods: These involve combinations of the above methods.
Preventive methods
These methods are based on the maxim that "prevention is better than cure" if it is cheaper.
Preventive methods inhibit or retard wax deposition and improve pumpability. They work
best when chemicals are injected about the cloud point (Price, 1971) and when well is
flowing. Preventive methods are economical because they minimize downtime and downhole
problems. Preventive methods include:
i. Chemical methods where wax crystal modifiers, paraffin dispersants or pour point
depressants are injected to modify the crystal structure or co-crystallise with the wax
crystals or depress the pour point to a manageable level. The most suitable chemical
is selected based on its cost-effectiveness in terms of optimum dosage and unit cost of
chemical.
ii. Use of Emulsion. Inducing oil-in-water emulsion has been reported to improve the
pumpability of waxy crude oils (Sifferman, 1971; Marsden and Raghavan, 1978).
This may probably be the reason why waxy crude oil fields are able to produce with
minimum problem as water cut increases (provided the total dissolved solids of
formation water are low). The problems with these methods are the stability of the
emulsion and the additional cost of handling and separating the emulsion.
iii. Heat Treatment: Heating a waxy crude oil flowline above the cloud point can prevent
wax deposition. The disadvantages are as indicated in thermal methods of removal
above.
iv. Production/Completion Techniques: These include the use of plastic or coated pipes,
application of back pressures, minimizing pressure drawdown and use of improved
handling facilities.
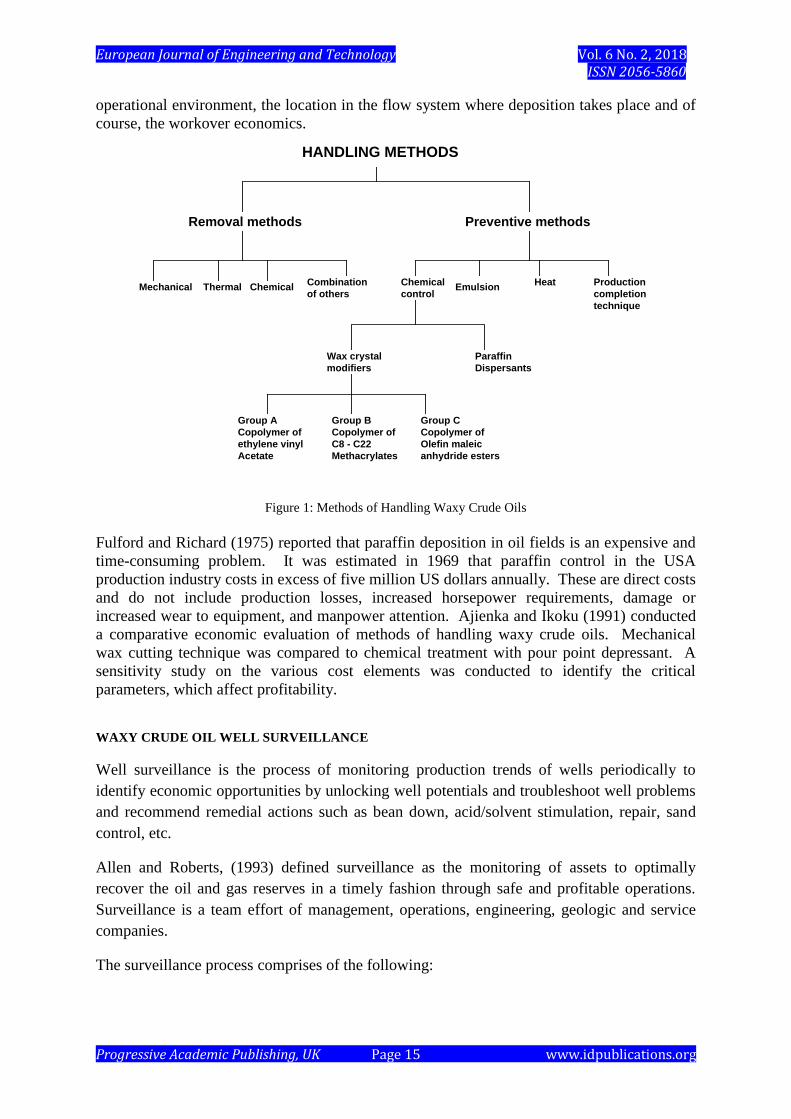
Figure 1 summarizes the handling methods. All these methods have their own limited
capabilities. The choice of any method of treatment depends on the severity of the problem,
European Journal of Engineering and Technology Vol. 6 No. 2, 2018 ISSN 2056-5860
Progressive Academic Publishing, UK Page 15 www.idpublications.org
operational environment, the location in the flow system where deposition takes place and of
course, the workover economics.
HANDLING METHODS
Preventive methodsRemoval methods
Mechanical Thermal Chemical Combination
of others
Chemical
controlEmulsion
Heat Production
completion
technique
Wax crystal
modifiers
Paraffin
Dispersants
Group A
Copolymer of
ethylene vinyl
Acetate
Group B
Copolymer of
C8 - C22
Methacrylates
Group C
Copolymer of
Olefin maleic
anhydride esters
Figure 1: Methods of Handling Waxy Crude Oils
Fulford and Richard (1975) reported that paraffin deposition in oil fields is an expensive and
time-consuming problem. It was estimated in 1969 that paraffin control in the USA
production industry costs in excess of five million US dollars annually. These are direct costs
and do not include production losses, increased horsepower requirements, damage or
increased wear to equipment, and manpower attention. Ajienka and Ikoku (1991) conducted
a comparative economic evaluation of methods of handling waxy crude oils. Mechanical
wax cutting technique was compared to chemical treatment with pour point depressant. A
sensitivity study on the various cost elements was conducted to identify the critical
parameters, which affect profitability.
WAXY CRUDE OIL WELL SURVEILLANCE
Well surveillance is the process of monitoring production trends of wells periodically to
identify economic opportunities by unlocking well potentials and troubleshoot well problems
and recommend remedial actions such as bean down, acid/solvent stimulation, repair, sand
control, etc.
Allen and Roberts, (1993) defined surveillance as the monitoring of assets to optimally
recover the oil and gas reserves in a timely fashion through safe and profitable operations.
Surveillance is a team effort of management, operations, engineering, geologic and service
companies.
The surveillance process comprises of the following:

European Journal of Engineering and Technology Vol. 6 No. 2, 2018 ISSN 2056-5860
Progressive Academic Publishing, UK Page 16 www.idpublications.org
(i) Problem Definition (ii) Diagnosis and Checks (iii) Remedial Action/ Treatment
and (iv) Post Treatment Evaluation.
A summary of the surveillance process modeling is shown in Figure 2.
PROBLEM
DEFINITION
DIAGNOSIS/
CHECKS
REMEDIAL
ACTION/
TREATMENT
POST
TREATMENT
EVALUATION
IS PROBLEM
SOLVED?
NO
STOP
YES
Figure 2: Surveillance Process Modeling
Problem definition: This involves certain observations in production test data of waxy crude
oil wells, such as sudden decrease in rate, wellhead temperature and pressure and increase in
GOR.
Diagnosis: The process involves:
i. Keeping records of all waxy crude oil wells such as cloud/pour point, yield value, wax
content of crude, Total Dissolved Solid (TDS) of produced water, chemical
composition (paraffin or asphaltenes) tubing size etc.
ii. Elimination of other possible causes of well problem by comparison with offset wells,
examining well performance history etc.
iii. Development of waxy crude oil diagnostic plots, e.g
a. Depth versus flowing/static temperature profiles. Flowing temperature at
various expected flow rates. Determination of critical region for wax
deposition
b. Wellhead temperature versus objective flow rate plots. Determination of
critical production rate below which wax deposition is expected
iv. Carrying out temperature survey and calibration of diagnostic plots. Prediction of
critical rate and time for treatment based on performance history.
v. Check the following: GOR history, critical rate, well head temperature (WHT),
wellhead pressure (WHP) and observed sudden changes, current water-cut and TDS.
These are summarized in Surveillance Spreadsheet provided in the appendix

European Journal of Engineering and Technology Vol. 6 No. 2, 2018 ISSN 2056-5860
Progressive Academic Publishing, UK Page 17 www.idpublications.org
Remedial action /treatment: This involves: a) Preventive methods: b) Remedial methods:
Wax cutting, solvent soaking, wax inhibitor injection (if injection materials are available).
Choice of method is based on economics and technical feasibility.
Post treatment evaluation: Check flow rate, wellhead temperature, well head pressure,
GOR.
WAXY CRUDE OIL DIAGNOSTIC PLOTS
These plots are basically used in the prediction of depth and critical rate at which wax is
expected to deposit on the production tubing as a function of flowing/static temperatures and
wellhead temperature respectively. The predicted results are compared with actual
measurements.
Simulation: In order to derive diagnostic plots, actual temperature survey data at different
depths should be used in the calibration of the software e.g. TEMPEST. From the results of
the simulation, the diagnostic plots: Depth versus Temperature and Wellhead Temperature
versus Flowrate are generated.
Prediction: Based on the diagnostic plots, the critical depth and rate at which wax is
expected to deposit in the tubing can be established.
Waxy Crude Oil Surveillance Flowchart: This is a summary of the process involved in
screening and identifying waxy crude oil wells, possible causes of wax deposition and the
recommended remedial action. Appendix 1 gives the surveillance spreadsheet containing
vital components of production that should be looked out for when monitoring wax
deposition.
CASE STUDIES
Waxy crude oil well surveillance was conducted for two fields in the Niger Delta. The basic
assumptions in the estimation of flowing tubing head temperatures were:
i. Ambient temperature of 77 oF
ii. Hole sizes, deviations and casing strings as per actual wells suspended.
iii. Constant bottom hole temperature over time.
iv. Range of wellhead pressures and rates from well production potentials
Based on the output data generated from the software, TEMPEST, diagnostic plots were
made using the EXCEL software, The pour point for the crude A was estimated to be within
the range of 65 -70 oF. The cloud point was generally difficult to estimate. However, it was
estimated to be some 10 - 25 oF above the pour point. Fig. 3 shows the critical depth region
for wax deposition in the tubing to be 500 - 800 ft. This depth range corresponds with the
various depths from which wax cutting operations were reported in all the wells investigated.
Figure 4 shows the plot of wellhead temperature versus production rate. Using the field
cloud point range, the critical rate region for wax deposition has been estimated as 700 - 1700

European Journal of Engineering and Technology Vol. 6 No. 2, 2018 ISSN 2056-5860
Progressive Academic Publishing, UK Page 18 www.idpublications.org
stb/d. Wells producing below the critical region would almost certainly be expected to
deposit wax.
Figure 3: Waxy Crude Oil Diagnostic Chart (Depth vs Flowing Temperature)
Figure 4: Waxy Crude Oil Diagnostic Chart (Wellhead Temperature vs. Flowrate)
Table 2 summarizes the results of the case studies. On the Effect of Tubing Size, a
relationship between the severity of wax cutting and tubing size was observed (Ajienka
1993). The severity ranges are as shown below:
0
1000
2000
3000
4000
5000
6000
7000
8000
9000
10000
11000
12000
13000
14000
0 50 100 150 200
DE
PT
H (
ft a
h)
Temperature deg oF
B A
40
50
60
70
80
90
100
110
120
0 500 1000 1500 2000 2500 3000
FW
HT
, d
eg F
Flowrate bopd
B A
A = Cloud point +20 oF
B = Pour point - 10 oFt

European Journal of Engineering and Technology Vol. 6 No. 2, 2018 ISSN 2056-5860
Progressive Academic Publishing, UK Page 19 www.idpublications.org
Tubing Size (inches) Severity Range
23/8 Fortnightly - Quarterly
27/8 Monthly - Quarterly
31/2 Quarterly - Semi-annually
Table 2: Parameters of wax cutting in Fields A and B of Niger Delta
Well
Reservoir Tubing
Size(in)
Rate
(Stb/d)
GOR
(Scf/stb)
BSW
(%)
WHP
(psig)
Wax Cut
Depth
Range (ft)
Remarks
A-12
M1000X
2-7/8
3-1/2
439
2000
0
1000
35 - 385
Rate critical
region.
A-22
M1000X 3 -1/2 1732 1640 27 1378 10 -1500 Rate within
critical region
A-25
M1000X
2-3/8
3 -1/2
1406
1393
0.1
(traces)
1465
6 - 2000
Rate within
critical region.
B-04
M2000X 2 -3/8 539 1465 81 240 10 - 1600 Rate below
critical region
B-12
D2000B 2 -3/8 1213 400 41 1000 25 - 2500 Rate within
critical region
B-39
C3000N 2 -3/8 925 303 3 126 50 - 1300 Rate within
critical region
The inference to be drawn from this is that since wax deposition decreases the internal
diameter of the production tubing, it is better to use larger diameter production tubing as long
as the tubing capacity can handle the well potential. On the prediction of maximum
permissible downtime to avoid gelling of flowlines, restartability after shutdown is a major
problem in waxy crude oil handling. To restart a flowline that has developed a gelling
structure, two conditions must be satisfied:
i. There must be enough available pump pressure to apply a shear stress to initiate flow.
This limiting shear stress is known as the static yield value of the crude oil. Care
must be taken to ensure that this static yield stress does not exceed the burst pressure
of the pipe.
ii. When the oil has yielded, the shearing stress must rapidly breakdown the gelled
structure in a reasonable time to give lower viscosities and hence increased flowrates.
Several studies have been conducted on the effect of flow interruption on the
pumpability of waxy crude oils (Economides and Chaney, 1983).
The transport properties of crude oil should be used to predict the acceptable downtime to
prevent complete gelling in the flowlines (Ajienka and Ikoku, 1990). Estimates for a 90 oF
pour point crude in the Niger Delta predicted that the maximum permissible downtimes for

European Journal of Engineering and Technology Vol. 6 No. 2, 2018 ISSN 2056-5860
Progressive Academic Publishing, UK Page 20 www.idpublications.org
the 6" flowline and 4" test line are about 5 and 6 hours respectively. Therefore, the need for
injection of pour point depressants into the flowlines particularly at downtimes to ensure
restartability cannot be over-emphasized.
CONCLUSIONS
i. Prediction of flowing and static temperature profiles in the production tubing is
necessary for effective well surveillance. Every waxy crude oil well should have
such diagnostic plots. From these, the critical depth for wax deposition should be
predicted. Confirm that this depth range corresponds to the various depths from
which wax cutting operations were reported in the wells investigated.
ii. Prediction of the cloud point and the critical rate region for wax deposition are
necessary. Wells producing below the critical rate region would almost certainly be
expected to cut wax.
iii. Waxy crude oil surveillance flowcharts are developed with which waxy crude oil
wells can be monitored effectively and production optimized.
iv. A waxy crude oil surveillance spreadsheet is developed to facilitate updating records
of waxy crude oil wells and to prepare monthly surveillance reports promptly.
RECOMMENDATIONS
The following recommendations are made:
i. Wax cutting sequence should be strictly followed to prevent tubing blockage. Thus
avoiding loss of production, high production downtime and minimization of
profitability.
ii. Waxy crude oil intervals should be sampled and analyzed monthly to obtain certain
parameters, such as TDS of water-cut, wax content etc.
iii. Carry out temperature (flowing and static) surveys as a function depth every six
months.
iv. There should be proper updates of wax cutting depths.
v. Sensitivity on temperature gradient should be carried out using software in order to
confirm the actual temperature measurements as well as the depth of wax deposition.
vi. A detailed economic evaluation of methods of handling waxy crude oils is imperative
in order to optimize oil production and revenue, maximize profits and obtain a good
return on investment.
vii. Elaborate tests should be performed at the discovery of a field to advise on special
well completion practices and subsequently to serve as a means of predicting severity
of wax deposition.
NOMENCLATURE
TDS = Total Dissolved Solids, ppm
GOR = Gas Oil Ratio, scf/stb
Rsi = Solution GOR, scf/stb
BS&W = Basic Sediments and Water, %
WHT = Well Head Temperature, oF
WHP = Well Head Pressure, psi
European Journal of Engineering and Technology Vol. 6 No. 2, 2018 ISSN 2056-5860
Progressive Academic Publishing, UK Page 21 www.idpublications.org
TEMPEST= Software for modeling temperature profiles in wells
Tc = Cloud Point, oF
Tp = Pour Point, oF
REFERENCES
1. Ajienka, J. A. & Ikoku, C. U. (1991): Economic Evaluation of Methods of Handling
Waxy Crude Oils, Processing, presented at the SPE Nigeria Int'l Conference, in Port
Harcourt, Nigeria
2. Ajienka, J. A. (1993) Otakikpo Development Feasibility Study, SPDC -E, Nigeria
3. Economides, M. J. & Chaney, G. T. (1983) The Rheological Properties of Prudhoe
Bay Oil and the Effects of a Prolonged Flow Interruption on its Flow Behavior, SPE
J. 23 (03), 408-416
4. Ajienka, J. A. & Ikoku, C. U. (1990) Waxy Crude Oil Handling in Nigeria. Practices
Problems and Prospects, Energy sources, 12, 463 – 478
5. Allen, T. O., & Roberts, A. P. (1993) Production Operations Vol. 2 - well
Completions, Workers and Stimulation. OGGI Tulsa, USA
6. Barker, K. M. (1987) Formation damage related to hot oiling, SPE 16230 presented at
the SPE production operations Symposium, 8-10 March, Oklahoma, USA
7. Benallal et al. (2008) Pueriere, Wax deposition in pipelines: Flow-loop experiments
and investigations on a Novel Approach, SPE 115293, presented at the SPE Annual
Conference and Exhibition, 21-23 September, Denver Colorado, USA.
8. Bilderback, C.A. & McDougall, L.A. (1969) Complete Paraffin Control in Petroleum
Production, J. Petroleum Technology, 21(09), 1151 – 1156
9. Brewster, F. M. (1927) Handling Congealing Oil and Paraffin Problems in the
Appalachian Fields, Tans. AIME, 77(01), 253-261
10. Burger, E. D., Perkins, T. K. & Striegler, J. H. (1981) Studies of Wax Deposition in
the Trance-Alaska pipeline, J. Petroleum Technology, 33(06), 1075 - 1086.
11. Dwivedi, P., Sarica, C., & Shang, W. (2012) Experimental Study on Wax Deposition
Characteristics of a Waxy Crude Oil under Single Phase Turbulent Flow Conditions,
presented at Offshore Technology Conference, 30 April-3 May, Houston, Texas, USA
12. Fulford, R. S. (1975) ‘‘Oilwell Paraffin Prevention Chemicals, SPE 5611, presented at
the SPE Oklahoma City Regional Meeting, 24-25 March, Oklahoma City, Oklahoma,
USA
13. Hirchberg et al. (1984) Meijer, Influence of Temperature and Pressure on Asphaltene
Flocculation, J. Petroleum Technology, 24(03), 283 - 293.
14. Holder, G. A. & Winkler, J. (1965) Wax Crystallization from Distillate Fuels, parts 1,
2 and 3. J. Inst. Petroleum 15, (499), 228 - 252
15. Hunt, E. B. (1962) Laboratory Study of Paraffin Deposition, J. Petroleum
Technology, 14(11), 1259 - 1269
16. Jeffries-Harris, M. J. & Coppel, C. P. (1969) Solvent Stimulation in low Gravity Oil
Reservoirs, J. Petroleum Technology 21(02), 167-175
17. Luthi, I. F. (2013) Waxy Crude Oil Characterization and Experimental Study of the
Restart of a Line Blocked with Gelled Waxy Crude, presented at the SPE Annual

European Journal of Engineering and Technology Vol. 6 No. 2, 2018 ISSN 2056-5860
Progressive Academic Publishing, UK Page 22 www.idpublications.org
Technical Conference and Exhibition, 30 September-2 October, New Orleans,
Louisiana, USA
18. Marsden, S. S. & Raghavan, R. (1973) A system for producing and transporting crude
oil as an oil/water simulation, J. Inst. Petrol 59 (570), 1973, 273 - 278
19. Newberry, M. E. Addison, G. E. & Barker, K. M. (1986) Paraffin Control in the
North Michigan Niagaran Reef Trend, SPE Production Engineering. 1(03), 213 - 220.
20. Pannu, J. K., & Sariman, M. Z. (2013) Yield Stress Measurement and Thixotropic
Behaviour of Waxy Crude Oil from the Malay Basin, presented at the International
Petroleum Technology Conference (IPTC), 26-28 March, Beijing, China
21. Perkins, T. K. & Turner, J. B. (1971) Starting Behaviour of Gathering Lines and
Pipelines filled with Gelled Prudhoe Bay oil, J. Petroleum Technology, 23(03), 301-
308
22. Price, R.C (1971) Flow improvers for waxy crudes, J. Inst. Petroleum, 57 (554), 106 -
109
23. Reistle, R. C. (1927) Summary of existing information on handling congealing oils
and Paraffins, Trans. AIME, 77 (01), 227 - 252.
24. Sifferman, T. R. (1979) Flow properties of difficult to handle waxy crude oils, J.
Petroleum Technology, 31(08), 1979, 1042 - 1050
25. Tuttle, R. N. (1983) High pour point and asphaltic crude oil and condensates, J. Petrol
Technology, 35(06), 1192 - 1196
26. Uhde, A. & Kopp, G. (1971) Pipeline Problems Resulting from Handling of Waxy
Crudes, J. Inst. Petroleum, 57(554), 63-73

European Journal of Engineering and Technology Vol. 6 No. 2, 2018 ISSN 2056-5860
Progressive Academic Publishing, UK Page 23 www.idpublications.org
Appendix 1: Surveillance Spreadsheet
Well Res. Tubing
size
inches
Well
potential
stb/d
Current
Rate
Stb/d
Crit.
Rate
Stb/d
GOR/
Rsi
Tc oF
Tp oF
WHT oF
WHP
psi
BS&W
%
TDS
ppm
Wax
cont
%
Crit.
Depth
ftah
Any
temp
survey
Handling
Method/
Frequency