wcl406 default 3 gb user space 2 gb per-process space 2 gb system space 3 gb per-process space 1 gb...
TRANSCRIPT


Mysteries of Windows Memory Management Revealed
Mark RussinovichTechnical FellowWindows Azure(created jointly with Dave Solomon)
WCL406
Goals
Deep dive on:Process virtual and physical memory usageOperating system virtual and physical memory usage
Crisply define memory-related terminologyHighlight tools that reveal memory usageDescribe ‘dark spots’ in memory analysis counters and tools
Agenda
Virtual MemoryAddress Space UsageProcess CommitSystem Commit
Physical MemoryWorking SetsPaging Lists
Hard to Track Memory

Tools We’ll Use
Task ManagerSysinternals Process ExplorerSysinternals Vmmap
Process virtual and physical memory usage
Sysinternals RammapSystem physical memory usage
Sysinternals TestlimitTest program to leak different kinds of memory
Sysinternals tools are free at www.sysinternals.com

Virtual Memory

Memory Management Fundamentals
Windows has demand-paged memory managementProcesses “demand” memory as neededThere is no swappingA page is 4 KB (8 KB on Itanium)Allocations must align on 64 KB boundaries
Large pages are available for improved TLB usagex86: 4 MBX64 and x86 PAE: 2 MBItanium: 16 MB
There is NO (will, almost no) connection between virtual memory and physical memory
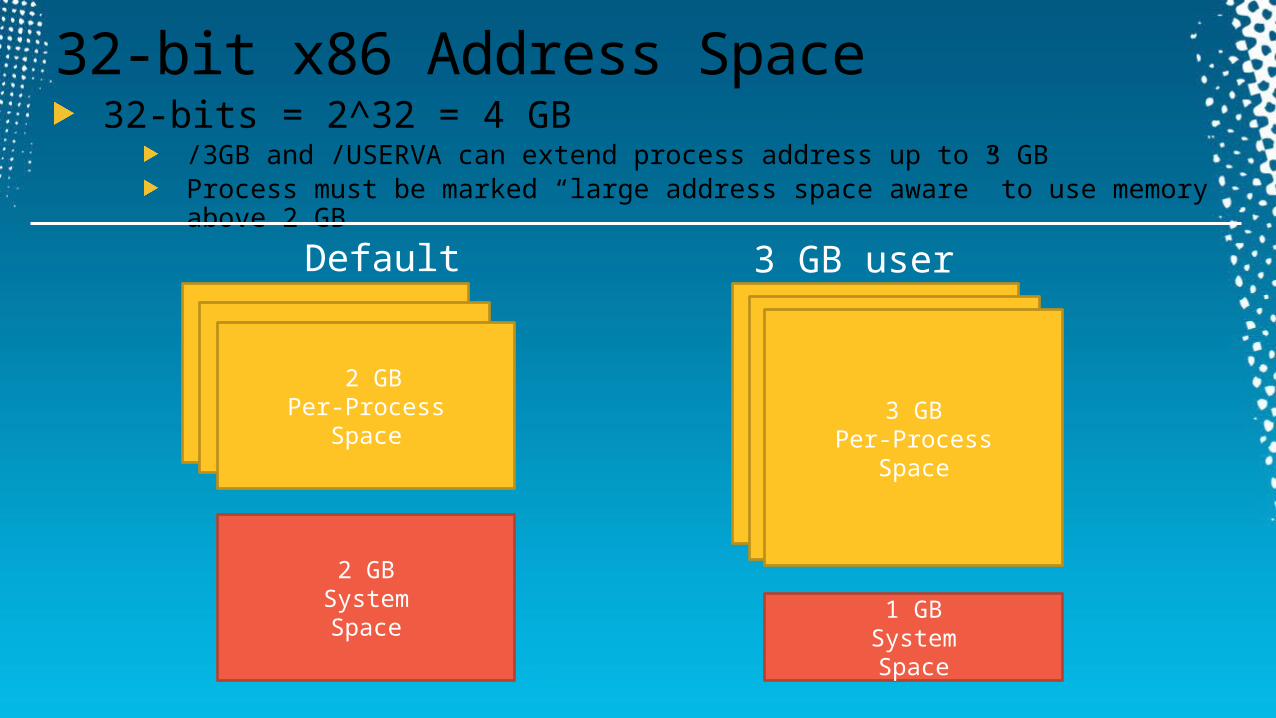
32-bit x86 Address Space32-bits = 2^32 = 4 GB
/3GB and /USERVA can extend process address up to 3 GBProcess must be marked “large address space aware” to use memory above 2 GB
Default 3 GB user space
2 GBPer-Process
Space
2 GBSystemSpace
3 GBPer-Process
Space
1 GBSystemSpace

64-bit Address Spaces64-bits = 2^64 = 17,179,869,184 GB
x64 today supports 48 bits virtual = 262,144 GB = 256 TBIA-64 today support 50 bits virtual= 1,048,576 GB = 1024 TB64-bit Windows supports 44 bits = 16,384 GB = 16 TB
x64 32-bit processon x64
8 TBSystemSpace
4 GBPer-Process
Space
8 TBSystemSpace
8 TBPer-Process
Space
Virtual Address Space Components
Committed: in-useReserved: reserved for future useAddress space breakdown
Private (e.g. process heap)Reserved or committed
Shareable (e.g. EXE, DLL, shared memory, other memory mapped files)
Reserved or committed
Free (not yet defined)
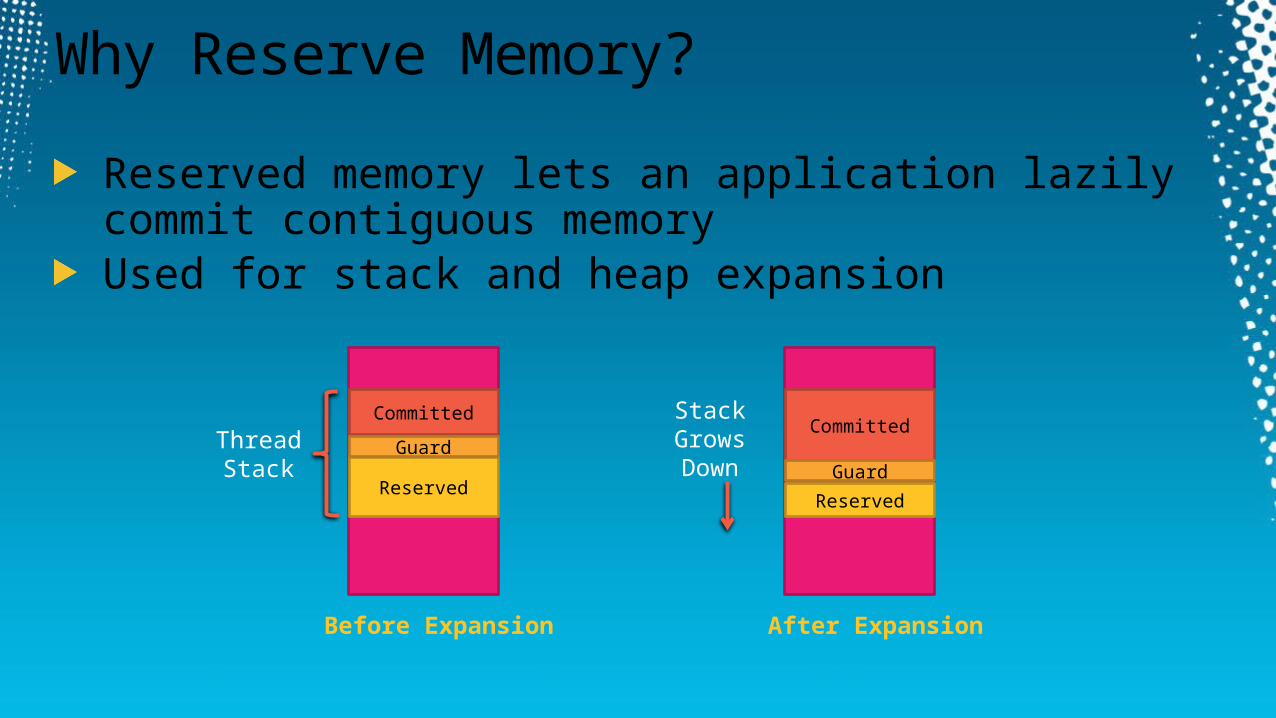
Why Reserve Memory?
Reserved memory lets an application lazily commit contiguous memory Used for stack and heap expansion
Before Expansion
Committed
Reserved
After Expansion
Committed
Reserved
ThreadStack
StackGrowsDown
GuardGuard

Viewing Address Space Breakdown
Task Manager only lets you see private bytes Before Vista: column called “VM Size”Vista and later: column called “Commit Size”
Process Explorer shows both virtual size and private bytesAdd 2 columns to process list
Virtual SizePrivate Bytes
Run Testlimit twice Testlimit -rTestlimit -m
Note: if on 64-bit Windows, 32-bit Testlimit can grow to 4GB

Understanding Process Address Space Usage
Most virtual memory problems are due to a process leaking private committed memory
Heap, GC heap, language heaps (CRT)
Private Bytes only tells part of the storyDoesn’t account for shareable memory that’s not shared (e.g. DLLs loaded only by this process)Fragmentation can be an issue
Address space can effectively be exhausted prematurely
Basic performance counters don’t provide enough information to troubleshoot
FragmentedAddressSpace

Viewing Processes with VMMap
VMMap shows detailed breakdown of process address space:Private process memory
Copy-on-write Private (VirtualAlloc)Heap and GC HeapStack
Shareable process memoryImage - executablesShareable – shareable memoryMapped File – memory mapped files
Page table – page table pagesUnusable – gap between allocation and next allocation boundary
Note that “shareable” types can have private commitmentRead/write pages in shared memoryCopy-on-write pages

Viewing FragmentationFragmentation is visible by selecting Options->Show Free Regions, selecting the Free type, and sorting by size
Largest free block is largest allocation possible
Clickable fragmentation map in View->Fragmentation ViewRun testlimit -t on 64-bit Windows
Threads need 256 KB 64-bit stack and 1 MB 32-bit stack

File MappingsFile mapping enables an application to read and write file data through memory operationsFile mappings are used for
Image (.EXE and .DLL) loading: “Image” in VMMapData files access (e.g. NLS files): “Mapped File” in VMMap“Pagefile-backed” shared memory: “Shareable” in VMMap
Entire file doesn’t have to be mappedAllows for “windows” into the file
AddressSpace
Database.db

Tracing File Mapping with Process Monitor
Procmon can trace image loader activity

VMMap Differencing
Press F5 to refresh the viewVMMap keeps all snapshots
Use the timeline to select snapshots to compare
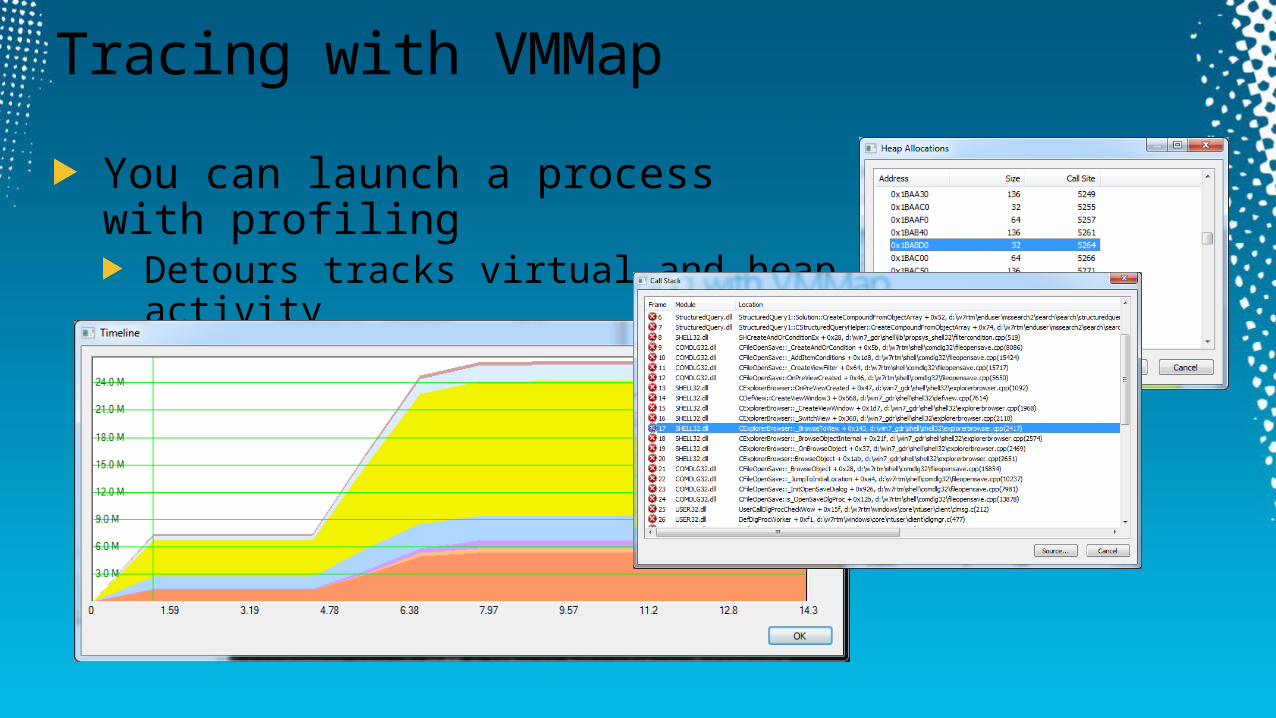
Tracing with VMMap
You can launch a process with profilingDetours tracks virtual and heap activity
The System Commit Limit
System committed virtual memory must be backed either by physical memory or stored in the paging file
Sum of (most of) physical memory and current paging files
Allocations charged against the system commit limit:Process private bytes Pagefile-backed shared memory Copy-on-write pagesRead/write file pagesSystem paged and nonpaged code and data
When limit is reached, virtual memory allocations failProcesses may crash (or corrupt data)
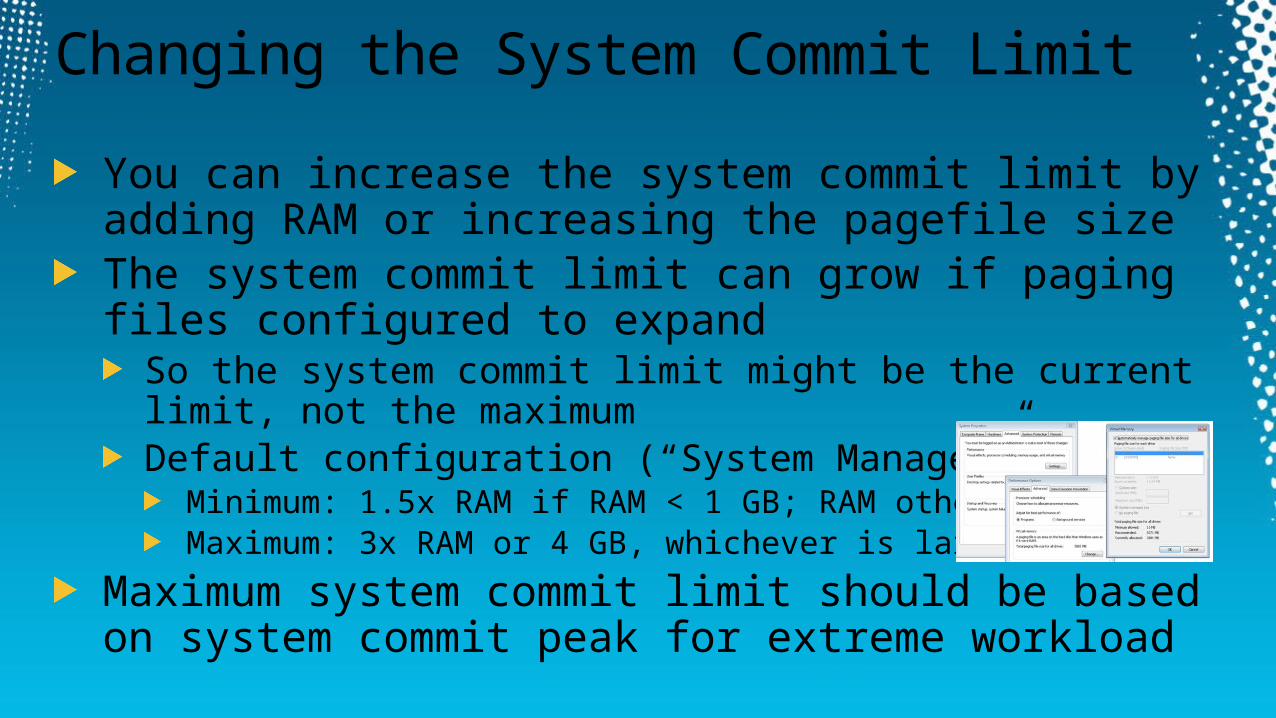
Changing the System Commit Limit
You can increase the system commit limit by adding RAM or increasing the pagefile sizeThe system commit limit can grow if paging files configured to expand
So the system commit limit might be the current limit, not the maximumDefault configuration (“System Managed”):
Minimum: 1.5x RAM if RAM < 1 GB; RAM otherwiseMaximum: 3x RAM or 4 GB, whichever is larger
Maximum system commit limit should be based on system commit peak for extreme workload

Viewing System Commit Usage
Performance Counters:Committed BytesCommit Limit
Task Manager XP: commit charge labeled “PF Usage”Vista: commit charge labeled “Page File”Win7: commit charge labeled “Commit”Vista and Win7 show commit limit after slash
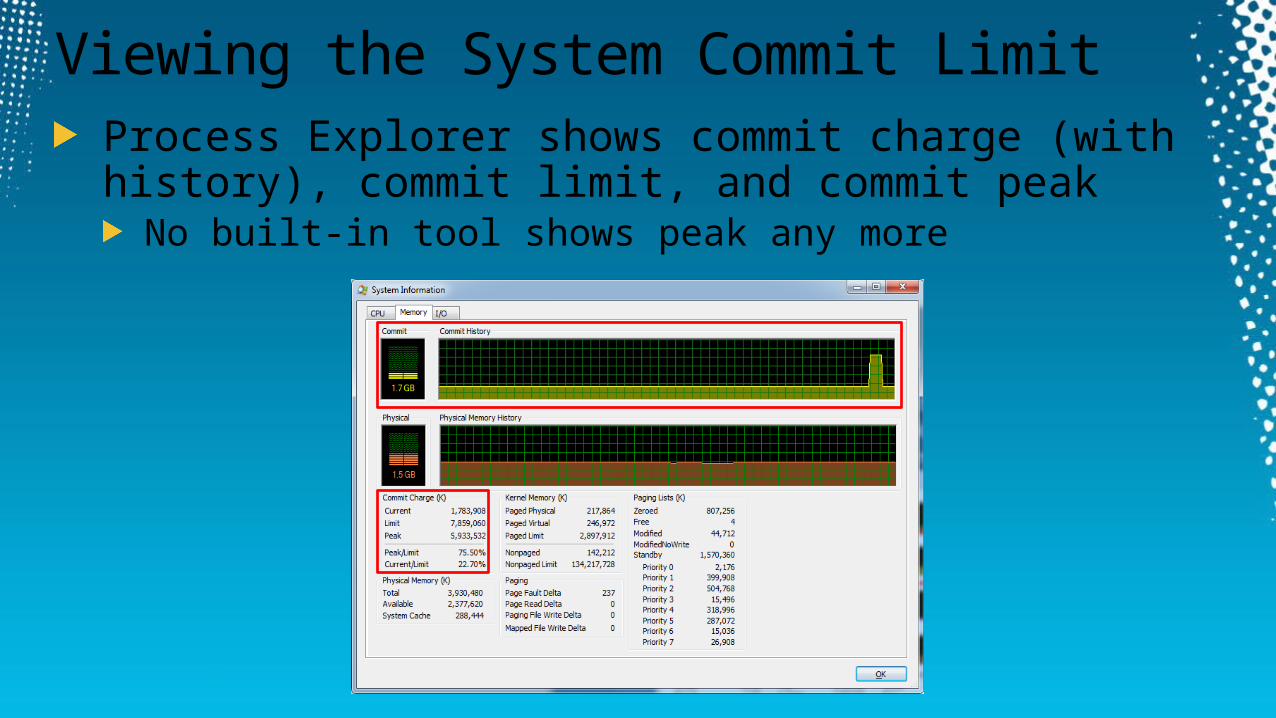
Viewing the System Commit LimitProcess Explorer shows commit charge (with history), commit limit, and commit peak
No built-in tool shows peak any more

Exhausting the System Commit Limit
On 32-bit system, run “Testlimit –m” multiple times until system commit limit exhaustedOn 64-bits, “Testlimit64 –m” will exhaust the system commit limit before its address space:

Sizing the Paging File
If you enough RAM to support your commit needs, why even have one?System can page out unused, modified private pages vs keeping them in RAMMore RAM available for useful stuff
Many recommendations use a formula based on RAM (1.5x, 2x, etc.)Actually, the more RAM, the smaller the paging file neededShould be based on workload usage of committed virtual memory
Look at commit peak after workload has runPre-Vista: Task ManagerVista+: Process ExplorerApply a formula to that to give buffer (1.5x or 2x)Make sure it’s big enough to hold a kernel crash dump

Physical Memory

Working Set List
All the physical pages “owned” by a processE.g. the pages the process can reference without incurring a page fault
A process always starts with an empty working setIt then incurs page faults when referencing a page that isn’t in its working set
Hard fault: resolved from file on disk (paging file, mapped file)Soft fault: resolved from memory
Working Set
newer pages older pages
Working Set
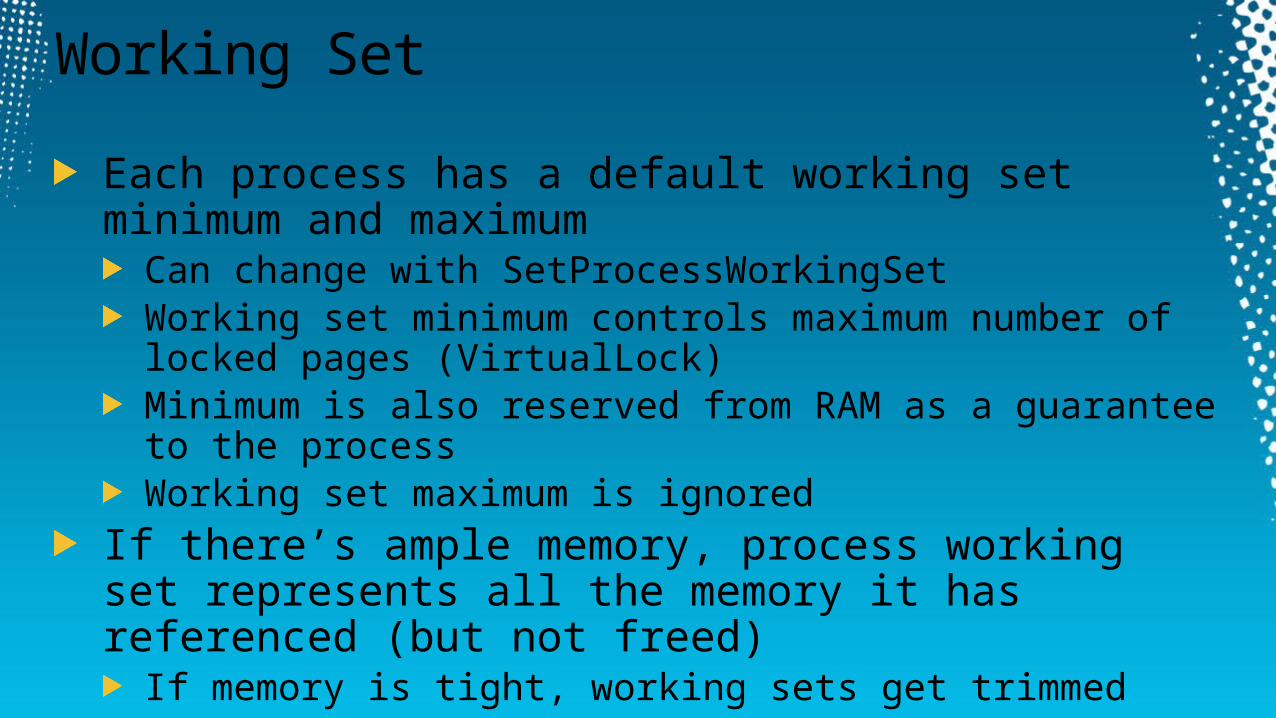
Each process has a default working set minimum and maximum
Can change with SetProcessWorkingSetWorking set minimum controls maximum number of locked pages (VirtualLock)Minimum is also reserved from RAM as a guarantee to the processWorking set maximum is ignored
If there’s ample memory, process working set represents all the memory it has referenced (but not freed)
If memory is tight, working sets get trimmed
Working Set Replacement
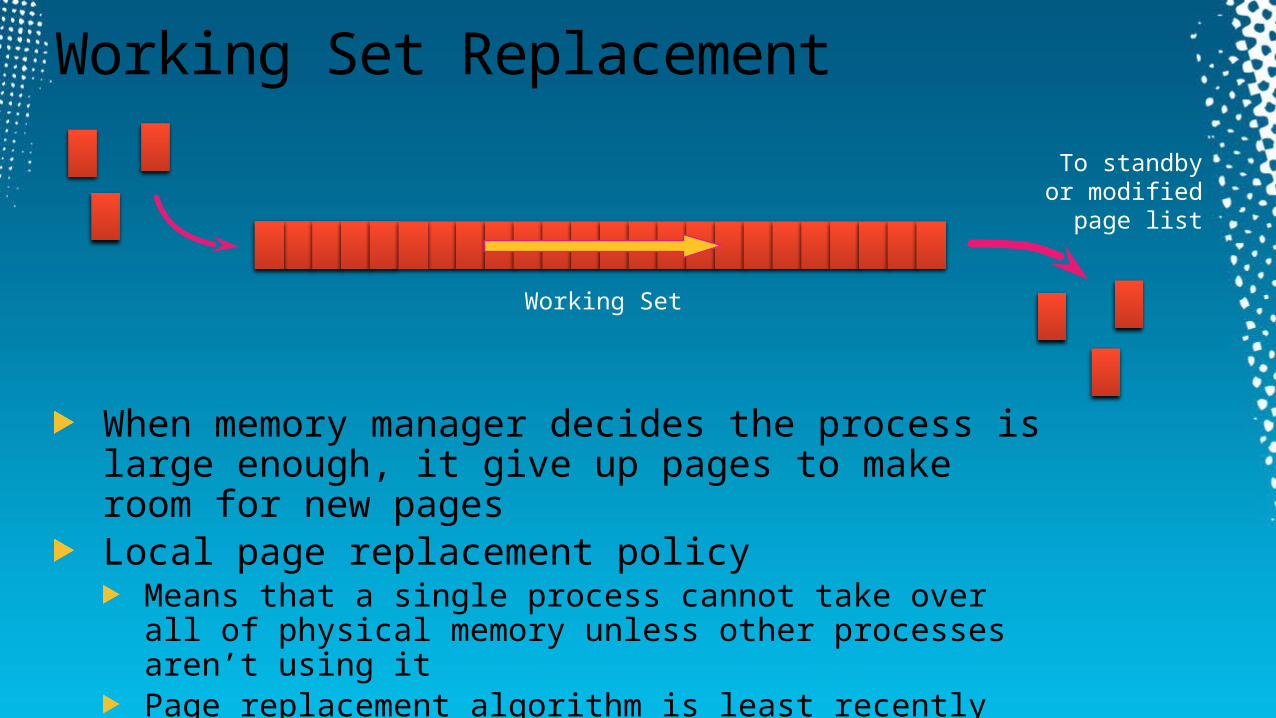
When memory manager decides the process is large enough, it give up pages to make room for new pagesLocal page replacement policy
Means that a single process cannot take over all of physical memory unless other processes aren’t using itPage replacement algorithm is least recently accessed (pages are aged when available memory is low)
Working Set
To standby or modified
page list
Working Set Breakdown
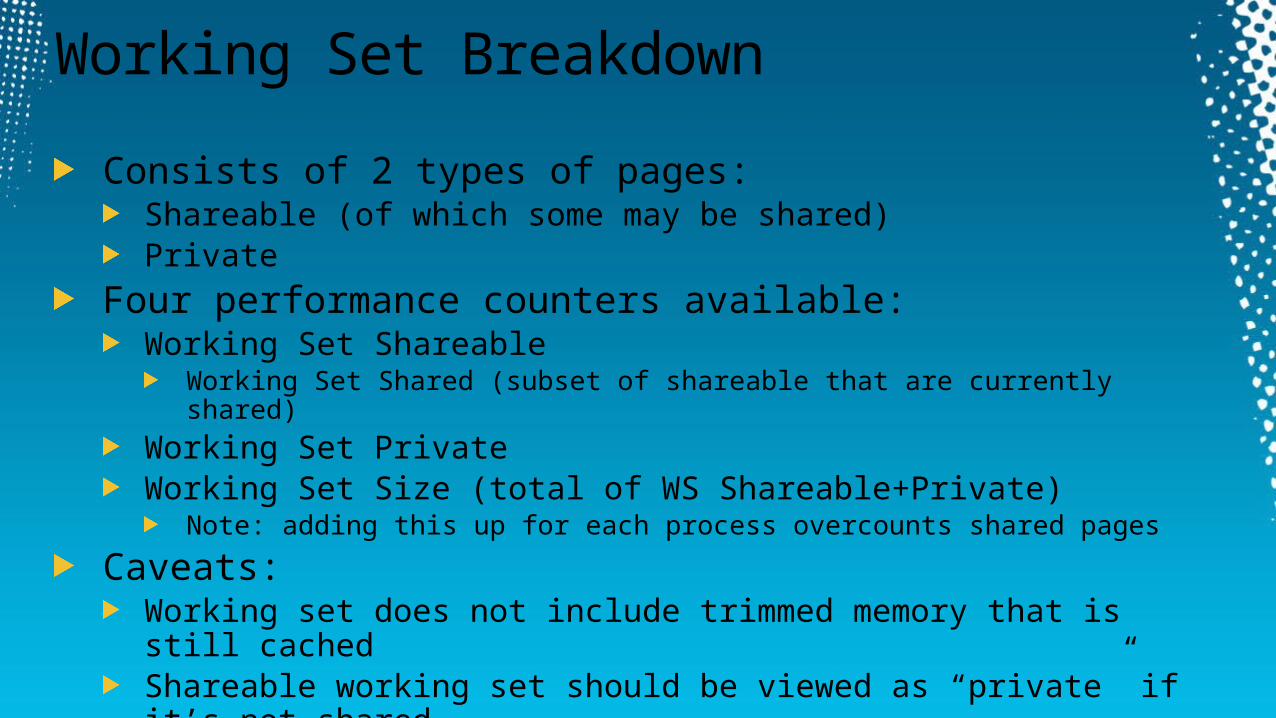
Consists of 2 types of pages:Shareable (of which some may be shared)Private
Four performance counters available:Working Set Shareable
Working Set Shared (subset of shareable that are currently shared)
Working Set PrivateWorking Set Size (total of WS Shareable+Private)
Note: adding this up for each process overcounts shared pages
Caveats:Working set does not include trimmed memory that is still cachedShareable working set should be viewed as “private” if it’s not shared
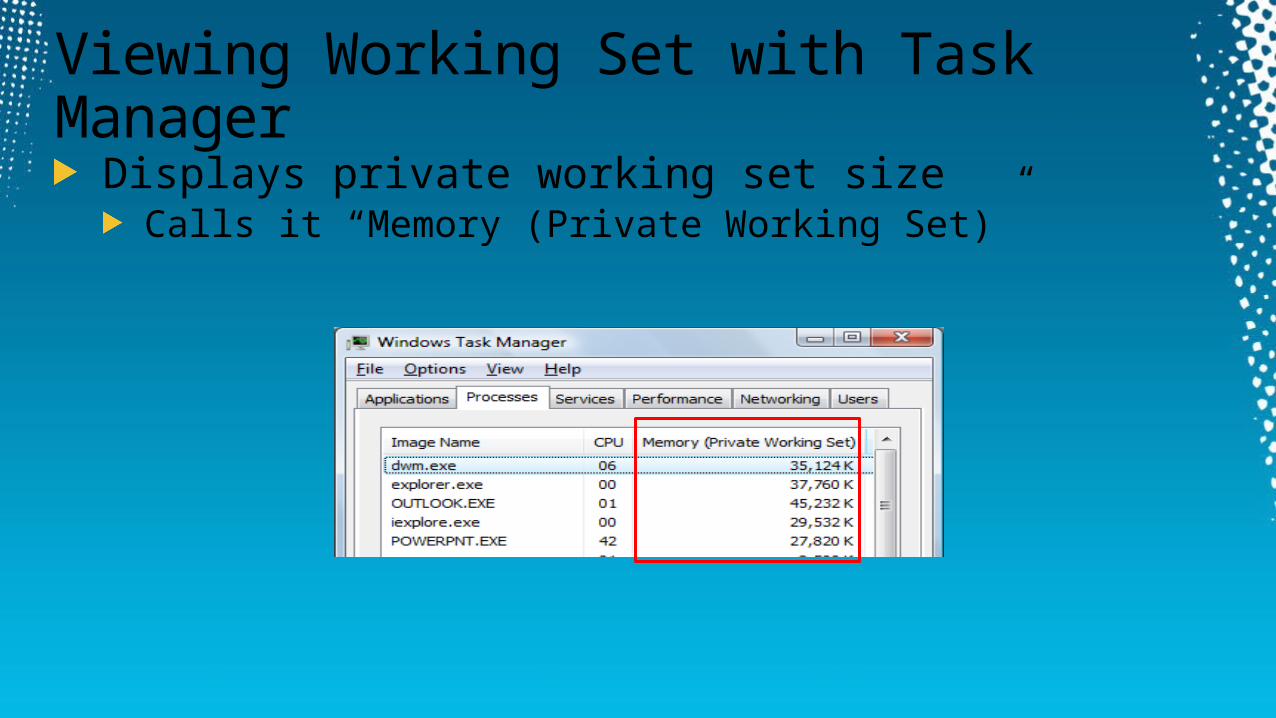
Viewing Working Set with Task Manager
Displays private working set sizeCalls it “Memory (Private Working Set)”

Viewing Working Set with Process Explorer
Process Explorer shows all the performance counters
Virtual BytesPrivate BytesWS Shareable BytesWS Shared BytesWS Private Bytes
Run Testlimit three times:Testlimit -r 1024 -c 1Testlimit -m 1024 -c 1Testlimit -d 1024 -c 1
Note how working set numbers don’t at all represent the process virtual memory usage

Viewing the Working Set with VMMap
Vmmap shows working set size of each component of address spaceAlso shows locked pagesCopy-on-write pages will show up as Private WS in shareable regions
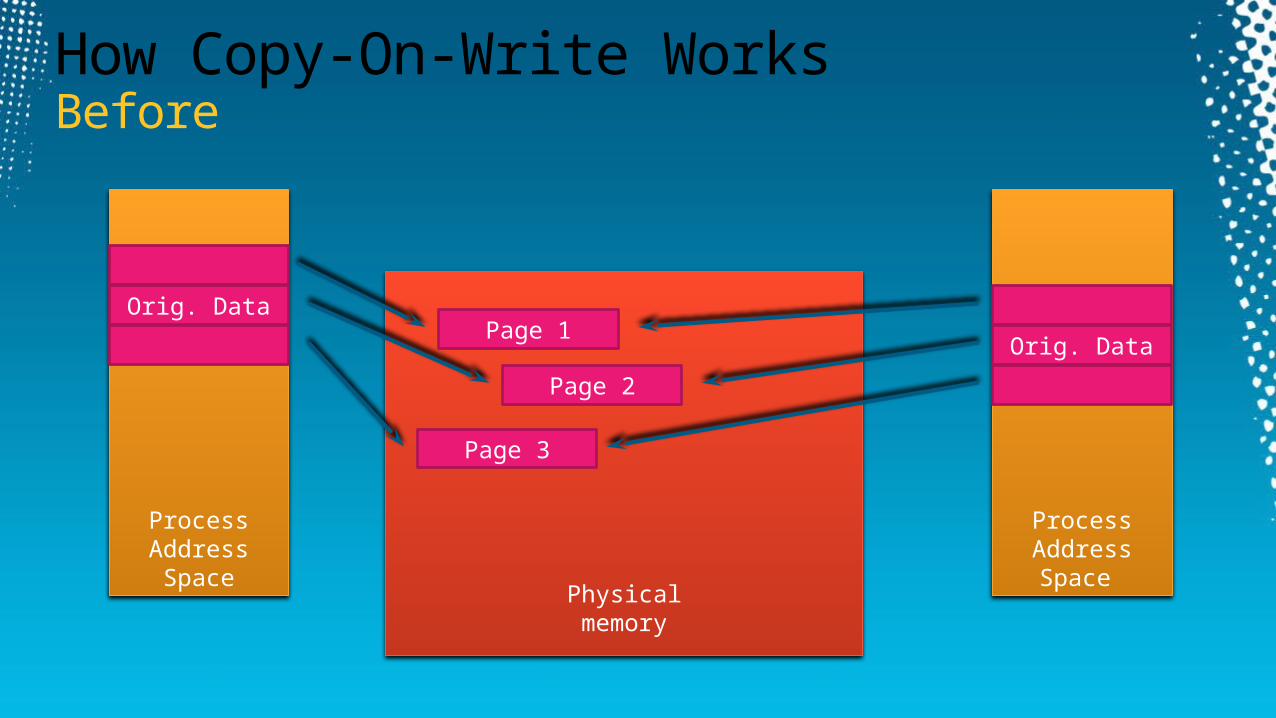
Physicalmemory
Page 3
Page 1
How Copy-On-Write WorksBefore
ProcessAddressSpace
Orig. Data
ProcessAddressSpace
Orig. Data
Page 2
ProcessAddressSpace
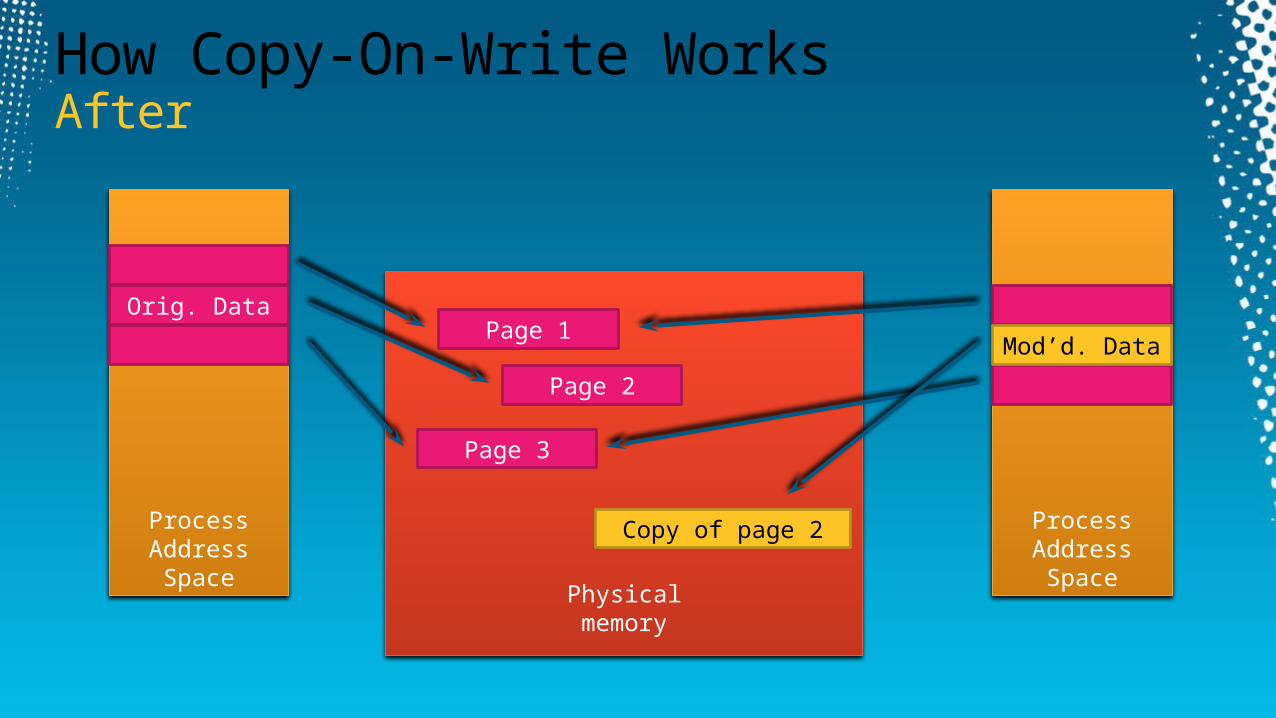
Physicalmemory
How Copy-On-Write WorksAfter
ProcessAddressSpace
Orig. Data
Page 3
Page 1
Page 2
Copy of page 2
Mod’d. Data
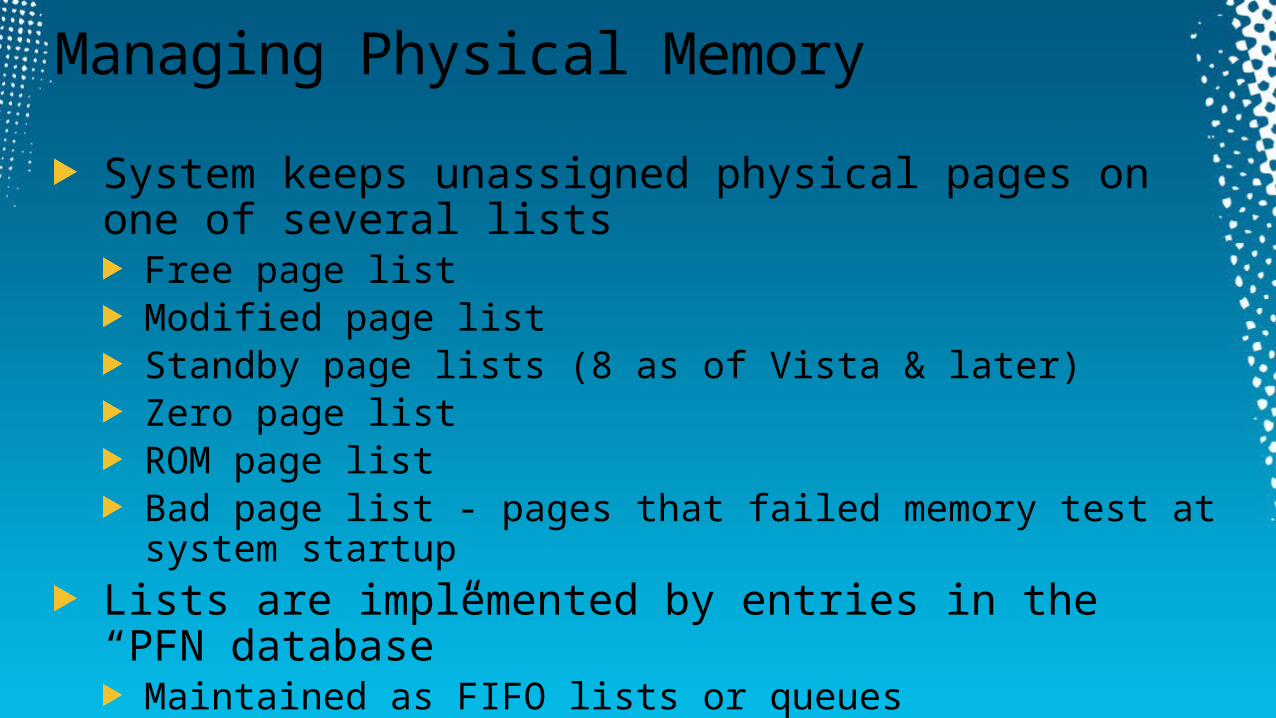
Managing Physical Memory
System keeps unassigned physical pages on one of several lists
Free page listModified page listStandby page lists (8 as of Vista & later)Zero page listROM page listBad page list - pages that failed memory test at system startup
Lists are implemented by entries in the “PFN database”Maintained as FIFO lists or queues

Paging Dynamics
New pages are allocated to working sets from the top of the free or zero page listPages released from the working set due to working set replacement go to the bottom of:
The modified page list (if they were modified while in the working set)The standby page list (if not modified)
Decision made based on “D” (dirty = modified) bit in page table entry
Association between the process and the physical page is still maintained while the page is on either of these lists
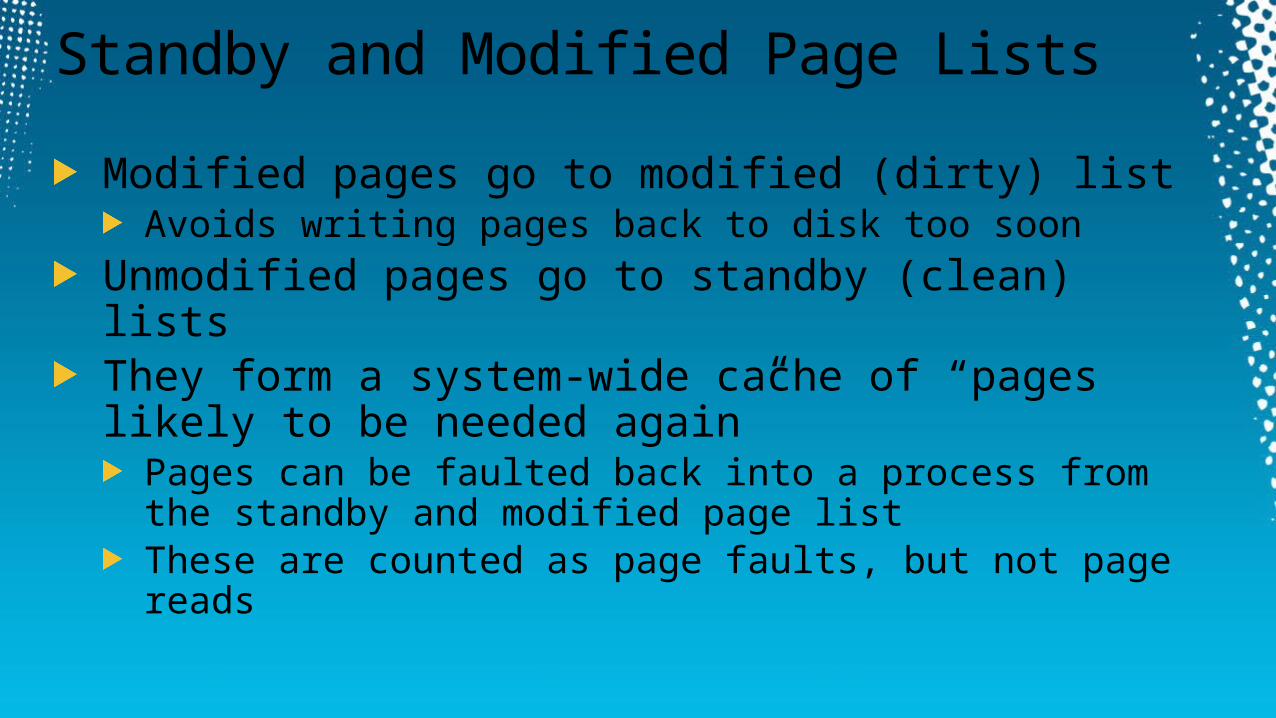
Standby and Modified Page Lists
Modified pages go to modified (dirty) listAvoids writing pages back to disk too soon
Unmodified pages go to standby (clean) listsThey form a system-wide cache of “pages likely to be needed again”
Pages can be faulted back into a process from the standby and modified page listThese are counted as page faults, but not page reads
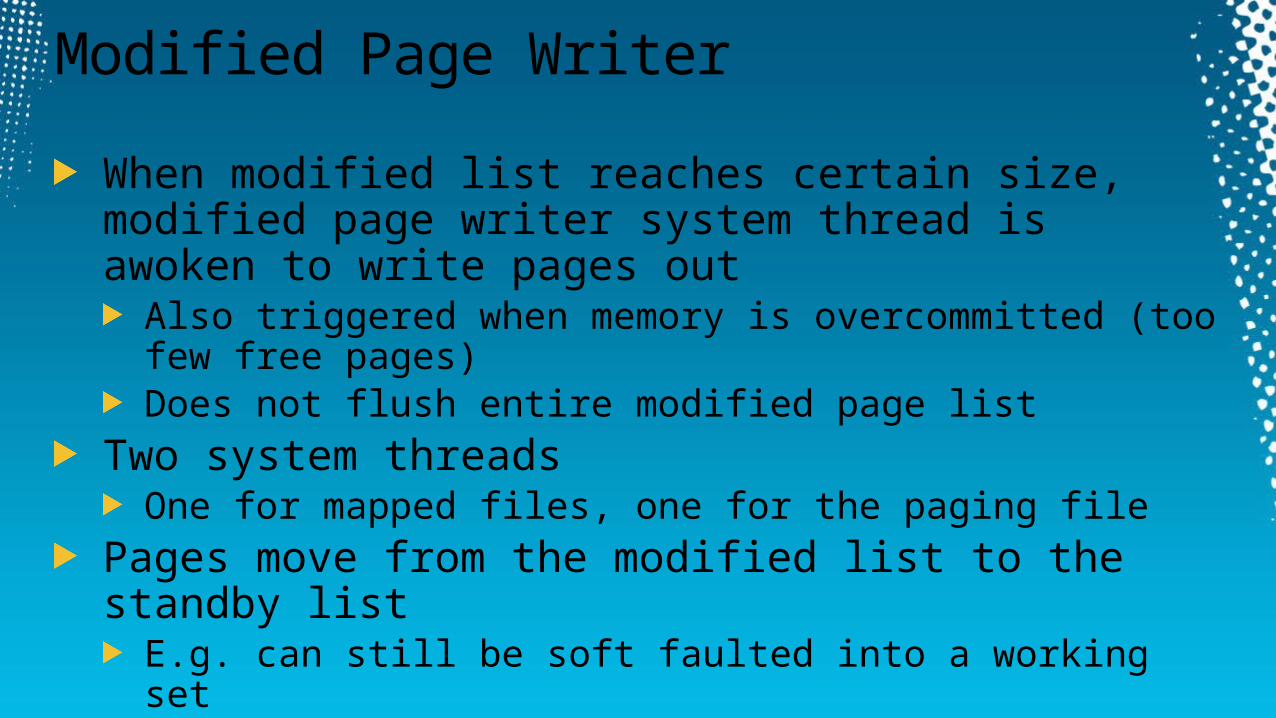
Modified Page Writer
When modified list reaches certain size, modified page writer system thread is awoken to write pages out
Also triggered when memory is overcommitted (too few free pages)Does not flush entire modified page list
Two system threadsOne for mapped files, one for the paging file
Pages move from the modified list to the standby listE.g. can still be soft faulted into a working set

Free and Zero Page Lists
Free Page ListUsed for page readsPrivate modified pages go here on process exitPages contain junk in them (e.g. not zeroed)On most busy systems, this is empty
Zero Page ListUsed to satisfy demand zero page faults
References to private pages that have not been created yet
When free page list has 8 or more pages, a priority zero thread is awoken to zero themOn most busy systems, this is empty too

Paging Dynamics
StandbyPageLists
ZeroPageList
FreePageList
WorkingSets
page read from disk or kernel allocations
(“hard” page faults)
demand zero page faults
working set replacement
ModifiedPageList
modifiedpagewriter
zeropage
thread
“soft”pagefaults
BadPageList
Private pages at process exit
“global valid” faults

Viewing the Paging Lists with Task Manager
XP/2003:Available = Standby + Zero + FreeSystem Cache = Standby + Modified + System Working Set
Vista/Server 2008:Replaced Available with Free
Free + Zero list
System Cache relabeled Cached
Windows 7/Server 2008 R2Available put back

Viewing the Paging Lists with Process Explorer
Process Explorer shows each paging listClick View->System Information

Total Process Private Memory Usage
Working Set size does not include:
Private memory on standby or modified listsPage tables
Rammap shows this on Processes tab

Viewing Memory Usage with Rammap
In addition to showing size of paging lists, shows usage breakdown:Process privateMapped fileShared memoryPage tablesPaged poolNonpaged poolSystem PTESession privateMetafileAWEDriver lockedKernel stack

Prioritized Standby Lists
In Vista & later, there are 8 prioritized standby listsPages are removed from lowest priority list first
Low memory priority process will keep re-using low priority pagesHigher priority information remains cached
0
1
2
3
4
5
6
7
Prioritized Standby Lists
Pages removed
Pages added
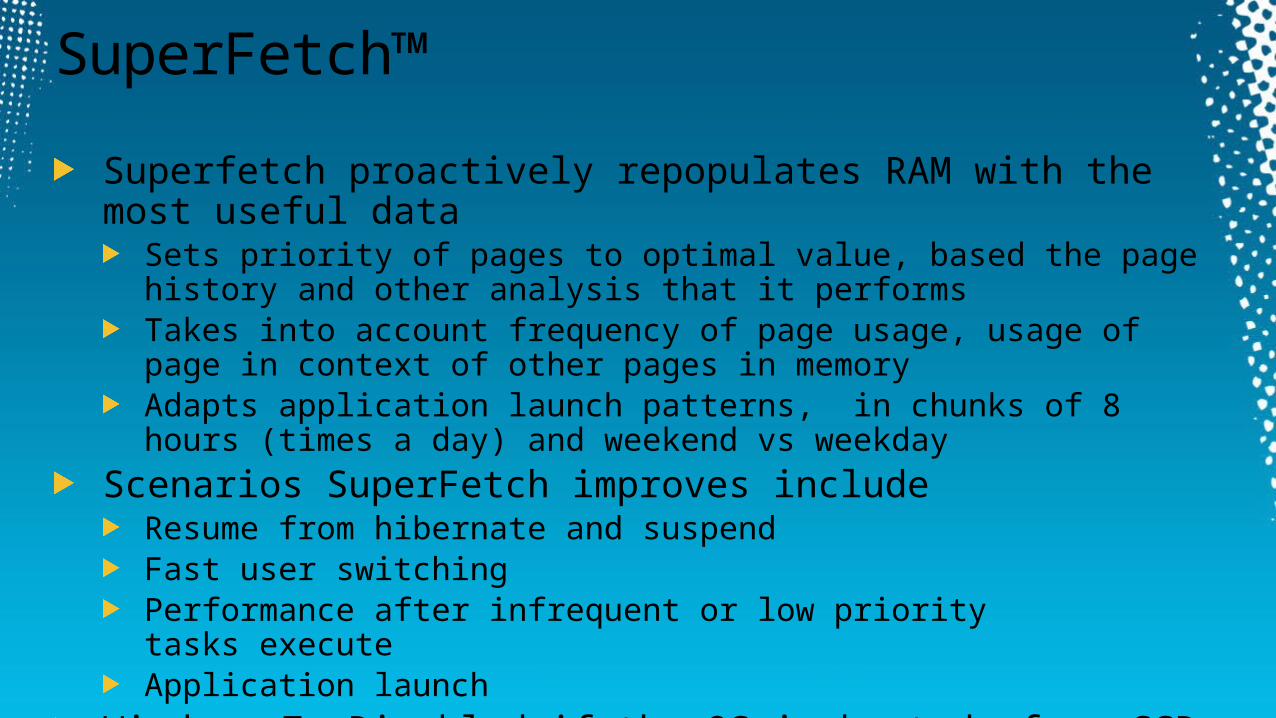
SuperFetch™
Superfetch proactively repopulates RAM with the most useful dataSets priority of pages to optimal value, based the page history and other analysis that it performsTakes into account frequency of page usage, usage of page in context of other pages in memoryAdapts application launch patterns, in chunks of 8 hours (times a day) and weekend vs weekday
Scenarios SuperFetch improves includeResume from hibernate and suspendFast user switchingPerformance after infrequent or low priority tasks executeApplication launch
Windows 7: Disabled if the OS is booted of an SSD

Memory Priority
Each thread has its own memory priority5: normal1: low
This determines which standby list is used for the page (when/if it arrives on the standby list)Thread priority comes from process memory priority
Can be changed for process or individual threadSetPriorityClass or SetThreadPriority “background mode”

Standby List Population
Priority 7 come from a static set (pre-trained at Microsoft) Pre-populated at each bootIncludes pages related to user input that requires fast responsiveness (right-click, desktop properties, control panel, start menu, etc.)
Priority 6 are pages that SuperFetch considers important, or useful (will rarely get repurposed)Priority 5 are standard user pages (memory priority 5)Priority 1 are low priority user pages (memory priority 1)Priority 0-4 may be Superfetch decayed, cache manager read-ahead and pagefault clustering
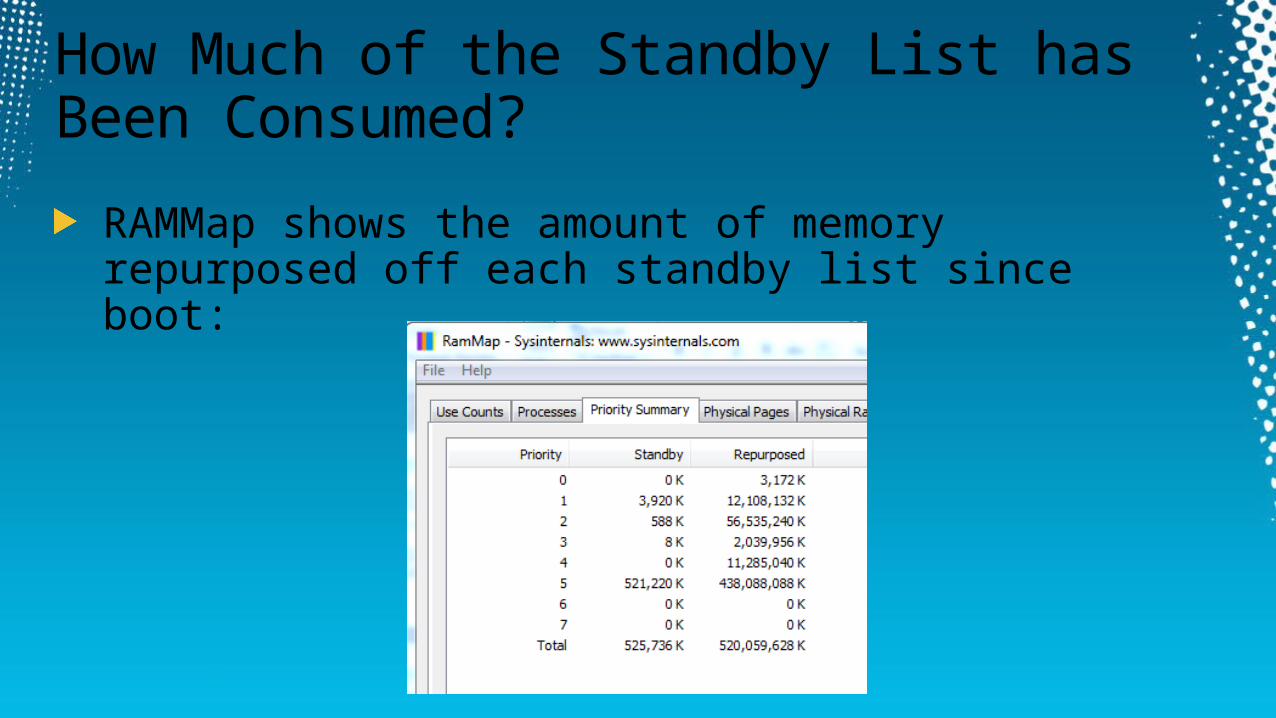
How Much of the Standby List has Been Consumed?
RAMMap shows the amount of memory repurposed off each standby list since boot:
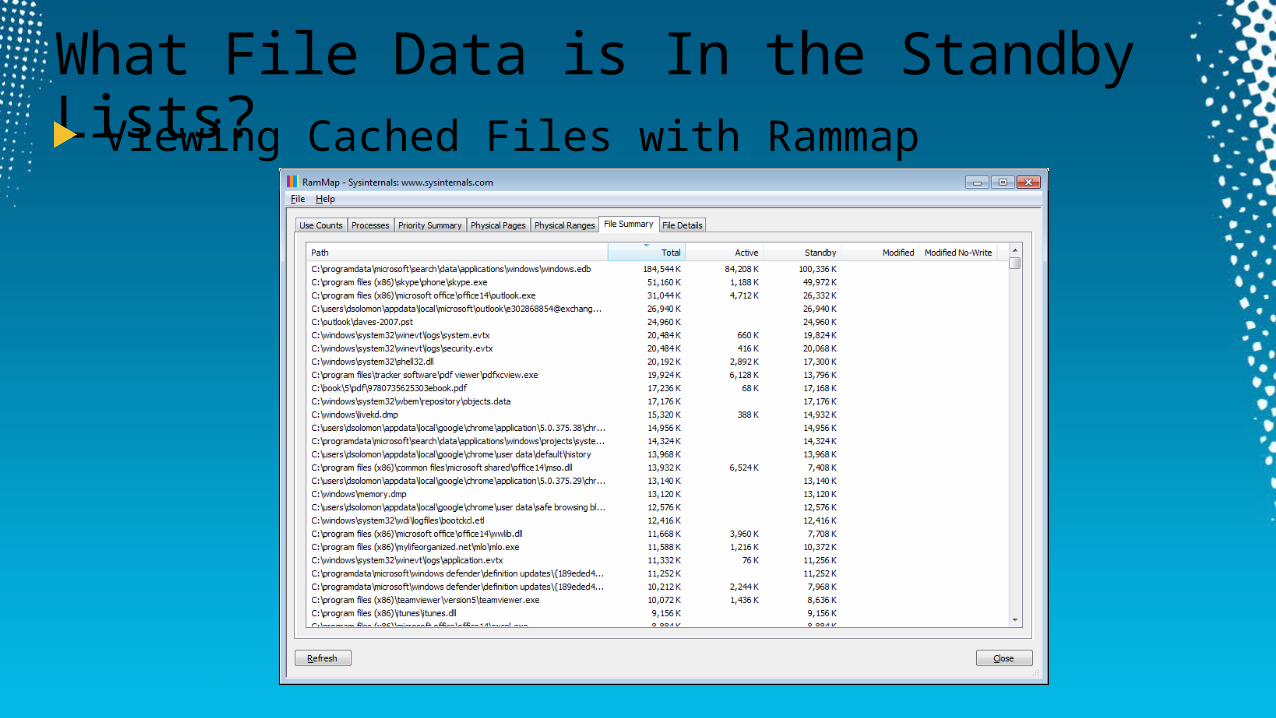
What File Data is In the Standby Lists? Viewing Cached Files with Rammap
Do You Have Enough Memory?
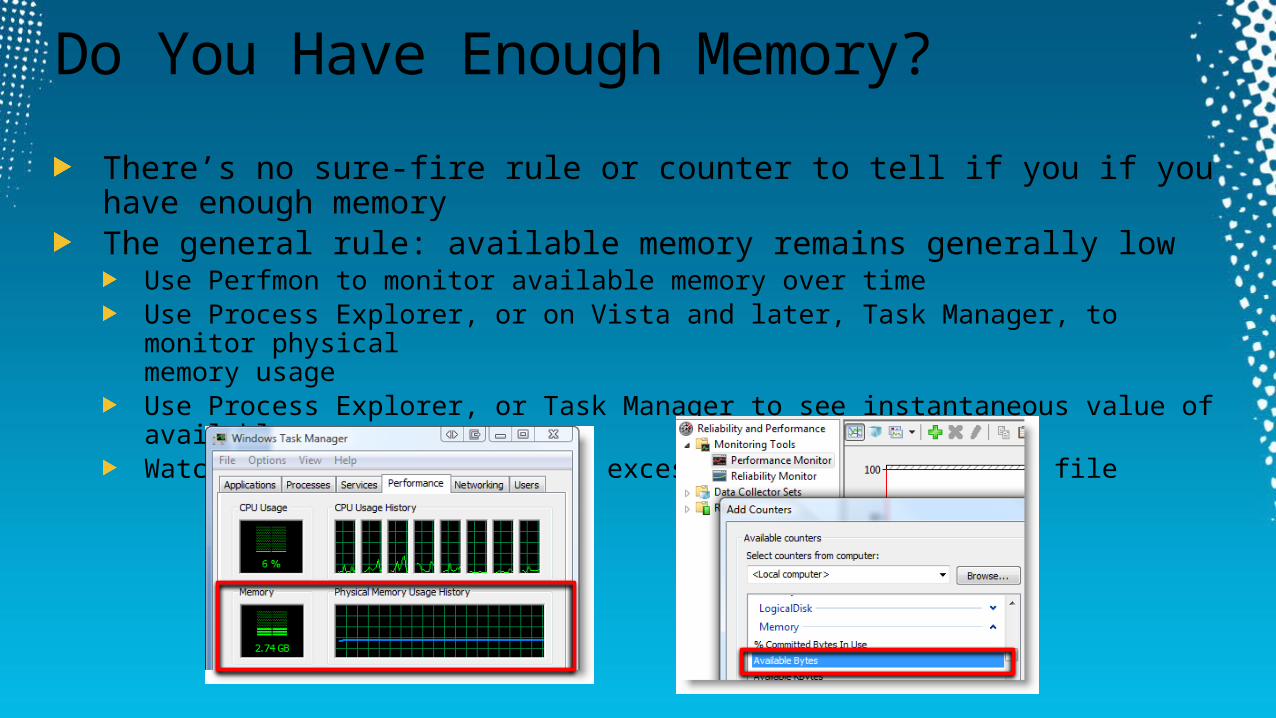
There’s no sure-fire rule or counter to tell if you if you have enough memoryThe general rule: available memory remains generally low
Use Perfmon to monitor available memory over timeUse Process Explorer, or on Vista and later, Task Manager, to monitor physical memory usageUse Process Explorer, or Task Manager to see instantaneous value of available memoryWatch in Process Monitor for excessive reads from paging file
Tracing Paging with Procmon
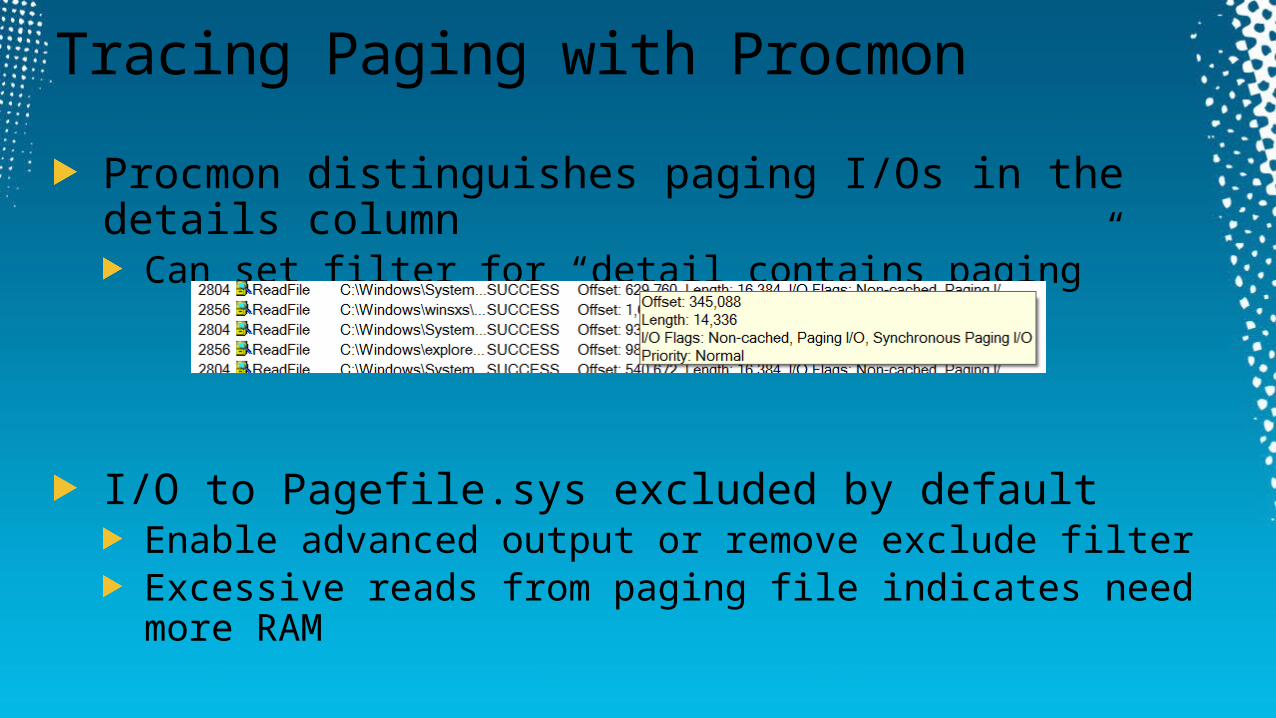
Procmon distinguishes paging I/Os in the details columnCan set filter for “detail contains paging”
I/O to Pagefile.sys excluded by defaultEnable advanced output or remove exclude filterExcessive reads from paging file indicates need more RAM

Hard to Track Memory

Hidden Cost of Reserved Memory
Memory Manager charges for page tables for reserved address space not yet committed
Charged against process private bytes (and therefore system commit limit)Cannot track this down
Experiment:Testlimit64 –r 100000 –c 10
Testlimit64 –rReserves ~8192GBPrivate bytes grows to >16GB!
Cost of Reserved Memory
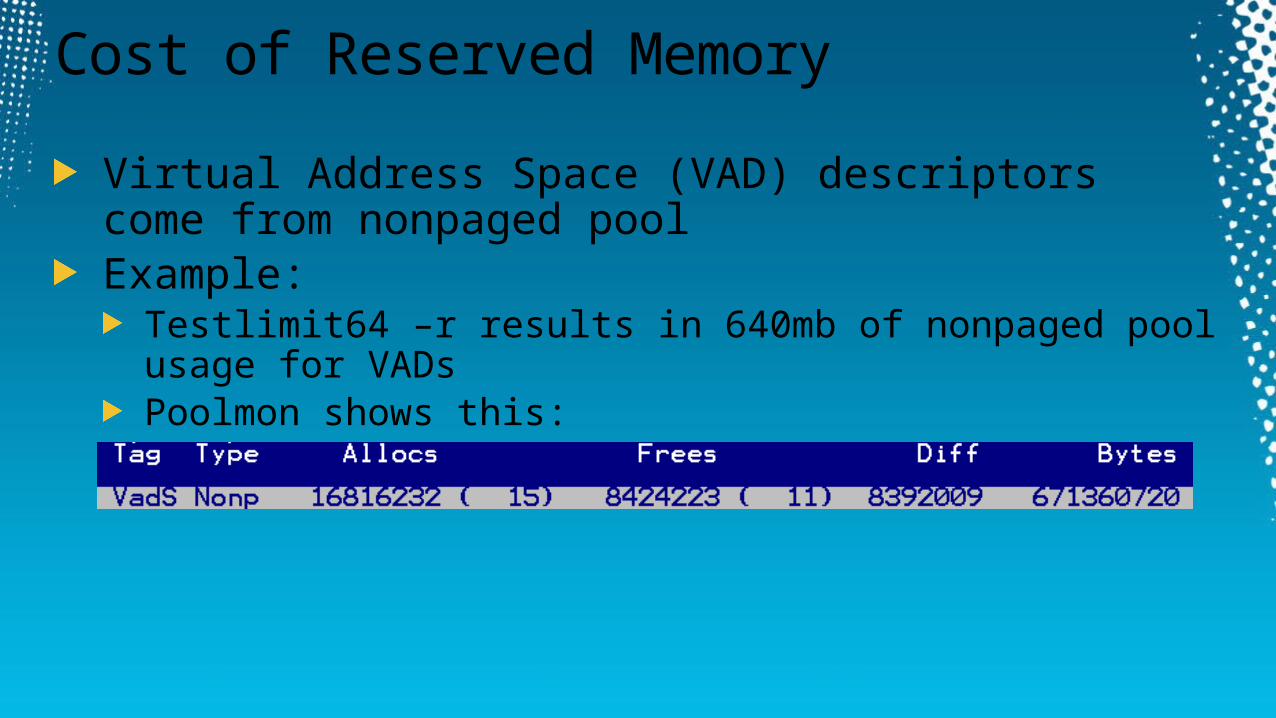
Virtual Address Space (VAD) descriptors come from nonpaged poolExample:
Testlimit64 –r results in 640mb of nonpaged pool usage for VADsPoolmon shows this:
Shared Memory
Shared memory is backed by virtual memoryEither paging file (if there is one), else physical memory
However, amount created not charged to process commit limit
Therefore, a shared memory VM leak is hard to track down

Demo: Shared Memory Leak
Testlimit –s 1000 –c 3This creates a 3 GB shared memory section
Note that process virtual and private bytes do not include this value
And only virtual bytes rise when process maps the section into its address space
VirtualLock Locked Pages
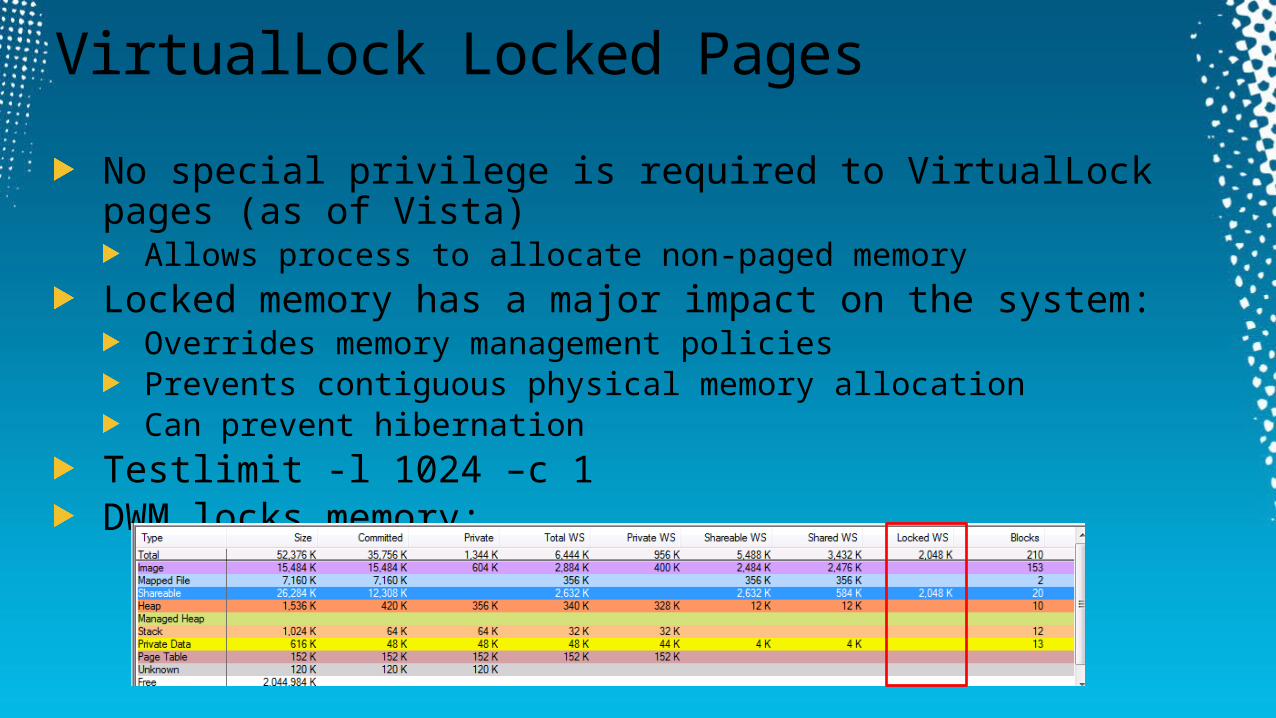
No special privilege is required to VirtualLock pages (as of Vista) Allows process to allocate non-paged memory
Locked memory has a major impact on the system:Overrides memory management policiesPrevents contiguous physical memory allocationCan prevent hibernation
Testlimit -l 1024 –c 1DWM locks memory:

Driver Locked Pages and AWE pages
VPC and Hyper-V use driver locked pagesSQL Server uses AWE memoryCounts against system commit, but not otherwise detectable
No way to track back to owner
More Information
More information in Windows Internals, 5th EditionMemory Management chapter
MSDN memory management API documentationThe best way to gain an understanding of memory manager behavior is to experiment and observeCome to my other sessions tomorrow!
Inside Windows Azure: 10:15Case of the Unexplained: 2:45
Book signing at the TechEd bookstore: 12:30-1:30

Track Resources
Don’t forget to visit the Cloud Power area within the TLC (Blue Section) to see product demos and speak with experts about the Server & Cloud Platform solutions that help drive your business forward.
You can also find the latest information about our products at the following links:
Windows Azure - http://www.microsoft.com/windowsazure/
Microsoft System Center - http://www.microsoft.com/systemcenter/
Microsoft Forefront - http://www.microsoft.com/forefront/
Windows Server - http://www.microsoft.com/windowsserver/
Cloud Power - http://www.microsoft.com/cloud/
Private Cloud - http://www.microsoft.com/privatecloud/

Resources
www.microsoft.com/teched
Sessions On-Demand & Community Microsoft Certification & Training Resources
Resources for IT Professionals Resources for Developers
www.microsoft.com/learning
http://microsoft.com/technet http://microsoft.com/msdn
Learning
http://northamerica.msteched.com
Connect. Share. Discuss.

Complete an evaluation on CommNet and enter to win!

Scan the Tag to evaluate this session now on myTech•Ed Mobile
