we create chemistry with optimization · pdf filewe create chemistry with optimization w. alex...
TRANSCRIPT

March 23-24, 2017
Doing It Right
SYMPOSIUM
We Create Chemistry with Optimization
W. Alex MarvinBASF Corporation
Advanced Business Analytics
Big Data Symposium – March 23-24, 2017

BASF – 150 years at a glance
2
1865-1901
The age of dyes
1902-1924
The Haber-Bosch-Process and the age of fertilizers
1902-1924
New high-pressure syntheses
1945-1964
From new beginnings to the plastic age
1965-1989
The road to becoming a trans-national company
1990-2015
Sustainable start to the new millennium
4th Big Data & Business Analytics Symposium – March 23-24, 2017

BASF – We create chemistry
Our chemistry is used in almost all industries
We combine economic success, social responsibility and environmental protection
Sales 2016: €57,550 million
EBIT 2016: €6,275 million
Employees (as of December 31, 2016): 113,830
6 Verbund sites and 352 other production sites
34th Big Data & Business Analytics Symposium – March 23-24, 2017

BASF worldwide: sites
4
SingaporeKuantan
Hong KongNanjing
Freeport
Florham ParkGeismar
LudwigshafenAntwerp
São PauloRegional centers
Selected sites
Verbund sites
Selected research and development sites
4th Big Data & Business Analytics Symposium – March 23-24, 2017

BASF’s segments
5
Crop Protection
PerformanceProducts
Dispersions & PigmentsCare Chemicals
Functional Materials & Solutions
AgriculturalSolutions
Nutrition & HealthPerformance Chemicals
Oil & Gas
Oil & Gas
Chemicals
Monomers
Intermediates
Petrochemicals
Functional Materials & Solutions
ConstructionChemicals
Coatings
Catalysts
Performance Materials
4th Big Data & Business Analytics Symposium – March 23-24, 2017
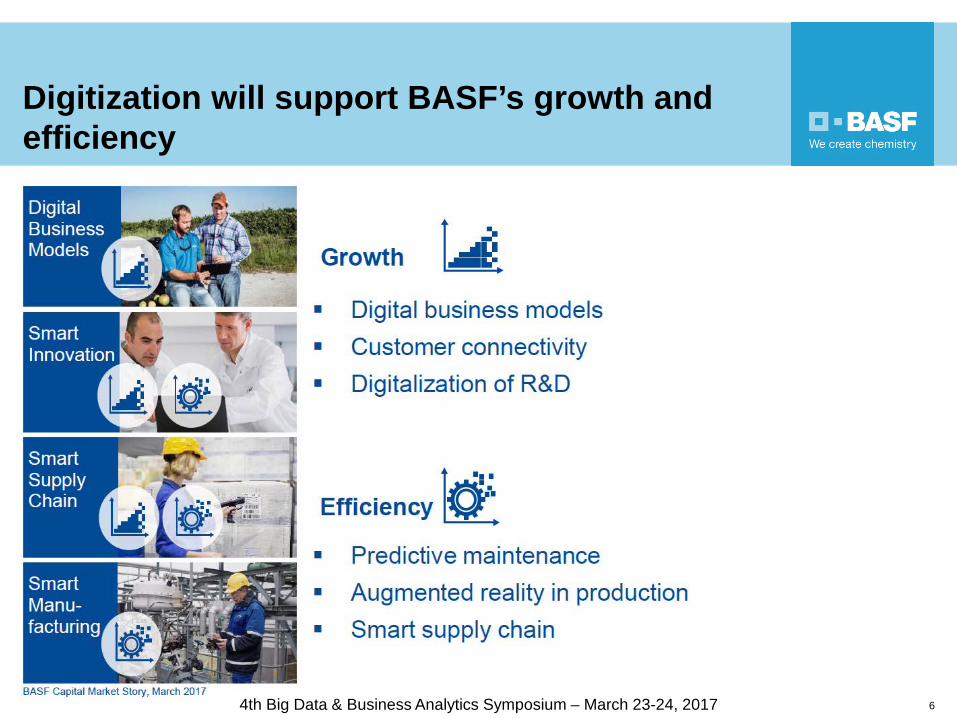
Digitization will support BASF’s growth and efficiency
64th Big Data & Business Analytics Symposium – March 23-24, 2017

Advanced Business AnalyticsTurning BIG data into SMART data
BIG Data
Volume: Scale of Data
Velocity: Streaming Data
Variety: Different Forms of Data
Veracity: Uncertainty of Data
74th Big Data & Business Analytics Symposium – March 23-24, 2017

Advanced Business AnalyticsInnovative solutions for all areas in business and operations
8
Methods &
Modeling
BASF Group
Operating Divisions
Functional and Central Divisions/Units
Tailored
Scalable
Understand Create Deliver
Analysis
Scope
Solution type
Marketing & SalesProduction
Procurement Supply Chain
Planning & Controlling Finance
…
Explorative Ideas
Business Needs
4th Big Data & Business Analytics Symposium – March 23-24, 2017

Providing insights and decision support for various fields in supply chain managementExamples
9
Inventory & Demand Planning Analytics
Safety & Target Stock Optimization incl. Advanced SNP Optimizer
Dysfunctional Inventory Analytics
Demand Planning Analysis ….
Network optimization
Optimal design of supply chain networks
Covering e.g. distribution, inventories, raw materials, taxes and duties
Scenario analysis …
Demand Forecasting
Advanced forecasting applying predictive methods on aggregated and disaggregated level
….
time
demand
Value chain optimization
Optimal value-based medium- and long-term steering of value chains
What-if scenarios, e.g. capacity increases, low price strategies
Sensitivity analysis, e.g. CM sensitivity on demand, raw material costs
…SNP: Supply Network Planning, CM: Contribution Margin
4th Big Data & Business Analytics Symposium – March 23-24, 2017

Global Business AnalyticsValue based network design and operation
10
Increase transparency and facilitate medium-/long-term decision-making for margin, volume and capacity optimizationObjective:
Production complexity - bottleneck situations - investments - volume-margin tradeoffs production sites in different regions joint ventures and tollers >10 production stages, coupled production
>100 intermediates, >50 by-products,>100 sales products
customers from different industries in all regions
Optimization-based scenario-tool for strategic planning & controllingSolution:4th Big Data & Business Analytics Symposium – March 23-24, 2017

Prerequisites
11
Database
Execution
ERP system
Make sure data is correct
Make sure KPI definitions fit
Make sure all relevant information is considered
Optimization tool
Database
ExecutionMake sure people believe in the concept
Make sure people trust the system
Make sure plans are understood
Make sure plans are executed
Reporting tool
4th Big Data & Business Analytics Symposium – March 23-24, 2017

12
Find optimal plan under complex constraints
Production
Customers InventoryTransportation & Logistics
Raw materialscontribution
marginPackaging
CapacitiesCapacity restrictions, safety stock levels, coverage
Capacities
Availability, minimal runsChangeovers
Service levelsSourcing restrictions
Availability4th Big Data & Business Analytics Symposium – March 23-24, 2017
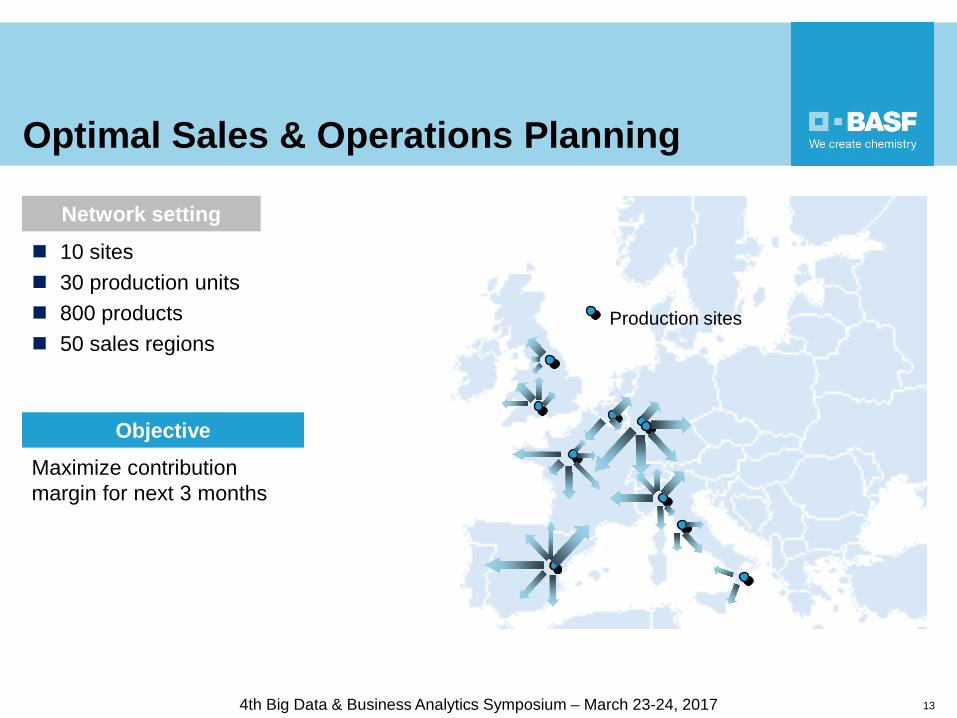
Production sites
13
Optimal Sales & Operations Planning
Network setting
10 sites 30 production units 800 products 50 sales regions
Objective
Maximize contribution margin for next 3 months
4th Big Data & Business Analytics Symposium – March 23-24, 2017
14
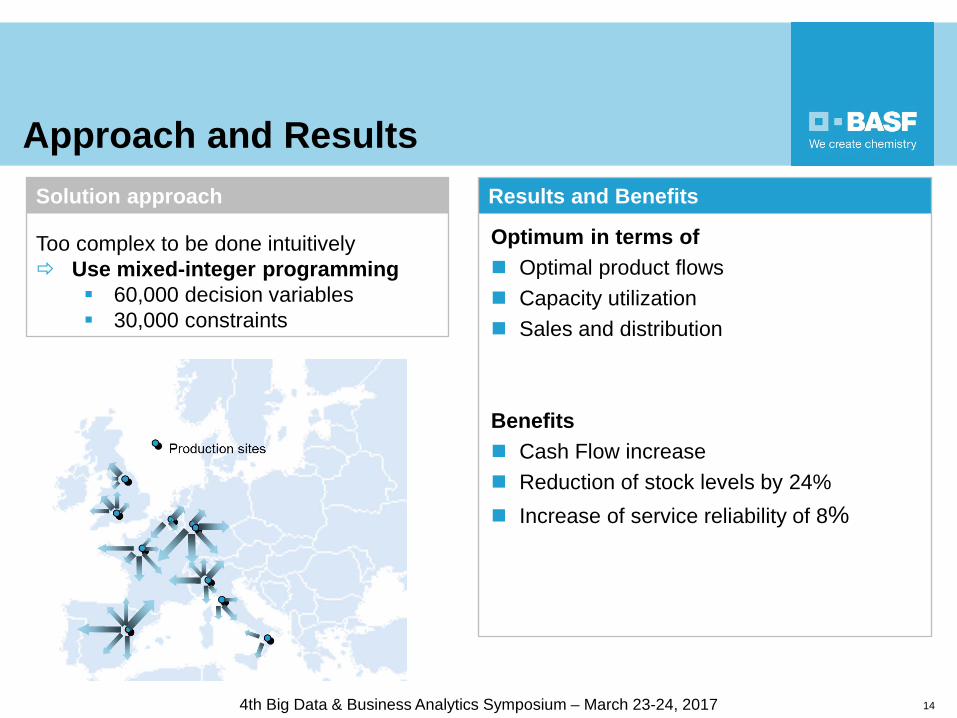
Approach and Results
Optimum in terms of Optimal product flows Capacity utilization Sales and distribution
Benefits Cash Flow increase Reduction of stock levels by 24% Increase of service reliability of 8%
Results and Benefits
Too complex to be done intuitively Use mixed-integer programming
60,000 decision variables 30,000 constraints
Solution approach
4th Big Data & Business Analytics Symposium – March 23-24, 2017
154th Big Data & Business Analytics Symposium – March 23-24, 2017

Planning in a matrix
16
Supply Chain Planning Matrix based on Fleischmann et.al., 2008
During implementation of Enterprise Resource Planning (ERP) systems, planning tasks have been defined according to software modules
S&OP is the task to ensure that planning processes are synchronized
4th Big Data & Business Analytics Symposium – March 23-24, 2017

From Unlinked data models
Reactive
Limited view
To Integrated data model
Proactive
Constraints visible
S&OP requires change in many areas
Process/Data
Technology/Tools From Mostly Manual
Multiple data sources
Cumbersome what-if analysis
Limited data visibility
To Automated
Single database
Quick simulations
Broad data visibility
People/OrganizationFrom Functional view
Independent
Metrics-functional
Many fragmented decisions
Unit focused
To Cross functional view
Ongoing communication
Metrics-process cycle time
Executive decisions
Margin focused
Senior Management commitment is essential
174th Big Data & Business Analytics Symposium – March 23-24, 2017

Specialties of planning problems in the process industry
Process challenge
Inverted Bills
Multiple Recipes
Multi-Level Planning
ImplicationProducing products to fulfill demand generates other products that must be sold or further processed. By-products, co-products and waste must be taken into account and matched to existing demand or used to meet other demands. Waste products consume capacity for recycling or disposal.
Products can be made in multiple ways, and often with different ingredients depending on what is available and what current costs are. That leads to multiple trade-off scenarios to produce a single item.
Production of bulk material must be planned concurrently with packaging operations. Demand for products often comes in different packaging configurations. When fixed or economical batch sizes are produced, this amount of bulk material typically does not match exactly packed demand, so inventory must be stored in tanks, packed off in product or intermediate containers, or disposed of.
4th Big Data & Business Analytics Symposium – March 23-24, 2017 18

Process challenge
Changeover / Sequencing
Tanks / Silos
Implication
Process plant productivity is very sensitive to product transitions, and properly sequencing these transitions are extremely important to improving yields and reducing changeovers. Cleanups must be taken into account, and product wheels and changeover matrices provide critical planning criteria when planning product mix and sequencing. Some process plants cannot be shut down between products and produce transition products during changeover. These transition products must be handled as push products.
Inventory and work-in-process material is often stored in tanks or silos. Planning for production in tanks and silos must not only address the time required for the operation, but also the volume of the material. The inflow from one operation and the outflow from the next dictate when the tank is available, and upstream and downstream operations have to be scheduled synchronously to ensure that the tank does not overflow.
Specialties of planning problems in the process industry
4th Big Data & Business Analytics Symposium – March 23-24, 2017 19

Process challenge
Variability
Push-Pull
Implication
Material used and produced often have variable qualities based on their chemistry and structure. Organic products, in particular, are often difficult to procure and produce in consistent composition, and planning must take into account this unpredictability on both a proactive and reactive basis.
When bulk materials are produced, they must be packaged, further processed, sold, or disposed of. Push-pull scenarios can come from an integrated plant that continuously provides feedstock that must be processed, inverted bills leading to by-products, co-products or waste, unexpected products or material grades that come from difficult to control processes, transition products, or other sources.
Specialties of planning problems in the process industry
4th Big Data & Business Analytics Symposium – March 23-24, 2017 20