we grew value to expand capabilities across the value
TRANSCRIPT


Growing value to expand capabilities
We grew value to expand capabilities across the value chain driven through our highly motivated workforce, flexible pricing strategy and optimal distribution in our business areas.
We delivered premium value by improving our product quality, route-to-market efficiency and enhanced customer engagement.
2N a s c o n A l l i e d I n d u s t r i e s P L C A n n u a l R e p o r t 2 0 1 7
01 01Introduction
Corporate Governance
Financials
Supplementary Information
Operations
05
04
02
03
CONTENT
Our Vision, Mission and Core Values 4
2017 At a Glance 6
Chairperson’s Statement 8
Corporate Governance Report 40
Board & Committee Structure 45
Board of Directors 48
Report of the Directors 50
Company Overview 12
Managing Director’s Review 14
Chief Financial Officer’s Review 16
Management Team 22
Human Resources 26
Risk Management 28
Health, Safety and Environment 34
Statutory Audit Committee Report 56
Statements of Management’s Responsibilities 58
Independent Auditor’s Report 59
Statement of Profit or Loss and Other
Comprehensive Income 62
Statement of Financial Position 63
Statement of Changes in Equity 64
Statement of Cash Flows 65
Accounting Policies 66
Notes to the Financial Statements 78
Other National Disclosures
Value Added Statement 105
Five Year Financial Summary 106
Claimed/Unclaimed Dividend Details 108
Share Capital History 109
Notice of Annual General Meeting 110
Directors and Professional Advisers 111
Corporate Information 112
Board and Committee Meeting Dates and
Attendance 113
Mandate for e-dividend Payments 114
Proxy Form 115
3N a s c o n A l l i e d I n d u s t r i e s P L C A n n u a l R e p o r t 2 0 1 7
Intr
od
ucti
on
Op
era
tio
ns
Co
rpo
rate
Go
ve
rnan
ce
Fin
an
cia
lsS
up
ple
me
nta
ry
Info
rmati
on

NASCON Allied Industries Plc is a member of the Dangote Group of companies
Customer ServiceAs a world-class organisation, we understand that we exist to serve and satisfy our
customers. Accordingly, our customer orientation reflects intimacy, integrity and learning.
EntrepreneurshipWe continuously seek and develop new businesses, and employ innovative ideas
to retain our market leadership.
ExcellenceWe are a large organisation, working together to deliver the best products and services to our valuable customers and stakeholders. To achieve this, we demonstrate teamwork,
respect and meritocracy.
LeadershipWe thrive on being leaders in our business, markets and communities. To drive this,
we focus on continuous improvement, partnership and professionalism.
Our vision is to be a world class consumer goods company that is recognized for the quality of our products and services, delivering high returns to our stakeholders.
Vision
Mission
Core Values
• To deliver consistently good results to our shareholders by selling high quality products at affordable prices, backed by excellent customer service.
• To satisfy market demand by producing the best quality products with the best resources and processes that comply with international industry standards and industry
best practices.
• To provide economic benefit to local communities in which we operate.
• To set a good example in areas of corporate governance, sustainability, health and safety.
Our Vision, Mission and Core Values
4N a s c o n A l l i e d I n d u s t r i e s P L C A n n u a l R e p o r t 2 0 1 7

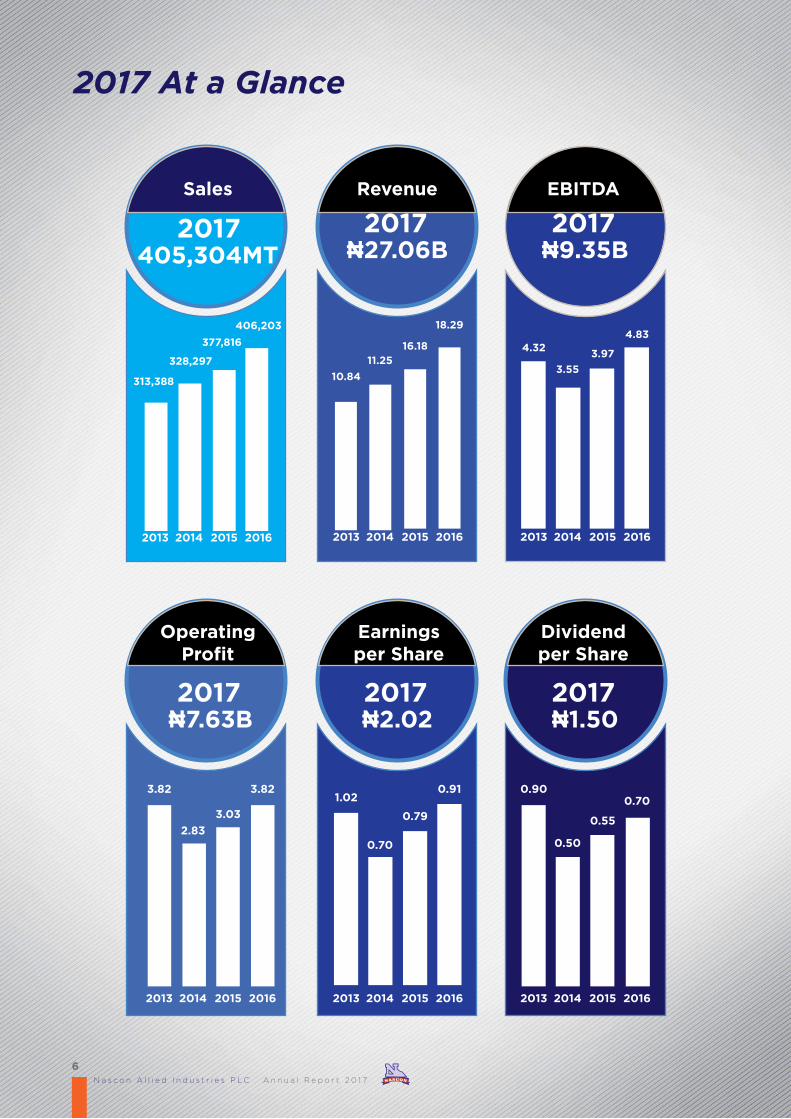
2017 At a Glance
2017
2017
2017
2017
2017
2017
405,304MT
₦7.63B
₦27.06B
₦2.02
₦9.35B
₦1.50
2014
328,297
2015
377,816
2016
406,203
2013
313,388
2014
2.83
2015
3.03
2016
3.82
2013
3.82
2014
11.25
2015
16.18
2016
18.29
2013
10.84
2014
0.70
2015
0.79
2016
0.91
2013
1.02
2014
3.55
2015
3.97
2016
4.83
2013
4.32
2014
0.50
2015
0.55
2016
0.70
2013
0.90
Sales
Operating Profit
Revenue
Earnings per Share
EBITDA
Dividend per Share
6N a s c o n A l l i e d I n d u s t r i e s P L C A n n u a l R e p o r t 2 0 1 7

7N a s c o n A l l i e d I n d u s t r i e s P L C A n n u a l R e p o r t 2 0 1 7

Chairperson’s Statement
We were able to satisfy the demands of our existing customers, increase
our market share, and strengthen our market leadership position
“
8N a s c o n A l l i e d I n d u s t r i e s P L C A n n u a l R e p o r t 2 0 1 7
”
Chairperson’s Statement
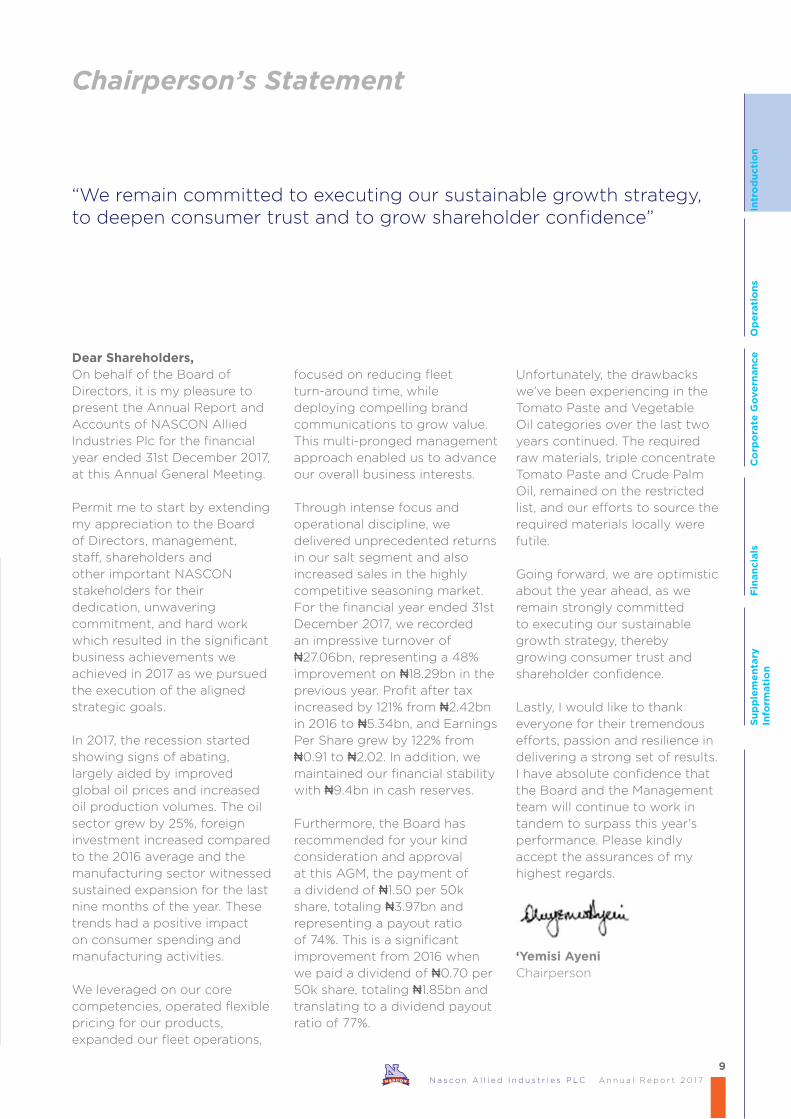
On behalf of the Board of Directors, it is my pleasure to present the Annual Report and Accounts of NASCON Allied Industries Plc for the financial year ended 31st December 2017, at this Annual General Meeting.
Permit me to start by extending my appreciation to the Board of Directors, management, staff, shareholders and other important NASCON stakeholders for their dedication, unwavering commitment, and hard work which resulted in the significant business achievements we achieved in 2017 as we pursued the execution of the aligned strategic goals.
In 2017, the recession started showing signs of abating, largely aided by improved global oil prices and increased oil production volumes. The oil sector grew by 25%, foreign investment increased compared to the 2016 average and the manufacturing sector witnessed sustained expansion for the last nine months of the year. These trends had a positive impact on consumer spending and manufacturing activities.
We leveraged on our core competencies, operated flexible pricing for our products, expanded our fleet operations,
focused on reducing fleet turn-around time, while deploying compelling brand communications to grow value. This multi-pronged management approach enabled us to advance our overall business interests.
Through intense focus and operational discipline, we delivered unprecedented returns in our salt segment and also increased sales in the highly competitive seasoning market. For the financial year ended 31st December 2017, we recorded an impressive turnover of ₦27.06bn, representing a 48% improvement on ₦18.29bn in the previous year. Profit after tax increased by 121% from ₦2.42bn in 2016 to ₦5.34bn, and Earnings Per Share grew by 122% from ₦0.91 to ₦2.02. In addition, we maintained our financial stability with ₦9.4bn in cash reserves.
Furthermore, the Board has recommended for your kind consideration and approval at this AGM, the payment of a dividend of ₦1.50 per 50k share, totaling ₦3.97bn and representing a payout ratio of 74%. This is a significant improvement from 2016 when we paid a dividend of ₦0.70 per 50k share, totaling ₦1.85bn and translating to a dividend payout ratio of 77%.
Unfortunately, the drawbacks we’ve been experiencing in the Tomato Paste and Vegetable Oil categories over the last two years continued. The required raw materials, triple concentrate Tomato Paste and Crude Palm Oil, remained on the restricted list, and our efforts to source the required materials locally were futile.
Going forward, we are optimistic about the year ahead, as we remain strongly committed to executing our sustainable growth strategy, thereby growing consumer trust and shareholder confidence.
Lastly, I would like to thank everyone for their tremendous efforts, passion and resilience in delivering a strong set of results. I have absolute confidence that the Board and the Management team will continue to work in tandem to surpass this year’s performance. Please kindly accept the assurances of my highest regards.
‘Yemisi AyeniChairperson
Dear Shareholders,
“We remain committed to executing our sustainable growth strategy, to deepen consumer trust and to grow shareholder confidence”
9N a s c o n A l l i e d I n d u s t r i e s P L C A n n u a l R e p o r t 2 0 1 7
Intr
od
ucti
on
Op
era
tio
ns
Co
rpo
rate
Go
ve
rnan
ce
Fin
an
cia
lsS
up
ple
me
nta
ry
Info
rmati
on


Operations
Su
pp
lem
en
tary
In
form
ati
on
11N a s c o n A l l i e d I n d u s t r i e s P L C A n n u a l R e p o r t 2 0 1 7

Company Overview
NASCON Allied Industries Plc is Nigeria’s leading refiner and distributor of household, food processing and industrial salt with installed production capacity of 567,000 metric tonnes per annum. We have recently expanded our product lines to include Tomato Paste, Vegetable Oil and Seasoning in a bid to transform to a FMCG company, ensuring that our products become staples in the homes of millions of Nigerians.
We employ over 500 people in our factories, warehouses, fleet and offices throughout Nigeria with our headquarters in Oregun, Lagos. We strictly adhere to rigorous industry and regulatory standards that ensure quality products for Nigeria’s ever-increasing consumer and developing industrial markets. Our products have Standards Organization of Nigeria (SON), International Organization for Standardization (ISO) and the National Agency for Food and Drugs Administration and Control (NAFDAC) certifications.
We have three regional sales offices that manage the warehouses and other distribution centers strategically located to serve the Nigerian and neighbouring markets. We own a fleet of over 200 trucks dedicated to the distribution of our products across Nigeria.
Our HistoryNational Salt Company of Nigeria was established as a salt refinery at Ijoko, Ogun State in 1973, as a joint venture between the Federal Military Government of Nigeria and Atlantic Salt & Chemical Inc. of Los Angeles, California, USA, due to an identified need for self-sufficiency in the production of salt, an essential commodity. Construction work commenced on October 20, 1974 with the refinery completed in December 1975 and erection of plants and machinery in August 1976. The
plant was commissioned with an initial installed capacity of 110,000 metric tonnes.
The Company was privatised in 1991 with its shares listed on the Nigerian Stock Exchange in October 1992, through which Dangote Industries Limited purchased majority shares in National Salt Company of Nigeria. Following the reverse takeover of NASCON by Dangote Salt Limited (DSL) in 2007, NASCON acquired the assets, liabilities and business undertakings of DSL. Total production capacity increased to 567,000 metric tons per annum, with the inclusion of three refineries.
Our PlantsThe Apapa refinery, located in the Apapa Port of Lagos, was commissioned in 2001 manufacturing 275,000 metric tonnes per annum. The Port Harcourt refinery located in the sea port in Rivers State was commissioned in 2003 with an installed capacity of 210,000 metric tonnes per annum. The Oregun plant was commissioned in 2004 with an installed capacity to refine 82,000 metric tonnes of salt per annum. Our plants are primarily powered through the National Grid with Caterpillar generators fueled by gas or diesel, with combined capacity to generate 6.1MW of power.
We made a strategic decision in 2011 to grow the company through new product lines and changed our name to NASCON Allied Industries in 2014 from National Salt Company of Nigeria to reflect our new positioning. We took advantage of our existing site in Ota and construction activities commenced in 2012. We commissioned the Seasoning plant in 2014 with an installed capacity of 3,744 metric tonnes per annum. The Tomato Paste packaging plant, which is
designed to produce and package Tomato Paste from tomato concentrate was commissioned in 2015 with an installed capacity of 37,440 metric tonnes. The Vegetable Oil refinery was commissioned in 2015 and can produce 156,000 metric tonnes of refined vegetable oil from crude palm oil.
Our ProductsDangote SaltNASCON offers a comprehensive Salt product portfolio that are sold mostly in 50kg bags under the well-known “Dangote” brand. For us salt is more than just the mineral that enhances the flavour in food. As an essential element in our diet, we fortify it with iodine under UNICEF guidelines and Nigerian regulations to combat iodine deficiency disorders.
Dan-Q SeasoningOur Seasoning is presently available in chicken and beef flavour variants with plans to expand our flavour offerings in line with consumer needs and the demand for flavour variation
Dangote Tomato Paste This is a thick paste made from triple concentrate. We entered into this product category in response to an identified supply gap within the Nigerian market where local production plus imports have been unable to effectively meet local demand.
Dangote Vegetable OilIn response to the obvious supply gap in the market and the perennial shortage of vegetable oil, resulting in the influx of low quality grey imports into Nigeria, we commenced the production and sale of vegetable oil as a high grade refined product for domestic and industrial use in of 2015.
12N a s c o n A l l i e d I n d u s t r i e s P L C A n n u a l R e p o r t 2 0 1 7

567,000MT
3,744MT
156,000MT
37,440MT
Apapa 275,000MTP/Harcourt 210,000MT
Oregun 82,000MT
Ota
Ota
Ota
Installed Capacity
Su
pp
lem
en
tary
In
form
ati
on
Intr
od
ucti
on
Op
era
tio
ns
Co
rpo
rate
Go
ve
rnan
ce
Fin
an
cia
ls
13N a s c o n A l l i e d I n d u s t r i e s P L C A n n u a l R e p o r t 2 0 1 7

“We executed strategic initiatives which had a positive impact on
profitability and business sustainability”
Managing Director’s Review
14N a s c o n A l l i e d I n d u s t r i e s P L C A n n u a l R e p o r t 2 0 1 7
Significant increase in Shareholder Value and Company Profitability
The economy started showing signs of recovery from the 2016 recession by the second quarter of 2017. This recovery was made possible by higher global oil prices, improved production levels in the oil sector, increased foreign exchange reserves, and relatively stable inflation. We are confident that our brand offerings are structured to capitalize on growth opportunities as the economy improves.
NASCON’s strong results are exemplified with another consecutive year of improved turnover, profits and shareholder returns. Our volume for the year ended 31st December 2017 was 405,304MT with an increase in Revenue of 48%, PBT by 125% and grew our EPS by 122%.
In 2017 we executed strategic
initiatives which had a positive impact on profitability & business sustainability.
People are the key to our success, and we have been working hard to activate the enormous potential that comes from a workforce empowered to give their best. In 2017 over 300 employees were trained, equipping them with skills to develop their abilities and to improve their productivity. Employee welfare ranks high on our priorities, and we have put in place a system which monitors and rewards excellence, hard work and dedication.
Health and safety standards were at the center of our welfare strategy in 2017. We implemented 15 safety golden rules as a guiding star in our day to day operational activities. The core aim was to create an organizational framework to optimize safety standards. Over 5,000 health and safety activities were
conducted in line with internal and international best practices. We implemented a number of quality control initiatives to enhance our product quality in both our salt and seasoning businesses.
The team pursued aggressive and sustained marketing of our refined salt and seasoning brands, gaining significant increase in our in-home penetration, and ensuring availability of our refined salt on table tops in markets across the country. Trade promotions and incentives on achievement of set targets were part of our tactical initiatives to our distributors, this was supported with television and radio commercials that resonated with our consumers to increase top of mind awareness.
We implemented a new customer service strategy to enhance our customer relationship management. We strengthened the customer service team and improved

“We will remain strongly focused on growth, and would be leveraging on a range of opportunities within the business to build scale”
Managing Director’s Review
Su
pp
lem
en
tary
In
form
ati
on
Intr
od
ucti
on
Op
era
tio
ns
Co
rpo
rate
Go
ve
rnan
ce
Fin
an
cia
ls
15N a s c o n A l l i e d I n d u s t r i e s P L C A n n u a l R e p o r t 2 0 1 7
customer interactions.
At NASCON we maintain a value chain pricing model that recommends the prices of our retail packs, whilst ensuring our products are available in convenience stores across the country.
We expanded our fleet operations with the addition of 98 new trucks which ensured that we were able to deliver our products to our customers in the most reliable, efficient and effective manner, whilst reducing our reliance on third-party truck operators.
Production reported an impressive performance in the year under review, delivering a combined production efficiency of 80% (2016: 76%) These results are attributable to year
long improvements across our operations with particular strong efficiency performances recorded by the Seasoning Plant in Ota 96% (2016: 70%)
Business outlookAt NASCON we will remain strongly focused on growth, and would be leveraging on a range of opportunities within the business to build scale across our brands. We intend to deliver on our promises made to all stakeholders.
We will continue to leverage synergies and enhance efficiencies across the business operations to curtail costs. Product innovation and improvement in our seasoning business aimed at delivering savory taste experiences will remain a priority.
Our impressive achievement reported for 2017 is demonstration of the commitment of a team comprising of each member of the NASCON ALLIED INDUSTRIES family. I would like to thank everyone for their commitment to achieving our strategic vision for the company.
I want to specifically thank our distributors, consumers, suppliers, team members, and strategic stakeholders, for contributing to our success story. We look forward to continuing these mutually beneficial relationships in the years ahead
Paul Farrer Managing Director

Chief Financial Officer’s Review
Summary of Financial Performance31-Dec-17 31-Dec-16
Financial Highlights ₦’000 ₦’000
Total Revenue 27,064,325 18,291,792
Gross Profit 9,994,015 5,917,694
GP Margin (%) 36.9% 32.4%
EBITDA* 9,354,478 4,833,013
EBITDA Margin (%) 34.6% 26.4%
Operating Profit 7,626,856 3,818,674
Profit Before Tax 7,909,488 3,516,331
PBT Margin (%) 29.2% 19.2%
Net Profit 5,343,592 2,415,183 Earnings per share (₦) 2.02 0.91
Net Cash & Cash Equivalents 9,438,170 2,453,499
Total Assets 30,123,247 24,603,267 *Earnings before interest, taxes, depreciation and amortisation
“The profit before tax was ₦7.91bn, compared to ₦3.52bn in 2016, which represents a 125% increase”
31-Dec-17 31-Dec-16
₦’000 ₦’000 Salt 22,247,384 14,823,697
Seasoning 765,296 544,458
Tomato Paste - 8,342
Vegetable Oil 192,904 479,375
Freight 3,858,741 2,435,920
Total Revenue 27,064,325 18,291,792
“Total revenue in 2017
increased by 48% to ₦27.06bn
from ₦18.29bn in 2016 with
2017 Salt revenue increasing
by 50% to ₦22.25bn from
₦14.82bn in 2016”
16N a s c o n A l l i e d I n d u s t r i e s P L C A n n u a l R e p o r t 2 0 1 7

Chief Financial Officer’s Review2017 was a rebound year for the Nigerian economy and the positive macro-economic trends resulted in a
robust year for NASCON. We increased total revenue by 48% to ₦27.06bn {2016: ₦18.29bn}. Salt revenue
increased by 50% to ₦22.25bn {2016: ₦14.82bn} driven primarily by price increases per bag in Q1. Seasoning
revenue increased by 41% to ₦0.77bn {2016: ₦0.54bn} and Freight revenue increased by 58% to ₦3.86bn {2016:
₦2.44bn}. Vegetable Oil revenue declined by 60% to ₦0.19bn {2016: ₦0.48bn} and Tomato Paste had no revenue
compared to ₦0.01bn in 2016.
31-Dec-17 31-Dec-16
Volume by Product Tonnes Tonnes Salt 403,432 403,505
Seasoning 1,404 1,347
Tomato Paste - 34
Vegetable Oil 468 1,317
Total Volume 405,304 406,203
Despite the increase in revenue, salt volume stayed flat in 2017 at 403,432MT compared to 403,505MT in 2016.
Seasoning volume increased by 4% in 2017 to 1,404MT compared to 1,347MT in 2017 driven by focusing our
marketing attention on brand differentiation and strategic market activations and penetration
Unfortunately, the 2015 CBN FX policy continued to stall the importation of the necessary raw materials for both
Tomato Paste and Vegetable Oil. Despite the challenges, in 2017, we were able to sell 468MT of Vegetable Oil
remaining in our tanks while we continue to focus our efforts on sourcing both raw materials locally.
31-Dec-17 31-Dec-16
Profitability ₦’000 ₦’000EBITDA 9,354,478 4,833,013
Depreciation and amortization (1,727,622) (1,014,339)
Operating Profit 7,626,856 3,818,674
31-Dec-17 31-Dec-16
Profitability by Product ₦’000 ₦’000
EBITDA 9,354,478 4,833,013
Depreciation and amortization (1,727,622) (1,014,339)
Operating Profit 7,626,856 3,818,674
EBITDA 9,354,478 4,833,013
Depreciation and amortization (1,727,622) (1,014,339)
Operating Profit 7,626,856 3,818,674
Operating profit in 2017 was ₦7.63bn, an increase of 100% over ₦3.82bn in 2016. Due to improved efficiencies,
operating margin increased to 28% in 2017 compared to 21% in 2016. Salt contributed ₦8.23bn {2016: ₦4.56bn}
to the total operating profit, Seasoning contributed ₦0.10bn {2016: ₦0.07bn} while Freight generated a loss of
(₦0.52bn) {2016: (₦0.53bn)}. Tomato Paste (₦0.03bn) {2016: (₦0.05bn)} and Vegetable Oil (₦0.24bn) {2016:
(₦0.14bn)} both made losses due to lack of raw materials for production
31-Dec-17 31-Dec-16
Cost of Sales ₦’000 ₦’000Direct material cost 10,148,410 7,231,144
Direct labour cost 886,686 822,450
External haulage 3,285,123 2,535,489
Depreciation 1,471,697 767,389
Loading 107,438 108,048
Manufacturing expenses 1,170,956 909,578
Total Cost of Sales 17,070,310 12,374,098
Su
pp
lem
en
tary
In
form
ati
on
Intr
od
ucti
on
Op
era
tio
ns
Co
rpo
rate
Go
ve
rnan
ce
Fin
an
cia
ls
17N a s c o n A l l i e d I n d u s t r i e s P L C A n n u a l R e p o r t 2 0 1 7

Chief Financial Officer’s ReviewCombined production efficiency 80% {2016: 76%}. Salt efficiency in all 3 plants increased to 79% {2016: 76%} and Seasoning efficiency increased to 96% {2016: 70%}.
2017 Cost of Sales increased by 38% to ₦17.07bn {2016: ₦12.38bn}. The major drivers were direct materials, depreciation and external haulage. Direct materials increased by 40% due to increase in the cost of raw materials and various packaging materials while depreciation increased by 92% due to improvements in our machinery and new trucks acquired in the year. External haulage increase of 30% was due to additional hiring of third party transporters to mitigate the infrastructure challenges in Nigeria and ensure timely delivery of all our products.
Gross profit increased by 69% to ₦9.99bn {2016: ₦5.92bn} and gross profit margin increased to 37% compared to 32% in 2016.
“Gross profit margin increased to 37%; EBITDA margin increased to 34.6% and PBT margin increased to 29.2%”
31-Dec-17 31-Dec-16
Administrative and Distribution Expenses ₦’000 ₦’000Distribution Expenses 604,718 638,189
Administrative Expenses 1,773,737 1,479,315
Operating Costs 2,378,455 2,117,504
Distribution costs decreased by 5% due to branding and distribution spend being pegged in relation to volume achievement, while Administrative expenses increased by 20%.
31-Dec-17 31-Dec-16
Finance Income ₦’000 ₦’000Bank deposits 671 340
Fixed deposits 354,074 54,988
Finance Income 354,745 55,328
31-Dec-17 31-Dec-16
Finance Cost ₦'000 ₦'000 Interest on borrowings 72,113 357,671
Finance Cost 72,113 357,671
Finance income increased by 541% in 2017 as surplus funds were invested in the year. Finance costs in 2017 was ₦0.07bn {2016: ₦0.36bn}. These are related to specific borrowings for capital projects. The average effective interest during the year was 15%.
The profit before tax was ₦7.91bn, compared to ₦3.52bn in 2016, which represents a 125% increase
31-Dec-17 31-Dec-16
Taxation ₦’000 ₦’000Income Tax Expense 2,565,896 1,101,148
Total Tax (Charge)/Credit 2,565,896 1,101,148
Tax expense for the year increased by 133% to ₦2.57bn, including a deferred tax expense of ₦0.57bn. The
effective tax rate was 32%.
The profit for the year was ₦5.34bn, a 121% increase over ₦2.42bn in 2016. This resulted in a 122% increase in
earnings per share in 2017 of ₦2.02 compared to ₦0.91 in 2016.
18N a s c o n A l l i e d I n d u s t r i e s P L C A n n u a l R e p o r t 2 0 1 7

Chief Financial Officer’s Review31-Dec-17 31-Dec-16
Financial Position ₦’000 ₦’000Property, plant and equipment 9,419,203 6,346,688
Intangible assets - 47,374
Other non-current assets 1,838 5,513
Current assets 11,225,466 15,711,623
Cash and bank 9,476,740 2,492,069
Total assets 30,123,247 24,603,267
31-Dec-17 31-Dec-16
₦’000 ₦’000Non-current liabilities 1,934,135 1,393,517
Current liabilities 16,615,330 15,124,953
Debt 38,570 38,570
Total liabilities 18,588,035 16,557,040
31-Dec-17 31-Dec-16
₦’000 ₦’000Share capital 1,324,719 1,324,719
Share premium 434,037 434,037
Retained earnings 9,776,456 6,287,471
Total equity 11,535,212 8,046,227
There was a 22% increase in total assets of ₦30.12bn {2016: ₦24.60bn}. Main driver was Cash at the bank which increased by 280% over 2016 due to increased revenue. Total liabilities increased by 12% to ₦18.59bn {2016: ₦16.56bn} mainly due to trade and other payables.
Net Cash & Cash Equivalents in 2017 was ₦9.44bn, a 285% increase of last year {2016: ₦2.45bn}. Capital expenditure increased by 799% to ₦4.82bn {2016: ₦0.54bn} as we purchased new trucks to ensure fast and efficient delivery of our products. Cash flow from operations increased by 518% in 2017 to ₦13.84bn {2016: ₦2.24bn}.
Recommended dividendOn Monday 5th March, 2018, the Directors proposed a dividend of ₦1.50 per share {2016: ₦0.70} to be paid to shareholders on Tuesday 8th May, 2018. The dividend represents a payout ratio of 74%. The proposed dividend is subject to the approval of shareholders at the Annual General Meeting on Thursday, 3rd May, 2018. If approved, the total amount payable will be ₦3.97bn {2016: ₦1.85bn}. The dividend will be payable to all shareholders whose names appear in the company’s Registrar of Members at close of business on Thursday 19th of April, 2018.
Financial PositionIn compliance with the Regulatory requirement in Nigeria, the Consolidated and Separate Statement of Financial Position as at 31st December, 2017 has been signed by NASCON Allied Industries Plc’s Finance Controller, Tunde Iwamofe, who is a Registered Member of a Nigerian Professional Accountancy Institute.
Going ConcernThe Directors continue to apply the Going Concern principle in the preparations of the financial statements. After considering the liquidity position and the availability of resources, the Directors concluded that there are no significant threats to the Company’s Going Concern capabilities.
Aderemi Saka Chief Financial Officer
Su
pp
lem
en
tary
In
form
ati
on
Intr
od
ucti
on
Op
era
tio
ns
Co
rpo
rate
Go
ve
rnan
ce
Fin
an
cia
ls
19N a s c o n A l l i e d I n d u s t r i e s P L C A n n u a l R e p o r t 2 0 1 7

Management Team
Tunde Iwamofe Patrick Mogaha
Shalom Okonmah
Olushola Shosanya Adewale Akinwale
Fatima Aliko-DangoteJude Amaechi
Management Team
20N a s c o n A l l i e d I n d u s t r i e s P L C A n n u a l R e p o r t 2 0 1 7

Management Team
Olusegun Ajala Gerhard ScheepersNura Shuaibu
Adedayo SamuelPaul Farrer
Rabiu MohammedRabi Adamu
Aderemi Saka
21N a s c o n A l l i e d I n d u s t r i e s P L C A n n u a l R e p o r t 2 0 1 7

Management Team
Fatima Aliko-Dangote | Executive Director, Commercial
Fatima joined the Dangote Group in 2014 as the Special Assistant to the Managing
Director-Cement and later worked as a Group Corporate Strategy Specialist. In this
latter role, she provided planning and analytical support across all the Business Units of
the Dangote Group.
She holds a Bachelor’s degree in Law from the University of Surrey in the UK. Fatima
has been called to the Nigerian Bar, and has worked as an Associate at Banwo and
Ighodalo Legal Chambers, on areas related to capital markets, intellectual property and
energy.
Aderemi Saka | Chief Financial Officer
Aderemi has a Bachelor’s Degree in Accounting and a Masters in Business Administration
(International Business) from Georgia State University, USA. She has 19 years of
experience working in the United States with various multinationals and publicly
traded corporations. Prior to joining NASCON as CFO, Aderemi was part of the Group
Corporate Strategy team at Dangote Industries Limited.
She has experience in financial analysis, planning, budgeting, forecasting, operational
and financial risk management, regulatory controls, internal auditing, financial strategy
and modeling, and program management.
Gerhard Scheepers | Head, Operations
Gerhard has decades of experience across sales, sales force management, production
management, operational financial management and driving operational efficiency for
growth.
He began his career in factory operations for Bidbake South Africa rising to become
the Managing Director and later Group Operations Director. His immediate past
leadership roles include Group Operations Director for Trimark Industries and Director
of Operations at Orbiline Pty SA.
Olushola Shosanya | Head, Sales
ShoIa has decades of experience in sales management, sales force management and
warehousing. He is also a Sales trainer. He started his career in Nigerian Bottling
Company, where he received both local and international trainings on sales management
and trade activations
He joined NASCON in 2016 having previously worked at 3D Impact Marketing as a
Marketing consultant and holds a Bachelor’s degree in Animal Science from Obafemi
Awolowo University and Post Graduate Diploma in Marketing from the University of
Lagos.
Paul Farrer | Managing Director
Paul joined NASCON as Managing Director in 2015, having previously been the Chief
Operating Officer and Group Executive Director of Food Concepts Plc.
His experience in the foods business spans 21 years in the South and West African
markets; in international companies such as TGI Fridays (Americana Group), Steers
Holdings – Debonairs Pizza, Famous Brands and Innscor International.
He is an alumnus of East London Technical College, South Africa.
22N a s c o n A l l i e d I n d u s t r i e s P L C A n n u a l R e p o r t 2 0 1 7

Management Team
Shalom Okonmah | Acting Head, Procurement
Shalom has 20 years of work experience spanning sales, finance, treasury, procurement,
international trade and importation. She holds an Accounting degree from Edo State
University and a Masters in Business Administration from the University of Calabar.
She started her career with Dangote Group as an Executive Officer in 1997 before
moving to Dangote Agrosacks Limited, where she rose to the position of Head Treasury,
Procurement and Clearing.
She is also a member Chartered Institute of Purchasing and Supply Chain Management
and Chartered Institute of Cost Management.
Rabi Adamu | Acting Head, Human Resources and Administration
Rabi is a seasoned practitioner with 20 years of practical HR Management work
experience within the Dangote Group.
She started her career with Dangote Group in 1998 as an Executive Officer. She graduated
from Bayero University, Kano and holds a Post Graduate Diploma in Management from
FUTO. She also has an MBA in Human Resources from Lagos State University.
She is also a member of Nigerian Institute of Management and an Associate Member of
the Chartered Institute of Personnel Management.
Nura Shuaibu | Head, Projects
Nura is a Mechanical Engineer with a degree from Ahmadu Bello University, Zaria. Prior
to joining NASCON, he worked with the Ministry of Works and Housing, Kano as trainee
Engineer and Gaskiya Textile Mills as Assistant Mechanical Engineer.
He joined the Company in 1997 as a pioneer staff and has worked in various functions
with increasing responsibility including maintenance manager, plant manager and project
manager.
Rabiu Mohammed | Head, Fleet & Logistics
Rabiu has 30-year experience spanning production, plant, fleet, transport, logistics and
warehouse management. He began his career with Nigerian Bottling Company where he
rose to Plant manager, working across the Northern states and Onitsha.
He Joined the Dangote Group in 1996 as Head of transport for the Flour business and
has held various positions of increasing responsibility and complexity across Dangote
Cement before being deployed as the Head of Fleet and Logistics for NASCON.
Olusegun Ajala | Acting Head, Marketing
Olusegun is a marketing professional with over 12 years’ cognate experience in experiential
marketing, consumer marketing, trade channel development, category management,
shopper marketing, new product development, public relations, events and sponsorship.
He joined NASCON in 2016 having previously worked at Nigeria Bottling Company. He
has a Bachelor’s degree in Pure and Applied Chemistry from Ladoke Akintola University
of Technology and Master’s degree in Marketing and Management from the University
of Bradford, UK. He is a fellow of the National Institute of Marketing of Nigeria, and an
affiliate member of the Chartered Institute of Marketing UK.
Su
pp
lem
en
tary
In
form
ati
on
Intr
od
ucti
on
Op
era
tio
ns
Co
rpo
rate
Go
ve
rnan
ce
Fin
an
cia
ls
23N a s c o n A l l i e d I n d u s t r i e s P L C A n n u a l R e p o r t 2 0 1 7

Tunde Iwamofe | Financial Controller
Tunde has over 10 years of experience in financial reporting, analysis, planning,
budgeting, forecasting, internal audit, tax planning and computation. Prior to joining
NASCON in 2008, He was the Account Manager for Somotex Nigeria Limited a member
of the Mohinani Group of Companies. He is an Associate of the Institute of Chartered
Accountants of Nigeria and a Certified Change Manager.
Jude Amaechi | Head, Health Safety and Environment
Jude joined NASCON in 2017 with over 12 years of valuable experience. Prior to
NASCON, he was a HSE Coordinator at Ponticelli Nigeria Limited.
He has a Bachelor’s degree in Soil Science and Technology and a Master’s degree in
Soil Survey and Land Use Planning from Federal University of Technology, Owerri. He is
a certified HSE professional from National Examination Board of Occupational Safety
and Health UK, Occupational Safety and Health Academy USA, ISO 9001: Quality
Management System UK, He is a member of the Institute of Safety Professionals of
Nigeria and Nigeria Institute of Chartered Management.
Patrick Mogaha | Head, Internal Audit
Patrick began his audit career as a Financial Auditor with First Bank of Nigeria PLC
and has over 19 years of experience in Internal Audit, Information Systems Audit and
Fraud & Forensic Audit. Prior to joining NASCON, he was the Deputy Head of Audit for
Dangote Cement.
Patrick is a Fellow of the Institute of Chartered Accountants of Nigeria, Certified Fraud
Examiner, Certified Forensic Accountant, Certified Information Systems Auditor and
a former member of Committee of Chief Inspectors of Banks in Nigeria. He holds a
Bachelor degree in Accounting and a MBA in Banking and Finance from ESUT Business
School, Enugu.
Adewale Akinwale | Head, Risk Management
Adewale joined NASCON as Head, Risk Management from his former role as Head,
Enterprise Risk Management at the Nigerian Aviation Handling Company PLC. He has
cognate experiences in the fields of Risk Management, HSE, Strategy, Logistics and
Business Continuity Management. His previous work experiences include functional
roles in Strategy consulting, Logistics and Business Continuity Management from
Messrs S.I.A.O Professional Services, Barratts Priceless U.K. and IKEA Tottenham U.K.
He has a Bachelor’s degree in Business Management from University of Sunderland, UK,
he is an Associate Business Continuity Professional of the Disaster Recovery Institute,
USA and an Affiliate Member of the Institute of Risk Management, UK.
Adedayo Samuel | Company Secretary
Adedayo was the pioneer Company Secretary of NASCON when the Company was
privatized by the Federal Government. He was responsible for taking the Company to
the Nigerian Stock Exchange upon privatization in 1992.
He has extensive and varied experience in Corporate Governance, broad exposure in
litigation and in the Judiciary where he had served as a Chief Magistrate. He obtained
his LLB degree from the then University of Ife and was called to the bar over three
decades ago.
24N a s c o n A l l i e d I n d u s t r i e s P L C A n n u a l R e p o r t 2 0 1 7


“People are the key to oursuccess, and we work hard
to harness the enormous potential that comes from an empowered workforce”
Human Resource Management and DevelopmentPeople remain the most valuable asset in NASCON’s constant aim to achieve its mission. The Human Resource Department (HRD) focuses on people development in its efforts to develop a dynamic and robust organization. It constantly reviews and refines its processes and policies for optimum performance.
This year, we initiated strategies for the purpose of linking, comparing and closing identified performance gaps in HR systems within the company’s plans. The core HR network along with other organization development initiatives focused on: • Reviewing departmental
structures and policies• Reviewing Standard
Operating Procedures (SOPs) • Updating the employee
handbook• Evaluating manpower
requirements and recruitment
As at 31st December 2017, NASCON’s’ head count was 547,
including 40 managements, 170 senior and 337 junior full time employees. The outsourced count is over 600 depending on the needs of the company.
A total of 96 employees were recruited during the year after going through a process of ensuring that the caliber of staff are engaged towards boosting our staff strength and increasing productivity. We at NASCON, offer equal opportunity of employment. The recruitment of additional management staff aimed to improve decision-making in the organization and enhance the quality of our work.
Career Development and Succession Plan. We at NASCON believe in the continuous learning and development of our workforce. This we do by developing their skills, knowledge and attitude. In line with the departmental objectives, we have commenced on a series of initiatives and plans aimed at developing the workforce to ensure continuity, better performance and efficiency. Initiatives such are:
• Identification, documentation and continuous addressing of skills gaps in the organization.
• Plan developmental programs to bridge the skill gaps identified.
• Updated job profiles and KPIs for all job functions
• Identified successors for key roles within the business for subsequent schedule for addressing the competency needs.
• Mapped out a framework for implementing the succession.
• Established a policy for prioritizing internal vacancies for any vacant position.
Additionally, in order to motivate, reward, retain and encourage internal growth within the company, we have converted some part-time staff to full-time employees. Some employees were also upgraded/promoted to higher levels of responsibilities to foster job enrichment and rotation policy of our company.
Training and Employee DevelopmentDuring the year, employees
Human Resources
26N a s c o n A l l i e d I n d u s t r i e s P L C A n n u a l R e p o r t 2 0 1 7

Human Resourceswere trained both in the plant and externally via the Dangote Academy. The in-house training targeted all operational staff. There were special trainings conducted for operators in the various production plants. The objective was to impart customized skills, based on identified skill gaps required to ensure total understanding of function, procedures, process and the need to carry out task rightly at the first instance. The expected outcome being improved quality of work, minimal waste and reduced downtime.
Employees of different cadre across all the departments were exposed to different training courses mostly from our Dangote Academy. These courses include:• Mandatory professional
Education(MCPE) organized jointly by the professional bodies and the academy with the aim of improving professional skills.
• Leadership and Supervisory development aimed at improving the supervisory and leadership function
• Sales and Marketing courses• Health and Safety• Customer service • Finance and Accounting• Human Resources and
Admin.
Both the in-house and Dangote Academy training were aimed at employee development via nurturing their personal creativity to equipping them with knowledge and skills required to perform better. The middle management and People Development courses aimed at encouraging strategic thinking and developing managerial skills.
A total of 583 training courses were attended via the Dangote academy, over 300 employees were trained in- house in line with the in plant development training strategy, this excludes the 197 truck drivers from our fleet unit who underwent series of organized training ranging from defensive driving, road rage, accident prevention and others. These courses have helped in no small means to reduce the rate of accident caused by negligence of drivers on the highway.
Staff RemunerationNASCON’s salary policy is to award remuneration packages that are competitive within the business sector. This ensures ability to attract, motivate and retain quality employees.
Staff are appraised yearly during the annual appraisal exercise. Salary increases and performance bonuses were awarded during the year as an outcome of the 2016 appraisal process. Ability and contributions were the basis of the decisions taken.
Long Service AwardsNASCON values and recognizes the contribution, loyalty and dedication of our staff that have been with us for several years. To appreciate their efforts, the Long Service awards for such dedicated and loyal employees is in process and will be implemented during the year.
Employee WelfareWe believe that healthy staff makes a healthy organization. In line with this, during the year, 3 HMO providers were engaged as against 1 in the previous year. This allowed for more choice of
hospitals and services in favor of our employees.
Additionally, series of health and HSE talks were effected by our in-house clinic to improve on health awareness.
Management introduced the “Free Meal” programme to support the operation staff; this is in a bid to improve their nutritional health status and the productivity output.
The canteen facilities were upgraded for better aesthetics and services. More storage facilities were provided for the employees’ cloakroom.
The Future of our people.We foresee a future where NASCON and its people work in a conducive and dynamic environment that ensures continuous learning, upgrading of skills and processes to improve organization efficiency. An environment where people work together in the overall interest of the organization.
Rabi AdamuActing, Head Human Resources and Administration
Su
pp
lem
en
tary
In
form
ati
on
Intr
od
ucti
on
Op
era
tio
ns
Co
rpo
rate
Go
ve
rnan
ce
Fin
an
cia
ls
27N a s c o n A l l i e d I n d u s t r i e s P L C A n n u a l R e p o r t 2 0 1 7

“Our goal at NASCON is to achieve corporate excellence through risk
management”
NASCON’s Risk Management process has fully developed into an integral part of the organization’s business culture and dynamics in the year under review.
Following the successful approval and implementation of a comprehensive and uniquely tailored Enterprise Risk Management Framework by the Board of Directors in the previous year; the risk management process now effectively guides the strategic execution of business objectives methodically to avoid or transfer
adverse risk factors and explore positive risk factors for increased profitability.
Our Enterprise Risk Framework augments the organization’s strategic intention to continuously excel by generating improved profitability and protecting shareholder’s value sustainably despite the harsh economic realities of the Nigerian business environment.
Our approach to Risk ManagementOur approach to risk management at NASCON
follows the globally accepted ISO 31000 standard with necessary adjustments to suit the uniqueness of our business environment. Risk is defined under the ISO 31000:2009 standards as the “effect of uncertainty on objectives”. The ISO definition is based on the premise that “uncertainty (risks) can have consequences in terms of economic performance and professional reputation for corporate organizations. Therefore, managing risk effectively helps organizations to perform well in an environment full of uncertainty”.
Risk Management
Strategy and Business Planning
Risk Identification & Assessment
Risk Measurement & Prioritization
Risk Control & Reporting
(Risk Appetite Tolerance Limits)
Risk Management Oversight, System and Tools
Risk Control & Reporting
28N a s c o n A l l i e d I n d u s t r i e s P L C A n n u a l R e p o r t 2 0 1 7

Our risk methodology is aimed at analyzing and retaining risks where doing so contributes value to our business and it is within our defined risk appetite. Therefore, we ensure that the availability of needed expertise, capabilities, processes and controls to manage all types of risks that the business could face.
Strategy and Business PlanningThe Board of Directors are responsible for setting the strategic plan for the organization; these could be short, medium and long term based on the set objectives, the vision and the mission of the organization.
Strategic plans are presented to the management for execution and required resources are made available in order to achieve the strategic intent of the shareholders. The strategic plans are carefully designed to be in line with the defined Risk appetite and tolerance limits already set by the Board of Directors.
Risk appetite in this parlance refers to the total value of financial and non-financial exposure that the organization is willing to undertake on the basis of risk-return trade-offs. Risk tolerance on the other hand refers to amount of uncertainty the organization is willing to accept; wherein exceeding the defined risk tolerance levels could impact negatively on the success of the strategy and objectives of the organization.
Risk identification and AssessmentProcedures for identifying risks are applied at the departmental, plant and organizational levels. Qualitative and quantitative tools deployed to manage this process effectively across the organization including the conduct of Risk and Control Self-Assessments, Key Risk Indicator Monitoring and Loss Incident Reporting. Processes for risk identification and assessment are conducted on a regular basis and supplemented with special risk reports when unexpectedly high risks are envisaged or
actually become real.
Risk Measurement and PrioritizationThis requires that the consequences of potential risks or actual risk incidents are fully understood and quantified. NASCON’s overall risk rating is based on the potential for damage from any specific risk, multiplied by its probability of occurrence. These consequences can be injury to staff, destruction of assets, financial losses or damage to our reputation. Ultimately, all will have some consequences for shareholder value.
Risks incidents reported are prioritized based on consideration for likelihood of occurrence and adjudged level of impact. Five levels of severity have been defined for both measurement parameters and properly defined as captured in Figures 1.1 and 1.2 below.
Risk Management Report
Negative publicity lasting over 6 months; High customer defection, irreparable share pricing decline;Major investor divestment
>25% of Gross income5
Catastrophic
Reputational
FinancialParameter
Negative publicity lasting for over 3 months, Some customer defection; Decline in share price; Few instances of investor divestment
>15%-25% of Gross Income
4Major
Assessing Level of Impact
Negative publicity lasting for over 1 month, Some customer defection; Decline in share price; No investor divestment
>5%-15%of Gross Income
3Moderate
No negative publicity, customer defection; impact on share price or investor divestment
1%-5% of Gross Income
2Minor
Minimal negative publicity, customer defection; No impact on share price or investor divestment
<1% of Gross income
1Insignificant
Su
pp
lem
en
tary
In
form
ati
on
Intr
od
ucti
on
Op
era
tio
ns
Co
rpo
rate
Go
ve
rnan
ce
Fin
an
cia
ls
29N a s c o n A l l i e d I n d u s t r i e s P L C A n n u a l R e p o r t 2 0 1 7
Risk control and reportingAfter risks have been identified and their potential impact quantified, mitigation strategies are recommended, implemented, monitored and reported to the Executive Committee on a monthly basis and to the Board on a quarterly basis. Where necessary, special risk reports are sent to relevant stakeholders on a need-to-know basis. The Board Finance, Risk and Audit Committee reviews risk reports and approves the implementation of recommended risk control measures.
Risk monitoringThe Risk Management team is responsible for coordinating all the risk management processes implemented across the organization and ensures that risk controls are duly implemented. Where required risk controls remain outstanding, the Risk Management team ensures timely escalation to relevant approving authorities for the required budgetary approvals or control modification. The risk monitoring process leads to the identification and assessment of new risks that are then analyzed using the process flow described above.
Risk management oversight, systems and tools The internal Risk Management function of NASCON is responsible for risk oversight in the business. The function is responsible for identifying, measuring, monitoring and controlling the full spectrum of risk facing the business; these risks have been classified under 3 broad categories namely:1. Credit Risks Credit Risk is defined as the
risk of loss resulting from a borrower’s failure or inability to repay a credit facility or otherwise meet a contractual obligation. Credit Risk exists in two basic forms:
a. Direct Credit Risk: It is the risk of loss from a counterparty / client’s inability or unwillingness to pay it’s on and off balance sheet commitments.
b. Indirect Credit Risk: It is a risk that arises in our business when a sale for which payment is not due immediately is mitigated by the provision of a bank guarantee.
2. Operational Risks Operational risks are
classified as incidents that result in actual or likely change in value ensuing from inadequate or failed internal processes, people and systems, or from external events including legal risk. Examples of operational risks identified in NASCON include fires at plants, unplanned disruption from equipment malfunctions, health and safety issues, and low staff productivity.
3. Insurance RisksInsurance is used as a means of protection from financial loss from risk which have been considered best transferred to an insurance underwriter. This follows the Risk management principle of using insurance as a risk transfer mechanism primarily used to hedge against the risk of a contingent, uncertain loss. NASCON therefore maintains several regulatory (Group Life Assurance, Commercial Vehicle, Private Motor, Marine and NSITF) and best-practice based (Business interruption,
Industrial All Risk, Goods in Transit) insurance policies which provide relief in the event of the crystallization of insured risks.
Risk types covered under the broad headers include political risks, market risks, reputation risks, health & safety risks and business continuity risks. Specialist risks such as legal, financial and information technology risks are jointly managed with the respective functional departments.
Some of the technical tools used in the application of Risk Management principles in the organization include:• Weekly Loss Incident
Reporting• Monthly Key Risk Indicators
(KRI) reporting• Risk reporting at Monthly
Performance Review (MPR) Meetings
• Quarterly risk reporting to the Board Finance, Risk and Audit Committee
• Bi-annual Risk and Control Self-Assessment
• Annual Engineering/Technical Risk assessments
• Plant Operational Risk Assessment exercises
• Control plan monitoring and evaluation
• Loss estimation using Scenario analysis
• Insurance policy management including policy design, renewals and claims management
The effectiveness of the Risk Management function is monitored by the Internal Audit function in line with Three Lines of Defense (3LoD) principle. In the Three Lines of Defense model, management control is the first line of defense in risk management, the risk function
Risk Management Report
30N a s c o n A l l i e d I n d u s t r i e s P L C A n n u a l R e p o r t 2 0 1 7

is the second line of defense, and an independent internal audit function is the third line. Each of these three “lines” plays a distinct role within the organization’s wider governance framework as shown in Fig 3.0.
OVERVIEW OF KEY RISKS IN YEAR 2017As a business operating in the Nigerian business environment, NASCON was not spared from the economic challenges that faced organizations in the past year. While some of these challenges were across board and impacted on most business entities in the country, some were more operational and localized to the manufacturing and distribution industry in particular.
Economic recession and reduced spending power The economic recession that crippled consumer spending for much of year 2016 continued up until the 1st half of year 2017 when marginal growth of 0.7% GDP was recorded in June 2017. Despite the turnaround from negative growth, consumer confidence remained poor up
until the 3rd quarter of the year when improved oil production signalled the end of the economic recession.
The reduction in production volumes by major players in the food sub-sector Nigeria impacted negatively on NASCON’s business in terms of volume, however, the loss on volume did not impact on volume the bottom-line revenue of the organization due to attendant price increases on finished goods.
Foreign Exchange challengesNASCON’s management had to pro-actively manage the FX challenges in its bid to sustain crude salt and associated raw material imports from its suppliers across the globe. Through our effective currency hedging, business continuity and global supply chain planning strategies, we were able to sustain all high FX imports into the country and the business did not suffer any loss-time on production from raw material exhaustion.
In terms of sourcing new
equipment and replacement of spare parts on existing equipment, the FX challenges opened up opportunities for local ingenuity and NASCON benefited from new partnerships through collaboration with other major players in the manufacturing industry for the local sourcing of equipment.
New production lines were sourced and installed locally and this was also significant in reducing the usual lead times and attendant costs from shipping equipment from overseas.
Apapa Gridlock and increased cost on sourcing of raw materials The traffic situation at the nation’s main gateway, the Apapa port impacted significantly on NASCON’s ability to import raw materials and distribute finished products out of its Apapa plant. Apapa plant contributes significantly to the total edible salt production of the business and serves as the major source of production for customers in the Lagos, South-west, North-central and North-
Risk Management Report
1. Ensure that business operations and risk management identify and control risks in a timely and optimal manner by providing independent oversight on policies and procedures deployed across the organization.
1. Promote Risk culture and desired risk behavioral decisions being made.
2. Ensure macro and micro risk management by limits monitoring for acceptable risk exposures.
3. Continuously monitor positions and report inherent risks to relevant stakeholders.
1. Understand business dynamics and complexities for apt risk management.
2. Engage all stakeholders for timely redress of identified risks.
3. Ensure a holistic approach to risk management and risk reporting.
1. Business operations
2. Risk Management Department
3. Internal Audit S
up
ple
me
nta
ry
Info
rmati
on
Intr
od
ucti
on
Op
era
tio
ns
Co
rpo
rate
Go
ve
rnan
ce
Fin
an
cia
ls
31N a s c o n A l l i e d I n d u s t r i e s P L C A n n u a l R e p o r t 2 0 1 7

Risk Management Reportwest regions of the country.
Road construction efforts in the Apapa axis critically affected the flow of traffic into the port and the average trip into the Apapa port was in the range of 4 to 7 days for trucks and tippers for most of the year.
This significant risk was mitigated with the acquisition of new trucks and upgrade of existing fleet; additional trucks were also sourced from 3rd party stakeholders.
Increased Logistics Turnaround Time The average turnaround time for trucks heading up to the North East and North West of the country were affected by the collapse of arterial highways and bridges mostly in the Middle belt region. Some of the major bridge collapse and severely damaged roads include the following: -• Tegina- jebba Bridge• Jebba-Mokwa Bridge• Lafia- Jos Bridge• Zungeru-Bida Bridge• Ayangba-Lokoja Road
The business incurred additional diesel cost as trucks plying this routes from the Lagos and Port Harcourt plants had to be diverted on longer routes to ensure product delivery to customers.
OPPORTUNITIES RECORDED IN YEAR 2017
Increase in export tradeNASCON consolidated on some of the successes of its export trade strategies from Year 2016 by pushing the boundaries of export trade into nearby West African countries notably the Republic of Benin and Republic
of the Niger. This effort has been significantly buoyed by technical and operational partnerships with some of the other business units within the Dangote group who already have market presence in the countries where NASCON intends to penetrate.
Whilst Salt is clearly the product with the highest potential for export earnings; its export trade into West Africa continues to be challenging majorly due to differences in preference for salt variants between Anglophone and Francophone West African countries. While Anglophone West African countries have a preference for refined table salt with a Particle Size Distribution (PSD) between 1000- 1200 microns, Francophone West African countries have a preference for salt crystals between 100-150 microns. These difference in preferences have considerable bearings on pricing and profitability in the medium to long term.
Despite the present challenges, NASCON will continue to explore opportunities despite the challenges and efforts are ongoing to significantly scale up export trades further into other West African countries.
Corporate trade customersDespite the pessimisms that came with the economic recession, the silver lining for NASCON was in the form of increased focus on local sourcing by the major manufacturing companies. NASCON took advantage of the opportunities presented and strategic supply agreements were reached with medium to large sized corporate customers.
Highlight of achievements in the year 2017• Implementation of Whistle
Blowing policy across all plants and workshops.
• Full implementation of Risk Management Framework and Tools: Risk and Control Self-Assessment, Loss Incident Reporting, Key Risk Reporting, Monthly Key Risk Indicator monitoring.
• Implementation of Customer credit rating system.
• Reconstruction of Port Harcourt Plant (Ongoing).
• Renovation of Oregun Plant Crude Salt Warehouse (Ongoing).
• Capacity increase (Installation of additional production lines at Oregun).
• Addition of 98 new truck to boost logistics operations.
• Implementation of Golden rules for HSSE management.
• Construction of water treatment plant at Oregun Plant.
• Renovation of staff canteen and upgrade of catering services to boost staff morale.
• Installation of Hygiene stations at all entrances to the production plants.
• Fire Risk Assessments conducted across all plants in line with ISO 45001 standard.
Adewale AkinwaleHead, Risk Management
32N a s c o n A l l i e d I n d u s t r i e s P L C A n n u a l R e p o r t 2 0 1 7


“We are committed to international and local best
practices in all NASCON operations”
Health, Safety and Environment is viewed from the standpoint as a function which has significant effect on the overall operation of our business, whilst the business plays an important role in the development of the nation’s economy; it has its peculiar hazards that need to be well managed.
As a global player in the salt industry, NASCON is committed to international and local best practices in her operations with the aim of reducing occupational health issues, industrial accidents, environmental degradation and to uphold her brand name. In NASCON, our core value is to ensure “GOAL ZERO” which stands for ‘no fatality, no accident, no occupational illness, no environmental pollution and no litigation. We have in place a robust safety mechanism to manage our operational hazards to as low as reasonably practicable (ALARP).
OUR STRATEGIC OBJECTIVESNASCON aims to create a safety culture which will improve the
condition of our workplaces and effectively communicate safety to our employees, contractors and visitors. Above all, we also aim to reduce workplace incidents which may have negative effects on our reputation and overall on our revenue.
In NASCON we are developing and implementing new HSE policies based on safety golden rules and health, safety, social and environment (HSSE) standards to manage our strategy to achieve our business objectives.
Our core HSE values are tied to People, Environment, Asset and Reputation (PEAR). These values will bring about a new approach to work, improve our good manufacturing practices (GMP), help transform the attitude of our employees, contractors, visitors and the way our competitors view us. It will give us an edge over other manufacturers of similar products in terms of insurance premium, legal suits, compensation and attraction of
investors.
To keep our strategic objectives on track, we set targets on key performance indicators (KPI’s) that will be dependent on the core values of our business and expectation of our shareholders. A sound technical HSE professional team has been set up to champion the responsibilities of overseeing the performance and improvement plan of HSE across the group. For proper evaluation and management of our occupational hazards we are committed to continuous improvement of the way we manage our workplace hazards and observe compliance with legal and regulatory requirements that govern the land.
Our HSE personnel conduct regular pre-engagement health assessment, inductions of new employees and transferred employees with the aim of ensuring that all staff are medically fit to work and understand the inherent hazards associated with our business
Health, Safety and Environment
34N a s c o n A l l i e d I n d u s t r i e s P L C A n n u a l R e p o r t 2 0 1 7
upon resumption
We carry out regular internal audits and inspections on our occupational health and safety management systems, equipment and in addition report all incidents with the aim of identifying root causes and put measures in place to avoid reoccurrences. Furthermore, external audits and inspections are carried out by industry regulators as well as certification bodies.
We encourage incident reporting with a system in place to record and investigate all reported incidents. The findings and recommendations are submitted to executive management and Board of Directors to ensure that health and safety measures are taken seriously across the business and incidents are reduced to as low as reasonably practicable.
All staff at different levels are encouraged to report any concerns with senior
management executives regarding occupational health and safety. On site, we have medical facilities as well as competent medical staff and an operational site ambulance available for emergency evacuations. More so, regular drills are conducted with the aim of testing the effectiveness and functionality of our emergency facilities and preparedness of workers in the event of an emergency. Quarterly site HSE meetings are conducted where various HSE lectures are delivered, awareness on safety issues and learning from incidents (LFI’s) are cascaded and awards and recognition of persons based on good safety practices are rewarded.
Fleet Safety Management The fleet team plays a very significant operational role in the business which cannot be over emphasized. In NASCON, we realize the importance of the fleet team in realizing the overall objective of the business. We also put into consideration
the operational risks associated with the department and its management system and we are committed to the reduction of road traffic accidents (RTA).
HSE department collaborates closely with the fleet team to increase their awareness on road safety, high way codes and defensive driving techniques. We further conduct daily truck inspections to ensure truck’s road worthiness, reduce road accidents and delay in product delivery time. We engage our truck drivers on monthly safety pep-talks and quarterly driver’s performance recognition performance awards to encourage safe driving. In addition, pre-trip briefings are conducted for truck drivers and the state of their health is also considered prior to any journey. This is done to ensure that all truck drivers are fit to work and are reminded of the rules governing driving for NASCON
We closely supervise our contractors and ensure
Health, Safety and Environment
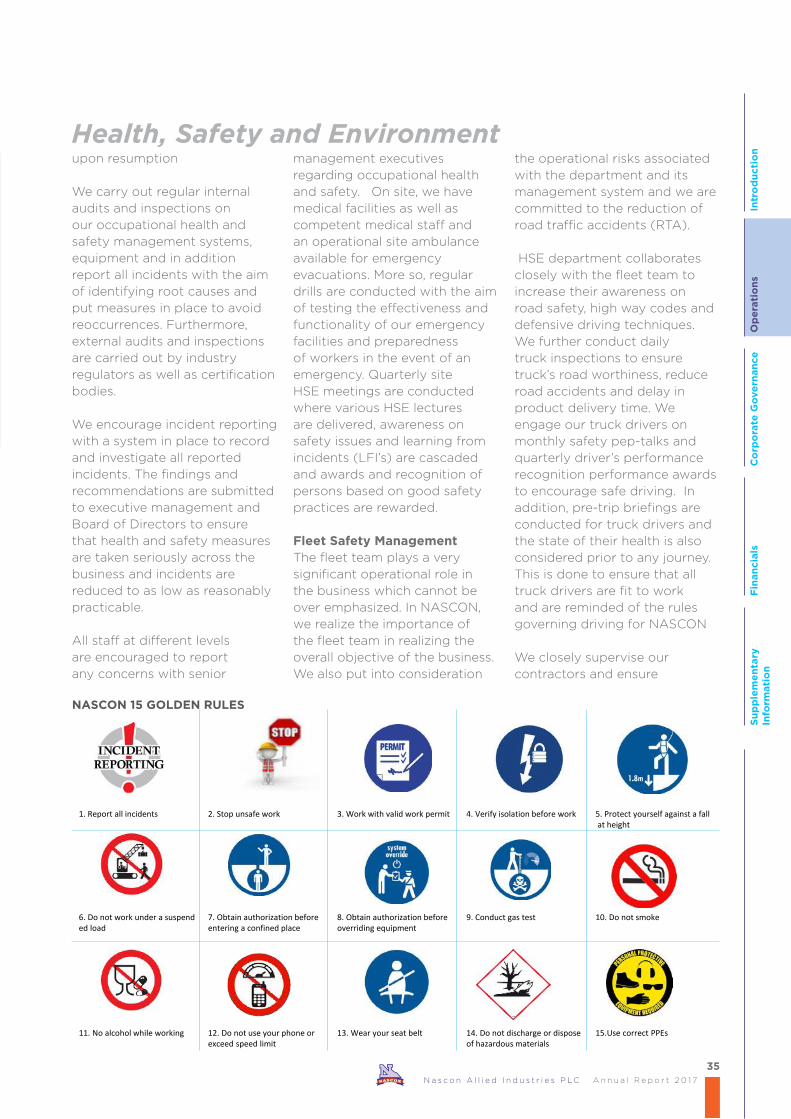
1. Report all incidents 2. Stop unsafe work 3. Work with valid work permit 4. Verify isolation before work 5. Protect yourself against a fallat height
6. Do not work under a suspended load
7. Obtain authorization beforeentering a confined place
8. Obtain authorization beforeoverriding equipment
9. Conduct gas test 10. Do not smoke
11. No alcohol while working 12. Do not use your phone orexceed speed limit
13. Wear your seat belt 14. Do not discharge or dispose of hazardous materials
15.Use correct PPEs
NASCON 15 GOLDEN RULES
Su
pp
lem
en
tary
In
form
ati
on
Intr
od
ucti
on
Op
era
tio
ns
Co
rpo
rate
Go
ve
rnan
ce
Fin
an
cia
ls
35N a s c o n A l l i e d I n d u s t r i e s P L C A n n u a l R e p o r t 2 0 1 7

safety procedures are not compromised in their activities. For every contract awarded we conduct a pre-job meeting and induction for contractor personnel and pre-mobilization of equipment before site mobilization and ensure appropriate personal protective equipments (PPE’s) are worn. Contractor sites are regularly inspected and all unsafe acts and conditions are identified, reported and ensured they are closed out to promote a safe workplace.
OUR ENVIRONMENTNASCON trusts in a robust environmental management system geared towards reducing the effect of climate change. It is noteworthy to state that salt dust contributes to climate change and global warming effects, we take necessary steps to avoid salt dust into the environment. This also helps to avoid legal challeneges and reputation damages from our host communities. This, if not well managed could attract legal challenges from our host communities and therefore affect our reputation. This is why we are committed to the implementation of ISO 14001:2015 Environmental Management System (EMS) which is a systematic approach to management of environment within the scope of our operations.
We conduct external Environmental Assessment Report (EAR) and its outcome informs areas of improvement of dust emission and noise. We comply with local and international standards by applying for environmental permits from state- owned and federal environmental agencies.
The environment and e-waste policies which have been endorsed by the Managing Director are effectively communicated and circulated to both staff and contractors. These policies are reviewed every three (3) years or as at when necessary for continuous improvement, thereby setting and reviewing environmental objectives and targets.
HAZARD EFFECT MANAGEMENT PROCESS (HEMP) TOOLThis is a structured set of controls for managing safety in the business to ensure and to demonstrate that business objectives are met.
Risk Management Standard: This standard considers the activities of employees and contractors conducting routine and non-routine activities, as well as the production services provided by their operation within NASCON.
Risk = Likelihood x Severity: The consequences of a specific / particular hazard being released and the likelihood of it happening.
Risk control effectiveness (Traffic Light System)INCIDENT REPORTING AND INVESTIGATION STANDARD: This standard is to describe the arrangement and requirement for reporting, classification, escalation and investigation of occupational HSE incidents across NASCON. Closure and communication of incidents is crucial to enable NASCON understand the effectiveness of risk management program and to ensure that employees learn lessons so as to avoid future reoccurrences
The essential steps for incident reporting and investigation are made up of four processes:1. Incident Notification: All
incidents shall be reported using the NASCON risk observation card / channeled in a timely manner based on severity of occurrence.
2. Incident classification/escalation/reporting alert: Incidents are classified as near misses or accidents and then risk level is determined
3. Investigation: An investigation team is set up comprising of several staff of NASCON based on the severity of the incident. More critical cases or those involving fatalities are investigated by upper management staff or management executives, while managers and team heads are part of the investigation team in other less critical incidents. Every investigation process involves witnesses’ statements and pictures, where necessary.
4. Communication of lesson learnt: This is carried out after all investigations have been reviewed by management executives. Findings and recommendations are generated and further cascaded to all staff through Learning From Incidents (LFI) and safety alerts. The aim of this process is to ensure that all employees are aware of the incident and have the knowledge of actions to take to prevent further recurrence.
HSE PERFORMANCE REPORTING STANDARD:This management tool ensures NASCON keeps track and regularly report on the
Health, Safety and Environment
36N a s c o n A l l i e d I n d u s t r i e s P L C A n n u a l R e p o r t 2 0 1 7
performances of the HSE key performance indicators (KPI’s) in order to support the business decision making process. The KPI’s are grouped into two; Leading and Lagging indicators
Lagging indicators are mandatory and are reactive in nature such as fatality, Lost Time Incidents (LTI’s), recordable injuries, occupational illnesses and near misses etc. These shall be monitored, documented and reported bi-monthly and quarterly to executive management and board of directors. They shall be further subjected to rigorous investigation to identify the root causes and cascaded to all staff to avoid recurrence.
Leading indicators, on the other hand are recommended, despite not being mandatory. Leading indicators are monitored, collected, documented and reported to management on a monthly basis for management review and if necessary for adoption of proper corrective actions.
The leading indicators include HSE meetings, unsafe acts and conditions, observations, golden rules violation, HSE trainings, Fire response readiness, drills, audits and inspections, etc
To effectively manage safety on site, we established a close relationship with the operations and fleet teams for adequate supervision of their activities, training of their personnel and ensuring that safety procedures are followed. These initiatives has led to an increase in compliance to Personal Protective Equipment (PPE), infrastructural renovations, identification and reporting of unsafe acts and conditions on site and the overall safety culture of staff has greatly improved.
2017 HIGHLIGHTS • Hiring of Head HSE and 5
new HSE professionals.• Implementation of new HSE
policies. • Development and
implementation of new safe system of work procedures (Permit to work, Job safety
analysis, safety operational procedures).
• Implementation of Safety pre-job meetings and induction of contractors personnel.
• Implementation of site HSE quarterly meeting.
• Implementation of safety Management committee monthly meeting.
• Implementation of monthly Management site safety tour.
• Commenced site HSE hazard tracking and report to executive management.
• Implementation of safety recognition and rewarding program.
• Full implementation of NASCON 15 Golden Rules.
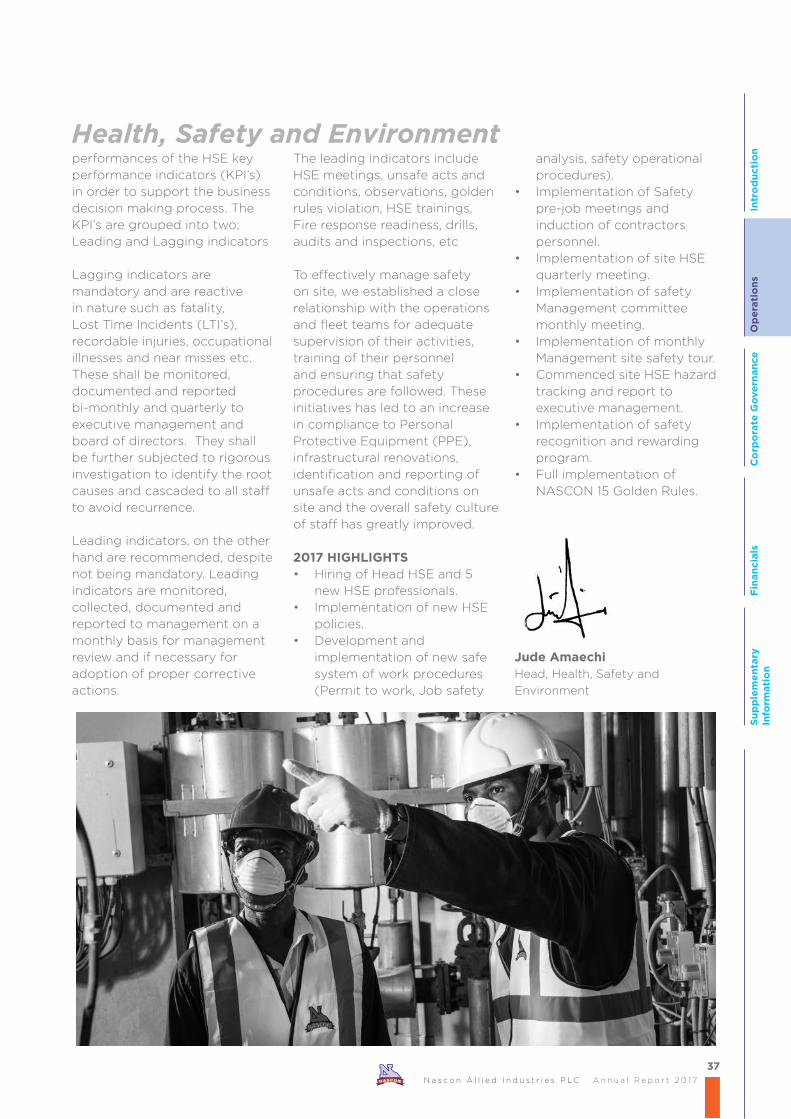
Jude AmaechiHead, Health, Safety and
Environment
Health, Safety and Environment
Su
pp
lem
en
tary
In
form
ati
on
Intr
od
ucti
on
Op
era
tio
ns
Co
rpo
rate
Go
ve
rnan
ce
Fin
an
cia
ls
37N a s c o n A l l i e d I n d u s t r i e s P L C A n n u a l R e p o r t 2 0 1 7


CorporateGovernance

Corporate Governance Report
“We took many steps to further improve our
governance and to propel NASCON to greater heights.
I am dedicated to continue driving good corporate
governance practices and structures.”
General informationNASCON Allied Industries Plc is committed to best practice and procedures in corporate governance. The corporate governance practices are constantly under review, in line with dynamics of the business environment. There was considerable focus on the company’s corporate governance practices especially at the Board level during the year.
The Corporate Governance policies adopted by the Board of Directors are designed to ensure that the Company’s business is conducted in a fair, honest and transparent manner which conforms to high ethical standards. The Board delegates the day-to-day running of the Company’s affairs to the Managing Director/Chief Executive Officer supported in this task by an Executive Management Committee. The Board of Directors consists of 10 members; the Chairperson, 2 Executive Directors and 7 Non-Executive Directors out of which 3 are Independent. They are:‘Yemisi Ayeni ChairpersonPaul Farrer Executive DirectorFatima Aliko-Dangote Executive DirectorOlakunle Alake DirectorHalima Aliko-Dangote DirectorAbdu Dantata DirectorSada Ladan-Baki DirectorChris Ogbechie Independent DirectorKnut Ulvmoen DirectorFatima Wali-Abdurrahman Independent Director
ComplianceNASCON is committed to compliance with
the requirements of the Nigerian corporate governance regulations, which include but are not limited to the Securities and Exchange Commission’s Code of Corporate Governance for Public Companies in Nigeria and the Companies and Allied Matters Act.
Responsibilities of the Board of DirectorsIt is the responsibility of the Board of NASCON Allied Industries Plc to:• Ensure integrity of the Company’s financial and
internal control policies.• Ensure the accurate, adequate and timely
rendition of statutory returns and financial reporting to the regulatory authorities (Nigerian Stock Exchange, Corporate Affairs Commission, Securities and Exchange Commission) and shareholders.
• Ensure value creation for shareholders, employees and other stakeholders.
• Review and approve corporate policies, strategy, annual budget and business plan
• Monitor implementation of policies and the strategic direction of the Company.
• Set performance objectives, monitor implementation and corporate performance.
• Review and approve all major capital expenditure of the Company.
• Ensure that the statutory rights of shareholders are protected at all times.
Meeting of the Board of DirectorsThe Board of Directors holds several meetings in the year to consider important corporate
40N a s c o n A l l i e d I n d u s t r i e s P L C A n n u a l R e p o r t 2 0 1 7

Corporate Governance Reportevents and actions such as approval of corporate strategy, annual corporate plan, review of internal risk management and control systems, review performance and direct the affairs of the Company, its operations, finance and formulate growth strategies.
Record of Directors’ meetingsAttendance at Directors’ meetings is impressive. In line with provisions of Section 258(2) of the Companies And Allied Matters Act Of Nigeria, Cap C20 Lfn 2004, the record of Directors attendance at Board meetings is available for inspection at the Annual General Meeting.
Board meeting attendance:The Committee held seven (7) meetings in 2017‘Yemisi Ayeni 7/7Paul Farrer 7/7Fatima Aliko-Dangote 7/7Olakunle Alake 7/7Halima Aliko-Dangote* 5/7Abdu Dantata 7/7Sada Ladan-Baki** 5/7Chris Ogbechie 6/7Knut Ulvmoen 7/7Fatima Wali-Abdurrahman 7/7*Halima Aliko-Dangote was on an approved leave of absence.**Sada Ladan-Baki was on approved work assignment with a related party company.
Key activities of the Board:• The board carried out an extensive review of
the company’s short and long term strategy, culminating in a detailed strategic plan.
• Consideration reports of the Board Committees with recommendations for approval.
• The Board considered the quarterly unaudited financial reports and audited full year reports and proposed a dividend.
• Financing requirements for rehabilitation and full automation of the salt refinery.
• Operational performance, marketing strategy and report on business and projects.
• Risk Management objectives and implementation.
Board CommitteesThe Board delegated some of its responsibilities to standing committees that consists of Executive Directors and Non-Executive Directors. These are the Establishment and General Purpose and Finance, Risk and Audit Committees. The
Committees report to the Board of Directors on their activities and decisions which are ratified by the full Board, at a meeting.
In compliance with the practices of good corporate governance, the Chairman of the Board is not a member of either of these committees.
The Finance, Risk and Audit CommitteeThe Finance, Risk and Audit Committee is responsible for monitoring the integrity of the financial statements of the Company. It also assesses and monitors all risks associated with the operations of the Company, developing and monitoring the implementation of Internal Control System, by Management. The Committee assists the Board in its responsibility relating to the oversight of the Company’s financial credit and risk management policies and procedures.
The Committee is comprised of seven (7) Directors: Chris Ogbechie ChairmanPaul Farrer MemberFatima Aliko-Dangote MemberOlakunle Alake MemberHalima Aliko-Dangote MemberAbdu Dantata MemberSada Ladan-Baki Member
Key matters of the committee:• Reviewed the 2016 annual reports and
accounts• Reviewed the 2017 quarterly financial reports• Reviewed the critical accounting policies
applied in the preparation of the financial statements
• Reviewed the reports on key operational risks and the related controls and processes to manage and mitigate said risks
Finance, Risk and Audit Committee attendance:The Committee held five (5) meetings in 2017Chris Ogbechie 5/5Paul Farrer 5/5Fatima Aliko-Dangote 5/5Olakunle Alake 5/5Halima Aliko-Dangote* 2/5Abdu Dantata 5/5Sada Ladan-Baki** 4/5*Halima Aliko-Dangote was on an approved leave of absence.**Sada Ladan-Baki was on approved work assignment with a related party company.
41N a s c o n A l l i e d I n d u s t r i e s P L C A n n u a l R e p o r t 2 0 1 7
Su
pp
lem
en
tary
In
form
ati
on
Intr
od
ucti
on
Op
era
tio
ns
Co
rpo
rate
Go
ve
rnan
ce
Fin
an
cia
ls
The Establishment and General Purpose CommitteeThe Committee is responsible for reviewing the policy framework for employee and remuneration issues. The Committee also institutes a transparent procedure for the appointment of new Directors to the Board of Directors and recommendation to the Board regarding the tenures and the re-appointment of Directors.
The committee is comprised of five (5) Directors:Knut Ulvmoen ChairmanPaul Farrer MemberFatima Aliko-Dangote MemberHalima Aliko-Dangote MemberFatima Wali-Abdurrahman Member
Key matters of the committee:• Considered the proposed new organizational
and salary structure, including new positions and portfolios
• Considered the controls and procedures for monitoring staff and IT output quality
Establishment & General Purpose Committee attendance:The Committee held four (4) meetings in the year Knut Ulvmoen 4/4Paul Farrer 4/4Fatima Aliko-Dangote 4/4Halima Aliko-Dangote* 0/4Fatima Wali-Abdurrahman 4/4*Halima Aliko-Dangote was on an approved leave of absence.
The Statutory Audit CommitteeThe Committee is made up of six (6) members, three (3) representatives of Shareholders and three (3) members of the Board of Directors. The members are elected annually at General Meetings. The Committee, in compliance to the requirement of good corporate governance practices is chaired by a representative of the Shareholders and include:Okey Nwuke Chairman/ShareholderUmar Farouk ShareholderKudaisi Ayodele Sarat ShareholderHalima Aliko-Dangote DirectorAbdu Dantata DirectorChris Ogbechie Director
Statutory Audit Committee attendance:The committee held five (5) meetings in 2017Okey Nwuke 5/5Umar Farouk 5/5
Kudaisi Ayodele Sarat 5/5Halima Aliko-Dangote* 4/5Abdu Dantata 5/5Chris Ogbechie 3/5*Halima Aliko-Dangote was on an approved leave of absence.
Key matters of the committee:• Ensured the independence and objectivity of
the Audit.• Reviewed the adequacy and effectiveness of
NASCON Allied Industries’ internal control policies prior to endorsement by the Board.
• Directed and supervised investigations into matters within its scope, such as evaluation of the effectiveness of NASCON Allied Industries’ internal controls.
In addition to the above stated responsibilities, the Committee carries out all such other functions as stipulated by the Companies and Allied Matters Act of Nigeria, CAP C20 LFN 2004.
Code of Business Conduct and Code of Governance for DirectorsThe Company has a code of business conduct, which is applicable to all employees and Directors. Mindful of our reputation, we have zero tolerance to all forms of unethical behavior including bribery and corruption. The policy is designed to promote a culture of honesty and accountability. It also provides guidance on mechanisms to report unethical conduct.
Whistle Blowing Policy We continually strive to create a work environment where employees, contract workers, vendors, service providers, customers and other stakeholders have the opportunity to make confidential disclosures on misconduct, irregularities or malpractice, without fear of harassment and/or victimization and with the assurance that their concerns will be taken seriously, investigated, and appropriate action will be taken.
In line with Section 32 of the SEC Code and international best practice in Corporate Governance, the Board has established a Whistle Blowing Policy to enable staff, in confidence, raise concerns about possible improprieties in financial and other matters and to do so without fear of reprisal, provided that such concerns are raised in good faith.
Corporate Governance Report
42N a s c o n A l l i e d I n d u s t r i e s P L C A n n u a l R e p o r t 2 0 1 7

Corporate Governance ReportEmployees and other stakeholders are encouraged to report incidents of misconduct in a confidential and anonymous manner through the internal reporting channels (i.e. Line Manager, Head of Department, and CEO) and/or the outsourced KPMG Ethics Line.
The Board subscribed to the KPMG Ethics Line to strengthen confidence in our Whistle Blowing Policy. The KPMG Ethics Line contact details are: 0703 000 0026, 0703 000 0027, 0808 822 8888, 0708 060 1222, 0809 993 6366 or [email protected].
The Board has delegated oversight over whistle blowing to the Finance, Risk and Audit Committee. All matters reported are investigated and reported to the Committee including the action taken.
Insider Trading PolicyIn accordance with Section 14 of the Nigerian Stock Exchange Amended Listing Rules, the Board has put in place a Security Trading Policy which applies to all Directors and Employees and also to those who may at any time possess, any insider or material information about the Company.
The Security Trading Policy as endorsed by the Board is in substantial conformity with the standard set out in Section 14 of the Amended Listing Rules.
Accordingly, it is hereby confirmed that, after specific inquiries of all the Directors of the Company, they have all confirmed their compliance with the Policy in the period before the Company results were announced for the 2017 financial year.
There is no case of non-compliance with the Policy. Furthermore, the compliance of the Company Directors with the listing rules and the anti-insider trading policy will continue to be disclosed in the Company’s quarterly and other financial reports.
Complaints managementThe Company has adopted a complaints management policy in accordance with the requirements of the Securities and Exchange Commission’s rules relating to the Complaints Management Framework of the Nigerian Capital Markets.
Shareholders can direct any complaints or enquiries to the Company Secretariat or to the Registrars, depending on the nature of complaint. Our policy is to acknowledge receipt of the complaint within 48 hours and respond/resolve the query within 10 working days of receipt.
Annual General Meeting (AGM)The AGM is the principal opportunity for the Board to meet shareholders and explain the Company’s progress and to answer any questions raised. The Notice of AGM is dispatched to all shareholders and published in two leading national newspapers and on our website, at least 21 working days before the AGM is held.
The Board and senior management team of the Company are available for discussions with shareholders before the Annual General Meeting. The Chairmen of the Committees and myself are also available to answer shareholders’ questions during formal proceedings of the Annual General Meeting.
The Annual General Meeting to discuss this 2017 Annual Report will be held at the Civic Centre, Victoria Island, Lagos, at 11.00am on 3rd May 2018.
Conflict of Interest and related-party transactionsThe Board maintains procedures to ensure that related-party transaction and potential conflicts of interest are identified, disclosed and managed. Details of the related-party transactions during the year is set out on page 102.
Shareholders’ Interest and RelationsThe Board ensures the protection of the statutory and general rights of shareholders at all times particularly their rights to vote at the general meetings. All shareholders, regardless of volume of shareholding or social status are treated equally. The Company has an Investor Relations team that manages effective two-way communications with our investors.
‘Yemisi AyeniChairperson
43N a s c o n A l l i e d I n d u s t r i e s P L C A n n u a l R e p o r t 2 0 1 7
Su
pp
lem
en
tary
In
form
ati
on
Intr
od
ucti
on
Op
era
tio
ns
Co
rpo
rate
Go
ve
rnan
ce
Fin
an
cia
ls


Okey Nwuke (c)Umar FaroukKudaisi Ayodele SaratHalima Aliko-DangoteAbdu DantataChris Ogbechie
Statutory Audit Committee
‘Yemisi Ayeni (c)Paul FarrerFatima Aliko-DangoteOlakunle AlakeHalima Aliko-DangoteAbdu DantataSada Ladan-BakiChris OgbechieKnut UlvmoenFatima Wali-Abdurrahman
Knut Ulvmoen (c)Paul FarrerFatima Aliko-DangoteHalima Aliko-DangoteFatima Wali-Abdurrahman
Chris Ogbechie (c)Paul FarrerFatima Aliko-DangoteOlakunle AlakeHalima Aliko-DangoteAbdu DantataSada Ladan-Baki
Paul Farrer (c)Fatima Aliko-Dangote Aderemi SakaGerhard ScheepersOlushola ShosanyaRabiu MohammedOlusegun AjalaNura ShuaibuRabi AdamuShalom OkonmahPatrick MogahaAdewale AkinwaleJude AmaechiTunde IwamofeAdedayo Samuel
Finance, Audit and Risk Committee
Management Committee
Establishment and General Purpose Committee
Board of Directors
Board & Committee Structure
10members
5members
7members
6members
15members
(c) denotes Chairperson
The Management Committee and Statutory Audit Committee are not Committees of the Board
45N a s c o n A l l i e d I n d u s t r i e s P L C A n n u a l R e p o r t 2 0 1 7
Su
pp
lem
en
tary
In
form
ati
on
Intr
od
ucti
on
Op
era
tio
ns
Co
rpo
rate
Go
ve
rnan
ce
Fin
an
cia
ls

Board of Directors
Abdu DantataFatima Wali-Abdurrahman
Paul Farrer
Chris Ogbechie
Fatima Aliko-Dangote
Board of Directors
46N a s c o n A l l i e d I n d u s t r i e s P L C A n n u a l R e p o r t 2 0 1 7

Halima Aliko-Dangote Knut Ulvmoen
Olakunle Alake
Sada Ladan-Baki
‘Yemisi Ayeni
47N a s c o n A l l i e d I n d u s t r i e s P L C A n n u a l R e p o r t 2 0 1 7

Board Profile
‘Yemisi Ayeni I Chairperson
‘Yemisi is the immediate past Managing Director, Shell Nig. Closed Pension Fund Administrator
Ltd, a position she held for 10 years. She was also a Council Member of the Nigerian Stock
Exchange and was recently appointed as a Non-Executive Director on the Board of Stanbic-
IBTC Pension Managers Ltd., and an Executive Board Member of Women in Management
and Business (WIMBIZ). A graduate of Economics (Specialising in Accounting and Business
Finance) from the University of Manchester, UK, she is also a member of the Institute of
Chartered Accountants in England and Wales. She started her career with Price Waterhouse,
London in 1985, relocated to their Lagos office in 1991 and joined Shell Nigeria in 1994. She
held a wide variety of roles in various Shell companies, including her being Finance Director
of SNEPCo.
Paul Farrer I Managing Director
Paul joined NASCON as Managing Director in 2015, having previously been the Chief Operating
Officer and Group Executive Director of Food Concepts Plc.
His experience in the foods business spans 20 years in the South and West African markets; in
international companies such as TGI Fridays (Americana Group), Steers Holdings – Debonairs
Pizza, Famous Brands and Innscor International.
He is an alumnus of East London Technical College, South Africa.
Fatima Aliko-Dangote I Executive Director, Commercial
Fatima joined the Dangote Group in 2014 as the Special Assistant to the Managing Director-
Cement and later worked as a Group Corporate Strategy Specialist. In this latter role, she
provided planning and analytical support across all the Business Units of the Dangote Group.
She holds a Bachelor’s degree in Law from the University of Surrey in the UK. Fatima has
been called to the Nigerian Bar, and has worked as an Associate at Banwo and Ighodalo Legal
Chambers, on areas related to capital markets, intellectual property, and energy.
She was appointed to the Board in 11th of March, 2016.
Olakunle Alake I Director
Olakunle is Chief Operating Officer of Dangote Industries. He was appointed to the Board
of Dangote Industries in 2001 and has since been instrumental to the growth of the parent
company and its subsidiaries.
He holds a Bachelor’s degree in Civil Engineering from Obafemi Awolowo University lle-Ife
(1983) and is a Fellow of the Institute of Chartered Accountants of Nigeria.
He joined Dangote Industries in 1990, after six years at PWC. He has held several management
positions in Dangote Industries, including Financial Controller and Head of Strategic Services.
He has deep finance and accounting experience and brings substantial experience in finance,
mergers and acquisitions to the Board.
Halima Aliko-Dangote I Director
Halima holds a Bachelor’s Degree in Marketing from the American Intercontinental University,
London, United Kingdom and a MBA from Webster Business School, London, also in the UK.
She started her career as a business analyst with KPMG Professional Services in Lagos, Nigeria,
before she joined Dangote Industries Limited in 2010. She has held a number of key roles at
Dangote Industries including Special Assistant to the President/Chief Executive.
She is currently the Executive Director in charge of Commercial activities at Dangote Flour
Mills. She resigned as Executive Director at NASCON in February 2016 but remains on the
Board as a Director.
Board of Directors
48N a s c o n A l l i e d I n d u s t r i e s P L C A n n u a l R e p o r t 2 0 1 7

Board Profile
Abdu Dantata I Director
Abdu is the Executive Director in charge of Logistics and Distribution for Dangote Industries
Limited, a position he has held since the Group was established more than 20 years ago. He is
also the Chairman of Agad Nigeria Limited, a trading and transportation Company operating
throughout Nigeria.
He is a fellow of the Nigerian Institute of Shipping. He brings his extensive experience in sales,
logistics and distribution to Board.
Sada Ladan-Baki I Director
Sada’s experience spans thirty years in public service and fund administration
He sits on the board of several companies and belongs to many professional associations
including the Institute of Logistics and Distribution (Chartered Fellow) and the Nigerian
Institute of Marketing (Chartered Member).
He is a graduate of Economics with an MBA from Ahmadu Bello University, Zaria.
Chris Ogbechie I Independent Director
Chris has wide experience in marketing, strategy and corporate governance derived from his
work as Head of Marketing/Sales at Nestle Nigeria and from his consulting work with Nigerian,
Ghanaian and Kenyan firms over the years. He is the Director of First bank Sustainability Centre,
Lagos Business School and Chairman, Board of Directors, Diamond Bank Plc.
He teaches strategy and corporate governance at the Lagos business School and Strathmore
Business School in Nairobi, Kenya. Chris has a first-class honours degree in Mechanical
Engineering from Manchester University, an MBA from Manchester Business School and a PhD
in Business Administration from Brunel Business School in the UK.
Knut Ulvmoen I Director
Knut joined Dangote in 1996 as the Finance Director. He is a management professional with
extensive background in finance and administration of multinational companies including
Revisor-Centret, Norcem Group, Bulkcem and Scancem.
He has been instrumental in moving the Group from import and trading into a manufacturing
conglomerate with tentacles across the African continent. He holds a Master’s of Science
degree in Business and is a Member of the Norwegian Association of Authorised Accountants.
Fatima Wali-Abdurrahman I Independent Director
Fatima is an architect, real estate developer and management professional. She is currently
the Chief Executive Officer of the Filmo Group and Deputy President of the Housing Finance
Professionals Association of Nigeria. She serves on the boards of NMRC (Nigeria Mortgage
Refinance Co.) and the Advisory Board of the Chapel Hill Denham Fund for Women. She
was recently appointed a member of the Board of Directors of the OANDO Foundation, is
a WIMBOARD Lead Ambassador (WIMBIZ Initiative) and a member of the Presidential
Committee for Flood Relief and Rehabilitation. A graduate of both Architecture and Urban
Studies from the University of Minnesota, U.S.A., she holds a M.Sc. (Arch.) in Economics and
Management of Construction from the University of London
Board of Directors
49N a s c o n A l l i e d I n d u s t r i e s P L C A n n u a l R e p o r t 2 0 1 7
Su
pp
lem
en
tary
In
form
ati
on
Intr
od
ucti
on
Op
era
tio
ns
Co
rpo
rate
Go
ve
rnan
ce
Fin
an
cia
ls

Report of the Directors’
“The Board is satisfied that the Annual Report
represents a fair, balanced and realistic view of events
during the 2017 financial year.”
The Directors are pleased to submit their report together with the audited financial statements of the Company for the year ended December 31, 2017.
Having considered all the matters reviewed and brought before the Board, the Board is satisfied that the Annual Report represents a fair, balanced and realistic view of events during the 2017 financial year.
Directors’ ResponsibilitiesThe Directors are responsible for the preparation of the financial statements which give a true and fair view of the state of affairs of the Company in accordance with Companies And Allied Matters Act Of Nigeria, Cap C20 Lfn 2004.
In doing so, they ensure that:• proper accounting records are maintained;• applicable accounting statements are followed;• suitable accounting policies are adopted and
consistently applied;• judgments and estimates made are reasonable
and prudent;• the going concern basis is used, unless it is
inappropriate to presume that the Company will continue in business;
• internal control procedures are instituted which as far as is reasonably possible, safeguard the assets and prevent and detect fraud and other irregularities.
Legal formThe Company was incorporated on April 30, 1973 as a limited liability company. The shares are currently quoted on the Stock Exchange.
Principal ActivitiesThe principal activities of the company during the year include processing of Raw Salt into Refined, Edible and Industrial Salts. The company also produced Seasoning Vegetable Oil.
Business ReviewThe Business Review comprises of the following, each of which are incorporated by reference into, and forms part of this Report of the Directors:• Chairperson’s Statement on page 9• MD Review on pages 14 - 15• CFO Review on pages 16 - 19• Corporate Governance Report on pages 40 - 43• Risk Management Report on pages 28 - 32• HSE Report on pages 34 - 37• Human Resources Report on pages 26 - 27
Results of the Year and DividendTotal revenue of the Company increased to ₦27.06 billion {2016: ₦18.29 billion}. Profit for the year also increased to ₦5.34 billion {2016: ₦2.42 billion}. Proposed final dividend for 2017 is ₦3.97 billion.
Unclaimed DividendsThe total amount outstanding as at 31 December, 2017 is ₦566.75million. A summary of the report
50N a s c o n A l l i e d I n d u s t r i e s P L C A n n u a l R e p o r t 2 0 1 7

Report of the Directors’is on page 108. The list of unclaimed dividends is available on the company website - www.nasconplc.com. The company notes that some dividend warrants have remained unclaimed, therefore all shareholders with unclaimed dividends should address their claims to the Registrars - Meristem Registrars and take advantage of the e-dividend by completing the form included in page 114.
DirectorsThe appointment, removal or re-appointments of Directors is governed by the Company’s Articles of Association and the Companies and Allied Matters Act (CAMA) LFN 2004. These documents also set out the rights and obligations of the Directors. NASCON Allied Industries Plc. as at the date of this report, has ten (10) Directors. Their biographies are contained in pages 48 to 49.
The Directors of the company during the year and to the date of this report are as follows:‘Yemisi Ayeni ChairpersonPaul Farrer Managing DirectorFatima Aliko-Dangote Executive DirectorOlakunle Alake DirectorHalima Aliko-Dangote DirectorAbdu Dantata DirectorSada Ladan-Baki DirectorChris Ogbechie DirectorKnut Ulvmoen DirectorFatima Wali-Abdurrahman Director
Rotation of DirectorsBy virtue of Section 259 (1) & (2) of the Companies And Allied Matters Act Of Nigeria, Cap C20 Lfn 2004, one-third of the Directors of
the Company who have been longest in office since their last election shall retire from office and in accordance with this section, Olakunle Alake, Halima Aliko-Dangote and Chris Ogbechie are retiring by rotation and being eligible, offer themselves for re-election.
No Directors’ has a service contract not determinable within five years.
Director’ InterestsThe Directors’ interests in the issued share capital of the Company as recorded in the register of members and/or as notified by them for the purpose of Section 275 of the Companies and Allied Matters Act of Nigeria, Cap C20 LFN 2004, are as follows in the table below.
Substantial interest in sharesThe Registrar has advised that according to the Register of Members on December 31, 2017, Dangote Industries Limited with 1,647,763,557 ordinary shares of 50k each and Stanbic IBTC Nominees Limited with 153,347,537 ordinary shares of 50k each held more than 5% of the issued share capital of the Company.
Free FloatAll shares other than shares held by Dangote Industries Limited are considered to be free float shares. The current free float is 37.81%.
Share Capital HistoryAll issued shares are fully paid and no additional shares were issued in 2017. Details of the share capital history are set out on page 109.
Directors Shareholding
As at December 31, 2016
As at December 31, 2017
As at March 31, 2018
(a) ‘Yemisi Ayeni - - -
(b) Paul Farrer - - -
(c) Fatima Aliko-Dangote - - -
(d) Olakunle Alake 4,170,000 4,419,959 4,419,959
(e) Halima Aliko-Dangote - - -
(f) Abdu Dantata 2,000,000 2,000,000 2,000,000
(g)Sada Ladan-Baki 2,758,673 1,197,694 1,197,694
(h) Knut Ulvmoen - - -
(i) Chris Ogbechie - - -
(j) Fatima Wali Abdurrahman - - -
51N a s c o n A l l i e d I n d u s t r i e s P L C A n n u a l R e p o r t 2 0 1 7
Su
pp
lem
en
tary
In
form
ati
on
Intr
od
ucti
on
Op
era
tio
ns
Co
rpo
rate
Go
ve
rnan
ce
Fin
an
cia
ls
Report of the Directors’
Corporate Governance• The Company is committed to the best
practice and procedures in corporate governance. Its business is conducted in a fair, honest and transparent manner which conforms to high ethical standards.
• Members of the Board of Directors hold quarterly meetings to decide on policy matters and direct the affairs of the Company, review its performance, its operations, finance and formulate growth strategy. Attendance at Directors’ meetings is impressive.
• In line with provisions of section 258(2) of the Companies and Allied Matters Act of Nigeria, Cap C20 LFN 2004, the record of Directors’ attendance at Boarding Meetings is available for inspection at the Annual General Meeting.
• The remuneration of the Executive Directors is fixed.
• The Board of Directors consists of 10 members; The Chairperson, 2 Executive Directors and 7 Non-Executive Directors out of which 3 are Independent.
• Appointment to the Board is made by shareholders at the Annual General Meeting upon retirement of a Director.
• The Board, from time to time, routinely empowers committees to examine and deliberate on finance and establishment related issues.
Non-current assetsMovements in Property, Plant and Equipment during the year are shown in Note 19 to the financial statements. In the opinion of the Directors, the market value of the company’s properties is not less than the value shown in the financial statements.
Events after the reporting periodThere were no significant developments since the balance sheet date which could have had a material effect on the state of affairs of the Company as at December 31, 2017 and the profit for the year ended on that date, which have not been adequately recognized.
Company DistributorsThe company’s products are distributed by distributors in 50kg bags across the country, who redistribute to wholesalers, confectioners, supermarkets and retailers. Salt retail packs come in various sizes of 250g, 500g and 1kg and are sold under the brand name “Dangote Refined Salt”. Seasoning is sold under the brand name “Dan-Q”, and Vegetable Oil sold as “Dangote Vegetable Oil”.
SuppliersThe Company obtains its materials at arm’s length basis from overseas and local suppliers. Amongst our main overseas and local suppliers are Salinor, from who we purchase raw salt and Dangote Agrosacks Limited, who provides us with packaging.
DonationsNo donations were made in 2017 as all CSR activities are carried out by Dangote Foundation on behalf of the companies within the Dangote Group.
Analysis of shareholdings
Analysis of shareholdings as at December 31, 2017
Range No. of Holders Percent Units Percent1 - 1000 20,651 61.67% 8,182,500 0.31%
1001 - 5000 6,306 18.83% 15,757,221 0.59%
5001 - 10000 2,184 6.52% 15,742,945 0.59%
10001 - 50000 3,202 9.56% 68,886,589 2.60%
50001 - 100000 516 1.54% 38,120,587 1.44%
100001 - 500000 474 1.42% 100,163,625 3.78%
500001 - 1000000 74 0.22% 53,796,107 2.03%
1000001 - 5000000 56 0.17% 110,542,941 4.17%
5000001 - 10000000 11 0.03% 73,453,074 2.77%
10000001 - ABOVE 13 0.04% 2,164,792,789 81.71%
33,487 100.00% 2,649,438,378 100.00%
52N a s c o n A l l i e d I n d u s t r i e s P L C A n n u a l R e p o r t 2 0 1 7

Report of the Directors’Audit committeeThe Company, pursuant to Section 359(3) of the Companies and Allied Matters Act of Nigeria, Cap C20 LFN 2004 has put in place a Statutory Audit Committee comprising three (3) shareholders and three (3) Directors as follows:
Okey Nwuke Chairman/ShareholderUmar Farouk ShareholderKudaisi Ayodele Sarat ShareholderHalima Aliko-Dangote DirectorAbdu Dantata DirectorChris Ogbechie Director
AuditorsMessers Deliotte & Touche (Chartered Accountants) have completed their ten years’ statutory period of audit as the Company’s
Auditors in accordance with SEC and FRCN regulations. A resolution will be proposed authorizing the Directors to appoint Price Waterhouse Coopers as the new Auditors and to fix their remuneration.
By Order of the Board
Adedayo A. SamuelCompany SecretaryFRC/2016/NBA/000000152911, Alfred Rewane Road,Falomo, Ikoyi, LagosNigeriaMonday, March 5, 2018
53N a s c o n A l l i e d I n d u s t r i e s P L C A n n u a l R e p o r t 2 0 1 7
Su
pp
lem
en
tary
In
form
ati
on
Intr
od
ucti
on
Op
era
tio
ns
Co
rpo
rate
Go
ve
rnan
ce
Fin
an
cia
ls

54N a s c o n A l l i e d I n d u s t r i e s P L C A n n u a l R e p o r t 2 0 1 7

Financials

Statutory Audit Committee ReportThis report is provided by the Audit Committee appointed in respect of the 2017 financial year of NASCON Allied Industries Plc.
1. Members of the Audit CommitteeThe Audit Committee is made up of six (6) members, three (3) representatives of Shareholders and three (3) members of the Board of Directors. Members of the Audit Committee are elected annually at General Meetings. The Committee in compliance to the requirement of corporate governance practice is chaired by a representative of the Shareholders and include:
Name PositionDr. Okey Nwuke Chairman/Shareholders’ RepresentativeDr. Umar Farouk Shareholders’ RepresentativeAlhaja Kudaisi Ayodele Sarat Shareholders’ RepresentativeMs. Halima Aliko Dangote DirectorAlhaji Abdu Dantata DirectorProfessor Chris Ogbechie Director
2. Meetings held by the Audit CommitteeThe committee held five scheduled meetings during 2017
Name 01/02/17 27/03/17 06/06/17 31/07/17 24/10/17
Dr. Okey Nwuke Yes Yes Yes Yes Yes
Dr. Umar Farouk Yes Yes Yes Yes Yes
Alhaja Kudaisi Ayodele Sarat Yes Yes Yes Yes Yes
Ms. Halima Aliko Dangote Yes Yes Yes Yes No
Alhaji Abdu Dantata Yes Yes Yes Yes Yes
Professor Chris Ogbechie Yes Yes Yes No No
3. Audit Committee ResponsibilitiesEnsuring the independence and objectivity of the Audit.
Reviewing the adequacy and effectiveness of NASCON Allied Industries Plc’s internal control policies prior to endorsement by the Board.
Directing and supervising investigations into matters within its scope, such as evaluation of the effectiveness of NASCON Allied Industries Plc’s internal controlst.
In addition to the above stated responsibilities, the Committee carries out all such other functions as stipulated by the Companies and Allied Matters Act of Nigeria, Cap C20 LFN 2004.
4. Insider Trading PolicyIn accordance with Section 14 of the Nigerian Stock Exchange Amended Listing Rules, the Board has put in place a Security Trading Policy which applies to all Directors and Employees and also to those who may at any time possess, any insider or material information about the Company.
The Security Trading Policy as endorsed by the Board is in substantial conformity with the standard set out in Section 14 of the Amended Listing Rules.
Accordingly, it is hereby confirmed that, after specific inquiries of all the Directors of the Company, they have all confirmed their compliance with the Policy in the period before the Company results were announced for the 2017 financial year.
There is no case of non-compliance with the Policy.
56N a s c o n A l l i e d I n d u s t r i e s P L C A n n u a l R e p o r t 2 0 1 7

Statutory Audit Committee ReportFurthermore, the compliance of the Company Directors with the listing rules and the anti-insider trading policy will continue to be disclosed in the Company’s quarterly and other financial reports.
5. External AuditorsIn accordance with the provisions of Section 359(6) of Companies and Allied Matters Act of Nigeria, CAP C20 LFN 2004, we have examined the Auditors’ report for the year ended December 31, 2017. We have obtained all the information and explanations we required.
In our opinion, the Auditors’ report is consistent with our review of the scope and planning of the Audit. We are also satisfied that the accounting and reporting policies of the Company are in accordance with legal requirements and agreed ethical practices.
Having reviewed the Auditors’ findings and recommendations in the Management letter, we are satisfied with Management’s response therein
Mr. Okey Nwuke Chairman, Statutory Audit CommitteeFRC/2017/ICAN/00000016523March 5, 2018
Members of the CommitteeDr Umar FaroukAlhaja Kudaisi Ayodele SaratMs. Halima Aliko DangoteAlhaji Abdu DantataProfessor Chris Ogbechie
57N a s c o n A l l i e d I n d u s t r i e s P L C A n n u a l R e p o r t 2 0 1 7
Su
pp
lem
en
tary
In
form
ati
on
Intr
od
ucti
on
Op
era
tio
ns
Co
rpo
rate
Go
ve
rnan
ce
Fin
an
cia
ls
Statements of Management’s Responsibilities for the Preparation and Approval of the Financial statements for the year ended December 31, 2017The Directors of NASCON Allied Industries Plc are responsible for the preparation of the Financial statements that give a true and fair view of the financial position of the Company as at December 31, 2017, and the results of its operations, statement of cash flows and changes in equity for the year ended, in compliance with International Financial Reporting Standards and in the manner required by Companies and Allied Matters Act of Nigeria, Cap C20 LFN 2004, the Financial Reporting Council Of Nigeria Act.
In preparing the consolidated Financial Statements, the Directors’ are responsible for:• properly selecting and applying accounting policies;
• presenting information, including accounting policies, in a manner that provides relevant, reliable,
comparable and understandable information;
• providing additional disclosures when compliance with the specific requirements in IFRSs are insufficient
to enable users to understand the impact of particular transactions, other events and conditions on the
Company’s financial position and financial performance; and
• making an assessment of the Company’s ability to continue as a going concern
The Directors’ are responsible for:
• Designing, implementing and maintaining an effective and sound system of internal controls throughout
the Company;
• Maintaining adequate accounting records that are sufficient to show and explain the Company’s
transactions and disclose with reasonable accuracy at any time the financial position of the Company, and
which enable them to ensure that the Financial Statements of the Company comply with IFRS;
• Maintaining statutory accounting records in compliance with the legislation of Nigeria and IFRS;
• Taking such steps as are reasonably available to them to safeguard the assets of the Company; and
preventing and detecting fraud and other irregularities.
The Financial Statements of the Company set out on pages 62 to 106, for the year ended December 31, 2017, were approved by the board on March 5, 2018
Signed on behalf of the Board of Directors By:
Professor Chris Ogbechie
Director
FRC/2015/IODN/0000011213
Paul Farrer
Managing Director
FRC/2016/IODN/0000015797
58N a s c o n A l l i e d I n d u s t r i e s P L C A n n u a l R e p o r t 2 0 1 7

Independent Auditor’s ReportTo the Shareholders of NASCON Allied Industries Plc
Opinion
We have audited the accompanying financial statements of NASCON Allied Industries Plc which comprise
the statement of financial position as at 31 December 2017, the statements of profit or loss and other
comprehensive income, statement of changes in equity, statement of cash flow for the year then ended, and
the notes to the financial statements including a summary of significant accounting policies.
In our opinion, the financial statements give a true and fair view of the financial position of NASCON Allied
Industries Plc as at 31 December 2017 and the financial performance and cash flows for the year then ended in
accordance with the International Financial Reporting Standards, the Companies and Allied Matters Act Cap
C20 LFN 2004 and the Financial Reporting Council of Nigeria Act, 2011.
Basis for OpinionWe conducted our audit in accordance with International Standards on Auditing (ISA). Our responsibilities
under those standards are further described in the Auditor’s Responsibilities for the Audit of the Financial
Statements section of our report.
We are independent of the Company in accordance with the requirements of the Institute of Chartered
Accountants of Nigeria Professional Code of Conduct and Guide for Accountants (ICAN Code) and other
independence requirements applicable to performing audits of financial statements in Nigeria. We have
fulfilled our other ethical responsibilities in accordance with the ICAN Code and in accordance with other
ethical requirements applicable to performing audits in Nigeria. The ICAN Code is consistent with the
International Ethics Standards Board for Accountants Code of Ethics for Professional Accountants (Parts A
and B).
We believe that the audit evidence we have obtained is sufficient and appropriate to provide a basis for our
opinion
Key Audit MattersKey audit matters are those matters that, in our professional judgment, were of most significance in our audit
of the financial statements of the current year. These matters were addressed in the context of our audit of the
financial statements as a whole, and in forming our opinion thereon, and we do not provide a separate opinion
on these matters.
Key Audit Matter Impairment of vegetable oil and tomato paste plants
How the matter was addressed in the audit
The Company commissioned the vegetable oil and
the tomatoes paste plants in 2015. These plants
have been idle since early 2016 due to the inability
of the Company to get raw material as a result of
Government legislation on import materials that
are not eligible for Foreign exchange.
Based on the above mentioned impairment
indicator, the Directors carried out impairment test
on the plants using discounted cash flow model in
line with the guidance contained in IAS 36.
In estimating the value in use of the plants, the
directors made some judgements and assumptions
as disclosed in Note 3.1.3 of the financial
statements.
In evaluating Directors’ impairment test, we carried out
substantive audit test on the Impairment analysis. We also
checked compliance with the requirements of IAS 36.
We carried out the following audit procedures:
• Reviewed the measurement methods used by the Company
and challenged the Directors’ decision to choose the
method used (Discounted cash flow model).
• Involved our internal experts in the review of the Directors
cash flows projection, Impairment analysis, related
assumptions and other supporting computations.
• Obtained and reviewed supporting documents and other
evidence provided to support the Directors’ future plans,
which were incorporated in the cash flows projection
Deloitte & ToucheCivic Towers, Plot GA 1, Ozumba Mbadiwe Avenue,
Victoria Island, Lagos, Nigeria
59N a s c o n A l l i e d I n d u s t r i e s P L C A n n u a l R e p o r t 2 0 1 7
Su
pp
lem
en
tary
In
form
ati
on
Intr
od
ucti
on
Op
era
tio
ns
Co
rpo
rate
Go
ve
rnan
ce
Fin
an
cia
ls

Impairment of vegetable oil and tomato paste plants (continued)
Independent Auditor’s Report
The result of the test showed that the assets were
not impaired.
Accordingly, for the purposes of our audit, we
have identified the impairment of vegetable oil
and tomatoes paste plants as matters requiring
significant audit attention due to the possibility
of the carrying value of the plants exceeding the
recoverable value.
As at the year end, the value of both plants included
in property plant and equipment balance disclosed
in Note 19 was N2.7billion.
• Analysed the future projected cash flows used in the
models to determine whether they are reasonable and
consistent with the current operating environment.
• Performed sensitivity analysis to assess the impact of any
changes in the assumptions and inputs.
Our audit review, including the review carried out by our
internal experts did not reveal any material misstatements.
Other InformationThe Directors are responsible for the other information. The other information comprises the Directors’ Report, Audit Committee’s Report, which we obtained prior to the date of this auditor’s report. The other information does not include the financial statements and our auditor’s report thereonOur opinion on the financial statements does not cover the other information and we do not express any form of assurance conclusion thereon
In connection with our audit of the financial statements, our responsibility is to read the other information and, in doing so, consider whether the other information is materially inconsistent with the financial statements or our knowledge obtained in the audit, or otherwise appears to be materially misstated.
Based on the work we have performed on the other information that we obtained prior to the date of this auditor’s report, if we conclude that there is a material misstatement of this other information, we are required to report that fact. We have nothing to report in this regard.
Responsibilities of the Directors for the Financial Statements The Directors are responsible for the preparation of the financial statements that gives true and fair view in accordance with International Financial Reporting Standards and the requirements of the Companies and Allied Matters Act CAP C20 LFN 2004, and for such internal control as the Directors determine is necessary to enable the preparation of financial statements that are free from material misstatement, whether due to fraud or error.
In preparing the financial statements, the Directors are responsible for assessing the Company’s ability to continue as a going concern, disclosing, as applicable, matters related to going concern and using the going concern basis of accounting unless the Directors either intend to liquidate the Company or to cease operations, or have no realistic alternative but to do so.
Auditor’s Responsibilities for the Audit of the Financial StatementsOur objectives are to obtain reasonable assurance about whether the financial statements as a whole are free from material misstatement, whether due to fraud or error, and to issue an auditor’s report that includes our opinion. Reasonable assurance is a high level of assurance, but is not a guarantee that an audit conducted in accordance with ISA will always detect a material misstatement when it exists. Misstatements can arise from fraud or error and are considered material if, individually or in the aggregate, they could reasonably be expected to influence the economic decisions of users taken on the basis of these financial statements.
60N a s c o n A l l i e d I n d u s t r i e s P L C A n n u a l R e p o r t 2 0 1 7

As part of an audit in accordance with ISA, we exercise professional judgment and maintain professional scepticism throughout the audit. We also:• Identify and assess the risks of material misstatement of the financial statements, whether due to fraud
or error, design and perform audit procedures responsive to those risks, and obtain audit evidence
that is sufficient and appropriate to provide a basis for our opinion The risk of not detecting a material
misstatement resulting from fraud is higher than for one resulting from error, as fraud may involve collusion,
forgery, intentional omissions, misrepresentations, or the override of internal control.
• Obtain an understanding of internal control relevant to the audit in order to design audit procedures that
are appropriate in the circumstances, but not for the purpose of expressing an opinion on the effectiveness
of the Company’s internal control.
• Evaluate the appropriateness of accounting policies used and the reasonableness of accounting estimates
and related disclosures made by the Directors.
• Conclude on the appropriateness of the Directors’ use of the going concern basis of accounting and based
on the audit evidence obtained, whether a material uncertainty exists relating to events or conditions
that may cast significant doubt on the Company’s ability to continue as a going concern If we conclude
that a material uncertainty exists, we are required to draw attention in our auditor’s report to the related
disclosures in the financial statements or, if such disclosures are inadequate, to modify our opinion Our
conclusions are based on the audit evidence obtained up to the date of our auditor’s report. However,
future events or conditions may cause the Company to cease to continue as a going concern.
• Evaluate the overall presentation, structure and content of the financial statements, including the
disclosures, and whether the Company’s financial statements represent the underlying transactions and
events in a manner that achieves fair presentation
We communicate with the audit committee and the Directors regarding, among other matters, the planned scope and timing of the audit and significant audit findings, including any significant deficiencies in internal control that we identify during our audit
We also provide the audit committee and Directors with a statement that we have complied with relevant ethical requirements regarding independence, and to communicate with them all relationships and other matters that may reasonably be thought to bear on our independence, and where applicable, related safeguards.
From the matters communicated with the audit committee and the Directors, we determine those matters that were of most significance in the audit of the financial statements of the current year and are therefore the key audit matters. We describe these matters in our auditor’s report unless law or regulation precludes public disclosure about the matter or when, in extremely rare circumstances, we determine that a matter should not be communicated in our report because the adverse consequences of doing so would reasonably be expected to outweigh the benefits derivable by the public from such communication.
Report on Other Legal and Regulatory Requirements In accordance with the Sixth Schedule of Companies and Allied Matters Act CAP C20 LFN 2004 we expressly state that:i) We have obtained all the information and explanation which to the best of our knowledge and belief were
necessary for the purpose of our audit.
ii) The Company has kept proper books of account, so far as appears from our examination of those books.
iii) The Company’s financial position and its statement of profit or loss and other comprehensive income are in
agreement with the books of account and returns.
Ijeoma Onwu, FCA - FRC/2013/ICAN/00000001364
For: Deloitte & Touhe
Chartered Accountants
Lagos, Nigeria
8 March, 2018
Independent Auditor’s Report
61N a s c o n A l l i e d I n d u s t r i e s P L C A n n u a l R e p o r t 2 0 1 7
Su
pp
lem
en
tary
In
form
ati
on
Intr
od
ucti
on
Op
era
tio
ns
Co
rpo
rate
Go
ve
rnan
ce
Fin
an
cia
ls

2017 2016
Note(s) ₦‘000 ₦‘000Revenue 5 27,064,325 18,291,792
Cost of sales 7 (17,070,310) (12,374,098)
Gross profit 9,994,015 5,917,694Other income 9 11,296 18,484
Distribution costs 10.1 (604,718) (638,189)
Administrative expenses 10.2 (1,773,737) (1,479,315)
Operating profit 15 7,626,856 3,818,674Investment income 8 354,745 55,328
Finance costs 13 (72,113) (357,671)
Profit before taxation 7,909,488 3,516,331Taxation 16 (2,565,896) (1,101,148)
Profit for the year 5,343,592 2,415,183Other comprehensive income - -
Total comprehensive income for the year 5,343,592 2,415,183
Earnings per share
Per share informationBasic earnings per share (Kobo) 18 202 91 The accounting policies on pages 66 to 77 and the notes on pages 78 to 104 form an integral part of the Financial Statements.
Statement of Profit or Loss and Other Comprehensive Income
62N a s c o n A l l i e d I n d u s t r i e s P L C A n n u a l R e p o r t 2 0 1 7
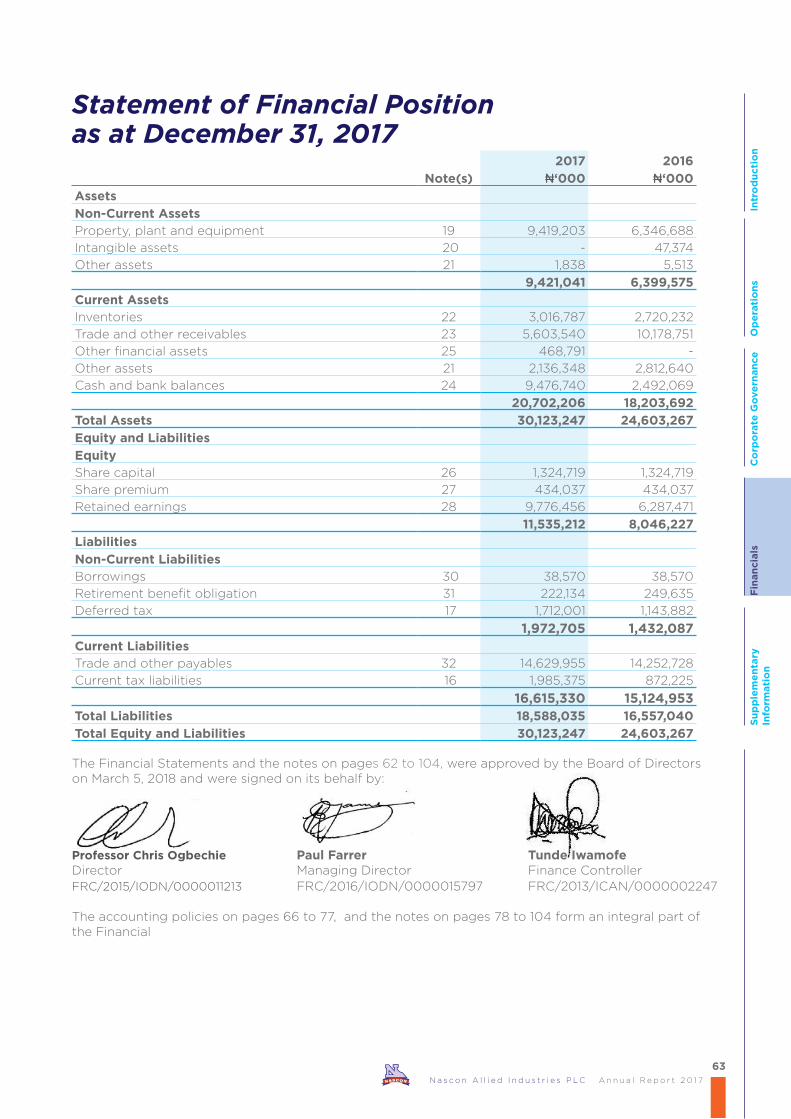
2017 2016
Note(s) ₦‘000 ₦‘000
Assets
Non-Current AssetsProperty, plant and equipment 19 9,419,203 6,346,688
Intangible assets 20 - 47,374
Other assets 21 1,838 5,513
9,421,041 6,399,575
Current AssetsInventories 22 3,016,787 2,720,232
Trade and other receivables 23 5,603,540 10,178,751
Other financial assets 25 468,791 -
Other assets 21 2,136,348 2,812,640
Cash and bank balances 24 9,476,740 2,492,069
20,702,206 18,203,692
Total Assets 30,123,247 24,603,267
Equity and Liabilities
EquityShare capital 26 1,324,719 1,324,719
Share premium 27 434,037 434,037
Retained earnings 28 9,776,456 6,287,471
11,535,212 8,046,227
Liabilities
Non-Current LiabilitiesBorrowings 30 38,570 38,570
Retirement benefit obligation 31 222,134 249,635
Deferred tax 17 1,712,001 1,143,882
1,972,705 1,432,087Current LiabilitiesTrade and other payables 32 14,629,955 14,252,728
Current tax liabilities 16 1,985,375 872,225
16,615,330 15,124,953Total Liabilities 18,588,035 16,557,040
Total Equity and Liabilities 30,123,247 24,603,267
The Financial Statements and the notes on pages 62 to 104, were approved by the Board of Directors on March 5, 2018 and were signed on its behalf by:
Professor Chris Ogbechie Paul Farrer Tunde Iwamofe Director Managing Director Finance ControllerFRC/2015/IODN/0000011213 FRC/2016/IODN/0000015797 FRC/2013/ICAN/0000002247
The accounting policies on pages 66 to 77, and the notes on pages 78 to 104 form an integral part of the Financial
Statement of Financial Position as at December 31, 2017
63N a s c o n A l l i e d I n d u s t r i e s P L C A n n u a l R e p o r t 2 0 1 7
Su
pp
lem
en
tary
In
form
ati
on
Intr
od
ucti
on
Op
era
tio
ns
Co
rpo
rate
Go
ve
rnan
ce
Fin
an
cia
ls

Statement of Changes in Equity
Share capital ₦‘000
Share premium
₦‘000
Retained income ₦‘000
Total equity ₦‘000
Balance at January 1, 2016 1,324,719 434,037 5,329,479 7,088,235
Profit for the year - - 2,415,183 2,415,183
Other comprehensive income - - - -
Total comprehensive income for the year - - 2,415,183 2,415,183
Dividends - - (1,457,191) (1,457,191)
Total contributions by and distributions to owners of company recognised directly in equity - - (1,457,191) (1,457,191)
Balance at January 1, 2017 1,324,719 434,037 6,287,471 8,046,227
Profit for the year - - 5,343,592 5,343,592
Other comprehensive income - - - -
Total comprehensive income for the year - - 5,343,592 5,343,592
Dividends - - (1,854,607) (1,854,607)
Total contributions by and distributions to owners of company recognised directly in equity - - (1,854,607) (1,854,607)
Balance at December 31, 2017 1,324,719 434,037 9,776,456 11,535,212 The accounting policies on pages 66 to 77, and the notes on pages 78 to 104 form an integral part of the Financial Statements.
Statement of Changes in Equity
64N a s c o n A l l i e d I n d u s t r i e s P L C A n n u a l R e p o r t 2 0 1 7

2017 2016
Note(s) ₦‘000 ₦‘000
Cash flows from operating activities
Cash receipts from customers 26,778,211 18,509,103
Cash paid to suppliers and employees (12,057,832) (15,740,394)
Cash generated from operations 33 14,720,379 2,768,709
Tax paid 16 (884,626) (530,212)
Net cash provided from operating activities 13,835,753 2,238,497
Cash flows from investing activities
Purchase of property, plant and equipment 19 (4,815,362) (535,361)
Proceed from sale of property, plant and equipment 5,046 5,010
Purchase of short term investment 25 (468,791) -
Interest received 8 354,745 55,328
Net cash used in investing activities (4,924,362) (475,023)
Cash flows from financing activities
Dividends paid 29 (1,854,607) (1,457,191)
Interest paid 13 (72,113) (357,671)
Net cash used in financing activities (1,926,720) (1,814,862)
Cash and cash equivalents for the year 6,984,671 (51,388)
Cash and cash equivalents at 1 January 2,492,069 2,543,457
Total cash and cash equivalents at end of the year 24 9,476,740 2,492,069 The accounting policies on pages 66 to 77, and the notes on pages 78 to 104 form an integral part of the Financial Statements.
Statement of Cash Flows
65N a s c o n A l l i e d I n d u s t r i e s P L C A n n u a l R e p o r t 2 0 1 7
Su
pp
lem
en
tary
In
form
ati
on
Intr
od
ucti
on
Op
era
tio
ns
Co
rpo
rate
Go
ve
rnan
ce
Fin
an
cia
ls

1 General informationNASCON Allied Industries Plc (Formerly known as National Salt Company of Nigeria.) was incorporated in Nigeria as a limited liability company on 30 April 1973. It was fully privatised in April, 1992 and became listed on the Nigerian Stock Exchange on 20 October, 1992. At a general meeting held on 29 September 2006, the shareholders approved the acquisition of the assets, liabilities and business undertakings of Dangote Salt Limited and the issue and allotment of additional NASCON PLC shares as the purchase consideration. The major shareholder of the Company is Dangote Industries Limited that owns about 62.19% of the issued share capital, while the remaining 37.81% is held by the Nigerian public.
The ultimate controlling party is Greenview International Corporation
The registered address of the Company is located at Salt City, Ijoko Ota, Ogun State.
1.1 The principal activityThe principal activity of the Company is the refining and sale of edible, refined, bulk and industrial salt, Vegetable Oil as well as Seasoning. The Company’s products are sold through distributors across the country.
1.2 Financial periodThe financial statements cover the financial year from January 1, 2017 to December 31, 2017 with comparatives for the year ended December 31, 2016.
1.3 Going concern statusThe Company has consistently turned in Profits since 2007. The Directors’ believe that there is no intention or threat from any party to curtail significantly its line of business in the foreseeable future. Thus, these Financial Statements are prepared on a going concern basis.
2 Significant accounting policiesThe principal accounting policies applied in the preparation of these Financial Statements are set out below. These policies have been consistently applied to all the years presented, unless otherwise stated.
2.1 Statement of Compliance with IFRSThe Financial statements have been prepared in accordance with, and comply with, International Financial Reporting Standards and International Financial Reporting Interpretations Committee (IFRIC) interpretations issued and effective at the time of preparing these financial statements.
2.2 Basis of measurementThe Financial statements have been prepared on the historical cost basis except for the revaluation of certain financial instruments. Historical cost is generally based on the fair value of the consideration given in exchange for assets.
Historical cost is generally based on the fair value of the consideration given in exchange for goods and services.
Fair value is the price that would be received to sell an asset or paid to transfer a liability in an orderly transaction between market participants at the measurement date, regardless of whether that price is directly observable or estimated using another valuation technique. In estimating the fair value of an asset or a liability, the Company takes into account the characteristics of the asset or liability if market participants would take those characteristics into account when pricing the asset or liability at the measurement date. Fair value for measurement and/or disclosure purposes in these financial statements is determined on such a basis, except for share-based payment transactions that are within the scope of IFRS 2, leasing transactions that are within the scope of IAS 17, and measurements that have some similarities to fair value but are not fair value, such as net realisable value in IAS 2 or value in use in IAS 36.
Accounting Policies
66N a s c o n A l l i e d I n d u s t r i e s P L C A n n u a l R e p o r t 2 0 1 7

In addition, for financial reporting purposes, fair value measurements are categorised into level 1, 2 or 3 based on the degree to which the inputs to the fair value measurements are observable and the significance of the inputs to the fair value measurement in its entirety, which are described as follows:
Level 1 inputs are quoted prices (unadjusted) in active markets for identical assets or liabilities that the entity can access at the measurement date;
Level 2 inputs are inputs, other than quoted prices included within level 1, that are observable for the asset or liability, either directly or indirectly; and
Level 3 inputs are unobservable inputs for the asset or liability.
2.3 Functional and presentation currencyThese Financial Statements are presented in Naira, which is the Company’s functional currency. All financial information presented in Naira has been rounded to the nearest thousand.
2.3.1 Foreign currency transactionsA foreign currency transaction is recorded, on initial recognition in Naira, by applying to the foreign currency amount the spot exchange rate between the functional currency and the foreign currency at the date of the transaction
At the end of the reporting period: foreign currency monetary items are translated using the closing rate; non-monetary items that are measured in terms of historical cost in a foreign currency are translated
using the exchange rate at the date of the transaction; and non-monetary items that are measured at fair value in a foreign currency are translated using the
exchange rates at the date when the fair value was determined.
Exchange differences arising on the settlement of monetary items or on translating monetary items at rates different from those at which they were translated on initial recognition during the period or in previous financial statements are recognised in profit or loss in the period in which they arise.
When a gain or loss on a non-monetary item is recognised to other comprehensive income and accumulated in equity, any exchange component of that gain or loss is recognised to other comprehensive income and accumulated in equity. When a gain or loss on a non-monetary item is recognised in profit or loss, any exchange component of that gain or loss is recognised in profit or loss.
Cash flows arising from transactions in a foreign currency are recorded in Naira by applying to the foreign currency amount the exchange rate between the Naira and the foreign currency at the date of the cash flow.
2.4 Revenue recognitionRevenue is measured as the fair value of the consideration received or receivable and represents amounts receivable for goods and services provided in the normal course of business, after deducting discounts, customer returns, VAT, volume rebates and other similar allowance. Sales are stated at their invoiced amount which is net of value added taxes and discounts.
Revenue from the sale of goods is recognised when all the following conditions have been satisfied: the company has transferred to the buyer the significant risks and rewards of ownership of the
goods; the company retains neither continuing managerial involvement to the degree usually associated
with ownership nor effective control over the goods sold; the amount of revenue can be measured reliably; it is probable that the economic benefits associated with the transaction will flow to the company;
Accounting Policies
67N a s c o n A l l i e d I n d u s t r i e s P L C A n n u a l R e p o r t 2 0 1 7
Su
pp
lem
en
tary
In
form
ati
on
Intr
od
ucti
on
Op
era
tio
ns
Co
rpo
rate
Go
ve
rnan
ce
Fin
an
cia
ls

and the costs incurred or to be incurred in respect of the transaction can be measured reliably.
Specifically, revenue from the sale of goods is recognised when goods are delivered (or collected, if sold under self-collection terms) and legal title is passed.
2.5 Interest incomeInterest income from a financial asset is recognised when it is probable that the economic benefits will flow to the Company and the amount of revenue can be measured reliably. Interest income is accrued on a time basis, by reference to the principal outstanding and at the effective interest rate applicable, which is the rate that exactly discounts estimated future cash receipts through the expected life of the financial asset to that asset’s net carrying amount on initial recognition.
2.6 Employee benefitsRetirement benefit costsPayments to defined contribution retirement benefit plans are recognised as an expense when employees have rendered service entitling them to the contributions.
2.7 TaxationIncome tax expense represents the sum of the tax currently payable and deferred tax.
Current taxThe tax currently payable is based on taxable profit for the year. Taxable profit differs from profit as reported in the statements of comprehensive income because of items of income or expense that are taxable or deductible in other years and items that are never taxable or deductible. The Company’s liability for current tax is calculated using tax rates that have been enacted or substantively enacted by the end of the reporting period.
Current income tax is the expected amount of income tax payable on the taxable profit for the year determined in accordance with the Companies Income Tax Act (CITA) using statutory tax rates at the reporting sheet date. Education tax is assessed at 2% of the assessable profits.
Deferred taxDeferred tax assets and liabilities are measured at the tax rates that are expected to apply in the period in which the liability is settled or the asset realised, based on tax rates (and tax laws) that have been enacted or substantively enacted by the end of the reporting period. The measurement of deferred tax liabilities and assets reflects the tax consequences that would follow from the manner in which the Company expects, at the end of the reporting period, to recover or settle the carrying amount of its assets and liabilities.
Deferred tax assets and liabilities are offset when there is a legally enforceable right to set off current tax assets against current tax liabilities and when they relate to income taxes levied by the same taxation authority and the Company intends to settle its current tax assets and liabilities on a net basis.
Current and deferred tax are recognised in Profit and Loss, except when they relate to items that are recognised in other comprehensive income or directly in equity, in which case, the current and deferred tax are recognised in other comprehensive income or directly in equity respectively. Where current tax and deferred tax arises from the initial accounting for a business combination, the tax effect is included in the accounting for the business combination.
2.8 Property, plant and equipment
2.8.1 Recognition and measurementItems of property, plant and equipment are measured at cost less accumulated depreciation and accumulated impairment losses.
Accounting Policies
68N a s c o n A l l i e d I n d u s t r i e s P L C A n n u a l R e p o r t 2 0 1 7

Cost includes expenditure that is directly attributable to the acquisition of the asset. Fixed assets under construction are disclosed as capital work-in-progress. The cost of construction recognised includes the cost of materials and direct labour, any other costs directly attributable to bringing the assets to a working condition for their intended use, the costs of dismantling and removing the items and restoring the site on which they are located, and borrowing costs on qualifying assets.
Purchased software that is integral to the functionality of the related equipment is capitalized as part of the equipment.
When parts of an item of property, plant and equipment have different useful lives, they are accounted for as separate items (major components) of property, plant and equipment.
Gains and losses on disposal of an item of property, plant and equipment are determined by comparing the proceeds from disposal with the carrying amount of property, plant and equipment, and are recognized in the statement of comprehensive income.
2.8.2 Subsequent costsThe cost of replacing a part of an item of property, plant and equipment is recognized in the carrying amount of the item if it is probable that the future economic benefits embodied within the part will flow to the Company and its cost can be measured reliably. The carrying amount of the replaced part is derecognized. The costs of the day-to-day servicing of property, plant and equipment are recognized in profit or loss as incurred.
2.8.3 DepreciationDepreciation is calculated on the depreciable amount, which is the cost of an asset, or other amount substituted for cost, less its estimated residual value.
Depreciation is recognized in profit or loss on a straight-line basis over the estimated useful lives of each part of an item of property, plant and equipment which reflects the expected pattern of consumption of the future economic benefits embodied in the asset. Leased assets are depreciated over the shorter of the lease term and their useful lives unless it is reasonably certain that the Company will obtain ownership by the end of the lease term in which case the assets are depreciated over the useful life.
The estimated useful lives for the current and comparative years are as follows:Buildings 50 yearsPlant and machinery 15 yearsFurniture and Fittings 5 yearsMotor vehicles 4 yearsTools and Equipment 4 yearsComputer Equipment 3 years
Depreciation methods, useful lives and residual values are reviewed at each financial year end and adjusted if appropriate.
Capital work-in-progress is not depreciated. The attributable cost of each asset is transferred to the relevant asset category immediately the asset is available for use and depreciated accordingly.
Properties in the course of construction for production, supply or administrative purposes, or for purposes not yet determined, are carried at cost, less any recognised impairment loss. Cost includes professional fees and, for qualifying assets, borrowing costs capitalised in accordance with the Company’s accounting policy. Depreciation of these assets, on the same basis as other property assets, commences when the assets are ready for their intended use.
Depreciation is recognised so as to write off the cost of assets (other than properties under
Accounting Policies
69N a s c o n A l l i e d I n d u s t r i e s P L C A n n u a l R e p o r t 2 0 1 7
Su
pp
lem
en
tary
In
form
ati
on
Intr
od
ucti
on
Op
era
tio
ns
Co
rpo
rate
Go
ve
rnan
ce
Fin
an
cia
ls

construction) less their residual values over their useful lives, using the straight-line method. The estimated useful lives, residual values and depreciation method are reviewed at each year end, with the effect of any changes in estimate accounted for on a prospective basis.
Assets held under finance leases are depreciated over their expected useful lives on the same basis as owned assets or, where shorter, the term of the relevant lease.
2.9 LeasesLeases are classified as a finance lease whenever the terms of the lease transfer substantially all the risks and rewards of ownership to the lessee. All other leases are classified as operating leases.
Operating leases – lesseeOperating lease payments are recognised as an expense on a straight-line basis over the lease term. The difference between the amounts recognised as an expense and the contractual payments are recognised as an operating lease asset.This liability is not discounted.
Any contingent rentals are expensed in the period they are incurred.
In the event that lease incentives are received to enter into operating leases, such incentives are recognised as a liability. The aggregate benefit of incentives is recognised as a reduction of rental expense on a straight-line basis, except where another systematic basis is more representative of the time pattern in which economic benefits from the leased assets are consumed.
Where there are no agreed lease terms, rent payable is recognised as incurred.
2.10 Intangible assetsThe amortisation is recognised on a straight-line basis over their estimated useful lives. The estimated useful life and amortisation method are reviewed at the end of each annual reporting period, with the effect of any changes in estimate being accounted for on a prospective basis. Intangible assets with indefinite useful lives that are acquired separately are carried at cost less accumulated impairment losses.
Derecognition of intangible assetsAn intangible assets is derecognized on disposal, or when no future economic benefits are expected from use or disposal.Gains or losses arising from derecognition of an intangible assets, measured as the difference between the net disposal proceeds and the carrying amount of the asset, are recognised in Profit or Loss when the asset is derecognised.
Impairment of tangible and intangible assets excluding goodwillAt the end of each reporting period, the Company reviews the carrying amounts of its tangible and Intangible Assets to determine whether there is any indication that those assets have suffered an impairment loss. If any such indication exists, the recoverable amount of the asset is estimated in order to determine the extent of the impairment loss (if any). Where it is not possible to estimate the recoverable amount of an individual asset, the Company estimates the recoverable amount of the cash-generating unit to which the asset belongs. Where a reasonable and consistent basis of allocation can be identified, corporate assets are also allocated to individual cash-generating units, or otherwise they are allocated to the smallest group of cash-generating units for which a reasonable and consistent allocation basis can be identified.
Intangible assets with indefinite useful lives and intangible assets not yet available for use are tested for impairment at least annually, and whenever there is an indication that the asset may be impaired.
Accounting Policies
70N a s c o n A l l i e d I n d u s t r i e s P L C A n n u a l R e p o r t 2 0 1 7
Recoverable amount is the higher of fair value less costs to sell and value in use. In assessing value in use, the estimated future cash flows are discounted to their present value using a pre-tax discount rate that reflects current market assessments of the time value of money and the risks specific to the asset for which the estimates of future cash flows have not been adjusted.
If the recoverable amount of an asset (or cash-generating unit) is estimated to be less than its carrying amount, the carrying amount of the asset (or cash-generating unit) is reduced to its recoverable amount. An impairment loss is recognised immediately in profit or loss.
Where an impairment loss subsequently reverses, the carrying amount of the asset (or cash generating unit) is increased to the revised estimate of its recoverable amount, but so that the increased carrying amount does not exceed the carrying amount that would have been determined had no impairment loss been recognised for the asset (or cash-generating unit) in prior years. A reversal of an impairment loss is recognised immediately in profit or loss.
2.11 InventoriesInventories are stated at the lower of cost and net realisable value. Cost of engineering spares and consumable stock is determined on a weighted average basis. Cost of other stock (raw materials, packaging materials, work-in-progress and finished goods) is determined on the basis of standard costs adjusted for variances. Standard costs are periodically reviewed to approximate actual costs.
Goods in transit are valued at the invoice price. Cost of inventories comprises of all costs of purchase, conversion cost (materials, labour and overhead) and other costs incurred to bring inventories to their present location and conditionFinished goods, which include direct labour and factory overheads, are valued at standard cost adjusted at year-end on an actual cost basis.
Costs, including an appropriate portion of fixed and variable overhead expenses, are assigned to inventories by the method most appropriate to the particular class of inventory, with the majority being valued on an average cost basis. Net realizable value represents the estimated selling price for inventories less all estimated costs of completion and costs necessary to make the sale.
2.12 ProvisionsProvisions are recognised when: the company has a present obligation as a result of a past event; it is probable that an outflow of resources embodying economic benefits will be required to settle
the obligation; and a reliable estimate can be made of the obligation (when the time value of money is material).
The amount recognised as provision is the present value of the expenditure expected to be required to settle the obligation at the end of the reporting period, taking into account the risks and uncertainties surrounding the obligation. Where a provision is measured using the cash flows estimated to settle the present obligation, its carrying amount is the present value of those cash flows.
Where some or all of the expenditure required to settle a provision is expected to berecovered from a third party, a receivable is recognised as an asset if it is virtually certain that reimbursement will be received and the amount of the receivable can be measured reliably.
If Company has a contract that is onerous, the present obligation under the contract shall be recognised and measured as a provisions. An onerous contract is considered to exist where the Company has a contract under which the unavoidable costs of meeting the obligations under the contract exceed the economic benefits expected to be received from the contract.
Accounting Policies
71N a s c o n A l l i e d I n d u s t r i e s P L C A n n u a l R e p o r t 2 0 1 7
Su
pp
lem
en
tary
In
form
ati
on
Intr
od
ucti
on
Op
era
tio
ns
Co
rpo
rate
Go
ve
rnan
ce
Fin
an
cia
ls

2.12.1 Environmental costsCosts incurred that result in future economic benefits, such as extending useful lives, increasing capacity or safety, and those costs incurred to mitigate or prevent future environmental contamination are capitalized. When the Company’s management determine that it is probable that a liability for environmental costs exists and that its resolution will result in an outflow of resources, an estimate of the future remediation cost is recorded as a provision without contingent insurance recoveries being offset (only virtually certain insurance recoveries are recognized as an asset on the statement of financial position). When the Company does not have a reliable reversal time schedule or when the effect of the passage of time is not significant, the provision is calculated based on undiscounted cash flows.
Environmental costs, which are not included above, are expensed as incurred.
2.13 Financial instrumentsFinancial assets and financial liabilities are recognised when the Company becomes a party to the contractual provisions of the instrument. Financial assets and financial liabilities are initially measured at fair value. Transaction costs that are directly attributable to the acquisition or issue of the financial assets and financial liabilities (other than financial assets or financial liabilities at fair value through profit or loss) are added to or deducted from the fair value of the financial assets or financial liabilities, as appropriate, on initial recognition. Transaction costs directly attributable to the acquisition of financial assets or financial liabilities at fair value through profit or loss are recognised immediately in profit or loss.
ClassificationThe Company classifies financial assets into the following specified categories: Financial assets at fair value through profit or loss Held-to-maturity investment Loans and receivables Available-for-sale financial assets
Classification depends on the nature and purpose of the financial assets and is determined at the time of initial recognition.All regular purchases or sales of financial assets are recognised and derecognized on a trade date basis. Regular purchases or sales are purchases or sales of financial assets that require delivery of assets within the time frame established by regulation or convention in the market place. The Company’s financial assets comprise loans and receivables.
Initial recognition and measurementFinancial instruments are recognised initially when the Company becomes a party to the contractual provisions of the instruments.
The Company classifies financial instruments, or their component parts, on initial recognition as a financial asset, a financial liability(debt) or an equity instrument in accordance with the substance of the contractual arrangement.
Incremental costs directly attributable to the issue of ordinary shares and share options are recognized as a deduction from equity, net of any tax effects.
Subsequent measurement Financial instruments at fair value through profit or loss are subsequently measured at fair value, with gains and losses arising from changes in fair value being included in profit or loss for the period.
Net gains or losses recognised in profit or loss include interest.
Financial liabilities at amortised cost are subsequently measured at amortised cost, using the effective
Accounting Policies
72N a s c o n A l l i e d I n d u s t r i e s P L C A n n u a l R e p o r t 2 0 1 7

interest method.
Effective interest methodThe effective interest method is a method of calculating the amortised cost of a debt instrument and of allocating interest income over the relevant period. The effective interest rate is the rate that exactly discounts estimated future cash receipts (including all fees and points paid or received that form an integral part of the effective interest rate, transaction costs and other premiums or discounts) through the expected life of the debt instrument, or (where appropriate) a shorter period, to the net carrying amount on initial recognition.
Income is recognised on an effective interest basis for debt instruments other than those financial assets classified as at FVTPL.
Financial instruments designated as loans and receivablesLoans and receivables are non-derivative financial assets with fixed or determinable payments that are not quoted in an active market. Loans and receivables (including trade and other receivables) are measured at amortised cost using the effective interest method, less any impairment. Interest income is recognised by applying the effective interest rate, except for short-term receivables when the recognition of interest would be immaterial.
Impairment of financial assetsFinancial assets, other than those at FVTPL, at each reporting date the Company assesses all financial assets, other than those at fair value through profit or loss, to determine whether there is objective evidence that a financial asset or group of financial assets has been impaired.
For all categories of financial assets, objective evidence of impairment could include: significant financial difficulty of the issuer or counterparty; or breach of contract, such as a default or delinquency in interest or principal payments; or it is becoming probable that the owner will enter bankruptcy or financial re-organisation; or the disappearance of an active market for that financial asset because of financial difficulties.
For certain categories of financial asset, such as trade receivables, assets that are assessed not to be impaired individually are, in addition, assessed for impairment on a collective basis. Objective evidence of impairment for a portfolio of receivables could include the Company’s past experience of collecting payments, an increase in the number of delayed payments in the portfolio past the average credit period of 30 days, as well as observable changes in national or local economic conditions that correlate with a default on receivables.
For financial assets carried at amortised cost, the amount of the impairment loss recognised is the difference between the asset’s carrying amount and the present value of estimated future cash flows, discounted at the financial asset’s original effective interest rate.
For financial assets carried at cost, the amount of the impairment loss is measured as the difference between the asset’s carrying amount and the present value of the estimated future cash flows discounted at the current market rate of return for a similar financial asset. Such impairment loss will not be reversed in subsequent periods.
The carrying amount of the financial asset is reduced by the impairment loss directly for all financial assets with the exception of trade receivables, where the carrying amount is reduced through the use of an allowance account. When a trade receivable is considered uncollectible, it is written off against the allowance account. Subsequent recoveries of amounts previously written off are credited against the allowance account. Changes in the carrying amount of the allowance account are recognised in profit or loss.
Accounting Policies
73N a s c o n A l l i e d I n d u s t r i e s P L C A n n u a l R e p o r t 2 0 1 7
Su
pp
lem
en
tary
In
form
ati
on
Intr
od
ucti
on
Op
era
tio
ns
Co
rpo
rate
Go
ve
rnan
ce
Fin
an
cia
ls

Derecognition of financial assetsThe Company derecognises a financial asset only when the contractual rights to the cash flows from the asset expire, or when it transfers the financial asset and substantially all the risks and rewards of ownership of the asset to another entity. If the Company neither transfers nor retains substantially all the risks and rewards of ownership and continues to control the transferred asset, the Company recognises its retained interest in the asset and an associated liability for amounts it may have to pay. If the Company retains substantially all the risks and rewards of ownership of a transferred financial asset, the Company continues to recognise the financial asset and also recognises a collateralised borrowing for the proceeds received.
On derecognition of a financial asset in its entirety, the difference between the asset’s carrying amount and the sum of the consideration received and receivable and the cumulative gain or loss that had been recognised in other comprehensive income and accumulated in equity is recognised in profit or loss.
The derecognises financial liabilities when, and only when the 0.73 billion obligations are discharged, cancelled, or they expire. The difference between the carrying amount of the financial liability derecognised and the consideration paid, and payable is recognised in 0.74 billion.
Cash and cash equivalentsCash and cash equivalents consist of cash, highly liquid investments and cash equivalents which are not subject to significant changes in value and with an original maturity date of generally less than three months from the time of purchase.
Classification as debt or equityDebt and equity instruments are classified as either financial liabilities or as equity in accordance with the substance of the contractual arrangements and the definitions of a financial liability and an equity instrument.
Equity instrumentsAn equity instrument is any contract that evidences a residual interest in the assets of an entity after deducting all of its liabilities. Equity instruments issued by the Company are recognised at the proceeds received, net of direct issue costs.
Incremental costs directly attributable to the issue of ordinary shares and share options are recognized as a deduction from equity, net of any tax effects.
Other financial liabilitiesOther financial liabilities (including borrowings and trade and other payables) are subsequently measured at amortised cost using the effective interest method.
The effective interest method is a method of calculating the amortised cost of a financial liability and of allocating interest expense over the relevant period. The effective interest rate is the rate that exactly estimates future cash payments (including all fees and points paid or received that form an integral part of the effective interest rate, transaction costs and other premiums or discounts) through the expected life of the financial liability, or (where appropriate), a shorter period, to the net carrying amount on initial recognition
Financial liabilitiesFinancial liabilities are classified as either financial liabilities ‘at fair value through profit and loss’ (FVTPL) or other liabilities.
Accounting Policies
74N a s c o n A l l i e d I n d u s t r i e s P L C A n n u a l R e p o r t 2 0 1 7
Financial liabilities are classified as at FVTPL when the financial liability is either held for trading or it is designated as at FVTPL. A financial liability is classified as held for trading if: it has been acquired principally for the purpose of repurchasing it in the near term or on initial
recognition; it is part of a portfolio of identified financial instruments that the Company manages together and
has a recent actual pattern of short term profit taking; it is a derivative that is not designated and effective as a hedging instrument.
A financial liability other than a financial liability held for trading may be designated as at FVTPL upon initial recognition if such designation eliminates or significantly reduces a measurement or recognition inconsistency that would otherwise arise; or the financial liability forms part of a group of financial assets or financial liabilities or both, which is managed and its performance is evaluated on a fair value basis, in accordance with the Company’s documented risk management or investment strategy, and information about the grouping is provided on that basis; or it forms part of a contract containing one or more embedded derivatives, and IAS 39 permits the entire combined contract (asset or liability) to be designated as at FVTPL.
Financial liabilities at FVTPL are stated at fair value, with any gains or losses arising on remeasurement recognised in profit or loss. The net gain or loss recognised in profit or loss incorporates any interest paid on the financial liability and is included in the other gains and losses’ line item.
Bank overdraft and borrowingsBank overdrafts and borrowings are initially measured at fair value, and are subsequently measured at amortised cost, using the effective interest rate method. Any difference between the proceeds (net of transaction costs) and the settlement or redemption of borrowings is recognised over the term of the borrowings in accordance with the company’s accounting policy for borrowing costs.
Derecognition of financial liabilitiesThe Company derecognises financial liabilities when, and only when the Company’s obligations are discharged, cancelled, or they expire. The difference between the carrying amount of the financial liability derecognised and the consideration paid, and payable is recognised in profit or loss.
These include loans to and from holding companies, fellow subsidiaries, subsidiaries, joint ventures and associates and are recognised initially at fair value plus direct transaction costs.
Loans to group companies are classified as loans and receivables.
Loans from group companies are classified as financial liabilities measured at amortised cost.
Trade and other receivablesTrade receivables are measured at initial recognition at fair value, and are subsequently measured at amortised cost using the effective interest rate method. Appropriate allowances for estimated irrecoverable amounts are recognised in profit or loss when there is objective evidence that the asset is impaired. Significant financial difficulties of the debtor, probability that the debtor will enter bankruptcy or financial reorganisation, and default or delinquency in payments (more than 30 days overdue) are considered indicators that the trade receivable is impaired. The allowance recognised is measured as the difference between the asset’s carrying amount and the present value of estimated future cash flows discounted at the effective interest rate computed at initial recognition.
The carrying amount of the asset is reduced through the use of an allowance account, and the amount of the loss is recognised in profit or loss within operating expenses. When a trade receivable is uncollectable, it is written off against the allowance account for trade receivables. Subsequent recoveries of amounts previously written off are credited against operating expenses in profit or loss.
Accounting Policies
75N a s c o n A l l i e d I n d u s t r i e s P L C A n n u a l R e p o r t 2 0 1 7
Su
pp
lem
en
tary
In
form
ati
on
Intr
od
ucti
on
Op
era
tio
ns
Co
rpo
rate
Go
ve
rnan
ce
Fin
an
cia
ls

Trade and other receivables are classified as loans and receivables.
Trade and other payablesTrade payables are initially measured at fair value, and are subsequently measured at amortised cost, using the effective interest rate method.
2.14 Borrowing costsBorrowing costs that are directly attributable to the acquisition, construction or production of a qualifying asset are capitalised as part of the cost of that asset until such time as the asset is ready for its intended use.
Investment income earned on the temporary investment of specific borrowings pending their expenditure on qualifying assets is deducted from the borrowing costs eligible for capitalization.
All other borrowing costs are recognised as an expense in the period in which they are incurred.
2.15 Government grantsGovernment grants are recognised when there is reasonable assurance that: the company will comply with the conditions attaching to them; and the grants will be received.
A government grant that becomes receivable as compensation for expenses or losses already incurred or for the purpose of giving immediate financial support to the entity with no future related costs is recognised as income of the period in which it becomes receivable.
Government grants related to assets, including non-monetary grants at fair value, are presented in the statement of financial position by setting up the grant as deferred income or by deducting the grant in arriving at the carrying amount of the asset.
The benefit of a government loan at a below market rate of interest is treated as a government grant, measured as the difference between proceeds and the fair value of the loan based on prevailing market interest rates.
3 Critical accounting judgement and key sources of estimation uncertaintyIn the application of the Company’s significant accounting policies, described in Note 3, the Directors’ are required to make judgments, estimates and assumptions about the carrying amounts of assets and liabilities that are not readily apparent from other sources. The estimates and associated assumptions are based on historical experience and other factors that are considered to be relevant. Actual results may differ from these estimates.
The estimates and underlying assumptions are reviewed on an on-going basis. Revisions to accounting estimates are recognised in the period in which the estimate is revised if the revision affects only that period, or in the period of the revision and future periods if the revision affects both current and future periods.
3.1 Key sources of estimation uncertaintyThe key assumptions concerning the future, and other key sources of estimation uncertainty at the reporting date, that have a significant risk of causing a material adjustment to the carrying amounts of assets and liabilities within the next financial year, are discussed below.
3.1.1 Useful life of property, plant and equipmentThe Company reviewed and revised the estimated useful lives of its property, plant and equipment on transition to IFRS on 1 January, 2011, and under IFRS, has reviewed them annually at each reporting date.
Accounting Policies
76N a s c o n A l l i e d I n d u s t r i e s P L C A n n u a l R e p o r t 2 0 1 7
Accounting PoliciesUseful lives are estimated based on the engineer’s report, as at each reporting date. Some of the factors considered include the current service potential of the assets, potential cost of repairs and maintenance.
There is a degree of subjective judgment in such estimation which has a resultant impact on profit and total comprehensive income for the year.
3.1.2 Allowances for credit lossesThe Company periodically assesses its trade receivables for probability of credit losses. Management considers several factors including past credit record, current financial position and credibility of management, judgment is exercised in determining the allowances made for credit losses.
Provisions are made for receivables that have been outstanding for 365 days, in respect of which there is no firm commitment to pay by the customer.
Furthermore all balances are reviewed for evidence of impairment and provided against once recovery is doubtful. These assessments are subjective and involve a significant element of judgment by management on the ultimate recoverability of amounts receivable.
3.1.3 Impairment Assessment on Vegetable Oil and Tomato Paste PlantsDetermining whether an asset is impaired requires an estimation of the value in use of the cash generating units. The value in use calculation requires the Directors to estimate the future cash flows expected to arise from the cash generating unit and a suitable discount rate in order to calculate present value.
Where the actual future cash flows are less than expected, a material impairment loss may arise. during the year, the Director carried out an impairmrnt assessment of the Vegetable Oil and Tomato Paste Plant. The carrying amount of the plants as at 31 December, 2017 was N2.76 billion (31 December, 2016 N2.94 billion). Based on the assessment carried out, the two plants are not impaired.
The following were the judgements and assumptions made by the Directors. Risk free rate of 14.12%. The yield to maturity of the 10 year FGN bond has been adopted as proxy for
risk free rate on the Naira cash flows expected to be generated by the plants. Equity risk premium of 11.42% representing the returns investors expect above the risk-free rate, as
compensation for taking extra risk by investing in the equity securities. Beta estimate of 0.89. Our beta estimate reflects the correlation between the returns reported by
companies in the food processing industry relative to the rest of the equities market. Debt to equity ratio of 45.75%, representing the average capital structure adopted by companies
operating within the food processing industry. 4% company specific premium to compensate for the specific risks potentially inherent in Nascon
Allied Industries Plc Limited’s operations. Key drivers of the business are Governments focus on backward integration which will improve
sourcing of raw materials and Dangote group’s agricultural backward integration program. Pre tax interest rate on loan is 20% while tax rate is 32% (corporate tax of 30% and education tax of
2%).
77N a s c o n A l l i e d I n d u s t r i e s P L C A n n u a l R e p o r t 2 0 1 7
Su
pp
lem
en
tary
In
form
ati
on
Intr
od
ucti
on
Op
era
tio
ns
Co
rpo
rate
Go
ve
rnan
ce
Fin
an
cia
ls

4. New Standards and Interpretations4.1 Standards and interpretations effective and adopted in the current yearIn the current year, the company has adopted the following standards and interpretations that are effective for the current financial year and that are relevant to its operations:
Standard/ Interpretation: Effective date: Years beginning on or after
Expected impact:
Amendments to IFRS 12: Annual Improvements to IFRS 2014 - 2016 cycle
January 1, 2017 The impact of the standard is not material.
Amendments to IAS 7: Disclosure initiative January 1, 2017 The impact of the standard is not material.
Amendments to IAS 12: Recognition of Deferred Tax Assets for Unrealised Losses
January 1, 2017 The impact of the amendments is not material.
4.2 Standards and interpretations not yet effectiveThe company has chosen not to early adopt the following standards and interpretations, which have been published and are mandatory for the company’s accounting periods beginning on or after January 1, 2018 or later periods:
Amendments to IFRS 10 and IAS 28: Sale or Contribution of Assets between an Investor and its Associate or Joint VentureIf a parent loses control of a subsidiary which does not contain a business, as a result of a transaction with an associate or joint venture, then the gain or loss on the loss of control is recognised in the parents’ profit or loss only to the extent of the unrelated investors’ interest in the associate or joint venture. The remaining gain or loss is eliminated against the carrying amount of the investment in the associate or joint venture. The same treatment is followed for the measurement to fair value of any remaining investment which is itself an associate or joint venture. If the remaining investment is accounted for in terms of IFRS 9, then the measurement to fair value of that interest is recognised in full in the parents’ profit or loss.
The effective date of the amendment is to be determined by the IASB.
It is unlikely that the amendment will have a material impact on the company’s financial statements.
Insurance Contracts
The IFRS establishes the principles for the recognition, measurement, presentation and disclosure of insurance contracts issued.
The effective date of the standard is for years beginning on or after January 1, 2021.
The company expects to adopt the standard for the first time in the 2021 financial statements.
It is unlikely that the standard will have a material impact on the company’s financial statements.
Uncertainty over Income Tax TreatmentsThe interpretation clarifies how to apply the recognition and measurement requirements in IAS 12 when there is uncertainty over income tax treatments. Specifically, if it is probable that the tax authorities will accept the uncertain tax treatment, then all tax related items are measured according to the planned tax treatment. If it is not probable that the tax authorities will accept the uncertain tax treatment, then the tax related items are measured on the basis of probabilities to reflect the uncertainty.
Notes to the Financial Statements
78N a s c o n A l l i e d I n d u s t r i e s P L C A n n u a l R e p o r t 2 0 1 7

Changes in facts and circumstances are required to be treated as changes in estimates and applied prospectively.
The effective date of the interpretation is for years beginning on or after January 1, 2019.
The company expects to adopt the interpretation for the first time in the 2019 financial statements.
It is unlikely that the interpretation will have a material impact on the company’s financial statements.
IFRS 16 LeasesIFRS 16 Leases is a new standard which replaces IAS 17 Leases, and introduces a single lessee accounting model. The main changes arising from the issue of IFRS 16 which are likely to impact the company are as follows:
Company as lessee: Lessees are required to recognise a right-of-use asset and a lease liability for all leases, except short
term leases or leases where the underlying asset has a low value, which are expensed on a straight line or other systematic basis. The cost of the right-of-use asset includes, where appropriate, the initial amount of the lease liability; lease payments made prior to commencement of the lease less incentives received; initial direct costs of the lessee; and an estimate for any provision for dismantling, restoration and removal related to the underlying asset. The lease liability takes into consideration, where appropriate, fixed and variable lease payments; residual value guarantees to be made by the lessee; exercise price of purchase options; and payments of penalties for terminating the lease.
The right-of-use asset is subsequently measured on the cost model at cost less accumulated depreciation and impairment and adjusted for any re-measurement of the lease liability. However, right-of-use assets are measured at fair value when they meet the definition of investment property and all other investment property is accounted for on the fair value model. If a right-of-use asset relates to a class of property, plant and equipment which is measured on the revaluation model, then that right-of-use asset may be measured on the revaluation model.
The lease liability is subsequently increased by interest, reduced by lease payments and re-measured for reassessments or modifications.
Re-measurements of lease liabilities are affected against right-of-use assets, unless the assets have been reduced to nil, in which case further adjustments are recognised in profit or loss.
The lease liability is re-measured by discounting revised payments at a revised rate when there is a change in the lease term or a change in the assessment of an option to purchase the underlying asset.
The lease liability is re-measured by discounting revised lease payments at the original discount rate when there is a change in the amounts expected to be paid in a residual value guarantee or when there is a change in future payments because of a change in index or rate used to determine those payments.
Certain lease modifications are accounted for as separate leases. When lease modifications which decrease the scope of the lease are not required to be accounted for as separate leases, then the lessee re-measures the lease liability by decreasing the carrying amount of the right of lease asset to reflect the full or partial termination of the lease. Any gain or loss relating to the full or partial termination of the lease is recognised in profit or loss. For all other lease modifications which are not required to be accounted for as separate leases, the lessee re-measures the lease liability by making a corresponding adjustment to the right-of-use asset.
Right-of-use assets and lease liabilities should be presented separately from other assets and liabilities. If not, then the line item in which they are included must be disclosed. This does not apply to right-of-use assets meeting the definition of investment property which must be presented within investment property. IFRS 16 contains different disclosure requirements compared to IAS 17 leases.
Notes to the Financial Statements
79N a s c o n A l l i e d I n d u s t r i e s P L C A n n u a l R e p o r t 2 0 1 7
Su
pp
lem
en
tary
In
form
ati
on
Intr
od
ucti
on
Op
era
tio
ns
Co
rpo
rate
Go
ve
rnan
ce
Fin
an
cia
ls
Company as lessor: Accounting for leases by lessors remains similar to the provisions of IAS 17 in that leases are
classified as either finance leases or operating leases. Lease classification is reassessed only if there has been a modification.
A modification is required to be accounted for as a separate lease if it both increases the scope of the lease by adding the right to use one or more underlying assets; and the increase in consideration is commensurate to the stand alone price of the increase in scope.
If a finance lease is modified, and the modification would not qualify as a separate lease, but the lease would have been an operating lease if the modification was in effect from inception, then the modification is accounted for as a separate lease. In addition, the carrying amount of the underlying asset shall be measured as the net investment in the lease immediately before the effective date of the modification. IFRS 9 is applied to all other modifications not required to be treated as a separate lease.
Modifications to operating leases are required to be accounted for as new leases from the effective date of the modification. Changes have also been made to the disclosure requirements of leases in the lessor’s financial statements.
Sale and leaseback transactions: In the event of a sale and leaseback transaction, the requirements of IFRS 15 are applied to consider
whether a performance obligation is satisfied to determine whether the transfer of the asset is accounted for as the sale of an asset.
If the transfer meets the requirements to be recognised as a sale, the seller-lessee must measure the new right-ofuse asset at the proportion of the previous carrying amount of the asset that relates to the right-of-use retained. The buyer-lessor accounts for the purchase by applying applicable standards and for the lease by applying IFRS 16
If the fair value of consideration for the sale is not equal to the fair value of the asset, then IFRS 16 requires adjustments to be made to the sale proceeds. When the transfer of the asset is not a sale, then the seller-lessee continues to recognise the transferred asset and recognises a financial liability equal to the transfer proceeds. The buyer-lessor recognises a financial asset equal to the transfer proceeds.
The effective date of the standard is for years beginning on or after January 1, 2019.
The company expects to adopt the standard for the first time in the 2019 financial statements.
It is unlikely that the standard will have a material impact on the company’s financial statements.
Amendments to IAS 28: Annual Improvements to IFRS 2014 - 2016 cycleAn entity such as a venture capital organisation, mutual fund or similar institution may elect to measure investments in associates or joint ventures at fair value through profit or loss in accordance with IFRS 9 rather than by applying the equity method. The amendment to IAS 28 Investments in Associates and Joint Ventures now specifies that the election must be made separately per associate or joint venture and at the time of initial recognition of such investment.
Further, if an entity is not an investment entity, but has interests in an associate or joint venture which is an investment entity, then the entity may retain the fair value measurement of the associate or joint venture. The amendment now provides that such election must be made separately for each investment entity associate or joint venture.
The effective date of the amendment is for years beginning on or after January 1, 2018.
The company expects to adopt the amendment for the first time in the 2018 financial statements.
It is unlikely that the amendment will have a material impact on the company’s financial statements.
Notes to the Financial Statements
80N a s c o n A l l i e d I n d u s t r i e s P L C A n n u a l R e p o r t 2 0 1 7

Amendments to IFRS 1: Annual Improvements to IFRS 2014 - 2016 cycleThe amendment to IFRS 1 First Time Adoption of International Financial Reporting Standards deleted certain short term
exemptions concerning disclosures of financial assets, employee benefits and investment entities from IFRS 1.
The effective date of the amendment is for years beginning on or after January 1, 2018.
The company expects to adopt the amendment for the first time in the 2018 financial statements.
It is unlikely that the amendment will have a material impact on the company’s financial statements.
Transfers of Investment Property: Amendments to IAS 40The amendment deals specifically with circumstances under which property must be transferred to or from investment property.
The amendment now requires that a change in use of property only occurs when the property first meets, or ceases to meet, the definition of investment property and that there is evidence of a change in use. The amendment specifies that a change in management’s intentions for use of the property, do not, in isolation, provide evidence of a change in use.
The effective date of the amendment is for years beginning on or after January 1, 2018.
The company expects to adopt the amendment for the first time in the 2018 financial statements.
It is unlikely that the amendment will have a material impact on the company’s financial statements.
Foreign Currency Transactions and Advance ConsiderationThe interpretation applies to circumstances when an entity has either paid or received an amount of consideration in advance and in a foreign currency, resulting in a non-monetary asset or liability being recognised. The specific issue addressed by the interpretation is how to determine the date of the transaction for the purposes of determining the exchange rate to use on the initial recognition of the related asset, expense or income when the non-monetary asset or liability is derecognised. The interpretation specifies that the date of the transaction, for purposes of determining the exchange rate to apply, is the date on which the entity initially recognises the non-monetary asset or liability.
The effective date of the interpretation is for years beginning on or after January 1, 2018.
The company expects to adopt the interpretation for the first time in the 2018 financial statements.
It is unlikely that the interpretation will have a material impact on the company’s financial statements.
Amendments to IFRS 4: Insurance ContractsThe amendment provides a temporary exemption that permits, but does not require, insurers, under specified criteria, to apply IAS 39 Financial Instruments: Recognition and Measurement, rather than IFRS 9 Financial Instruments for annual periods beginning before 1 January 2021. The exemption is only available provided the insurer has not previously applied any version of IFRS 9 (with some exceptions) and that the activities are predominantly connected with insurance.
A further exemption has been provided from IAS 28 Investments in Associates and Joint Ventures. In terms of the exemption, an insurer is exempt from applying uniform accounting policies when applying the equity method, insofar as the IAS 39/IFRS 9 exemption is applied. Thus, the relevant accounting policies of the associate or joint venture are retained if the entity applies the IFRS9/IAS 39 exemption
Notes to the Financial Statements
81N a s c o n A l l i e d I n d u s t r i e s P L C A n n u a l R e p o r t 2 0 1 7
Su
pp
lem
en
tary
In
form
ati
on
Intr
od
ucti
on
Op
era
tio
ns
Co
rpo
rate
Go
ve
rnan
ce
Fin
an
cia
ls

and the associate or joint venture does not apply the exemption, or visa versa.
The amendment further permits, but does not require, insurers to apply the “overlay approach” to designated financial assets when it first applies IFRS 9. The overlay approach requires the entity to reclassify between profit or loss and other comprehensive income, an amount which results in the profit or loss of the designated financial assets at the end of the reporting period being equal to what it would have been had IAS 39 been applied to the designated financial assets.
Additional disclosures are required as a result of the amendment.
The effective date of the amendment is for years beginning on or after January 1, 2018.
The company expects to adopt the amendment for the first time in the 2018 financial statements.
It is unlikely that the amendment will have a material impact on the company’s financial statements because the Company is not in business of insurance.
Amendments to IFRS 4: Applying IFRS 9 Financial Instruments with IFRS 4 Insurance ContractsThe amendment to IFRS 4 provides a temporary exemption, allowing insurers to apply IAS 39 rather than IFRS 9. The exemption only applies in certain circumstances and only for annual periods beginning before 1 January 2021.
The exemption also introduces an “overlay approach” in specific circumstances. This approach requires the insurer to reclassify an amount between other comprehensive income and profit or loss. This results in the profit or loss for designated financial assets being the same as if the insurer had applied IAS 39 rather than IFRS 9.
The effective date of the amendment is for years beginning on or after January 1, 2018.
The company expects to adopt the amendment for the first time in the 2017 financial statements.
It is unlikely that the amendment will have a material impact on the company’s financial statements.
Amendments to IFRS 2: Classification and Measurement of Share-based Payment TransactionsThe amendment now specifies the treatment of vesting and non-vesting conditions with regards to cash-settled share-based payment transactions. The treatment is essentially similar to the treatment of such conditions for equity-settled share-based payment transactions. That is, non-market vesting conditions are taken into consideration when estimating the number of awards which are expected to vest (and which ultimately vest), while market conditions and other non-vesting conditions are taken into consideration when determining the fair value of the share based payment liability, both initially and subsequently.
The amendment also provides for share-based payment transactions with a net settlement feature for withholding tax obligations. Essentially, where the entity is required to withhold part of the equity instruments equal to the tax obligation, the entity is required to account for the payment to tax authorities as a reduction in equity, except to the extent that the payment exceeds the fair value of the equity instruments withheld at net settlement date. The entity should also disclose the amount that it expects to transfer to tax authorities in terms of such transactions.
The amendment further provides guidance in terms of modifications which convert cash-settled share-based payment transactions to equity -settled share-based payment transactions. For such modifications, the equity-settled share based payment transaction is measured by reference to the fair value of the equity instruments granted at modification date, to the extent to which goods or services have been received. The liability for cash-settled share based payment transactions is derecognised on
Notes to the Financial Statements
82N a s c o n A l l i e d I n d u s t r i e s P L C A n n u a l R e p o r t 2 0 1 7
the modification date. Any difference between the two is recognised immediately in profit or loss.
The effective date of the amendment is for years beginning on or after January 1, 2018.
The company expects to adopt the amendment for the first time in the 2017 financial statements.
It is unlikely that the amendment will have a material impact on the company’s financial statements.
Amendments to IFRS 15: Clarifications to IFRS 15 Revenue from Contracts with CustomersThe amendment provides clarification and further guidance regarding certain issues in IFRS 15. These items include guidance in assessing whether promises to transfer goods or services are separately identifiable; guidance regarding agent versus principal considerations; and guidance regarding licenses and royalties.
The effective date of the amendment is for years beginning on or after January 1, 2018.
The company expects to adopt the amendment for the first time in the 2018 financial statements.
It is unlikely that the amendment will have a material impact on the company’s financial statements.
IFRS 9 Financial InstrumentsIn July 2014, the IASB issued the final version of IFRS 9 Financial Instruments that replaces IAS 39 Financial Instruments:
Recognition and Measurement and all previous versions of IFRS 9. IFRS 9 brings together all three aspects of the accounting for financial instruments project: classification and measurement, impairment and hedge accounting. IFRS 9 is effective for annual periods beginning on or after 1 January 2018, with early application permitted. Except for hedge accounting, retrospective application is required but providing comparative information is not compulsory. For hedge accounting, the requirements are generally applied prospectively, with some limited exceptions.
The Company has adopted the new standard on the required effective date and will not restate comparative information. During 2017, the Company has performed a detailed impact assessment of all three aspects of IFRS 9. This assessment is based on currently available information and may be subject to changes arising from further reasonable and supportable information being made available to the Company in 2018. Overall, the Company expects no significant impact on its statement of financial position and equity.
The Company expects an insignificant decrease in the loss allowance resulting in an impact on equity as discussed below.
(a) Classification and measure:The Company does not expect a significant impact on its balance sheet or equity on applying the classification and measurement requirements of IFRS 9.Bank balances, trade receivables as well as other receivables that qualify as financial instruments under IFRS 9 are held to collect contractual cash flows and are expected to give rise to cash flows representing solely payments of principal and interest. The Company analysed the contractual cash flow characteristics of those instruments and concluded that they meet the criteria for amortised cost measurement under IFRS 9. Therefore, reclassification for these instruments is not required.(b) Impairment:IFRS 9 requires the Company to record expected credit losses on all of its’ for all its instruments to be measured at amortized cost or fair value through OCI within the scope of IFRS impairment, either on a 12-month or lifetime basis.
Notes to the Financial Statements
83N a s c o n A l l i e d I n d u s t r i e s P L C A n n u a l R e p o r t 2 0 1 7
Su
pp
lem
en
tary
In
form
ati
on
Intr
od
ucti
on
Op
era
tio
ns
Co
rpo
rate
Go
ve
rnan
ce
Fin
an
cia
ls

The Company will apply the simplified approach and record lifetime expected losses on all trade receivables and similar assets.The Company has estimated its loss allowance under the expected credit loss model and determined that the impact of IFRS 9 impairment on its financial statements based on the receivables exposure as at 31 December 2017 is insignificant.
IFRS 15 Revenue from Contracts with CustomersIFRS 15 supersedes IAS 11 Construction contracts; IAS 18 Revenue; IFRIC 13 Customer Loyalty Programmes; IFRIC 15 Agreements for the construction of Real Estate; IFRIC 18 Transfers of Assets from Customers and SIC 31 Revenue - Barter Transactions Involving Advertising Services.
The core principle of IFRS 15 is that an entity recognises revenue to depict the transfer of promised goods or services to customers in an amount that reflects the consideration to which the entity expects to be entitled in exchange for those goods or services. An entity recognises revenue in accordance with that core principle by applying the following steps:
Identify the contract(s) with a customer
Identify the performance obligations in the contract
Determine the transaction price
Allocate the transaction price to the performance obligations in the contract
Recognise revenue when (or as) the entity satisfies a performance obligation.
Impact analysis.The Company plans to adopt the new standard on the required effective date using the Modified approach. Based on the impact assessment carried out in 2017, The Company has explained below the potential impact of adoption of the standard, although the directors are still assessing the full impact on the financial statements. The below preliminary assessment is subject to change when the complete impact assessment is completed.
Impact of adoptiona. Performance ObligationsUnder IFRS 15, the Company is required to identify the performance obligations in each contract and allocate transaction price based on the identified performance obligation. Distinct good or service is identified when customers can enjoy the benefit from the good or service on its own or together with other readily available resources and the good or service separately identifiable from other promises in the contract.
This has no current impact on the financial statement and potentially will have no impact as contractual terms are being reviewed and updated to reflect single performance obligation.
b. Right of returnUnder IFRS 15, because the contract allows the customer to return the products, the consideration received from the customer is variable. Although the Company grants customers right of return, the Company has assessed the impact of the returns on revenue as insignificant on a portfolio basis. However, the Company expects to provide detailed disclosure of the judgements exercised in adopting a portfolio approach in its 2018 financial statements.
c. Presentation and disclosure requirementsThe presentation and disclosure requirements in IFRS 15 are more detailed than under current IFRS. The presentation requirements represent a significant change from current practice and significantly
Notes to the Financial Statements
84N a s c o n A l l i e d I n d u s t r i e s P L C A n n u a l R e p o r t 2 0 1 7

increases the volume of disclosures required in the financial statements. However, this will have no material impact on the Company’s financial statements. This assessment is based on currently available information and may be subject to changes arising from further reasonable and supportable information being made available to the Company in 2018. In addition, as required by IFRS 15, the Company will disaggregate revenue recognised.
The effective date of the standard is for year beginning on or after January 1, 2018.
The company expects to adopt the standard for the first time in the 2018 financial statements.
It is unlikely that the standard will have a material impact on the company’s financial statements.
2017 2016
5. Revenue ₦‘000 ₦‘000Revenue (Note 5.1) 23,205,584 15,855,872
Freight income (Note 5.3) 3,858,741 2,435,920
27,064,325 18,291,792
5.1 The amount represents revenue realised during the year on the sale of edible, refined, bulk, industrial salt as well as Seasoning and Vegetable Oil.
5.2 None of the major customers contributed up to 10% of the total revenue earned in the year ended December 31, 2017.
Our customers include leading blue chip companies in Nigeria, such as manufacturers of confectioneries, seasonings, refined edible oil, processed leather, noodles and oil industries. They buy industrial salts of different grades and specifications.
5.3 The Company provides freight services to customers by transporting Salt and Vegetable Oil purchased to their destinations. Freight income represents revenue earned in respect of this during the year. The associated cost of running the freight services is rendered in cost of sales.
DistributorsThe Company sells it’s products directly to distributors who redistribute to small wholesalers, confectioners, supermarkets and retailers. Salt retail packs come in various sizes 250g, 500g and 1kg and are sold under the brand name DANGOTE REFINED SALT. Seasoning is sold under the brand name DANQ, Tomato Paste sold as DANGOTE TOMATO PASTE and Vegetable Oil sold as DANGOTE VEGETABLE OIL.
6. Segmental informationThe company has identified reportable segments which represent the structure used by the Management to make key operating decisions and assess performance.
The company’s reportable segments are treated as operating segments which are differentiated by the activities that each undertake, the products they manufacture and the markets they operate in
These reportable segments as well as the products and services from which each of them derives revenue are set out below:
Segmental revenue and resultsThe Management assesses the performance of the operating segments based on the measure of EBITDA. This measure excludes the effects of non-recurring expenditure from the operating segments such as restructure costs, legal expenses and goodwill impairments when the impairment is the result of an isolated, non recurring event. The measure also excludes the effects of equity-settled share-based payments and unrealised gains/losses on financial instruments. Interest income and expenditure are not
Notes to the Financial Statements
85N a s c o n A l l i e d I n d u s t r i e s P L C A n n u a l R e p o r t 2 0 1 7
Su
pp
lem
en
tary
In
form
ati
on
Intr
od
ucti
on
Op
era
tio
ns
Co
rpo
rate
Go
ve
rnan
ce
Fin
an
cia
ls

allocated to operating segments, as this type of activity is driven by the central treasury function.The results of discontinued operations are not included in the measure of EBITDA. This measure is consistent with all prior periods which are presented.
Transactions between related Companies take place at arms length.
The segment information provided from the Management is presented below. The information presented includes a reconciliation of the company’s EBITDA to net profit before tax and discontinued operations.
2017
Revenue
Segment revenue
Segment cost of sales revenue
Segment Profit
₦‘000 ₦‘000 ₦‘000Salt 22,247,384 (11,620,182) 10,627,202
Seasoning 765,296 (639,564) 125,732
Tomato Paste - (32,840) (32,840)
Vegetable Oil 192,904 (335,623) (142,719)
Freight income 3,858,741 (4,442,101) (583,360)
Total 27,064,325 (17,070,310) 9,994,015
2016
Revenue
Segment revenue
Segment cost of sales revenue
Segment Profit
₦‘000 ₦‘000 ₦‘000Salt 14,823,697 (8,206,653) 6,617,044
Seasoning 544,458 (453,779) 90,679
Tomato Paste 8,342 (50,386) (42,044)
Vegetable Oil 479,375 (701,411) (222,036)
Freight income 2,435,920 (2,961,869) (525,949)
Total 18,291,792 (12,374,098) 5,917,694
Notes to the Financial Statements
86N a s c o n A l l i e d I n d u s t r i e s P L C A n n u a l R e p o r t 2 0 1 7

Segment assets and liabilitiesThe amounts provided from the Management with respect to total assets are measured in a manner consistent with that of the financial statements. These assets are allocated based on the operations of the segment and the physical location of the asset.
Investments in shares held by the company and deferred tax assets are not considered to be segment assets and are not allocated to segments.
Capital expenditure reflects additions to non-current assets, other than financial instruments, deferred tax assets, post employment benefit assets and rights arising under insurance contracts.
The amounts provided from the Management with respect to total liabilities are measured in a manner consistent with that of the financial statements. These liabilities are allocated based on the operations of the segment.
The company’s interest-bearing liabilities are not considered to be segment liabilities but rather are managed by the company’s treasury function.
The table below provides information on segment assets and liabilities as well as a reconciliation to total assets and liabilities as per the statement of financial position.
2017 Total assets Total liabilities
₦‘000 ₦‘000Salt 22,287,531 13,659,538
Seasoning 1,175,305 180,986
Tomato Paste 517,862 -
Vegetable oil 2,245,256 -
Freight 3,897,293 2,813,376
Total 30,123,247 16,653,900
UnallocatedRetirement benefit obligation - 222,134
Deferred tax - 1,712,001
Total as per statement of financial position 30,123,247 18,588,035
2016 Total assets Total liabilities
₦‘000 ₦‘000Salt 19,219,804 14,660,205
Seasoning 2,041,329 254,865
Tomato Paste 548,244 -
Vegetable oil 2,245,837 -
Freight 548,053 248,453
Total 24,603,267 15,163,523
UnallocatedRetirement benefit obligation - 249,635
Deferred tax - 1,143,882
Total as per statement of financial position 24,603,267 16,557,040
Notes to the Financial Statements
87N a s c o n A l l i e d I n d u s t r i e s P L C A n n u a l R e p o r t 2 0 1 7
Su
pp
lem
en
tary
In
form
ati
on
Intr
od
ucti
on
Op
era
tio
ns
Co
rpo
rate
Go
ve
rnan
ce
Fin
an
cia
ls
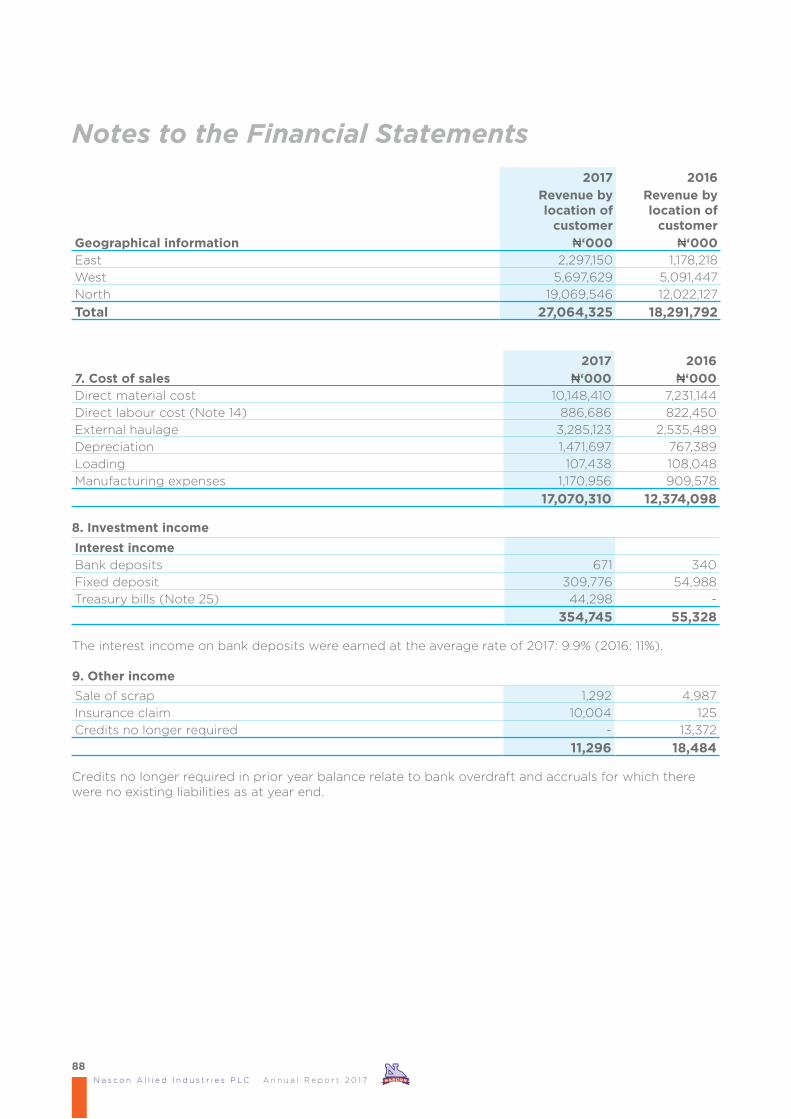
2017 2016
Revenue by location of
customer
Revenue by location of
customer
Geographical information ₦‘000 ₦‘000East 2,297,150 1,178,218
West 5,697,629 5,091,447
North 19,069,546 12,022,127
Total 27,064,325 18,291,792
2017 2016
7. Cost of sales ₦‘000 ₦‘000Direct material cost 10,148,410 7,231,144
Direct labour cost (Note 14) 886,686 822,450
External haulage 3,285,123 2,535,489
Depreciation 1,471,697 767,389
Loading 107,438 108,048
Manufacturing expenses 1,170,956 909,578
17,070,310 12,374,098
8. Investment income
Interest incomeBank deposits 671 340
Fixed deposit 309,776 54,988
Treasury bills (Note 25) 44,298 -
354,745 55,328
The interest income on bank deposits were earned at the average rate of 2017: 9.9% (2016: 11%).
9. Other income
Sale of scrap 1,292 4,987
Insurance claim 10,004 125
Credits no longer required - 13,372
11,296 18,484
Credits no longer required in prior year balance relate to bank overdraft and accruals for which there were no existing liabilities as at year end.
Notes to the Financial Statements
88N a s c o n A l l i e d I n d u s t r i e s P L C A n n u a l R e p o r t 2 0 1 7

10. Operating expense
2017 2016
10.1 Distribution Expenses ₦‘000 ₦‘000Market activation 177,772 123,286
Branding expenses 426,946 514,903
604,718 638,189
10.2 Administrative expensesManagement fees 90,839 141,728
Auditors remuneration 17,400 17,400
Provision for bad debts 42,454 74,931
Bank charges 30,513 32,038
Cleaning 21,330 15,525
Consulting and professional fees 25,551 30,897
Depreciation (Note 11) 208,551 153,140
Amortisation (Note 11) 47,374 93,810
Directors’ remuneration 170,744 144,138
Employee costs 671,412 431,323
Entertainment 13,599 12,800
Business development 18,194 10,809
Insurance 27,431 26,186
Rent and rates 10,584 17,225
Petrol and oil 15,150 11,999
Printing and stationery 14,224 19,780
Loss on sale of assets 1,868 22,171
Repairs and maintenance 39,135 28,985
Secretarial fees 110,098 39,024
Security 23,911 18,322
Staff welfare 51,141 33,196
Telephone and fax 82,224 57,983
Travel - local 35,535 38,812
Travel - overseas 4,475 7,093
1,773,737 1,479,315
11. Depreciation, amortisation and impairmentsThe following items are included within depreciation, amortisation and impairments:
Total depreciation, amortisation and impairments
Depreciation (Administrative expenses) 208,551 153,140
Depreciation (Cost of sales) 1,471,698 767,391
1,680,249 920,531Amortisation 47,374 93,810
1,727,623 1,014,341
12. Auditors’ remuneration
Fees 17,400 17,400
13. Finance costs
Interest on borrowings 72,113 357,671
Notes to the Financial Statements
89N a s c o n A l l i e d I n d u s t r i e s P L C A n n u a l R e p o r t 2 0 1 7
Su
pp
lem
en
tary
In
form
ati
on
Intr
od
ucti
on
Op
era
tio
ns
Co
rpo
rate
Go
ve
rnan
ce
Fin
an
cia
ls
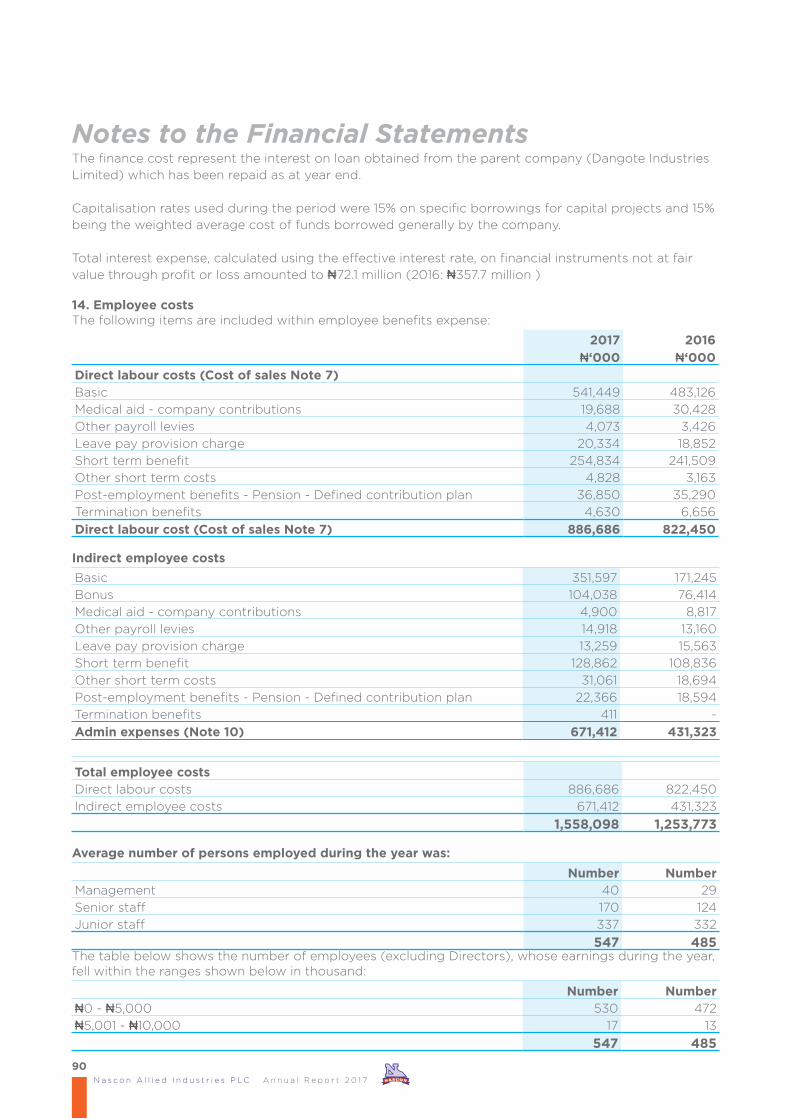
The finance cost represent the interest on loan obtained from the parent company (Dangote Industries Limited) which has been repaid as at year end.
Capitalisation rates used during the period were 15% on specific borrowings for capital projects and 15% being the weighted average cost of funds borrowed generally by the company.
Total interest expense, calculated using the effective interest rate, on financial instruments not at fair value through profit or loss amounted to ₦72.1 million (2016: ₦357.7 million )
14. Employee costsThe following items are included within employee benefits expense:
2017 2016
₦‘000 ₦‘000
Direct labour costs (Cost of sales Note 7)Basic 541,449 483,126
Medical aid - company contributions 19,688 30,428
Other payroll levies 4,073 3,426
Leave pay provision charge 20,334 18,852
Short term benefit 254,834 241,509
Other short term costs 4,828 3,163
Post-employment benefits - Pension - Defined contribution plan 36,850 35,290
Termination benefits 4,630 6,656
Direct labour cost (Cost of sales Note 7) 886,686 822,450
Indirect employee costs
Basic 351,597 171,245
Bonus 104,038 76,414
Medical aid - company contributions 4,900 8,817
Other payroll levies 14,918 13,160
Leave pay provision charge 13,259 15,563
Short term benefit 128,862 108,836
Other short term costs 31,061 18,694
Post-employment benefits - Pension - Defined contribution plan 22,366 18,594
Termination benefits 411 -
Admin expenses (Note 10) 671,412 431,323
Total employee costsDirect labour costs 886,686 822,450
Indirect employee costs 671,412 431,323
1,558,098 1,253,773
Average number of persons employed during the year was:
Number NumberManagement 40 29
Senior staff 170 124
Junior staff 337 332
547 485The table below shows the number of employees (excluding Directors), whose earnings during the year, fell within the ranges shown below in thousand:
Number Number₦0 - ₦5,000 530 472
₦5,001 - ₦10,000 17 13
547 485
Notes to the Financial Statements
90N a s c o n A l l i e d I n d u s t r i e s P L C A n n u a l R e p o r t 2 0 1 7

15. Operating profitOperating profit for the year is stated after charging/(crediting) the following:
2017 2016
₦‘000 ₦‘000Loss on sale of property, plant and equipment 1,868 22,171
Auditors remuneration 17,400 17,400
Amortisation on intangible assets 47,374 93,810
Depreciation on property, plant and equipment 1,680,248 920,529
Employee costs (excluding directors) 1,558,098 1,253,773
Directors’ remuneration 170,744 144,138
16. TaxationMajor components of the tax expense
CurrentLocal income tax 1,805,645 799,938
Education tax 192,131 73,337
1,997,776 873,275Deferred
In respect of current year (Note 17) 568,120 227,873
2,565,896 1,101,148
The charge for taxation in these financial statements is based on the provisions of the Companies Income Tax Act, CAP C21 LFN 2004 and the Education Tax Act CAP E4, LFN 2004. Corporation Tax and Education Tax is calculated at 30% and 2% respectively of the estimated taxable profit for the year. The charge for the year can be reconciled to the profit per the statement of comprehensive income as follows:
Reconciliation of the tax expense
Reconciliation between accounting profit and tax expense.
2017 2016
₦‘000 ₦‘000Profit before tax from continuing operations 7,909,488 3,516,331
Tax at the applicable tax rate of 30% (2016: 30%) 2,372,846 1,054,899
Education tax 192,131 73,337
Tax effect of adjustments on taxable incomeEffect of concessions (reseacrch and development and other allowances)
(10,133) (11,089)
Additional assessment from tax audit 11,351 -
Effect of non - taxable expenses (299) (15,999)
2,565,896 1,101,148
Current tax liabilities in the statement of financial positionAt January 1, 2017 872,225 529,162
Charge for the year 1,997,776 873,275
Payment during the year (884,626) (530,212)
At December 31, 2017 1,985,375 872,225
Notes to the Financial Statements
91N a s c o n A l l i e d I n d u s t r i e s P L C A n n u a l R e p o r t 2 0 1 7
Su
pp
lem
en
tary
In
form
ati
on
Intr
od
ucti
on
Op
era
tio
ns
Co
rpo
rate
Go
ve
rnan
ce
Fin
an
cia
ls

Analysis of deferred tax is made up of
December 31, 2017Deferred tax (asset) or liability in relation to:
At January 1,
2017Recognize in profit or loss
Recognize in other
comprehensive income
At December
31, 2017
₦‘000 ₦‘000 ₦‘000 ₦‘000Property, plant and equipment 1,247,742 572,905 - 1,820,647
Allowance for doubtful debt (103,861) (4,785) - (108,646)
1,143,881 568,120 - 1,712,001
December 31, 2016Deferred tax (asset) or liability in relation to:
At January 1,
2016Recognize in profit or loss
Recognize in other
comprehensive income
At December
31, 2016
₦‘000 ₦‘000 ₦‘000 ₦‘000Property, plant and equipment 1,251,037 (3,294) - 1,247,743
Allowance for doubtful debt (335,027) 231,166 - (103,861)
916,010 227,872 - 1,143,882
18. Earnings per share
2017 2016
Basic earnings per shareFrom continuing operations (kobo per share) 202 91
Reconciliation of profit or loss for the year to basic earnings
₦‘000 ₦‘000Profit or loss for the year attributable to equity holders of the parent 5,343,592 2,415,183
Adjusted for:After tax effect of preference dividends - -
5,343,592 2,415,183Weighted average number of ordinary shares as at 31 December 2017 (‘000) 2,649,438 2,649,438
Notes to the Financial Statements 17. Deferred tax The deferred tax assets and the deferred tax liability relate to income tax in the same jurisdiction, and the law allows net settlement. Therefore, they have been offset in the statement of financial position as follows:
2017 2016
₦‘000 ₦‘000Deferred tax liability (1,820,647) (1,247,743)
Deferred tax asset 108,646 103,861
Total net deferred tax liability (1,712,001) (1,143,882)
Reconciliation of deferred tax asset / (liability)At January 1, 2017 (1,143,882) (916,009)
Temporary difference movement in the year (568,120) (227,873)
(1,712,001) (1,143,882)
Deferred tax as at December 31, 2017 relating to property, plant & equipment was as a result of differences between the rates of depreciation adopted for accounting purposes and the rates of capital allowances granted for tax purposes.
92N a s c o n A l l i e d I n d u s t r i e s P L C A n n u a l R e p o r t 2 0 1 7
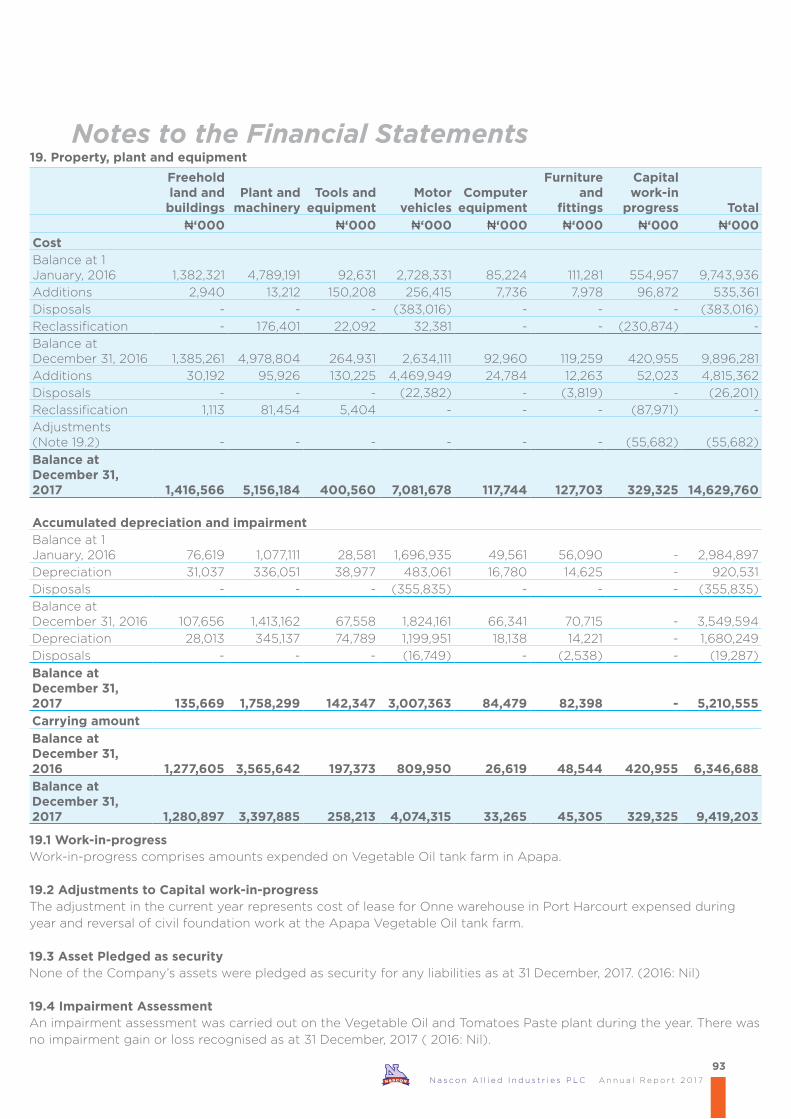
19. Property, plant and equipment
Freehold land and buildings
Plant and machinery
Tools and equipment
Motor vehicles
Computer equipment
Furniture and
fittings
Capital work-in
progress Total
₦‘000 ₦‘000 ₦‘000 ₦‘000 ₦‘000 ₦‘000 ₦‘000
CostBalance at 1 January, 2016 1,382,321 4,789,191 92,631 2,728,331 85,224 111,281 554,957 9,743,936
Additions 2,940 13,212 150,208 256,415 7,736 7,978 96,872 535,361
Disposals - - - (383,016) - - - (383,016)
Reclassification - 176,401 22,092 32,381 - - (230,874) -
Balance at December 31, 2016 1,385,261 4,978,804 264,931 2,634,111 92,960 119,259 420,955 9,896,281
Additions 30,192 95,926 130,225 4,469,949 24,784 12,263 52,023 4,815,362
Disposals - - - (22,382) - (3,819) - (26,201)
Reclassification 1,113 81,454 5,404 - - - (87,971) -
Adjustments (Note 19.2) - - - - - - (55,682) (55,682)
Balance at December 31, 2017 1,416,566 5,156,184 400,560 7,081,678 117,744 127,703 329,325 14,629,760
Accumulated depreciation and impairmentBalance at 1 January, 2016 76,619 1,077,111 28,581 1,696,935 49,561 56,090 - 2,984,897
Depreciation 31,037 336,051 38,977 483,061 16,780 14,625 - 920,531
Disposals - - - (355,835) - - - (355,835)
Balance at December 31, 2016 107,656 1,413,162 67,558 1,824,161 66,341 70,715 - 3,549,594
Depreciation 28,013 345,137 74,789 1,199,951 18,138 14,221 - 1,680,249
Disposals - - - (16,749) - (2,538) - (19,287)
Balance at December 31, 2017 135,669 1,758,299 142,347 3,007,363 84,479 82,398 - 5,210,555
Carrying amount
Balance at December 31, 2016 1,277,605 3,565,642 197,373 809,950 26,619 48,544 420,955 6,346,688
Balance at December 31, 2017 1,280,897 3,397,885 258,213 4,074,315 33,265 45,305 329,325 9,419,203
19.1 Work-in-progressWork-in-progress comprises amounts expended on Vegetable Oil tank farm in Apapa.
19.2 Adjustments to Capital work-in-progressThe adjustment in the current year represents cost of lease for Onne warehouse in Port Harcourt expensed during year and reversal of civil foundation work at the Apapa Vegetable Oil tank farm.
19.3 Asset Pledged as securityNone of the Company’s assets were pledged as security for any liabilities as at 31 December, 2017. (2016: Nil)
19.4 Impairment AssessmentAn impairment assessment was carried out on the Vegetable Oil and Tomatoes Paste plant during the year. There was no impairment gain or loss recognised as at 31 December, 2017 ( 2016: Nil).
Notes to the Financial Statements
93N a s c o n A l l i e d I n d u s t r i e s P L C A n n u a l R e p o r t 2 0 1 7

20. Intangible assets
Cost Computer software Total
₦‘000 ₦‘000Balance as at 1 January 2016 - -
Additions 281,429 281,429
Balance as at December 31, 2016 281,429 281,429
Additions - -
Balance as at December 31, 2017 281,429 281,429
AmortizationBalance as at January 1, 2016 140,245 140,245
Amortization expenses 93,810 93,810
Balance as at December 31, 2016 234,055 234,055
Amortization expenses 47,374 47,374
Balance as at December 31, 2017 281,429 281,429
Net Book Value
Balance as at December 31, 2016 47,374 47,374
Balance as at December 31, 2017 - -
Intangible asset (computer software) represents software which has a useful life of 3 years and amortized on a straight-line basis over the year.
21. Other assets 2017 2016
₦‘000 ₦‘000
Prepayments:Rent prepaid 24,251 35,376
Insurance prepaid 1,425 1,884
Prepayment-Others 9,354 -
Deposit for import 2,103,156 2,780,893
2,138,186 2,818,153
Non - current 1,838 5,513
Current 2,136,348 2,812,640
2,138,186 2,818,153
22. Inventories
Raw materials 1,851,369 1,778,568
Finished goods 237,716 251,855
Spare parts and consumables 491,044 139,994
Oil and lubricants 51,951 43,256
Packaging materials 384,707 506,559
3,016,787 2,720,232
22.1 Inventory pledged as securityNo inventory was pledged as security for any liability.
The cost of inventories recognised as an expense during the year in respect of continuing operations was ₦10.148 billion (2016:₦7.231 billion).
Notes to the Financial Statements
94N a s c o n A l l i e d I n d u s t r i e s P L C A n n u a l R e p o r t 2 0 1 7

2017 2016
23. Trade and other receivables ₦‘000 ₦‘000Trade receivables 585,116 285,836
Impairment for doubtful debts (12,688) (12,688)
572,428 273,148
Amounts due from related parties (37.1) 4,390,775 9,745,773
Employee loans and advance 30,018 38,450
Other receivable (Note 23.1) 610,319 121,380
5,603,540 10,178,751
5,603,540 10,178,751
23.1 Other receivables
Other receivables include:
Advance to vendors 652,773 120,978
Insurance claim receivables - 402
Provision for doubful debt (42,454) -
610,319 121,380
Trade and other receivables pledged as securityTrade receivables disclosed are carried at cost less allowance for doubtful debts.
The average credit period taken on sales of goods is 30 days. No interest is charged on outstanding trade receivables. It is the Company’s policy to recognise a 100% allowance on receivables that are due for over 365 days based on management judgment that those receivables are unlikely to be recovered. Allowances for doubtful debts are recognised against trade receivables between 60 days and 365 days based on estimated irrecoverable amounts determined by reference to past default experience of the counterparty and an analysis of their current financial position.
Trade receivables disclosed include amounts (see below for aged analysis) that are past due at the end of the reporting period for which the Company has not recognised an allowance for doubtful debts because there has not been a significant change in credit quality.
23.2 Credit quality of trade and other receivablesThe credit quality of trade and other receivables that are neither past nor due nor impaired can be assessed by reference to external credit ratings (if available) or to historical information about counterparty default rates:
2017 2016
Movement in allowance for doubtful debt ₦‘000 ₦‘000At 1 January 12,688 803,701
Additions - 74,931
Allowance written off - (803,701)
Transfers to related company (Note 37.1) - (62,243)
At 31 December, 2017 12,688 12,688
Notes to the Financial Statements
95N a s c o n A l l i e d I n d u s t r i e s P L C A n n u a l R e p o r t 2 0 1 7
Su
pp
lem
en
tary
In
form
ati
on
Intr
od
ucti
on
Op
era
tio
ns
Co
rpo
rate
Go
ve
rnan
ce
Fin
an
cia
ls

23.3 Trade and other receivables past due but not impairedTrade and other receivables which are less than 3 months past due are not considered to be impaired. At December 31, 2017, N62.1 million (2016: N124.2 million) were past due but not impaired.The ageing of amounts past due but not impaired is as follows:
2017 2016
₦‘000 ₦‘0000 - 30 days 483,332 203,767
31 - 60 days 76,030 45,658
61 - 90 days 13,066 23,723
572,428 273,148
Trade and other receivables impairedIn determining the recoverability of a trade receivable, the Company considers any change in credit quality of the trade receivable from the date credit was initially granted up to the end of the reporting period. The concentration of credit risk is limited due to the fact that the customer base is large and unrelated.The ageing of these receivables is as follows:
2017 2016
₦‘000 ₦‘00060 - 90 days - -
91 - 120 days - -
360+ days 12,688 12,688
12,688 12,688
24. Cash and bank balancesCash and cash equivalents consist of:
Cash on hand 7,495 7,165
Bank balances 9,469,245 2,484,904
9,476,740 2,492,069
25. Other financial assetsShort term investments 468,791 -
Current assetsShort term investments 468,791 -
The short term investments represent shareholders unclaimed dividend invested in treasury bills earning 18.5% per annum (Note 8) and maturing 14 June, 2018.
2017 2016
26. Share capital ₦‘000 ₦‘000
Authorised4,000,000,000 Ordinary shares of 50k each 2,000,000 2,000,000
Issued and fully paid2,649,438,378 ordinary shares of 50k each 1,324,719 1,324,719
27. Share premiumIssued
Share premium 434,037 434,037
Reconciliation of number of shares issued:Issue of shares – ordinary shares 156,793 156,793
Conversion of debentures 404,303 404,303
Less: Deferred charges written off (127,059) (127,059)
434,037 434,037
Notes to the Financial Statements
96N a s c o n A l l i e d I n d u s t r i e s P L C A n n u a l R e p o r t 2 0 1 7

2017 2016
₦‘000 ₦‘000At 1 January 6,287,471 5,329,479
Profit for the year 5,343,592 2,415,183
Dividend declared and paid (1,854,607) (1,457,191)
9,776,456 6,287,471
At the Annual General Meeting held on 4th May 2017, the shareholders approved that dividend of ₦0.70 amounting to ₦1.854 billion be paid to shareholders for the year ended December 31, 2016. In respect of the current year, the Directors propose that a dividend of ₦1.50 per ordinary share be paid to shareholders. The dividend is subject to approval by shareholders at the Annual General Meeting and deduction of withholding tax at the appropriate rate. Consequently, it has not been included as a liability in these financial statements. The total estimated dividend to be paid is ₦3.974billion
29. Dividend payable
At 1 January - -
Dividend declared 1,854,607 1,457,191
Payments - Meristem Registrars (1,854,607) (1,457,191)
At 31 December, 2017 - -
30. BorrowingsHeld at amortised cost
Government grant 38,570 38,570
Non-current liabilitiesAt amortised cost 38,570 38,570
At the time of privatisation in 1992, the debt owned the Federal Government of Nigeria, by the Company was restructured by the Bureau for Public Enterprise. The Board of Directors has taken steps to obtain a waiver of the loan from the Federal Government of Nigeria.
31. Retirement benefits obligation31.1 Movement in gratuity
At 1 January, 2017 249,635 300,514
Current service cost - -
Benefit paid out (27,501) (50,879)
Balance as at 31 December, 2017 222,134 249,635
The entity was operating a defined benefit for its permanent Nigerian staff, the benefits under which are related to employees’ length of service and final remuneration.
However, the Board resolved to eliminate the scheme effective January, 2013. The balance as at 31 December, 2017 represent what is owned to staff who are still in the service from the old scheme.
As at December 31, 2017 no funds has been set up from which payments can be disbursed.
Notes to the Financial Statements
97N a s c o n A l l i e d I n d u s t r i e s P L C A n n u a l R e p o r t 2 0 1 7
Su
pp
lem
en
tary
In
form
ati
on
Intr
od
ucti
on
Op
era
tio
ns
Co
rpo
rate
Go
ve
rnan
ce
Fin
an
cia
ls

Defined contribution planThe employees of the company are members of a Pension plan administered under the Pension Reform Act of 2014. The assets of the plans are held separately from those of the Company and managed by Pension Fund Administrators. The scheme is funded in accordance with the Pension Reform Act of 2014 with the employee and employer contribution representing 8% and 10% respectively of the employee’s relevant emoluments effective July 2014.
2017 2016
Staff pension ₦‘000 ₦‘000At 1 January, 2017 8,317 7,192
Contributions during the year 135,078 97,227
Remittance in the year (143,395) (96,102)
At 31 December, 2017 - 8,317
The only obligation of the Company with respect to the pension scheme is to make the specified contributions. The total expense recognised in profit or loss of ₦75.04 million (2016: ₦53.38 million) represents contributions paid to this plan by the Company as at December 31, 2017.
2017 2016
32. Trade and other payables ₦‘000 ₦‘000Trade payables 440,663 927,912
Amounts due to related parties (Note 37.1) 11,270,430 9,823,997
Value added tax 48,642 20,854
Witholding tax payable 18,181 37,333
Unclaimed dividend 468,791 -
Staff pension (Note 31.1) - 8,317
Accrued audit fees 5,800 17,400
Other accrued expenses 1,168,054 488,921
Customers’ deposit 1,186,993 2,890,342
Other payables 22,401 37,652
14,629,955 14,252,728
Customers’ depositTrade payable 1,186,993 2,890,342
1,186,993 2,890,342
Customers’ deposits relate to amount deposited by customers for which delivery has not been made as at year end.
Trade creditors and accruals principally comprise amounts outstanding for trade purchases and ongoing costs. The average credit period taken for trade purchases is 30 days. For most suppliers no interest is charged on the trade payables. The Directors consider that the carrying amount of trade payables approximates to the fair value.
Notes to the Financial Statements
98N a s c o n A l l i e d I n d u s t r i e s P L C A n n u a l R e p o r t 2 0 1 7

2017 2016
33. Reconciliation of net income to net cash provided by operating activities
₦‘000 ₦‘000
Profit before taxation 7,909,488 3,516,331
Adjustments for:Depreciation 1,680,248 920,529
Amortisation 47,374 93,810
Loss on sale of assets 1,868 22,171
Investment income (354,745) (55,328)
Finance costs 72,113 357,671
Allowance for doubtful debt (42,454) (74,931)
PPE Adjustment (Note 19) 55,682 -
Changes in working capital:Inventories (296,555) (787,230)
Trade and other receivables 4,617,667 (5,251,274)
Other assets 679,967 (2,757,790)
Retirement benefit obligation (27,501) (50,879)
Trade and other payables 377,227 6,835,629
14,720,379 2,768,709
34. Categories of financial instruments
AssetsTrade and other receivables 5,603,540 10,178,751
Cash and bank 9,476,740 2,492,069
15,080,280 12,670,820LiabilitiesTrade and other payables 14,629,955 14,252,728
14,629,955 14,252,728
35. Risk management35.1 Capital risk managementThe capital structure of the company consists of net debt (which includes the borrowings disclosed in Note 30, offset by cash and bank balances and equity attributable to equity holders, comprising issued capital, reserves and retained earnings as disclosed in relevant notes in the financial statements.
The company monitors its capital structure to ensure that the target debt equity ratio as stated in its debt covenants is not exceeded. The Company is not subject to any externally imposed capital requirements.
35.2 Gearing ratiosThe Company is minimally geared for the reporting and comparative years.
35.3 Financial risk managementRisk management roles and responsibilities are assigned to stakeholders in the Company at three levels: The Board, Executive Committee and Line Managers.
The Board oversight is performed by the Board of Directors through the Finance and Establishment Committees.
The second level is performed by the Executive Management Committee (EXCO).
Notes to the Financial Statements
99N a s c o n A l l i e d I n d u s t r i e s P L C A n n u a l R e p o r t 2 0 1 7
Su
pp
lem
en
tary
In
form
ati
on
Intr
od
ucti
on
Op
era
tio
ns
Co
rpo
rate
Go
ve
rnan
ce
Fin
an
cia
ls

The third level is performed by all line managers under EXCO and their direct reports. They are required to comply with all risk policies and procedures and to manage risk exposures that arise from daily operations.
The Internal Audit Department provides an independent assurance of the risk framework. They assess compliance with established controls and recommendations for improvement in processes are escalated to relevant management, Audit Committee and Board of Directors.
The Company monitors and manages financial risks relating to its operations through an internal risk report which analyses exposures by degree and magnitude of risks. These risks include market risk (including currency risk and interest rate risk), credit risk and liquidity risk.
35.4 Foreign currency, financial and credit riskThe Company is exposed to foreign currency, financial and credit risks. The parent Company’s internal audit and risk management team is responsible for monitoring its exposure to each of the mentioned risks. This policy provides guidance over all treasury and finance related matters and is underpinned by delegated authority guidelines and detailed procedures. The main objectives of the policy are to ensure that sufficient liquidity exists to meet the operational needs of the business, to maintain the integrity and liquidity of the investment portfolio and to manage the impact of foreign exchange and interest rate volatility on the Company’s net income.
The Company undertakes transactions denominated in foreign currencies; consequently, exposures to exchange rate fluctuations arise. The Company is mainly exposed to USD. It monitors the movement in currency rates on an ongoing basis to mitigate the risk that the movements in the exchange rates may adversely affect the Company’s income or value of their holdings of financial instruments.
The carrying amounts of the Company’s foreign currency denominated monetary assets and monetary liabilities at the end of the reporting period are as follows.
Foreign currency exposure at the end of the reporting period
Liabilities Assets
2017 2016 2017 2016
₦‘000 ₦‘000 ₦‘000 ₦‘000US Dollars 4,746,740 2,218,607 4,779,249 9,613,434
The following table details the Company’s sensitivity to a 3%, increase and decrease in Naira against USD currency. Management believes that a 3% movement in either direction is reasonably possible at the balance sheet date.The sensitivity analyses below include outstanding balances of USD denominated assets and liabilities. A positive number indicates an increase in profit where Naira strengthens by 3% against the USD.. For a 3% weakening of Naira against the USD there would be an equal and opposite impact on profit, and the balances below would be negative.
2017 2016
₦‘000 ₦‘000Naira strengthens by 3% against the US dollar Profit / (loss) 975 233,861
Naira weakens by 3% against the US dollar Profit / (loss) (975) (233,861)
35.5 Sensitivity analysis for interest rate riskInterest rate risk is the risk that the fair value or future cash flows of a financial instrument will fluctuate because of changes in market interest rates. The Company’s exposure to the risk of changes in market interest rates is minimal as it does not have either floating or fixed interest bearing financial liabilities outstanding as the reporting date. Its cash and cash equivalents with financial institutions have fixed interest rates.
Notes to the Financial Statements
100N a s c o n A l l i e d I n d u s t r i e s P L C A n n u a l R e p o r t 2 0 1 7

Notes to the Financial Statements35.6 Credit risk managementCredit risk refers to the risk that a counterparty will default on its contractual obligations resulting in financial loss to the Company. The Company has adopted a policy of only dealing with creditworthy counterparty and obtaining sufficient collateral where appropriate (bank guaranties and insurance bonds), as a means of mitigating the risk of financial loss from defaults. The Company only transacts with entities that are rated the equivalent of investment grade and above. This information is supplied by independent rating agencies where available, and if not available, the Company uses other publicly available financial information, customers’ financial position, past trading relationship, its own trading records and other factors to rate its major customers. The Company’s exposure and the credit ratings of its counterparties are continuously monitored and the aggregate value of transactions concluded is spread amongst approved counterparties. Credit exposure is controlled by counterparty limits that are reviewed and approved by the risk management team periodically.
Trade receivables consist of a large number of customers, spread across diverse industries and geographical areas. Ongoing credit evaluation is performed on the financial condition of accounts receivable and where appropriate, credit guarantee insurance cover is purchased.
About 96% of the trade receivables are due from Bulk Commodities Limited, a related party, for rebate on purchase of Salt. The Company evaluates the concentration of risk with respect to trade receivables as low, as its customers are otherwise diverse including both corporate entities and lots of individual end users. The requirement for impairment is analyzed at each reporting date on an individual basis for corporate and individual customers.
The maximum credit risk at the reporting date was:
2017 2016
₦‘000 ₦‘000Trade receivables 572,428 273,148
Other receivables 610,319 121,380
Cash and cash equivalents 9,476,740 2,492,069
Employee loans and advance 30,018 38,450
Amount due from related party 4,390,775 9,745,773
35.7 Deposit with banks and other financial institutionsCredit risk from balances with banks and financial institutions is managed by the company’s treasury department in accordance with its corporate treasury policy that spells out counterparty limits, list of financial institutions that the company deals with and the maximum tenure of fixed term funds. Surplus funds are spread amongst these institutions and funds must be within credit limits assigned to each counterparty. Counterparty credit limits are reviewed by the Corporate Treasurer periodically and may be updated throughout the year. The limits are set to minimise the concentration of risks and therefore mitigate financial loss through the potential counterparty’s failure.
35.8 Liquidity risk management Ultimate responsibility for liquidity risk management rests with the Board of Directors, which has established an appropriate liquidity risk management framework for the management of the Company’s short- medium- and long-term funding and liquidity management requirements. The Company manages liquidity risk by maintaining adequate reserves, banking facilities and reserve borrowing facilities, by continuously monitoring forecast and actual cash flows, and by matching the maturity profiles of financial assets and liabilities.
The following tables detail the Company’s remaining contractual maturity for its non-derivative financial liabilities with agreed repayment periods. The tables have been drawn up based on the undiscounted cash flows of financial liabilities based on the earliest date on which the Company can be required to pay. The table includes both interest and principal cash flows. To the extent that interest flows are floating rate, the undiscounted amount is derived from interest rate curves at the balance sheet date. The contractual maturity is based on the earliest date on which the Company may be required to pay.
101N a s c o n A l l i e d I n d u s t r i e s P L C A n n u a l R e p o r t 2 0 1 7
Su
pp
lem
en
tary
In
form
ati
on
Intr
od
ucti
on
Op
era
tio
ns
Co
rpo
rate
Go
ve
rnan
ce
Fin
an
cia
ls

Notes to the Financial StatementsAt December 31, 2017 0 – 3 months 3 – 6 months Total
₦’000 ₦’000 ₦’000Trade payables 413,013 27,650 440,663
Other payables 2,462,073 456,789 2,918,862
Due to related parties 4,490,110 6,780,320 11,270,430
Government grant - 38,570 38,570
7,365,196 7,303,329 14,668,525
At December 31, 2016 0 – 3 months 3 – 6 months Total
₦’000 ₦’000 ₦’000Trade payables 823,920 103,887 927,807
Other payables 3,442,313 58,506 3,500,819
Due to related parties 2,910,464 6,913,533 9,823,997
Government grant - 38,570 38,570
7,176,697 7,114,496 14,291,193
36. Fair value informationExcept as detailed in the following table, the Directors consider that the carrying amounts of financial assets and financial liabilities recorded at amortised cost in the financial statements approximate their fair values
Book value Fair value
2017 2016 2017 2016
Financial asset ₦’000 ₦’000 ₦’000 ₦’000Trade and other receivables 5,603,540 10,178,751 5,603,540 10,178,751
Cash and bank 9,476,740 2,492,069 9,476,740 2,492,069
Financial liabilitiesTrade and other payables 14,629,955 14,252,728 14,629,955 14,252,728
Employee benefit 222,134 249,635 222,134 249,635
Government grant 38,570 38,570 38,570 38,570
The book value of the trade and other receivables is arrived at by factoring allowances for doubtful debts on trade receivables and other receivables.
The carrying amount of bank overdrafts and loans is approximately equal to their fair value.
37. Related parties
37.1 Related party balances
Intercompany receivables 2017 2016Parent and ultimate controlling party ₦‘000 ₦‘000
- -
Other related party receivablesDangote Pasta Limited 7,918 7,918
Dangote Sugar Refineries 13,250 46,371
Dangote Noodles Limited 5,044 8,346
Dangote Head office 5,118 -
Dangote Cement - Ibeshe 2,206 22,394
Dangote Cement - Gboko 4,320 4,320
West African Popular Foods 62,243 124,486
Bulk Commodities Ltd 4,352,919 9,594,181
Provision for doubtful related party receivables (Note 23.2) (62,243) (62,243)
4,390,775 9,745,773
102N a s c o n A l l i e d I n d u s t r i e s P L C A n n u a l R e p o r t 2 0 1 7

Notes to the Financial Statements2017 2016
Intercompany payables ₦‘000 ₦‘000
Parent and ultimate controlling partyDangote Industries Limited (Parent) 3,843,262 6,301,212
Other related party payablesGreen view Development Company Limited 7,220 -
Dansa Foods Limited 300 300
Dangote Cement 24,194 29,474
Dangote Flour 19,108 -
Agrosack Ltd 33,271 141,741
Dangote Transport 22,962 22,962
Central TPT Parts Store 75,977 139,009
Dangote Head office 2,514,113 1,007,483
Dangote Refinery 14,711 -
Benue Cement 81,922 81,922
Benue Cement-Truck scheme 54,398 54,398
DANCOM 1,451 5,247
Bulk Commodities Ltd 4,577,541 2,040,249
11,270,430 9,823,997
Relationships
Benue Cement Fellow subsidiary, provides trucks for NASCON
Bulk Commodities International Inc. Entity controlled by DIL, purchases raw salt for NASCON
Central TPT Parts Store Entity controlled by DIL, purchases and sells spare parts
DANCOM Technologies Limited Fellow subsidiary, provides internet services and IT support
Dangote Agrosacks Limited Fellow subsidiary, produces empty sacks for NASCON
Dangote Cement Plc Fellow subsidiary, buys Crude Salt from NASCON and procures trucks on behalf of NASCON
Dangote Flour Mills Plc Fellow subsidiary, NASCON reimburses entity for expenses
Dangote Foundation Fellow subsidiary, engages in philanthropy
Dangote Industries Limited Major shareholder of NASCON, provides short term financing and receives management fees for shared services
Dangote Noodles Limited Fellow subsidiary, buys Table Salt from NASCON
Dangote Oil Refinery Fellow subsidiary, NASCON purchases equipment
Dangote Pasta Limited Fellow subsidiary, NASCON provides haulage services
Dangote Sugar Refinery Plc. Fellow subsidiary, buys crude salt from NASCON and provides warehouse facility to NASCON
Dangote Transport Limited Fellow subsidiary, provides haulage services to NASCON
Dansa Foods Limited Entity controlled by a Director of DIL, provides beverages
Greenview Development Nigeria Limited
Fellow subsidiary, provides port and terminal services to NASCON
Greenview International Limited Ultimate holding company
Obajana Cement Fellow subsidiary, NASCON provides haulage services
West African Popular Foods JV with Unilever, purchased and sold Annapurna Salt
Dangote Industries Limited (DIL) performed certain administrative services for the Company for which a management fee of ₦90.8 million (2016: ₦141.7 million) was charged, being an appropriate allocation of costs incurred by relevant administrative departments.
In addition to the above, interest of ₦72 million was paid to DIL for the loan of (₦4.5 billion at 15% interest) obtained by the Company in 2016, which has been fully paid in February, 2017. The loan was included in balance due to DIL in 2016.
103N a s c o n A l l i e d I n d u s t r i e s P L C A n n u a l R e p o r t 2 0 1 7
Su
pp
lem
en
tary
In
form
ati
on
Intr
od
ucti
on
Op
era
tio
ns
Co
rpo
rate
Go
ve
rnan
ce
Fin
an
cia
ls

2017 2016
₦‘000 ₦‘000
Compensation to directors and other key managementShort-term employee benefits 170,744 144,138
Post-employment benefits - Pension - Defined contribution plan - -
Long-term benefits - incentive scheme - -
Termination benefits - -
Share-based payment - -
170,744 144,138
Directors fee and expensesDirectors Fees 17,457 18,150
Directors Expenses 153,287 125,988
170,744 144,138
The number of Directors with gross emoluments within the bands stated below were:
₦’000 2017 2016
0 — 10,000 - -10,001 — 20,000 8 8
20,001 — 30,000 - -
30,001 and above 2 2
10 10
38. CommitmentsThe Company’s total capital commitments as at December 31, 2017 amounted to ₦2.1 billion in respect of purchase of raw salt and Oregun plant rehabilitation (2016: ₦2.8 billion).
39. Contingent assets and Contingent liabilities
39.1 Pending litigation and claims.There are certain lawsuits and claims pending against the Company in various courts of law which are being handled by external legal conusels. The contingent liabilities in respect of pending litigation and claims amounted to ₦17.1million as at December 31, 2017 (2016 - ₦17.1 million). In the opinion of the Directors and based on independent legal advice, the Company is not expected to suffer any material loss arising from these claim, thus no provision has been made in these financial statements.
39.2 Financial commitmentsThe Directors are of the opinion that all known liabilities and commitments, which are relevant in assessing the state of affairs of the Company, have been taken into consideration in the preparation of these financial statements.
40. Events after the reporting periodThere were no events after the reporting period that could have had a material effect on the financial statements of the Company as at December 31, 2017 that have not been taken into account in these financial statements.
41. Approval of Financial statementsThe Board approved the financial statements during its meeting of March 5, 2018.
Notes to the Financial Statements
104N a s c o n A l l i e d I n d u s t r i e s P L C A n n u a l R e p o r t 2 0 1 7

2017 2017 2016 2016
₦‘000 % ₦‘000 %
VALUE ADDEDTurnover: Local 27,064,325 18,291,792
Export - -
Interest received 354,745 55,328
Other income 11,296 18,484
Bought - in materials and services
- Local (3,510,160) (4,511,543)
- Foreign (12,482,144) (7,567,809)
Total Value Added 11,438,062 100 6,286,252 100
VALUE DISTRIBUTED
To Pay Employees Salaries, wages, medical and other benefits 1,728,842 1,397,911
1,728,842 15 1,397,911 22
To Pay Providers of Capital Finance costs 72,113 357,671
72,113 1 357,671 6
To Pay Government Income tax 1,997,776 873,275
1,997,776 17 873,275 14
To be retained in the business for expansion and future wealth creation:Depreciation, amortisation and impairment 1,727,622 1,014,339
Deferred tax 568,120 227,873
2,295,742 20 1,242,212 20
Value retainedRetained profit 5,343,590 2,415,183
5,343,590 47 2,415,183 38
Total Value Distributed 11,438,062 100 6,286,252 100
Value added represents the additional wealth which the company has been able to create by its own and employees’ efforts.
This report is not prepared under IFRS. Instead, it has been prepared in compliance with the Companies and Allied Matters Act of Nigeria, Cap C20 LFN 2004.
Other National Disclosures-Value Added Statement
105N a s c o n A l l i e d I n d u s t r i e s P L C A n n u a l R e p o r t 2 0 1 7
Su
pp
lem
en
tary
In
form
ati
on
Intr
od
ucti
on
Op
era
tio
ns
Co
rpo
rate
Go
ve
rnan
ce
Fin
an
cia
ls
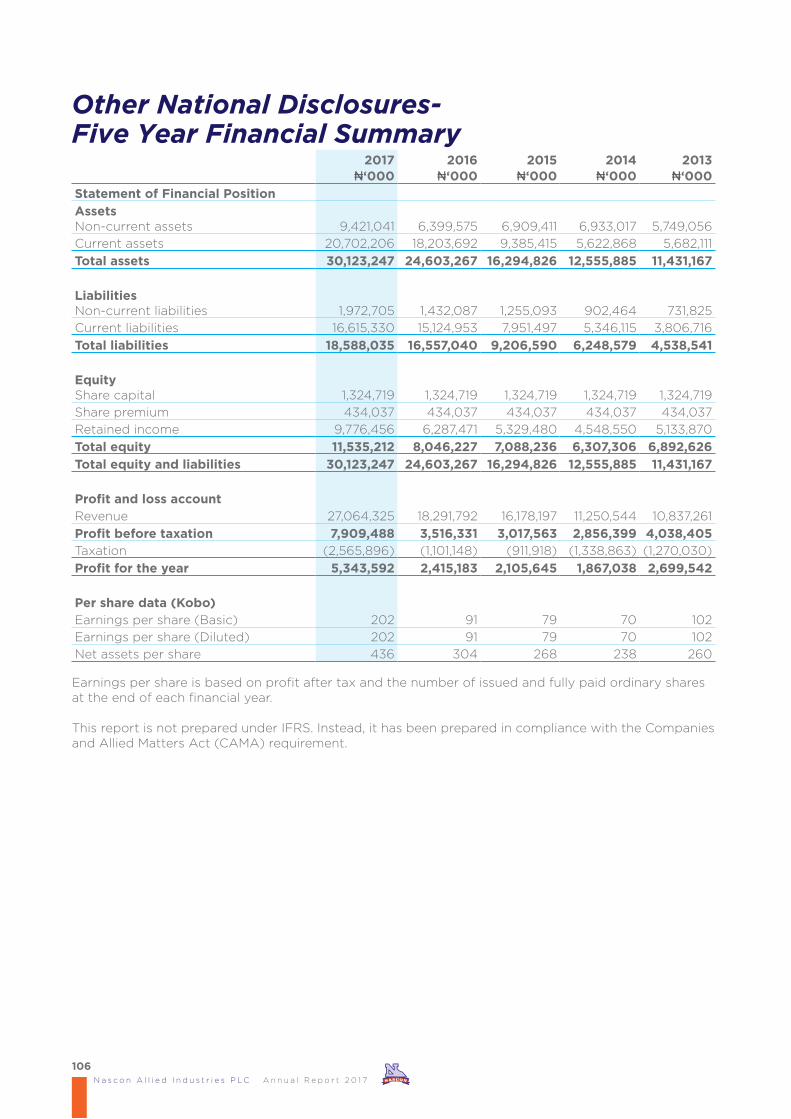
2017 ₦‘000
2016 ₦‘000
2015 ₦‘000
2014 ₦‘000
2013 ₦‘000
Statement of Financial Position
Assets Non-current assets 9,421,041 6,399,575 6,909,411 6,933,017 5,749,056
Current assets 20,702,206 18,203,692 9,385,415 5,622,868 5,682,111
Total assets 30,123,247 24,603,267 16,294,826 12,555,885 11,431,167
Liabilities Non-current liabilities 1,972,705 1,432,087 1,255,093 902,464 731,825
Current liabilities 16,615,330 15,124,953 7,951,497 5,346,115 3,806,716
Total liabilities 18,588,035 16,557,040 9,206,590 6,248,579 4,538,541
Equity Share capital 1,324,719 1,324,719 1,324,719 1,324,719 1,324,719
Share premium 434,037 434,037 434,037 434,037 434,037
Retained income 9,776,456 6,287,471 5,329,480 4,548,550 5,133,870
Total equity 11,535,212 8,046,227 7,088,236 6,307,306 6,892,626
Total equity and liabilities 30,123,247 24,603,267 16,294,826 12,555,885 11,431,167
Profit and loss accountRevenue 27,064,325 18,291,792 16,178,197 11,250,544 10,837,261
Profit before taxation 7,909,488 3,516,331 3,017,563 2,856,399 4,038,405Taxation (2,565,896) (1,101,148) (911,918) (1,338,863) (1,270,030)
Profit for the year 5,343,592 2,415,183 2,105,645 1,867,038 2,699,542
Per share data (Kobo)Earnings per share (Basic) 202 91 79 70 102
Earnings per share (Diluted) 202 91 79 70 102
Net assets per share 436 304 268 238 260
Earnings per share is based on profit after tax and the number of issued and fully paid ordinary shares at the end of each financial year.
This report is not prepared under IFRS. Instead, it has been prepared in compliance with the Companies and Allied Matters Act (CAMA) requirement.
Other National Disclosures-Five Year Financial Summary
106N a s c o n A l l i e d I n d u s t r i e s P L C A n n u a l R e p o r t 2 0 1 7


108N a s c o n A l l i e d I n d u s t r i e s P L C A n n u a l R e p o r t 2 0 1 7
AS AT DECEMBER 31, 2017
Dividend Payment Dividend Amount Total TotalYear Date No. Declared ₦ Claimed ₦ Unclaimed ₦2007 07/17/2008 1 883,146,126.00 864,450,815.66 18,695,310.34 2008 10/05/2009 2 1,059,775,351.20 1,034,665,069.80 25,110,281.40 2009 10/04/2010 3 1,324,719,189.00 1,286,246,607.65 38,472,581.35 2010 07/11/2011 4 1,324,719,189.00 1,290,353,340.79 34,365,848.21 2011 06/07/2012 5 1,854,606,865.00 1,779,699,053.79 74,907,811.21 2012 06/17/2013 6 2,384,494,540.20 2,291,937,723.52 92,556,816.68 2013 06/24/2014 7 2,384,494,540.20 2,278,601,925.01 105,892,615.19 2014 06/12/2015 8 1,324,719,189.00 1,269,208,367.06 55,510,821.94 2015 05/23/2016 9 1,457,191,107.90 1,402,308,259.90 54,882,848.00 2016 07/09/2017 10 1,854,606,864.60 1,790,253,154.86 64,353,709.74
Data on Claimed/Unclaimed Dividends

109N a s c o n A l l i e d I n d u s t r i e s P L C A n n u a l R e p o r t 2 0 1 7
Intr
od
ucti
on
Op
era
tio
ns
Co
rpo
rate
Go
ve
rnan
ce
Fin
an
cia
lsS
up
ple
me
nta
ry
Info
rmati
on
Share Capital History
AUTHORISED NOMINAL VALUE ISSUED AND PAID-UP
Other than by bonus Bonus issue Total
Year No. of No. of No. of No. of
shares Amount shares Amount shares Amount shares Amount
‘000 ₦’000 ‘000 ₦’000 ‘000 ₦’000 ‘000 ₦’000
1991 40,000 20,000 - - - - 14,110 7,0551992 40,000 20,000 - - - - 14,110 7,0551993 40,000 20,000 - - - - 14,110 7,0551994 40,000 20,000 - - - - 14,110 7,0551995 80,000 40,000 - - - - 14,110 7,0551996 80,000 40,000 65,847 32,923 - - 79,957 39,9781997 200,000 100,000 - - - - 79,957 39,9781998 200,000 100,000 - - - - 79,957 39,9781999 200,000 100,000 - - - - 79,957 39,9782000 200,000 100,000 - - - - 79,957 39,9782001 200,000 100,000 - - - - 79,957 39,9782002 200,000 100,000 - - - - 79,957 39,9782003 200,000 100,000 - - - - 79,957 39,9782004 200,000 100,000 - - - - 79,957 39,9782005 200,000 100,000 - - - - 79,957 39,9782006 4,000,000 2,000,000 - - - - 79,957 39,9782007 4,000,000 2,000,000 2,127,909 1,063,954 - - 2,207,865 1,103,9322008 4,000,000 2,000,000 - - 441,573 220,787 2,649,438 1,324,7192009 4,000,000 2,000,000 - - - - 2,649,438 1,324,7192010 4,000,000 2,000,000 - - - - 2,649,438 1,324,7192011 4,000,000 2,000,000 - - - - 2,649,438 1,324,7192012 4,000,000 2,000,000 - - - - 2,649,438 1,324,7192013 4,000,000 2,000,000 - - - - 2,649,438 1,324,7192014 4,000,000 2,000,000 - - - - 2,649,438 1,324,7192015 4,000,000 2,000,000 - - - - 2,649,438 1,324,7192016 4,000,000 2,000,000 - - - - 2,649,438 1,324,7192017 4,000,000 2,000,000 - - - - 2,649,438 1,324,719

110N a s c o n A l l i e d I n d u s t r i e s P L C A n n u a l R e p o r t 2 0 1 7
Notice of Annual General Meeting
accounts for the payment of their dividends.e) Detachable forms in respect of mandate for
e-dividend payment, unclaimed/stale dividend payment and shareholder’s data are attached to the Annual Report for convenience. The aforementioned forms can also be downloaded from NASCON’s website at www.nasconplc.com or from Meristem Registrars website, www.meristemregistrars.com
f) The duly completed forms should be returned to Meristem Registrars Ltd at No 213 Herbert Macaulay Way Adekunle. Yaba Lagos.
NOTES
1] CLOSURE OF REGISTER AND TRANSFER BOOKSNOTICE IS HEREBY GIVEN that the Register of Members and Transfer Books of the Company will be closed on Friday 20th April and Monday 23rd April 2018.
2] AUDIT COMMITTEEIn accordance with Section 359(5) of the Companies and Allied Matters Act CAP C20 LFN 2004, a nomination (in writing) by any member or shareholder for appointment to the Audit Committee should reach the Company Secretary at least 21 days before the Annual General Meeting. The Audit Committee comprises three shareholders and three Directors.
3] RIGHTS OF SHAREHOLDERS TO ASK QUESTIONS. Securities’ holders have a right to ask questions not only at the Meeting but also in writing prior to the Meeting and such questions must be submitted to the Company on or before Wednesday 25th April 2018
BY ORDER OF THE BOARD
ADEDAYO SAMUELCompany SecretaryFRC/2016/NBA/00000015291Dated this 3rd day of March, 2018NASCON Allied IndustriesUnion Marble House1, Alfred Rewane RoadFalomo, Ikoyi,Lagos, Nigeria.
NOTICE IS HEREBY GIVEN that the ANNUAL GENERAL MEETING of NASCON ALLIED INDUSTRIES PLC. (NASCON) for the year ended 31st December 2017 will hold on Thursday 3rd May, 2018 at the Civic Centre Ozumba Mbadiwe Road Victoria Island Lagos at 11.00 am prompt to transact the following business:
1] To lay before the Meeting the audited financial statements for the year ended 31st December, 2017 along with the Directors report, the reports of the Auditors and the Audit Committee thereon for the year ended 31st December, 2017.
2] To declare a Dividend.3] To re-elect Directors retiring by rotation 4] To appoint new Company Auditors.5] To authorize the Directors to fix the
remuneration of the Auditors.6] To appoint members of the Audit Committee.SPECIAL BUSINESS.7] To fix the remuneration of the Directors for the
year ending 31st December 2018
PROXYA member of the Company entitled to attend and vote at the above Meeting is entitled to appoint a proxy to attend and vote instead of him/her. A proxy need not be a member of the Company. A proxy for an organization may vote on a show of hands and on a poll. For the appointment to be valid, a completed proxy form must be deposited at the registered office of the Company or with the Registrar not later than 48 hours before the time fixed for the meeting, and be duly acknowledged.
DIVIDEND & e- DIVIDEND MANDATEa) The Board recommends for the approval of
shareholders, the payment of a dividend of N1:50K per ordinary share of 50 Kobo each, out of the profits declared in the financial year ended 31st December, 2017 and which will be subject to withholding tax at the appropriate rate
b) If approved, the dividend will be payable on Tuesday, May 8, 2018 to shareholders whose names are in the Company Register on Thursday 19th April 2018.
c) shareholders who have completed the e-Dividend Mandate Form will receive a direct credit of the Dividend into their bank accounts.
d) Shareholders are kindly requested to update their records and advise Meristem Registrars of their updated records and relevant bank

111N a s c o n A l l i e d I n d u s t r i e s P L C A n n u a l R e p o r t 2 0 1 7
Intr
od
ucti
on
Op
era
tio
ns
Co
rpo
rate
Go
ve
rnan
ce
Fin
an
cia
lsS
up
ple
me
nta
ry
Info
rmati
on
Country of incorporation and domicile Nigeria
Nature of business and principal activities Principal activities of the Company during the year include processing of raw salt into refined, edible and industrial salt. The company also produces Seasoning, Tomato Paste and Vegetable Oil.
Directors ‘Yemisi Ayeni Chairperson Paul Farrer Managing Director Fatima Aliko-Dangote Executive Director Olakunle Alake Director Halima Aliko-Dangote Director Abdu Dantata Director Sada Ladan-Baki Director Chris Ogbechie Director Knut Ulvmoen Director Fatima Wali-Abdurrahman Director Company Secretary Adedayo Samuel
Registered office Salt City, Ijoko Ota, Ogun State
Registrar And Transfer Office Meristem Registrars Limited 213, Herbert Macaulay, Way Adekunle, Yaba, Lagos
Auditors Deloitte & Touche Chartered Accountants Civic Towers, Plot GA 1 Ozumba Mbadiwe Avenue, Victoria Island, Lagos
Ultimate holding company Greenview International Corporation
Bankers Access Bank Plc Diamond Bank Plc Ecobank Limited Fidelity Bank Plc GTBank Plc Jaiz Bank Limited Skye Bank Plc UBA Plc Union Bank Plc Zenith Bank Plc
Directors, Officers and Professional Advisers

112N a s c o n A l l i e d I n d u s t r i e s P L C A n n u a l R e p o r t 2 0 1 7
Corporate Information
Capital Market Information
NASCON Allied Industries is listed on the main board of the Nigerian Stock Exchange (NSE)
Each share carries one voting right
NSE ticker symbol NASCON
ISIN NGNASCON0005
Bloomberg Code NASCON:NL
Reuters Code NASCON:LG
Date listed 20 October,1992
Market Capitalization (31/12/17) ₦50,922,205,625
Outstanding shares 2,649,438,378
Free float 37.81%
Registration Information
RC Number 11364
Date of Incorporation 30 April, 1973
Registered office
Salt City
Ijoko Ota, Ogun State
Business Office
15B Ikosi Road
Oregun, Ikeja, Lagos State
Registrar and Transfer Office
Meristem Registrars Limited
213, Herbert Macaulay Way,
Adekunle, Yaba, Lagos
Tel: 01–8920491–2; 01–2809250–3
E-mail: [email protected]
For more Information please contact
Corporate Communications
Anthony Chiejina
+234 (1) 448 0815
Investor Relations
Eyitope Olumudi
+234 (0) 807 049 2706
Morayo Tukuru
+234 (0) 807 049 4389
Website
www.nasconplc.com

113N a s c o n A l l i e d I n d u s t r i e s P L C A n n u a l R e p o r t 2 0 1 7
Intr
od
ucti
on
Op
era
tio
ns
Co
rpo
rate
Go
ve
rnan
ce
Fin
an
cia
lsS
up
ple
me
nta
ry
Info
rmati
on
Board and Committee Meeting Dates & Attendance
Board MeetingsMembers 24/01 28/03 27/04 04/05 28/07 23/10 18/12 ‘Yemisi Ayeni
Paul Farrer
Fatima Aliko-Dangote
Olakunle Alake
Halima Aliko-Dangote* X X
Abdu Dantata X
Sada Ladan-Baki** X X X
Chris Ogbechie X
Knut Ulvmoen
Fatima Wali-Abdurrahman X
Finance, Risk and Audit CommitteeMembers 20/01 27/03 26/04 27/07 18/10Chris Ogbechie
Paul Farrer
Fatima Aliko-Dangote
Olakunle Alake
Halima Aliko-Dangote* X X
Abdu Dantata
Sada Ladan-Baki**
Establishment and General Purpose Committee
Members 20/01 26/04 27/07 19/10Knut Ulvmoen
Paul Farrer
Fatima Aliko-Dangote
Halima Aliko-Dangote * X X
Fatima Wali-Abdurrahman
Statutory Audit Committee
Members 01/02 28/03 06/6 31/07 24/10Okey Nwuke
Umar Farouk
Kudaisi Ayodele Sarat
Halima Aliko-Dangote* X
Abdu Dantata
Chris Ogbechie X
KEY - Present in meetingX - Absent from meeting
*Halima Aliko-Dangote was on an approved leave of absence.**Sada Ladan-Baki was on approved work assignment with a related party company.
114N a s c o n A l l i e d I n d u s t r i e s P L C A n n u a l R e p o r t 2 0 1 7
Affix Current Passport
(To be stamped by Bankers) Write your name at the back of your passport photograph
TICK NAME OF COMPANY SHAREHOLDER’S ACCOUNT NO.
Instruction Only Clearing Banks are acceptable Please complete all sections of this form to make it eligible for processing and return to the address below The Registrar Meristem Registrars And Probate Services Limited 213, Herbert Macaulay Way Adekunle-Yaba Lagos State
I\We hereby request that henceforth, all my\our Dividend Payment(s) due to me\us from my\our holdings in all the companies ticked at the right hand column be credited directly to my \ our bank account detailed below:
Bank Verification Number
Bank Name Bank Account Number
Account Opening Date
Shareholder Account Information
Surname/Company’s Name First Name Other Names
Address:
City
Previous Address (If address has changed)
CHN
State Country
Mobile Telephone 1
Name of Stockbroker
Mobile Telephone 2
CSCS A/c No
Email Address
Signature(s) Company Seal (If applicable)
Company Seal (If applicable)
Joint\Company’s Signatories
Help Desk Telephone No/Contact Centre Information for Issue resolution or clarification: 01-2809250-4
Meristem Registrars Limited website:www.meristemregistrars.com; E-mail: [email protected]
TICK NAME OF COMPANY SHARE A/C NO
ACAP INCOME FUND AFRINVEST EQUITY FUND BERGER PAINTS NIG PLC CEAT FIXED INCOME FUND CHELLARAMS BOND CONOIL PLC CONSOLIDATED HALLMARK INS. PLC CUSTODIAN & ALLIED PLC COVENANT SALT NIGERIA LIMITED EMPLOYEE ENERGY LIMITED ENERGY COMPANY OF NIGERIA PLC
[ENCON]
eTRANZACT INTERNATIONAL PLC FIDSON HEALTHCARE PLC FOOD CONCEPTS PLC FREE RANGE FARMS PLC FTN COCOA PROCESSORS PLC GEO-FLUIDS PLC INTERNATIONAL ENERGY INSURANCE
PLC
JUBILEE LIFE MORTGAGE BANK LTD MAMA CASS RESTAURANTS LIMITED MCN DIOCESE OF REMO MCN LAGOS CENTRAL MCN TAILORING FACTORY [NIGERIA]
LIMITED
MULTI-TREX INTEGRATED FOODS PLC MUTUAL BENEFITS ASSURANCE PLC NASSARAWA STATE GOVT BOND NASCON ALLIED INDUSTRIES PLC NEIMETH INT’L PHARMS PLC NEWREST ASL NIGERIA PLC NIGER INSURANCE PLC NIGERIA MORTGAGE REFINANCE
COMPANY [NMRC] PLC
NIGERIA MORTGAGE REFINANCE COMPANY PLC [NMRC] BOND
ONWARD PAPER MILLS PLC PACAM BALANCED FUND PAINTS & COATINGS MANUFACTURERS
NIG PLC
PROPERTYGATE DEVT. & INVEST. PLC R.T. BRISCOE NIGERIA PLC REGENCY ALLIANCE INSURANCE PLC SMART PRODUCTS NIGERIA PLC SOVEREIGN TRUST INSURANCE PLC TANTALIZERS PLC THOMAS WYATT PLC VITAFOAM NIGERIA PLC ZENITH EQUITY FUND ZENITH ETHICAL FUND ZENITH INCOME FUND
Meristem Registrars And Probate Services Limited
Web: www.meristemregistrars.com; email: [email protected]
E-DIVIDEND MANDATE ACTIVATION FORM

115N a s c o n A l l i e d I n d u s t r i e s P L C A n n u a l R e p o r t 2 0 1 7
Intr
od
ucti
on
Op
era
tio
ns
Co
rpo
rate
Go
ve
rnan
ce
Fin
an
cia
lsS
up
ple
me
nta
ry
Info
rmati
on
The Annual General Meeting to be held at the Civic Centre, Ozumba Mbadiwe Avenue, Victoria Island, Lagos, on Thursday, May 3, 2018 at 11:00 a.m.
I/WE ................................................................................................................................................................................................................................................
of .....................................................................................................................................................................................................................................................
being a shareholder of NASCON Allied Industries Plc hereby appoint ........................................................... or failing him/her
.................................................................................................................... or ...............................................................................................................................
as my/our Proxy to act and vote for me/us on my/our behalf at the 2017 Annual General Meeting to be held on 3rd May, 2018 and at
any adjournment thereof.
Dated the ....................................................... 2018 shareholder’s signature .........................................................
I/We desire this proxy to be used in favour of/or against the resolution as indicated alongside (strike out whichever is not applicable)
Please indicate with an “X” in the appropriate column, how you wish your votes to be cast on the resolutions set out above. Unless otherwise instructed, the Proxy will vote or abstain from voting at his/her discretion.
NO. ORDINARY BUSINESS FOR AGAINST
To receive the audited Financial Statements for the year ended 31st December, 2017, the Reports of Directors, Auditors, and the Audit Committee thereon;
To declare a dividend;
To re-elect the following retiring Directors: • Olakunle Alake • Halima Aliko Dangote • Prof. Chris Ogbechie
To appoint new Auditors for the Company
To authorize the Directors to fix the remuneration of the Auditors
To elect the members of the Audit Committee
SPECIAL BUSINESSTo approve the remuneration of the non-executive Directors for the year ending December 31, 2018.
1.
2.
3.
4.
7.
5.
6.
This proxy form should NOT be completed and sent to the registered office if the member will be attending the meeting.Note:iI. A member (shareholder) entitled to attend and vote at the Annual General Meeting is entitled to appoint to a proxy in his stead.
All proxy form should be deposited at the registered office of the Registrar (as in notice) not later than 48 hours before the meeting.
II. In the case of joint shareholders, any of them may complete the form, but the names of all joint shareholders must be stated.III. If the shareholder is a corporation, this form must be executed under its Common Seal or under the hand of some officers or an
attorney duly authorized.IV. The proxy must produce the admission card sent with the notice of the meeting to gain entrance to the meeting.V. It is a legal requirement that all instrument of proxy to be used for the purpose of voting by any person entitled to vote at any
meeting of the shareholders must bear appropriate stamp duty from the Stamp Duties office (not adhesive postage stamps).
Before posting this form, please tear off this part and retain it for admission to the meeting.
NAME AND ADDRESS NUMBER OF SHARES HELD: NUMBER OF SHAREHOLDER(S):
Please admit .............................................................. to the Annual General Meeting of NASCON Allied Industries Plc to be held at Civic Centre, Ozumba Mbadiwe Avenue, Victoria Island, Lagos, on Thursday, May 3rd, 2018 at 11:00 a.m.Signature of person attending: ....................................................................................• This admission card should be produced by the shareholder or his/her proxy in
order to obtain entrance to the Annual General Meeting.• You are requested to sign this card at the entrance in the presence of the
Company Secretary or his Nominee on the day of the Annual General Meeting.
Please be advised that to enable a Proxy gain entrance to the meeting, the Proxy Form is to be duly completed and delivered to the Company Secretary not later than 48 hours before the time fixed for the meeting.
ADMISSIONC A R D
NASCON Allied Industries Plc Rc: 11364
Proxy Form
116N a s c o n A l l i e d I n d u s t r i e s P L C A n n u a l R e p o r t 2 0 1 7
The Registrar
Meristem Registrars Limited
213, Herbert Macaulay Way
Adekunle, Yaba, Lagos