wealthinsight - marketresearch · professional services – consultants, accountants, lawyers and...
TRANSCRIPT
WealthInsight http://www.marketresearch.com/WealthInsight-v3905/
Publisher Sample
Phone: 800.298.5699 (US) or +1.240.747.3093 or +1.240.747.3093 (Int'l)
Hours: Monday - Thursday: 5:30am - 6:30pm EST
Fridays: 5:30am - 5:30pm EST
Email: [email protected]
MarketResearch.com
0
Challenges and Opportunities for the Wealth Sector in Poland 2014
© WealthInsight. This report is a licensed product and is not to be photocopied.
Publication date: February 2015
Report code: WI0310MR
www.wealthinsight.com
Challenges and Opportunities
for the Wealth Sector in
Poland 2014
Beijing • Buenos Aires • Frankfurt • Hong Kong • Hyderabad • London • Madrid • Mexico City • New York • San Francisco • Seoul • Shanghai • Singapore • Sydney
1
Challenges and Opportunities for the Wealth Sector in Poland 2014
© WealthInsight. This report is a licensed product and is not to be photocopied.
About WealthInsight
The WealthInsight Intelligence Center Database is an unparalleled resource and the leading resource
of its kind. Compiled and curated by a team of expert research specialists, the database comprises
dossiers on over 125,000 HNWIs from around the world.
The Intelligence Center also includes tracking of wealth and liquidity events as they happen and
detailed profiles of major private banks, wealth managers and family offices in each market.
With the database as the foundation for its research and analysis, WealthInsight is able to obtain an
unsurpassed level of granularity, insight and authority on the HNWI and wealth management universe
in each of the countries and regions it covers.
TABLE OF CONTENTS
2
Challenges and Opportunities for the Wealth Sector in Poland 2014
© WealthInsight. This report is a licensed product and is not to be photocopied.
Table of Contents
1 Introduction ........................................................................................................ 6
1.1 Details of this Report ............................................................................................................... 6
1.2 Definitions ................................................................................................................................ 7
2 Executive Summary ......................................................................................... 11
3 Wealth Sector Fundamentals.......................................................................... 14
3.1 Political Background .............................................................................................................. 14
3.2 Economic Background .......................................................................................................... 18
3.3 Benchmarking Polish Wealth in Context ............................................................................... 20
3.3.1 Distribution of wealth in Poland ..................................................................................... 20
3.4 HNWI Volume and Wealth Trends ........................................................................................ 21
4 Competitive Landscape of the Wealth Sector ............................................... 23
4.1 Competitive Landscape ......................................................................................................... 25
4.1.1 Foreign private banks .................................................................................................... 26
4.1.2 Wealth managers .......................................................................................................... 27
4.1.3 Family offices ................................................................................................................ 28
4.1.4 Financial advisors.......................................................................................................... 29
4.1.5 Polish wealth management industry – clientele model and maturity ............................ 30
4.2 Behavioral Mapping of Wealth Management and Private Banking in Poland ...................... 31
5 Appendix .......................................................................................................... 32
5.1 Additional Components of the Wealth Sector in Poland ....................................................... 32
5.1.1 Philanthropy .................................................................................................................. 32
5.1.2 Demand for intergenerational wealth transfer ............................................................... 32
5.2 Tax Regulations .................................................................................................................... 33
5.3 Regulations Related to Immigration, Investment and Employment ...................................... 34
5.4 Key Drivers ............................................................................................................................ 35
5.4.1 Real GDP growth .......................................................................................................... 35
5.4.2 Per capita GDP ............................................................................................................. 36
5.4.3 Domestic market capitalization ..................................................................................... 37
5.4.4 Commodity index........................................................................................................... 38
5.4.5 Foreign direct investments – inflow and outflow ........................................................... 39
5.4.6 Inflation rate ................................................................................................................... 40
5.4.7 Interest rate ................................................................................................................... 41
5.4.8 Balance of payments ..................................................................................................... 42
5.4.9 Government debt........................................................................................................... 43
TABLE OF CONTENTS
3
Challenges and Opportunities for the Wealth Sector in Poland 2014
© WealthInsight. This report is a licensed product and is not to be photocopied.
5.4.10 Stock market performance ............................................................................................ 44
5.5 Wealth Breakdowns .............................................................................................................. 45
6 About WealthInsight ........................................................................................ 50
TABLE OF CONTENTS
4
Challenges and Opportunities for the Wealth Sector in Poland 2014
© WealthInsight. This report is a licensed product and is not to be photocopied.
LIST OF TABLES
Table 1: HNWI Wealth Band and Group Definitions................................................................................................ 8 Table 2: Cities in Poland by Population (Volume), 2013 ....................................................................................... 16 Table 3: Leading Foreign Private Banks in Poland by Head Office, 2013 ............................................................. 26 Table 4: Leading Polish Family Offices, 2013 ....................................................................................................... 28 Table 5: Polish Income Tax Bands (USD), 2013–2014 ......................................................................................... 33 Table 6: Polish Real GDP Growth (%), 2009–2018 .............................................................................................. 35 Table 7: Polish GDP per Capita (US$), 2009–2018 .............................................................................................. 36 Table 8: Polish Domestic Market Capitalization (US$ Billion),2009–2013 ............................................................ 37 Table 9: Polish Commodity Indices, 2009–2018 ................................................................................................... 38 Table 10: Polish Foreign Direct Investment (US$ Billion), 2009–2018 .................................................................. 39 Table 11: Polish Inflation Rate (%), 2009–2018 .................................................................................................... 40 Table 12: Polish Money Market Rate (%), 2009–2018 .......................................................................................... 41 Table 13: Poland’s Balance of Payments (US$ Billion), 2009–2013 ..................................................................... 42 Table 14: Polish Government Debt as a Percentage of GDP, 2009–2018 ............................................................ 43 Table 15: Polish Stock Market Performance, 2009–2013 ..................................................................................... 44 Table 16: Polish HNWI Wealth vs GDP Ratio, 2009–2018 ................................................................................... 45 Table 17: Poland – Appendix One ........................................................................................................................ 46 Table 18: Poland – Appendix Two ........................................................................................................................ 47
TABLE OF CONTENTS
5
Challenges and Opportunities for the Wealth Sector in Poland 2014
© WealthInsight. This report is a licensed product and is not to be photocopied.
LIST OF FIGURES
Figure 1: HNWI Wealth Band Definitions ................................................................................................................ 9 Figure 2: Map of Poland ........................................................................................................................................ 10 Figure 3: Polish Asset Price Performance (%), 2009–2013 .................................................................................. 20 Figure 4: Polish HNWI Performance (US$ Billion and HNWI Volume), 2009–2018 .............................................. 21 Figure 5: Poland Vs Global HNWIs (%), 2009–2018 ............................................................................................. 22 Figure 6: Polish Wealth Management Industry – Maturity Level of Operators, 2014............................................. 30 Figure 7: Polish Wealth Management Industry – Behavioral Mapping, 2013 ........................................................ 31 Figure 8: Polish Real GDP Growth (%), 2009–2018 ............................................................................................. 35 Figure 9: Polish GDP per Capita (US$), 2009–2018 ............................................................................................. 36 Figure 10: Polish Domestic Market Capitalization (US$ Billion), 2009–2013 ........................................................ 37 Figure 11: Polish Commodity Indices, 2009–2018 ................................................................................................ 38 Figure 12: Polish Foreign Direct Investment (US$ Billion), 2009–2018 ................................................................. 39 Figure 13: Polish Inflation Rate (%), 2009–2018 ................................................................................................... 40 Figure 14 Polish Money Market Rate (%), 2009–2018 .......................................................................................... 41 Figure 15: Poland’s Balance of Payments (US$ Billion), 2009–2013 .................................................................... 42 Figure 16 Polish Government Debt as a Percentage of GDP, 2009–2018 ........................................................... 43 Figure 17: Polish Stock Market Performance, 2009–2013 .................................................................................... 44 Figure 18: Polish HNWI Wealth vs GDP Ratio, 2009–2018 .................................................................................. 45 Figure 19: Polish HNWIs – Volume by Wealth Band, 2009–2018 ......................................................................... 48 Figure 20: Polish HNWIs – Wealth by Wealth Band (US$ Billion), 2009–2018 ..................................................... 48 Figure 21: Polish HNWIs – Wealth per Capita (US$ Million), 2009–2018 ............................................................. 49
INTRODUCTION
6
Challenges and Opportunities for the Wealth Sector in Poland 2014
© WealthInsight. This report is a licensed product and is not to be photocopied.
1 Introduction
1.1 Details of this Report
This report is the result of WealthInsight’s extensive research into the high net worth
individual (HNWI) population and wealth management industry in Poland.
The report focuses on HNWI performance between the end of 2009 and the end of
2013. This provides a clear understanding of how well the country’s HNWIs performed
during the financial crisis.
For the purposes of this report, the phrase “coverage period” refers to 2009–2018, while
the “review period” covers 2009–2013 and the “forecast period” covers 2014–2018.
The report reviews the performance and asset allocations of Polish HNWIs and
UHNWIs in Poland and highlights the top-performing cities. It also includes an
evaluation of the local wealth management industry.
This report categorizes the HNWI population across five wealth bands, as defined in
Table 1.
“Polish HNWIs” includes all individuals permanently living in Poland, as well as Polish-
born individuals who have chosen to live elsewhere but still operate businesses within
the country.
For the purposes of this report, wealth is defined as the net value of assets, which
includes both financial holdings and tangible assets. This comprises alternative assets,
real estate (excluding the primary residence), cash and deposits, fixed-income, equities
and business interests.
The demographic details in this study are based on a sample of 358 Polish HNWIs from
the WealthInsight database.
INTRODUCTION
7
Challenges and Opportunities for the Wealth Sector in Poland 2014
© WealthInsight. This report is a licensed product and is not to be photocopied.
1.2 Definitions
“Wealth management” is defined as the provision of banking services to wealthy
individuals and their families. It generally involves the management of trusts and
inheritance, and the allocation of client funds.
A “private bank” is defined as a division of the banking group that provides wealth
management services.
A “wealth manager” is defined as a specialist wealth management service provider.
A “family office” is defined as a wealth management company that focuses on a single
HNWI or a small group of selected HNW clients.
“Investable assets” include all assets except business interests, whereas “liquid assets”
are defined as all assets that can be immediately cashed-in.
INTRODUCTION
8
Challenges and Opportunities for the Wealth Sector in Poland 2014
© WealthInsight. This report is a licensed product and is not to be photocopied.
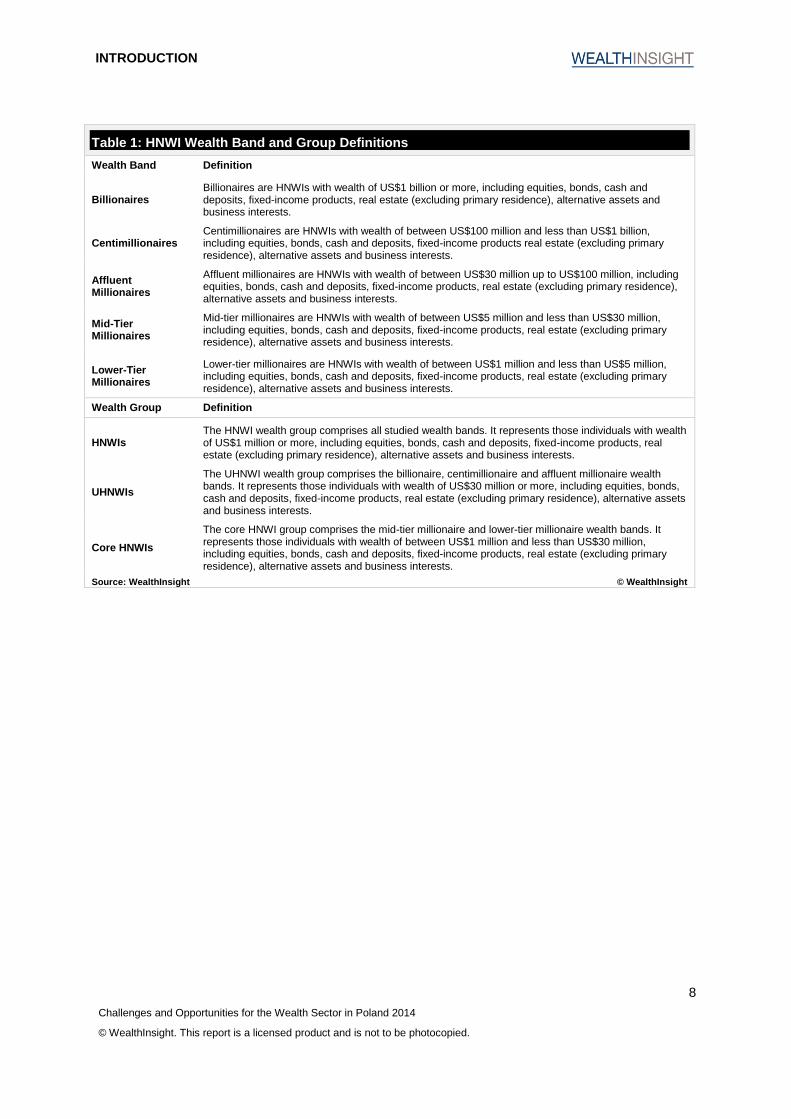
Table 1: HNWI Wealth Band and Group Definitions
Wealth Band Definition
Billionaires Billionaires are HNWIs with wealth of US$1 billion or more, including equities, bonds, cash and deposits, fixed-income products, real estate (excluding primary residence), alternative assets and business interests.
Centimillionaires Centimillionaires are HNWIs with wealth of between US$100 million and less than US$1 billion, including equities, bonds, cash and deposits, fixed-income products real estate (excluding primary residence), alternative assets and business interests.
Affluent Millionaires
Affluent millionaires are HNWIs with wealth of between US$30 million up to US$100 million, including equities, bonds, cash and deposits, fixed-income products, real estate (excluding primary residence), alternative assets and business interests.
Mid-Tier Millionaires
Mid-tier millionaires are HNWIs with wealth of between US$5 million and less than US$30 million, including equities, bonds, cash and deposits, fixed-income products, real estate (excluding primary residence), alternative assets and business interests.
Lower-Tier Millionaires
Lower-tier millionaires are HNWIs with wealth of between US$1 million and less than US$5 million, including equities, bonds, cash and deposits, fixed-income products, real estate (excluding primary residence), alternative assets and business interests.
Wealth Group Definition
HNWIs The HNWI wealth group comprises all studied wealth bands. It represents those individuals with wealth of US$1 million or more, including equities, bonds, cash and deposits, fixed-income products, real estate (excluding primary residence), alternative assets and business interests.
UHNWIs
The UHNWI wealth group comprises the billionaire, centimillionaire and affluent millionaire wealth bands. It represents those individuals with wealth of US$30 million or more, including equities, bonds, cash and deposits, fixed-income products, real estate (excluding primary residence), alternative assets and business interests.
Core HNWIs
The core HNWI group comprises the mid-tier millionaire and lower-tier millionaire wealth bands. It represents those individuals with wealth of between US$1 million and less than US$30 million, including equities, bonds, cash and deposits, fixed-income products, real estate (excluding primary residence), alternative assets and business interests.
Source: WealthInsight © WealthInsight
INTRODUCTION
9
Challenges and Opportunities for the Wealth Sector in Poland 2014
© WealthInsight. This report is a licensed product and is not to be photocopied.
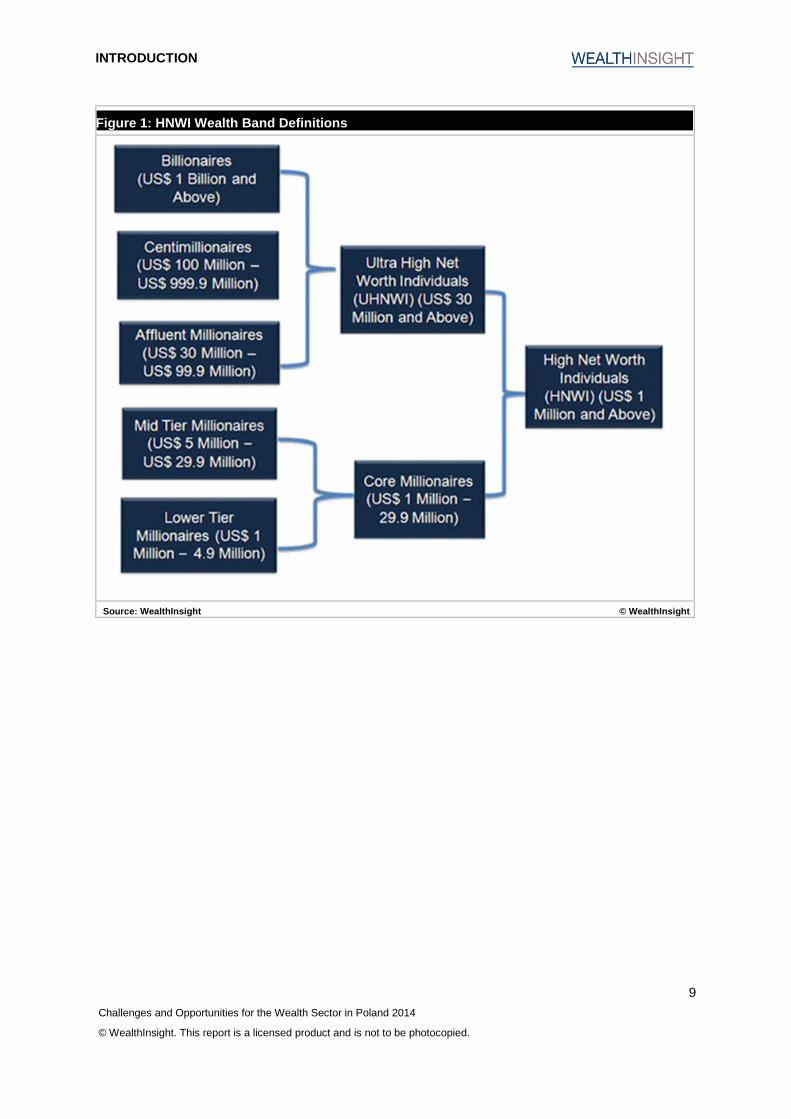
Figure 1: HNWI Wealth Band Definitions
Source: WealthInsight © WealthInsight
INTRODUCTION
10
Challenges and Opportunities for the Wealth Sector in Poland 2014
© WealthInsight. This report is a licensed product and is not to be photocopied.
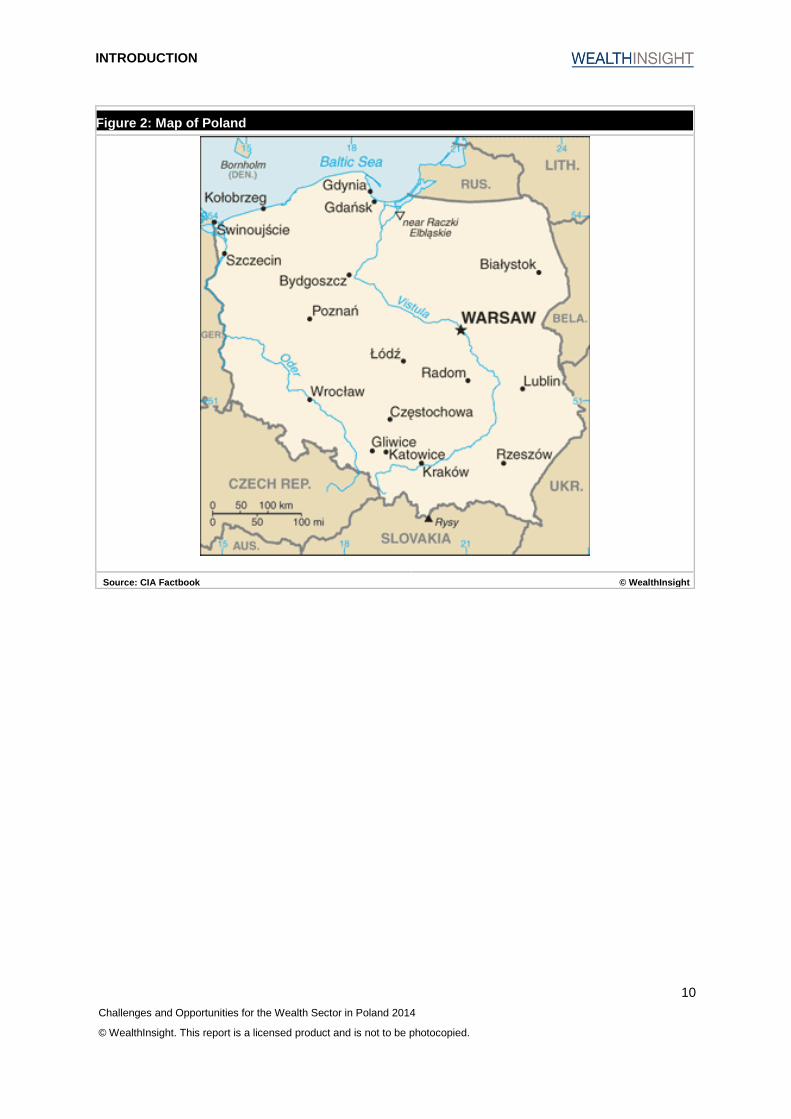
Figure 2: Map of Poland
Source: CIA Factbook © WealthInsight
ABOUT WEALTHINSIGHT
Challenges and Opportunities for the Wealth Sector in Poland 2014
© WealthInsight. This report is a licensed product and is not to be photocopied.
2 About WealthInsight
WealthInsight provides detailed data and insightful analysis on the world’s HNWI and wealth
sector. With decades of experience providing business information, WealthInsight helps
organizations to make informed decisions and win new business.
At WealthInsight’s core is its proprietary HNWI Database of the world’s wealthiest
individuals. Around this database WealthInsight has built a number of valuable research-
based products and services that make WealthInsight much more than just a rich contact list.
WealthInsight works with and provides solutions for:
Wealth managers
Private banks
Family offices
Technology providers
Professional services – consultants, accountants, lawyers and real estate professionals
Fund managers, hedge fund managers, asset managers, venture capitalists
Non-profit and educational institutions
WealthInsight’s corporate headquarters are located in London, with offices in New York, San
Francisco, Sydney, Seoul and Hong Kong.
For more information on WealthInsight please visit www.wealthinsight.com
Reports
WealthInsight publishes high-quality research reports focused on the wealth sector. The
reports provide comprehensive analysis of countries, regions and special topics.
With the HNWI Database as the foundation for its primary research and analysis,
WealthInsight is able to obtain an unsurpassed level of granularity, insight and authority on
the HNWI universe in each of the countries and regions covered.
All reports are available as a part of the WealthInsight Intelligence Centre. Reports can also
be purchased on a subscription or one-off basis.
Every WealthInsight report is uniquely formulated for the region, country or topic covered.
ABOUT WEALTHINSIGHT
12
Challenges and Opportunities for the Wealth Sector in Poland 2014
© WealthInsight. This report is a licensed product and is not to be photocopied.
Key features of the reports include:
Market sizing
Forecasting
Benchmarking
HNWI asset allocation
Behavioral mapping
Family offices
Methodology
WealthInsight’s teams of in-house analysts devise and collect data over a historical period of
five years and develop forecasts for a five-year forecast period. All WealthInsight wealth
reports are rigorously sourced and created according to a comprehensive methodological
process:
Internal audit
Review of in-house databases to gather existing data:
Historic market databases and reports
HNWI Database
Wealth management, private bank and family office database
Financial deals and news archive
Secondary research
Collection of the latest market-specific data from a wide variety of industry sources:
Government statistics
Industry associations
Company filings
Broker reports
International organizations
ABOUT WEALTHINSIGHT
13
Challenges and Opportunities for the Wealth Sector in Poland 2014
© WealthInsight. This report is a licensed product and is not to be photocopied.
Primary research
Review of the latest wealth management and private banking industry trends
Surveys using panels compiled from across the wealth sector:
Wealth management and private banking professionals
Financial services experts
HNWIs
Expert opinion
Collation of opinion taken from WealthInsight interviews of leading industry experts
Analysis of third-party opinion and forecasts:
Broker reports
Industry associations
Wealth management and private banking media
Official government sources
Leading academic research and commentary
Data consolidation and verification
Consolidation of data and opinion to create historical datasets
Creation of models to benchmark data across sectors, asset classes and geographies
Market forecasts
Feed of forecast data into market models:
Macroeconomic indicators
Industry-specific drivers
Analysis of the WealthInsight HNWI Database and Wealth sector company databases
to identify key trends:
ABOUT WEALTHINSIGHT
14
Challenges and Opportunities for the Wealth Sector in Poland 2014
© WealthInsight. This report is a licensed product and is not to be photocopied.
Latest wealth trends
Key drivers of the wealth management industry
Report writing
Analysis of market data
Discussion of company and industry trends and issues
Integration of survey results
Annual review of financial deals and wealth management trends
Standardization of market definitions using recognized industry classifications
Quality control
Peer review
Senior-level QC
Random spot checks on data integrity
Benchmark checks across databases
Market data cross-checked for consistency with accumulated data from:
Internal databases
Company filings
ABOUT WEALTHINSIGHT
15
Challenges and Opportunities for the Wealth Sector in Poland 2014
© WealthInsight. This report is a licensed product and is not to be photocopied.
Disclaimer
All Rights Reserved.
The facts of this report are believed to be correct at the time of publication but cannot be guaranteed.
Please note that the findings, conclusions and recommendations that WealthInsight delivers will be
based on information gathered in good faith from both primary and secondary sources, whose
accuracy we are not always in a position to guarantee. As such WealthInsight can accept no liability
whatever for actions taken based on any information provided herein.
0
Challenges and Opportunities for the Wealth Sector in Poland 2014
© WealthInsight. This report is a licensed product and is not to be photocopied.
CONTACT US
HEAD OFFICE
John Carpenter House
7 Carmelite Street
London
EC4Y 0BS
UK
Beijing • Buenos Aires • Frankfurt • Hong Kong • Hyderabad • London • Madrid • Mexico City • New York • San Francisco • Seoul • Shanghai • Singapore • Sydney
www.wealthinsight.com